
Maximizing the Performance of 3D Printed Fiber-Reinforced Composites


Wilson College of Textiles, North Carolina State University, Raleigh, NC 27965, USA
*
Author to whom correspondence should be addressed.
J. Compos. Sci. 2021, 5(5), 136; https://0-doi-org.brum.beds.ac.uk/10.3390/jcs5050136
Submission received: 9 April 2021
/
Revised: 29 April 2021
/
Accepted: 13 May 2021
/
Published: 18 May 2021
(This article belongs to the Special Issue 3D Printing Composites)
Abstract
:Fiber-reinforced 3D printing technology offers significant improvement in the mechanical properties of the resulting composites relative to 3D printed (3DP) polymer-based composites. However, 3DP fiber-reinforced composite structures suffer from low fiber content compared to the traditional composite, such as 3D orthogonal woven preforms solidified with vacuum assisted resin transfer molding (VARTM) that impedes their high-performance applications such as in aerospace, automobile, marine and building industries. The present research included fabrication of 3DP fiberglass-reinforced nylon composites, with maximum possible fiber content dictated by the current 3D printing technology at varying fiber orientations (such as 0/0, 0/90, ±45 and 0/45/90/−45) and characterizing their microstructural and performance properties, such as tensile and impact resistance (Drop-weight, Izod and Charpy). Results indicated that fiber orientation with maximum fiber content have tremendous effect on the improvement of the performance of the 3DP composites, even though they inherently contain structural defects in terms of voids resulting in premature failure of the composites. Benchmarking the results with VARTM 3D orthogonal woven (3DOW) composites revealed that 3DP composites had slightly lower tensile strength due to poor matrix infusion and voids between adjacent fiber layers/raster, and delamination due to lack of through-thickness reinforcement, but excellent impact strength (224% more strong) due to favorable effect of structural voids and having a laminated structure developed in layer-by-layer fashion.
1. Introduction
Fiber-reinforced 3D printing technology to develop high performance composites has been a bourgeoning research focus in recent times due to promising applications in multidimensional fields, such as automobile, aerospace, naval and building industries [1]. Among the different technologies of 3D printing process (such as at stereolithography, vat polymerization, powder bed fusion, material jetting, binder jetting, etc.), material extrusion-based printing, especially fused deposition modeling (FDM), is the most favorable technology because of its cost convenience and process simplicity to incorporate fiber in the composite structure [2]. Reinforcing with continuous fiber posed a great challenge, requiring to change in the configuration of the printer: either two separate supply systems for polymer and fiber, but a single extrusion process (also called coaxial extrusion process), or supplying and extruding polymer and polymer pre-impregnated fiber separately using a dual nozzle system [3]. The latter is preferred for its improved fiber–polymer interfacial property (good adhesion between fiber and polymer) and desired fiber placing facility, although the coaxial extrusion configuration can have high fiber content with relatively poor interfacial bonding between fiber and polymer that resulted in poor mechanical performance and premature failure of composites [3].
It is an established fact that the fiber content (i.e., fiber volume fraction, FVF) has significant positive impact on the mechanical properties of the composite. Consequently, maximizing fiber content is of interest to manipulate the mechanical properties, such as loading fiber in the test direct significantly increases tensile strength [4,5]. The intrinsic nature of the 3D printing process developing a structure in layer-by-layer fashion involves relatively more matrix material than traditional composite manufacturing technology, such as injection molding, resin transfer molding and compression molding to ensure good adhesion between adjacent print beads and layers for improved structural integrity [6]. While conventional composites might easily have more than 60% FVF [7], 3DP composites with 40% FVF is hardly possible [4,6,8,9]. Although some researchers reported 3DP composites with more than 40% FVF [10,11,12,13,14], they actually did not consider the amount of matrix in the fiber filament (also can be referred as composite filament); therefore, the amount of fiber has been over estimated. Dual nozzle-based printers use pre-impregnated fiber filament to supply fiber material. Thermal analyses (thermogravimetric analysis, TGA) of the most widely used commercial fiber filaments were revealed to have 45% or less fiber (such as carbon ~45%, fiberglass ~38%, Kevlar ~37%, and high temperature and high strength fiberglass ~36%), inferring that the composites cannot be fabricated with 45% fiber even if the number of fiber layers are maximized [3]. In fact, the fiber content becomes further a bit low, since there are some unavoidable thermoplastic/polymeric layers, at least one wall layer around the composite structure, one floor layer and one roof layer [3].
A great deal of factors associating 3DP composites have been studied; however, fabrication of a composite with maximum fiber content and investigating the mechanical properties still remains as a special interest. Although few works reported development of composites with maximum fiber layers [4,6], their studies are limited to tensile properties. The present research involved maximizing 3DP fiberglass-reinforced composites at different fiber orientations (0/0, 0/90, ±45 and 0/45/90/−45) and exploring their impact properties (Drop-weight, Izod and Charpy impacts), including tensile behavior, with a focus on the failure mechanism. Among the three major types of impacts, Charpy and Izod impacts are called pendulum impacts providing information about a material’s toughness, while the Drop-weight impact provides more information about the behaviors of material, such as longitudinal wave transmission, load distribution, peak force, peak energy and total energy absorption [15].
2. Experimental
2.1. Composite Fabrication with Maximum FVF
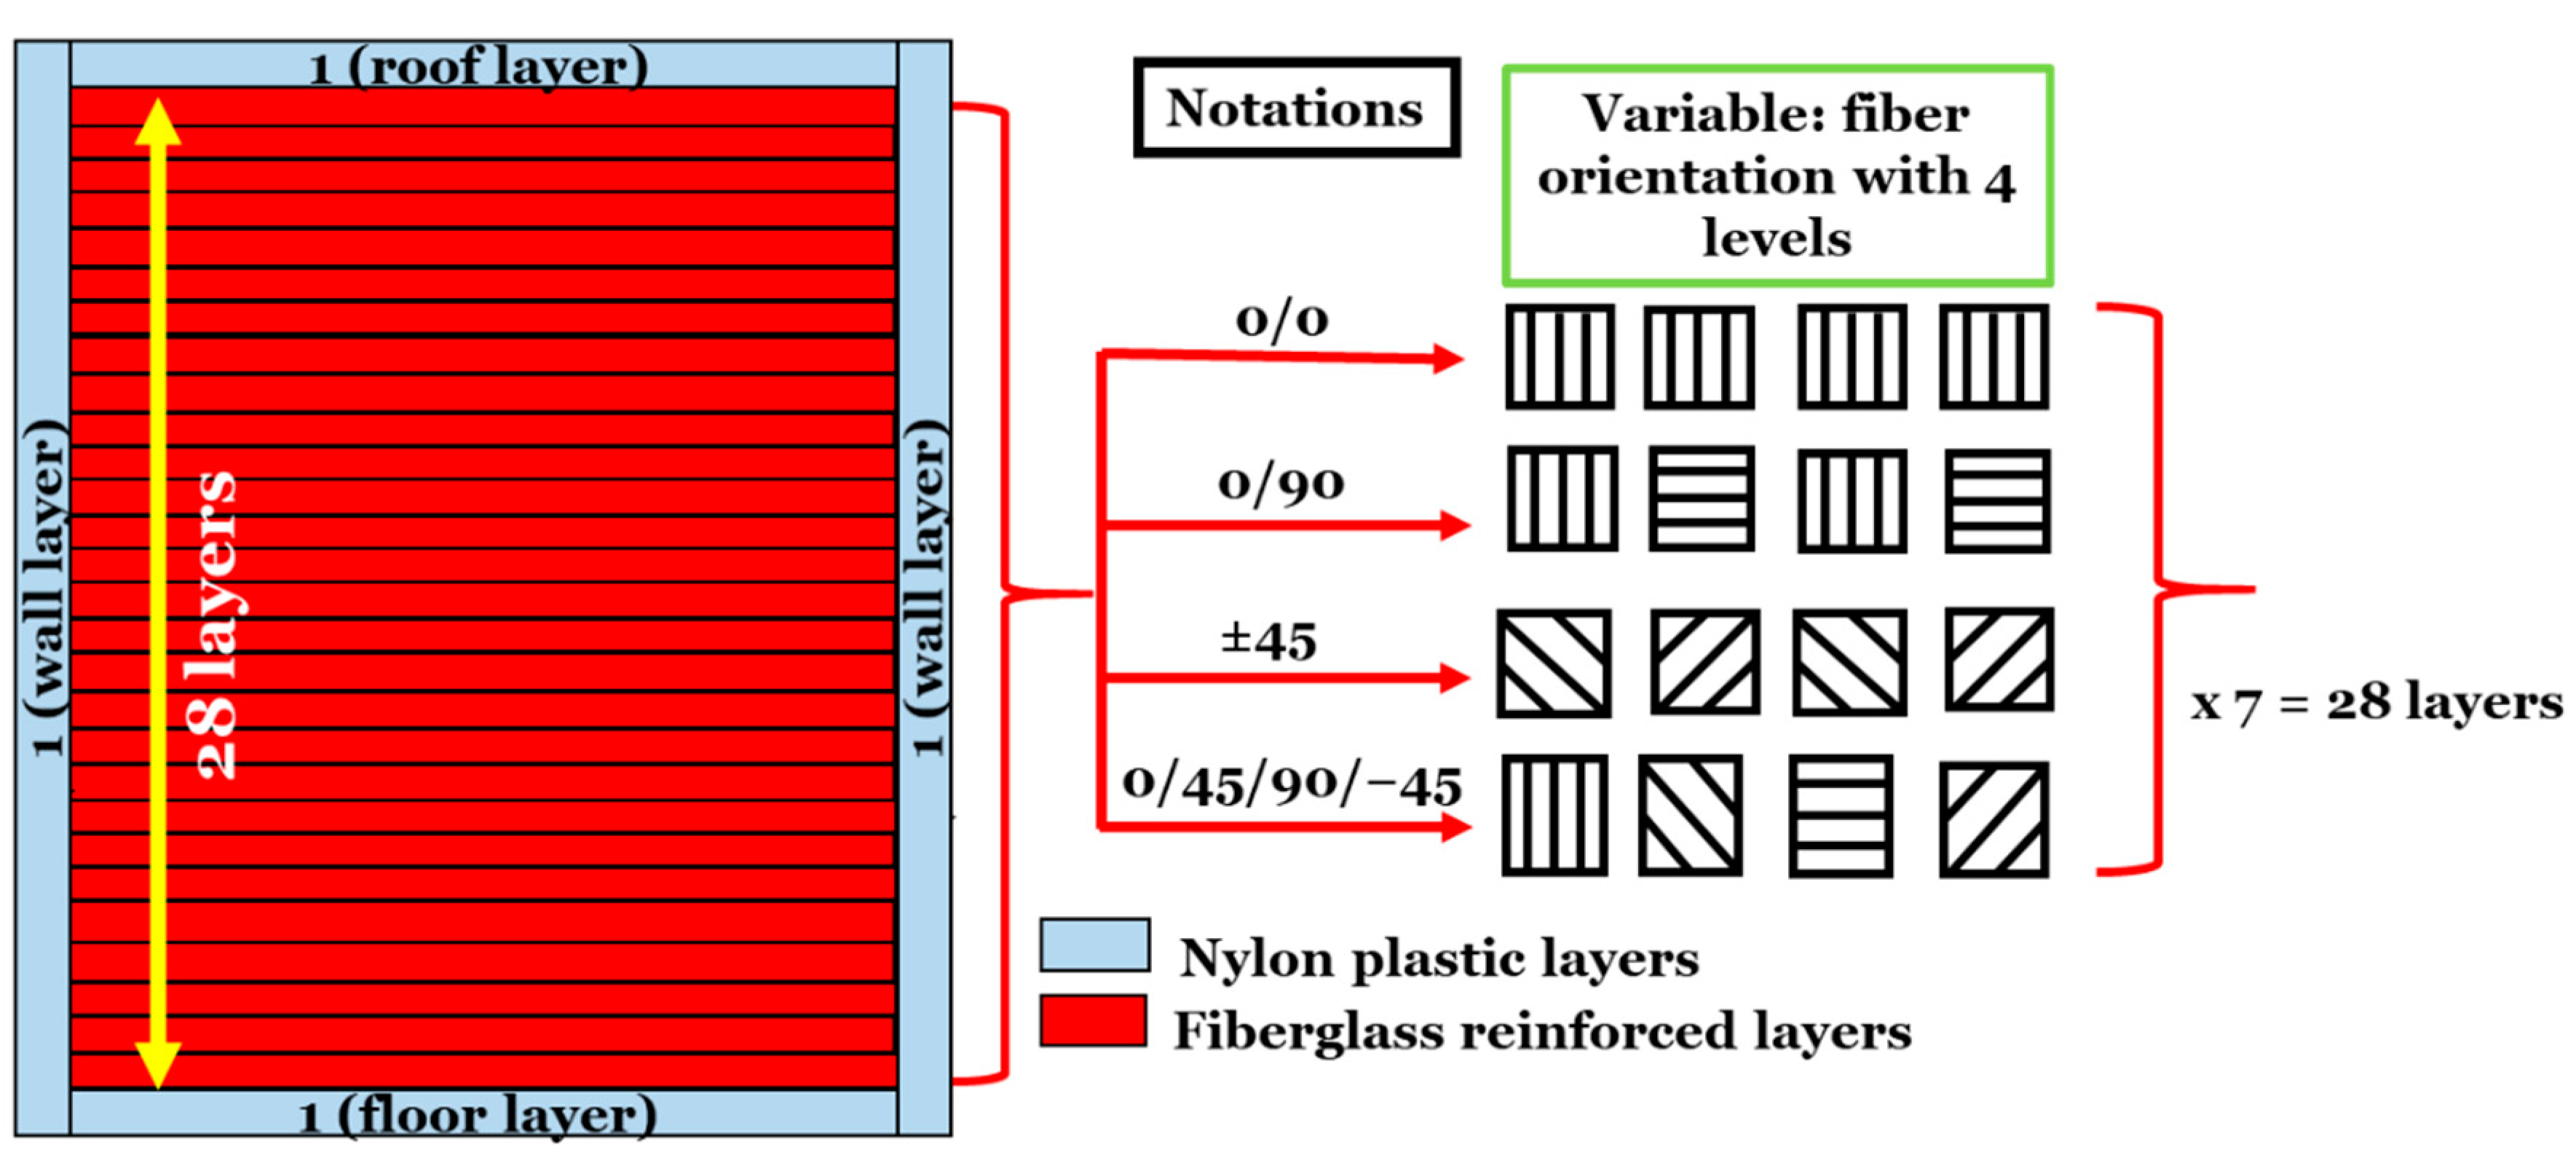
Polyamide thermoplastic polymer filament (Nylon 6) and fiberglass filament pre-sized with Nylon 6 were used to print the composites using Mark Two 3D printer (Markforged Inc., Boston, MA, USA). The properties of fiber and thermoplastic filaments can be availed from Kabir et al. [3,16]. The composite samples were printed according to the dimension of the test specimens with 3 mm thickness comprised of 30 layers (height of each layer is 0.1 mm). To maximize FVF, the samples were printed with 28 isotropic fiber layers, and number of floor/roof (at either ends) and wall layers were set to 1 (which are always thermoplastic polymer layers as default set by the printer software system). Other print parameters were followed as in Mathur et al. [17]. The schematic of the composite structure along with the experimental design considering fiber orientation as a variable with four levels, namely 0/0, 0/90, ±45 and 0/45/90/−45, is illustrated in Figure 1. As the amount of the polymer and the fiber changes with the size of the test specimen and fiber orientation, the FVF of the composite changes accordingly (Table 1). The slicer of the printer (Eiger) provides the estimated volumes of fiber (vf) and thermoplastic filaments (vp), as well as the weight of final composite part (W). Using the information, the FVF of the composite can be obtained from Equation (1). Here, the FVF of fiber filament (Vfraction) was obtained by TGA analysis, as explained in Kabir et al. [3].
Here,
.
2.2. Properties Evaluation
2.2.1. Microstructural Analysis
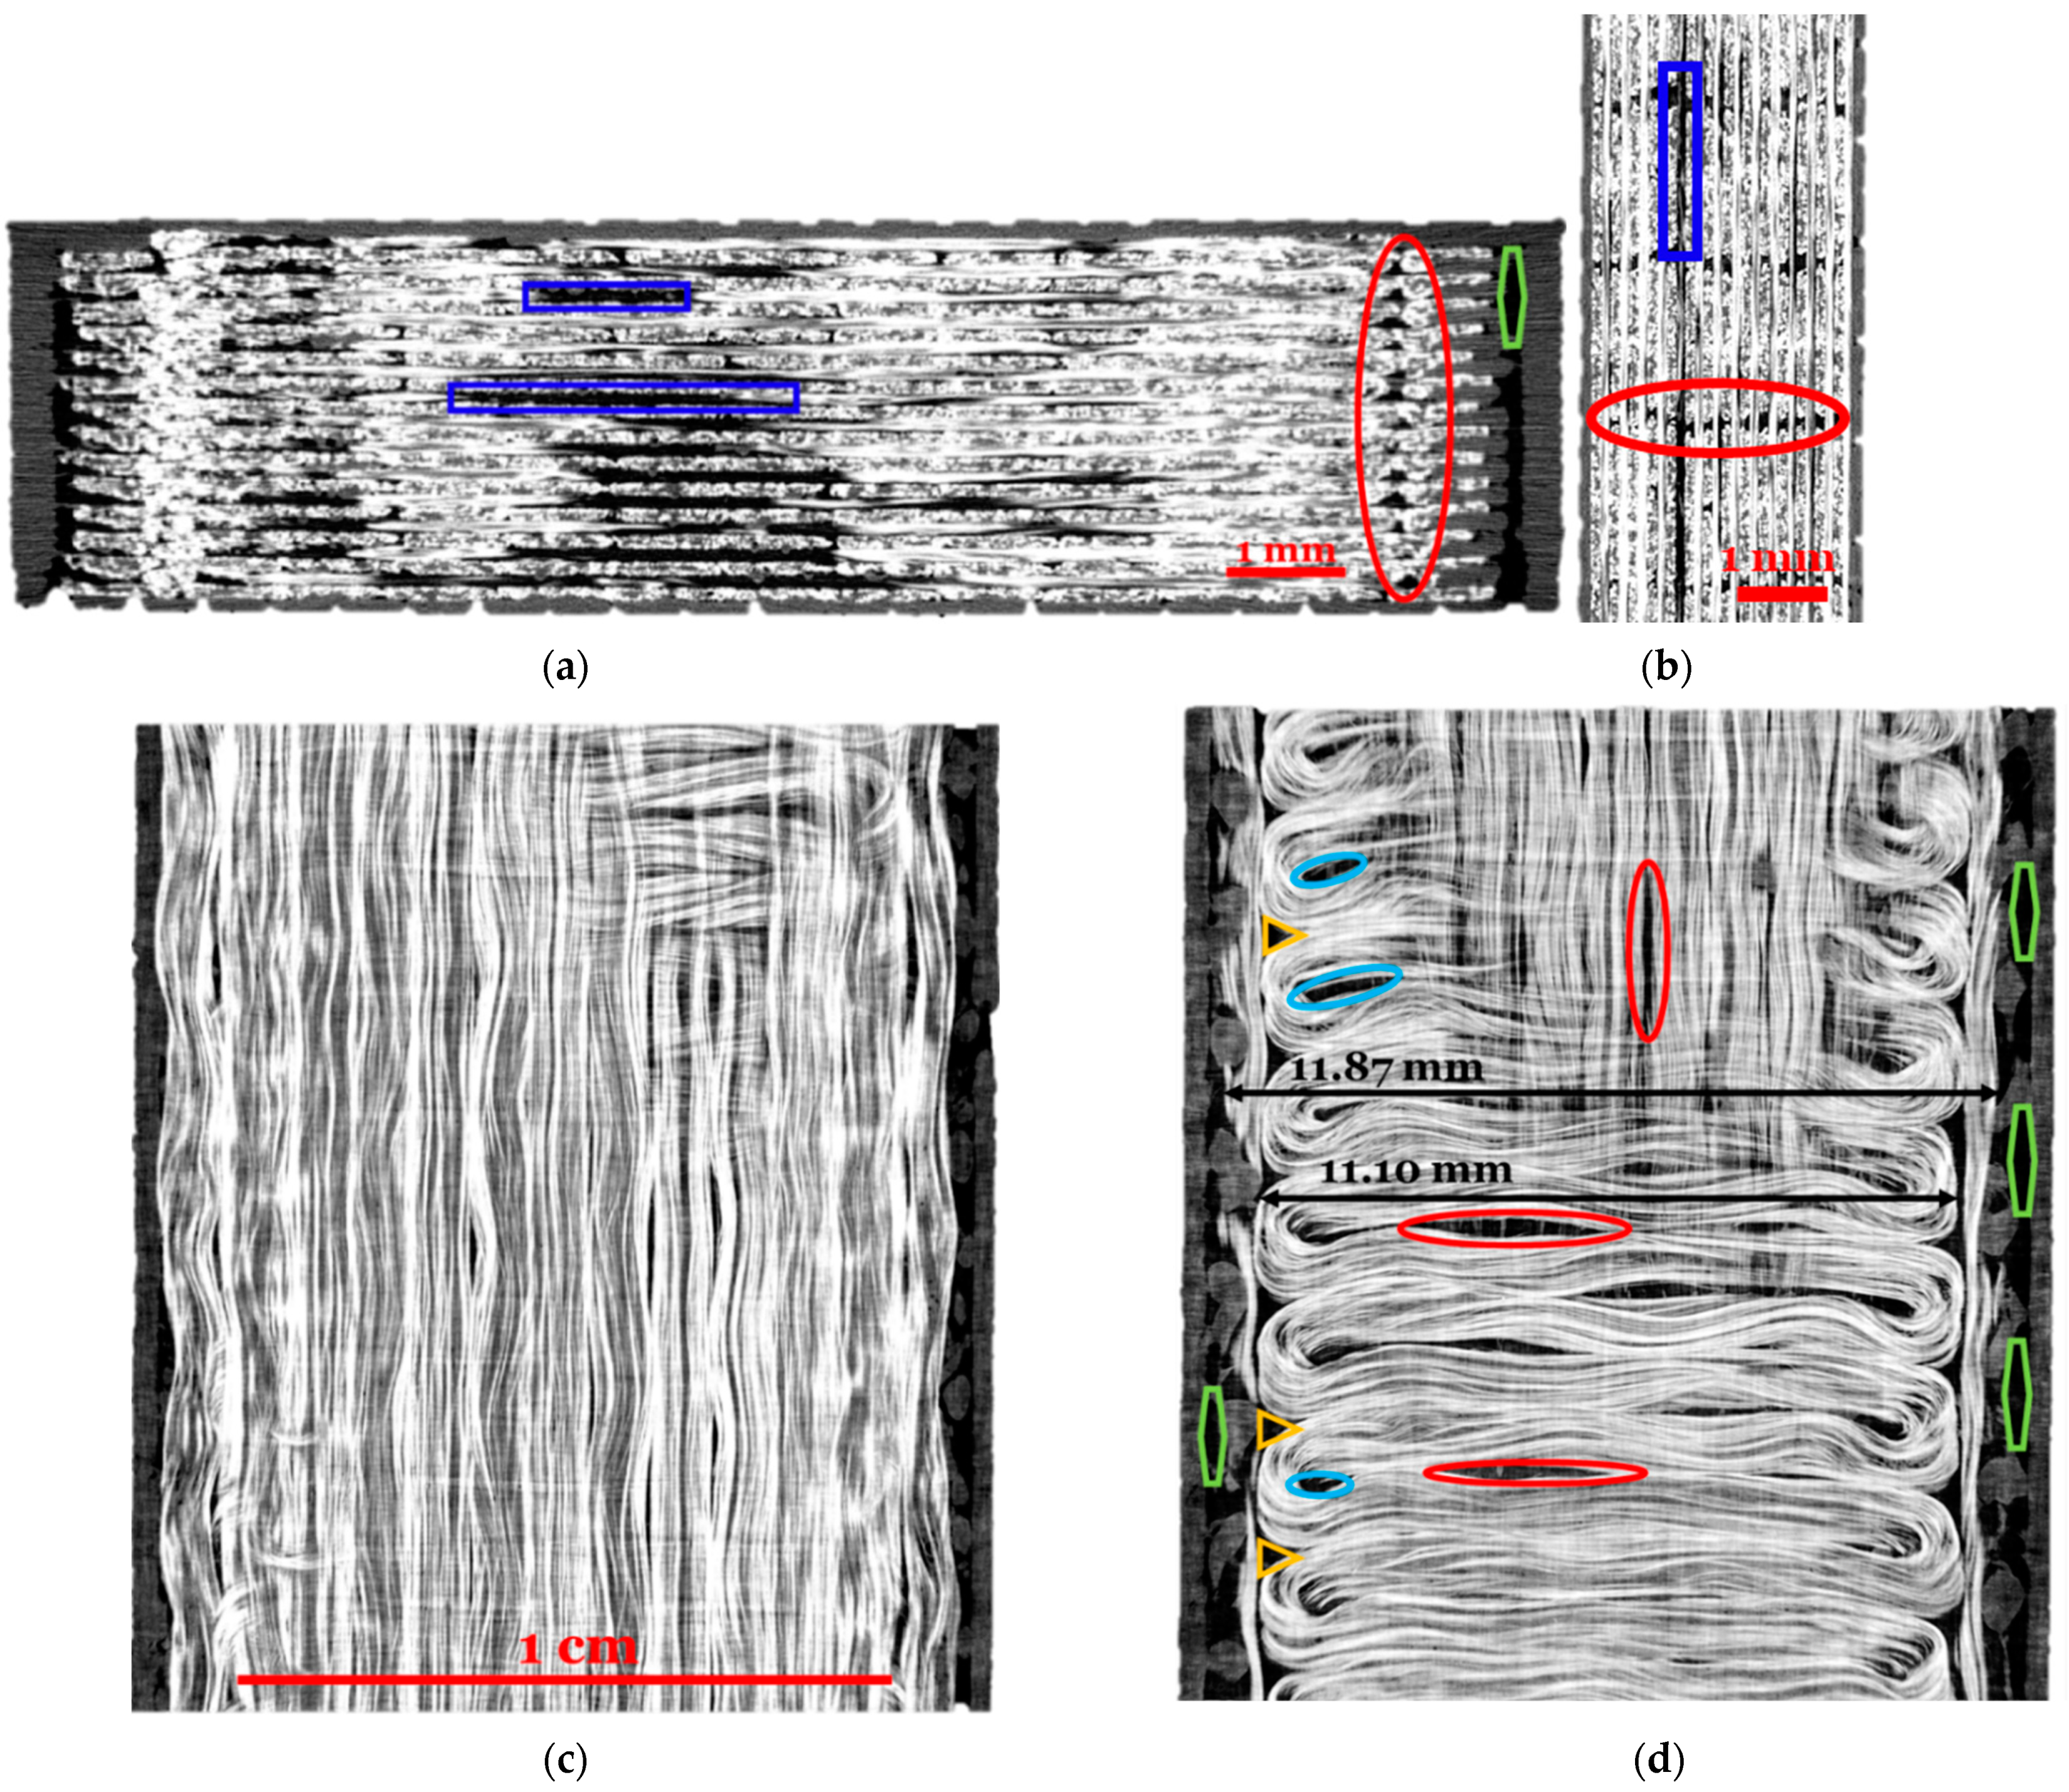
Microstructural studies of the composite fiber filament and printed composite were performed using X-ray computed tomography (CT) (Zeiss Xradia 510 Versa, Jena, Germany), which is an excellent non-destructive method to image the internal structure of a material. The settings for composite filament (fiberglass) and printed composite (0/90 Izod specimen as an example case) were somewhat different, as high-resolution scanning was performed for composite filament to obtain more detailed information: Binning mode—2, pixel size—2.01 µm, exposure—4 s, and projection—1600 for composite filament; and binning mode—1, pixel size—9.57 µm, exposure—20 s, and projection—1600 for printed composite. Seven consecutive scans using the same settings for composite filaments were performed and stitched together using Dragonfly 2020.2 software (Object Research Systems Inc., Montreal, QC, Canada, 2020) to cover a substantial length (12.5 mm) of composite filament based on the periodicity of waviness, as seen in Figure 2c,d.
2.2.2. Mechanical Properties
Tensile Properties
Samples were tested for their tensile properties using MTS Servo Hydraulic 370 Load Frame (Eden Prairie, MN, USA) equipped with 250 kN load capacity. The testing was performed in accordance with the ASTM D3039 standards and guidelines at a constant crosshead speed of 1 mm/min. The gauge length was 72 mm with gripping length of 40 mm from either end. After preliminary set of trials, the gripping pressure of 1000 psi to mount tensile specimens was selected to avoid slippage and damage of specimens at the grip. The test direction was in the 0° fiber orientation. The tensile strength was availed from the stress values obtained from testing instrument.
Drop-Weight Impact Properties
Drop-weight impact system, also called Tower-drop or Tub impact test, was performed according to ASTM D3763 standard using the Instron Drop Tower Impact CEAST 9350 (Norwood, MA, USA). Initially, the strongest samples were placed over a vertical cylinder to find the required energy to gain full puncture/penetration, which was obtained by loading 15 kg dead weight (creating 150 J total impact energy) over a hemispherical striker of 12.7 mm thickness whilst maintaining 3.88 m/s impact velocity.
Pendulum Impact Properties
The Izod and Charpy impact assessments of unnotched samples were conducted using CEAST 9050 Pendulum Impact System (Norwood, MA, USA) according to the ASTM D4812-19 and ASTM D6110, respectively. The energy used for Charpy and Izod tests were 50 J, respectively, which was selected assuming this striking energy would break the strongest samples.
2.3. Statistical Analysis
A one-way ANOVA test was assigned to assess the effects of fiber orientation followed by a post-hoc multiple mean comparison test (Tukey’s HSD) for the 4 levels of orientation. The tests were performed at 95% confidence level using JMP Pro statistical software. The number of non-defective specimens for each test was 3.
3. Results and Discussion
3.1. Microstructural Analysis
The structural unit of a 3DP composite is the print bead/raster. Apart from the void of the inherent supply materials, a significant amount of voids were found in the case of the FDM 3DP part due to its fashion of building a part [3]. To assess the internal structure of additively manufactured parts, X-ray computed tomography is considered as an established technique [18]. The internal structure of a 3DP composite specimen has been analyzed by X-ray CT imaging to reveal and explain the pattern of fiber orientation, including their connection to the variation in weight and FVF in different samples. Additionally, the internal structure influences the performance characteristic of the final composite part.
Figures S1 and S2 show the fiber and thermoplastic polymer routes for the layers of different fiber orientations, indicating the variations in the coverage pattern. Different coverage pattern makes a difference in the amount of fiber and polymer for differently oriented layers with same dimension. Here, each layer was attempted to optimize with maximum fiber content. The amount of fiber and thermoplastic depends on area of the specimen and the nearest integer number of the rasters to cover the area. For instance, in case of Izod samples, the number of 0° fiber rasters is optimized having relatively more fiber than 90° followed by 45° rasters; while the scenario is opposite for the tensile samples (Figures S1 and S2). Here, all impact samples (Drop-weight, Izod and Charpy) follow a similar trend for FVF (0/0 > 0/90 > 0/45/90/−45 > ±45), and for the same ground reason, the tensile sample has a different trend (±45 > 0/45/90/−45 > 0/90 > 0/0), as realized from Table 1 (column 3 and 5), as the respective weights are adjusted accordingly (column 6).
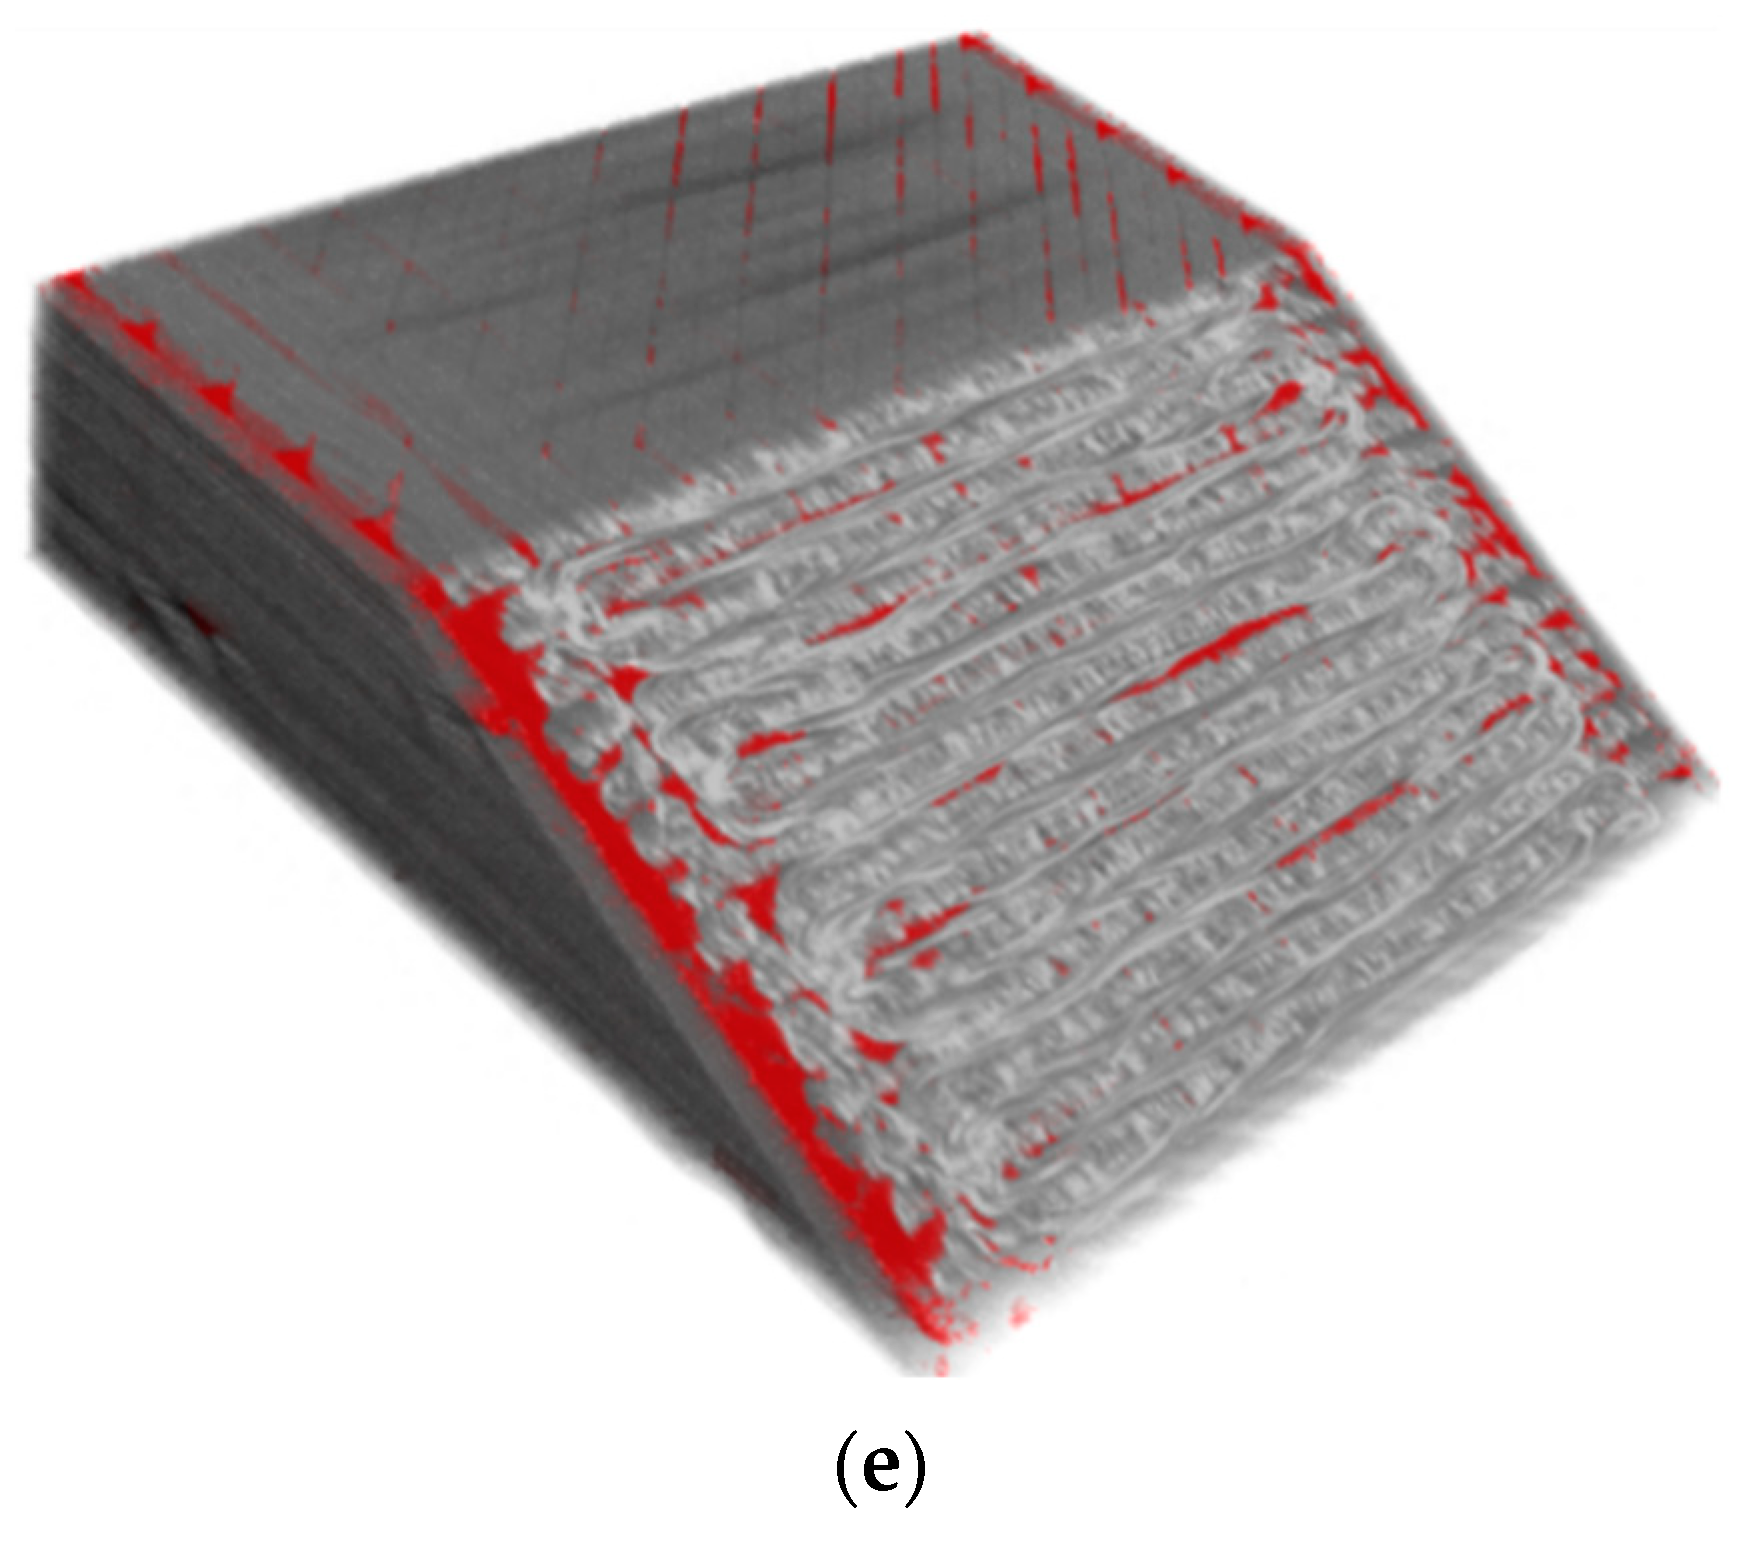
Images in Figure 2 exhibit the extent of covering a layer by fiber and thermoplastic rasters with an attempt to ensure structural integrity of the layer, so as the whole composite part. Although the supply materials (fiber and thermoplastic filaments) might have some voids [3], it was not evident in the printed composite because of diminishing the void as a consequence of fusing and subsequent crystallization during printing or potential incapability of scanner to capture high resolution images. However, the structural voids are quite obvious from the figure, which are possibly originated from (1) imperfect joining and attachment of adjacent rasters and layers marked with red and blue spots, respectively (Figure 2a,b,d), due to in-plane waviness, potentially from locking the filament tow during composite filament preparation or the movement of the extruding nozzle during printing; (2) the unavoidable gaps created inside and outside of the raster’s turn (light blue and orange spots) (Figure 2d) due to the bending rigidity of the composite filaments; (3) and gap between the wall and infill rasters (Figure 2a,d and Figure S3) due to the nature of covering pattern of a layer for a given fiber/polymer orientation. Figure 2d also shows a portion of super imposition (upper side of the image) of 0° and 90° layers, which bolster how 0° can have more fiber coverage area (11.87 mm vs. 11.10 mm) than 90° (it can also be felt by contrasting Figure 2c,d). The images e in Figure 2 illustrate the overall situations shown in red color in different 2D planes of 3D structure. Additionally, Figure 2e presents some notion of void formation due to the out-of-plane waviness of the rasters; a narrow channel of void along the rasters, which has also been experienced by other researchers [19,20]. To minimize the void formation due to out-of-plane waviness, geometry of the extruding nozzle could play a significant role [21,22]. Reduction of the bending rigidity is possible by controlling the composite filament structural parameters (reduce size of individual filament and amount of matrix material) is another approach to reduce waviness. Additionally, a cutting tool may be introduced to cut the material after formation of each raster. Thus, the total amount of void of this specimen quantified by image analysis from X-ray CT scans was 6.23%.
To assess the source of the in-plane waviness, if it is due to locking fiber during composite filament preparation or the movement of extruding nozzle during printing process, X-ray tomography of the composite filament was performed to view the waviness of the fiber in the composite filament. Figure S4 shows that the fibers are pretty straight, with a slight notion of twist in the composite filament implying that the in-plane waviness is potentially for the movement of nozzle, probably due to an uneven build platform and/or improper belt tension guiding the print head. It may be also as a result of the force that the print head experiences right at the sample edges after the formation of each raster by the bending rigidity of the filament composite.
3.2. Mechanical Properties
3.2.1. Tensile Properties
Tensile Strength
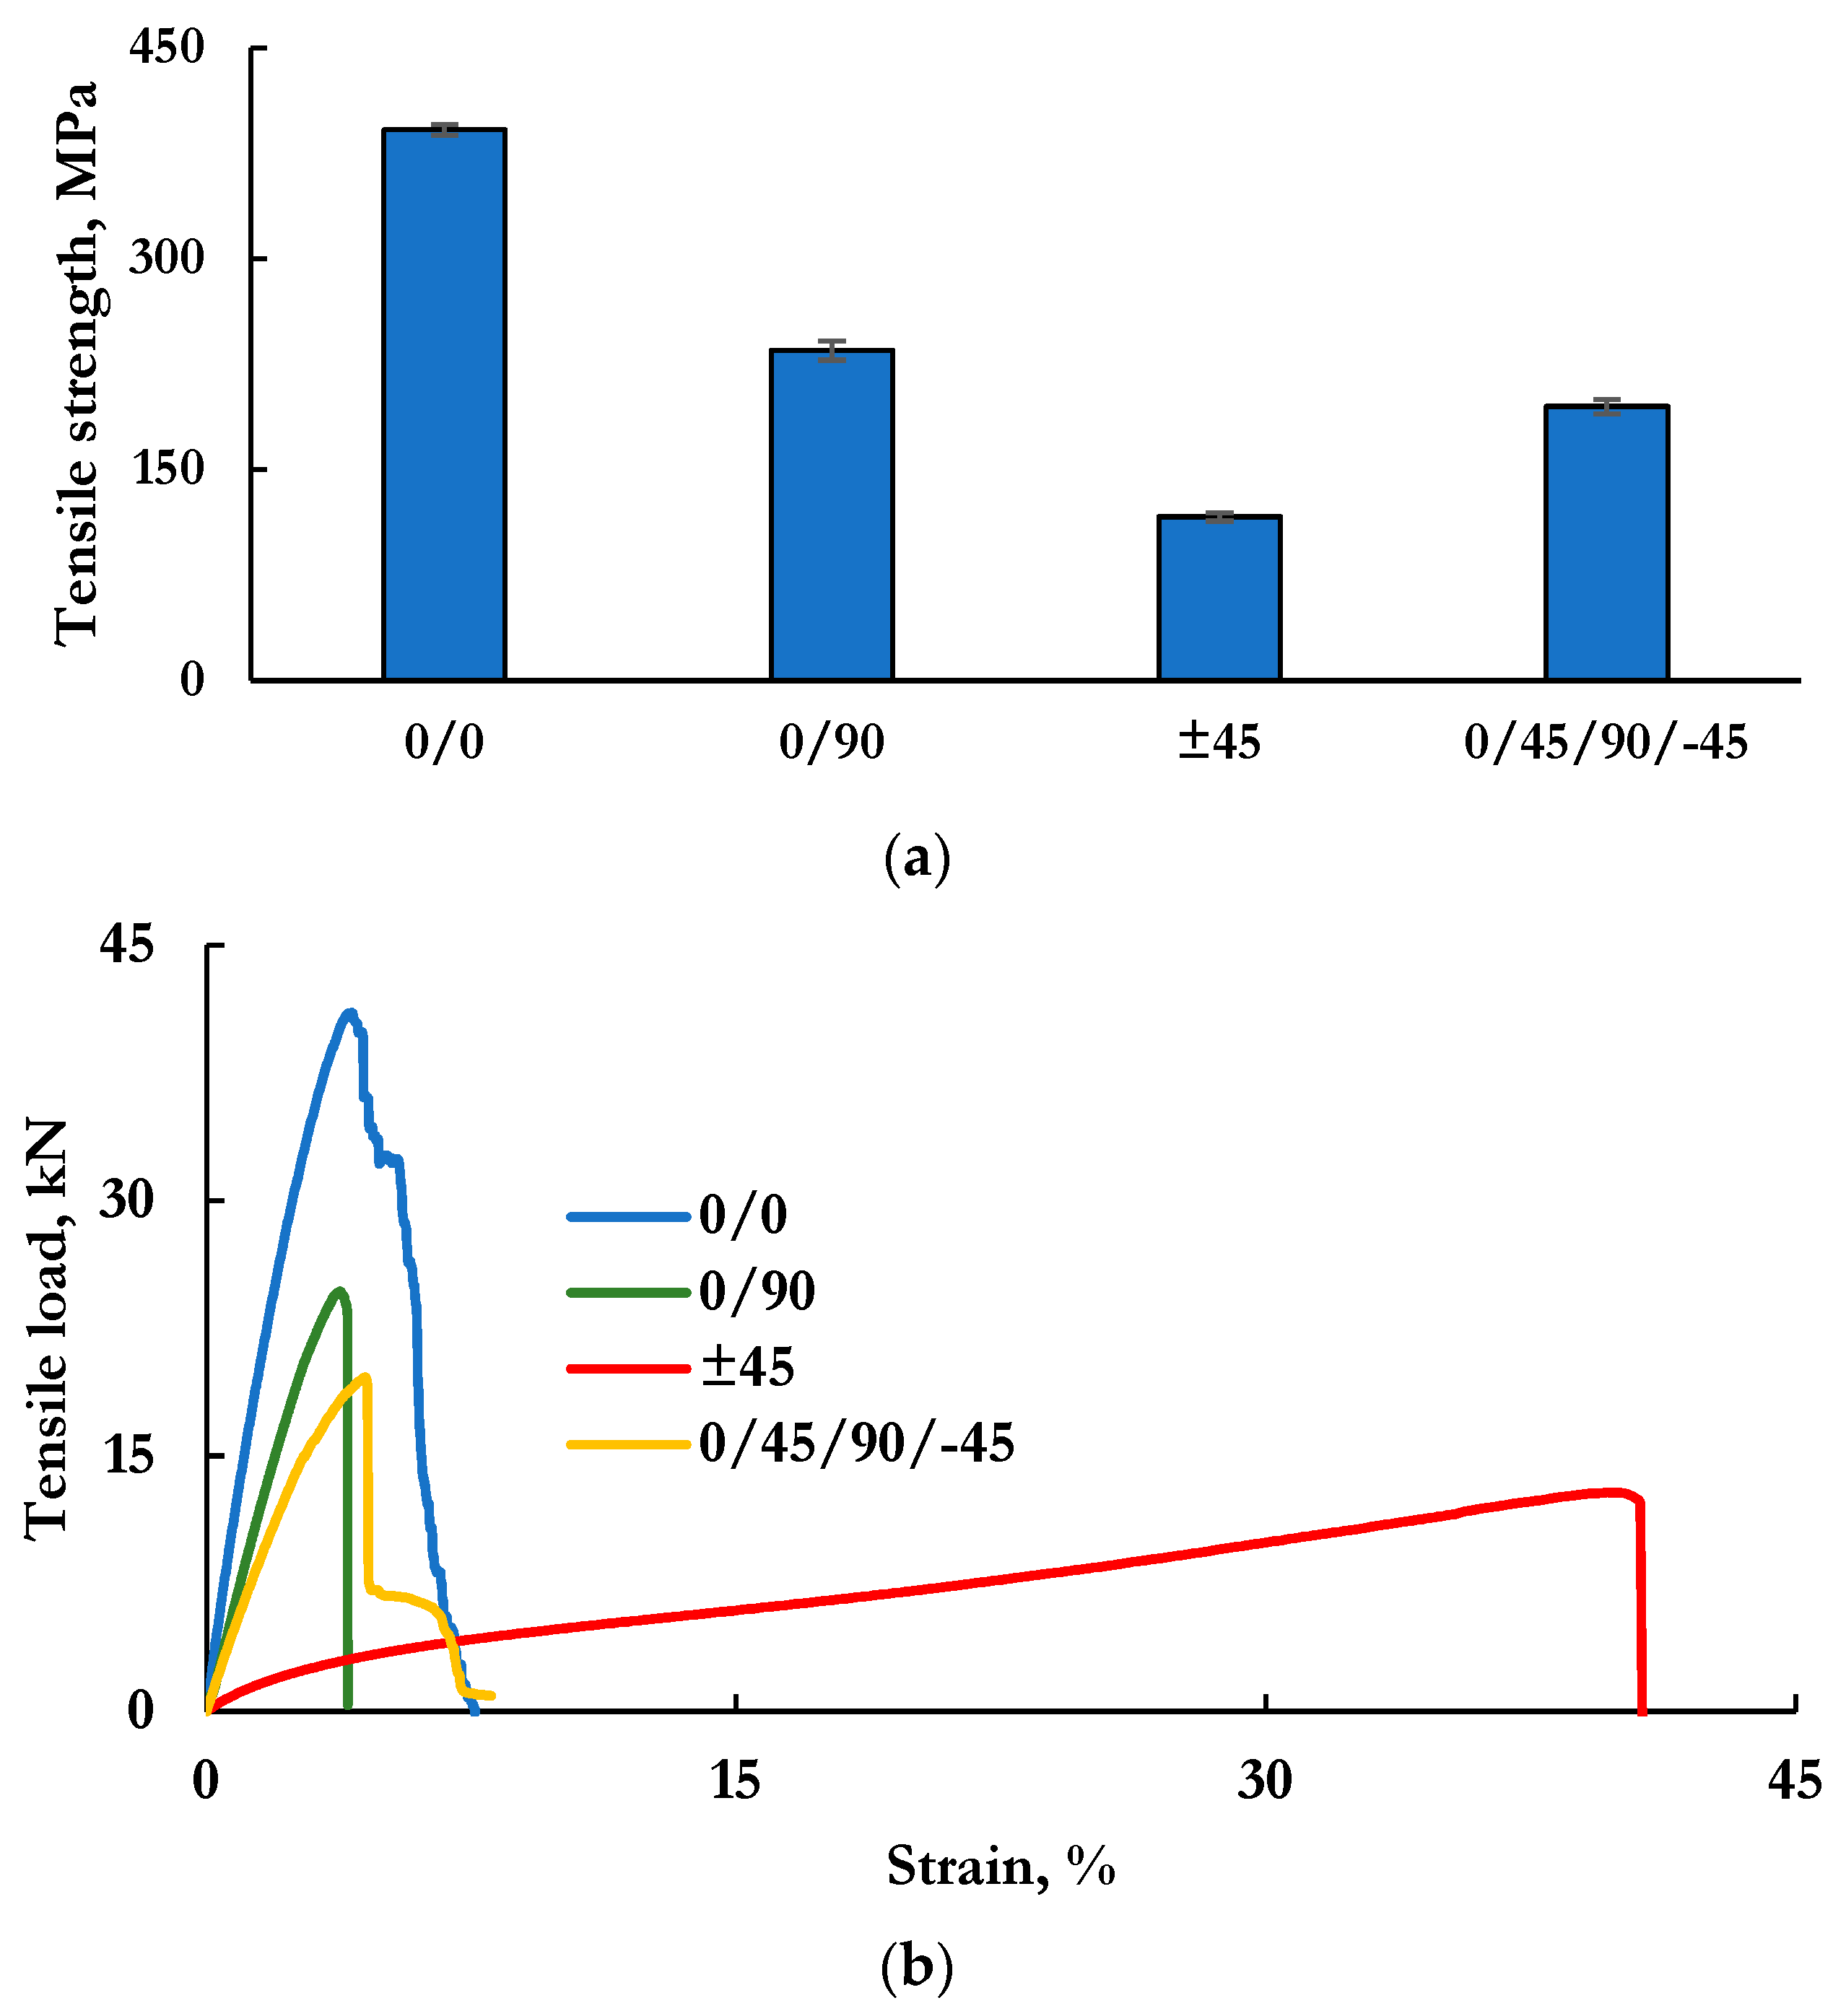
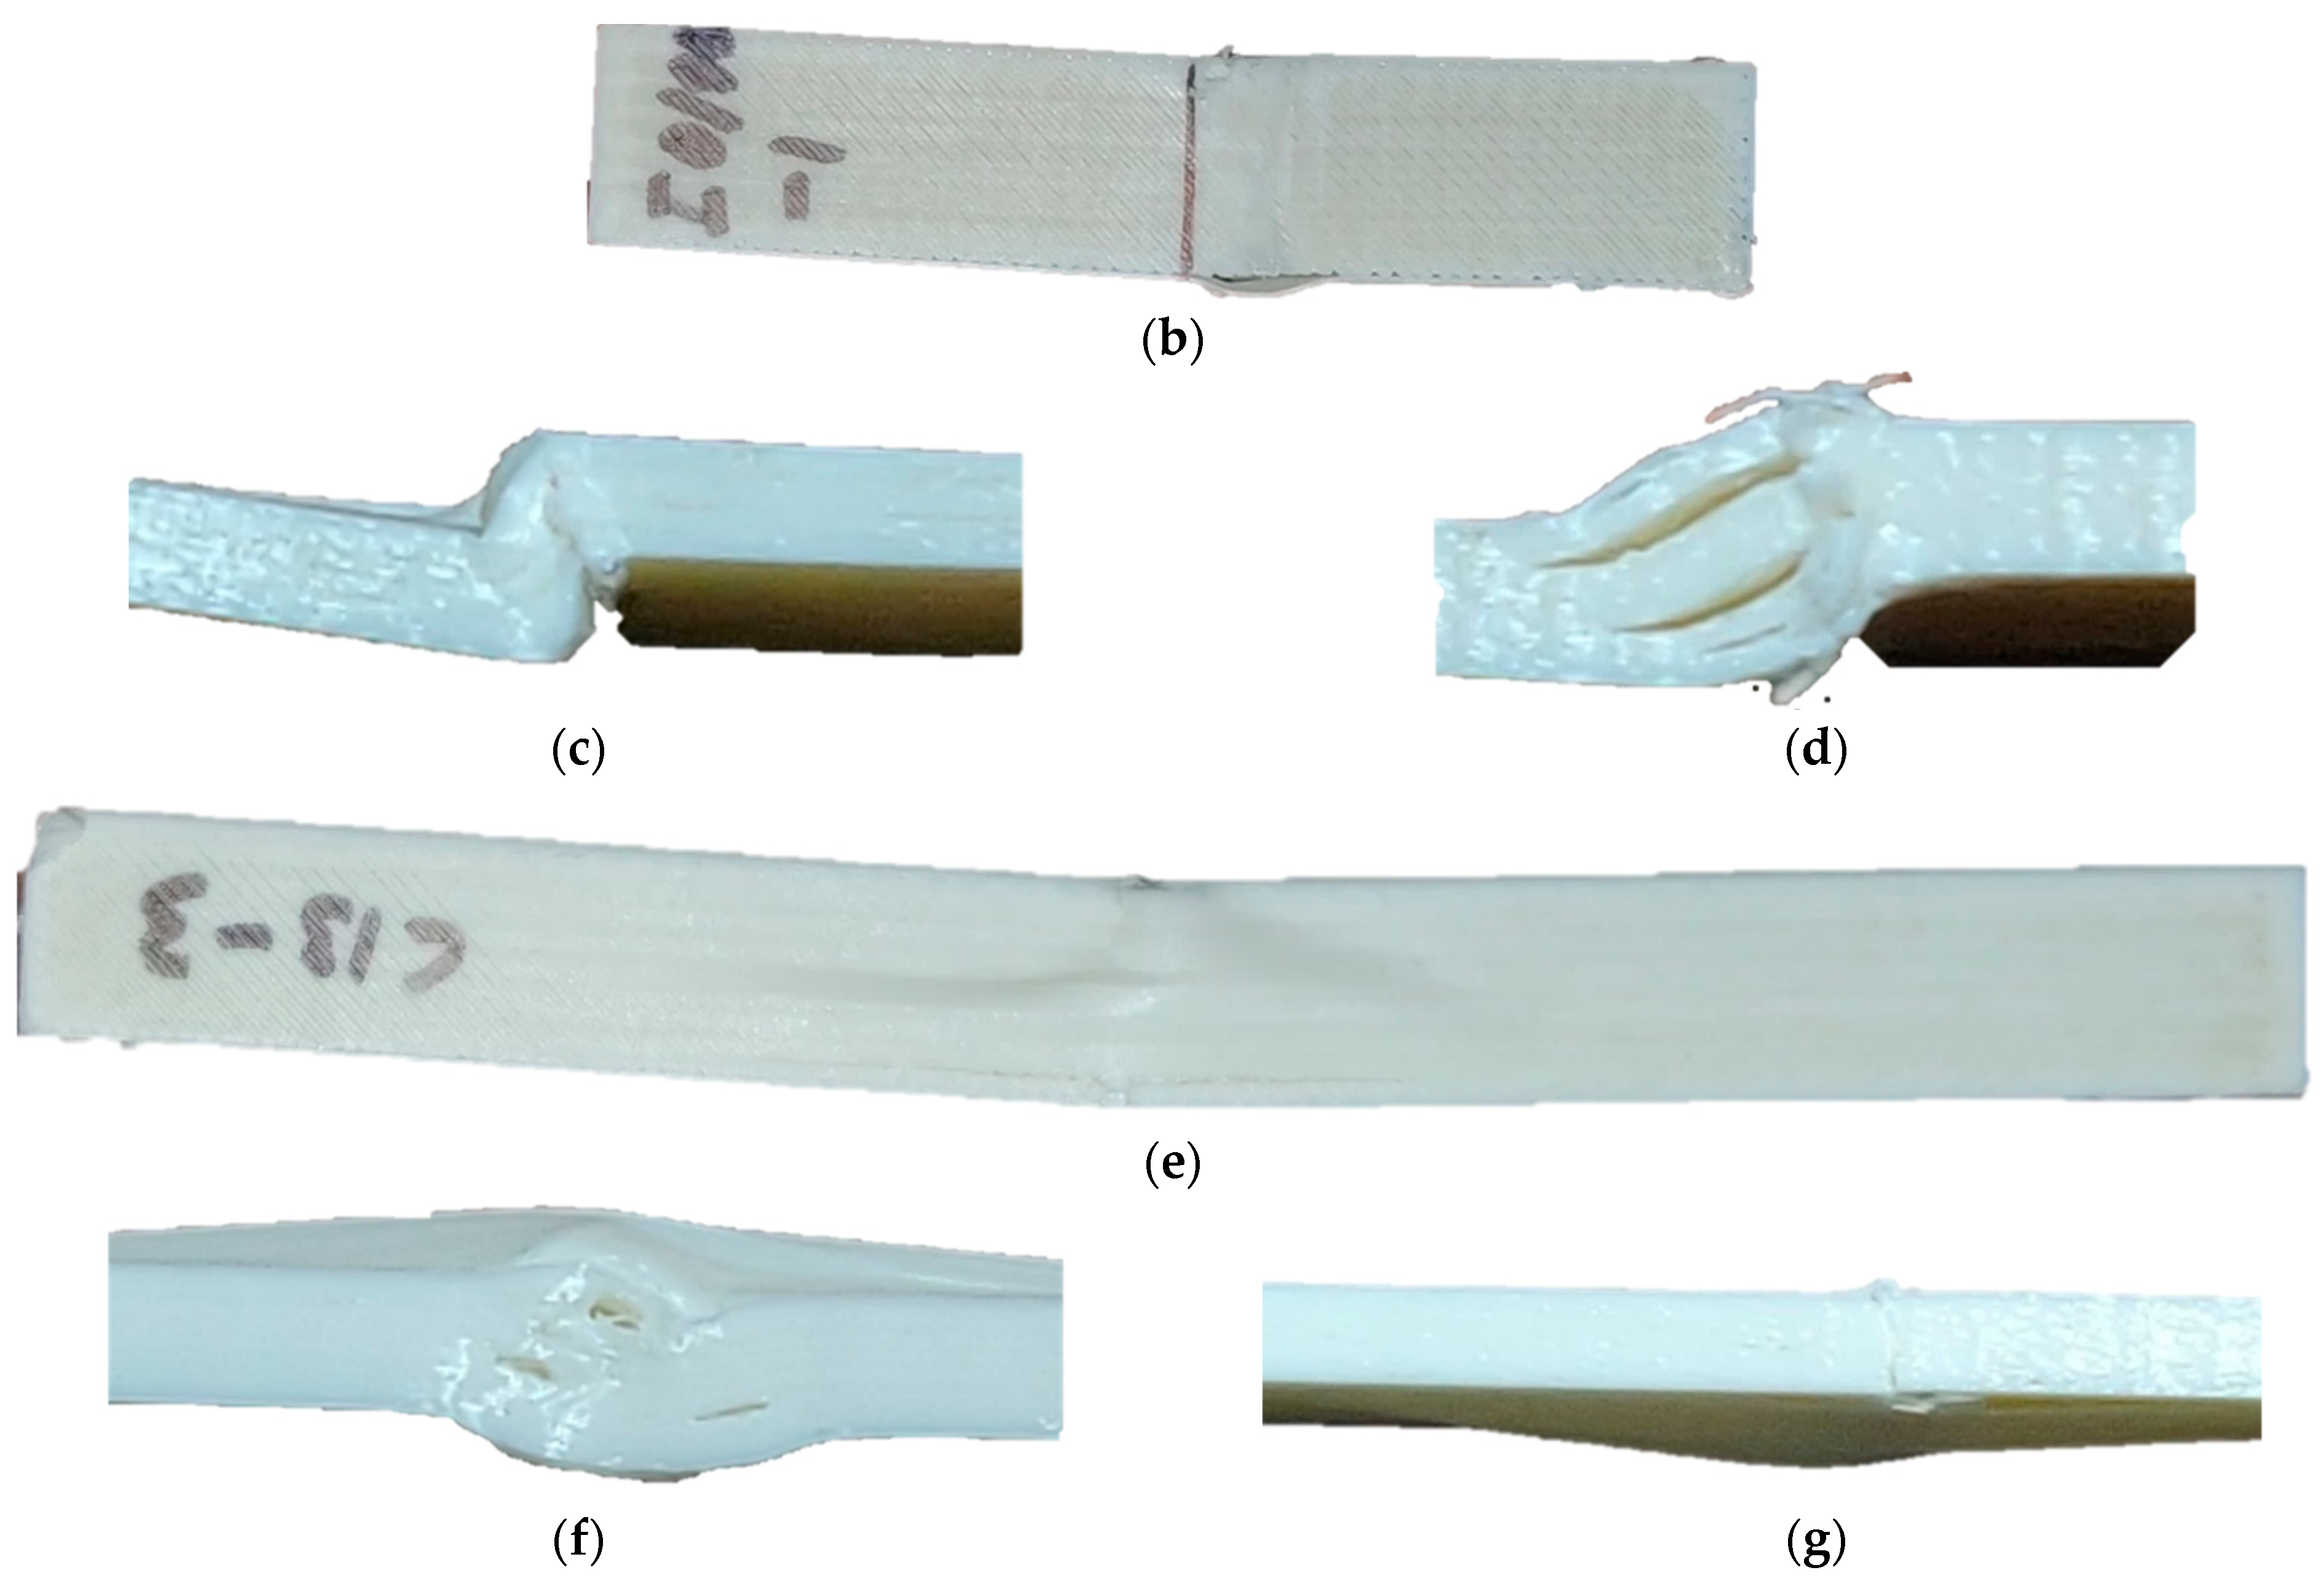
Investigation of tensile properties is the most crucial and often explored criteria of composites [23,24]; therefore, discussion of this significant aspect of the developed composite comes first. Results of one-way ANOVA statistical analysis showed significant effect of fiber orientation (p-value < 0.0001) on the tensile strength of the fabricated composites. A further run of Tukey post-hoc multiple mean comparison test revealed the fiber orientation level was significantly different from each other with highest value for unidirectional (0/0) sample followed by cross-lay (0/90), quasi-isotropic (0/45/90/−45) and angle-lay (±45) samples (Figure 3). Tensile strength of the composites is predominantly led by the contribution of fibers aligned to the test direction than the matrix component due to the higher mechanical properties of fibers [17,25,26,27]. Therefore, based on the principle that the load share by the fiber is proportional to Cosine angles (0°, 45° and 90°), the predicted tensile strength of the composites should be highest for 0/0 orientation (28 fiber layers having Cos0°), followed by ±45 (28 fiber layers having Cos 45°), 0/45/90/−45 (14 fiber layers having Cos 45° + seven fiber layers having Cos 0° + seven layers having Cos 90°), and 0/90 (14 fiber layers having Cos 0° + 14 layers having Cos 90°), respectively. However, the tensile strength obtained for ±45 composite was the least, the reason for this unusual phenomenon lies in the failure nature of the ±45 composite (Figure 4d–f) that failed due to the delamination of fiber and/or polymer layers (attributed by the voids between layers and rasters) before the fiber breakage (in fact, fibers did not break at all). As a result, the load share by fibers in the ±45° orientation was very insignificant; and the apparent tensile strength of the composites with fibers in the ±45° direction had largely been contributed by the matrix component. The load–strain curves in Figure 3b demonstrate the same conclusion; the samples having more fiber in the tensile direction showed higher modulus and low %strain, as contributed by the high modulus rigidity of the fiber. The largest %strain at break (46.18 ± 0.51) for the ±45 composite was mainly attributed to the permanent mechanical deformation of thermoplastic matrix material (which is highly extendable) that had little contribution of fiber [17]. The %strain at break of 0/0, 0/90 and 0/45/90/−45 composites are close; 6.17 (± 0.43), 4.11 (± 0.17) and 4.74 (± 0.11), respectively, due to having some fiber in the test directions (0°).
Comparison of the obtained results (Table 2), with the 3D orthogonal woven (3DOW) and unidirectional (UD) composites having about similar structures, indicated 3DP composites had better tensile strength. However, while considering the fiber contribution in test direction, 3DOW structure having 22.5% of Y-yarn and 23.5% of X-yarn, and UD composites having 55% fiberglass in the test direction showed slightly better performance than the 3DP structure (fiber in the test 31.5% for 0/0 composite) [17,28]. It can be described from the properties of matrices and fibers used in both composites, as in Table S1, that the matrix and fibers in 3DOW (similar information for UD composite were not available) composites had higher tensile strength. Additionally, the poor structural integrity of the 3DP composites with more voids might have played a pivotal role in crack initiation and propagation, which eventually caused premature failure of the composites [29,30]. It can be understood from the load–strain curves of these composites that the fibers in 3DOW and UD specimens failed simultaneously [28,31], whilst the fiber filament in 3DP specimens experienced breakage at different times (as there is seen undulations after the peak force), indicating progressive fiber breakage (Figure 3b). The voids between layers/rasters caused uneven attachment between layers/rasters, resulting in the intermittent fiber breakage for 3DP composites. The difference in the load–strain behavior of 3DOW and 3DP composites is attributed to the through-thickness z-yarn in 3DOW, which prevented delamination and caused all the fiber to break simultaneously. When comparing the results among the Markforged printer-based composites (Table 2) that used the same type of fiber filament (fiberglass), the present result seems somewhat lower than obtained by other researchers as well as the authors’ previous findings [17] (Table S2). It might have happened for the same underlying reason: Due to the waviness and poor matrix infusion (as there more fiber), resulting in poor interface with voids among the adjacent printed composite filament (causing poor connection), the 3DP composites in this study failed prematurely by individualizing composite filaments (Figure 4c) and breaking at different times. Here, Justo et al. [32] in their paper did not mention the number of reinforcing fiber layers and the authors of the present research, including other researchers (who used same material), realized that the fiberglass filament had approximately 38% FVF ([6,19], (observed 35%). In this sense, composite with 50% fiberglass seems overestimated when there are already two unavoidable floor/roof thermoplastic polymer layers.
Failure Mechanism
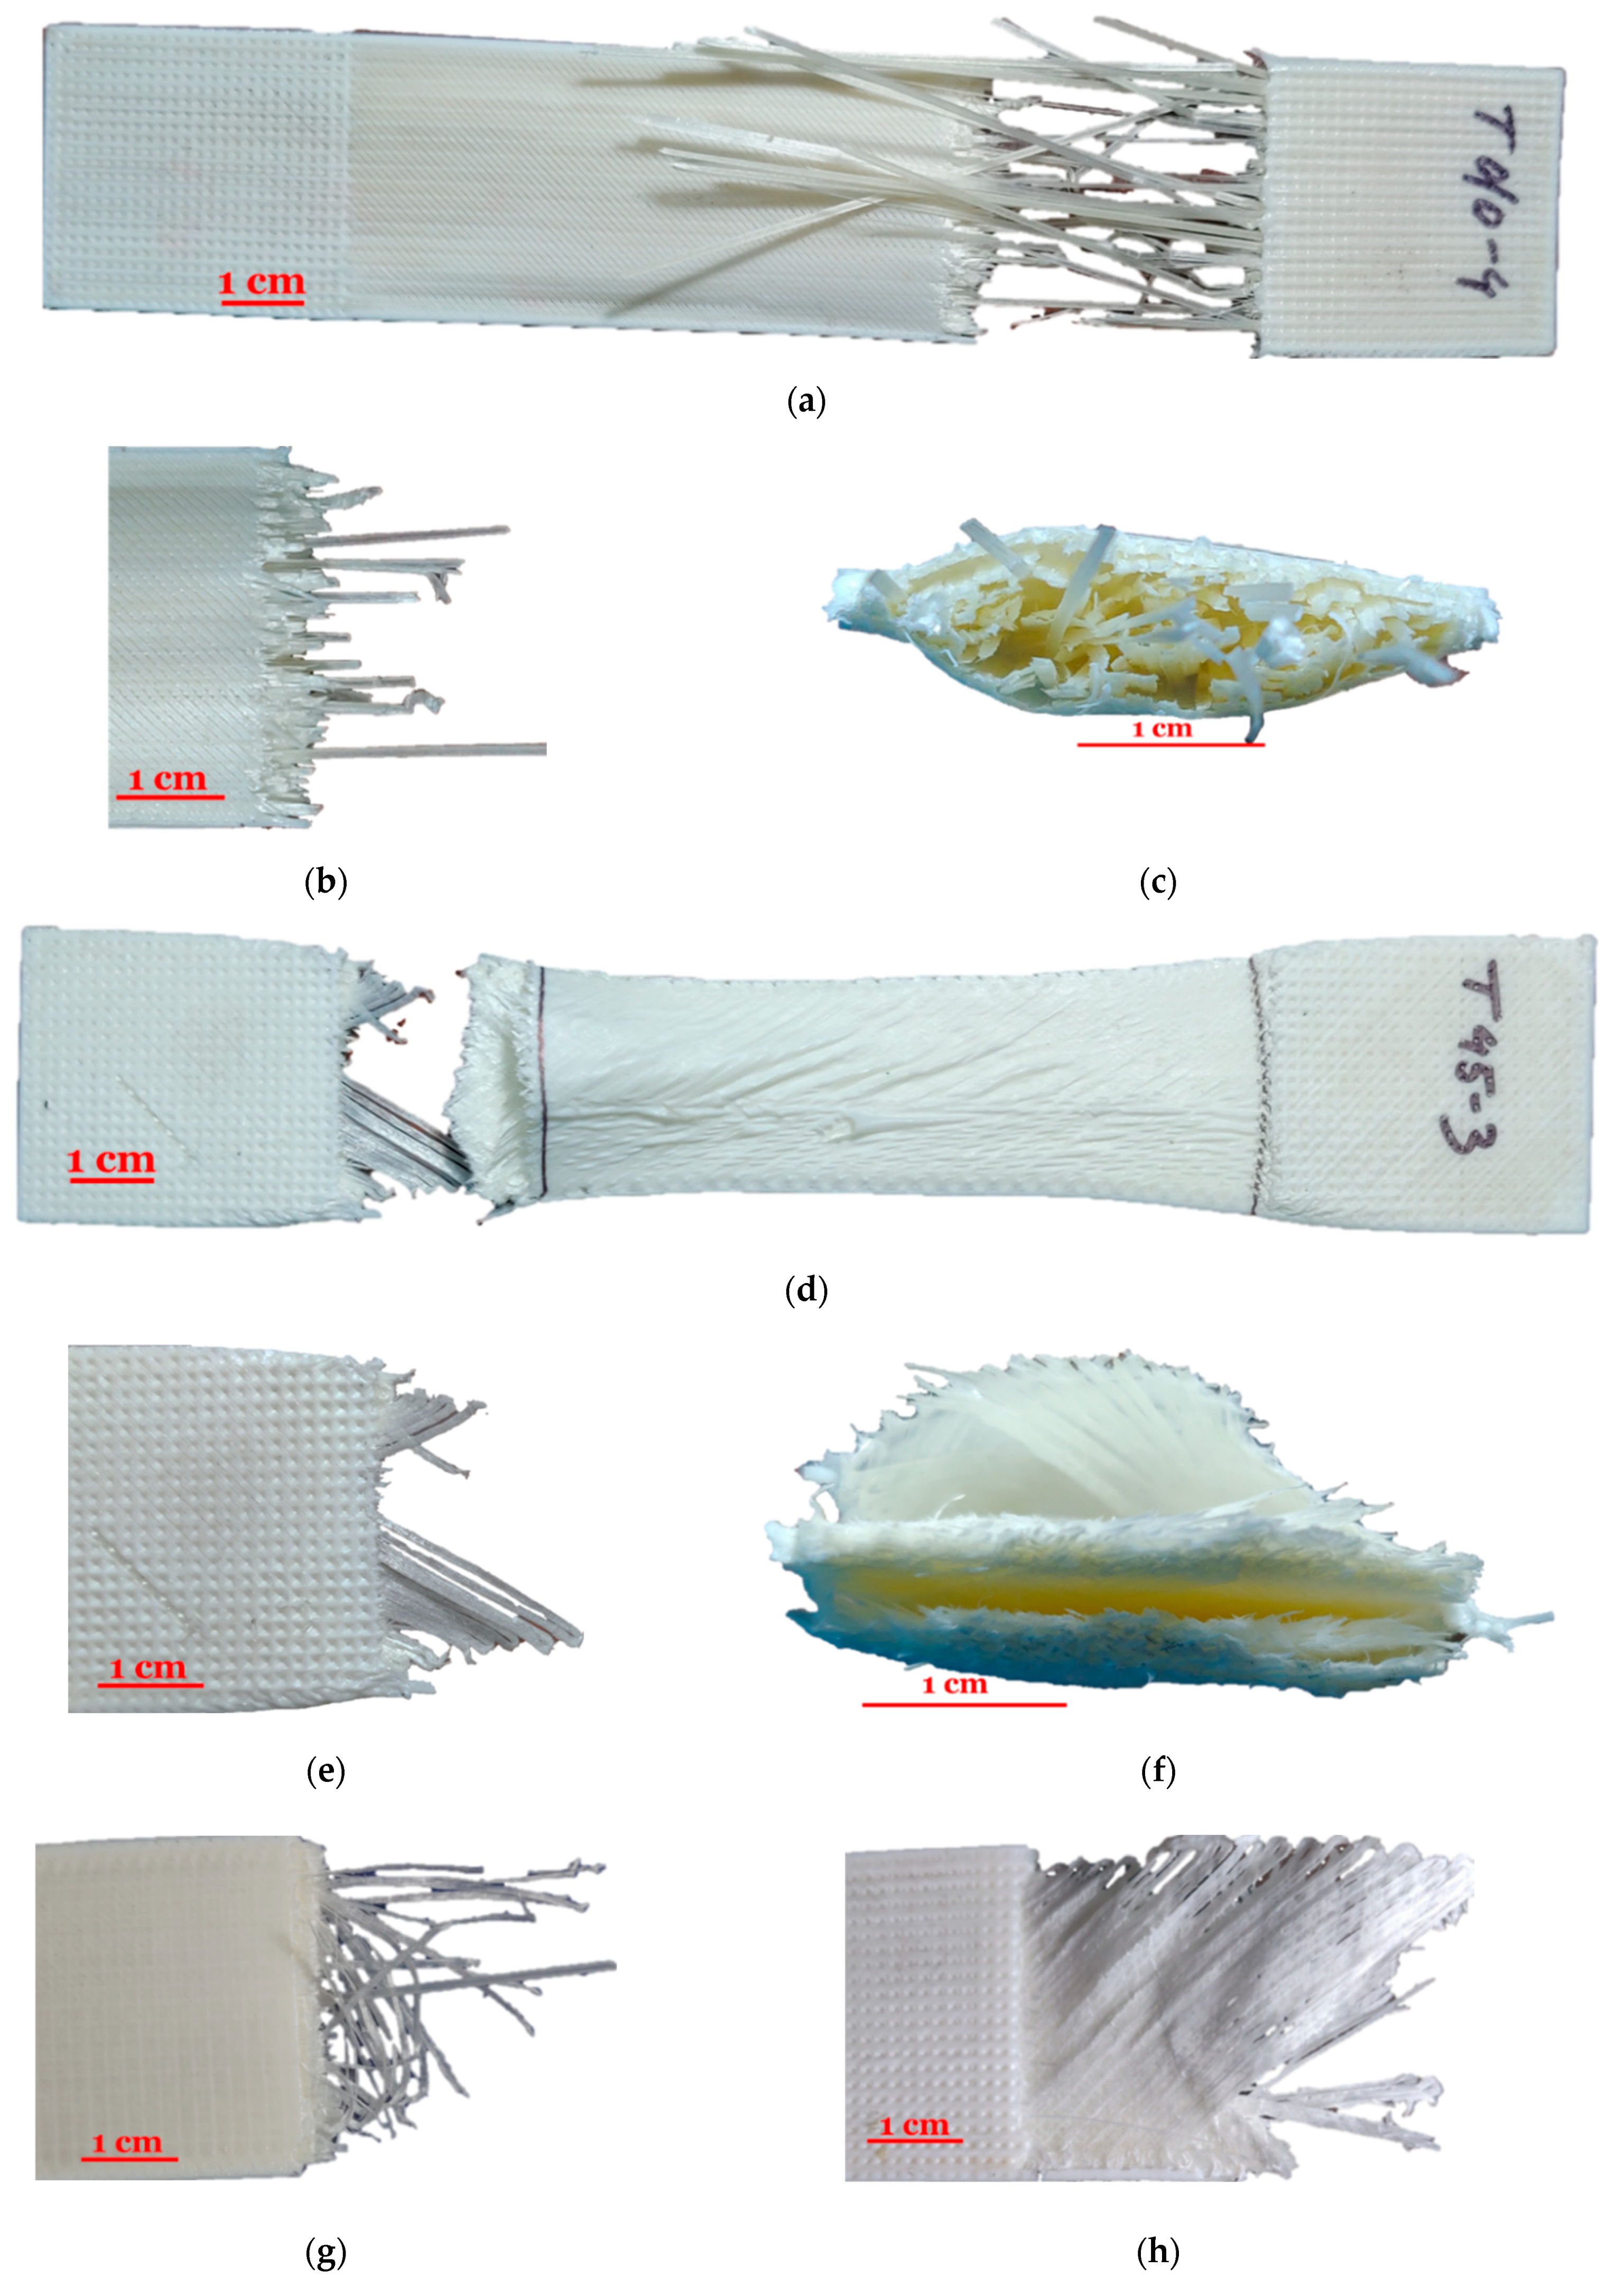
Figure 4 presents two distinct natures of tensile failure: one was led by fiber breakage, including some notion of interlayer delamination (Figure 4a–c,g of 0/0 and 0/90 specimens); while the other was interlayer delamination (due to interlaminar shear) only (Figure 4d–f of ±45 specimen). Fiber bundle breakage with interlayer delamination was noticed in case of unidirectional, cross-lay and quasi-isotropic samples and significant interlayer delamination was seen in the angle-lay composite. A closer look at the fiber breakage (Figure 4a,b,g) illustrates fiber pullout phenomenon in bundle format, rather than individual fiber breakage, indicating that the fiber composite filament had a good fiber–polymer interface (before printing, in the fiber filament state) but poor interface between the filament bundles after printing. Consequently, a substantial debonding between the adjacent filament bundles (or yarn) is observed, as seen in Figure 4c, where the printed filament bundles have been individualized due to a very side weak interface. Use of a polymer layer between fiber layers helps improve the interface, as observed by Kabir et al. [16] and Chabaud et al. [6]. While failure of unidirectional and cross-lay composites occurred mainly due to progressive and massive fiber breakage (Figure 4a–c,h), respectively, as evidenced by filament pullout (Figure 4a,b,e), the angle-lay composite failed due to interlayer delamination of both fiber and polymer layers (Figure 4d–f), with no evidence of filament breakage. On the other hand, the failure mechanism of the quasi-isotropic composite included both filament pullout and interlayer delamination due to the presence of fiber filament in both 0/0 and ±45 directions.
3.2.2. Drop-Weight Impact Properties
Drop-Weight Impact Force and Energy
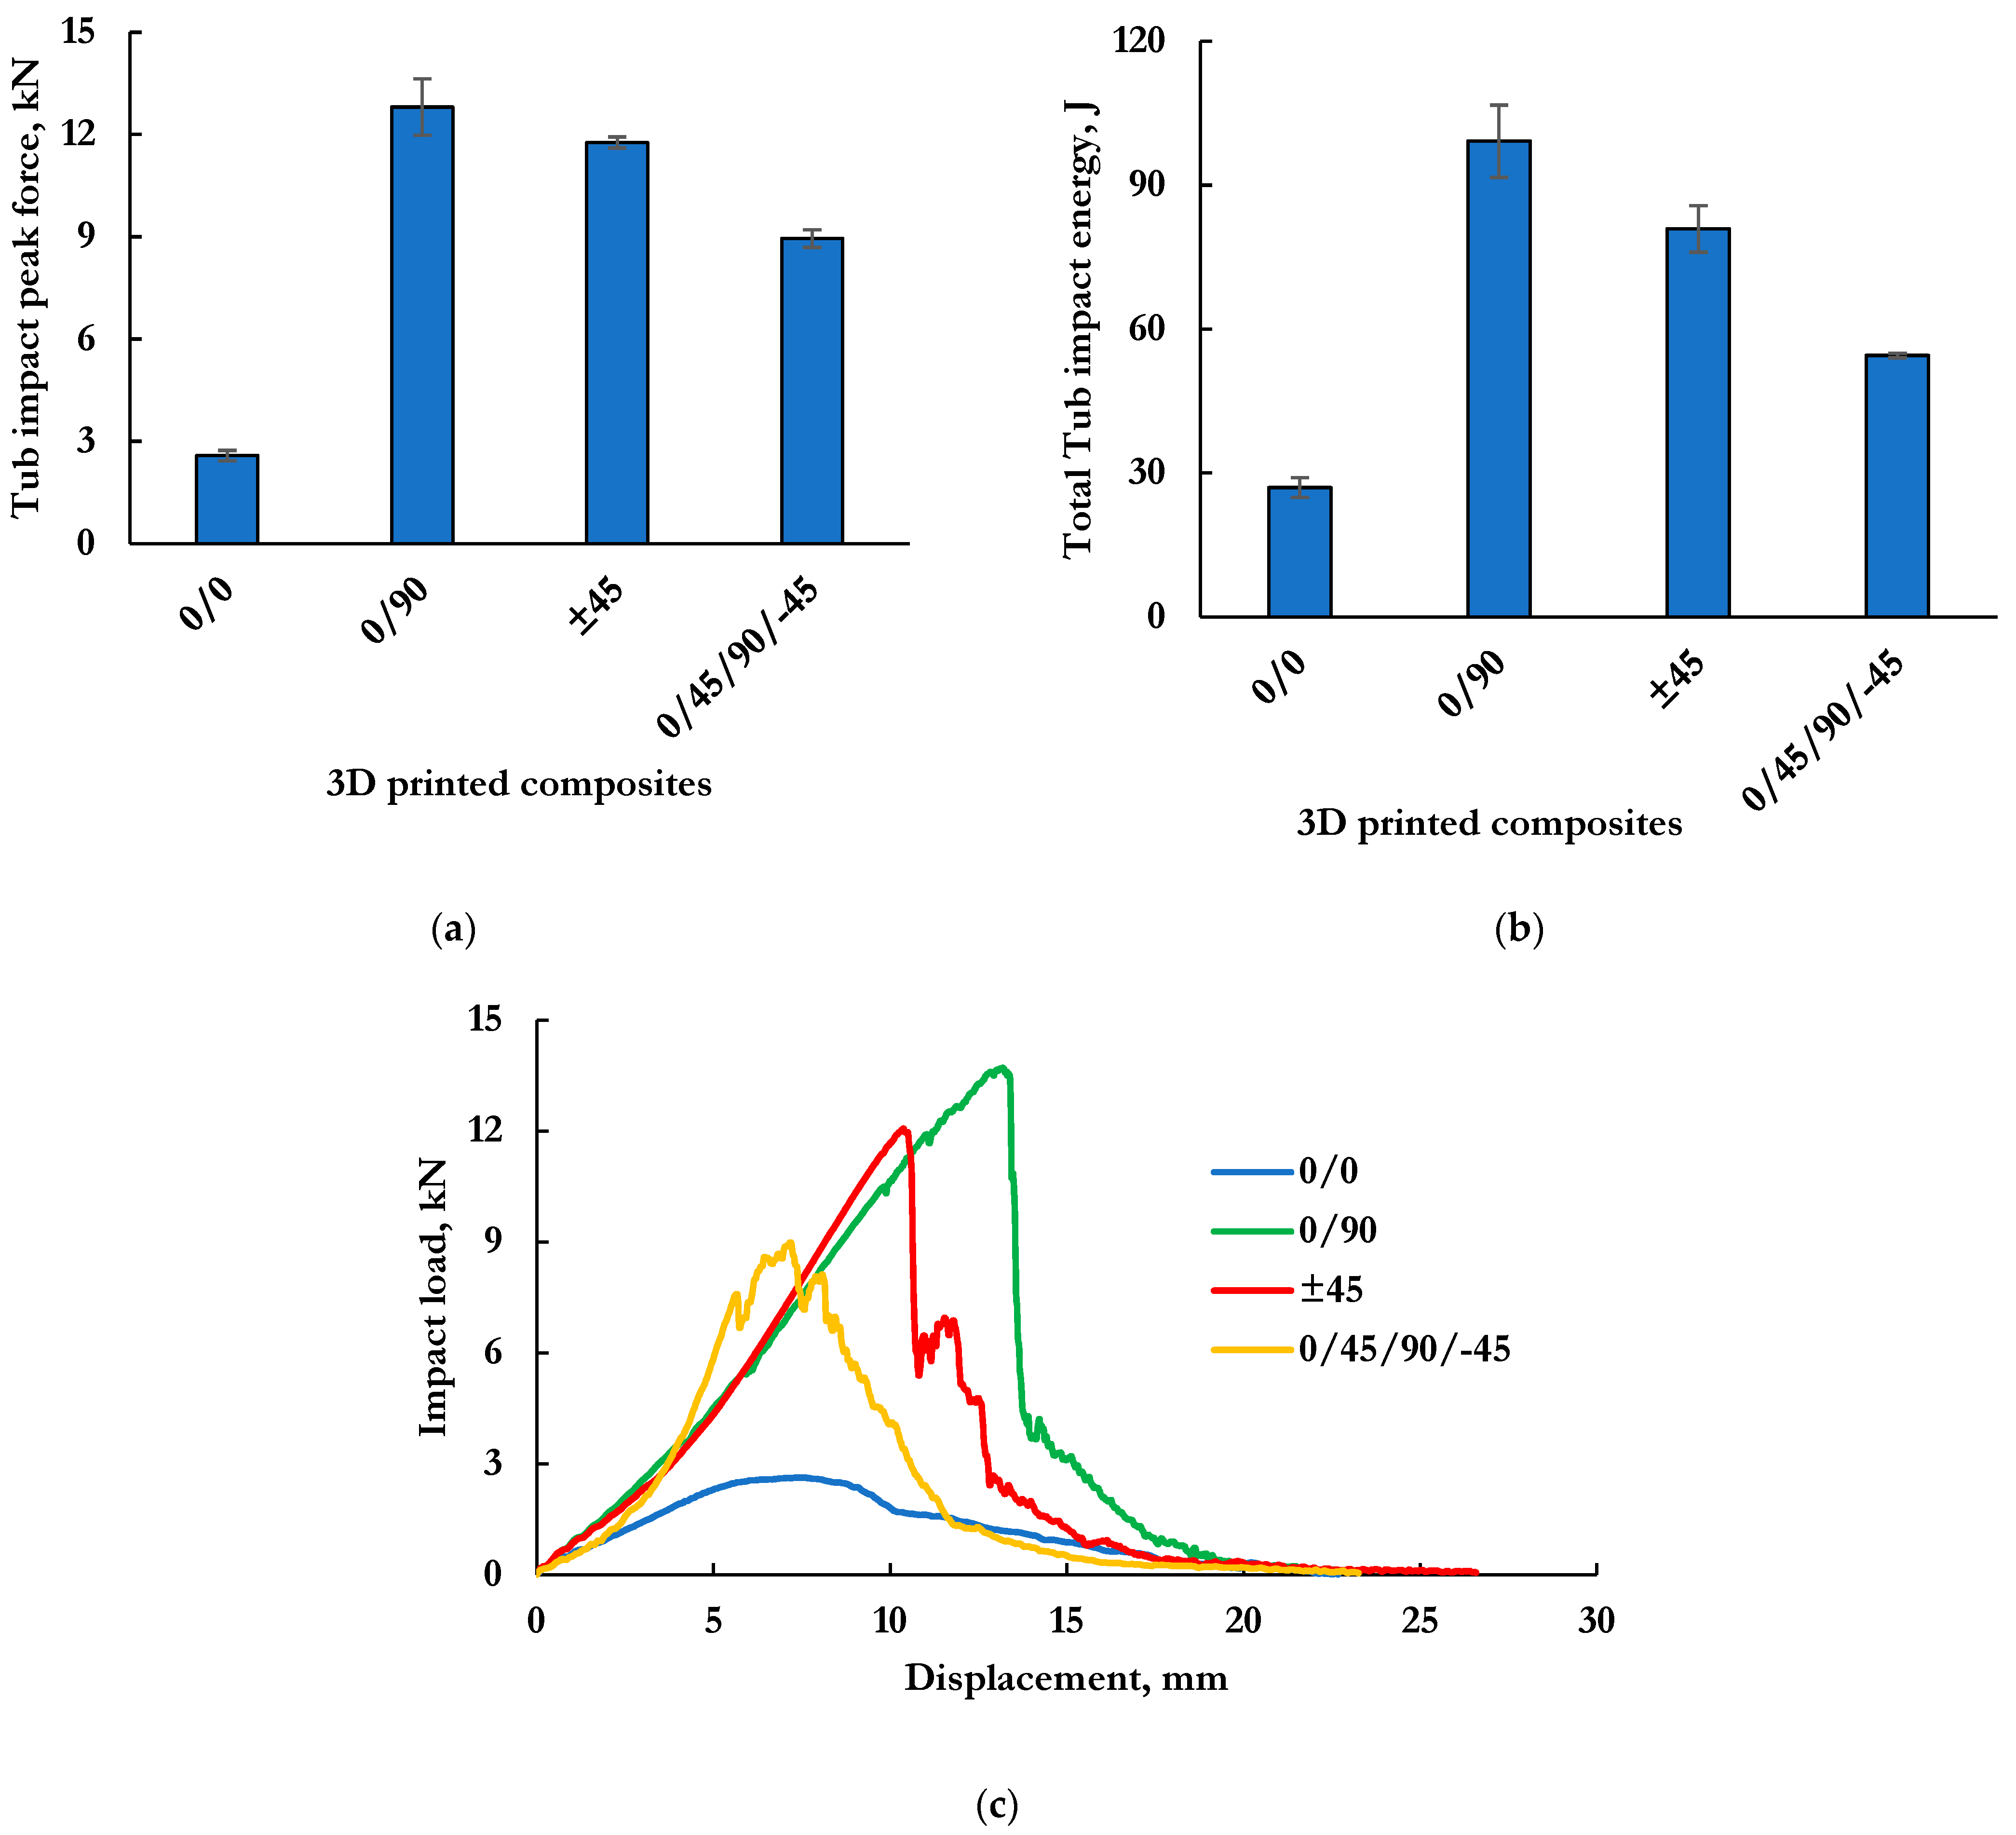
Impact resistance of 3DP composites by Drop-weight system is summarized in Figure 5 in terms of Tub impact peak force (a), Tub impact total energy absorption (b), and Tub impact load–displacement curves (c). Results from statistical analysis revealed that the fiber orientation had significant effect on peak impact force (p-value < 0.0001) and total energy absorption (p-value < 0.0001). However, the Tukey multiple mean comparison exhibited the fiber orientation level is not significantly different from each other and distinguished three in subsections for four levels: The cross- and angle-lay composites remained in the first section, A (Tukey lettered groupings (A, B, and C) that is interpreted as the means falling in a same group/section have no significant difference), for both force (p-value = 0.55) and energy (p-value = 0.104), although the cross-lay (0/90) composite seems to have better (Figure 5) impact resistance than the angle-lay (±45) composite; followed by the quasi-isotropic composite (0/45/90/−45) in section B and unidirectional composite (0/0) in section C.
The stacking sequence of the fiber dictates the stiffness and load-transfer mechanism of the composites. The lowest impact resistance of the unidirectional composite is because of the inability of the fiber component to participate in impact energy absorption. Here, the impact energy was mainly resisted by the matrix material, regardless of the amount of fiber loaded. For instance, Kabir et al. [16] found almost the same impact properties (force and energy), although the FVF fraction in their composites was very low compared to the present study (9% vs. 32%); the other parameters are the same. In contrast, loading fiber in different directions causes phenomenal change in the improvement of impact resistance, as evidenced by the other composites, as the fibers in this regard contribute to transfer the applied impact load more than that of the matrix component. The reasons behind the differences in the impact properties among the cross-lay, angle-lay and quasi-isotropic composites include the differences in the stiffness, rebounding effect and curvature formation. Due to having more variations in fiber orientation in case of the quasi-isotropic sample, its relative stiffness is higher than the cross- and angle-lay composites [33], as seen from Figure 5c. The cross-lay composite showed rebounding effect, causing surface buckling (an indication of less stiff composite) that eventually contributed to some energy absorption. Although cross- and angle-lay composites have no statistically significant difference in their impact performance, the former showed better impact resistance than the latter. The cross-lay composite had uniform and balanced fiber distribution extending the length and width of the composite, allowing it to form curvature as well as slightly higher fiber volume fraction; consequentially, the cross-lay composite showed better impact resistance than the angle-lay composite [33].
The authors experienced lack of literature to compare the obtained results with 3DP structures, except their previous research, concluding that maximizing fiber content from eight to 28 layers (of 3 mm thick composite) tremendously improved impact resistance (from ~29 J to ~100 J) [16], and both results (present and previous) were pretty consistent, as outlined in Table S2. Benchmarking the impact properties with the same 3DOW composites (Table 3) revealed the developed 3DP composite (0/90 as it resembles to the 3DOW structure) is highly resistant to impact force (53.4 J vs. 99 J). Normalizing the impact energy by the composite areal weight (J/kg/m2), fiber weight (J/kg/m2), composite thickness (J/mm) and FVF (J/FVF) demonstrates that the 3DP composite is 130%, 207%, 79% and 179% stronger than 3DOW composites, respectively. The nature of the fabrication technology of 3DP and 3DOW composites is mainly responsible for the phenomena that creates some unintentional and structural voids in 3DP composites, acting an auspicious role to absorb more energy than stiff and solid structures, following the principal to enhance impact resistance by incorporating cellular cells [30]. Besides, the layer-by-layer structure of 3DP composites can be considered as a laminated structure with many layers, unlike 3DOW composites (an integrated structure due to the presence of the through the thickness reinforcement), which might have been fractured intermittently involving relatively more energy absorption [16].
Failure Mechanism
Understanding failure behavior is a complicated process involving a wide variety of factors, such as matrix micro- and macro-cracks, surface buckling, delamination, core failure, fiber breakage and fiber splitting, based on the composite design and constituting materials [33,34,35,36]. Load-deflection curves (Figure 5c) and the fractographies (Figure 6) are useful to explain the failure mechanism of the composites. Figure 5c and Figure 6 suggest that the fiber orientations dominate the breaking mode of the composites.
Figure 5c denotes the composites having fibers in different directions (0/90, ±45 and 0/45/90/−45) are very stiff, while the unidirectional composite shows ductile behavior. It makes sense, as in the case of unidirectional composites, the matrix (Nylon 6) component of the composite, which is very pliable, mainly managed the impact force. Additionally, evidence of no undulation is obvious for the 0/0 composite, indicating no fiber breakage occurred, which can also be perceived from Figure 6a–c. Failure of the composite was led by the matrix cracking that propagated along the fiber direction (0°), until it reached any of the ends, followed by massive and multiple slitting (Figure 6a–c) in the fiber direction before transferring the load to the fiber, thus no fiber breakage happened.
However, for other composites, oscillations in the curves are observed indicating progressive fiber breakage. Here, initially the load increased linearly with displacement until it achieved the peak force, except for the 0/45/90/−45 composite that experienced some micro- and macro-cracks before reaching the peak force (Figure 5c). For this sample, the peak force is seen in the middle of the curve and a significant (almost half) amount of impact energy was absorbed after the peak force, which is a typical behavior of a ductile fracture. However, this might be attributed to the variable stiffness and the different mode of failures of the fiber layers with different orientations, which enabled the composite to absorb energy after reaching the peak force, although the resultant stiffness of the composite is higher. To better understand the phenomenon, a future in-depth research involving different quasi-isotropic and cross-lay composites is suggested considering high resolution fractured images.
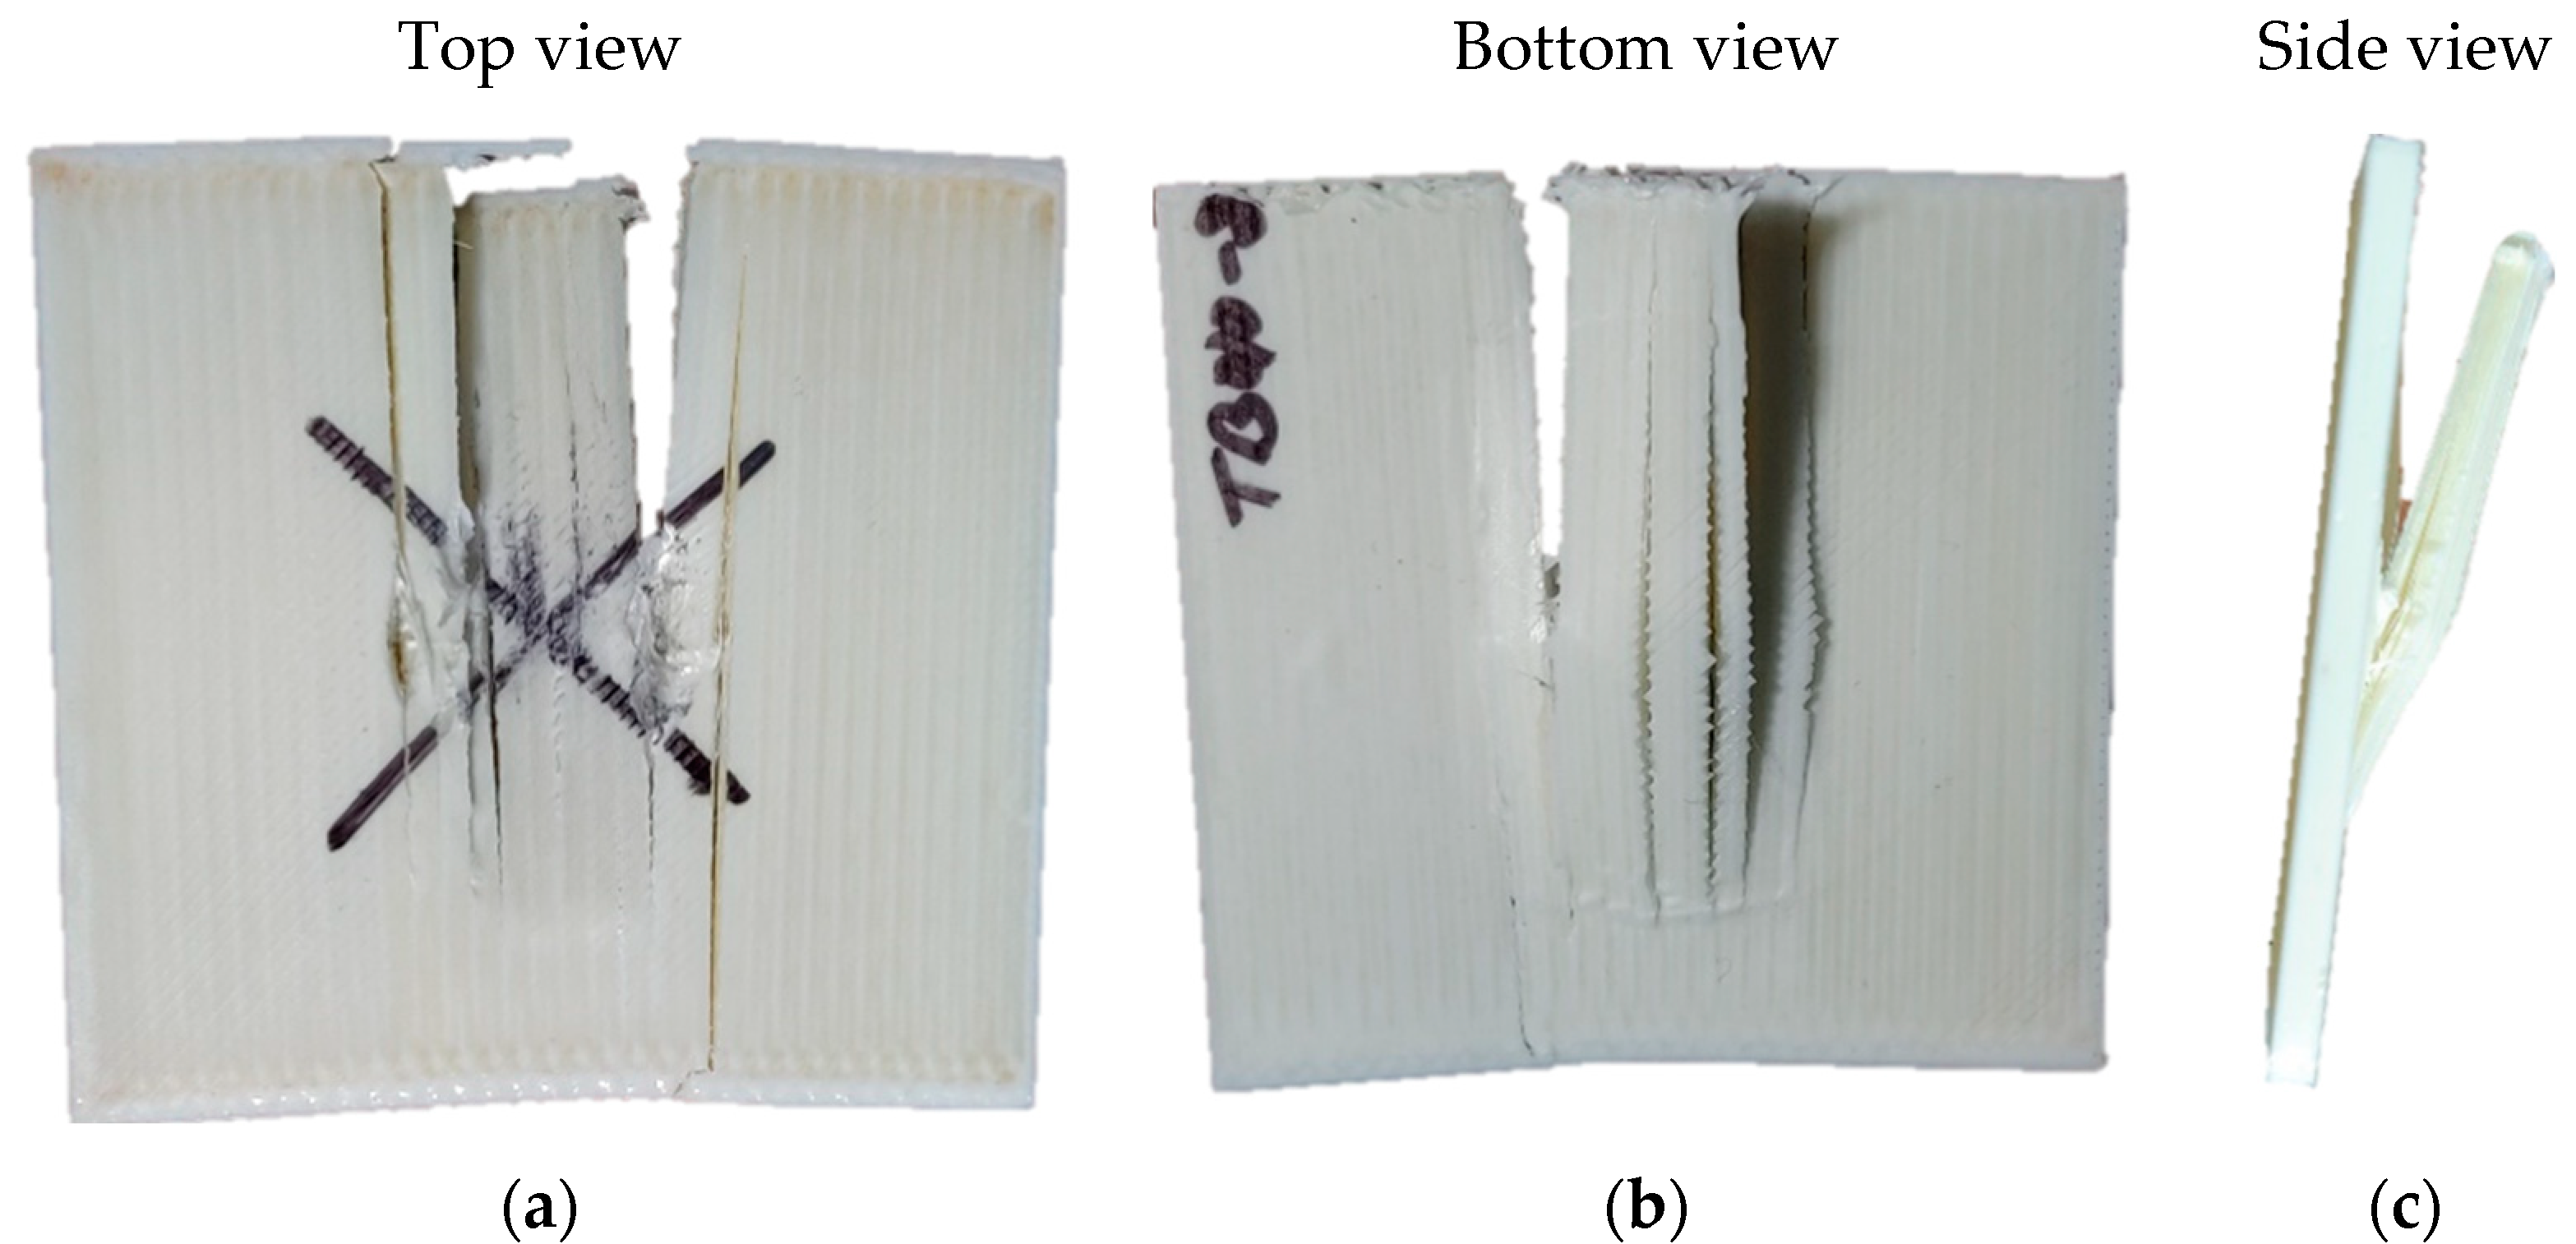
On the other hand, cross- and angle-lay composites showed similar fracture behavior—abrupt failure after reaching the peak force due to interlayer delamination and rapid fiber breakage. The fractured images of these composites (Figure 6d–f for cross-lay and Figure 6g–i for angel-lay composites) provide a testimony for interlayer delamination, fiber breakage, surface buckling and slitting into four pieces along the fiber orientations of respective composites. In case of the quasi-isotropic composite, in Figure 6j–l, interlayer delamination is seen in the outer most layers (Figure 6k, which are the floor layers) that were in tension during impacting (this might potentially be initiated from the micro- and macro matrix cracks). Again, the delamination including the matrix fracture followed the fiber orientation (the very first layer after floor layer is 0°). The deflection height and area are often considered to explain the impact resistance of the composite—the lower the deflected area, the better the impact resistance is [28]—which also supports the findings of this research (0/90 > ±45 > 0/45/90/−45).
3.2.3. Pendulum Impact Properties
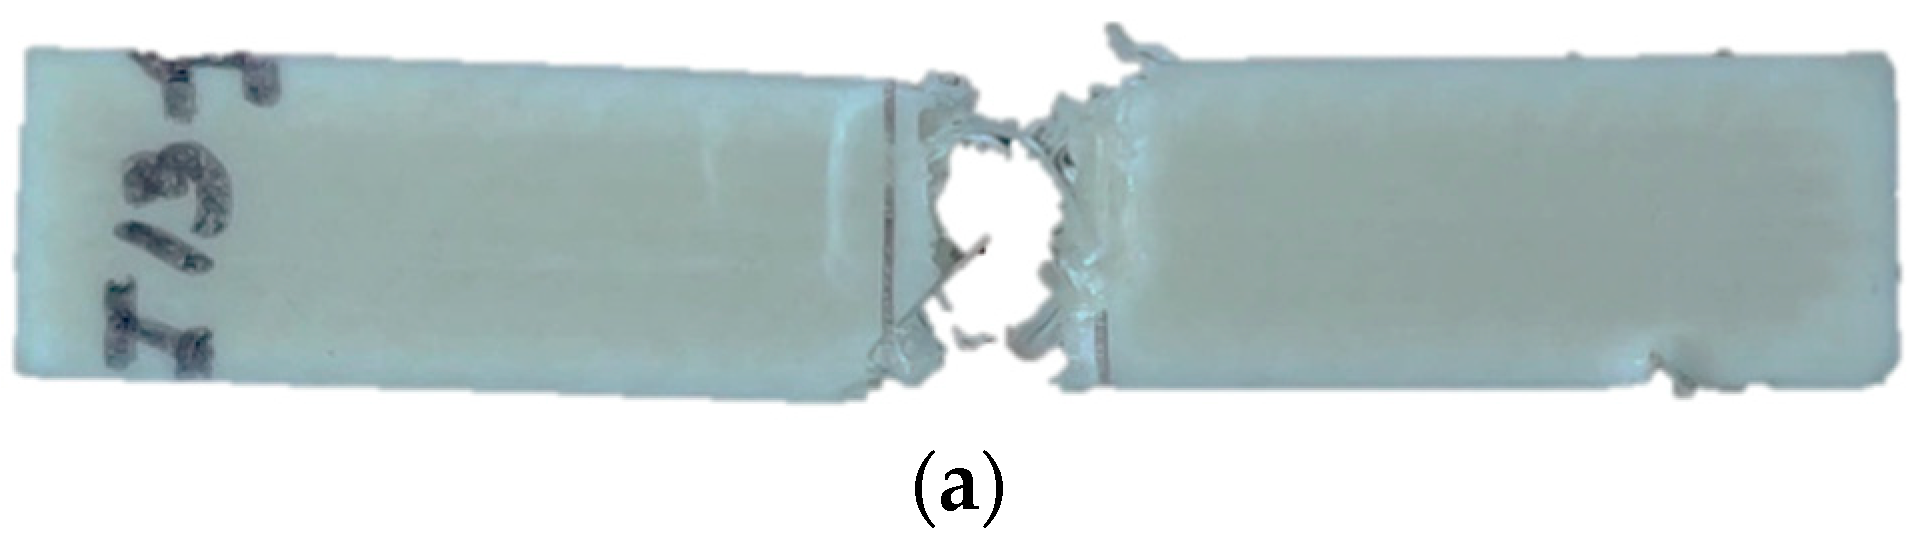
Pendulum impact (Izod and Charpy) properties evaluate the toughness of a material through measuring the total amount of kinetic energy that a material can absorb during impacting [15]. Figure 7 presents the results of both impact energies. According to ASTM test standard, four types of breaking mode (complete break, hinge break, partial break and non-break) should be observed, and the results of complete or hinge break are reportable only. Additionally, samples having different breaking modes should not be compared [37,38]. In the present research, only the 0/45/90/−45 Izod composite sample achieved hinge break (Figure 8a), no other sample from both tests gained any break (non-break). Therefore, the results obtained are not plausible and interpretable (hence no statistical analysis was performed). One is supposed to expect that the trend of impact energy should be 0/0 > 0/90 > 0/45/90/−45 > ±45 based on amount of fiber being impacted, which is not reflected from Figure 7. At this juncture, painstaking and reasonable explanation is deserved for the non-break phenomenon.
Although, the samples of the research are expected to be very strong due to high fiber content, the authors based on their experience believe that the energy of the pendulum used here (50 J) is more than sufficient to break the strongest composites (0/0). It can be apprehended from the maximum energy obtained from the tested samples being 11.3 J, which is less than 25% of the impactor’s capacity. In addition, in our previous research, we had a 0/0 sample with 30 layers including eight reinforcing fiber layers that achieved complete break with a 22 J impactor and absorbed approximately 30% of the impactor’s energy (8 J) [16]. Here, the samples avoided breaks by flexing, twisting and/or receding from the sample holder, thus they avoid confronting the whole impact energy applied. Consequently, the absorbed energy is too low. The sample placement configuration of Izod and Charpy differs: The Izod test involves holding the test specimens firmly at one end (and other end is impacted), while in the Charpy test, the test specimen is loosely supported, and often specimens lose the support before receiving the full impact force, as experienced and discussed by Kabir et al. [16] and Hetrict et al. [39]. Having a firm support for the Izod test, specimens remained in the sample holder after the test seemingly to receive impact energy, but they twisted, as seen in Figure 8b–d. It happened due to a weak connection between the printed adjacent composite filament rasters as a result of insufficient matrix infusion. Consequently, when the impactor hit a specimen, the printed fiber filament rasters inside the outer polymer layer individualized, overcoming the weakly held connection, and migrated from the impacting side that resultantly caused the specimens to twist and thus avoid receiving full impact energy. This explanation (individualization of fiber bundle) can be provisioned from the cross-sectional fractured image of the 0/0 tensile specimen in Figure 4c. In contrast, all Charpy test specimens lost support, absorbing a small portion of applied impact energy and; therefore, experienced non-break mode.
4. Conclusions
Low fiber content compared to traditional composites is a drawback of fiber-reinforced 3DP composites. The present research fabricated and characterized continuous fiberglass-reinforced 3DP composites with maximum fiber content orientated in different directions (0/0, 0/90, ±45, 0/45/90/−45). Although the achieved FVF is still low (~32%) compared to traditional composites, the results of the investigated properties (tensile and impact) are encouraging. Apparently, the tensile strength of 3DP composites was slightly low because of poor structural integrity, causing premature failure of the composite by progressive fiber breakage at different times, which was due to insufficient matrix infusion between rasters and the absence of through-thickness reinforcement. On the other hand, this poor structural integrity of 3DP composites accompanied with a void and a layered structure played an auspicious role to improve impact resistance, indicating preference of 3DP over 3DOW structures in high-performance end use applications that are potentially subjected to impact force. The effect of fiber orientations was highly significant on both tensile and impact properties investigated: The highest tensile properties were exhibited by the 0/0 composite followed by 0/90, 0/45/90/−45 and ±45, respectively. While in the case of Drop-weight impact properties, the 0/90 composite was the most impact resistant, followed by ±45, 0/45/90/−45 and 0/0, respectively. However, poor structural integrity due to insufficient matrix infusion impeded the conductance of successful pendulum impact tests (Izod and Charpy), suggesting future research consideration.
Supplementary Materials
The following are available online at https://0-www-mdpi-com.brum.beds.ac.uk/article/10.3390/jcs5050136/s1, Figure S1: Fiber and plastic paths for different layers with different fiber orientations (availed from the slicer, Eiger of Izod impact specimen with 63.5 mm × 12.7 mm dimension); (a) 0° (b) 90° and (c) 45°, Figure S2: Fiber and plastic paths for different layers with different fiber orientations (availed from the slicer, Eiger of tensile sample with 152.4 mm × 35.6 mm dimension); (a) 0° (b) 90° and (c) 45°, Figure S3: Void (red marked) between wall and infill rasters. This porosity is generated when the infill rasters do not completely cover the whole area (as raster density is fixed) or using 1 wall layer (as Eiger slicer recommends using two wall layers to obtain watertight surface finish), Figure S4: Internal structure of composite filament; (a) cross-section showing dark background, white dots, and air pocket representing matrix (Nylon 6), fiberglass filament and void, respectively; (b) 3D longitudinal view of fiber in the composite filament exhibiting fibers are pretty straight. Additionally, the X-ray tomography analysis measured fiber content of approximately 33% (with approximately 10 µm diameter of individual filament), which are in agreement with the authors’ previous finding in [3]. Here, the authors followed the fiber content value obtained by thermal analysis (approximately 38%), Table S1: Tensile properties of 3DOW (sample 28 from Midani et al. [28])) and 3DP (sample 0/0) composites, Table S2: Comparison of tensile and impact properties between authors present and previous research [16].
Author Contributions
S.M.F.K. performed the properties evaluations, data curation and writing the manuscript. K.M. supervised the work, edited and revised the writing. A.-F.M.S. conceptualized the research, supervised the work, edited and revised the writing. All authors have read and agreed to the published version of the manuscript.
Funding
The authors received no funding for the research.
Institutional Review Board Statement
Not applicable.
Informed Consent Statement
Not applicable.
Data Availability Statement
Not applicable.
Conflicts of Interest
The authors declare no conflict of interest.
References
- Kabir, S.M.F.; Mathur, K.; Seyam, A.M. A critical review on 3D printed continuous fiber-reinforced composites: History, mechanism, materials and properties. Compos. Struct. 2020, 232, 111476. [Google Scholar] [CrossRef]
- Chakraborty, S.; Biswas, M.C. 3D printing technology of polymer-fiber composites in textile and fashion industry: A potential roadmap of concept to consumer. Compos. Struct. 2020, 248, 112562. [Google Scholar] [CrossRef]
- Kabir, S.M.F.; Mathur, K.; Seyam, A.M. The Road to Improved Fiber-Reinforced 3D Printing Technology. Technologies 2020, 8, 51. [Google Scholar] [CrossRef]
- Dickson, A.N.; Barry, J.N.; McDonnell, K.A.; Dowling, D.P. Fabrication of continuous carbon, glass and Kevlar fibre reinforced polymer composites using additive manufacturing. Addit. Manuf. 2017, 16, 146–152. [Google Scholar] [CrossRef]
- Hetrick, D.R.; Sanei, S.H.R.; Bakis, C.E.; Ashour, O. Evaluating the effect of variable fiber content on mechanical properties of additively manufactured continuous carbon fiber composites. J. Reinf. Plast. Compos. 2020. [Google Scholar] [CrossRef]
- Chabaud, G.; Castro, M.; Denoual, C.; Le Duigou, A. Hygromechanical properties of 3D printed continuous carbon and glass fibre reinforced polyamide composite for outdoor structural applications. Addit. Manuf. 2019, 26, 12. [Google Scholar] [CrossRef]
- Bodaghi, M.; Cristóvão, C.; Gomes, R.; Correia, N. Experimental characterization of voids in high fibre volume fraction composites processed by high injection pressure RTM. Compos. Part A Appl. Sci. Manuf. 2016, 82, 88–99. [Google Scholar] [CrossRef]
- Kuchipudi, S.C. The Effects of Fiber Orientation and Volume Fraction of fiBer on Mechanical Properties of Additively Manufactured Composite Material. Master’s Thesis, Minnesota State University, Mankato Mankato, MN, USA, 2017. [Google Scholar]
- Matsuzaki, R.; Ueda, M.; Namiki, M.; Jeong, T.-K.; Asahara, H.; Horiguchi, K.; Nakamura, T.; Todoroki, A.; Hirano, Y. Three-dimensional printing of continuous-fiber composites by in-nozzle impregnation. Sci. Rep. 2016, 6, 23058. [Google Scholar] [CrossRef]
- Al Abadi, H.; Thai, H.-T.; Paton-Cole, V.; Patel, V. Elastic properties of 3D printed fibre-reinforced structures. Compos. Struct. 2018, 193, 8–18. [Google Scholar] [CrossRef]
- Araya-Calvo, M.; López-Gómez, I.; Chamberlain-Simon, N.; León-Salazar, J.L.; Guillén-Girón, T.; Corrales-Cordero, J.S.; Sánchez-Brenes, O. Evaluation of compressive and flexural properties of continuous fiber fabrication additive manufacturing technology. Addit. Manuf. 2018, 22, 157–164. [Google Scholar] [CrossRef]
- Caminero, M.; Chacón, J.; García-Moreno, I.; Reverte, J. Interlaminar bonding performance of 3D printed continuous fibre reinforced thermoplastic composites using fused deposition modelling. Polym. Test. 2018, 68, 415–423. [Google Scholar] [CrossRef]
- Caminero, M.; Chacón, J.; García-Moreno, I.; Rodríguez, G. Impact damage resistance of 3D printed continuous fibre reinforced thermoplastic composites using fused deposition modelling. Compos. Part B Eng. 2018, 148, 93–103. [Google Scholar] [CrossRef]
- Zhuo, P.; Li, S.; Ashcroft, I.; Jones, A.; Pu, J. 3D printing of continuous fibre reinforced thermoplastic composites. In Proceedings of the 21st International Conference on Composite Materials, ICCM21 ID. Xi’an, China, 20–25 August 2017; Volume 4265, pp. 20–25. [Google Scholar]
- Ruiz-Herrero, J.; Rodriguez-Perez, M.; De Saja, J. Design and construction of an instrumented falling weight impact tester to characterise polymer-based foams. Polym. Test. 2005, 24, 641–647. [Google Scholar] [CrossRef]
- Kabir, S.M.F.; Mathur, K.; Seyam, A.M. Impact resistance and failure mechanism of 3D printed continuous fiber-reinforced cellular composites. J. Text. Inst. 2020, 112, 752–766. [Google Scholar] [CrossRef]
- Mathur, K.; Kabir, S.M.F.; Seyam, A.M. Tensile properties of 3D printed continuous fiberglass reinforced cellular composites. J. Text. Inst. 2020, 1–10. [Google Scholar] [CrossRef]
- Du Plessis, A.; Yadroitsev, I.; Yadroitsava, I.; Le Roux, S.G. X-ray microcomputed tomography in additive manufacturing: A review of the current technology and applications. 3D Print. Addit. Manuf. 2018, 5, 227–247. [Google Scholar] [CrossRef] [Green Version]
- Goh, G.D.; Dikshit, V.; Nagalingam, A.P.; Goh, G.L.; Agarwala, S.; Sing, S.L.; Wei, J.; Yeong, W.Y. Characterization of mechanical properties and fracture mode of additively manufactured carbon fiber and glass fiber reinforced thermoplastics. Mater. Des. 2018, 137, 79–89. [Google Scholar] [CrossRef]
- Sanei, S.H.R.; Popescu, D. 3D-printed carbon fiber reinforced polymer composites: A systematic review. J. Compos. Sci. 2020, 4, 98. [Google Scholar] [CrossRef]
- Blok, L.G.; Longana, M.L.; Yu, H.; Woods, B.K. An investigation into 3D printing of fibre reinforced thermoplastic composites. Addit. Manuf. 2018, 22, 176–186. [Google Scholar] [CrossRef]
- Papon, E.A.; Haque, A.; Spear, S.K. Effects of Fiber Surface Treatment and Nozzle Geometry in Structural Properties of Additively Manufactured Two-Phase Composite; AIAA Scitech 2019 Forum: San Diego, CA, USA, 2019; p. 0407. [Google Scholar]
- Brenken, B.; Barocio, E.; Favaloro, A.; Kunc, V.; Pipes, R.B. Fused filament fabrication of fiber-reinforced polymers: A review. Addit. Manuf. 2018, 21, 1–16. [Google Scholar] [CrossRef]
- Goh, G.D.; Yap, Y.L.; Agarwala, S.; Yeong, W.Y. Recent progress in additive manufacturing of fiber reinforced polymer composite. Adv. Mater. Technol. 2019, 4, 1800271. [Google Scholar] [CrossRef] [Green Version]
- Oztan, C.; Karkkainen, R.; Fittipaldi, M.; Nygren, G.; Roberson, L.; Lane, M.; Celik, E. Microstructure and mechanical properties of three dimensional-printed continuous fiber composites. J. Compos. Mater. 2019, 53, 271–280. [Google Scholar] [CrossRef]
- Pyl, L.; Kalteremidou, K.-A.; Van Hemelrijck, D. Exploration of the design freedom of 3D printed continuous fibre-reinforced polymers in open-hole tensile strength tests. Compos. Sci. Technol. 2019, 171, 135–151. [Google Scholar] [CrossRef]
- Todoroki, A.; Oasada, T.; Mizutani, Y.; Suzuki, Y.; Ueda, M.; Matsuzaki, R.; Hirano, Y. Tensile property evaluations of 3D printed continuous carbon fiber reinforced thermoplastic composites. Adv. Compos. Mater. 2020, 29, 147–162. [Google Scholar] [CrossRef]
- Midani, M.; Seyam, A.M.; Saleh, M.N.; Pankow, M. The effect of the through-thickness yarn component on the in-and out-of-plane properties of composites from 3D orthogonal woven preforms. J. Text. Inst. 2019, 110, 317–327. [Google Scholar] [CrossRef]
- Dong, C. Effects of process-induced voids on the properties of fibre reinforced composites. J. Mater. Sci. Technol. 2016, 32, 597–604. [Google Scholar] [CrossRef] [Green Version]
- Mehdikhani, M.; Gorbatikh, L.; Verpoest, I.; Lomov, S.V. Voids in fiber-reinforced polymer composites: A review on their formation, characteristics, and effects on mechanical performance. J. Compos. Mater. 2019, 53, 1579–1669. [Google Scholar] [CrossRef]
- Torabizadeh, M.A. Tensile, Compressive and shear properties of unidirectional glass/epoxy composites subjected to mechanical loading and low temperature services. Indian J. Eng. Mater. Sci. 2013, 20, 299–309. [Google Scholar]
- Justo, J.; Távara, L.; García-Guzmán, L.; París, F. Characterization of 3D printed long fibre reinforced composites. Compos. Struct. 2018, 185, 537–548. [Google Scholar] [CrossRef]
- Ahmad, F.; Hong, J.-W.; Choi, H.S.; Park, S.-J.; Park, M.K. The effects of stacking sequence on the penetration-resistant behaviors of T800 carbon fiber composite plates under low-velocity impact loading. Carbon Lett. 2015, 16, 107–115. [Google Scholar] [CrossRef] [Green Version]
- Midani, M.; Seyam, A.M.; Pankow, M. The effect of the structural parameters of 3D orthogonal woven composites on their impact responses under different modes of impact. Key Eng. Mater. 2018, 786, 215–223. [Google Scholar] [CrossRef]
- Sharma, A.P.; Khan, S.H.; Velmurugan, R. Effect of through thickness separation of fiber orientation on low velocity impact response of thin composite laminates. Heliyon 2019, 5, e02706. [Google Scholar] [CrossRef] [PubMed] [Green Version]
- Wu, K.; Zheng, Z.; Zhang, S.; He, L.; Yao, H.; Gong, X.; Ni, Y. Interfacial strength-controlled energy dissipation mechanism and optimization in impact-resistant nacreous structure. Mater. Des. 2019, 163, 107532. [Google Scholar] [CrossRef]
- Standard Test Method for Unnotched Cantilever Beam Impact Resistance of Plastics; ASTM: West Conshohocken, PA, USA, 2014; Volume 8.
- Standard Test Methods for Determining the Charpy Impact Resistance of Notched Specimens of Plastics; ASTM: West Conshohocken, PA, USA, 2014; Volume 8.
- Hetrick, D.R.; Sanei, S.H.R.; Ashour, O.; Bakis, C.E. Charpy impact energy absorption of 3D printed continuous Kevlar reinforced composites. J. Compos. Mater. 2021. [Google Scholar] [CrossRef]
Figure 1.
Experimental design.

Figure 2.
Different X-ray tomography images of an Izod 0/90 specimen showing the internal structure including fiber, polymer and void shape and distribution. The cross-sectional (a) and longitudinal (b) views present the stacking of layers, (c,d) exhibiting slices of 0° and 90° orientated layers, finally (e) is 3D image of the composite.


Figure 3.
Tensile properties of the printed composites: (a) Tensile strength and (b) load–strain curves.
Figure 3.
Tensile properties of the printed composites: (a) Tensile strength and (b) load–strain curves.

Figure 4.
Fractography of tensile samples: (a) Failure of a 0/0 specimen, (b) breaking of fiber as bundle and fiber bundle pullout, (c) magnified cross-sectional view of the fractured specimen, (d) failure of a ±45 specimen, (e) interlayer delamination of a ±45 specimen, (f) magnified cross-sectional view of the fractured ±45 specimen, (g) fiber filament pullout of a 0/90 specimen, and (h) fiber filament pullout and interlayer delamination of a 0/45/90/−45 composite specimen.

Figure 5.
Drop-weight impact properties of the printed composites; (a) Tub impact peak force, (b) total Tub impact energy, and (c) impact load–displacement curves.
Figure 5.
Drop-weight impact properties of the printed composites; (a) Tub impact peak force, (b) total Tub impact energy, and (c) impact load–displacement curves.

Figure 6.
Fractography of Drop-weight impacted samples; top (a,d,g,j), bottom (b,e,h,k), and side (c,f,i,l) views of unidirectional, cross-lay, angle-lay and quasi-isotropic composites.
Figure 6.
Fractography of Drop-weight impacted samples; top (a,d,g,j), bottom (b,e,h,k), and side (c,f,i,l) views of unidirectional, cross-lay, angle-lay and quasi-isotropic composites.


Figure 7.
Pendulum impact properties of the printed composites: (a) Izod impact energy and (b) Charpy impact energy.
Figure 7.
Pendulum impact properties of the printed composites: (a) Izod impact energy and (b) Charpy impact energy.

Figure 8.
Fractography of pendulum-impacted samples: (a) Hinge break of a 0/45/90/−45 specimen; (b–d) non-break of a Izod 0/0 specimen’s top and side views, and (e–g) non-break of a Charpy 0/45/90/−45 specimen’s top and side views.
Figure 8.
Fractography of pendulum-impacted samples: (a) Hinge break of a 0/45/90/−45 specimen; (b–d) non-break of a Izod 0/0 specimen’s top and side views, and (e–g) non-break of a Charpy 0/45/90/−45 specimen’s top and side views.


Table 1.
Weight and fiber volume fraction of the composites.
| Test (Specimen Size): Test Standard | Fiber Orientation | Volume of Fiber Filament, cm3 | Volume of Polymer Filament, cm3 | Fiber Volume Fraction of Composite (Vfraction) from Equation (1) | Estimated Weight (by Eiger), g | Measured Weight * (std. dev.), g |
|---|---|---|---|---|---|---|
| Tensile (152.4 × 35.6 mm): ASTM D3039 | 0/0 | 13.47 | 2.95 | 31.45 | 24.80 | 22.99 (0.46) |
| 0/90 | 13.52 | 2.65 | 31.56 | 24.58 | 22.61 (0.04) | |
| ±45 | 13.57 | 2.42 | 31.68 | 24.38 | 21.97 (0.08) | |
| 0/45/90/−45 | 13.54 | 2.54 | 31.61 | 24.47 | 21.89 (0.05) | |
| Drop-weight impact (60 × 60 mm): ASTM D3763 | 0/0 | 9.12 | 1.48 | 32.09 | 16.23 | 14.82 (0.25) |
| 0/90 | 9.12 | 1.48 | 32.09 | 16.23 | 14.52 (0.03) | |
| ±45 | 9.04 | 1.67 | 31.81 | 16.30 | 14.84 (0.04) | |
| 0/45/90/−45 | 9.08 | 1.58 | 31.95 | 16.27 | 14.73 (0.13) | |
| Izod (63.5 × 12.7 mm): ASTM D4812-19 | 0/0 | 2.01 | 0.60 | 31.57 | 3.88 | 3.37 (0.03) |
| 0/90 | 1.92 | 0.62 | 30.16 | 3.76 | 3.32 (0.01) | |
| ±45 | 1.83 | 0.75 | 28.74 | 3.75 | 3.28 (0.01) | |
| 0/45/90/−45 | 1.87 | 0.69 | 29.37 | 3.75 | 3.24 (0.05) | |
| Charpy (127 × 12.7 mm): ASTM D6110 | 0/0 | 3.95 | 0.94 | 31.02 | 7.35 | 6.48 (0.01) |
| 0/90 | 3.76 | 1.01 | 29.53 | 7.12 | 6.24 (0.05) | |
| ±45 | 3.60 | 1.20 | 28.27 | 7.08 | 6.17 (0.02) | |
| 0/45/90/−45 | 3.68 | 1.11 | 28.90 | 7.10 | 6.22 (0.02) |
Table 2.
Comparison of maximum tensile strength of different fiberglass-reinforced composites fabricated by 3D printing and traditional technology.
Table 2.
Comparison of maximum tensile strength of different fiberglass-reinforced composites fabricated by 3D printing and traditional technology.
| Fabrication Technology | Fiber/Matrix | Design Criteria (Composite Thickness, Number of Reinforcing Layers, FVF and Others) | Tensile Strength, MPa | References |
|---|---|---|---|---|
| VARTM * | E-glass/epoxy resin from 3DOW prepreg | 2.89 mm, 3 Y-yarn layers, 22.5% Others: 5 kg/m2 areal weight, 5.48 pick density | 382 | [28] |
| Hand lay-up | Glass/epoxy resin | 2 mm, 55% Other: Unidirectional | 700 | [31] |
| 3D printing (FDM) | Fiberglass/nylon from Markforged Inc. | 2.5 mm, 23, 35% Other: Unidirectional, isotropic orientation | 450 | [19] |
| 1 mm, not mentioned, 50% Other: Unidirectional, isotropic orientation | 574 | [32] | ||
| 2 mm, 18, 30% Other: Unidirectional, isotropic orientation | 384 | [6] | ||
| 3 mm, 28, 31.5% Other: Unidirectional, isotropic, orientation, 4.25 kg/m2 areal weight | 391.5 | Data obtained for this paper |
VARTM *: Vacuum assited resin transfer molding technology.
Table 3.
Tub impact properties of 3D orthogonal woven (sample 28 from Midani et al. [29]) and 3DP (sample 0/90) composites.
Table 3.
Tub impact properties of 3D orthogonal woven (sample 28 from Midani et al. [29]) and 3DP (sample 0/90) composites.
| Attributes of Composites | Description | 3DOW | 3DP |
|---|---|---|---|
| Composite properties | Composite areal weight, kg/m2 | 5.00 | 4.03 |
| Fiber areal weight, kg/m2 | 3.42 | 2.07 | |
| FVF, % | 48.00 | 32.00 | |
| Composite thickness, mm | 2.89 | 3.00 | |
| Total Tub impact energy | Total Tub impact energy, J | 53.40 | 99.20 |
| Normalized total Tub impact energy | By composite areal weight, J/kg/m2 | 10.68 | 24.62 |
| By fiber content (areal weight), J/kg/m2 | 15.60 | 47.93 | |
| By fiber content (FVF), J/FVF | 1.11 | 3.10 | |
| By composite thickness, J/mm | 18.47 | 33.07 |
Publisher’s Note: MDPI stays neutral with regard to jurisdictional claims in published maps and institutional affiliations. |
© 2021 by the authors. Licensee MDPI, Basel, Switzerland. This article is an open access article distributed under the terms and conditions of the Creative Commons Attribution (CC BY) license (https://creativecommons.org/licenses/by/4.0/).
Share and Cite
MDPI and ACS Style
Kabir, S.M.F.; Mathur, K.; Seyam, A.-F.M. Maximizing the Performance of 3D Printed Fiber-Reinforced Composites. J. Compos. Sci. 2021, 5, 136. https://0-doi-org.brum.beds.ac.uk/10.3390/jcs5050136
AMA Style
Kabir SMF, Mathur K, Seyam A-FM. Maximizing the Performance of 3D Printed Fiber-Reinforced Composites. Journal of Composites Science. 2021; 5(5):136. https://0-doi-org.brum.beds.ac.uk/10.3390/jcs5050136
Chicago/Turabian StyleKabir, S M Fijul, Kavita Mathur, and Abdel-Fattah M. Seyam. 2021. "Maximizing the Performance of 3D Printed Fiber-Reinforced Composites" Journal of Composites Science 5, no. 5: 136. https://0-doi-org.brum.beds.ac.uk/10.3390/jcs5050136