
Cellulose Nanocomposites of Cellulose Nanofibers and Molecular Coils
by
 and
and
Doug Henderson
1, 
Xin Zhang
1,
Yimin Mao
1,2,
Liangbing Hu
1,
Robert M. Briber
1,* and
Howard Wang
1,3,* 1
Department of Materials Science and Engineering, University of Maryland, College Park, MD 20742, USA
2
NIST Center for Neutron Research, National Institute of Standards and Technology, Gaithersburg, MD 20899, USA
3
Neutron Science Platform, Songshan Lake Materials Laboratory, Dongguan 523808, China
*
Authors to whom correspondence should be addressed.
J. Compos. Sci. 2021, 5(8), 200; https://0-doi-org.brum.beds.ac.uk/10.3390/jcs5080200
Submission received: 15 July 2021
/
Revised: 26 July 2021
/
Accepted: 27 July 2021
/
Published: 30 July 2021
(This article belongs to the Special Issue Sustainable Biocomposites)
Abstract
:All-cellulose nanocomposites have been produced from cellulose nanofiber (CNF) suspensions and molecular coil solutions. Morphology and small-angle neutron scattering studies show the exfoliation and dispersion of CNFs in aqueous suspensions. Cellulose solutions in mixtures of ionic liquid and organic solvents were homogeneously mixed with CNF suspensions and subsequently dried to yield cellulose composites comprising CNF and amorphous cellulose over the entire composition range. Tensile tests show that stiffness and strength quantities of cellulose nanocomposites are the highest value at ca. 20% amorphous cellulose, while their fracture strain and toughness are the lowest. The inclusion of amorphous cellulose in cellulose nanocomposites alters their water uptake capacity, as measured in the ratio of the absorbed water to the cellulose mass, reducing from 37 for the neat CNF to less than 1 for a composite containing 35% or more amorphous cellulose. This study offers new insights into the design and production of all-cellulose nanocomposites.
1. Introduction
Cellulose is the most abundant renewable organic material, and cellulose fibers show promise in reinforcing polymer composites to develop intermediate technologies toward a balanced target of the performance in mechanical and chemical properties, and the sustainability in renewability and carbon footprints [1,2,3,4,5]. The challenges of interfacial compatibility between natural and synthetic polymers have persisted, limiting the development of hybrid materials. All-cellulose composite (ACC), composed only of different forms of neat cellulose, is an interesting subject of research as it provides better understanding of the limitations and opportunities of biomass technologies for a sustainable future, as well as potential solutions for hybrid composite technologies as an intermediate step [6,7,8,9,10].
Two common methods of producing ACCs are infiltrating a cellulose solution in pre-aligned cellulose fibers [9,10,11], and in situ dissolution of cellulose fibrils to partially amorphized cellulose for binding remainder fibers [12,13,14]. Other routes for production of cellulose composites have been experimented through either incorporating fibers to cellulose solutions or partially dissolving fibers using solvents including N-methyl morpholine N-oxide (NMMO) [15], ionic liquids [16,17,18], N,N-dimethyl acetamide (DMAc) and LiCl [13,19,20,21], or others [22,23], followed by coagulation to regenerate cellulose II, resulting in cellulose composites containing a myriad of structures resulting in interlinked bulk and interfacial properties [12,23,24,25,26].
Evaluation of the composition dependence of the process–structure–property relationship is a common practice in materials research. However, typical processes for producing cellulose composites are often transient and kinetically controlled, therefore exact quantities of each component are not easily accounted for, causing difficulties in studying cellulose composites. Furthermore, investigating a wide range of compositions, ideally covering the entire range from 0 to 100% of key components, is an even bigger challenge and is often limited by the method of preparation. This study presents the production and characterization of nanocomposites composed of two model cellulose components, cellulose nanofibers (CNFs) and amorphous cellulose (AC), over the entire composition range.
Aqueous suspensions of CNFs have been prepared using the (2,2,6,6-Tetramethylpiperidin-1-yl)oxyl (TEMPO) mediated oxidation process, initially developed by Isogai and coworkers [27,28]. Understanding of the TEMPO-oxidation process is extended in this study through measuring the morphological evolution of large-scale cellulose fibers, or macrofibers, using a combination of microscopy and scattering techniques. Solutions of cellulose have been prepared by dissolving microcrystalline cellulose in mixtures of ionic liquids (IL) and organic solvents [29,30,31]. Our previous studies have revealed the structure and dynamics in cellulose solution using neutron scattering methods [30], and demonstrated the direct use of cellulose molecules for producing amorphous cellulose films with unique structures and properties [31]. Using compatible suspensions of CNFs and cellulose coils, arbitrary compositional ratios of the two components are easily realized in solution, resulting in cellulose composites covering the entire composition range upon the removal of solvent molecules. Morphology, mechanical properties, and water uptake behaviors of the cellulose composites have been systematically assessed.
2. Materials and Methods
2.1. Materials
For TEMPO-mediated oxidation, TEMPO, NaBr, NaClO, and NaOH were purchased from Sigma Aldrich. Durapore PVDF membrane filters with a pore size of ca. 0.65 μm from EMD Millipore were used in Buchner filtration. For cellulose solutions, Avicel microcrystalline cellulose (MCC), a purified cellulose powder with an average of ca. 250 anhydroglucose units per cellulose chain, and 1-ethyl-3-methylamidazolium acetate at 95% purity (EMIMAc) were also purchased from Sigma Aldrich. Deuterated water (D2O) and dimethylsulfoxide-d6 (dDMSO) were purchased from Cambridge Isotopes. All other solvents used, namely DMSO (hydrogenated), ethanol, and acetone, were reagent grade. MCC and EMIMAc were stored in a dry glove box, and DMSO was stored using molecular sieves to prevent water absorption.
2.2. TEMPO-Mediated Oxidation
Wood pulps of southern yellow pines with a moisture content of 85.5%, as measured by oven drying, went through TEMPO/NaBr/NaClO-mediated oxidation to produce CNF, based on previously reported protocols [32,33,34,35]. Initially, 35 g moist cellulose pulp (~5 g dry) was mixed into DI water at 1% cellulose by mass, then TEMPO and NaBr were added and dissolved at concentrations of 0.1 and 1 mM per gram of cellulose, respectively. The reaction started upon the addition of 35 mL of NaClO solution (at 10–15% available chlorine), dropwise, into the solution. The pH of the solution was monitored with a pH meter and was initially raised to 10.5 with a 3 M solution of NaOH, then maintained at 10.5 through the remainder of the reaction. The reaction lasted for 120 min, and the products were collected for preparing CNFs.
Cellulose macrofibers in the oxidation process were sampled by taking aliquots of 10 mL reaction solution 5, 15, 30, 60 and 120 min after the onset of the reaction, respectively, and immediately mixing with 100 mL DI water to quench the reaction. Solid precipitates were collected using a Buchner funnel and washed with DI water three times to remove residual reactants. The collected cellulose was weighed to estimate remaining water content, then diluted to 1% mass of cellulose and stirred until fully redispersed. Cellulose concentration was verified through oven drying.
2.3. Optical Microscopy (OM) of Oxidized Macrofibers
Optical micrographs of cellulose macrofiber suspensions in water confined between a glass slide and cover slip were obtained using an Olympus Accura Zoom XB70 microscope with both bright and cross-polarized light illuminations. Macrofiber widths were measured from micrographs and the histograms were fit to a log-normal distribution function to yield the average and dispersity of the transverse dimension of cellulose macrofibers.
2.4. Small-Angle Neutron Scattering (SANS) on Pulp Suspensions
For the SANS study, macrofibers were redispersed at 1% by mass in D2O. SANS measurements were conducted on the NGB 30 m SANS instrument at the NIST Center for Neutron Research (NCNR) [36]. SANS spectra were collected at three sample-to-detector distances (SDDs), namely, 1 m, 4 m, and 13 m, respectively, with a neutron wavelength of 6 Å, to cover a Q-range from 0.003 Å−1 to 0.5 Å−1, where the amplitude of the momentum transfer vector is defined as , with being half of the scattering angle. The wavelength spread was = 0.148. A focusing lens was added at SDD = 13 m and the wavelength was set at 8.4 Å to extend the low-Q limit to 0.001 Å−1. Data were reduced using NCNR Igor Macros for SANS measurements [37] and evaluated through fitting with an empirical model.
2.5. Production and Characterization of Cellulose Nanofibers
CNFs were produced from the 120 min TEMPO-oxidized macrofiber suspension using a NanoDeBEE microfluidizer from BEE International. TEMPO-oxidized cellulose pulps in 1 wt% aqueous suspension were loaded to the microfluidizer and passed through the high shear zone 1 to 4 times at a pressure of 30 kpsi. Suspensions of four CNF samples were diluted with water by ten thousand times, and a drop of the suspension fluid was placed on a freshly cleaved mica substrate and allowed to dry at ambient conditions. Atomic force microscopy (AFM) micrographs were obtained using a VEECO DI Nanoscope III multimode microscope with tapping mode. The transverse and length dimensions of CNF were obtained from AFM micrographs and organized into histograms, which were analyzed using log-normal distribution functions.
2.6. Preparation of Cellulose Solutions and Composites
Cellulose solutions are prepared by dissolving MCC powder in a mixed solvent of EMIMAc and DMSO. First, 4.80 g of MCC powder was suspended in 66.0 g DMSO with vigorous agitation using a Vortex stirrer, EMIMAc was then gradually added, followed by repeated vigorous stirring and heating in an oven at 90 °C for 5–10 min. The EMIMAc addition, heating and stirring process was repeated until the solution became transparent. The resulting compositions of cellulose, IL, and DMSO were 6.1, 10.6, and 83.3% by weight, respectively.
Aqueous suspensions of CNF underwent solvent exchange to replace water in the suspension with DMSO following the process previously reported [38]. An equal mass of DMSO was added to 800 g of 0.6 wt% CNF suspension. The mixture was rigorously stirred until homogeneous. Water was preferentially removed using a rotary evaporator operating at 60 °C. The exchange process was repeated 3 times to ensure water removal. A sample of the resulting CNF suspension in DMSO was oven-dried to confirm the final concentration of 0.6 wt% CNF. The suspension was stored in a desiccator before use to minimize the moisture uptake.
Cellulose composites were prepared by mixing molecular solutions and CNF suspensions in DMSO at various ratios to yield target compositions. Mixture suspensions were homogenized by ultra-sonication and mechanical stirring, and stored in a dish with Teflon walls and a flat glass base. DMSO in mixtures was mostly removed in a vacuum oven at 60 °C at a low vacuum of 2/3 bar, and removed more thoroughly at the full vacuum overnight, resulting in transparent gel films containing uniformly dispersed cellulose coils, CNFs and IL. IL in nanocomposite films was removed through acetone and ethanol soaking. Films were twice soaked in acetone for 1 day followed by vacuum drying for 2 h. Because of the small solubility of IL in acetone, the IL removal process was slow, ensuring gradual condensation of solutes to remain in an amorphous state before kinetic trapping kicks in. The process was repeated using ethanol and continued until IL in the specimen was reduced below the sensitivity limit by weighing. Films were carefully weighed after each soak/dry cycle; the process was terminated when the mass loss was not detectable.
2.7. Tensile Test
Tensile tests were conducted using a dynamic mechanical analyzer (DMA) Q800 from TA Instruments at room temperature. Nanocomposite films with thicknesses ca. 30 μm were cut into roughly 2–3 mm wide by 20 mm long strips using a razor blade. To prevent failure at the clamped section of the sample, the edge of a freshly sharpened hole punch was used to cut the sample into an “I” shape, so that the width in the middle was 1.5–2 mm. Film width was measured using calipers and film thickness using a micrometer. Before use, calibration for clamp mass, length, and compliance was run on the DMA, and a preload force of 0.1 N was applied at the start of each test to account for bending in the specimen. All measurements were carried out in the conventional tensile test mode, although a DMA was used here. Force-ramp tests were run at a rate of 1 N/min, with at least 3 independent measurements acquired for specimens at each composition. Mechanical properties were determined as the mean value, with the error being the standard deviation.
2.8. Scanning Electron Microscopy (SEM) on Fracture Surface Morphology
The fracture surface of selected specimens from the tensile test was examined using a Hitachi SU-70 FEG SEM. Specimens were coated with a thin carbon layer and measured at an acceleration voltage of 0.7 kV and a working distance of ca. 15 mm.
2.9. Water Uptake Test
Specimens prepared in disks of 1 cm diameter and ca. 30 μm thickness were immersed in water for various times and their weight was subsequently measured using a microbalance. Measurements continued until specimens disintegrated or stopped taking up water. It was found that composite containing <12% cellulose coils disintegrated, while those with higher amorphous content kept their integrity.
3. Results
3.1. Morphology of Oxidized Wood Pulp
Figure 1 shows the bright field (Figure 1a,b) and cross-polarized (Figure 1c,d) optical micrographs of cellulose fibers after 5 min (Figure 1a,c) and 120 min (Figure 1b,d) of TEMPO-assisted oxidation reaction, respectively. The width of fibers is relatively uniform for each fiber, while varying among different ones over a wide range from less than 10 μm to larger than 100 μm. These are called macrofibers in this article. Figure 1a,c shows the macrofibers after 5 min oxidation mostly with sharp outlines, whereas some apparently lose integrity. Figure 1b,d shows the macrofibers after 120 min having apparently thicker widths with blurred outlines. The cross-polarized micrographs show both straight and twisted fibril features, with structural features appearing smeared more in the images with longer oxidation times.
To quantify the structural evolution of macrofibers during TEMPO oxidation, widths of macrofibers were measured using ImageJ. A virtual grid was overlaid on a 1.4 mm × 1.8 mm micrograph, and the cross-section width of fibers in each square of the grid were recorded. To account for variations with reasonable statistics, at least 180 measurements were obtained for each sample. Typical results are shown in Figure 1e as histograms of counts vs. diameters for 5 min (red) and 120 min (blue) samples. The 5-min sample shows a narrower distribution centered about 30 μm, while the 120 min one shows a broader distribution centered about 80 μm.
The distributions were fit to a log-normal probability density function according to the Equation (1) [39,40,41,42],
where μ and σ are parameters relating to the position and width of the distribution function. The best fits are plotted as solid curves in Figure 1e along with the 5- and 120-min histograms. The mean diameter of a given log-normal distribution is given by Equation (2),
The standard deviation used to describe how broadly the distribution deviates from the mean is given by Equation (3) [40,41],
Figure 1f shows the variation of as a function of the oxidation time, where the error bars are the standard deviations . It is apparent that both the mean diameter and the width of distribution increase with the oxidation time. increases from 37 ± 5 μm at 5 min to 90 ± 13 μm at 120 min.
3.2. Evolution of Nanostructures in Pulp Oxidation
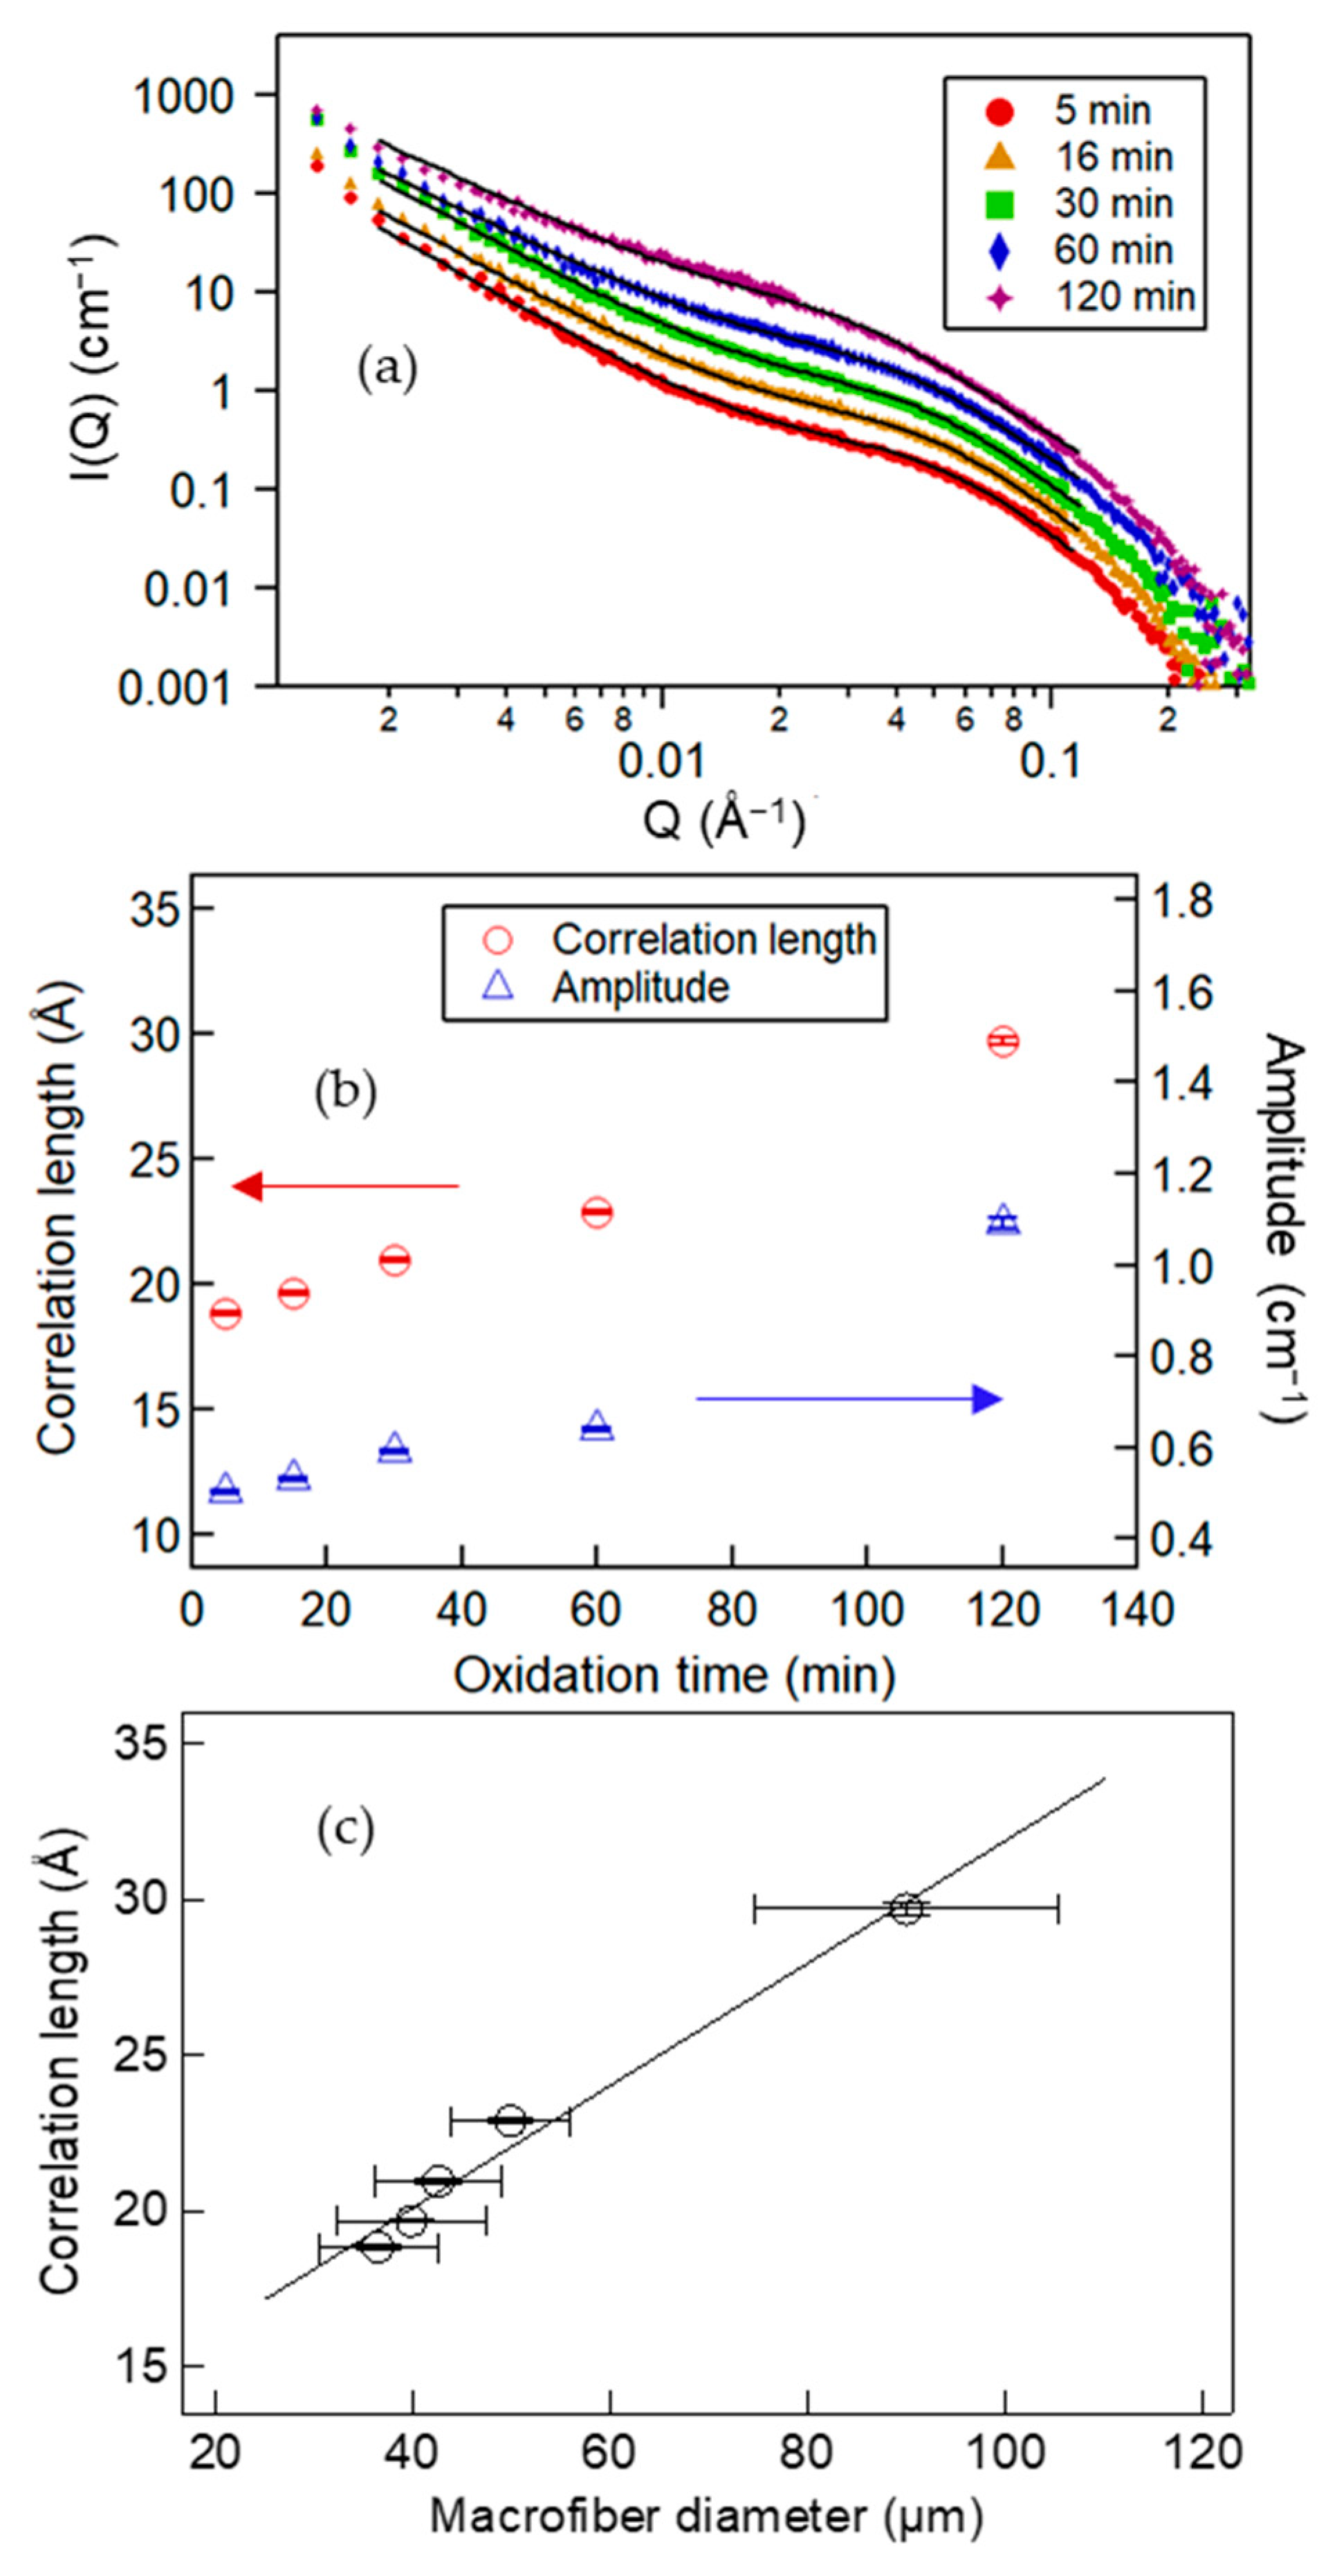
The SANS spectra of macrofibers after 5-, 16-, 30-, 60- and 120-min TEMPO-oxidation are shown in Figure 2a.
The SANS spectra appear to follow a power-law scaling with excess scattering at the mid-Q range from 0.01–0.1 Å−1. The shoulder of excess scattering broadens and shifts to the lower Q with the oxidation time. The spectra can be described using an empirical scattering model composing of generalized Porod and Lorentzian scattering functions as shown in Equation (4),
where A is the Porod scaling factor, n is the Porod exponent, L is the Lorentzian scaling factor, m is the Lorentzian exponent, ξ is the correlation length, and B is a constant for incoherent scattering and the background [43]. The best fits are shown as solid curves through the symbols in Figure 2a. Figure 2b show ξ and L as a function of the oxidation time. Both quantities increase with time. The increase in ξ from 19 Å at 5 min to 30 Å at 120 min corresponds to the shift in the shoulder to lower Q, whereas an increase in L implies more prominent intermediate scattering by nanostructures from the TEMPO oxidation. Figure 2c shows the correlation length as a function of the mean diameter of the macrofibers. The line through the symbols illustrates the apparently linear relationship between the two quantities, which will be discussed below.
3.3. Characteristics of Isolated Nanofibers
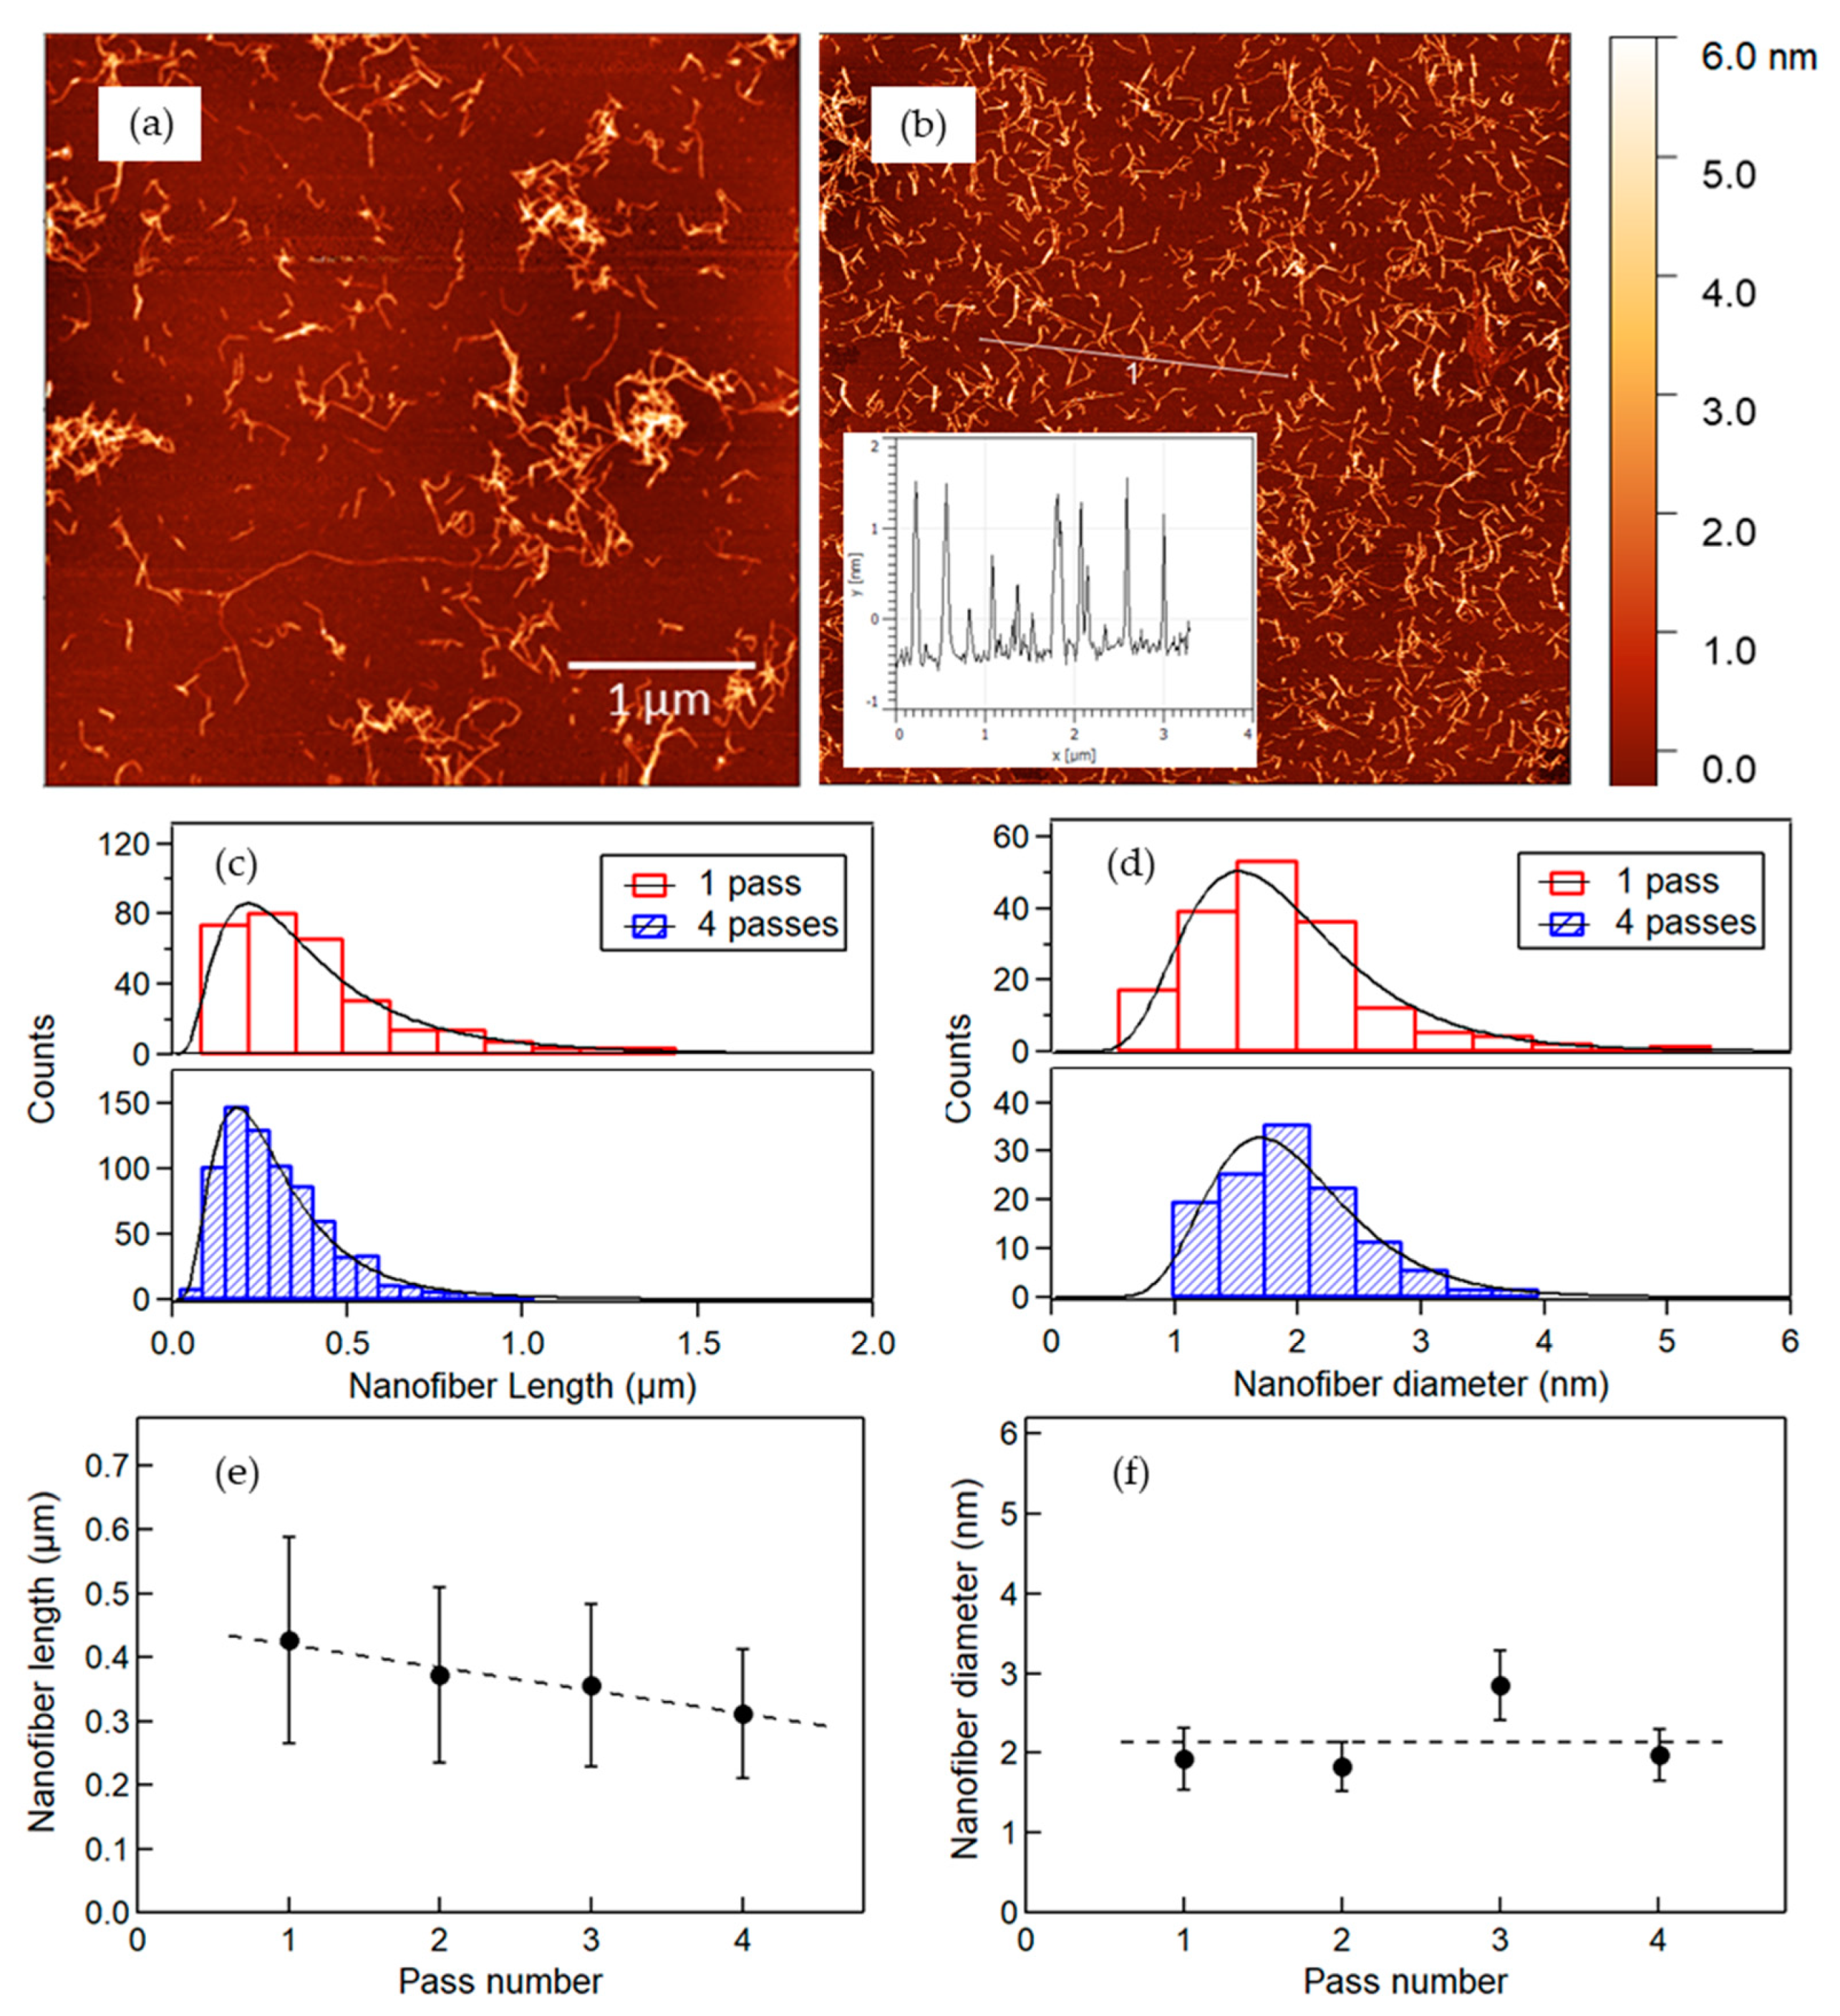
CNFs from homogenizing aqueous suspensions of macrofibers were characterized using AFM, and representative micrographs are shown in Figure 3a,b for those after 1 pass and 4 passes through the homogenizer, respectively. Micrographs show that both 1- and 4-pass samples contain dominantly curvy fibrils, while the former appears to have some longer fibers in both isolated individuals and loose aggregates, and the latter mostly in isolated and more uniform shorter fibers. Heights of CNFs in both specimens appear relatively constant, as evident from the line profile in Figure 3b. Variations of characteristic features are assessed by counting multiple fibers in AFM images.
Lengths of nanofibers were measured from the planar images and diameters from heights in line scans, with more than 300 measurements organized to each histogram as shown in Figure 3c,d, respectively. Histograms were fit to a log-normal distribution function, Equation (1), with the best fitting curves plotted in Figure 3c,d. The means and standard deviations of each quantity were calculated using Equations (2) and (3), respectively, and plotted as a function of the number of passes through the microfluidizer in Figure 3e,f, respectively. The data show that mean length of CNFs varies insignificantly from 430 ± 160 nm after 1 pass to 310 ± 100 nm after 4 passes. The diameters remain relatively constant of ca. 2 nm up to 4 passes in this study.
3.4. Mechanical Properties
The stress–strain, σ-ε, curves of selected specimens from the tensile test are shown in Figure 4a. All curves are characterized by the elastic/linear regime at small ε, measured by the slope as the Young’s modulus, E, deviation from the linearity at strains greater than the yield strength, σy, and the failure at the highest strain value, εmax. The 15% AC nanocomposite shows the highest E at the low strain and the highest stress before failure, while the neat amorphous cellulose has both the lowest E and the largest εmax. The other compositions are in between those extremes.
The quantities E, σy, and εmax obtained from each σ–ε curve are plotted in Figure 4b–d as a function of the amorphous content, C, respectively. E increases with C up to 12 GPa at ~20% AC, then decreases roughly linearly from 45 to 100% AC. The σy was determined at the point of the σ–ε curve with a 0.002 strain offset from the low-ε linear fitting line, as shown in Figure 4c. σy shows a weak maximum of ca. 110 MPa at ~20% AC. Average εmax decreases with the AC content and reaches a minimum at ~20%, then increases to ca. 0.08 for neat amorphous cellulose, as shown in Figure 4d. Toughness, UT, defined as the area under the σ–ε curve, shows a minimum at ~20% AC, as shown in Figure 4e.
3.5. Morphology of Fracture Surface
SEM micrographs of the fracture surfaces of the specimens after the tensile test can be seen in Figure 5. The horizontal direction is normal to the film specimen and the vertical direction is along the plane of the film. Figure 5 shows a neat CNF film (Figure 5a,b), a composite film with 15% AC (Figure 5c,d), and a neat amorphous cellulose film (Figure 5e,f), respectively. In Figure 5a, textures aligned along the plane are clearly visible. The higher-magnification micrograph in Figure 5b shows webs of connected fibrils, both coarse and fine, between the dominantly oriented ones. Figure 5c,d show similar features in the composite, except that those textures appear more uniform, free of coarse features. The fracture surface of the amorphous cellulose is noticeably different, with fibril textures forming a random network.
3.6. Water Uptake
Water uptake of cellulose composites was assessed by the ratio of the mass of absorbed water to that of cellulose,
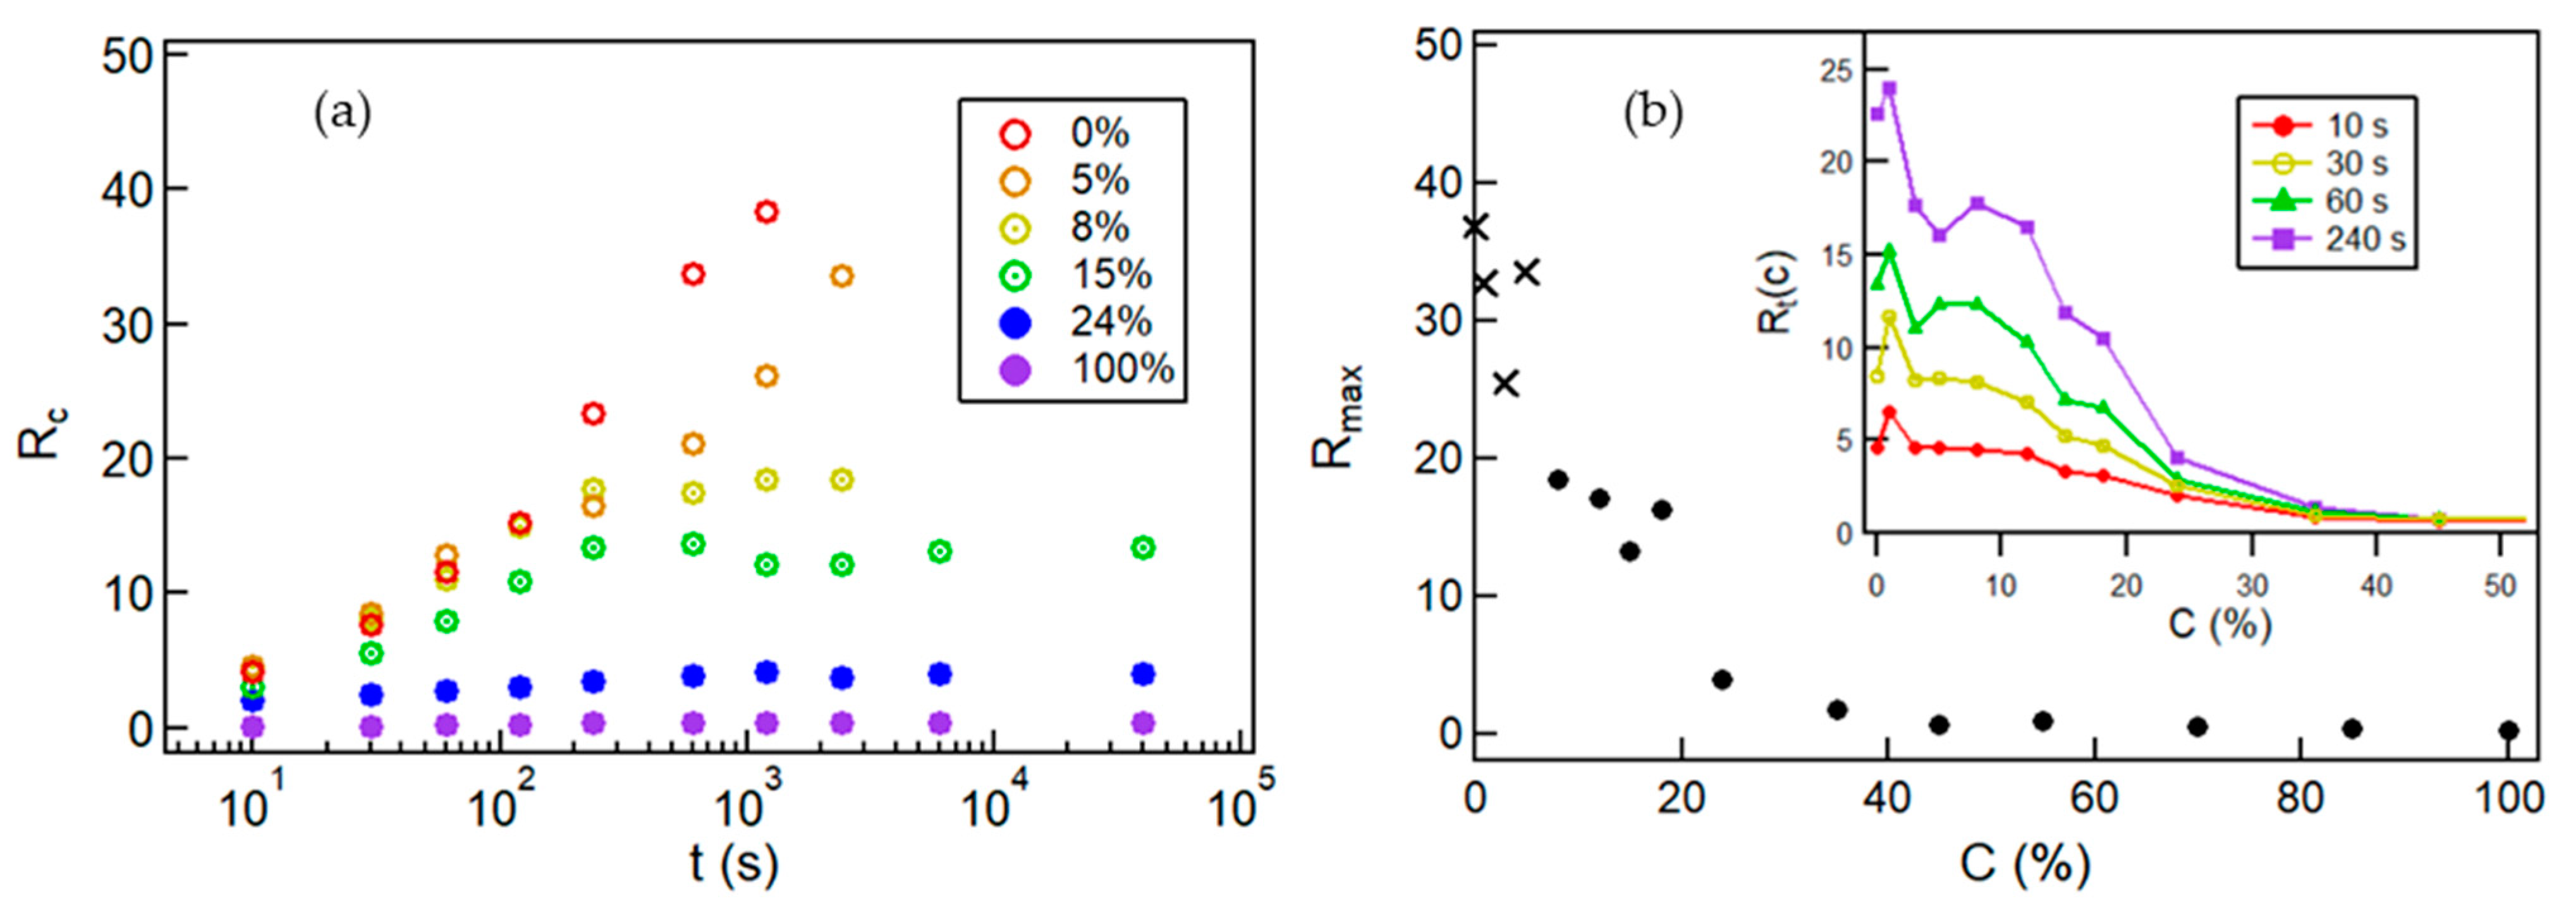
where m0 is the initial mass, and mw is the mass after soaking in water for time t. Figure 6a shows R at various compositions, denoted as Rc, as a function of time in semi-logarithm plot. Data show that both the rate and final amount of water uptake decrease with the amorphous composition. Films having 0–5% AC absorb water logarithmically and disintegrate after about 1000 s in water. At ca. 8% AC, R reaches a plateau at ~1000 s before the film disintegrates. Films containing 12% AC or greater do not disintegrate but instead stabilize at a finite amount of absorbed water. The neat amorphous cellulose film gains about 30% of its own weight after more than 11 h in water.
The maximum measured absorption ratio, Rmax, as a function of amorphous cellulose composition, is shown in Figure 6b. The cross symbol is used for low amorphous cellulose films that disintegrate to distinguish those stable films, shown as solid circles. Rmax decreases monotonically with the amorphous content, and films containing greater than 35% AC have an Rmax of less than 1. The inset in Figure 6b shows that R’s for specific soaking times generally decrease with the amorphous content. Unlike Rmax, which drops steeply at low C, for a short time R is relatively insensitive to the amorphous content, implying initial-geometry-limited transport behavior.
4. Discussion
4.1. Multi-Scale Evolution of Cellulose
The structure evolution of cellulose during TEMPO-assisted oxidation for producing CNFs has been illustrated by combining OM on cellulose macrofibers and SANS on elementary cellulose nanofibers. OM shows the swelling and disintegration of macrofibers with increasing reaction time, whereas SANS shows that the correlation length as a measure of the average interfiber distance increases with oxidation time. As a phenomenological model is often used to quantify characteristic length such as the average mesh size of a 3D network [44], here the variation of the correlation length is 2D in the cross-sectional plane of aligned fibers. As nanofibers separate and the interfiber spacing increases, so does the scattering intensity in the mid-Q regime, as characterized by the Lorentzian scale factor (Figure 2b), implying an increasing population of nanofibers due to oxidation.
TEMPO oxidation converts the C6 hydroxyl groups at the surface of nanofibers to sodium carboxylate, which readily ionize in aqueous solution to become negatively charged. Hydration of interfiber pockets separate fibers from each other, increasing the average interfiber distance as well as the diameter of macrofibers. The density of carboxylate groups increases with the oxidation time, resulting in a higher degree of hydration and larger interfiber distances and macrofiber diameters, until the remaining hydrogen bonds can no longer hold nanofibers together and the macrofibers disintegrate.
The swollen macrofibers, consisting of loosely bound nanofibers, could be readily disrupted by mechanical forces in high shear flow during homogenization. Apparently, such a feat can be achieved by a single pass, as diameters of resultant CNF remain constant with additional passes, while slightly reducing the length and narrowing the dispersity of fibers. For producing model all-cellulose nanocomposites in this study, CNFs of narrower distribution after 4 passes were used.
4.2. Mechanical and Fracture Surface Analysis
Neat CNF films have a modulus of 8.8 GPa, comparable to those in previous studies [27,28,45], which is mostly due to the extensive hydrogen bonding network among entangled nanofibers of high intrinsic stiffness [46].
Table 1 shows a list of regenerated cellulose from different solvent systems. Cellulose from an ionic liquid have high moduli and limited elongation [26], while those from alkali/urea dissolution show excellent elongation and high strength. [47,48], both having higher moduli than that of neat amorphous film in this study, at ca. 2.2 GPa. As rapidly regenerated cellulose films typically have high crystallinity (40% to 50%), composite films intentionally prepared with cellulose from coil solutions should remain in an amorphous state and possess properties similar to amorphous films in a previous study [31,49]. Indeed, the ductility increases at >20% AC, as shown in Figure 4d. On the other hand, nanocomposite with 15% AC has ~ 19% crystallinity carried from CNF, and has a higher modulus and strength than the regenerated semicrystalline ones [26,47], yet relatively low stretchability. Regenerated neat AC has negligibly low crystallinity, and the crystallinity of TEMPO-oxidized fibers is ca. 39%, with significant amorphization in CNFs occurring in the process of homogenization and composite preparation. Diffraction data show that the 15% AC composite contains comparable amounts of type I and II cellulose. It is assumed that the converted cellulose II shall have the CNF origin and possibly remain bound to CNFs. Detailed characteristics will be elucidated in future reports. By studying ACCs encompassing the entire range of the CNF/AC ratio, nanocomposites with a modulus of 2–12 GPa and strength of 55–110 MPa can be rationally designed and prepared, expanding the engineering space spanned by cellulose-plastic composites [50] and other ACCs [9,10].
SEM micrographs in Figure 5 offer insights into the mechanical behaviors of composite films. Since the bulk of composites consist of nanoscale fibrils and molecular coils, the microscale topological features, as revealed by SEM, reflect the nature of structural deformation at the fracture surface. Coarse features correspond to large deformations and a ductile failure, while smooth features imply local deformations and a brittle failure. Figure 5a,c show aligned structures from anisotropy of CNFs laying mostly parallel to the plane of films [4,51], while the apparently isotropic features in Figure 5e are a natural consequence of condensed random molecular coils. As individual entities in composites have sub-micron dimensions, morphological features of the fracture surface at large scales in Figure 5 reflect the nature of the fracture mechanics. A ductile failure involves deformation over a large distance, typically generating morphological features of a wide range of length scales and irregular features, while a brittle failure results in a relatively smooth and featureless fracture surface. Here, the neat amorphous cellulose can be stretched as much as 13% (Figure 4a) and has a large irregular fracture surface, while the 15% AC film breaks at ~1% elongation (Figure 4a) and shows rather uniform features of constituent fibers (Figure 5c). The neat CNF breaks at 3.5% and has feature dimensions of fracture morphology in-between.
Data show that, in general, high stiffness is mostly due to the presence of more rigid CNF, while the more flexible coil molecules help mediate interactions among fibers to afford a large deformation. The increase in stiffness and decrease in elongation in the 15% AC film compared to the neat CNF imply that the addition of small quantities of amorphous cellulose helps enhance interfibril interactions, presumably through hydrogen bonding, while isolated or aggregated short chains involve only in localized deformation, resulting in brittle failure, much like typical glass. Details of CNF/coil interactions will be the topic of future studies.
4.3. Mechanical Behavior
The method of composite preparation in this study allows for the discussion of mechanical behavior in the entire range of the constituent compositions. In ACCs prepared via partial dissolution of cellulose fibrils, the amount of dissolved cellulose in the composite could hardly be quantified [6,16,52,53,54,55]. On the other hand, ACCs fabricated by solution infiltration could have uncertainties in the uniformity of infiltrates in the composites, particularly when the dimension for infiltration becomes larger [8]. Inclusion of amorphous cellulose as a minority component in the CNF matrix increases modulus and strength with compromised stretchability, similar to findings, while synthetic polymers are used to fill in CNF mats [3,56]. However, instead of charge interactions, combinations of hydrogen-bonding and hydrophobic interactions are dominant factors in all-cellulose composites, due to the method of preparation that would render regenerated cellulose mostly in the amorphous state [31].
4.4. Water Uptake
Neat CNF films absorb water readily due to the surface charge upon ionization of sodium carboxylate. As water accumulates amongst CNFs, films swell with the amount of take-up water as much as ca. 37 times its starting mass, at the point that CNF network cannot hold together. As the content of amorphous cellulose increases, water uptake decreases drastically, implying the presence of amorphous cellulose altering interactions between CNF and water, and among CNFs. It is conceivable that collapsed cellulose coils fill in the voids among CNFs and occupy sites that would favor water adsorption; however, the uptake kinetics do not change much below 15% of amorphous cellulose. As shown in the inset in Figure 6b, low-C plateaus have persisted at the fixed time up to 240 s. Diffusion coefficients of water in composites, estimated using the short-time absorption data based on Fick’s first law, show relatively constant quantities at ca. 3 × 10⁻⁵ cm2/s for <15% coils, drop to ca. 1 × 10⁻⁶ cm2/s at 45% AC, and further down to 4 × 10⁻⁷ cm2/s in the neat amorphous cellulose. Apparently, regenerated amorphous cellulose with sufficiently high compositions can stabilize cellulose composites in water, as would be expected based on a previous study of amorphous cellulose films [31]. Further investigation is needed to understand the water-resistant behavior of amorphized cellulose. A good understanding in the behavior and control of ACCs could lead to potential applications that require stringent properties in biocompatibility, biodegradability, and environmental stability, such as in food supplements, drug packaging and delivery, medical implants, etc.
5. Summary
Various aspects of producing all cellulose nanocomposites of cellulose nanofibers and molecular coils have been examined. The process of TEMPO-assisted oxidation has been followed by morphological and small angle neutron scattering studies. Cellulose macrofibers swell upon oxidation and lose integrity at longer times, while the average distance between individual nanofibers increases roughly proportional to the average diameter of macrofibers, indicating uniform oxidation of elementary fibrils. Mechanical homogenization via high shear flow effectively tears apart macrofiber slurries to individual nanofibers with a relatively uniform thickness of ca. 2 nm. The length of CNF slightly becomes more uniform with the extent of flow homogenization. Cellulose solutions in mixtures of ionic liquid EMIMAc and organic solvent DMSO were homogeneously mixed with CNF suspensions and subsequently dried to yield all-cellulose nanocomposites. The structure and properties of composites comprising CNF and amorphous cellulose in the entire composition range have been measured. Tensile tests show that stiffness and strength quantities of nanocomposites reach the highest value at ca. 20% amorphous cellulose, while their fracture strain and toughness are the lowest. Filling CNF mats with a small amount of amorphous cellulose helps enhance interfibril interactions, presumably through hydrogen bonding. The inclusion of amorphous cellulose in cellulose nanocomposites also alters the kinetics and capacity of water uptake by composites. The apparent diffusion coefficients of water decrease by about two orders of magnitude from the neat CNF to the neat amorphous cellulose, while the maximum water uptake also varies over two orders of magnitude, due mostly to the presence of amorphous cellulose. Details of synergistic behaviors involving coiled cellulose remain to be elucidated in future studies.
Author Contributions
H.W. and R.M.B. conceived the idea and directed the project; L.H. provided technical input to the project; D.H., X.Z. and Y.M. carried out research; D.H. wrote the original draft; all contributed to editing to produce the final version of the manuscript. All authors have read and agreed to the published version of the manuscript.
Funding
This work was supported by the National Institute of Standards and Technology award number 70NANB15H261.
Acknowledgments
D.H. acknowledges Cesar Torres for his assistance in experiments and suggestions in data analysis. H.W. acknowledges the discussion with Yoshiharu Nishyama of the Univ. of Grenoble Alpes.
Conflicts of Interest
The authors declare no conflict of interest.
References
- Benítez, A.J.; Walther, A. Cellulose nanofibril nanopapers and bioinspired nanocomposites: A review to understand the mechanical property space. J. Mater. Chem. A 2017, 5, 16003–16024. [Google Scholar] [CrossRef]
- Sehaqui, H.; Zhou, Q.; Berglund, L.A. Nanostructured biocomposites of high toughness—A wood cellulose nanofiber network in ductile hydroxyethylcellulose matrix. Soft Matter 2011, 7, 7342–7350. [Google Scholar] [CrossRef]
- Kurihara, T.; Isogai, A. Properties of poly(acrylamide)/TEMPO-oxidized cellulose nanofibril composite films. Cellulose 2014, 21, 291–299. [Google Scholar] [CrossRef]
- Saito, T.; Uematsu, T.; Kimura, S.; Enomae, T.; Isogai, A. Self-aligned integration of native cellulose nanofibrils towards producing diverse bulk materials. Soft Matter 2011, 7, 8804–8809. [Google Scholar] [CrossRef]
- Mohanty, A.K.; Misra, M.; Drzal, L.T. Sustainable Bio-Composites from renewable resources: Opportunities and challenges in the green materials world. J. Polym. Environ. 2002, 10, 19–26. [Google Scholar] [CrossRef]
- Li, J.; Nawaz, H.; Wu, J.; Zhang, J.J.; Wan, J.; Mi, Q.; Yu, J.; Zhang, J.J. All-cellulose composites based on the self-reinforced effect. Compos. Commun. 2018, 9, 42–53. [Google Scholar] [CrossRef]
- Kalka, S.; Huber, T.; Steinberg, J.; Baronian, K.; Müssig, J.; Staiger, M.P. Biodegradability of all-cellulose composite laminates. Compos. Part A Appl. Sci. Manuf. 2014, 59, 37–44. [Google Scholar] [CrossRef]
- Nishino, T.; Matsuda, I.; Hirao, K. All-cellulose composite. Macromolecules 2004, 37, 7683–7687. [Google Scholar] [CrossRef]
- Huber, T.; Müssig, J.; Curnow, O.; Pang, S.; Bickerton, S.; Staiger, M.P. A critical review of all-cellulose composites. J. Mater. Sci. 2012, 47, 1171–1186. [Google Scholar] [CrossRef]
- Baghaei, B.; Skrifvars, M. All-Cellulose Composites: A Review of recent studies on structure, properties and applications. Molecules 2020, 25, 2836. [Google Scholar] [CrossRef]
- Qin, C.; Soykeabkaew, N.; Xiuyuan, N.; Peijs, T. The effect of fibre volume fraction and mercerization on the properties of all-cellulose composites. Carbohydr. Polym. 2008, 71, 458–467. [Google Scholar] [CrossRef]
- Han, D.; Yan, L. Preparation of all-cellulose composite by selective dissolving of cellulose surface in PEG/NaOH aqueous solution. Carbohydr. Polym. 2010, 79, 614–619. [Google Scholar] [CrossRef]
- Tanpichai, S.; Witayakran, S. All-cellulose composites from pineapple leaf microfibers: Structural, thermal, and mechanical properties. Polym. Compos. 2018, 39, 895–903. [Google Scholar] [CrossRef]
- Nishino, T.; Arimoto, N. All-cellulose composite prepared by selective dissolving of fiber surface. Biomacromolecules 2007, 8, 2712–2716. [Google Scholar] [CrossRef]
- Orelma, H.; Korpela, A.; Kunnari, V.; Harlin, A.; Suurnäkki, A. Improving the mechanical properties of CNF films by NMMO partial dissolution with hot calender activation. Cellulose 2017, 24, 1691–1704. [Google Scholar] [CrossRef]
- Zhang, J.J.; Zhang, J.J.; Luo, N.; Zhang, X.; Xu, L.; Wu, J.; Yu, J.; He, J. All-cellulose nanocomposites reinforced with in situ retained cellulose nanocrystals during selective dissolution of cellulose in an ionic liquid. ACS Sustain. Chem. Eng. 2016, 4, 4417–4423. [Google Scholar] [CrossRef]
- Chen, F.; Sawada, D.; Hummel, M.; Sixta, H.; Budtova, T. Unidirectional all-cellulose composites from flax via controlled impregnation with ionic liquid. Polymers 2020, 12, 1010. [Google Scholar] [CrossRef]
- Tang, X.; Liu, G.; Zhang, H.; Gao, X.; Li, M.; Zhang, S. Facile preparation of all-cellulose composites from softwood, hardwood, and agricultural straw cellulose by a simple route of partial dissolution. Carbohydr. Polym. 2021, 256, 117591. [Google Scholar] [CrossRef]
- Hai, L.V.; Kim, H.C.; Kafy, A.; Zhai, L.; Kim, J.W.J.; Kim, J.W.J. Green all-cellulose nanocomposites made with cellulose nanofibers reinforced in dissolved cellulose matrix without heat treatment. Cellulose 2017, 24, 3301–3311. [Google Scholar] [CrossRef]
- Zhao, J.; He, X.; Wang, Y.; Zhang, W.; Zhang, X.X.; Zhang, X.X.; Deng, Y.; Lu, C. Reinforcement of all-cellulose nanocomposite films using native cellulose nanofibrils. Carbohydr. Polym. 2014, 104, 143–150. [Google Scholar] [CrossRef]
- Duchemin, B.J.C.Z.; Newman, R.H.; Staiger, M.P. Phase transformations in microcrystalline cellulose due to partial dissolution. Cellulose 2007, 14, 311–320. [Google Scholar] [CrossRef]
- Soykeabkaew, N.; Nishino, T.; Peijs, T. All-cellulose composites of regenerated cellulose fibres by surface selective dissolution. Compos. Part A Appl. Sci. Manuf. 2009, 40, 321–328. [Google Scholar] [CrossRef]
- Shakeri, A.; Mathew, A.P.; Oksman, K. Self-reinforced nanocomposite by partial dissolution of cellulose microfibrils in ionic liquid. J. Compos. Mater. 2012, 46, 1305–1311. [Google Scholar] [CrossRef]
- Tanpichai, S.; Witayakran, S. All-cellulose composite laminates prepared from pineapple leaf fibers treated with steam explosion and alkaline treatment. J. Reinf. Plast. Compos. 2017, 36, 1146–1155. [Google Scholar] [CrossRef]
- Pullawan, T.; Wilkinson, A.N.; Eichhorn, S.J. Discrimination of matrix-fibre interactions in all-cellulose nanocomposites. Compos. Sci. Technol. 2010, 70, 2325–2330. [Google Scholar] [CrossRef] [Green Version]
- Cao, Y.; Li, H.; Zhang, Y.; Zhang, J.; He, J. Structure and properties of novel regenerated cellulose films prepared from cornhusk cellulose in room temperature ionic liquids. J. Appl. Polym. Sci. 2010, 116, 547–554. [Google Scholar] [CrossRef]
- Isogai, A.; Saito, T.; Fukuzumi, H. TEMPO-oxidized cellulose nanofibers. Nanoscale 2011, 3, 71–85. [Google Scholar] [CrossRef] [PubMed]
- Saito, T.; Kimura, S.; Nishiyama, Y.; Isogai, A. Cellulose nanofibers prepared by TEMPO-mediated oxidation of native cellulose. Biomacromolecules 2007, 8, 2485–2491. [Google Scholar] [CrossRef] [PubMed]
- Rein, D.M.; Khalfin, R.; Szekely, N.; Cohen, Y. True molecular solutions of natural cellulose in the binary ionic liquid-containing solvent mixtures. Carbohydr. Polym. 2014, 112, 125–133. [Google Scholar] [CrossRef]
- Zhang, X.; Mao, Y.; Tyagi, M.; Jiang, F.; Henderson, D.; Jiang, B.; Lin, Z.; Jones, R.L.; Hu, L.; Briber, R.M.; et al. Molecular partitioning in ternary solutions of cellulose. Carbohydr. Polym. 2019, 220, 157–162. [Google Scholar] [CrossRef]
- Lu, R.; Zhang, X.; Fu, L.; Wang, H.; Briber, R.M.; Wang, H. Amorphous cellulose thin films. Cellulose 2020, 27, 2959–2965. [Google Scholar] [CrossRef]
- Huang, J.; Zhu, H.; Chen, Y.; Preston, C.; Rohrbach, K.; Cumings, J.; Hu, L. Highly transparent and flexible nanopaper transistors. ACS Nano 2013, 7, 2106–2113. [Google Scholar] [CrossRef] [PubMed]
- Zhu, H.; Parvinian, S.; Preston, C.; Vaaland, O.; Ruan, Z.; Hu, L. Transparent nanopaper with tailored optical properties. Nanoscale 2013, 5, 3787–3792. [Google Scholar] [CrossRef] [PubMed] [Green Version]
- Zhu, H.; Xiao, Z.; Liu, D.; Li, Y.; Weadock, N.J.; Fang, Z.; Huang, J.; Hu, L. Biodegradable transparent substrates for flexible organic-light-emitting diodes. Energy Environ. Sci. 2013, 6, 2105–2111. [Google Scholar] [CrossRef]
- Fang, Z.; Zhu, H.; Preston, C.; Han, X.; Li, Y.; Lee, S.; Chai, X.; Chen, G.; Hu, L. Highly transparent and writable wood all-cellulose hybrid nanostructured paper. J. Mater. Chem. C 2013, 1, 6191–6197. [Google Scholar] [CrossRef]
- Glinka, C.J.; Barker, J.G.; Hammouda, B.; Krueger, S.; Moyer, J.J.; Orts, W.J. The 30 m small-angle neutron scattering instruments at the National Institute of Standards and Technology. J. Appl. Crystallogr. 1998, 31, 430–445. [Google Scholar] [CrossRef]
- Kline, S.R. Reduction and analysis of SANS and USANS data using IGOR Pro. J. Appl. Crystallogr. 2006, 39, 895–900. [Google Scholar] [CrossRef]
- Okita, Y.; Fujisawa, S.; Saito, T.; Isogai, A. TEMPO-oxidized cellulose nanofibrils dispersed in organic solvents. Biomacromolecules 2011, 12, 518–522. [Google Scholar] [CrossRef]
- Lu, J.Z.; Monlezun, C.J.; Wu, Q.; Cao, Q.V. Fitting Weibull and lognormal distributions to medium-density fiberboard fiber and wood particle length. Wood Fiber Sci. 2007, 39, 82–94. [Google Scholar]
- Usov, I.; Nyström, G.; Adamcik, J.; Handschin, S.; Schütz, C.; Fall, A.; Bergström, L.; Mezzenga, R. Understanding nanocellulose chirality and structure-properties relationship at the single fibril level. Nat. Commun. 2015, 6, 7564. [Google Scholar] [CrossRef] [Green Version]
- Guccini, V.; Yu, S.; Agthe, M.; Gordeyeva, K.; Trushkina, Y.; Fall, A.; Schütz, C.; Salazar-Alvarez, G. Inducing Nematic Ordering of Cellulose Nanofibers using Osmotic Dehydration. ChemRxiv 2018, 10, 23157. [Google Scholar] [CrossRef] [PubMed] [Green Version]
- Juttula, H.J.; Törmänen, M.; Mäkynen, A.J. Predicting scattering properties of fiber suspensions using Mie theory and probabilistic cross-sectional diameter of fibers. Opt. Rev. 2020, 27, 225–232. [Google Scholar] [CrossRef] [Green Version]
- Pahimanolis, N.; Salminen, A.; Penttilä, P.A.; Korhonen, J.T.; Johansson, L.S.; Ruokolainen, J.; Serimaa, R.; Seppälä, J. Nanofibrillated cellulose/carboxymethyl cellulose composite with improved wet strength. Cellulose 2013, 20, 1459–1468. [Google Scholar] [CrossRef]
- Penttilä, P.A.; Várnai, A.; Fernández, M.; Kontro, I.; Liljeström, V.; Lindner, P.; Siika-aho, M.; Viikari, L.; Serimaa, R. Small-angle scattering study of structural changes in the microfibril network of nanocellulose during enzymatic hydrolysis. Cellulose 2013, 20, 1031–1040. [Google Scholar] [CrossRef]
- Wu, B.; Geng, B.; Chen, Y.; Liu, H.; Li, G.; Wu, Q. Preparation and characteristics of TEMPO-oxidized cellulose nanofibrils from bamboo pulp and their oxygen-barrier application in PLA films. Front. Chem. Sci. Eng. 2017, 11, 554–563. [Google Scholar] [CrossRef]
- Zhu, H.; Zhu, S.; Jia, Z.; Parvinian, S.; Li, Y.; Vaaland, O.; Hu, L.; Li, T. Anomalous scaling law of strength and toughness of cellulose nanopaper. Proc. Natl. Acad. Sci. USA 2015, 112, 8971–8976. [Google Scholar] [CrossRef] [Green Version]
- Yang, Q.; Saito, T.; Berglund, L.A.; Isogai, A. Cellulose nanofibrils improve the properties of all-cellulose composites by the nano-reinforcement mechanism and nanofibril-induced crystallization. Nanoscale 2015, 7, 17957–17963. [Google Scholar] [CrossRef]
- Cai, J.; Zhang, L. Rapid dissolution of cellulose in LiOH/urea and NaOH/urea aqueous solutions. Macromol. Biosci. 2005, 5, 539–548. [Google Scholar] [CrossRef]
- Jin, L.; Gan, J.; Hu, G.; Cai, L.; Li, Z.; Zhang, L.; Zheng, Q.; Xie, H. Preparation of cellulose films from sustainable CO2/DBU/DMSO system. Polymers 2019, 11, 994. [Google Scholar] [CrossRef] [Green Version]
- Wang, J.; Wang, L.; Gardner, D.J.; Shaler, S.M.; Cai, Z. Towards a cellulose-based society: Opportunities and challenges. Cellulose 2021, 28, 4511–4543. [Google Scholar] [CrossRef]
- Lakovaara, M.; Sirviö, J.A.; Ismail, M.Y.; Liimatainen, H.; Sliz, R. Hydrophobic modification of nanocellulose and all-cellulose composite films using deep eutectic solvent as a reaction medium. Cellulose 2021, 28, 5433–5447. [Google Scholar] [CrossRef]
- Dormanns, J.W.; Schuermann, J.; Müssig, J.; Duchemin, B.J.C.; Staiger, M.P. Solvent infusion processing of all-cellulose composite laminates using an aqueous NaOH/urea solvent system. Compos. Part A Appl. Sci. Manuf. 2016, 82, 130–140. [Google Scholar] [CrossRef]
- Ghaderi, M.; Mousavi, M.; Yousefi, H.; Labbafi, M. All-cellulose nanocomposite film made from bagasse cellulose nanofibers for food packaging application. Carbohydr. Polym. 2014, 104, 59–65. [Google Scholar] [CrossRef]
- Sirviö, J.A.; Visanko, M.; Hildebrandt, N.C. Rapid preparation of all-cellulose composites by solvent welding based on the use of aqueous solvent. Eur. Polym. J. 2017, 97, 292–298. [Google Scholar] [CrossRef] [Green Version]
- Mat Salleh, M.; Magniez, K.; Pang, S.; Dormanns, J.W.; Staiger, M.P. Parametric optimization of the processing of all-cellulose composite laminae. Adv. Manuf. Polym. Compos. Sci. 2017, 3, 73–79. [Google Scholar] [CrossRef] [Green Version]
- Kurihara, T.; Isogai, A. Mechanism of TEMPO-oxidized cellulose nanofibril film reinforcement with poly(acrylamide). Cellulose 2015, 22, 2607–2617. [Google Scholar] [CrossRef]
Figure 1.
Bright field (a,b) and cross-polarized (c,d) optical micrographs of cellulose fibers after 5 min (a,c) and 120 min (b,d) of TEMPO-assisted oxidation reaction. Micrographs show fiber swelling upon oxidation. Cross-polarized micrographs show structural features smearing at longer times. (e) The histogram diameter distribution of 5- and 120-min specimens, and the best fits using the log-normal distribution function. The 5-min distribution is narrower and centered around 30 μm, while the 120 min is broader and centered around 80 μm. (f) The mean diameters of macrofibers as a function of oxidation time.

Figure 2.
(a) Small-angle neutron scattering of macrofibers in aqueous suspension after various times of TEMPO-assisted oxidation. The symbols are experimental data and solid curves through the symbols are best-model fitting. Curves are vertically shifted for better visibility. (b) The correlation length and the amplitude of Lorentzian function as a function of the oxidation time. Both quantities increase with time. (c) The correlation length as a function of the mean diameter of macrofibers as in Figure 1f. The line through the symbols illustrates the linear relationship between the two quantities.

Figure 3.
AFM micrographs of nanofiber after 1 pass (a) and 4 passes (b) through the microfluidizer. A line profile in (b) indicating relatively uniform thickness of nanofibers of a few nanometers. Length (c) and diameter (d) histograms for 1- and 4-pass specimens. The curves are best fits of a log-normal distribution function. Mean length (e) and diameter (f) of nanofibers as a function of the number of passes through the microfluidizer. The dash lines are the linear regression as a guide to the eye. Both the mean length and diameter vary little.

Figure 4.
(a) Stress–strain curves to the point of fracture for selected specimens with various amorphous cellulose contents. The inset shows the elastic deformation at small strains, with linear fitting (thin lines through symbols) yielding the Young’s modulus. Mechanical properties of specimens obtained from the stress–strain curves, (b) Young’s modulus, (c) yield strength, (d) elongation at break, and (e) toughness, as a function of amorphous composition. A grey zone in (b–e) at ~20% AC indicates the modulus and yield strength at a maximum, and the elongation at break and toughness at a minimum.

Figure 5.
SEM micrographs of the neat CNF (a,b), the 15% AC composite (c,d), and the neat amorphous (e,f) films at two magnifications, in which the horizontal is normal to the film and in a vertical direction along the film plane. Both CNF and the 15% AC show structures aligned parallel to the film plane, and neat amorphous cellulose film appears isotropic.

Figure 6.
(a) The absorption ratio as a function of time in water for composite films containing various amounts of amorphous cellulose. The composite films disintegrate at <12% AC and maintain integrity at >12% AC. Both the rate and the amount of absorption decrease with the amorphous content. (b) The effect of amorphous content on the maximum absorption ratio, where the disintegrated films are marked as crosses and stable films as solid circles. The inset shows the absorption ratio at specific soaking times, which is relatively insensitive to the composition at early times.


Table 1.
Mechanical properties (Young’s modulus, tensile strength, and max elongation at break) and crystallinities of cellulose regenerated from various solvent systems.
Table 1.
Mechanical properties (Young’s modulus, tensile strength, and max elongation at break) and crystallinities of cellulose regenerated from various solvent systems.
| Solvent | Young’s Modulus (GPa) | Tensile Strength (MPa) | Elongation at Break (%) | Crystallinity Index (%) | Reference |
|---|---|---|---|---|---|
| Alkali/Urea | 3.2 | 111 | 12 | 42 | [47] |
| EMIMAc | 6.1 | 35–48 | 0.5–2.6 | 48 | [26] |
| AMIMCl | 5.1–7.1 | 78–120 | 2.1–5.6 | 50 | [26] |
| CO2/DBU/DMSO | 1.6 | 55 | 6.5 | ~0 | [49] |
| DMSO/EMIMAc | 2.2 | 54.4 | 7.5 | <2 | 100%AC this work |
| DMSO/EMIMAc | 12 | 130 | 1 | ~19 | 15%AC this work |
Publisher’s Note: MDPI stays neutral with regard to jurisdictional claims in published maps and institutional affiliations. |
© 2021 by the authors. Licensee MDPI, Basel, Switzerland. This article is an open access article distributed under the terms and conditions of the Creative Commons Attribution (CC BY) license (https://creativecommons.org/licenses/by/4.0/).
Share and Cite
MDPI and ACS Style
Henderson, D.; Zhang, X.; Mao, Y.; Hu, L.; Briber, R.M.; Wang, H. Cellulose Nanocomposites of Cellulose Nanofibers and Molecular Coils. J. Compos. Sci. 2021, 5, 200. https://0-doi-org.brum.beds.ac.uk/10.3390/jcs5080200
AMA Style
Henderson D, Zhang X, Mao Y, Hu L, Briber RM, Wang H. Cellulose Nanocomposites of Cellulose Nanofibers and Molecular Coils. Journal of Composites Science. 2021; 5(8):200. https://0-doi-org.brum.beds.ac.uk/10.3390/jcs5080200
Chicago/Turabian StyleHenderson, Doug, Xin Zhang, Yimin Mao, Liangbing Hu, Robert M. Briber, and Howard Wang. 2021. "Cellulose Nanocomposites of Cellulose Nanofibers and Molecular Coils" Journal of Composites Science 5, no. 8: 200. https://0-doi-org.brum.beds.ac.uk/10.3390/jcs5080200