
Influence of Matrix Strength on Bridging Performance of Fiber-Reinforced Cementitious Composite with Bundled Aramid Fiber


Abstract
:1. Introduction
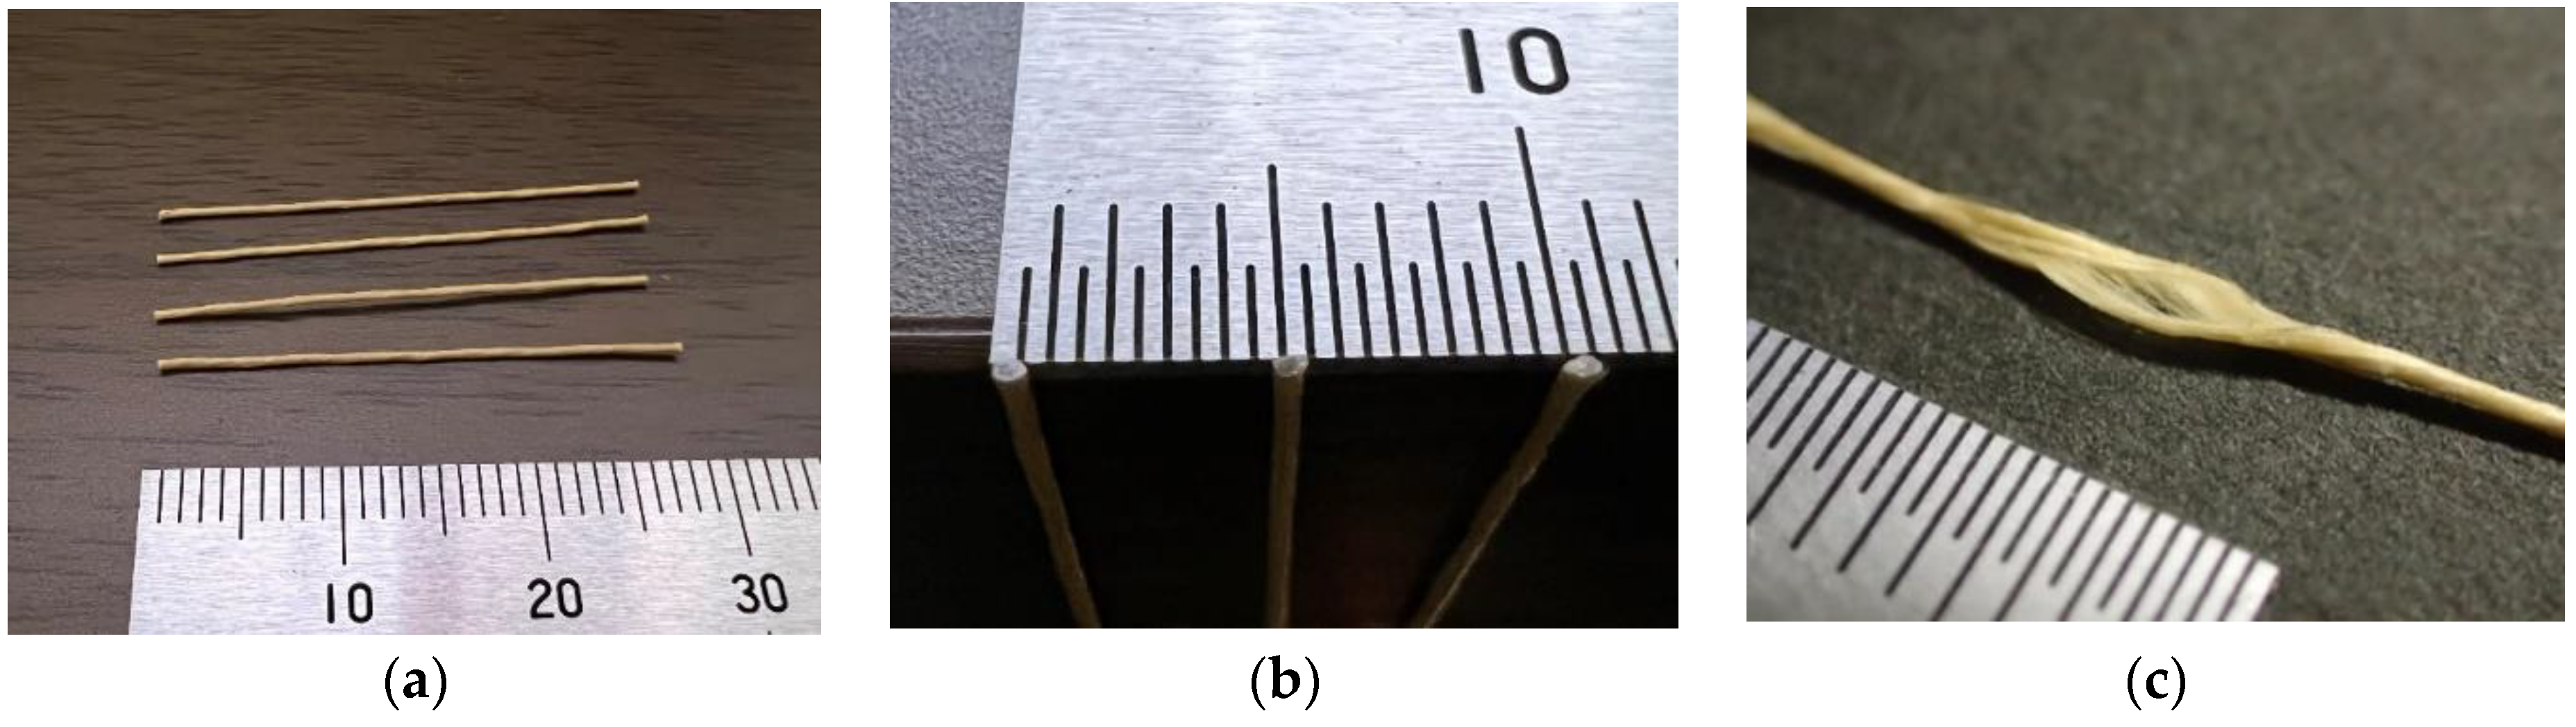
2. Used Materials
3. Uniaxial Tension Test of FRCC
3.1. Specimens
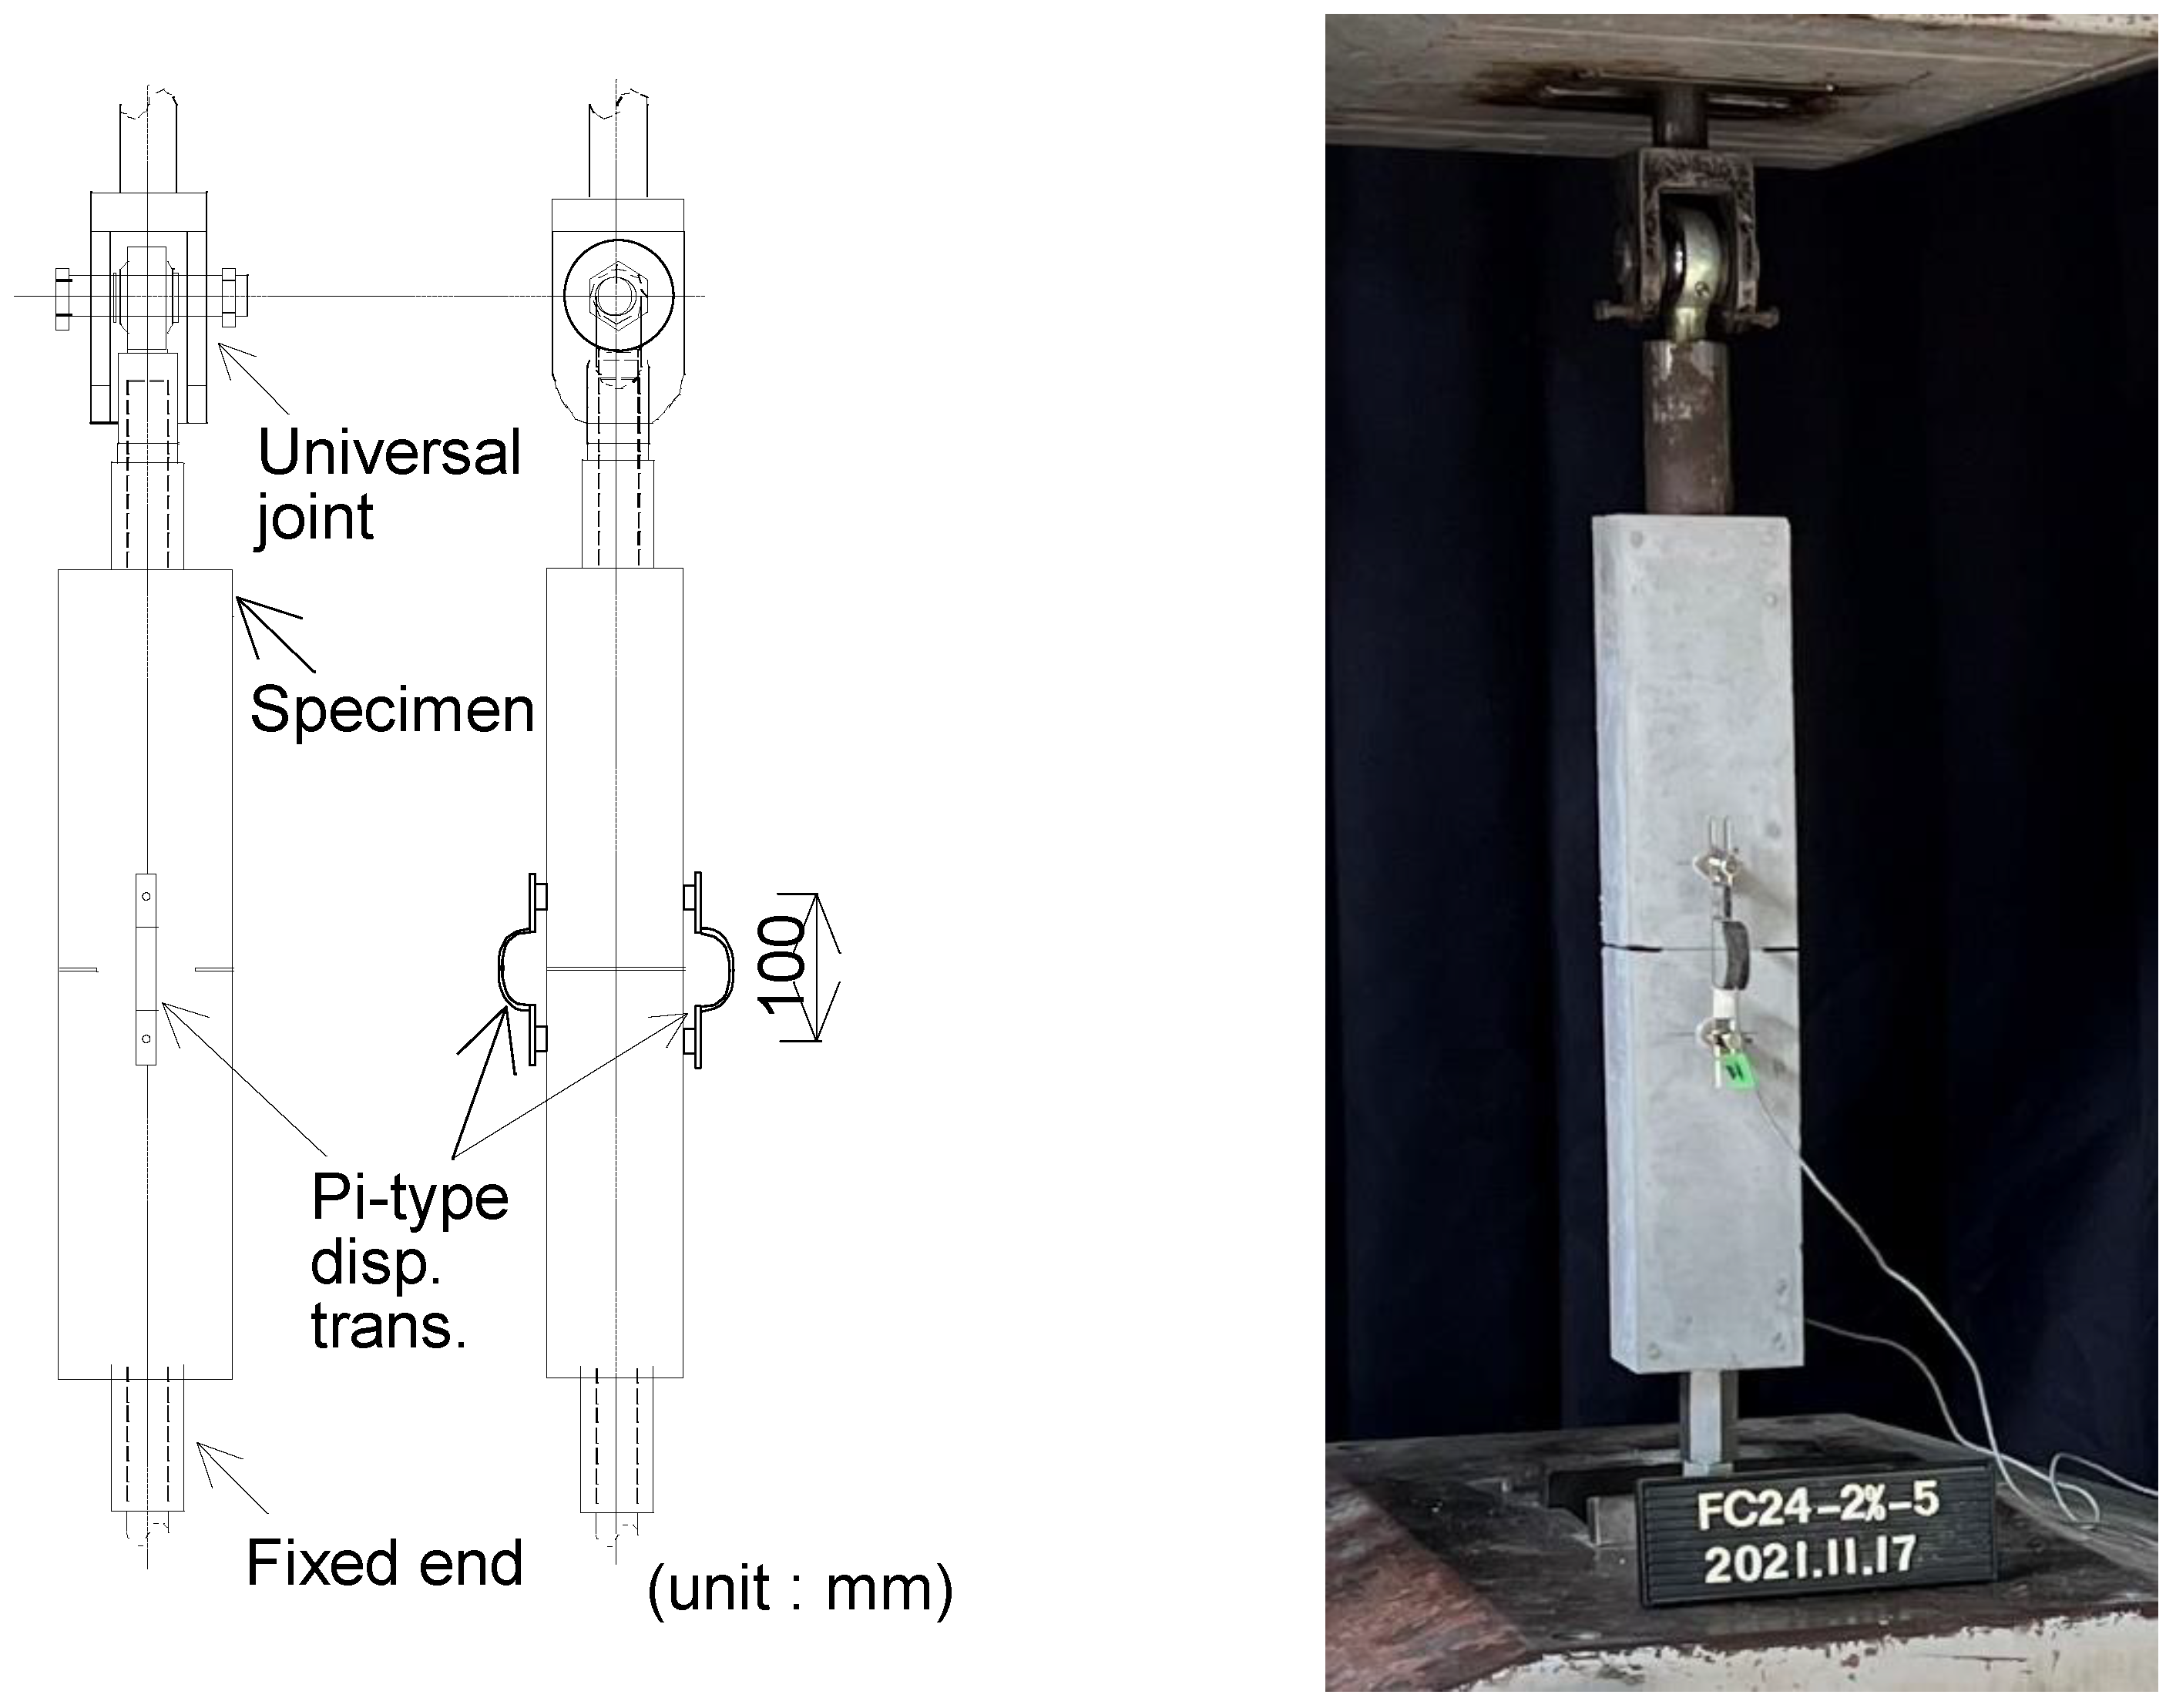
3.2. Loading and Measurement
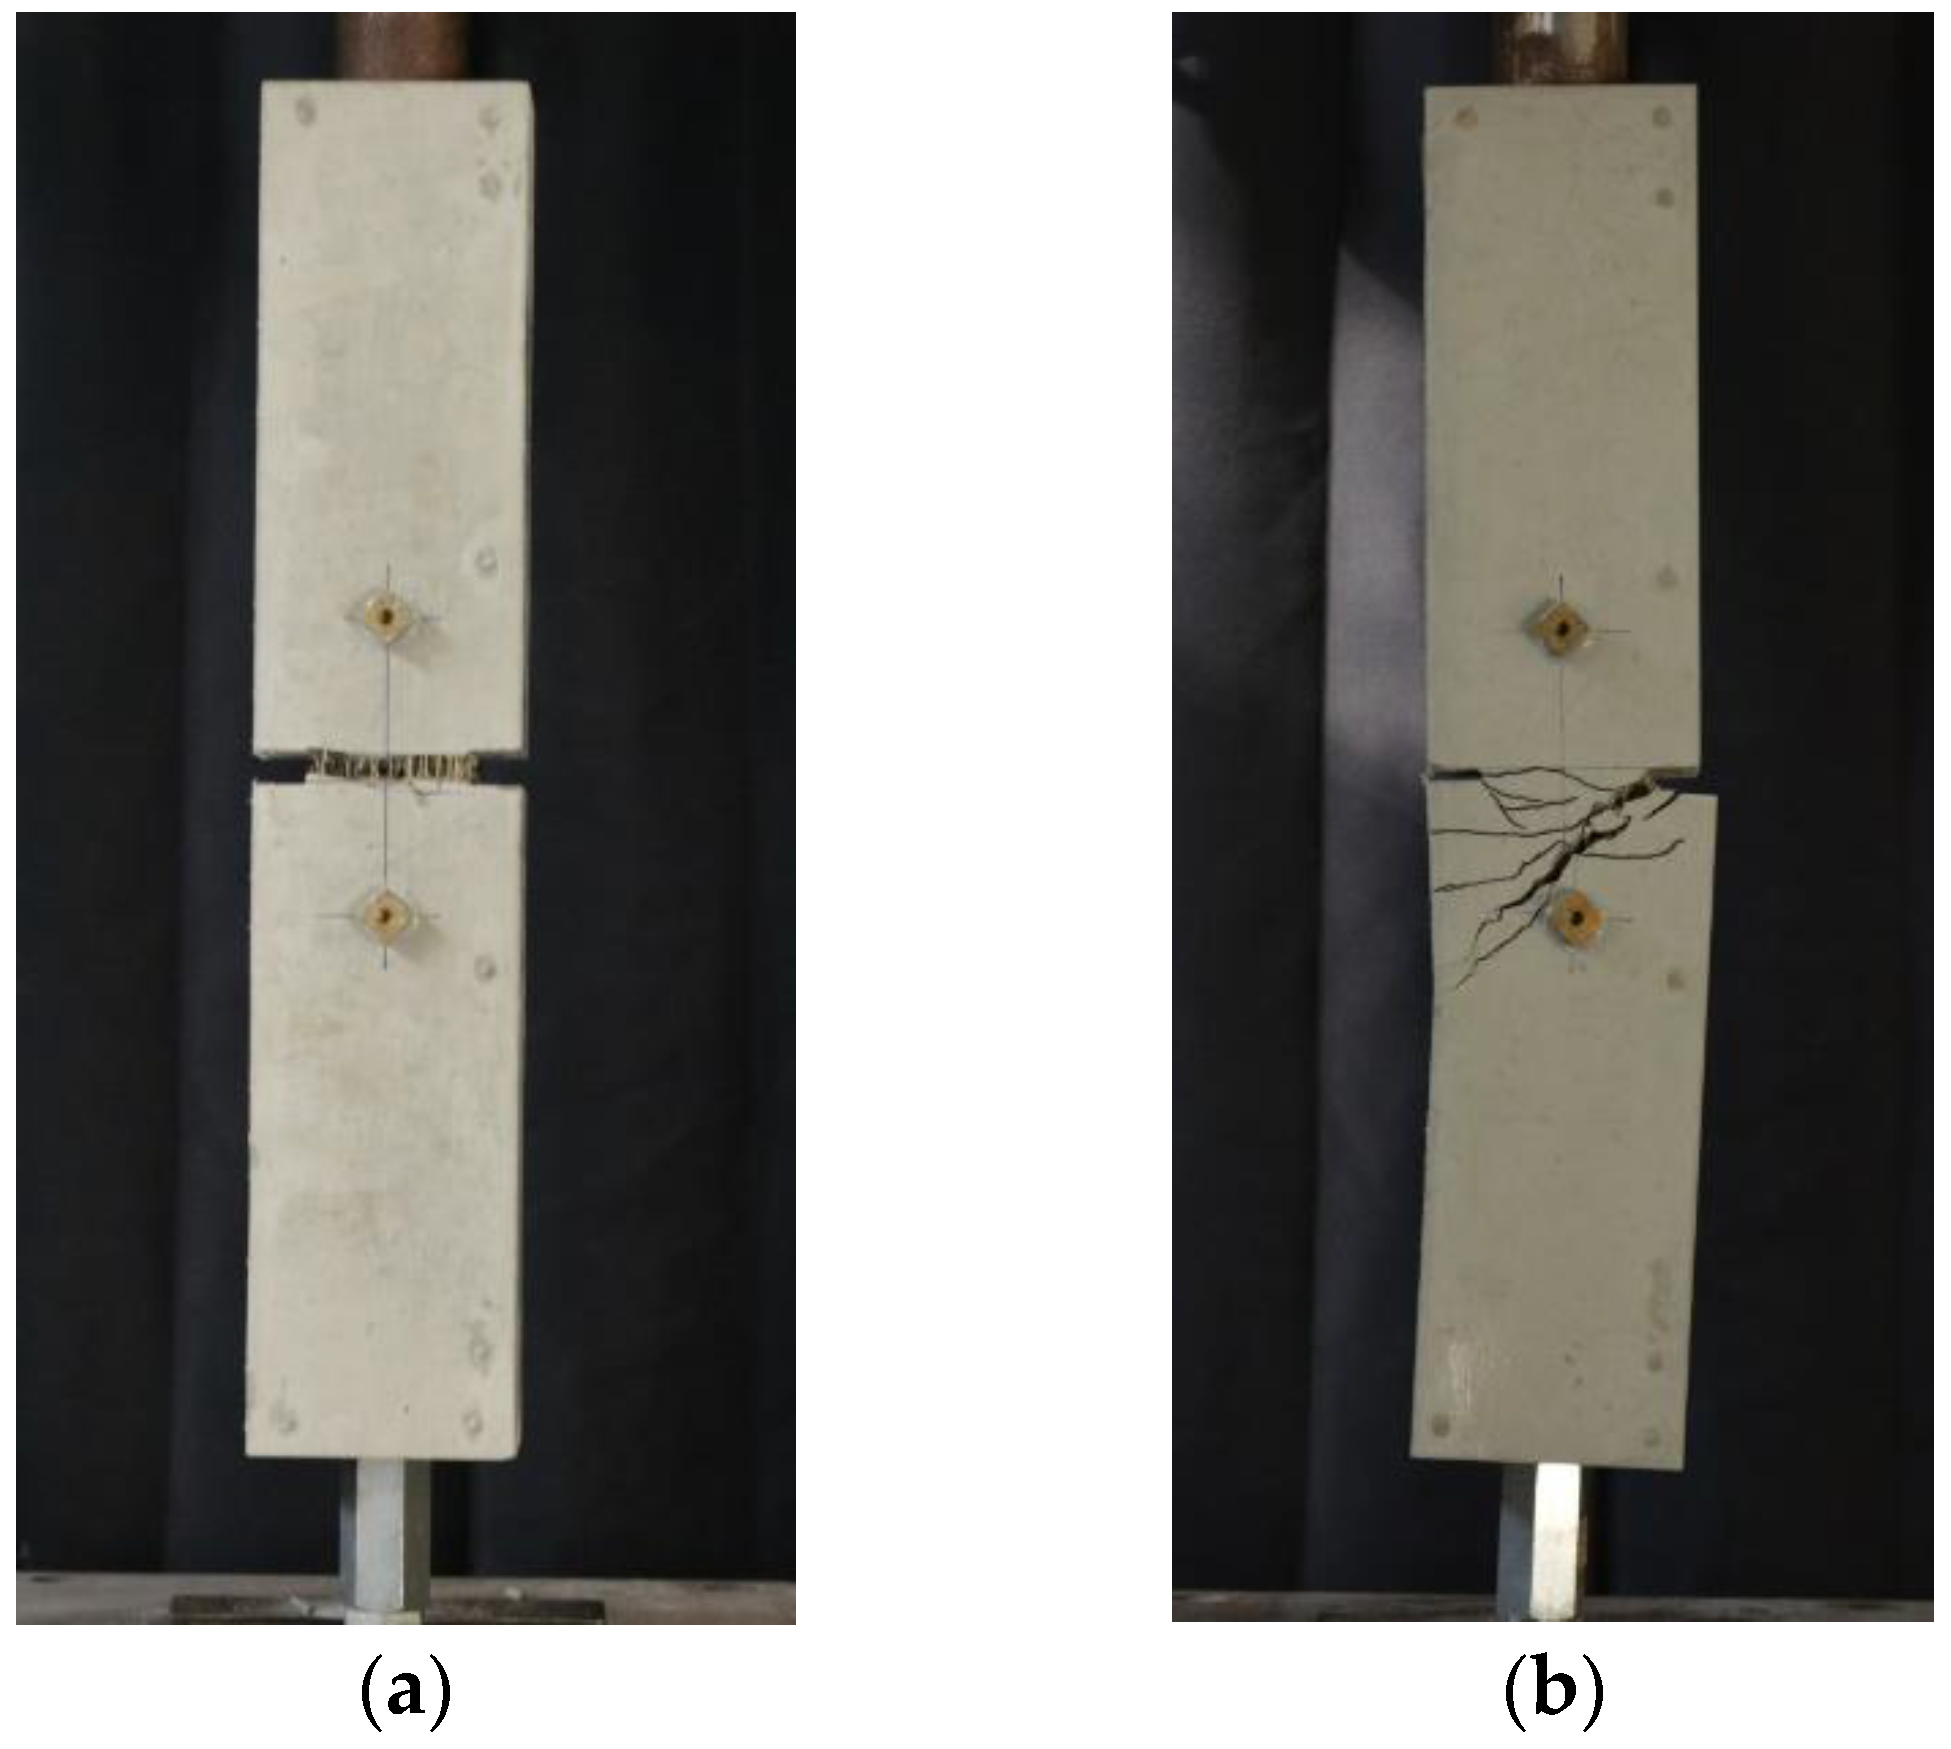
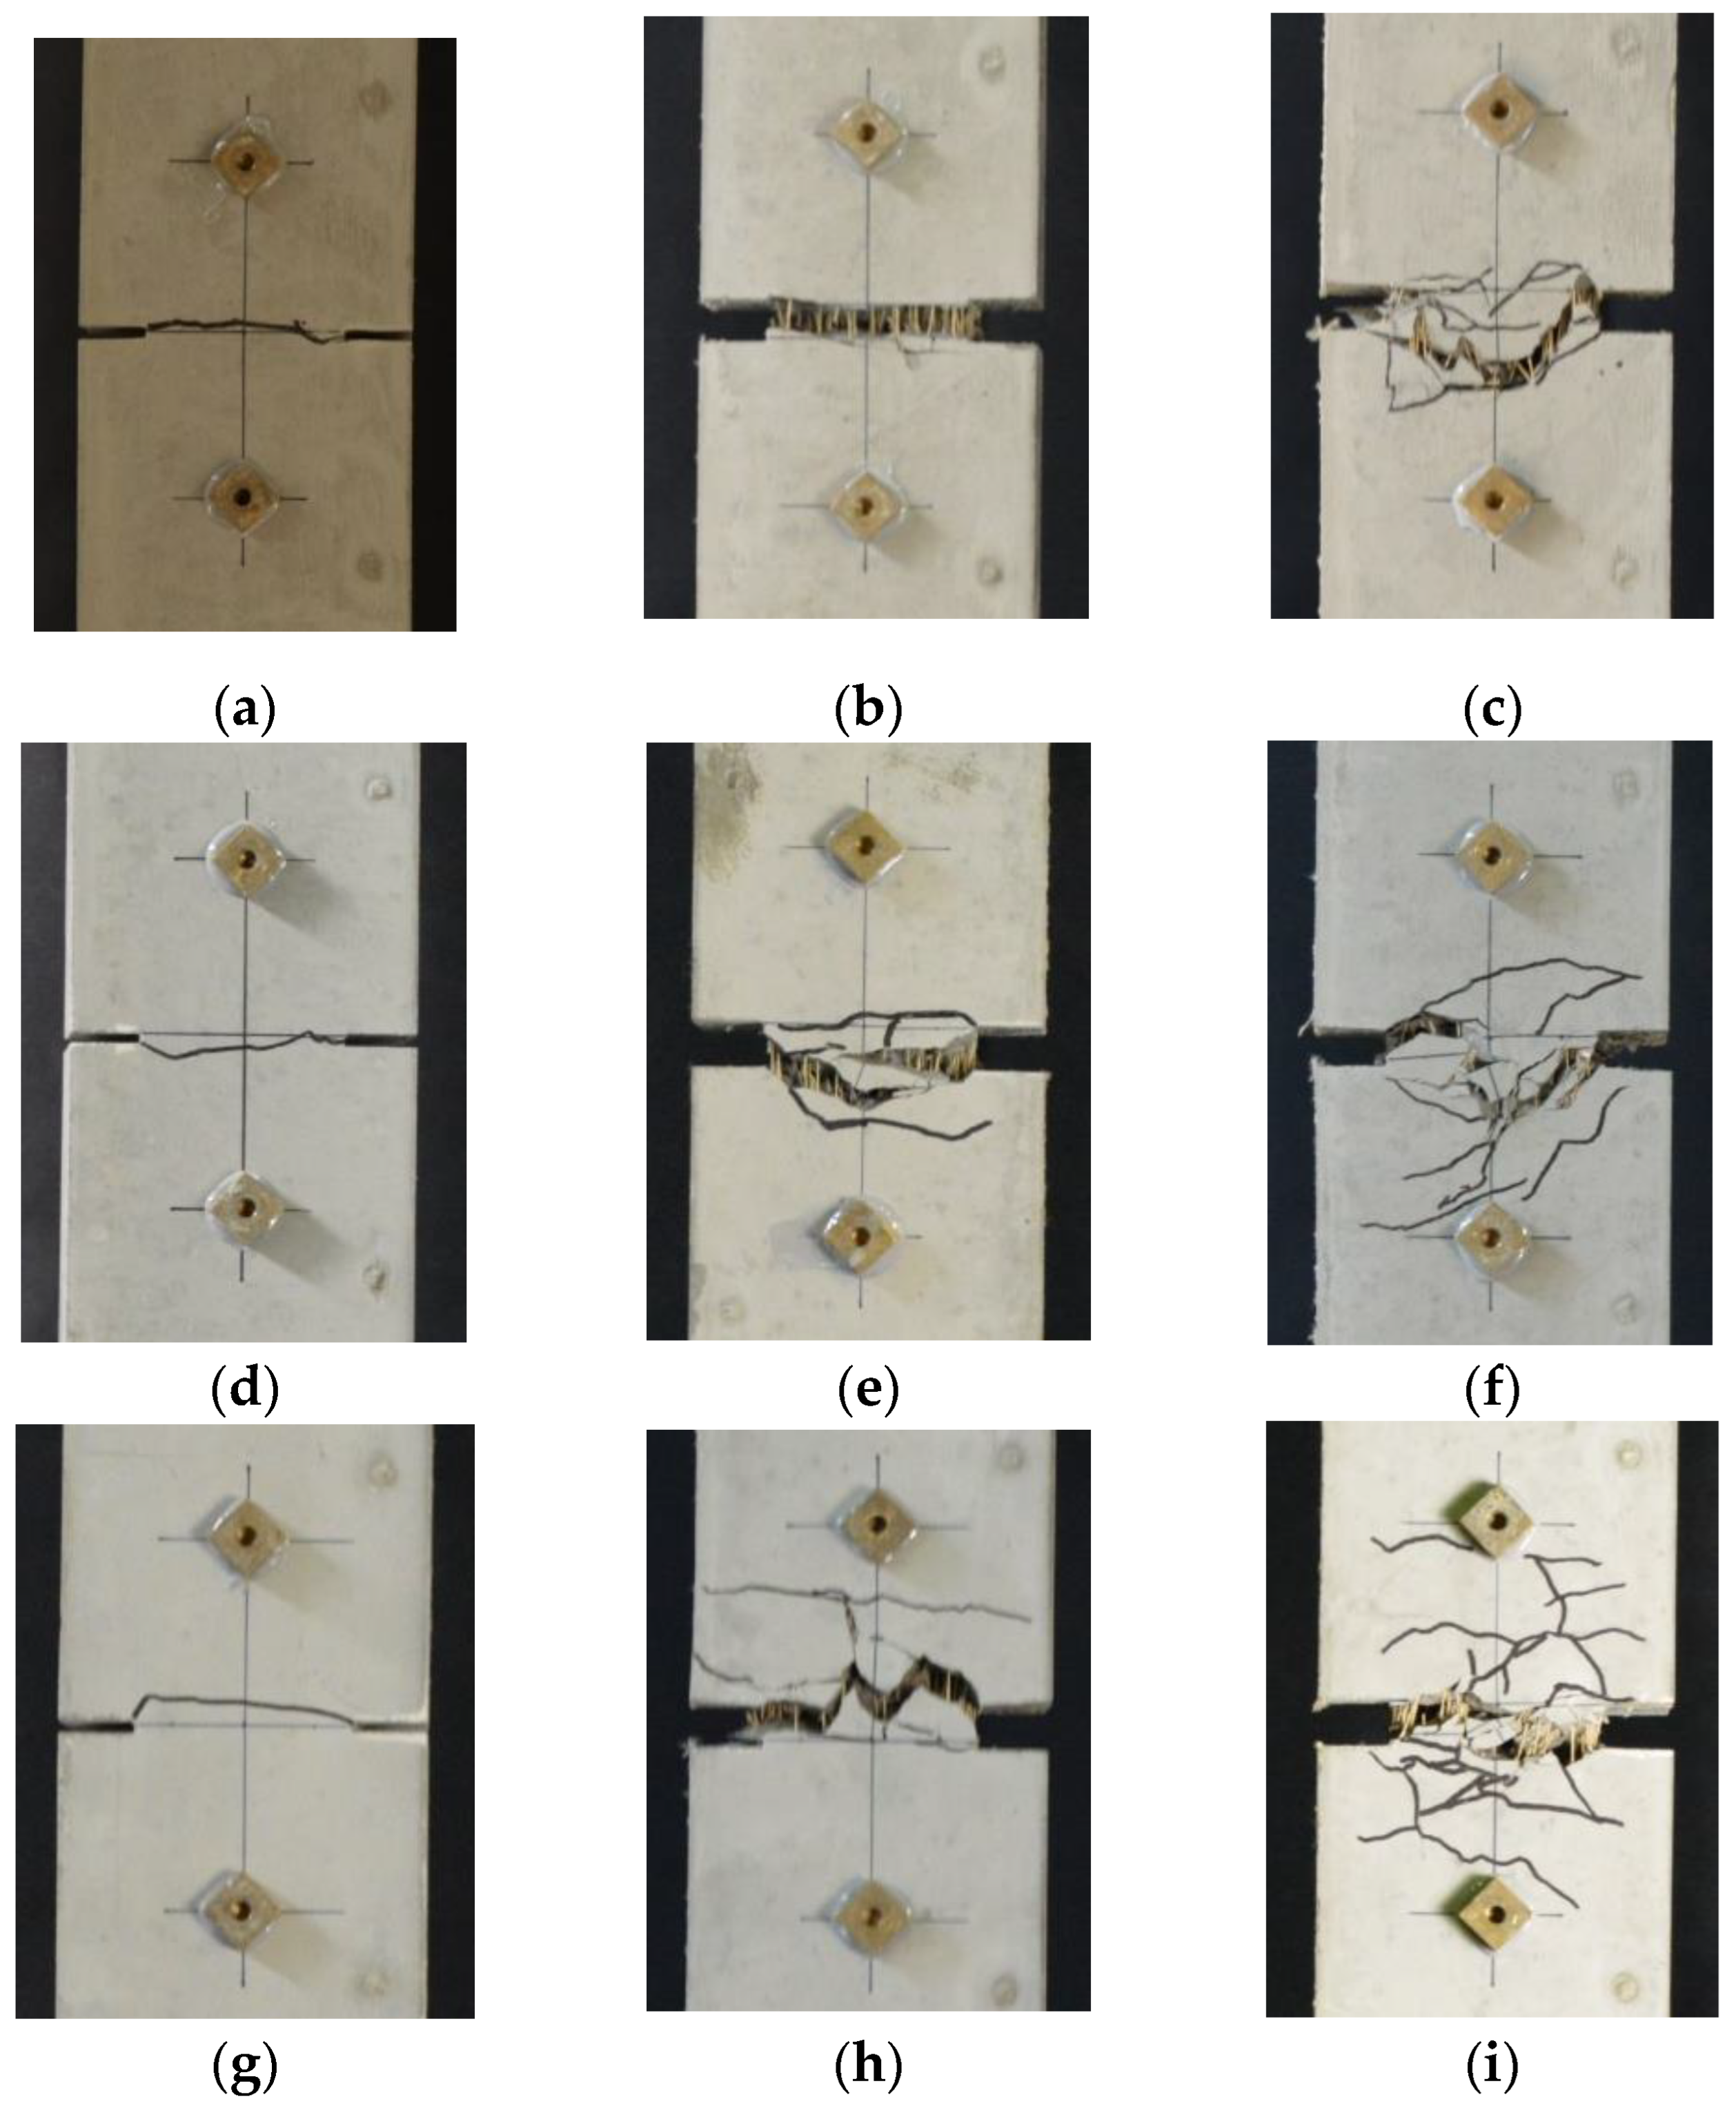
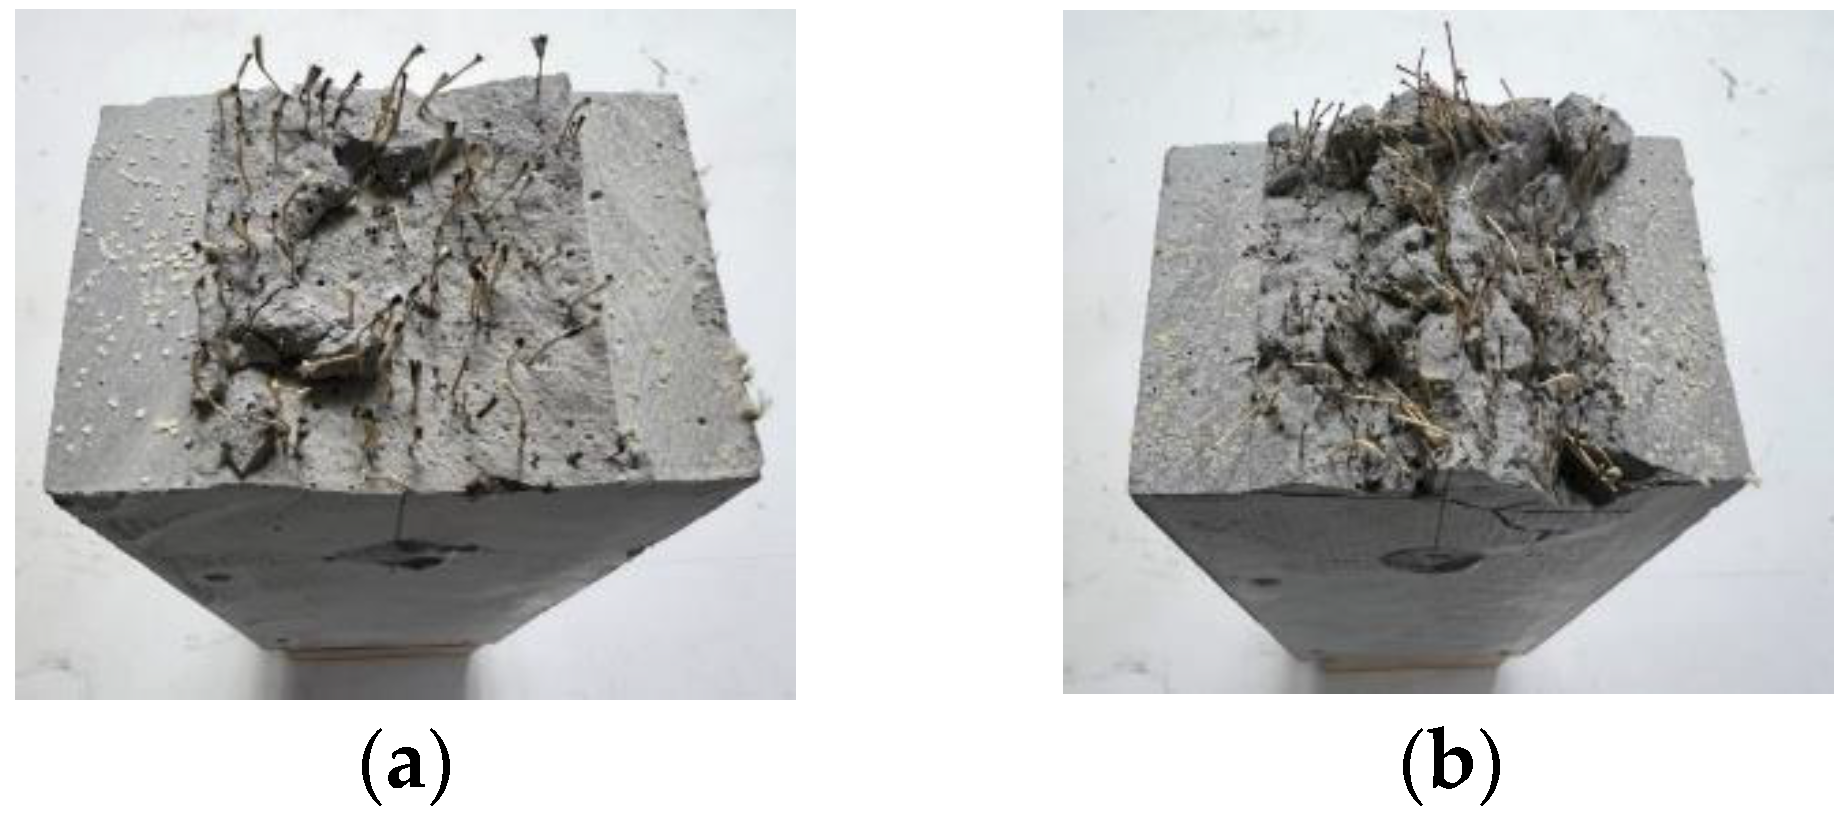
3.3. Failure Patterns
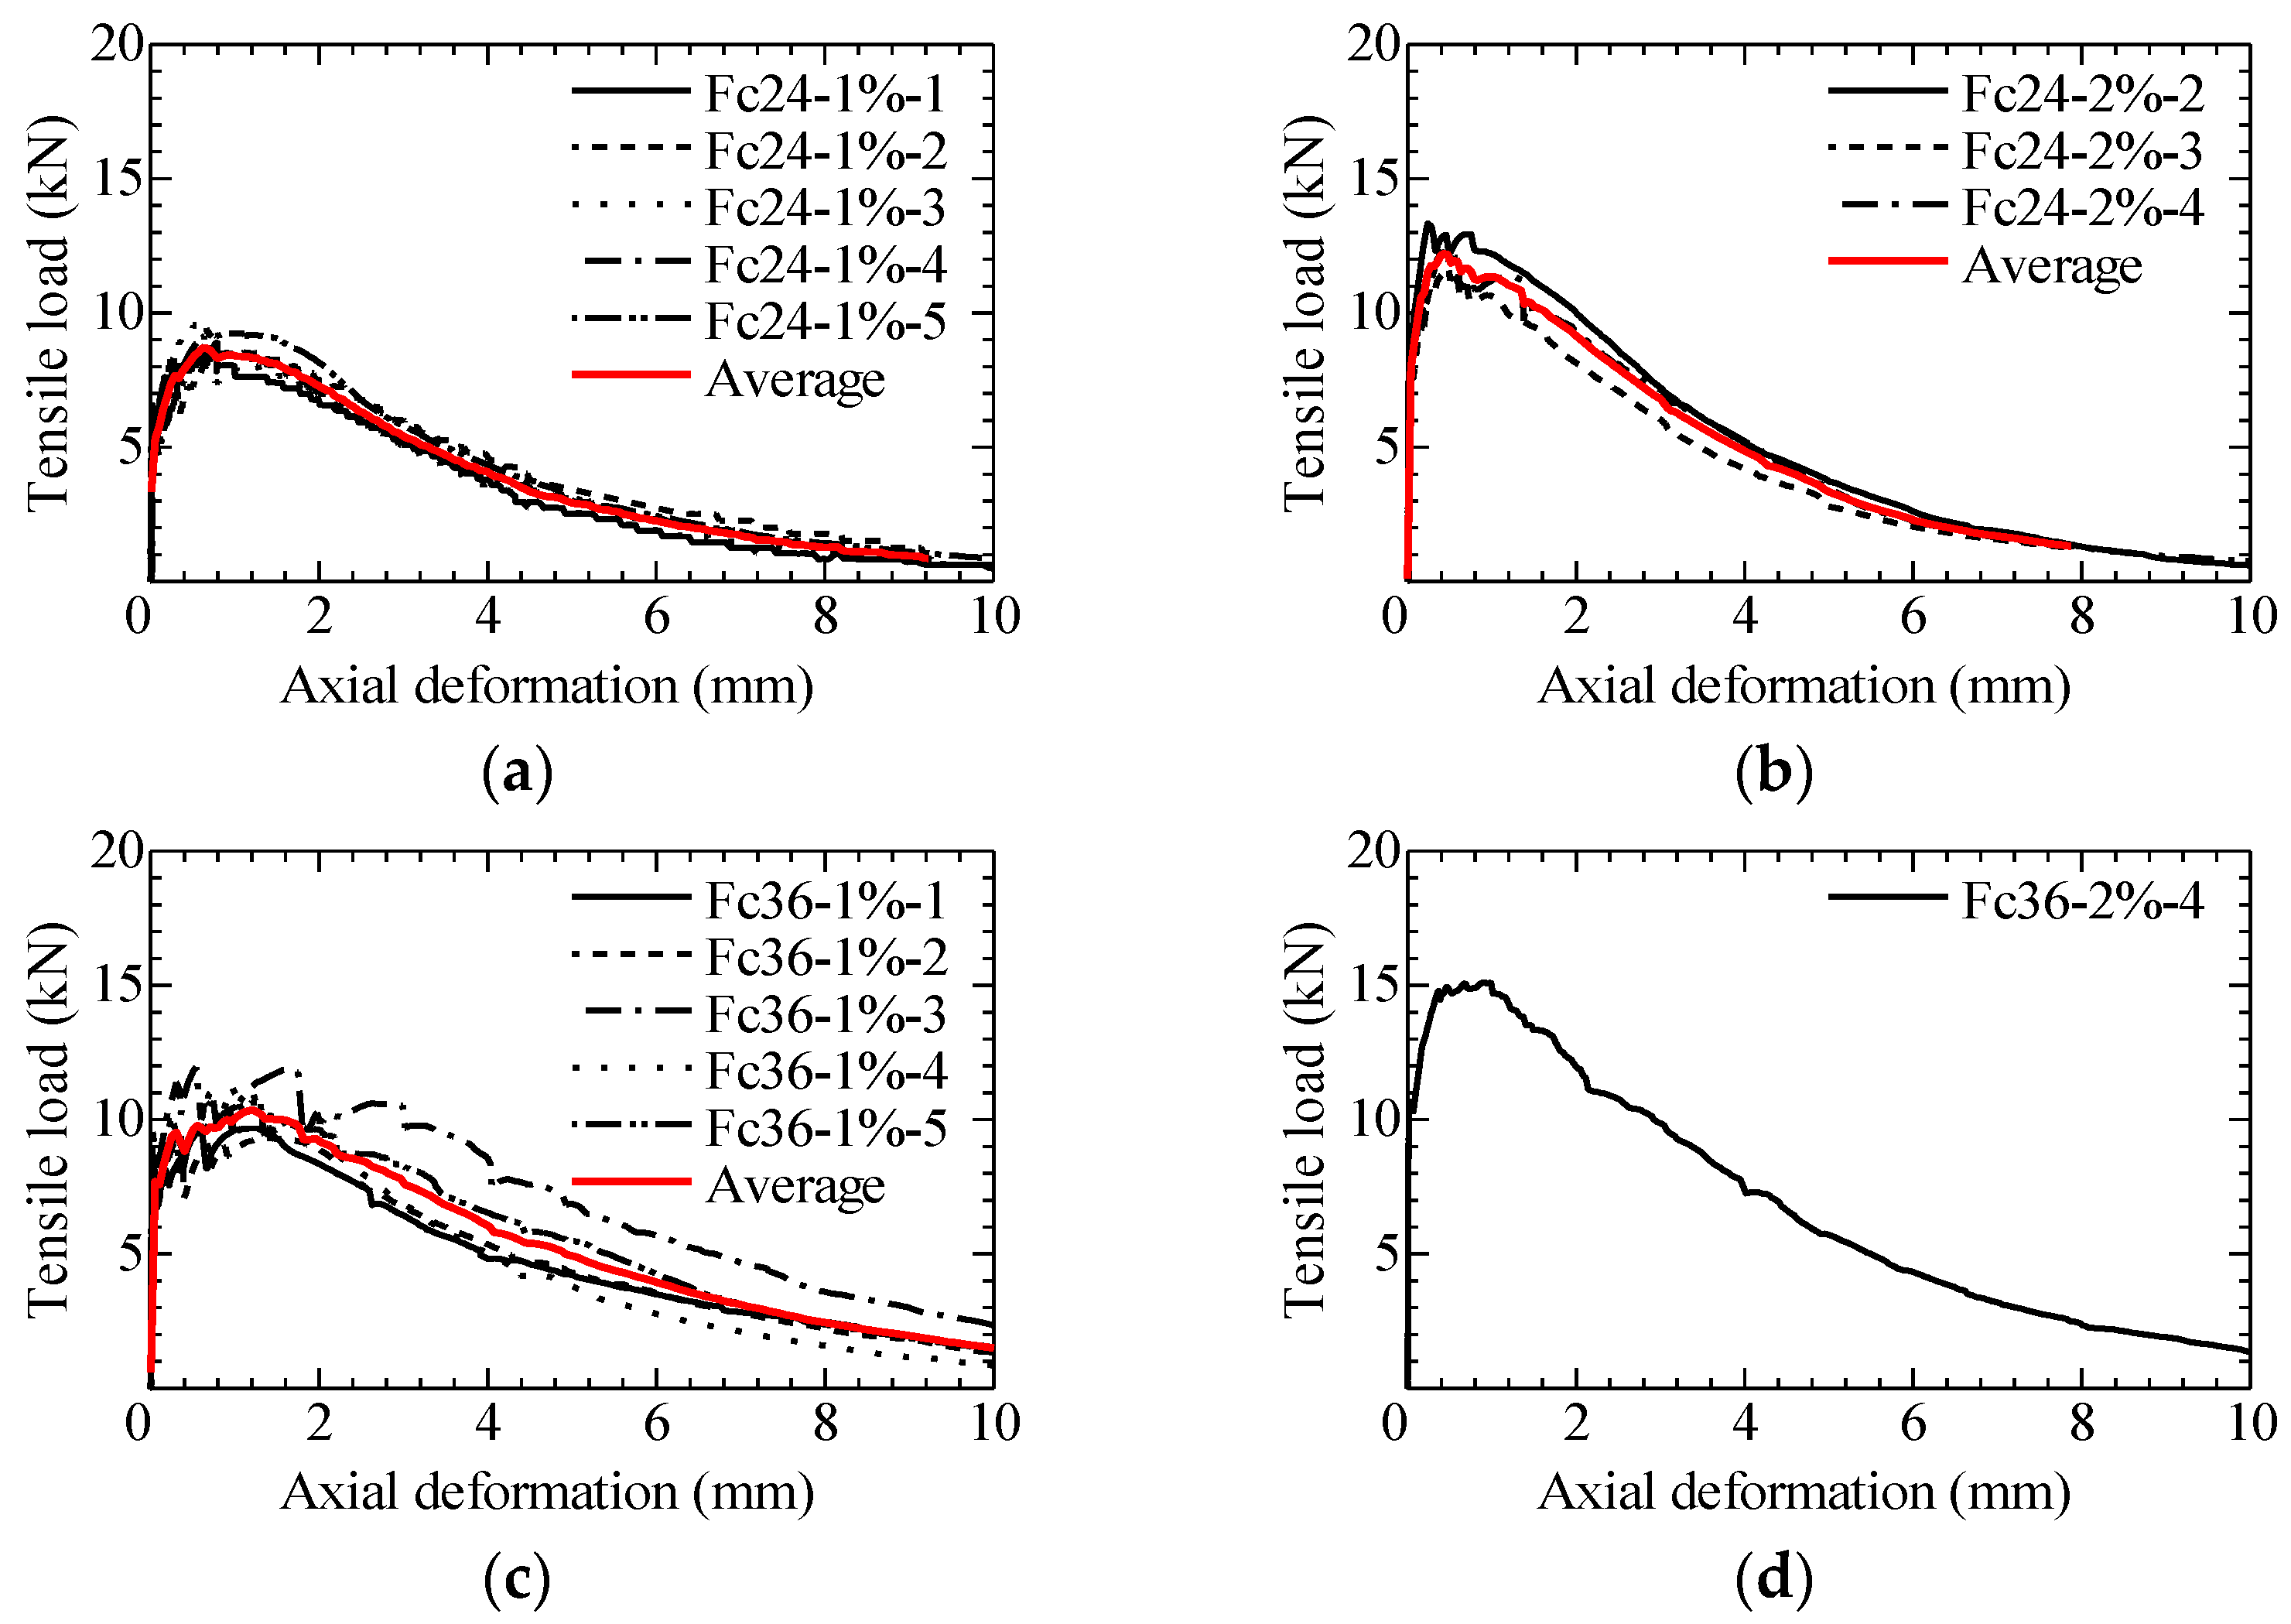
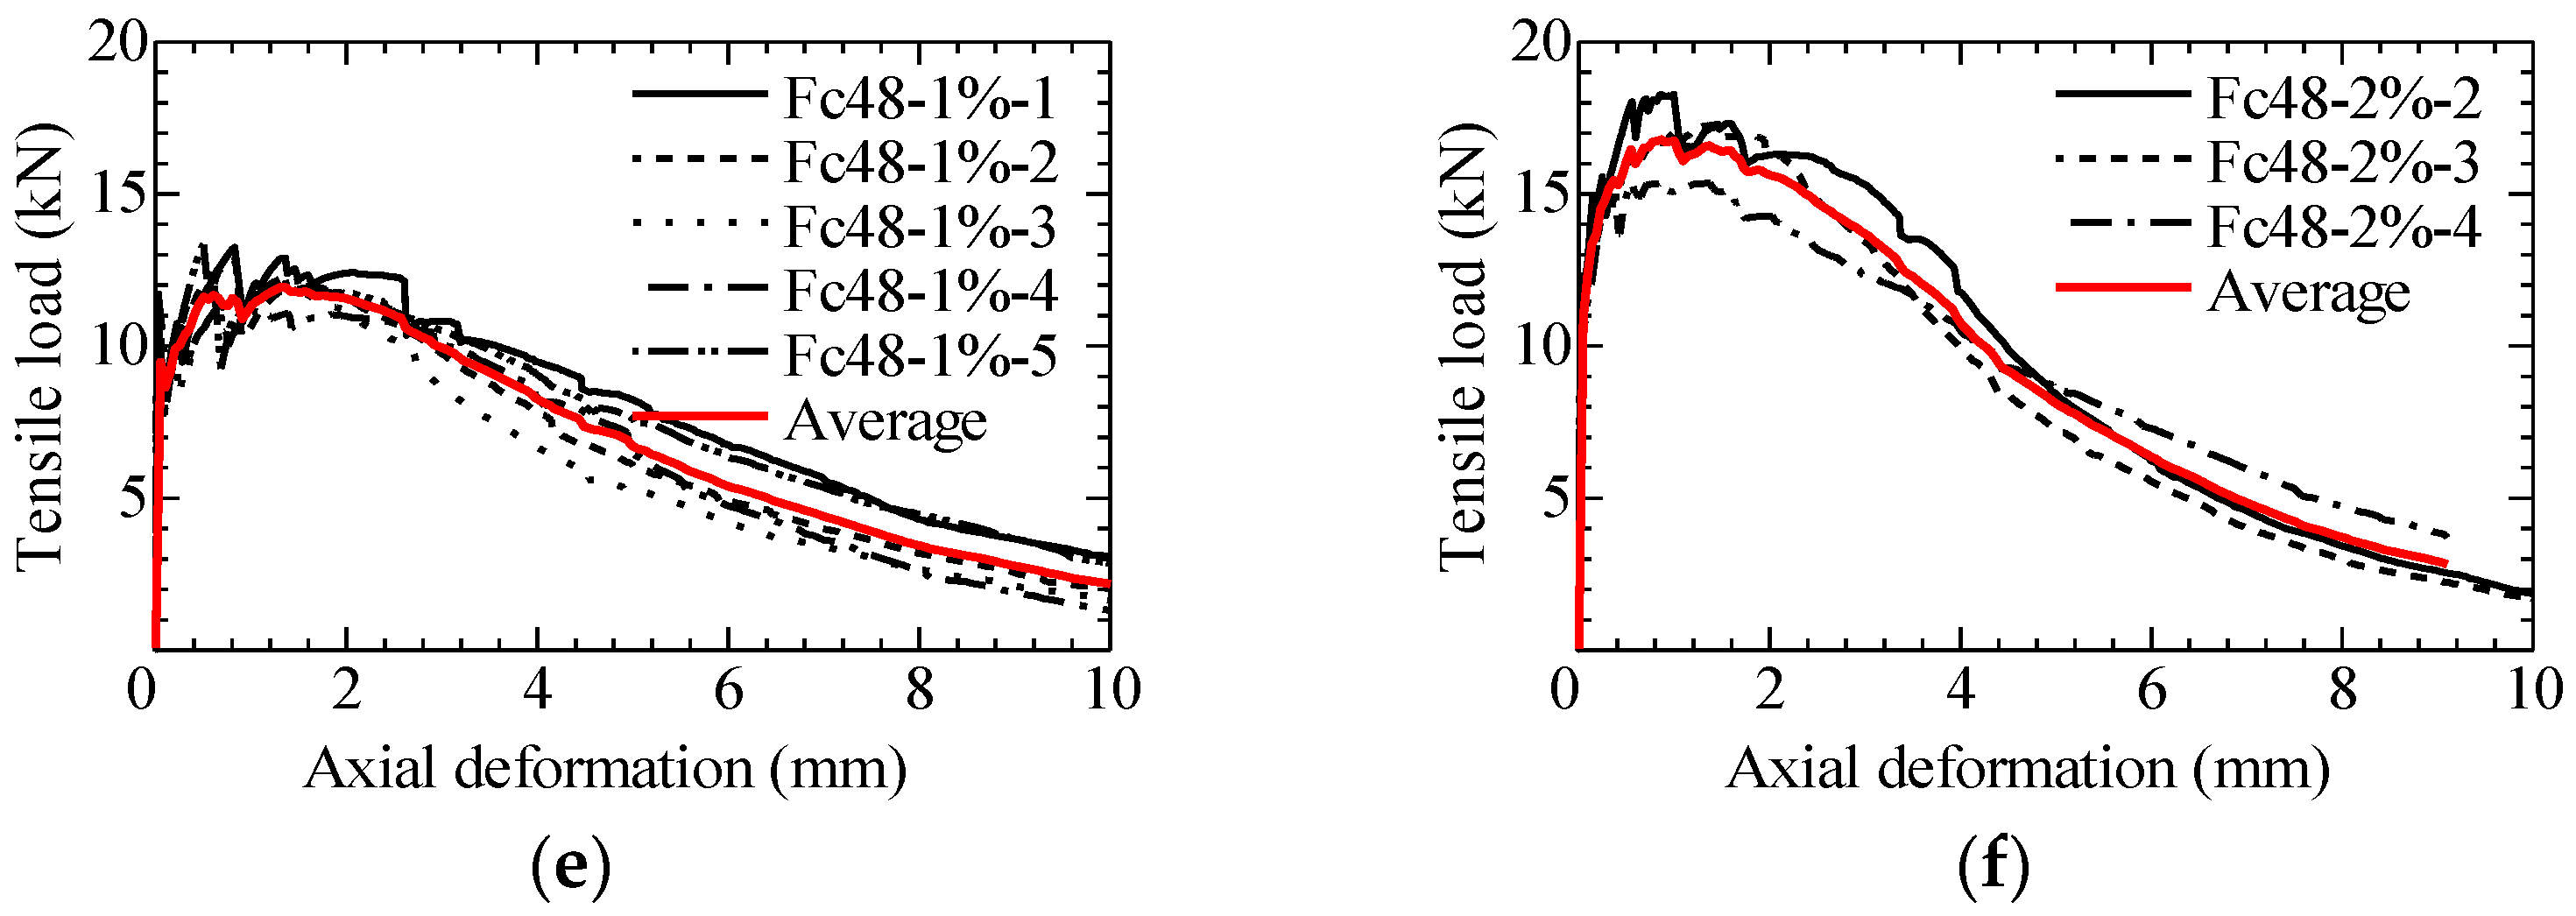
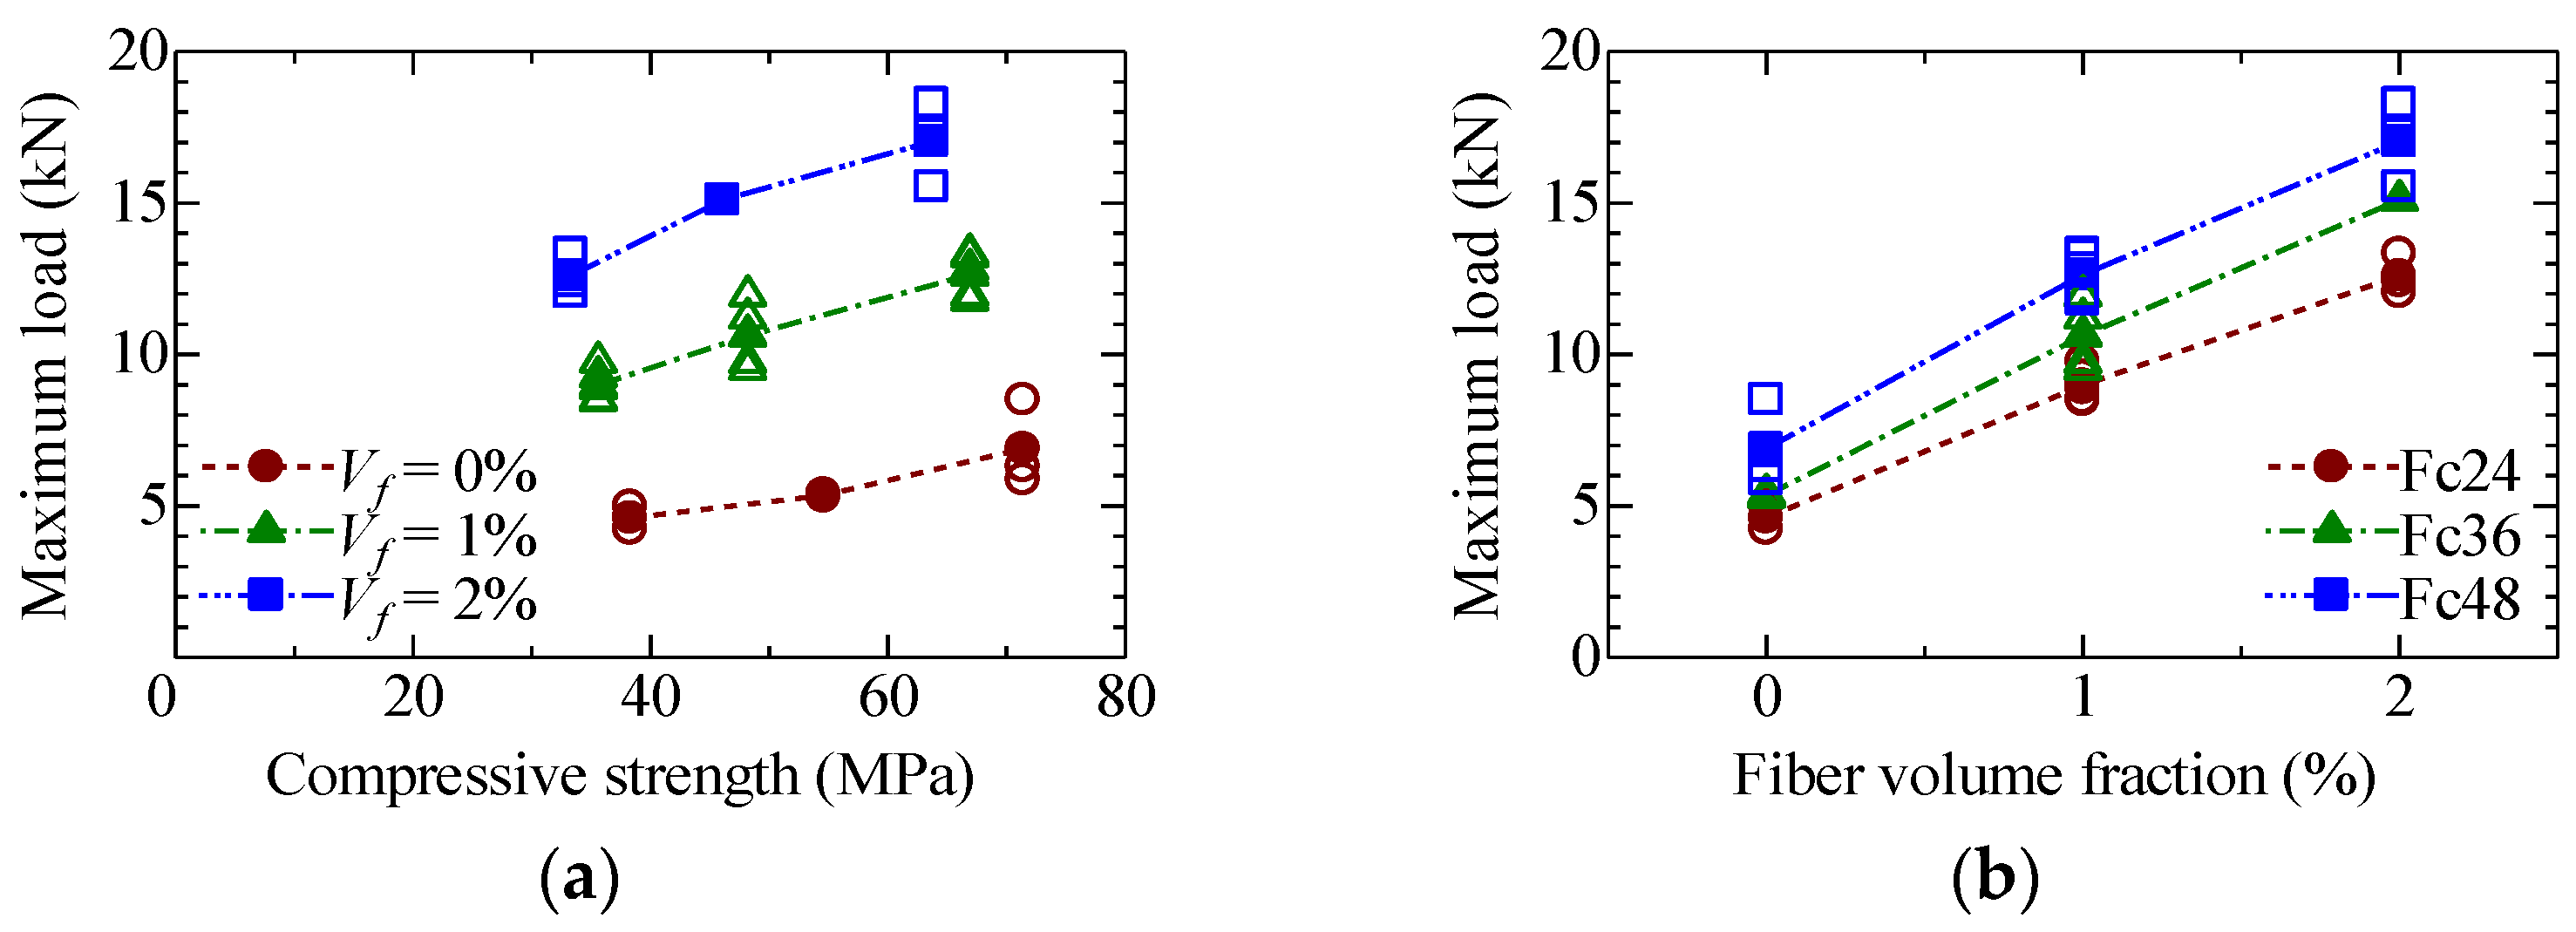
3.4. Tensile Load vs. Axial Deformation Relatioonship
4. Pullout Test of Individual Fiber
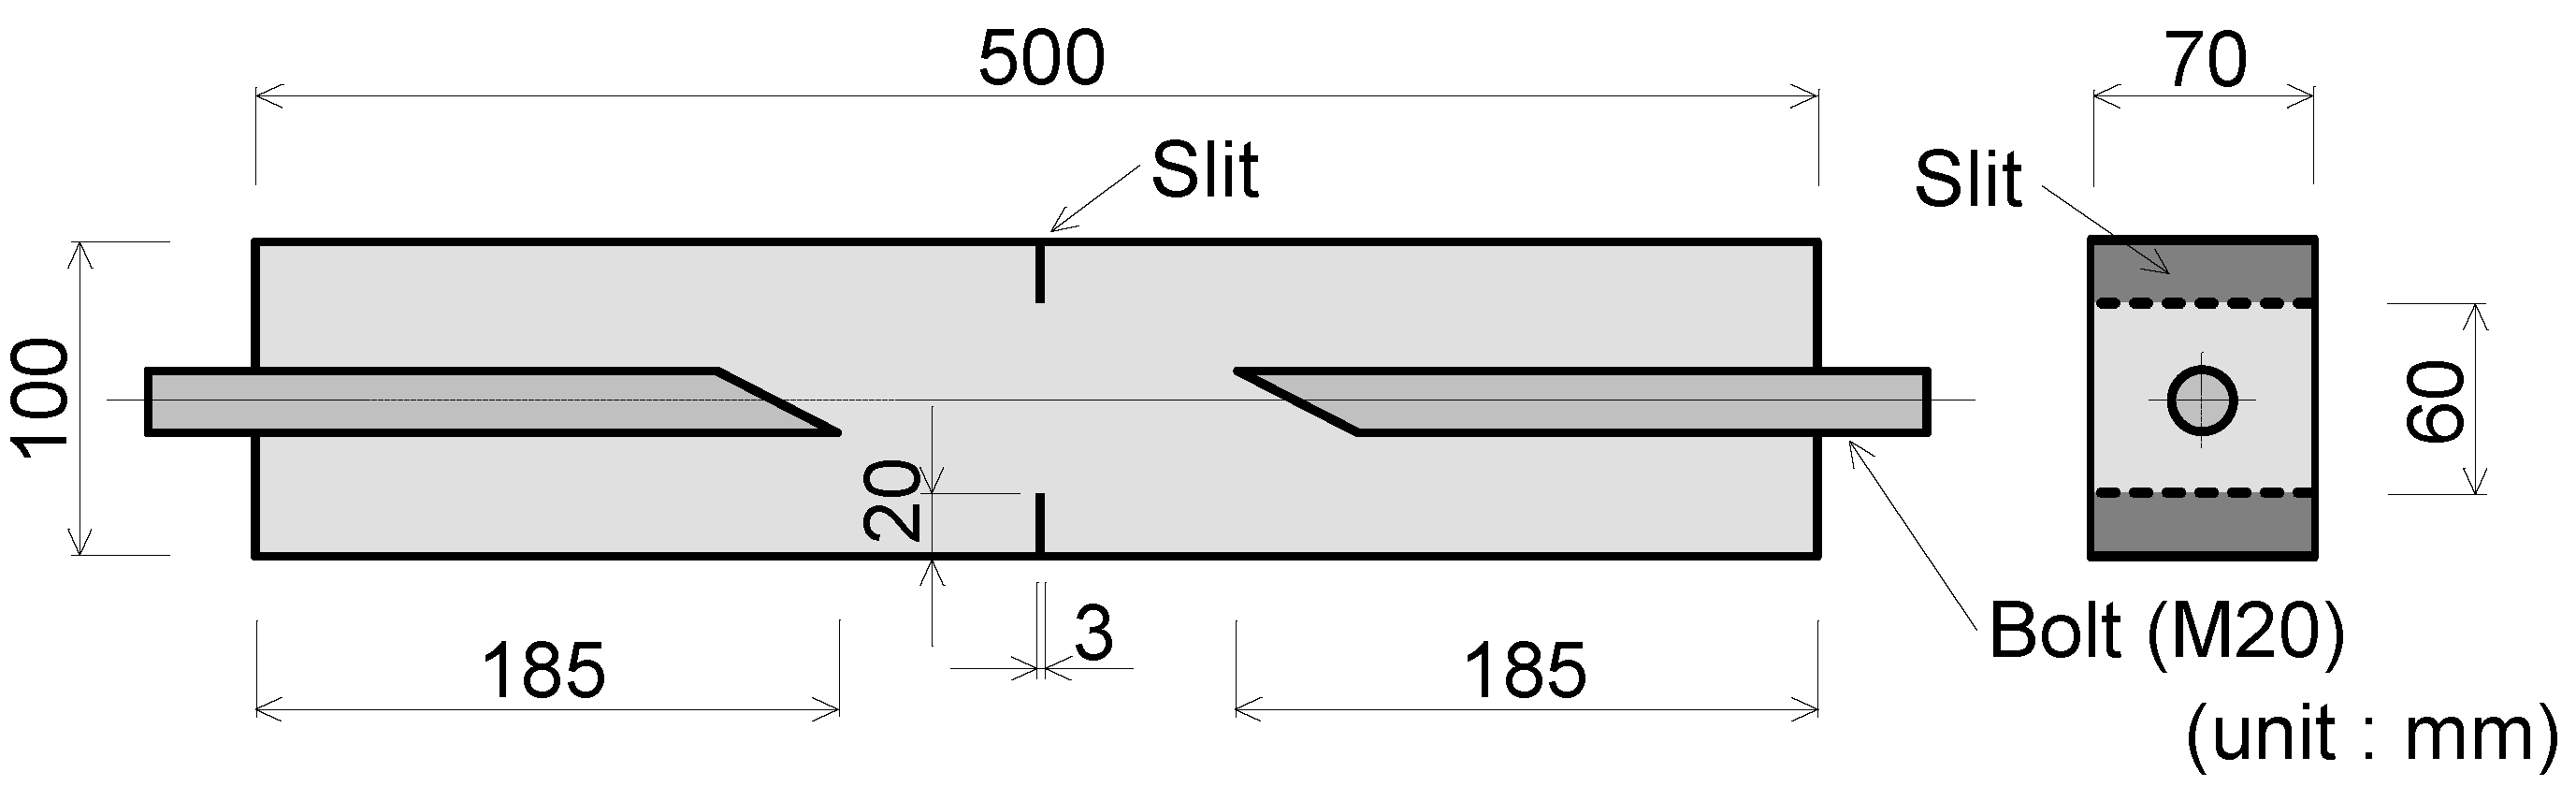
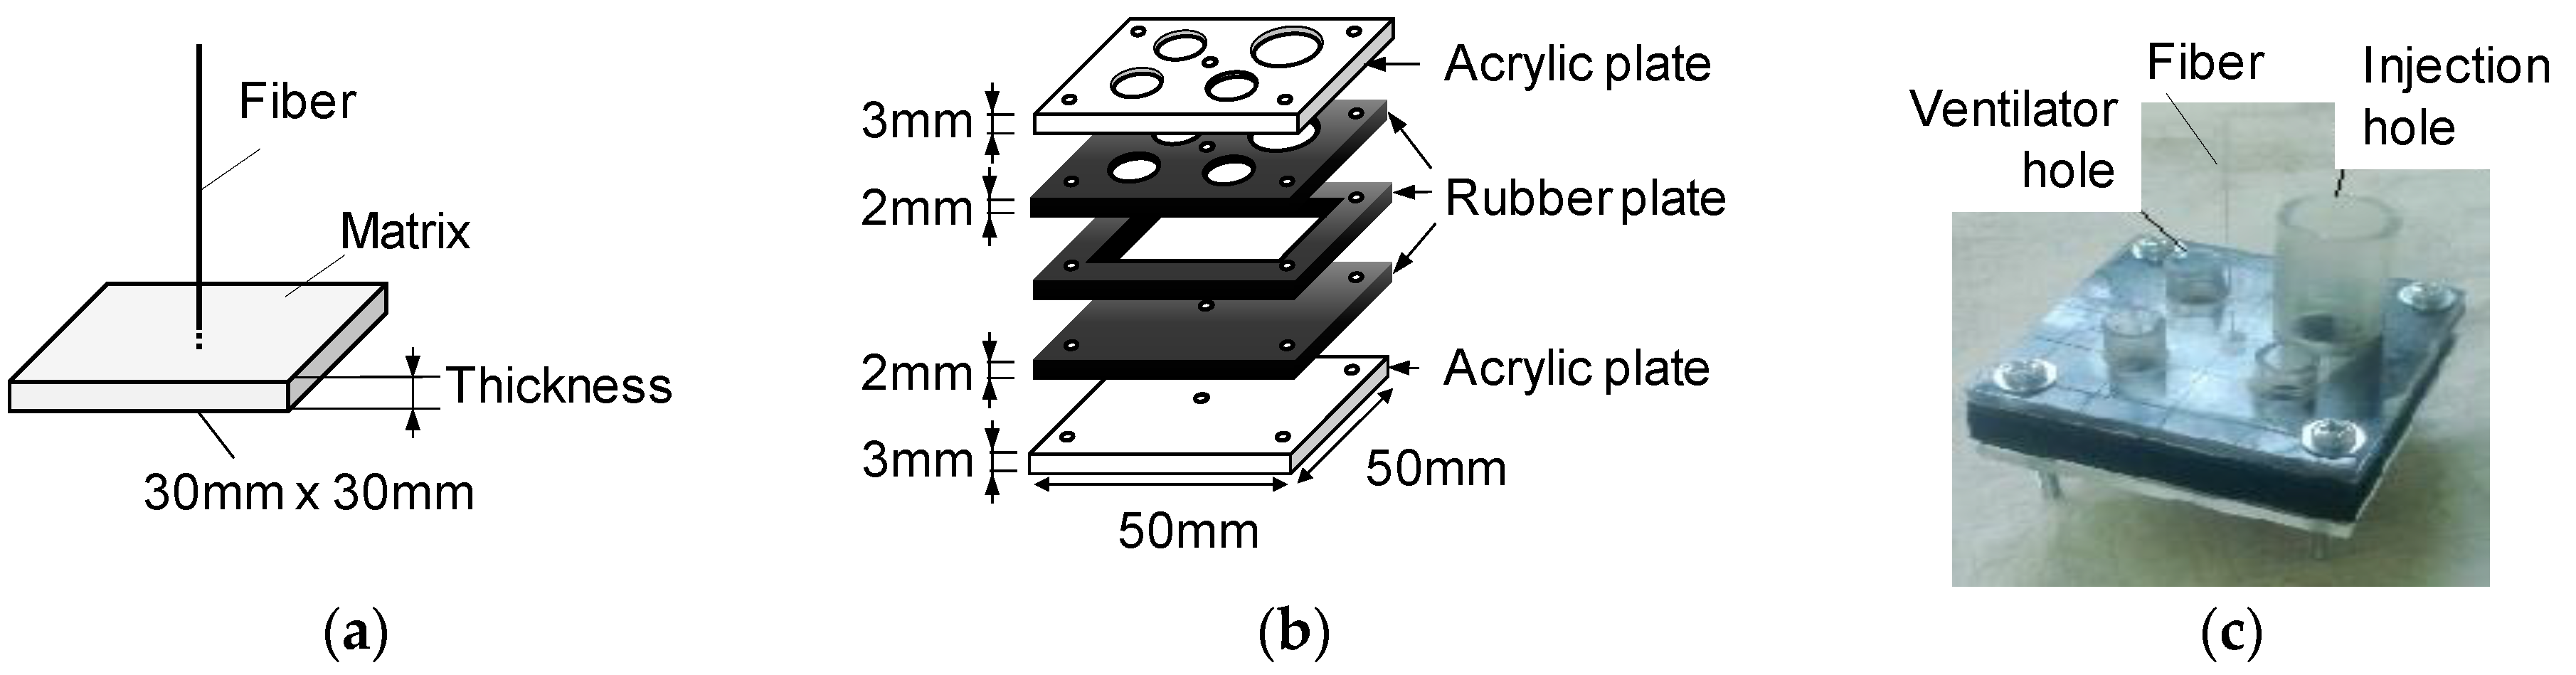
4.1. Specimens
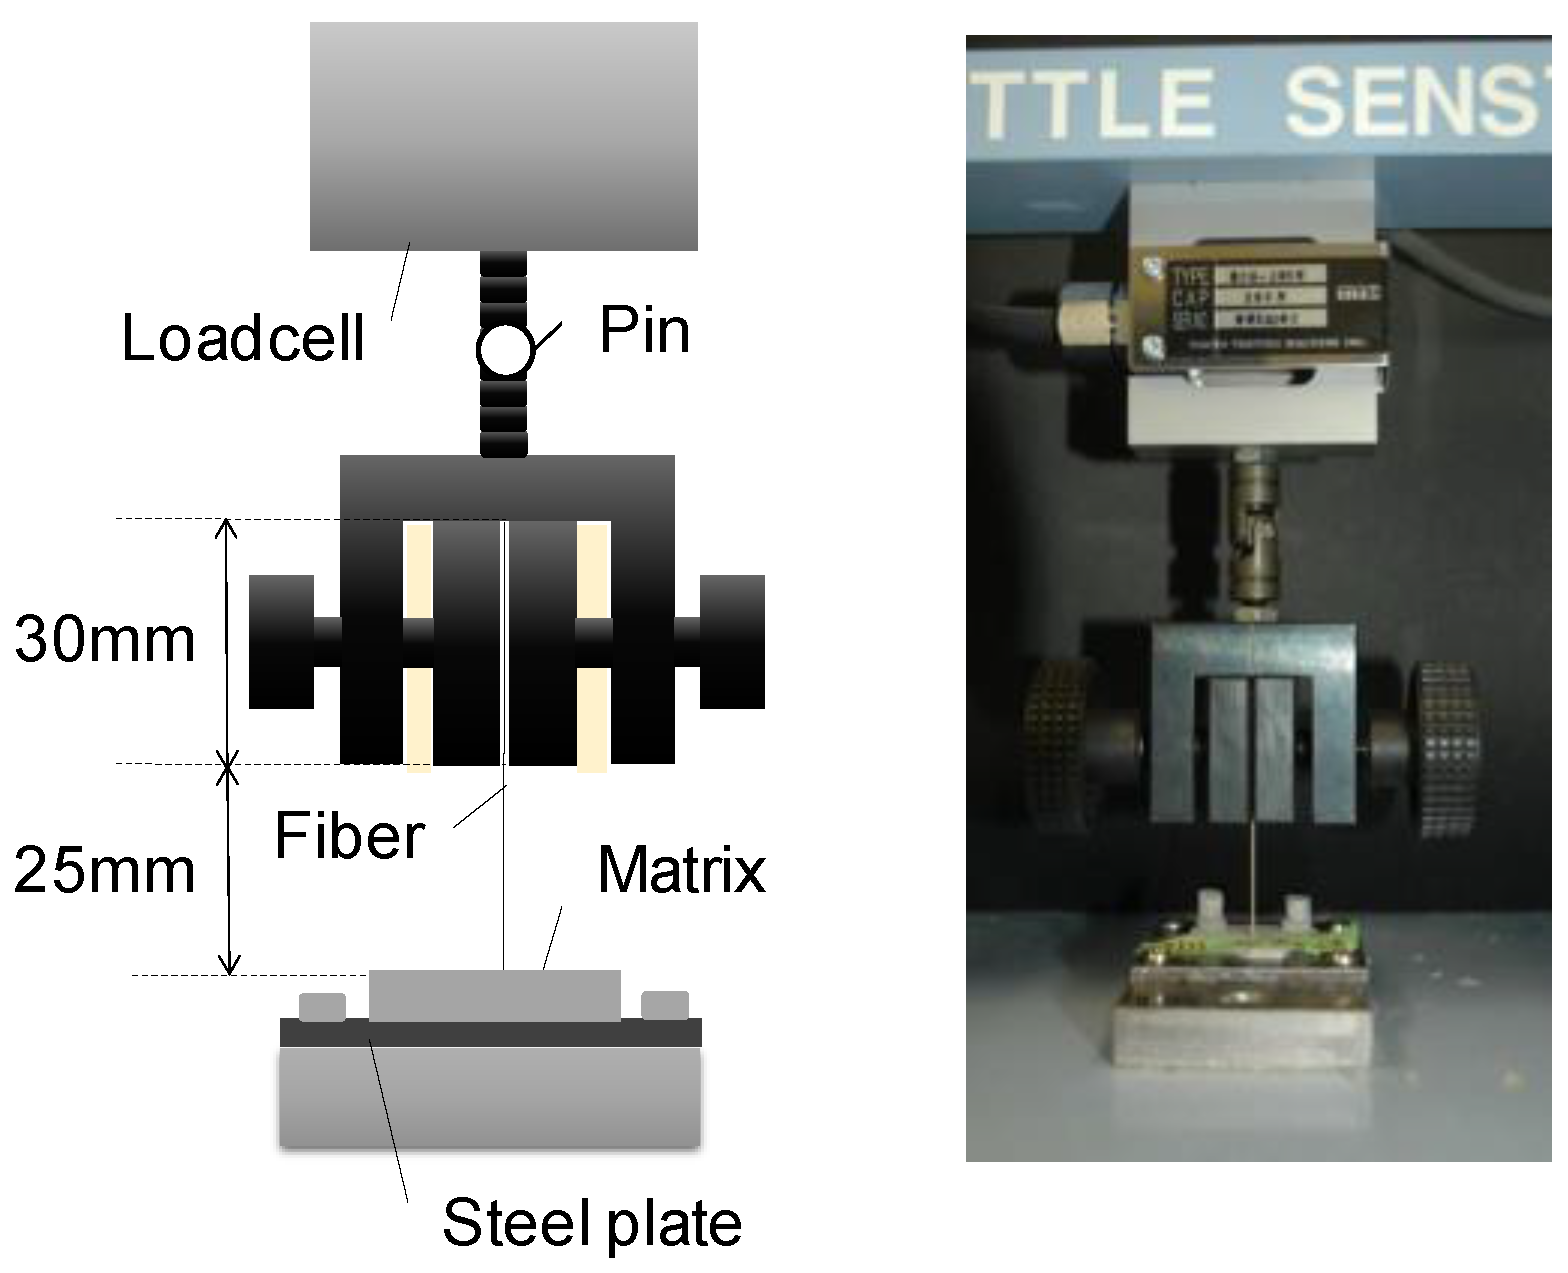
4.2. Loading and Measurement
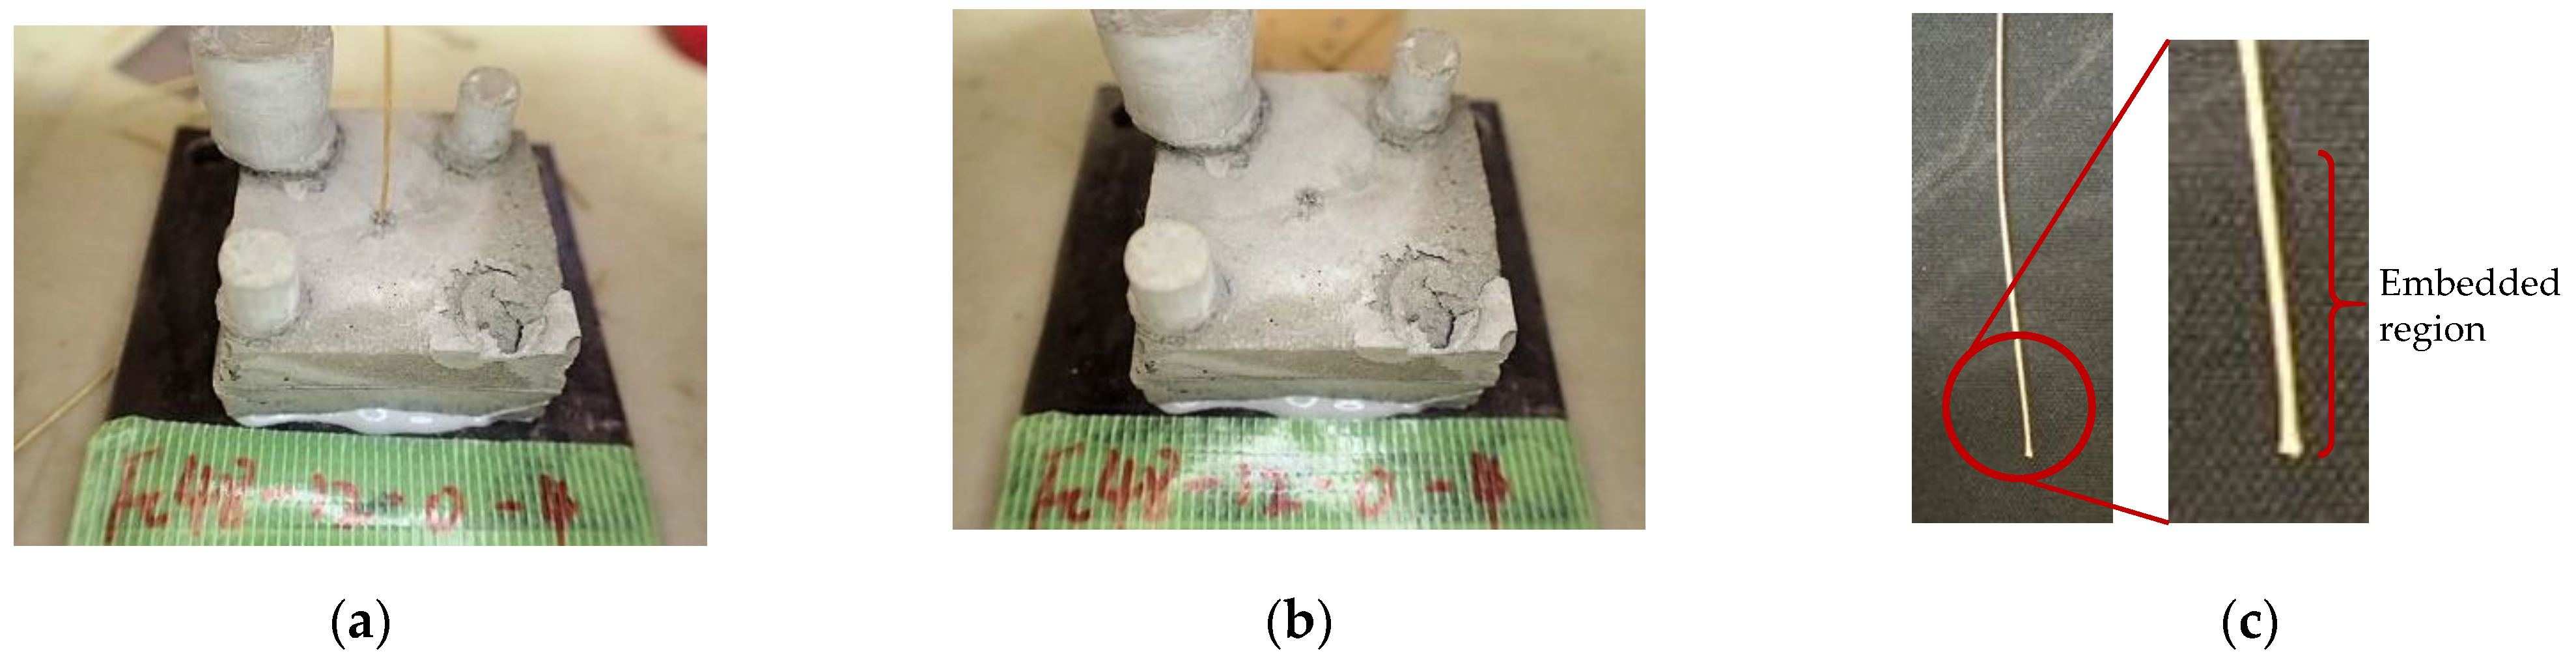
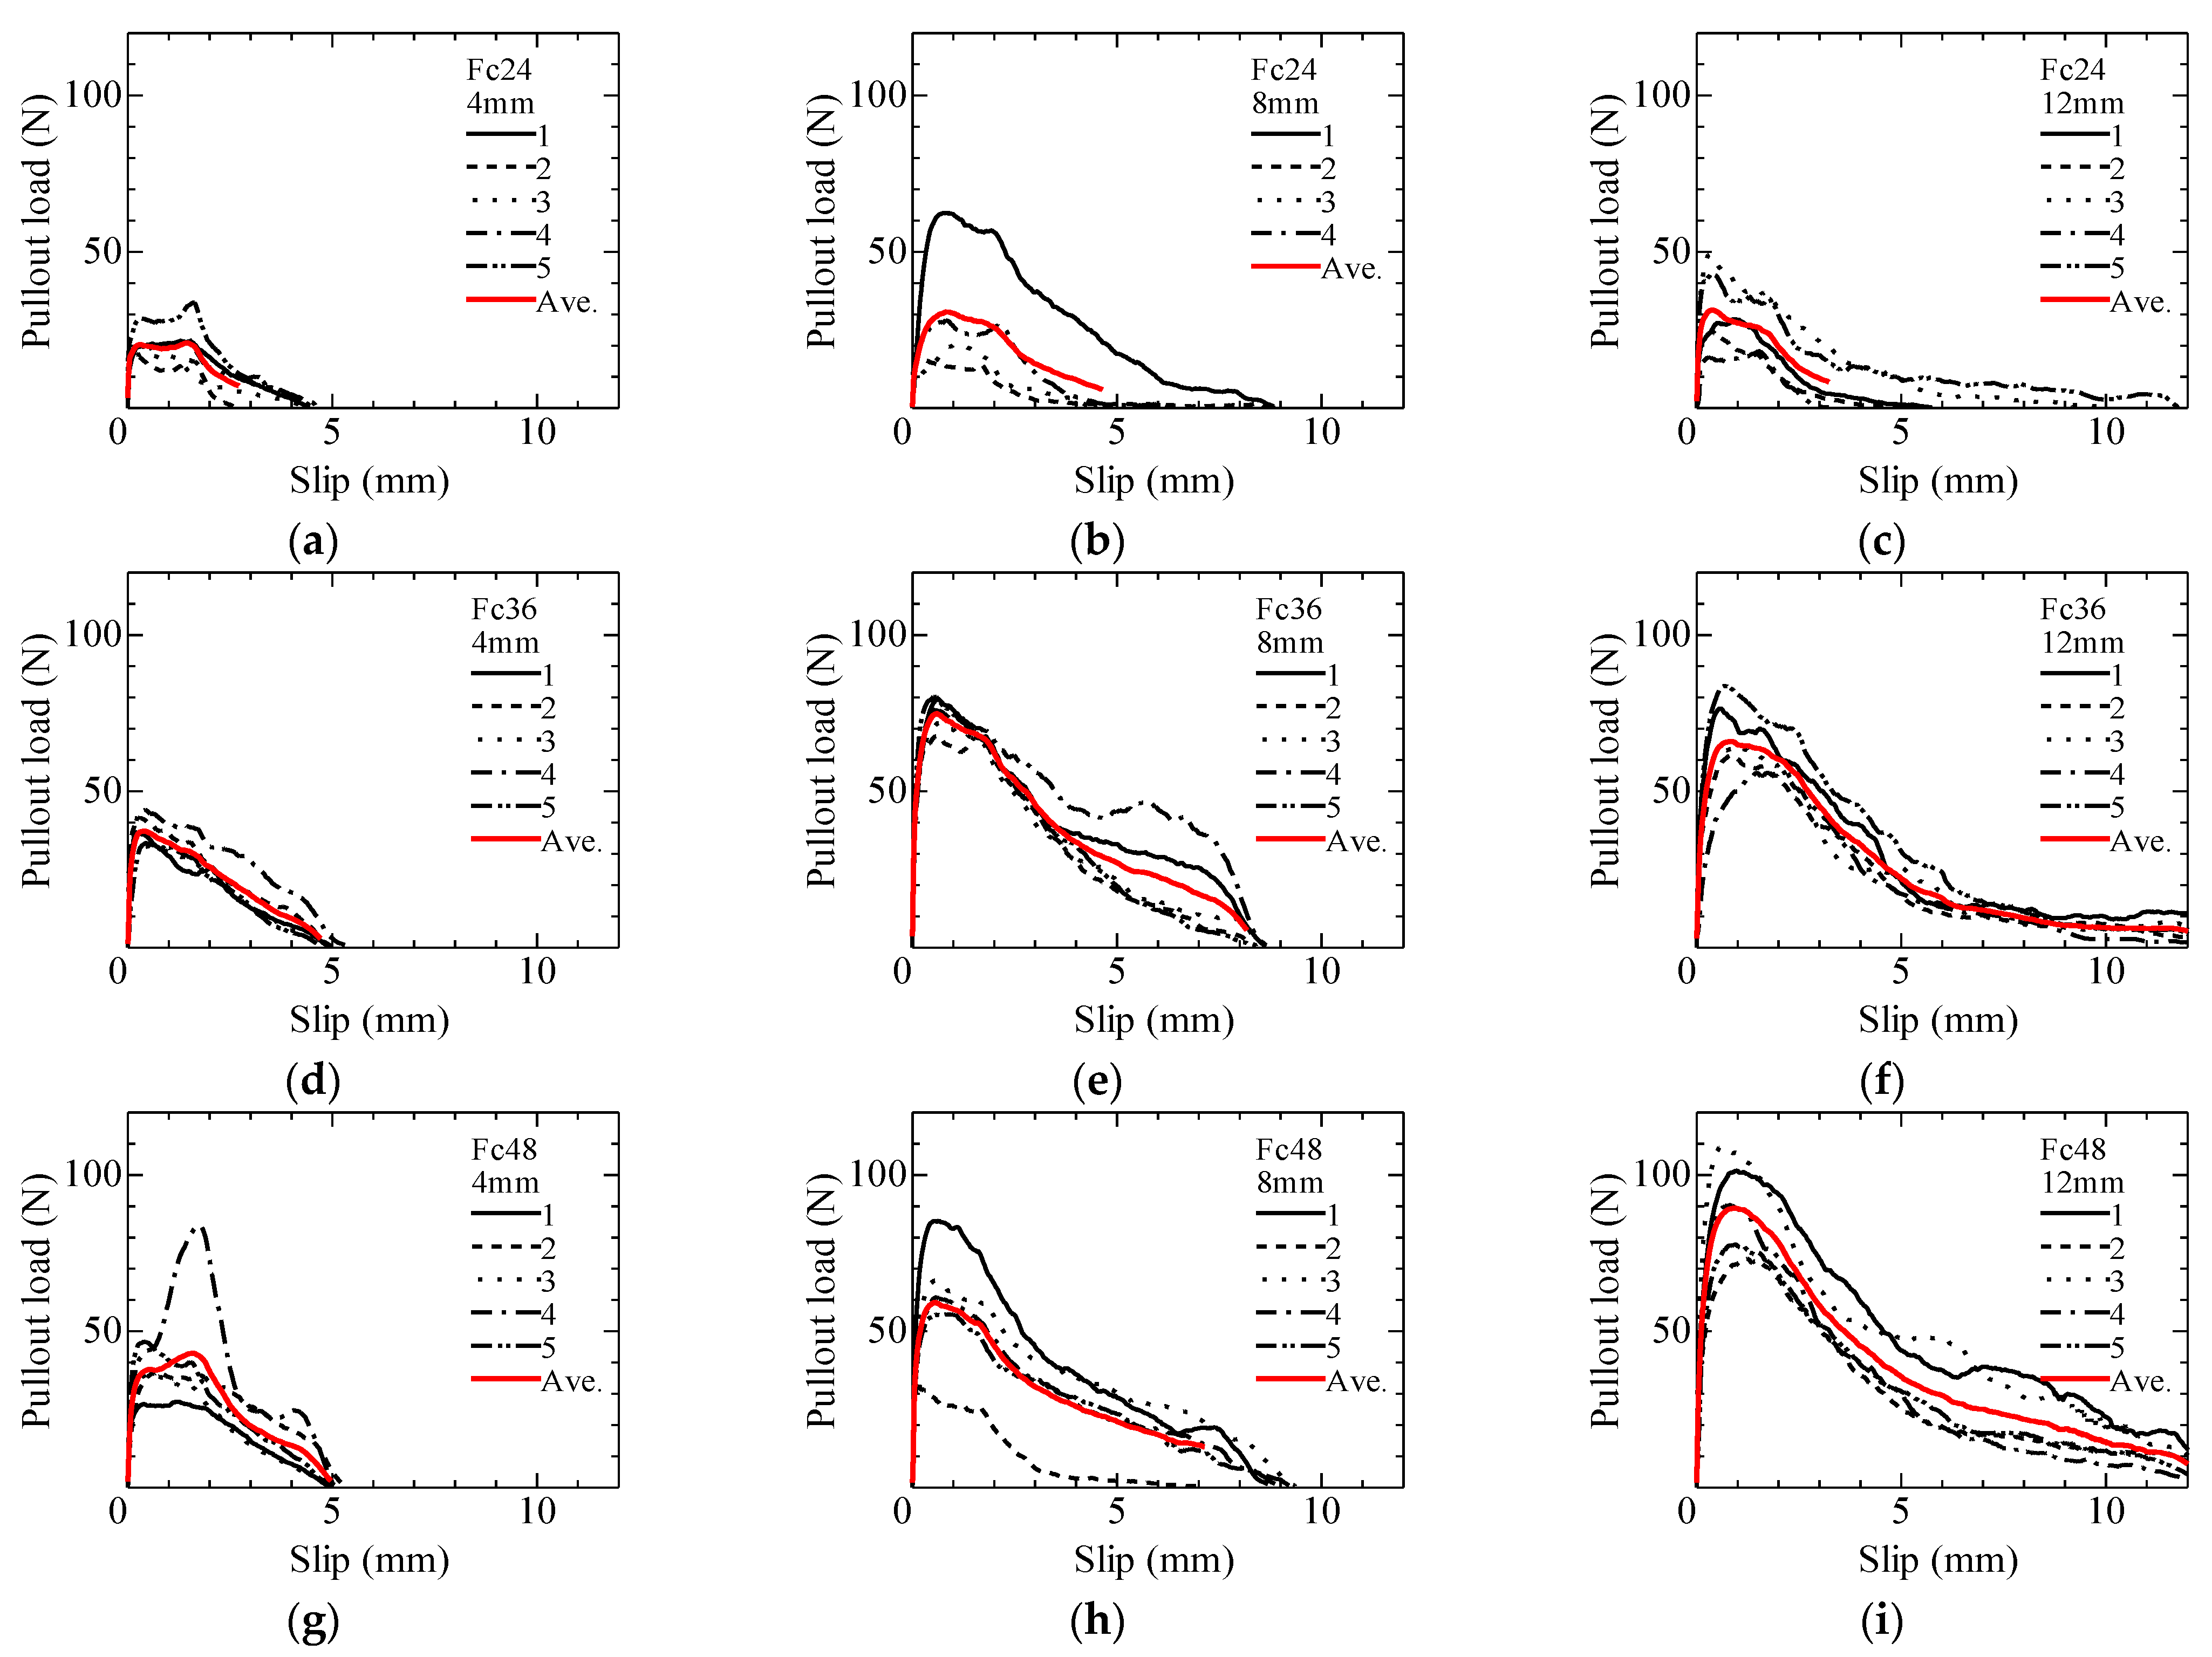
4.3. Failure Pattern and Pullout Load vs. Slip Relationship
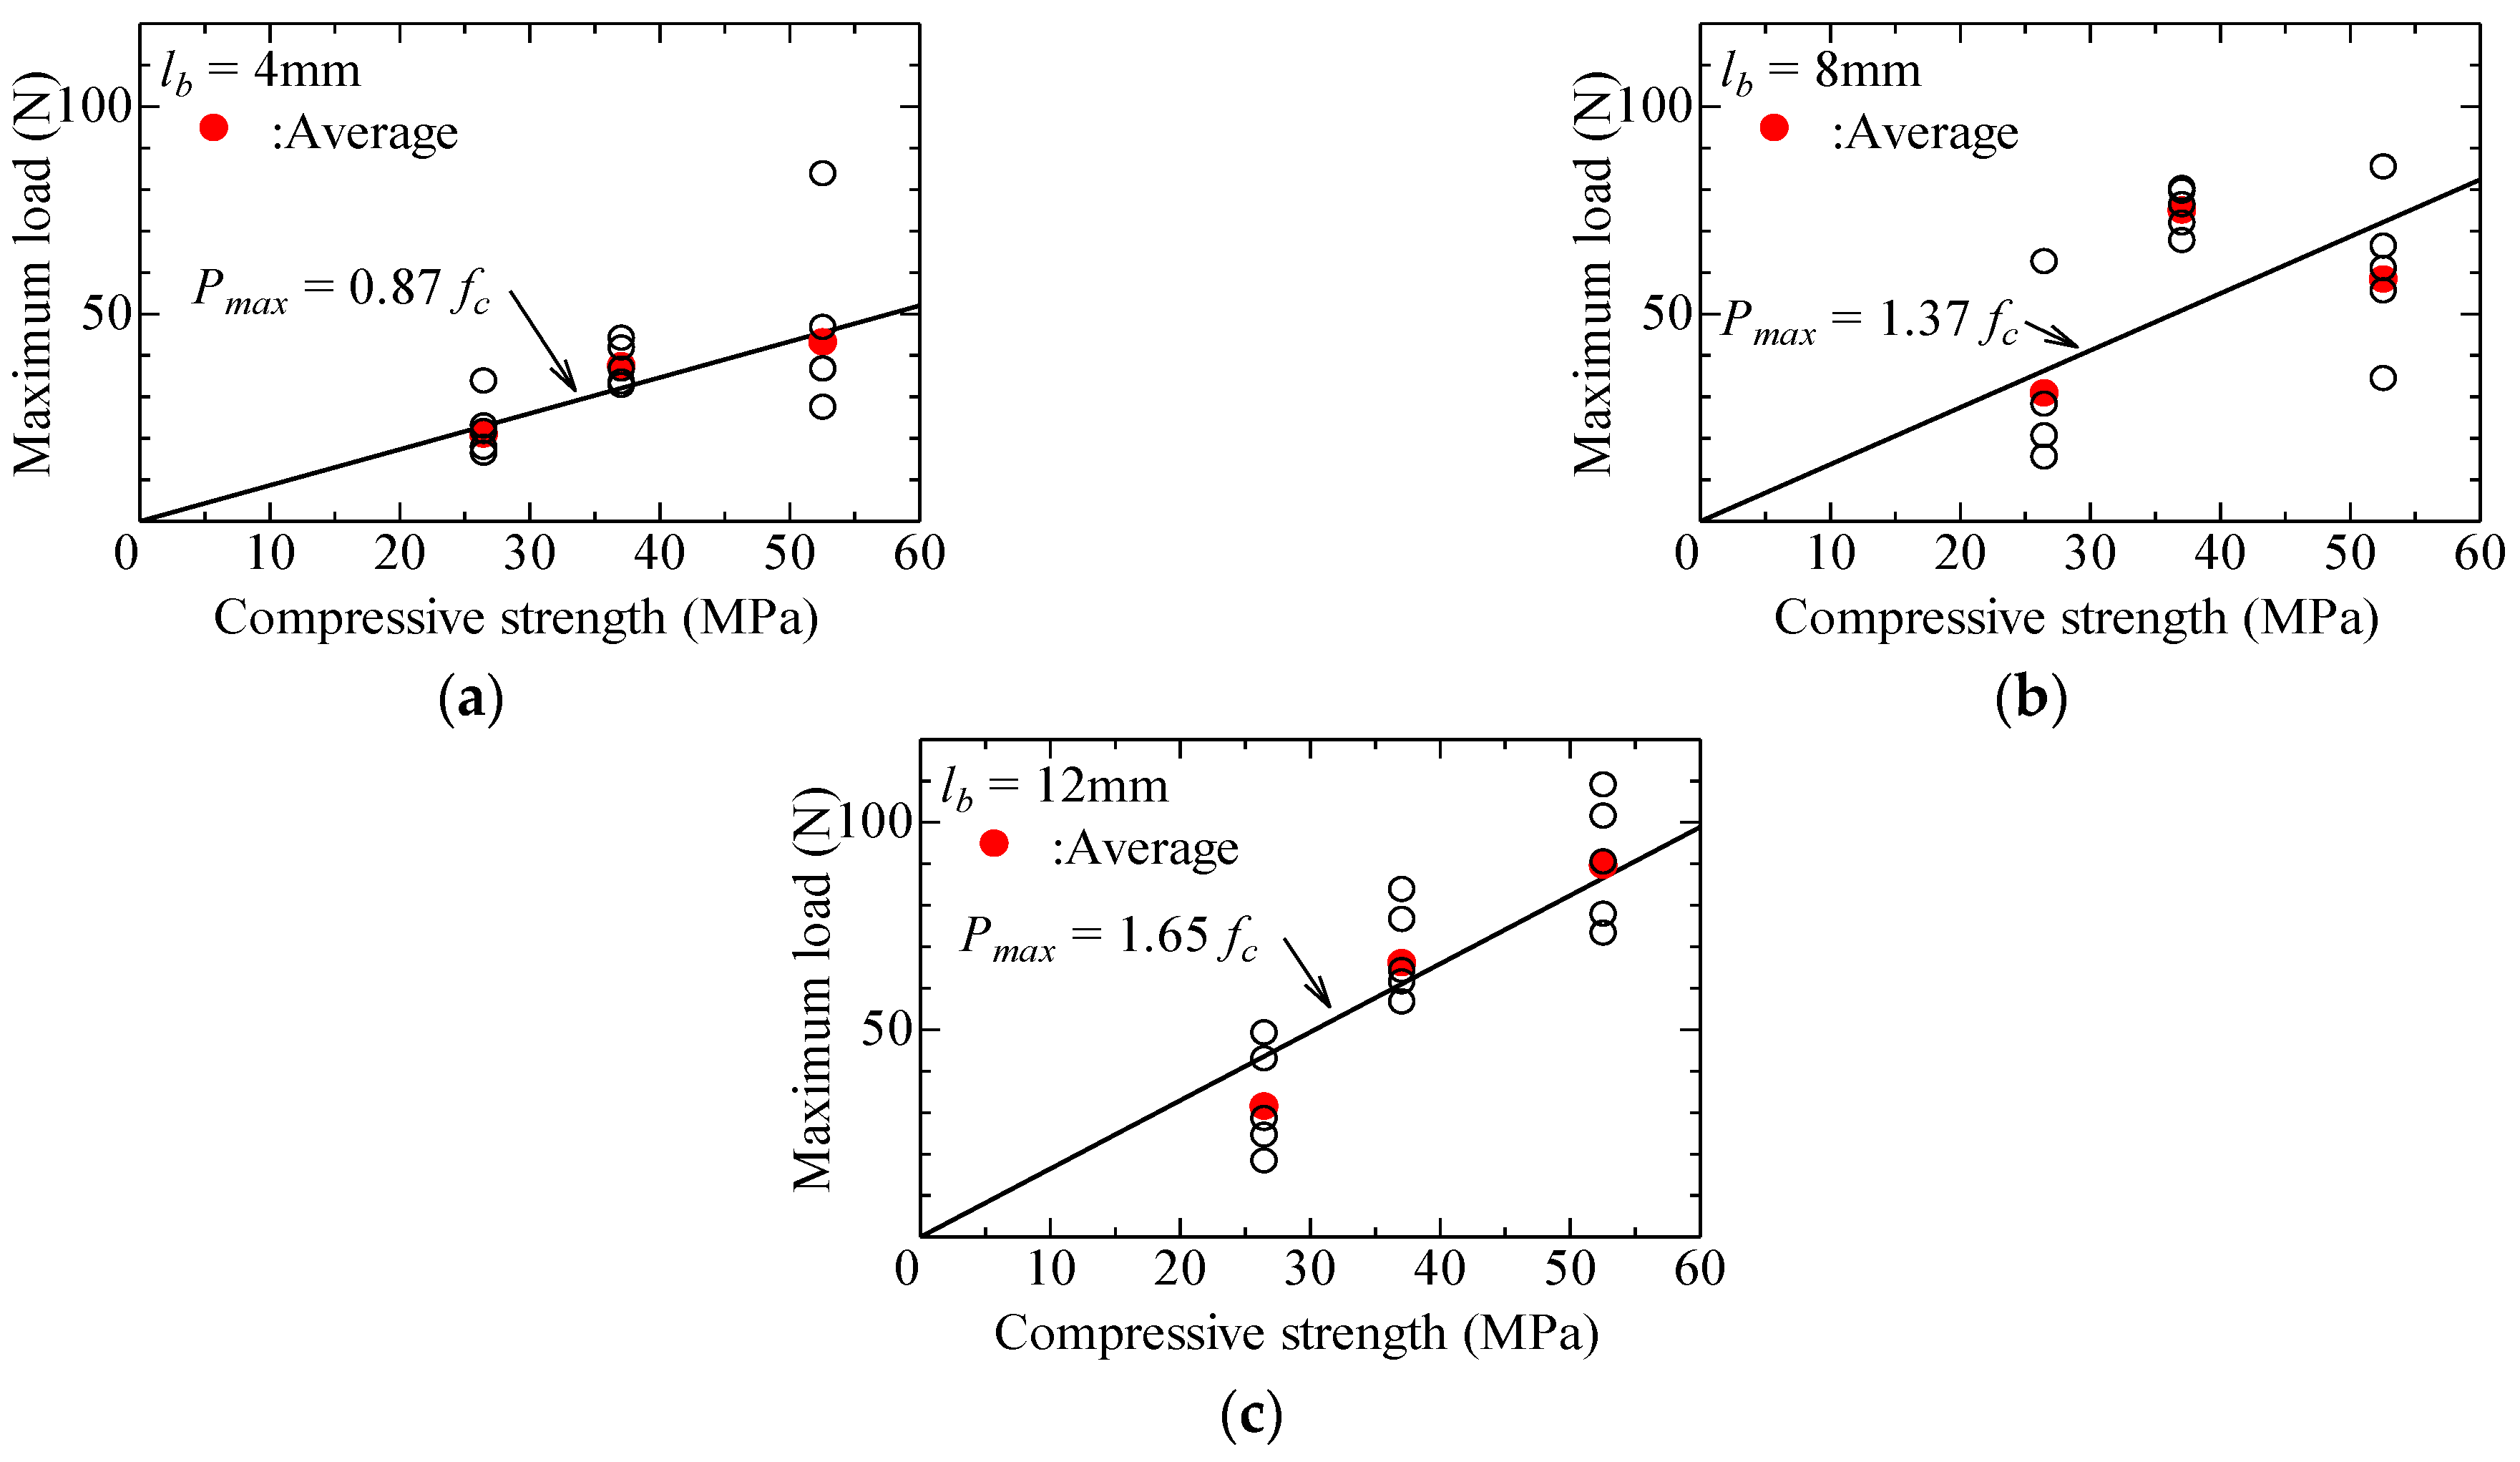
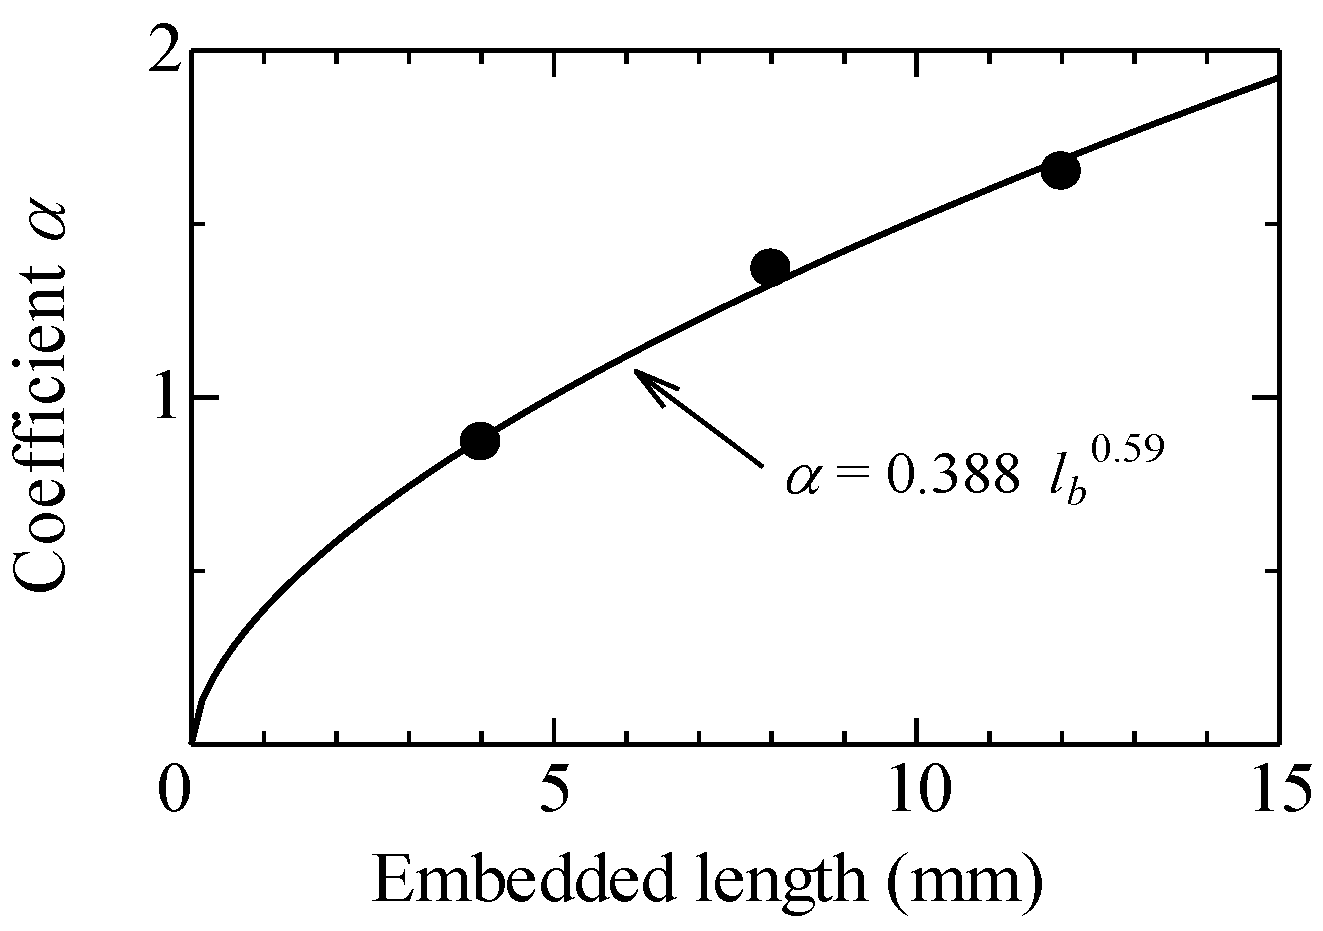
4.4. Evaluation of Maximum Pullout Load
5. Calculation of Bridging Law and Comparison with Test Results
5.1. Calculation Method of Bridging Law
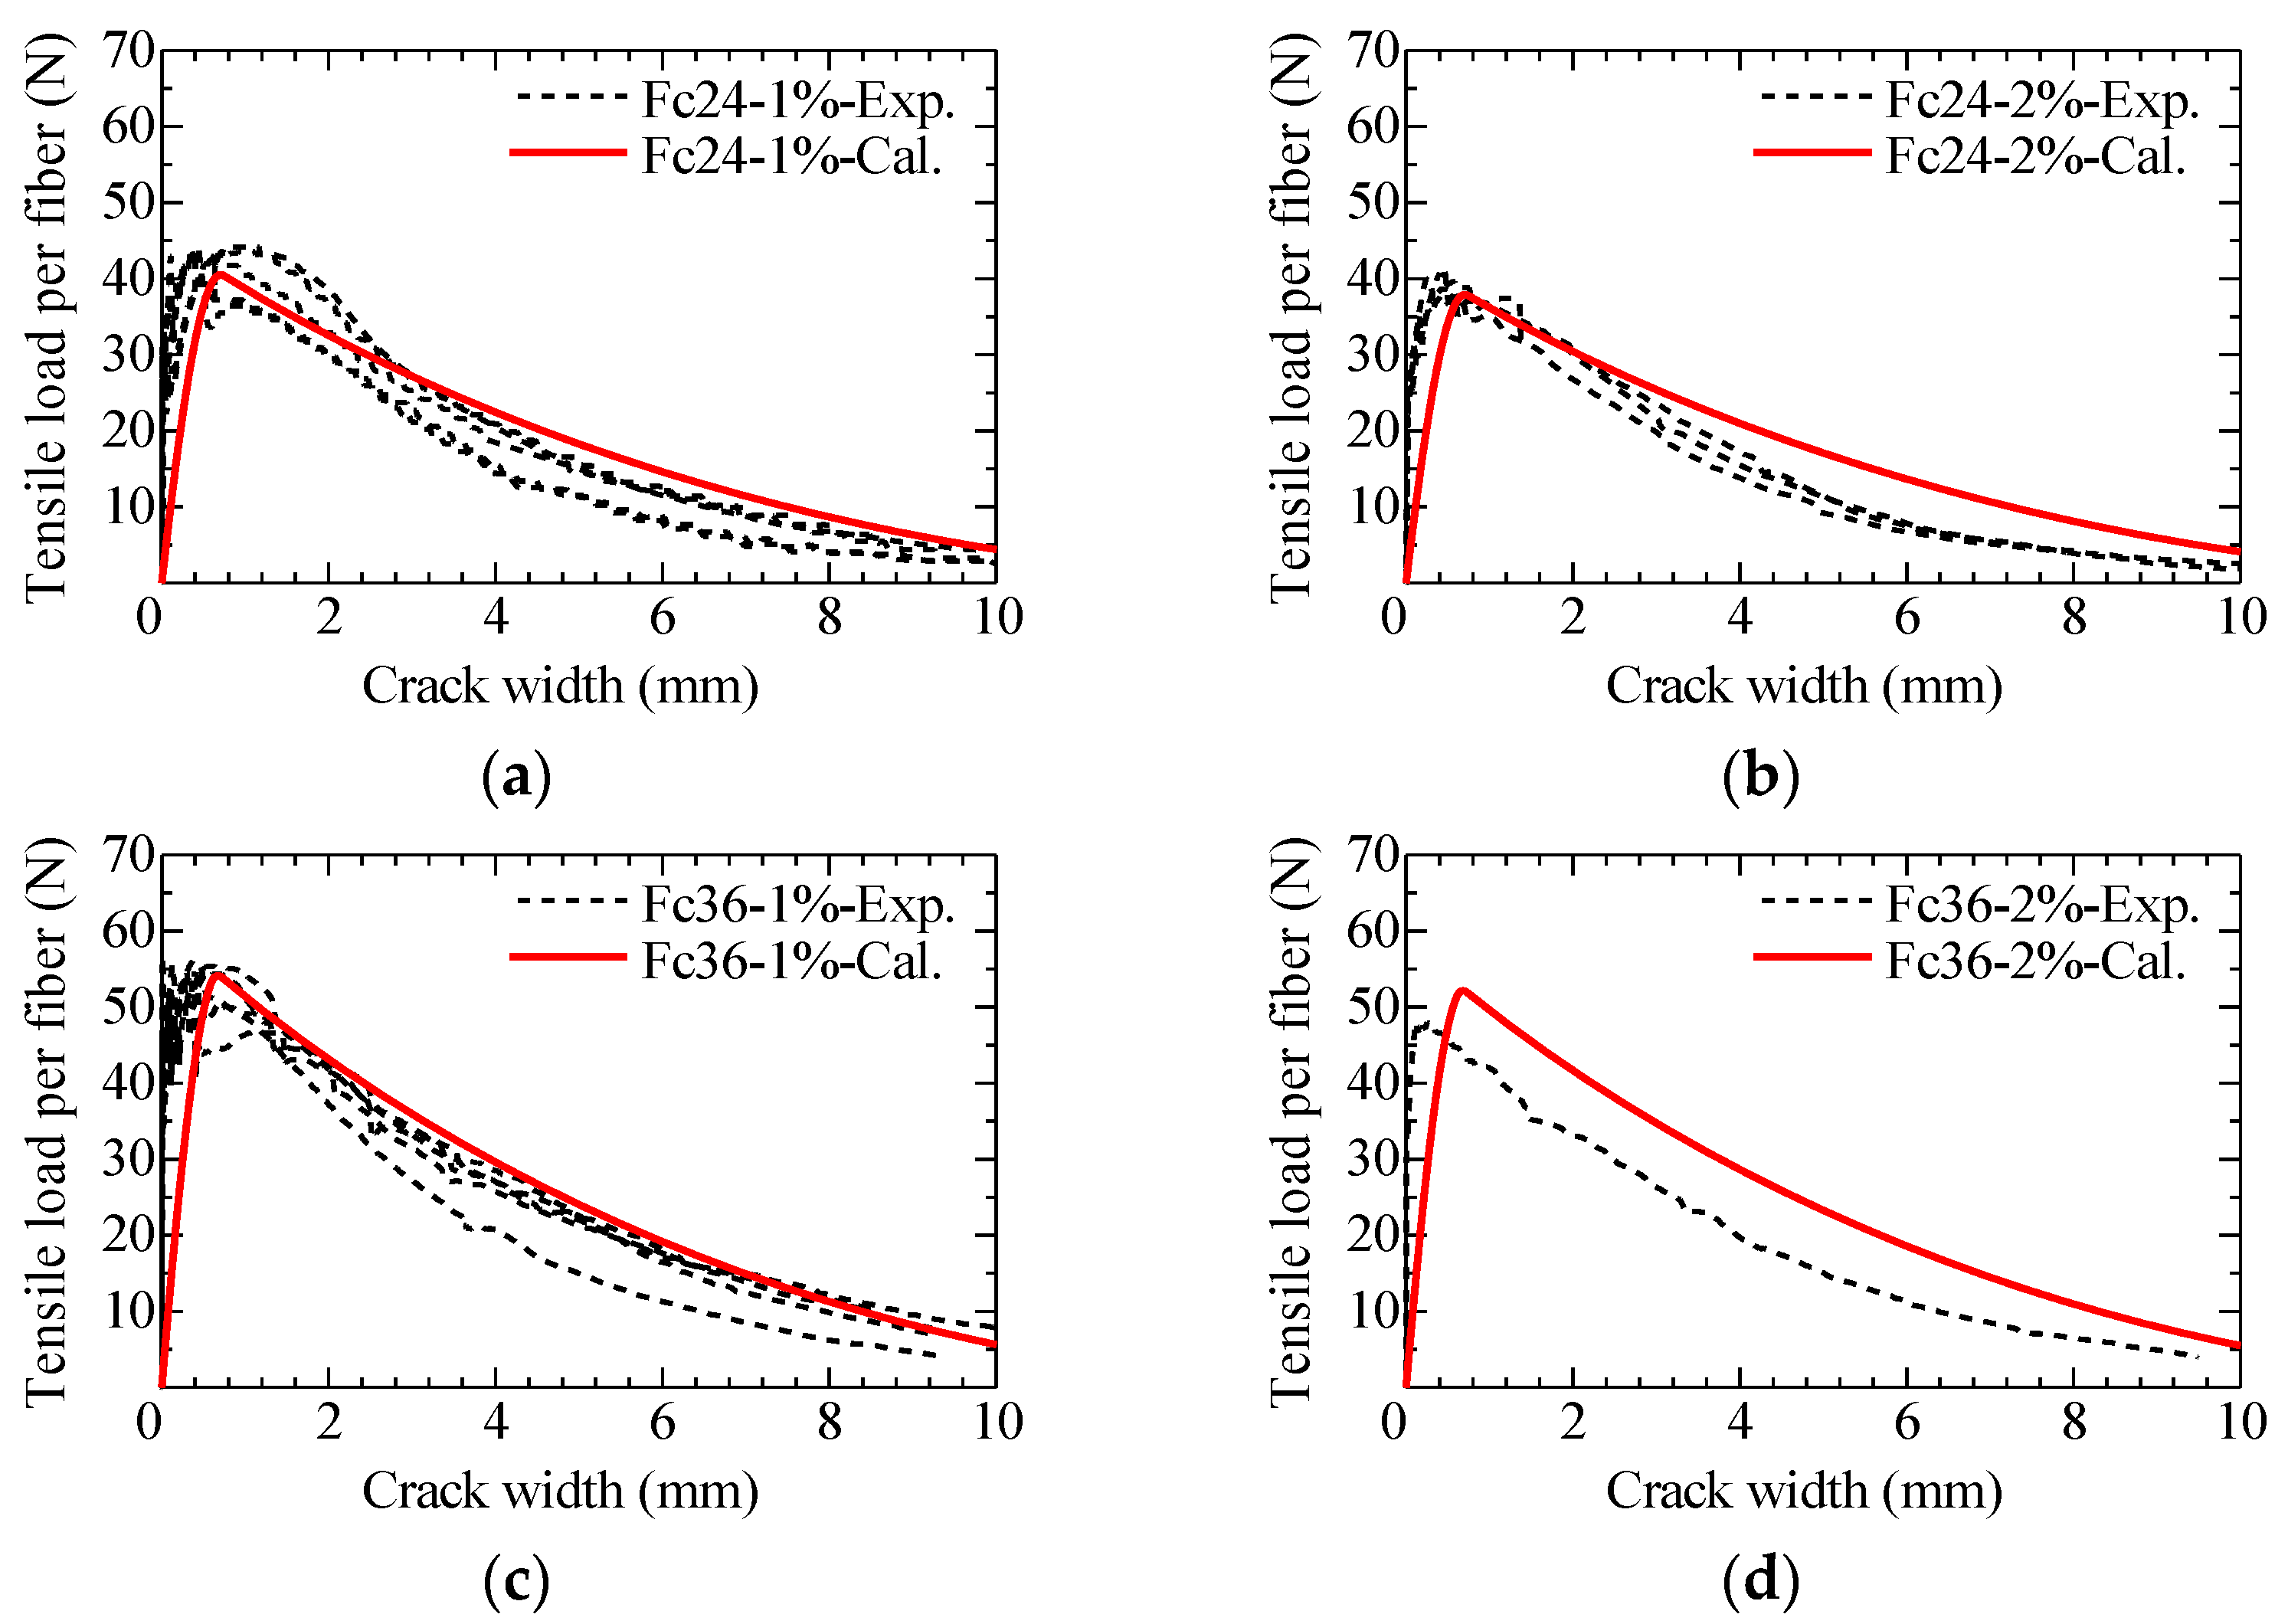
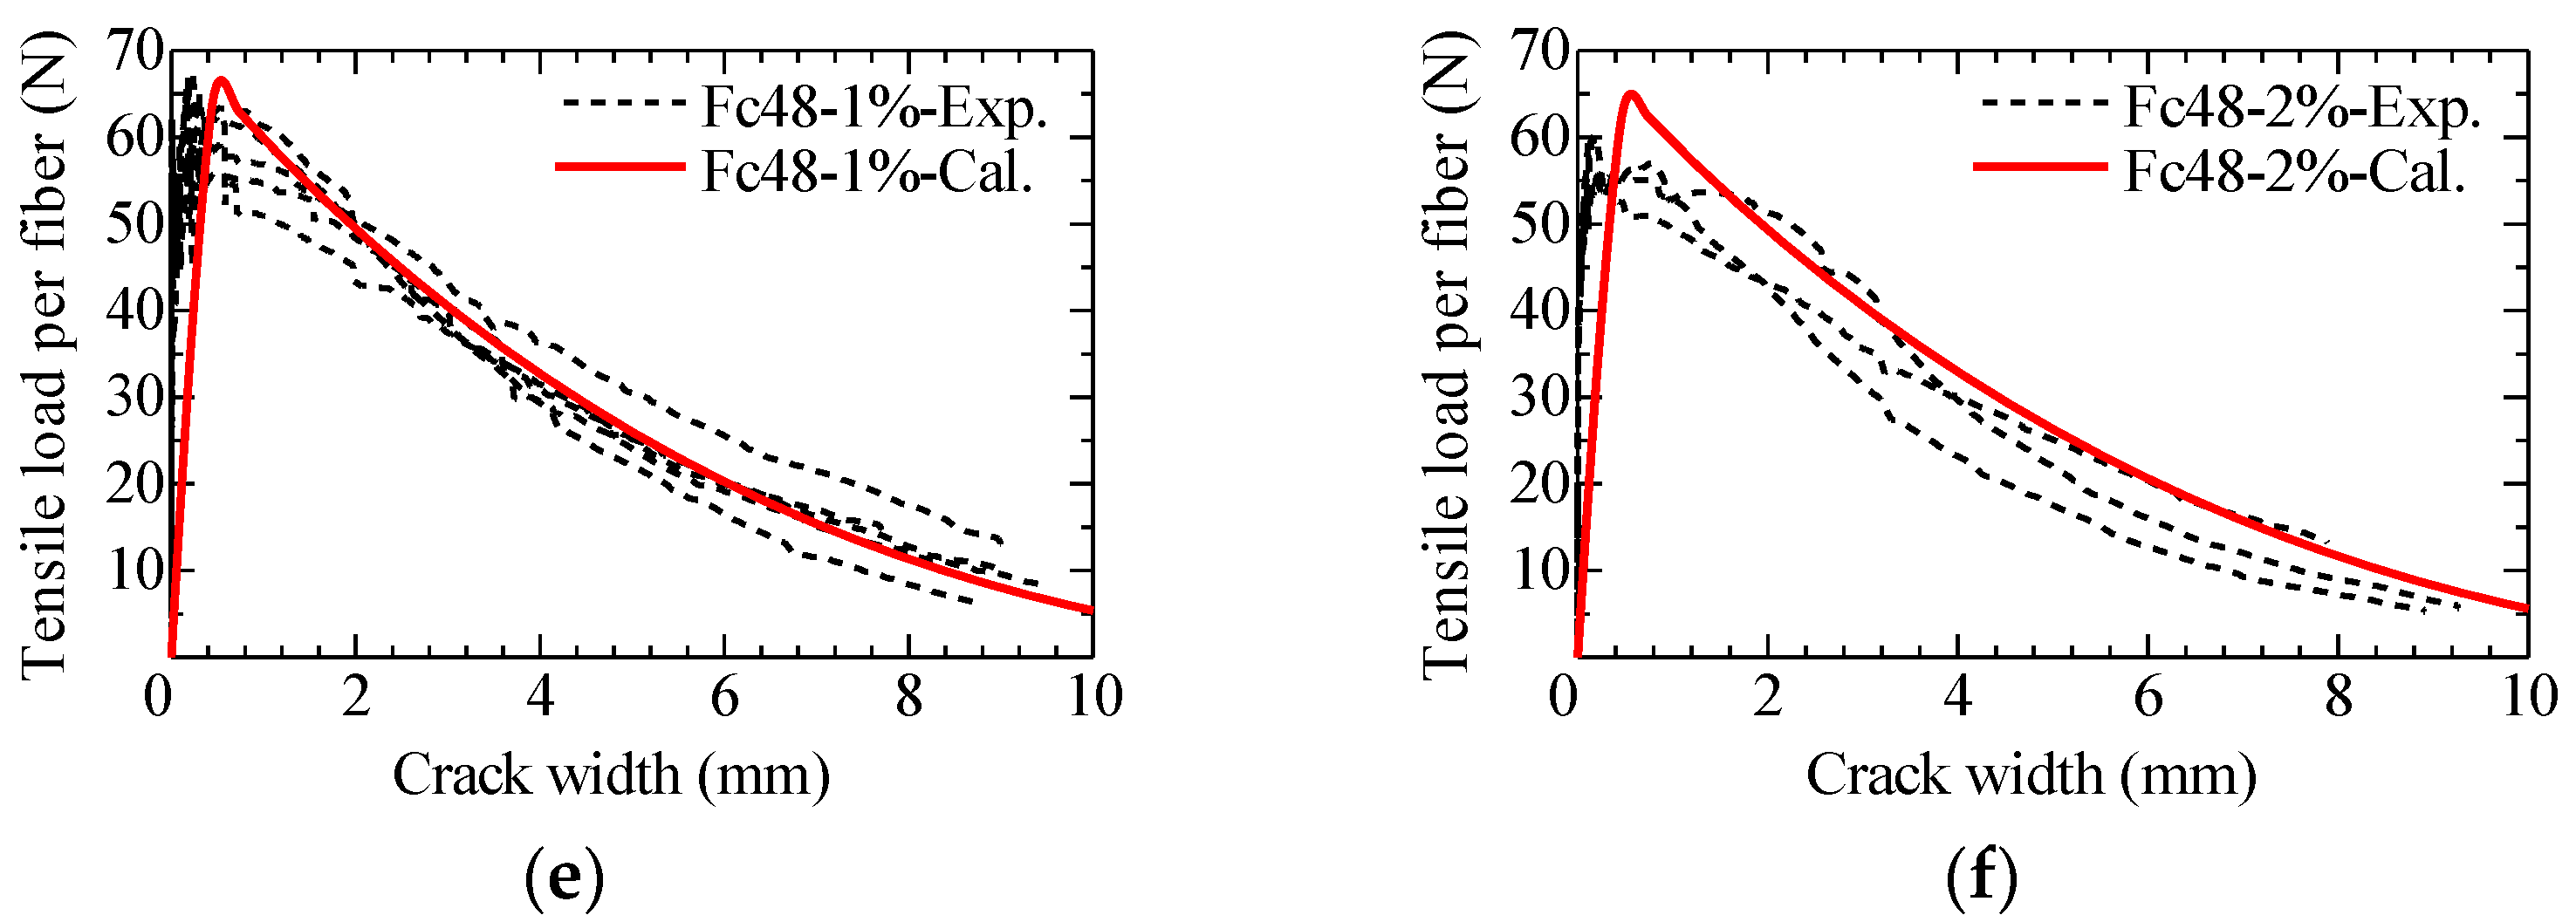
5.2. Comparison of Calculation Result with Uniaxial Tension Test Result
6. Conclusions
Author Contributions
Funding
Data Availability Statement
Conflicts of Interest
References
- Shah, S.P.; Kuder, K.G.; Mu, B. Fiber-reinforced cement-based composites: A forty year odyssey. In Proceedings of the 6th RILEM Symposium on Fiber-Reinforced Concretes (FRC), Varenna-Lecco, Italy, 20 September 2004; di Prosco, M., Felicetti, R., Plizzari, G.A., Eds.; RILEM Publications S.A.R.L.: Paris, France, 2004; pp. 3–30. [Google Scholar]
- Aldea, C.M.; Shah, S.P. Durability Enhancements of Cracked Concrete by Fibers. In Durability Enhancements in Concrete with Fiber Reinforcement; ACI SP-276; ACI: Farmington Hills, MI, USA, 2011; pp. 3.1–3.14. [Google Scholar]
- Rokugo, K.; Kanda, T. (Eds.) Strain Hardening Cement Composites: Structural Design and Performance; RILEM State-of-the-Art Reports 6; Springer: Berlin/Heidelberg, Germany, 2013; p. 90. [Google Scholar]
- Li, V.C. Engineered Cementitious Composites (ECC)—Bendable Concrete for Sustainable and Resilient Infrastructure; Springer: Berlin/Heidelberg, Germany, 2019; p. 419. [Google Scholar]
- Matsumoto, T.; Mihashi, H. JCI-DFRCC Summary Report on DFRCC Terminologies and Application Concepts. In Proceedings of the JCI International Workshop on Ductile Fiber Reinforced Cementitious Composites (DFRCC), Takayama, Japan, 21–22 October 2002; pp. 59–66. [Google Scholar]
- An Outstanding Para-Aramid Combining Unique Properties. Available online: https://www.teijinaramid.com/wp-content/uploads/2018/10/Product-brochure-Technora.pdf (accessed on 23 March 2022).
- Fiber Sheets for Repairing and Reinforcing Concrete, One Direction Aramid Fiber Sheet. Available online: https://eng.maedakosen.jp/products/583/ (accessed on 23 March 2022).
- Cho, Y.S.; Jang, H.S.; Back, S.K.; Choi, M.I.; Hong, S.U.; Lee, Y.T. Evaluation of Sustainable Structural Concrete Using Recycled Aggregate and Aramid Fiber Sheet. Adv. Mater. Sci. Eng. 2016, 2016, 2721859. [Google Scholar] [CrossRef] [Green Version]
- Uchida, Y.; Takeyama, T.; Dei, T. Ultra high strength fiber reinforced concrete using aramid fiber. In Proceedings of the 7th International Conference on Fracture Mechanics of Concrete and Concrete Structures, Jeju, Korea, 23–28 May 2010; pp. 1492–1497. [Google Scholar]
- Pitcha, J.; Chung, N.T.; Ganchai, T.; Linh, V.H.B. Mechanical properties of aramid fiber-reinforced composites and performance on repairing concrete beams damaged by corrosion. Songklanakarin J. Sci. Technol. 2020, 42, 637–644. [Google Scholar]
- Kiyota, M.; Mihashi, H.; Kanda, T.; Kawamata, A. Study on Bond Characteristics of Fibers in Cementitious Composites. In Proceedings of the Japan Concrete Institute, Sapporo, Hokkaido, Japan, 27–30 August 2001; Volume 23, pp. 187–192. [Google Scholar]
- Kanda, T.; Li, V.C. Interface Property and Apparent Strength of High-Strength Hydrophilic Fiber in Cement Matrix. J. Mater. Civ. Eng. 1998, 10, 5–13. [Google Scholar] [CrossRef] [Green Version]
- Redon, C.; Li, V.C.; Wu, C.; Hoshiro, H.; Saito, T.; Ogawa, A. Measuring and Modifying Interface Properties of PVA Fibers in ECC Matrix. J. Mater. Civ. Eng. 2001, 13, 399–406. [Google Scholar] [CrossRef]
- Blazy, J.; Blazy, R. Polypropylene fiber reinforced concrete and its application in creating architectural forms of public spaces. Case Stud. Constr. Mater. 2021, 14, e00549. [Google Scholar] [CrossRef]
- Shannag, M.; Brincker, R.; Hansen, W. Pullout behavior of steel fibers from cement-based composites. Cem. Concr. Res. 1997, 27, 925–936. [Google Scholar] [CrossRef]
- Wang, Y.; Li, V.C.; Backer, S. Analysis of Synthetic Fiber Pull-Out from a Cement Matrix. MRS Online Proc. Libr. 2011, 114, 159. [Google Scholar] [CrossRef] [Green Version]
- Kanakubo, T.; Echizen, S.; Wang, J.; Mu, Y. Pullout Behavior of Bundled Aramid Fiber in Fiber-Reinforced Cementitious Composite. Materials 2020, 13, 1746. [Google Scholar] [CrossRef] [PubMed] [Green Version]
- Wang, Y.; Backer, S.; Li, V.C. A statistical tensile model of fibre reinforced cementitious composites. Composites 1989, 20, 265–274. [Google Scholar] [CrossRef]
- Kanakubo, T.; Miyaguchi, M.; Asano, K. Influence of Fiber Orientation on Bridging Performance of Polyvinyl Alcohol Fiber-Reinforced Cementitious Composite. Mater. J. 2016, 113, 131–141. [Google Scholar] [CrossRef]
- Li, V.C.; Wang, Y.; Backer, S. A Micromechanical Model of Tension-Softening and Bridging Toughening of Short Random Fiber Reinforced Brittle Matrix Composites. J. Mech. Phys. Solids 1991, 39, 607–625. [Google Scholar] [CrossRef] [Green Version]
- Kanda, T.; Tomoe, S.; Nagai, S.; Maruta, M.; Kanakubo, T.; Shimizu, K. Full Scale Processing Investigation for ECC Pre-cast Structural Element. J. Asian Archit. Build. Eng. 2006, 5, 333–340. [Google Scholar] [CrossRef]
- Fukuyama, H. Application of high performance fiber reinforced cementitious composites for damage mitigation of building structures case study on damage mitigation of RC buildings with soft first story. J. Adv. Concr. Technol. 2006, 4, 35–44. [Google Scholar] [CrossRef] [Green Version]
- Li, M.; Luub, H.C.; Wu, C.; Mo, Y.L.; Hsu, T.T.C. Seismic performance of reinforced engineered cementitious composite shear walls. Earthq. Struct. 2014, 7, 691–704. [Google Scholar] [CrossRef]
- Mu, Y.; Yasojima, A.; Kanakubo, T. Shear Performance of FRCC Beam-Column Joints Using Various Polymer Fibers. J. Civ. Eng. Archit. 2019, 13, 562–571. [Google Scholar]
- JIS A 6201; Fly Ash for Use in Concrete. Japanese Standards Association (JSA): Tokyo, Japan, 2015. Available online: https://www.jisc.go.jp/eng/index.html (accessed on 22 April 2022).
- ISO 19044:2016; Test Methods for Fibre-Reinforced Cementitious Composites—Load-Displacement Curve Using Notched Specimen. ISO: Geneva, Switzerland, 2016. Available online: https://www.iso.org/committee/259923/x/catalogue/p/1/u/0/w/0/d/0 (accessed on 22 April 2022).
- JCI-S-001-2003; Method of Test for Fracture Energy of Concrete by Use of Notched Beam. Japan Concrete Institute: Tokyo, Japan, 2003. Available online: http://jci-net.or.jp/e/guideline/index.html (accessed on 22 April 2022).
- JIS A 1108; Method of Test for Compressive Strength of Concrete. Japanese Standards Association (JSA): Tokyo, Japan, 2018. Available online: https://www.jisc.go.jp/eng/index.html (accessed on 22 April 2022).
- JIS A 1149; Method of Test for Static Modulus of Elasticity of Concrete. Japanese Standards Association (JSA): Tokyo, Japan, 2017. Available online: https://www.jisc.go.jp/eng/index.html (accessed on 22 April 2022).
- Kanakubo, T. Tensile Characteristics Evaluation Method for Ductile Fiber-Reinforced Cementitious Composites. J. Adv. Concr. Technol. 2006, 4, 3–17. [Google Scholar] [CrossRef] [Green Version]


| Fiber Type | Diameter | Length | Tensile Strength | Elastic Modulus |
|---|---|---|---|---|
| Aramid | 0.5 mm | 30 mm | 3432 MPa 1 | 73 GPa 1 |
| Series | W/C | FA/B | Unit Weight (kg/m3) | |||
|---|---|---|---|---|---|---|
| W | C | FA | S | |||
| Fc24 | 0.785 | 0.500 | 380 | 484 | 484 | 484 |
| Fc36 | 0.560 | 0.300 | 380 | 678 | 291 | 484 |
| Fc48 | 0.436 | 0.100 | 380 | 872 | 97 | 484 |
| Series | Fiber Volume Fraction (%) | Curing Time (d) | Compressive Strength (MPa) | Elastic Modulus (GPa) |
|---|---|---|---|---|
| Fc24 | 0 (None) 1 2 | 25 | 38.3 35.6 33.3 | 14.2 13.6 13.0 |
| Fc36 | 0 (None) 1 2 | 32 | 54.6 48.2 46.1 | 18.2 17.8 17.6 |
| Fc48 | 0 (None) 1 2 | 45 | 71.4 66.9 63.7 | 20.0 19.7 19.3 |
| Series | Specimen No. | Load at First Crack (kN) | Maximum Load (kN) | Average Max. Load (STDV) (kN) |
|---|---|---|---|---|
| Fc24-N | 1 2 | 4.99 4.24 | 4.99 4.24 | 4.61 (0.53) |
| Fc24-1% | 1 2 3 4 5 | 6.57 5.23 6.58 6.37 5.38 | 8.88 8.54 9.76 8.49 9.28 | 8.99 (0.53) |
| Fc24-2% | 2 3 4 | 8.66 7.54 7.40 | 13.33 12.05 12.41 | 12.60 (0.66) |
| Fc36-N | 1 2 3 | 5.35 5.40 5.30 | 5.35 5.40 5.30 | 5.35 (0.05) |
| Fc36-1% | 1 2 3 4 5 | 7.51 9.53 8.10 7.69 8.94 | 9.75 9.53 11.95 11.21 10.65 | 10.62 (1.01) |
| Fc36-2% | 4 | 10.34 | 15.10 | 15.10 |
| Fc48-N | 2 3 4 | 6.30 8.51 5.87 | 6.30 8.51 5.87 | 6.89 (1.42) |
| Fc48-1% | 1 2 3 4 5 | 11.03 9.20 11.54 11.97 7.71 | 13.25 12.82 11.80 11.97 13.33 | 12.63 (0.71) |
| Fc48-2% | 2 3 4 | 10.71 12.54 10.55 | 18.28 17.27 15.53 | 17.03 (1.39) |
| Parameter | Input | |
|---|---|---|
| Cross-sectional area of individual fiber, Af (mm2) | 0.196 | |
| Length of fiber, lf (mm) | 30 | |
| Apparent rupture strength of fiber [17], σfu (MPa) | σfu = 1080 × e−0.667ψ | |
| Bilinear model [17] | Maximum pullout load, Pmax (N) Crack width at Pmax, wmax (mm) | Pmax = (0.388 lb 0.59) fc wmax = 0.13 lb 0.64 |
| Elliptic distribution [17] | Orientation intensity for x-y plane, kxy Orientation intensity for z-x plane, kzx Principle orientation angle, θr | 1.5 6 0 |
| Series | Specimen No. | Maximum Load (kN) | Number of Fibers on Fracture Surface | Max. Load per Fiber (N) | ||
|---|---|---|---|---|---|---|
| Top | Bottom | Total | ||||
| Fc24-1% (fc = 35.6 MPa) | 1 2 3 4 5 | 8.88 8.54 9.76 8.49 9.28 | 99 90 109 95 103 | 106 108 112 97 109 | 205 198 221 192 212 | 43.33 43.13 44.15 44.23 43.76 |
| Calculation | 4.73 | Vf Am / Af ηf = 0.01 × (60 × 70)/0.196 × 0.544 | 117 | 40.54 | ||
| Fc24-2% (fc = 33.3 MPa) | 2 3 4 | 13.33 12.05 12.41 | 182 159 174 | 151 145 129 | 333 304 303 | 40.04 39.63 40.96 |
| Calculation | 8.84 | Vf Am / Af ηf = 0.02 × (60 × 70)/0.196 × 0.544 | 233 | 37.91 | ||
| Series | Specimen No. | Maximum Load (kN) | Number of Fibers on Fracture Surface | Max. Load per Fiber (N) | ||
|---|---|---|---|---|---|---|
| Top | Bottom | Total | ||||
| Fc36-1% (fc = 48.2 MPa) | 1 2 3 4 5 | 9.75 9.53 11.95 11.21 10.65 | 96 89 118 107 101 | 82 79 109 93 95 | 178 168 227 200 196 | 54.76 56.73 52.63 56.07 54.33 |
| Calculation | 6.31 | Vf Am / Af ηf = 0.01 × (60 × 70)/0.196 × 0.544 | 117 | 54.12 | ||
| Fc36-2% (fc = 46.1 MPa) | 4 | 15.10 | 163 | 152 | 315 | 47.92 |
| Calculation | 12.16 | Vf Am / Af ηf = 0.02 × (60 × 70)/0.196 × 0.544 | 233 | 52.16 | ||
| Series | Specimen No. | Maximum Load (kN) | Number of Fibers on Fracture Surface | Max. Load per Fiber (N) | ||
|---|---|---|---|---|---|---|
| Top | Bottom | Total | ||||
| Fc48-1% (fc = 66.9 MPa) | 1 2 3 4 5 | 13.25 12.82 11.80 11.97 13.33 | 101 105 92 97 107 | 97 86 94 101 99 | 198 191 186 198 206 | 66.91 67.13 63.44 60.46 64.72 |
| Calculation | 7.76 | Vf Am / Af ηf = 0.01 × (60 × 70)/0.196 × 0.544 | 117 | 66.59 | ||
| Fc48-2% (fc = 63.7 MPa) | 2 3 4 | 18.28 17.27 15.53 | 156 163 131 | 148 144 149 | 304 307 280 | 60.14 56.25 55.46 |
| Calculation | 15.16 | Vf Am / Af ηf = 0.02 × (60 × 70)/0.196 × 0.544 | 233 | 65.03 | ||
Publisher’s Note: MDPI stays neutral with regard to jurisdictional claims in published maps and institutional affiliations. |
© 2022 by the authors. Licensee MDPI, Basel, Switzerland. This article is an open access article distributed under the terms and conditions of the Creative Commons Attribution (CC BY) license (https://creativecommons.org/licenses/by/4.0/).
Share and Cite
Kanakubo, T.; Shi, H.; Wang, J. Influence of Matrix Strength on Bridging Performance of Fiber-Reinforced Cementitious Composite with Bundled Aramid Fiber. J. Compos. Sci. 2022, 6, 131. https://0-doi-org.brum.beds.ac.uk/10.3390/jcs6050131
Kanakubo T, Shi H, Wang J. Influence of Matrix Strength on Bridging Performance of Fiber-Reinforced Cementitious Composite with Bundled Aramid Fiber. Journal of Composites Science. 2022; 6(5):131. https://0-doi-org.brum.beds.ac.uk/10.3390/jcs6050131
Chicago/Turabian StyleKanakubo, Toshiyuki, Haohui Shi, and Jin Wang. 2022. "Influence of Matrix Strength on Bridging Performance of Fiber-Reinforced Cementitious Composite with Bundled Aramid Fiber" Journal of Composites Science 6, no. 5: 131. https://0-doi-org.brum.beds.ac.uk/10.3390/jcs6050131