Article

Non-Destructive and Destructive Testing to Analyse the Effects of Processing Parameters on the Tensile and Flexural Properties of FFF-Printed Graphene-Enhanced PLA

School of Engineering and Built Environment, Faculty of Science and Engineering, Anglia Ruskin University, Chelmsford CM1 1SQ, UK
*
Author to whom correspondence should be addressed.
J. Compos. Sci. 2022, 6(5), 148; https://0-doi-org.brum.beds.ac.uk/10.3390/jcs6050148
Submission received: 20 April 2022 / Revised: 10 May 2022 / Accepted: 17 May 2022 / Published: 19 May 2022
(This article belongs to the Special Issue Graphene Composites)

Abstract

:
The significance of non-destructive testing (NDT) methods cannot be overstated as they help to evaluate the properties of a material without damaging/fracturing it. However, their applicability is dependent on their ability to provide reliable correlation with destructive tests such as tensile and flexural. This correlation becomes more problematic when the material is not homogeneous, such is the case with parts manufactured using a popular additive manufacturing process termed as fused filament fabrication (FFF). This process also requires optimisation of its parameters to achieve desired results. Therefore, this study aims to investigate the effects of four different nozzle temperatures, print bed temperatures, and print speeds on FFF-printed Haydale’s Synergy Graphene Enhanced Super Tough PLA through three non-destructive (ultrasonic, hardness, strain) and two destructive (tensile, flexural) testing methods. Samples were manufactured using Anet® ET4 Pro 3D printer and evaluated as per British and International standards. Two non-destructive tests, i.e., ultrasonic and hardness have been associated with evaluating the tensile properties of the manufactured parts. These results were correlated with destructive tensile testing and showed good agreement. The NDT method of strain measurement showed a very good correlation with the destructive three-point flexural test and was able to provide a reliable evaluation of flexural properties as a function of all three processing parameters. The results presented in this work highlight the importance of NDT methods and how they can be used to evaluate different properties of a material.

1. Introduction

Fused filament fabrication (FFF) is a popular additive manufacturing (AM) process that is based on the principle of material extrusion and makes use of thermoplastics to manufacture products [1,2,3]. Fused deposition modelling (FDM) is another terminology used for this process but is a trademark of Stratasys. The systems working on the principle of FFF/FDM are termed as 3D printers [4,5]. The FFF process has several notable advantages such as ease of operation, wide variety of materials, and cost-effectiveness [6,7]. However, the layer-by-layer nature of the process and anisotropic behaviour of the materials make the detection of defects in FFF-printed parts difficult. These defects could also be introduced if the processing parameters are not optimised for the material being used such as nozzle temperature, print bed temperature, print speed, infill percentage, and infill pattern [8]. In such a situation, non-destructive testing (NDT) is an appropriate choice for detecting and evaluating these defects without damaging the FFF-printed parts or altering their properties as opposed to a destructive test, e.g., tensile, and flexural [9]. These methods have been in use to provide an assessment of a product’s integrity, quality, and reliability [10]. The common NDT methods for FFF include visual inspection, ultrasonic testing, thermography, and acoustic emission testing. Mwema et al. [11] used visual inspection to measure the dimensions of different elements (including circular, diamond, hollow, square, and S-shapes) printed using an affordable 3D printer. They compared these measurements taken by a micrometer and compared them with the CAD files. They also evaluated the geometrical accuracy of the prints using an optical microscope. The methods reported significant dimensional errors on the shapes and identified insufficient fusion of the filament material during printing as the cause as well. Fayazbakhsh et al. [12] introduced defects in PLA samples and used high-frequency phased array ultrasonic testing to capture their layups. These results were compared to the destructive tensile tests, and it was observed that the as-manufactured gap widths of the samples were within 10% of the as-designed values, highlighting the effectiveness of the NDT method. Seppala and Migler [13] used infrared imaging to measure the temperature profiles of ABS material during its build and obtained the temporal profile of the weld zone temperatures. They showed how this method can help in understanding, controlling, and enhancing the weld strength in extrusion-based systems. Li et al. [14] investigated the failure mode of PLA parts by obtaining acoustic emissions (AE) during tensile testing. They analysed the AE features of peak frequency, energy, and amplitude followed by the application of the unsupervised clustering method of k-means. They proved that the failure modes of PLA debonding and breakage can be successfully recognised by the pattern recognition technique of k-means. All these examples show the significance of NDT methods for FFF-printed thermoplastics.
In addition to appropriate NDT methods, the research to expand the material variety for FFF process is also expanding. Efforts are continuously being made to improve the properties of the commonly used thermoplastics (e.g., PLA and ABS) through the incorporation of particles, fibres, or nanomaterial reinforcements [15,16,17]. Graphene nanoplatelets (GNP) have also become exceedingly popular due to their excellent properties especially incorporated with PLA for 3D printing [18]. Such a filament provides improved operating temperature performance, high rigidity, good impact strength, and excellent interlayer adhesion for smooth printing. Rigorous research is being undertaken to leverage such properties of graphene-enhanced PLA (GPLA) material for FFF. Caminero et al. [19] studied the effects of GNP reinforcement and showed that the incorporation of such platelets help in enhancing the mechanical properties, dimensional accuracy, and surface texture of PLA parts. El Magri et al. [20] analysed the combined effect of process parameters, loading amplitude, and frequency on fatigue behaviour of GPLA parts. Their experimental results showed that the fatigue lifetime depends on the process parameters as well as the loading amplitude and frequency. García et al. [21] evaluated the geometric properties of dimensional accuracy, flatness error, surface texture, and surface roughness for PLA as well as GPLA as a function of build orientation, layer thickness, and feed rate. They showed that the properties were not significantly affected by the chosen printing parameters for both materials. On the other hand, Butt et al. [22] studied the impact of extrusion temperatures and material extrusion rates on PLA and GPLA. They showed that GPLA is more adversely affected due to changes in these printing parameters and how they can be leveraged to achieve desired results in products. Cicero et al. [23] investigated the effects of three different raster orientations (0/90, 30/−60, and 45/−45) on tensile and fracture samples of PLA and GPLA. They observed that the addition of GNPs resulted in significant improvement of tensile and fracture properties for samples printed at 30/−60 and 45/−45. However, they did not observe this phenomenon in the raster orientation of 0/90. Camargo et al. [24] also analysed the impact of infill and layer thickness on GPLA parts for their tensile strength, flexural strength, and impact energy. They concluded that tensile strength and flexural strength increased as the infill increased, while impact energy decreased as infill increased. Vidakis et al. [25] investigated the tension, compression, flexion and impact mechanical responses accompanied with macro- and microhardness for FDM-printed PLA and GPLA. They observed limited deviations between the mechanical properties. However, a significant increase in the dielectric constant for GPLA was observed compared with PLA. Similarly, Bustillos et al. [26] studied indentation creep resistance and tribological properties of FDM-printed PLA and PLA–graphene composites. In both cases, GPLA showed significant improvements compared with PLA. These examples highlight the significance of graphene-enhanced PLA material, the importance of understanding the combinational effect of process parameters, and the need for optimisation to achieve desired results. However, the majority of testing undertaken to assess the mechanical properties of materials is destructive. In the case of FFF/FDM, manufacturing parts for testing is quick but bespoke properties require optimisation of processing parameters and having reliable NDT methods could help evaluate such properties without damaging the printed parts.
Therefore, it is evident that NDT methods are extremely useful and can help in evaluating the properties of FFF-printed parts, especially when multiple processing parameters are being optimised to achieve desired results. The effectiveness of NDT methods also depend on the properties being investigated. It is not mandatory that every material property can be evaluated using NDT methods. Therefore, this work aims to analyse three NDT methods (i.e., ultrasonic testing, strain measurement, and indentation hardness testing) for their effectiveness in evaluating the tensile and flexural properties of graphene-enhanced PLA material. Three processing parameters for the material have been investigated, i.e., nozzle temperature, print bed temperature, and print speed. The work analyses the effectiveness of the NDT methods in evaluating the properties of GPLA and whether they can capture the impact of all three processing parameters. The presence of nanoplatelets in the PLA matrix can hinder proper analysis using NDT methods and this work aims to explore that avenue. The experimental methodology for this study is presented in Section 2 with descriptions of the material, standards for manufacture and testing, combinations of processing parameters, and NDT methods. The effects of the processing parameters are discussed in Section 3 using both non-destructive and destructive methods. Section 4 presents a correlation between non-destructive and destructive testing to show the applicability of the former to evaluate tensile and flexural properties for graphene-enhanced PLA. The conclusions of this work are outlined in Section 5.

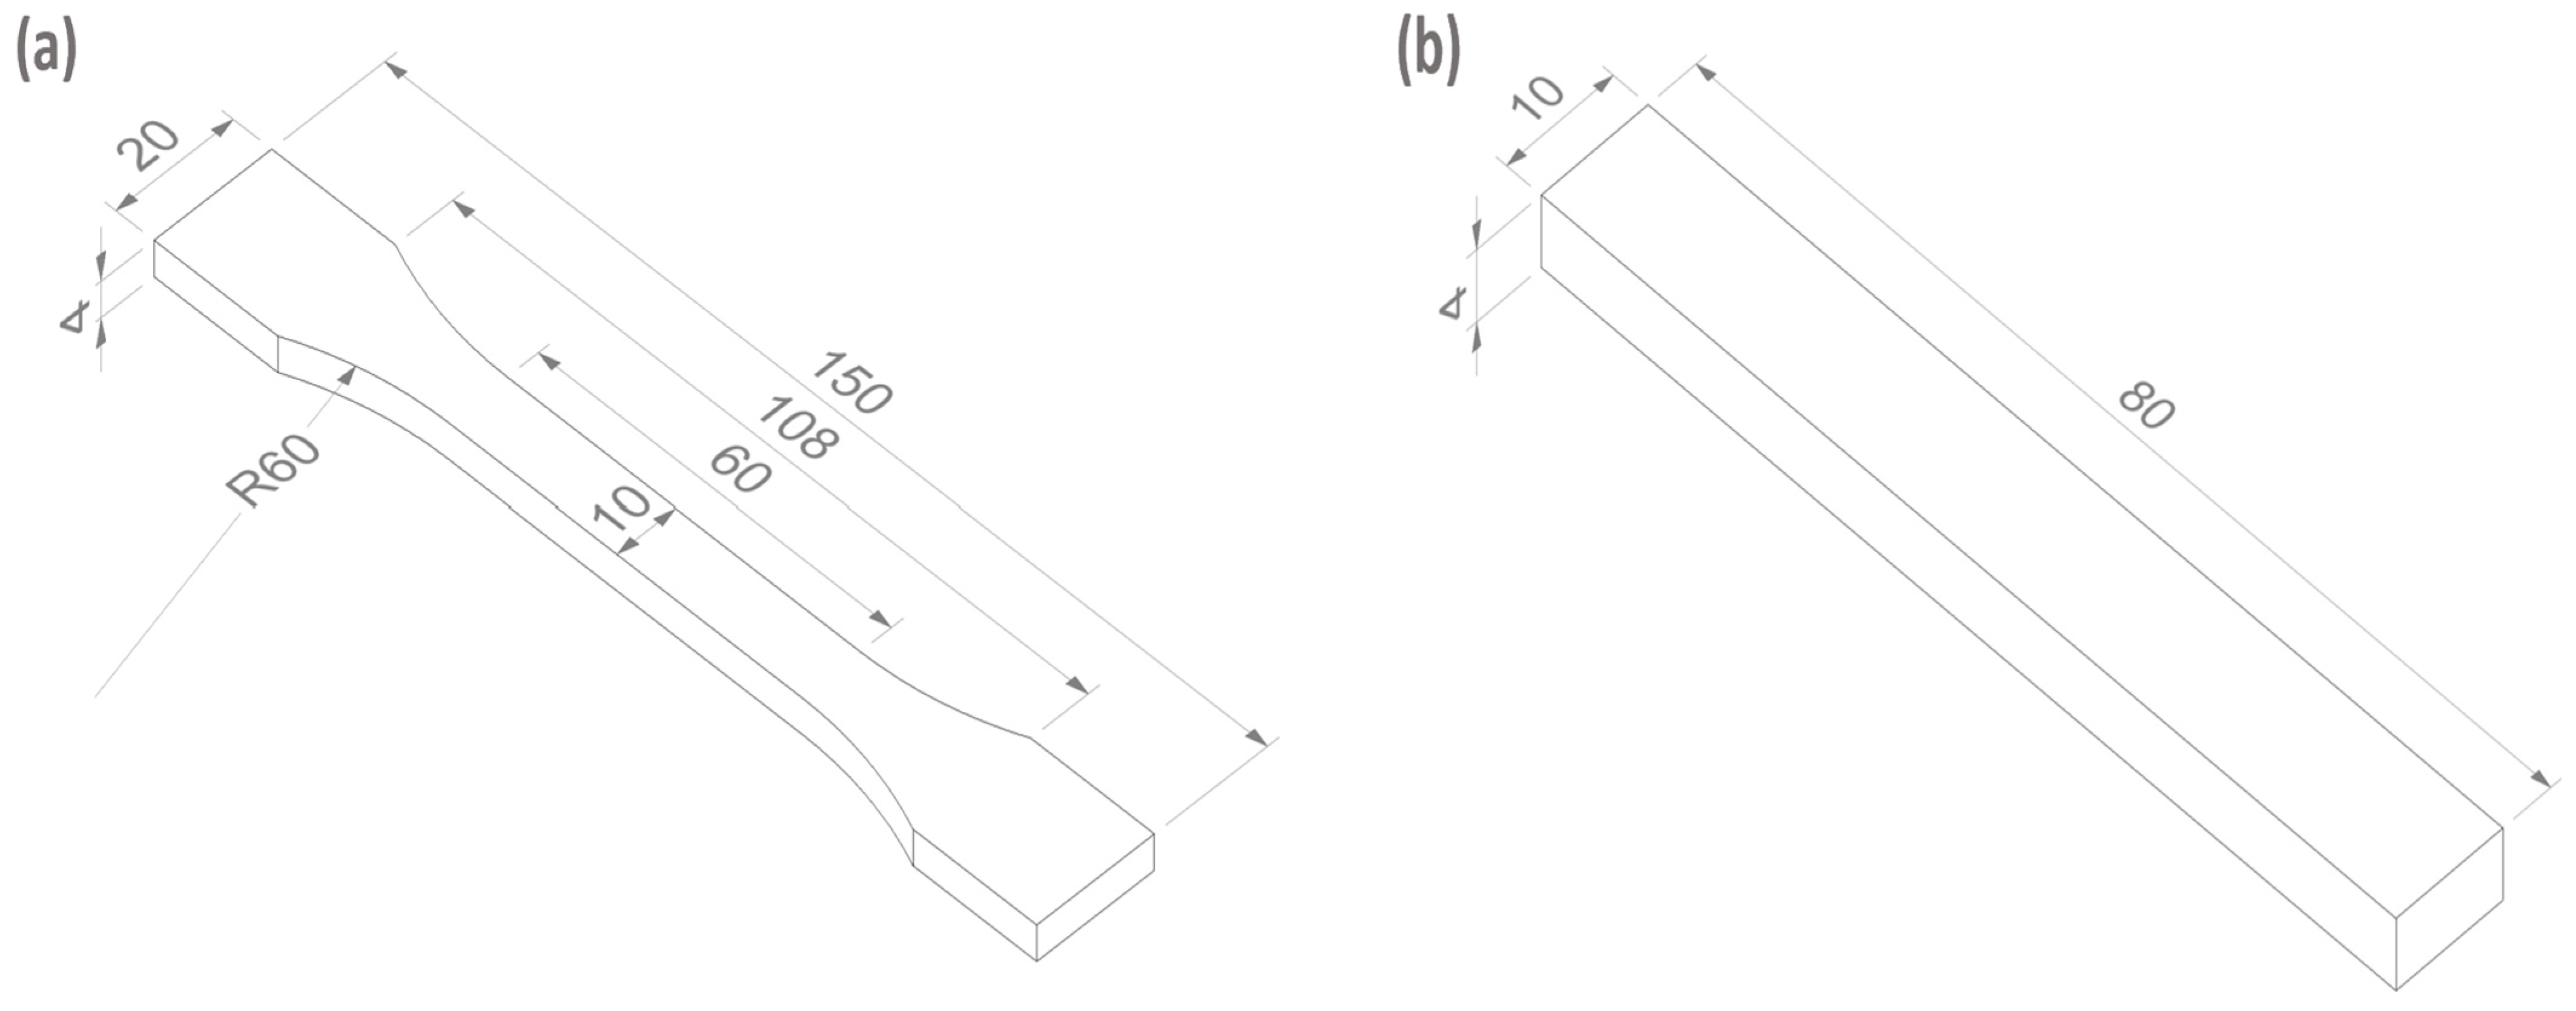
2. Experimental Methodology

HDPlas® PLA-GNP-A filament from 3D Haydale Ltd., (Loughborough, UK) was used to manufacture samples to analyse the effects of nozzle temperature, print bed temperature, and print speed. The introduction of the HDPlas® functionalised graphene nanoplatelets of a planar size between 0.3–5 μm helps to improve dispersion and bonding within the PLA polymer. It provides the material with improved operating temperature performance, high rigidity, good impact strength, and excellent interlayer adhesion for smooth printing [27]. The characteristics of GPLA are shown in Table 1. Anet® ET4 Pro desktop 3D printer was used to manufacture two sets of samples. BS EN ISO 527-2:2012 [28] was followed to manufacture dog-bone samples for tensile testing whereas rectangular samples for flexural testing were manufactured as per BS EN ISO 178:2019 [29]. The dimensions for the manufactured samples are shown in Figure 1. Ultimaker Cura 4.11.0 [30] was used to generate G-code files based on the different combinations of the three processing parameters, as shown in Table 2. Five samples for each combination of the processing parameters were tested while all other parameters were kept constant and were taken from literature [22]. The infill density was set at 100% and infill pattern of lines was used. The flow percentage and layer height were set to 100% and 0.2 mm, respectively.
The dog-bone samples were first subjected to ultrasonic testing using a Proceq PUNDIT® PL-200 (Test Equipment Center, Zürich, Switzerland) comprising two 54-kHz transducers [31]. This method utilises high-frequency sound waves to detect flaws and defects in products. The samples were tested at three points along their length to ascertain an average value of transmission time. After ultrasonic testing, the dog-bone samples were subjected to indentation hardness testing as per BS EN ISO 868:2003 [32] using a Shore D durometer. The indentation was measured at five different points to obtain an average hardness value for all the samples. These two non-destructive tests are linked to the destructive tensile testing that was subsequently undertaken as per BS EN ISO 527-2:2012 [28] on a TIRAtest 2810 Universal Testing Machine at a crosshead speed of 1.5 mm/s according to the standard.
The NDT method of strain measurement is more suited to assess bending in the rectangular samples. Two metallic strain gauges were bonded to both sides of the samples in a half bridge configuration because it instils more sensitivity by measuring both tensile (positive) and compressive strain (negative). BF350-3 AA type metal foil resistance strain gauges were used with a resistance of 350 ± 0.1 ohms, sensitivity factor of 2.0–2.20, and precision level of 0.02. They were bonded on the surfaces of the rectangular samples with cyanoacrylate adhesive [33]. A static load of 1000 g (1 kg) was applied to the samples and the resistance values from the strain gauges were recorded using a HBM Data Acquisition System QuantumX MX 1615B system running Catman DAQ software with a half bridge configuration [34]. After strain measurements, flexural testing was undertaken on a TIRAtest 2810 Universal Testing Machine with a speed of 2 mm/min as per BS EN ISO 178:2019 [29]. The diameter of the former and supports was 10 mm, and the samples were placed in such a way to ensure a support span length of 60 mm for the test. The reason for testing commercially available GPLA is because of its unique properties and incorporation of graphene nanoplatelets that can make evaluating the mechanical properties difficult through NDT methods. The work also focuses on assessing the effectiveness of the NDT methods in capturing the impact of all three processing parameters.

3. Experimental Results and Discussion

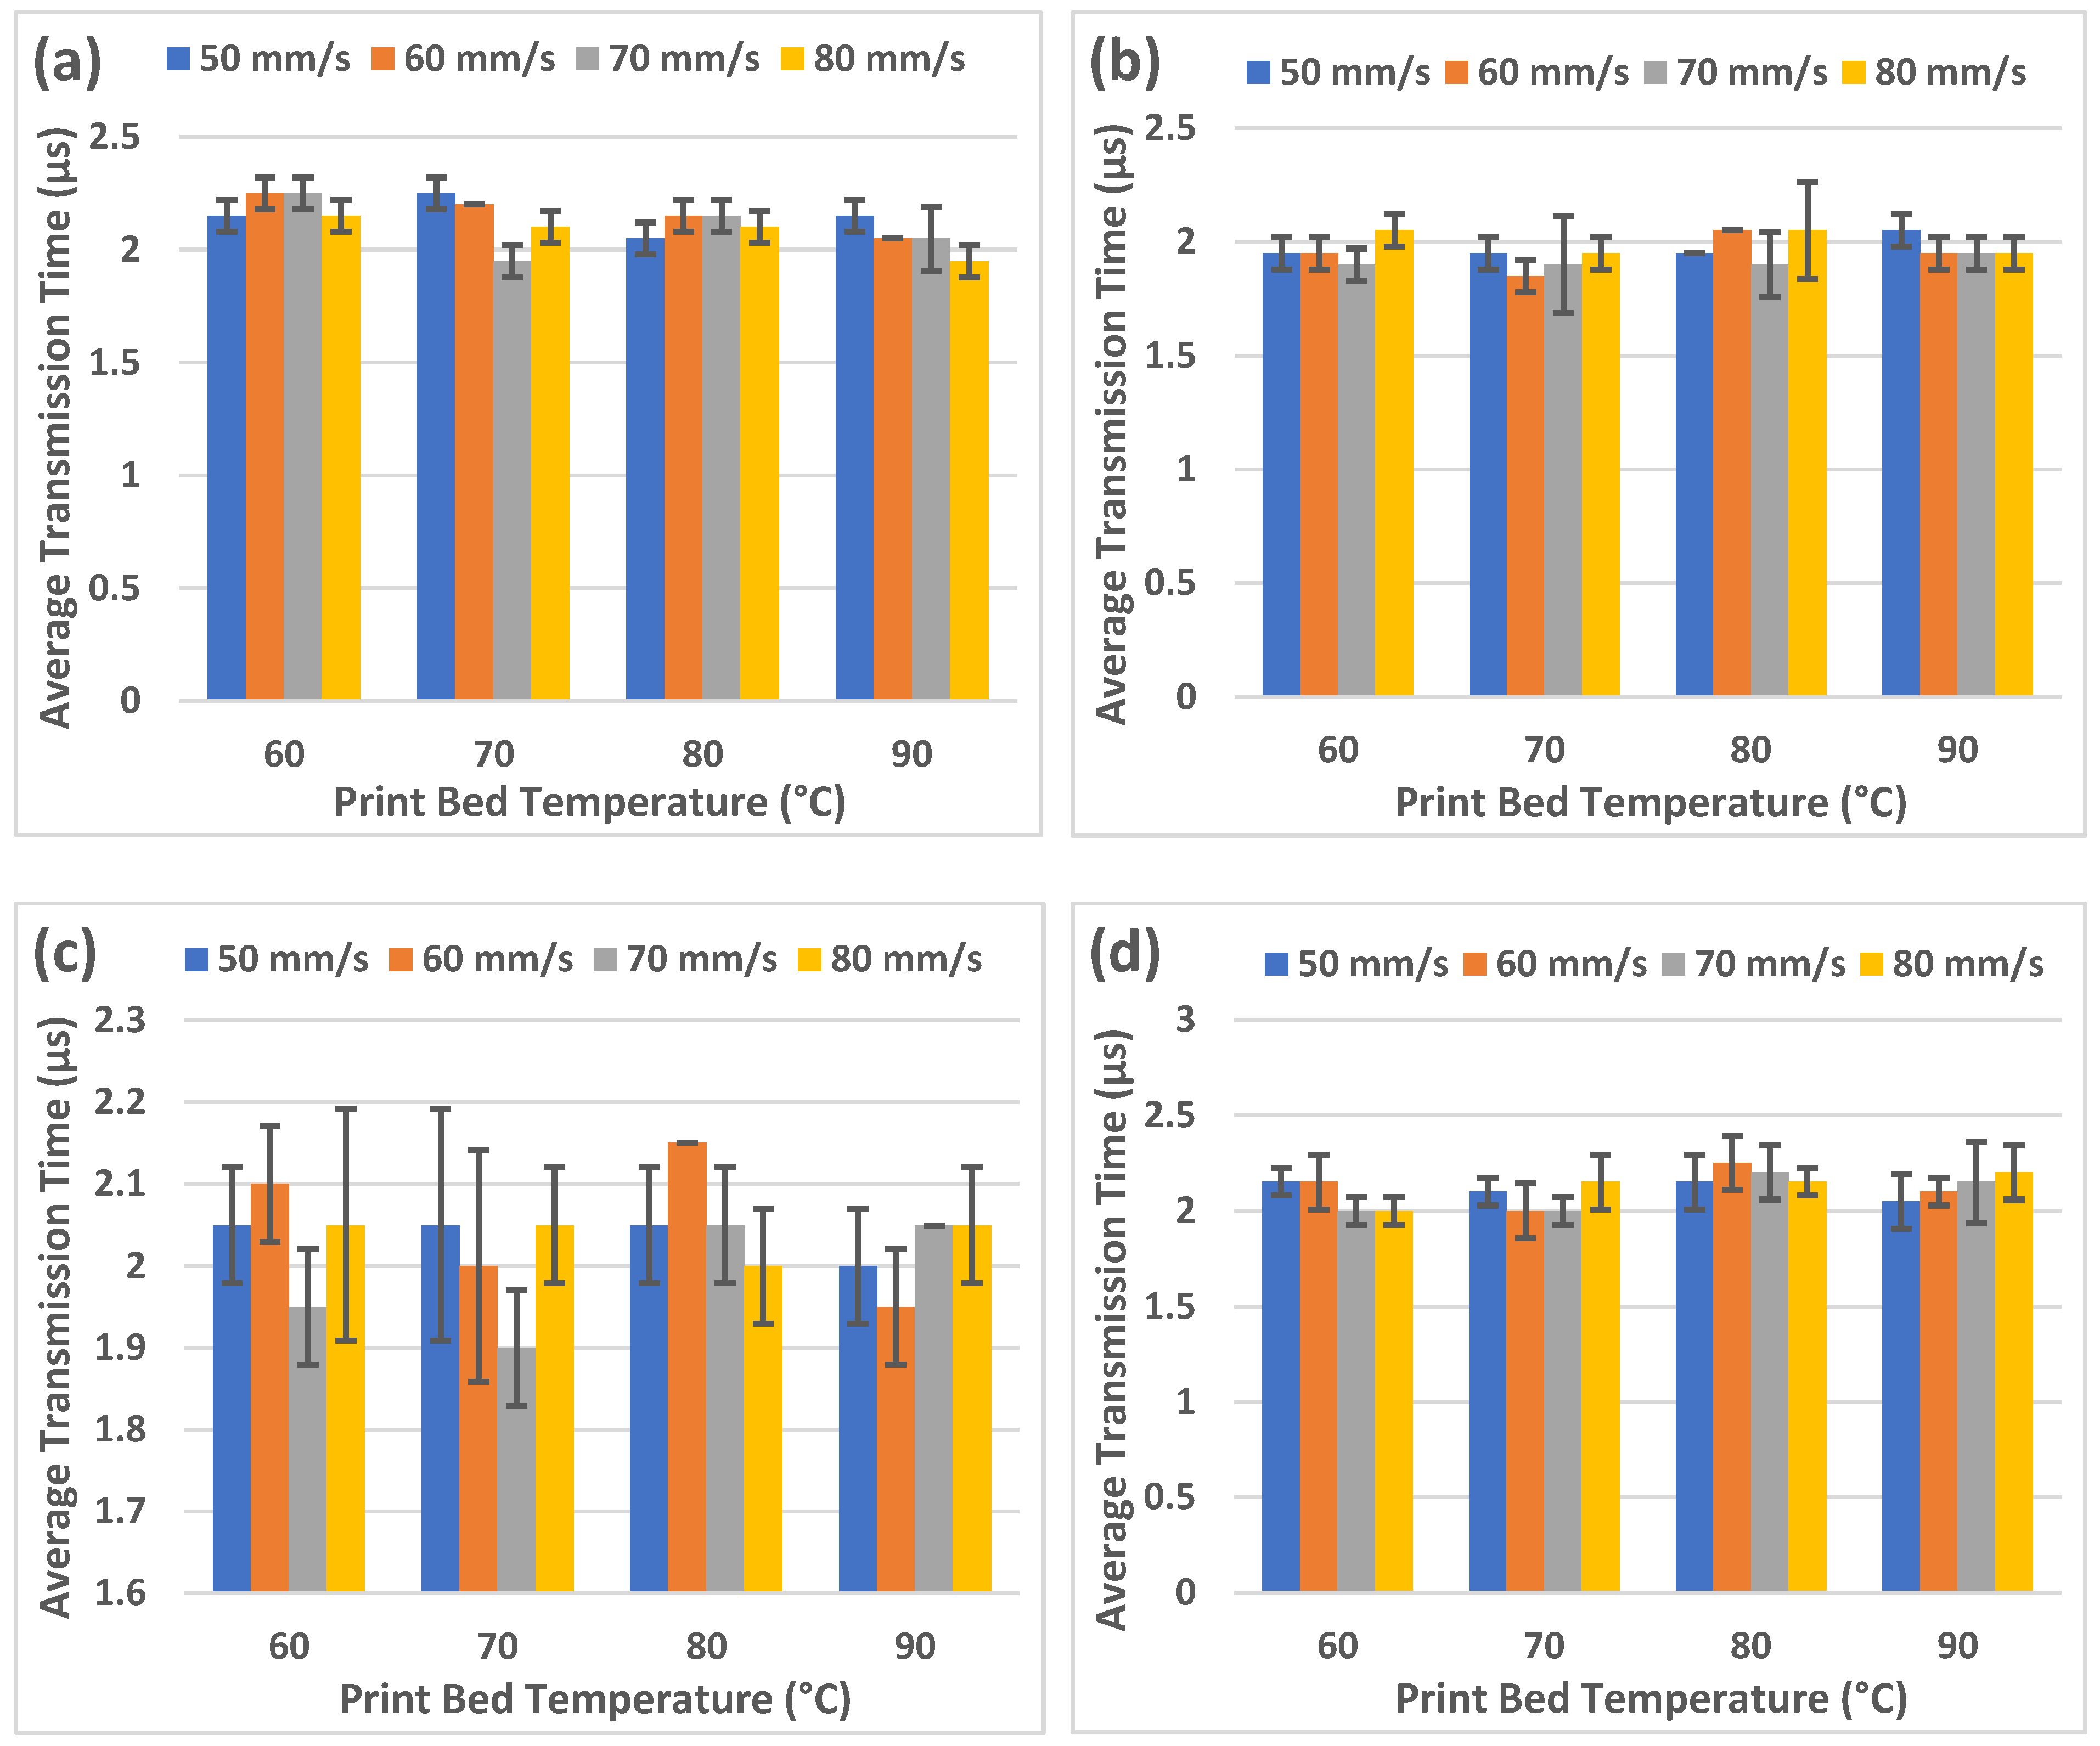
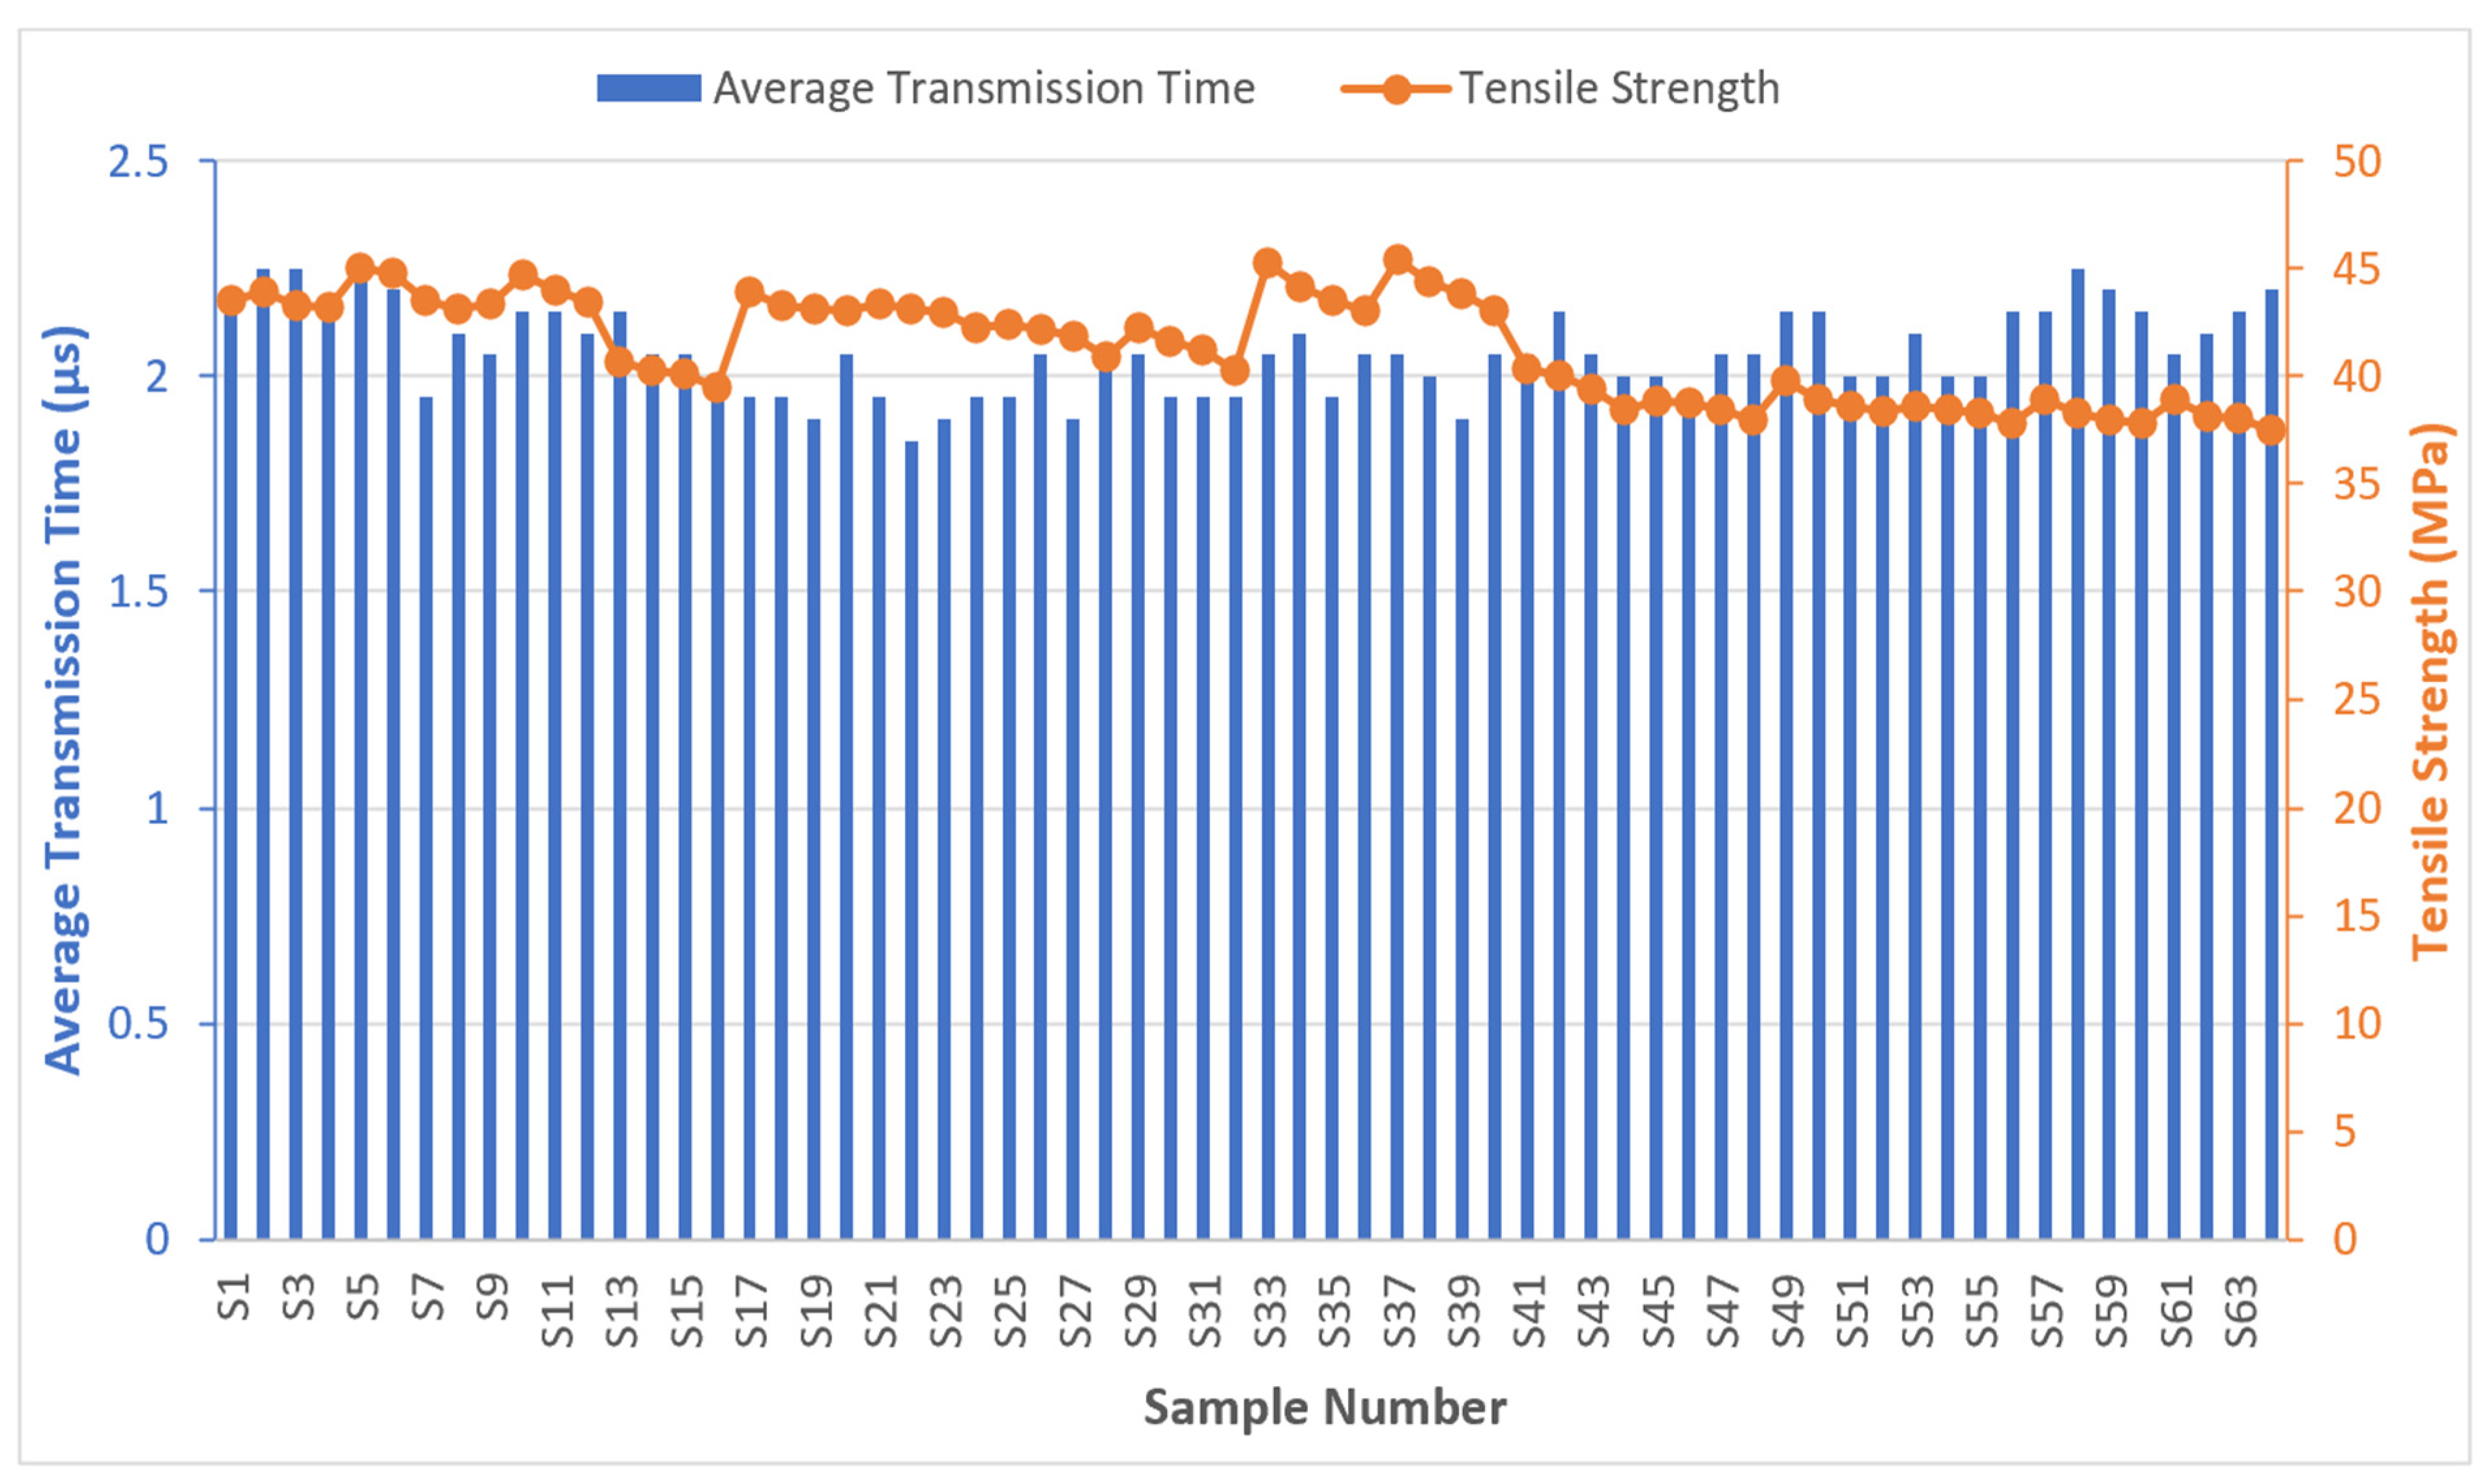
3.1. Ultrasonic Testing

This NDT is useful in detecting defects in FFF-printed parts such as voids and gaps [8,12,15,22]. The presence of a void or poorly welded layer interface would result in a higher value as opposed to a sample that is properly packed with good layer adhesion. The test was conducted on all the dog-bone samples and three measurements were taken along their length. The results of the transmission times for the four different nozzle temperatures are shown in Figure 2.
It is evident from Figure 2 that the average transmission times are consistent for all the nozzle temperatures and range between 2.25 and 1.85 μs. The lowest average times were recorded at nozzle temperatures of 190 °C (1.95 μs) and 200 °C (2.02 μs) whereas the highest values were observed at 180 °C (2.12 μs) and 210 °C (2.11 μs). Furthermore, with the increase in print bed temperature, the lowest values were observed at 70 °C for all nozzle temperatures (Figure 2b–d) except 180 °C whereas the lowest values were observed at 90 °C (Figure 2a). Print speed does not play a significant role in the average transmission times as they are more affected by nozzle temperatures and print bed temperatures. Only in the case of 200 °C were varied values observed at different print speeds but they were quite consistent at all other nozzle temperatures.

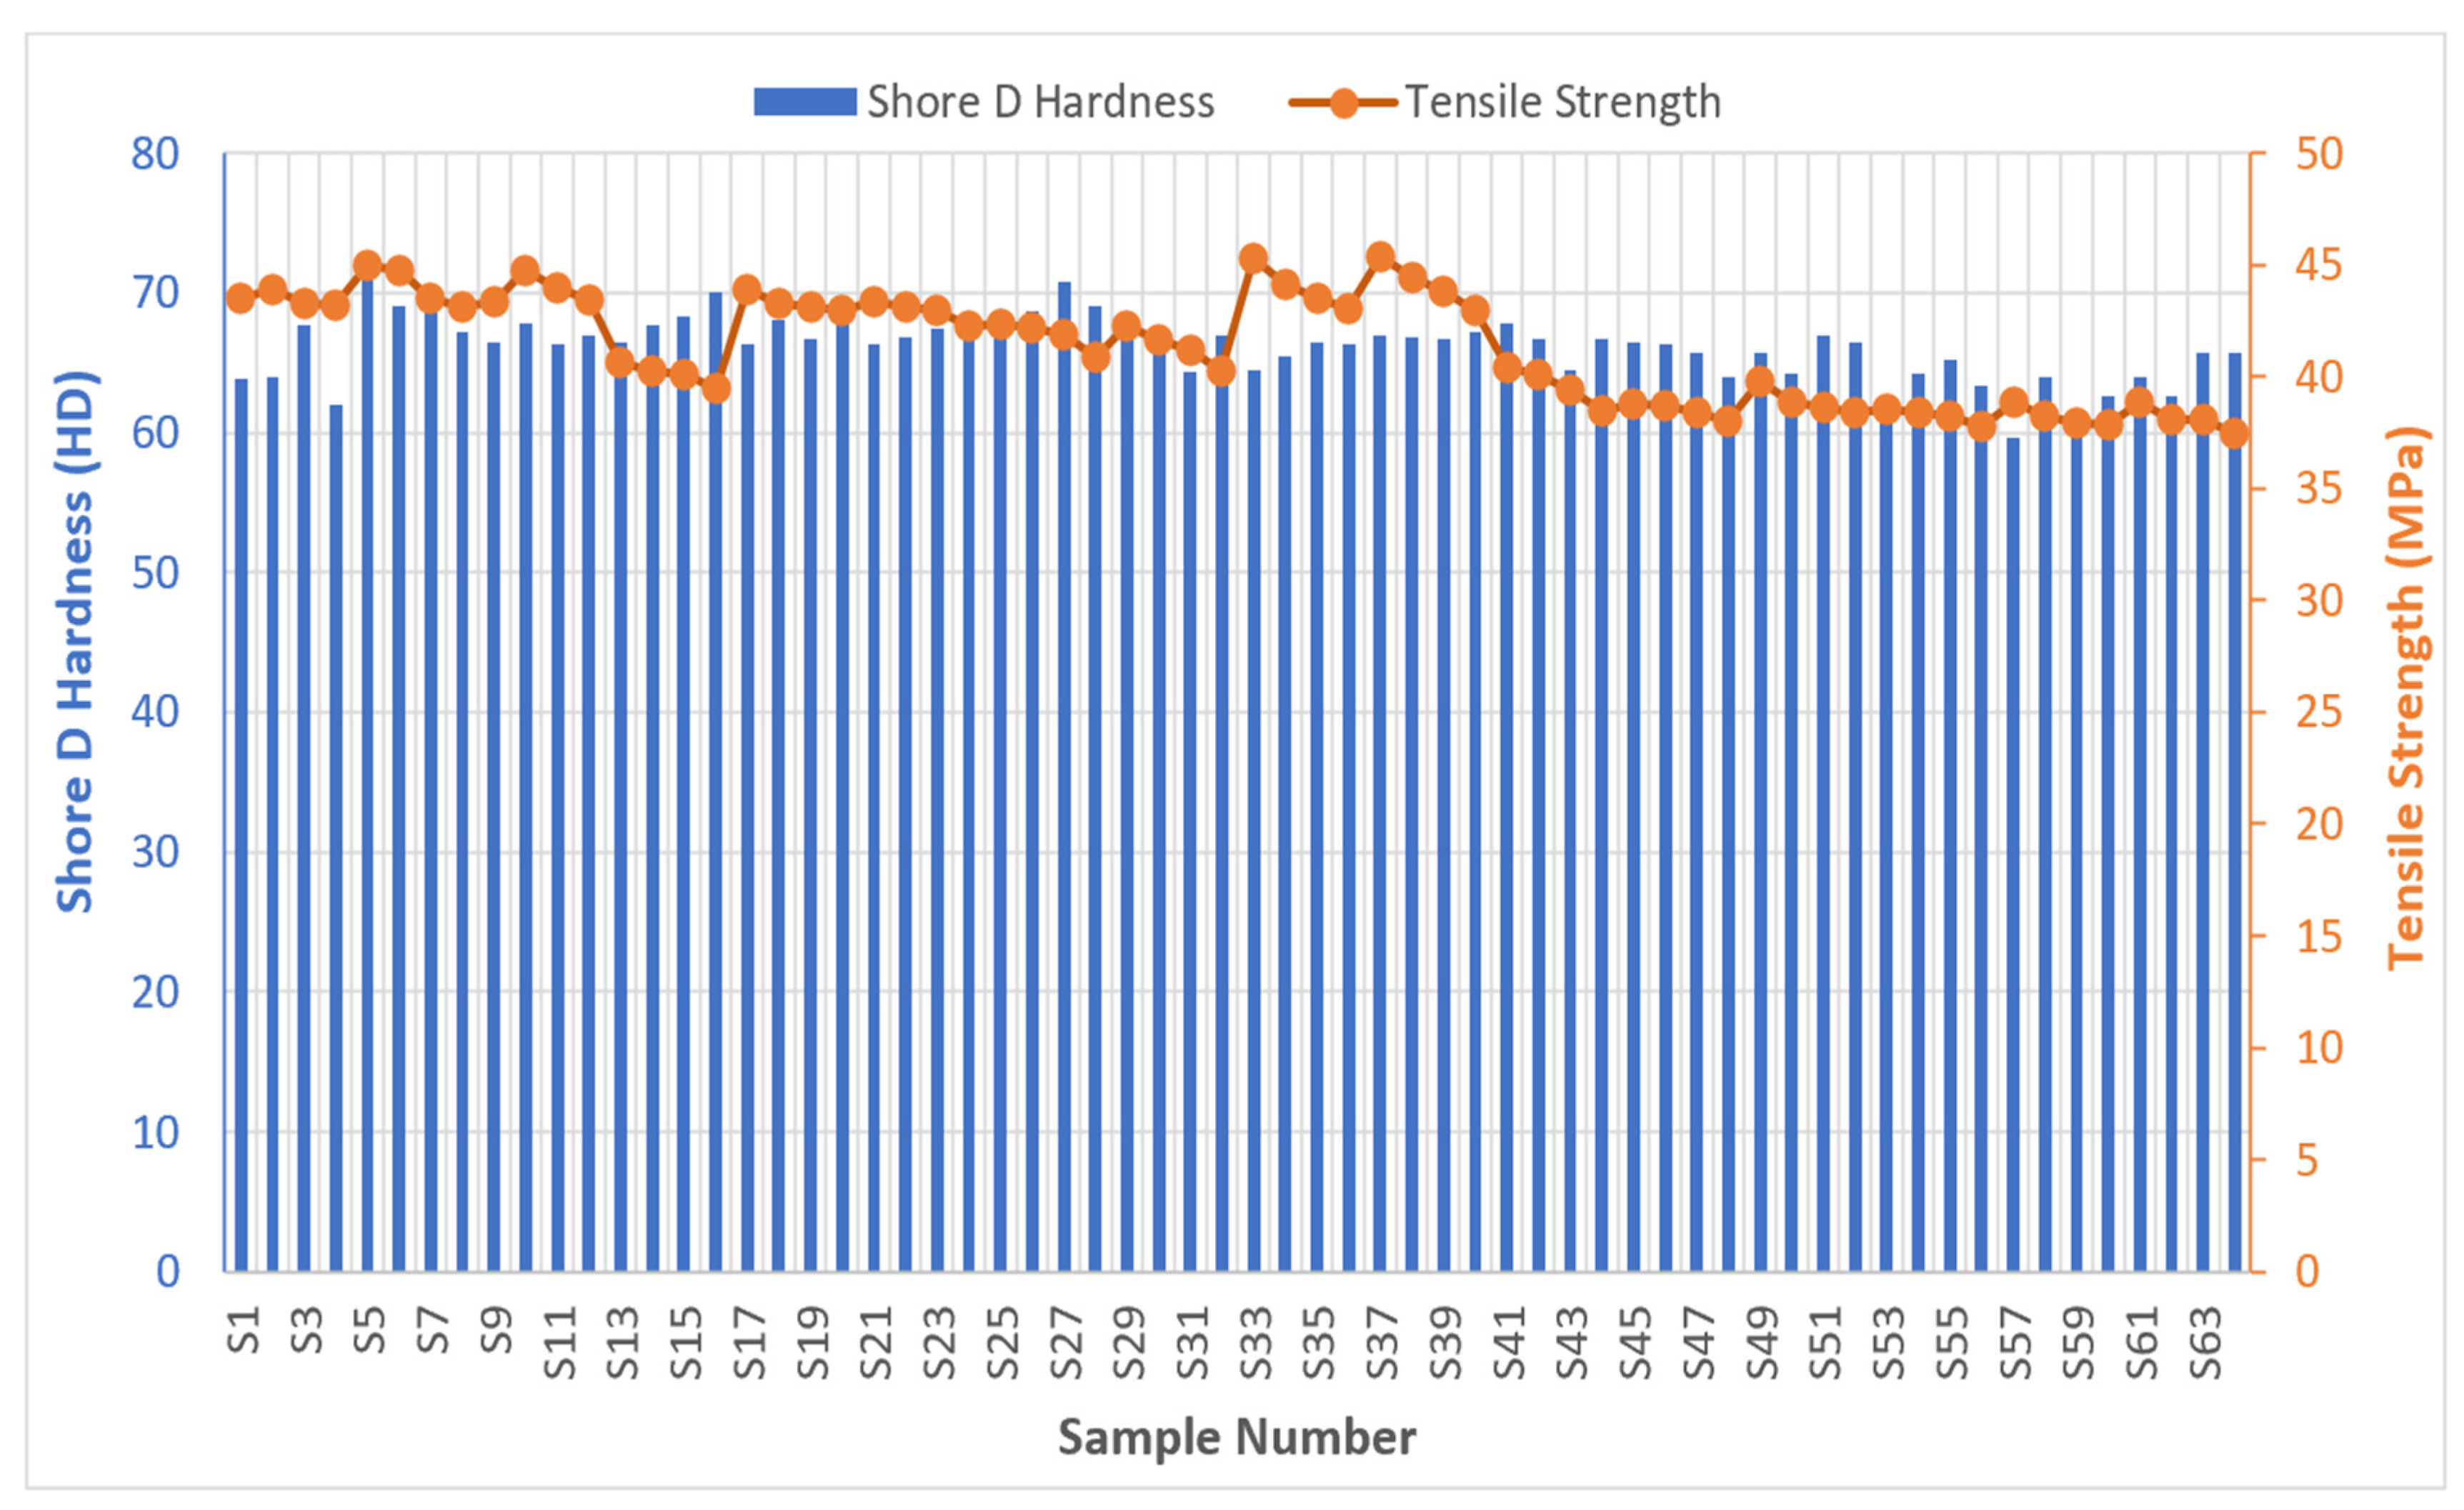
3.2. Hardness Testing

The second non-destructive test in this work is simple and inexpensive. It does not completely destroy a material such as in a tensile or flexural test. However, indentation hardness testing leaves behind marks or imprints on the tested parts. Shore hardness is a non-destructive testing method that can determine how effectively a material resists indentation, providing insight into how it will perform over time. Although hardness testing cannot usually find defects, it can show how materials are affected by stress and how components will wear during their operational life. This test can shed some light on the strength, ductility, and wear resistance of GPLA as there is a very close relationship between hardness and tensile strength [35,36]. The dog-bone samples were subjected to indentation Shore D hardness testing and the results are shown in Figure 3. Similar to ultrasonic testing (Section 3.1), there is not a significant difference in the hardness values. The maximum hardness values were observed for nozzle temperature of 190 °C (Figure 3b) whereas the lowest were shown by 210 °C (Figure 3d), indicating that the hardness values decreased with the increase in nozzle temperature. Furthermore, as the print bed temperature increased, the hardness values increased until 70 °C for 180 °C (Figure 3a) and 200 °C (Figure 3c) before gradually decreasing. For nozzle temperature of 190 °C, the hardness values started high at the lowest print bed temperature of 60 °C before dropping at 70 °C; then, it reached a peak value at 80 °C and dropped again at 90 °C. For nozzle temperature of 210 °C, the hardness values started at their peak at the lowest print bed temperature of 60 °C before dropping until 80 °C and then rising slightly at 90 °C. It can also be seen that as the nozzle temperature increased, the difference in hardness values at different printing speeds also increased with the most deviations at different print bed temperatures being observed at higher nozzle temperatures. Similar to ultrasonic testing (UT), the print speed does not play a significant role in impacting the hardness values of GPLA and they are quite consistent at different nozzle temperatures.

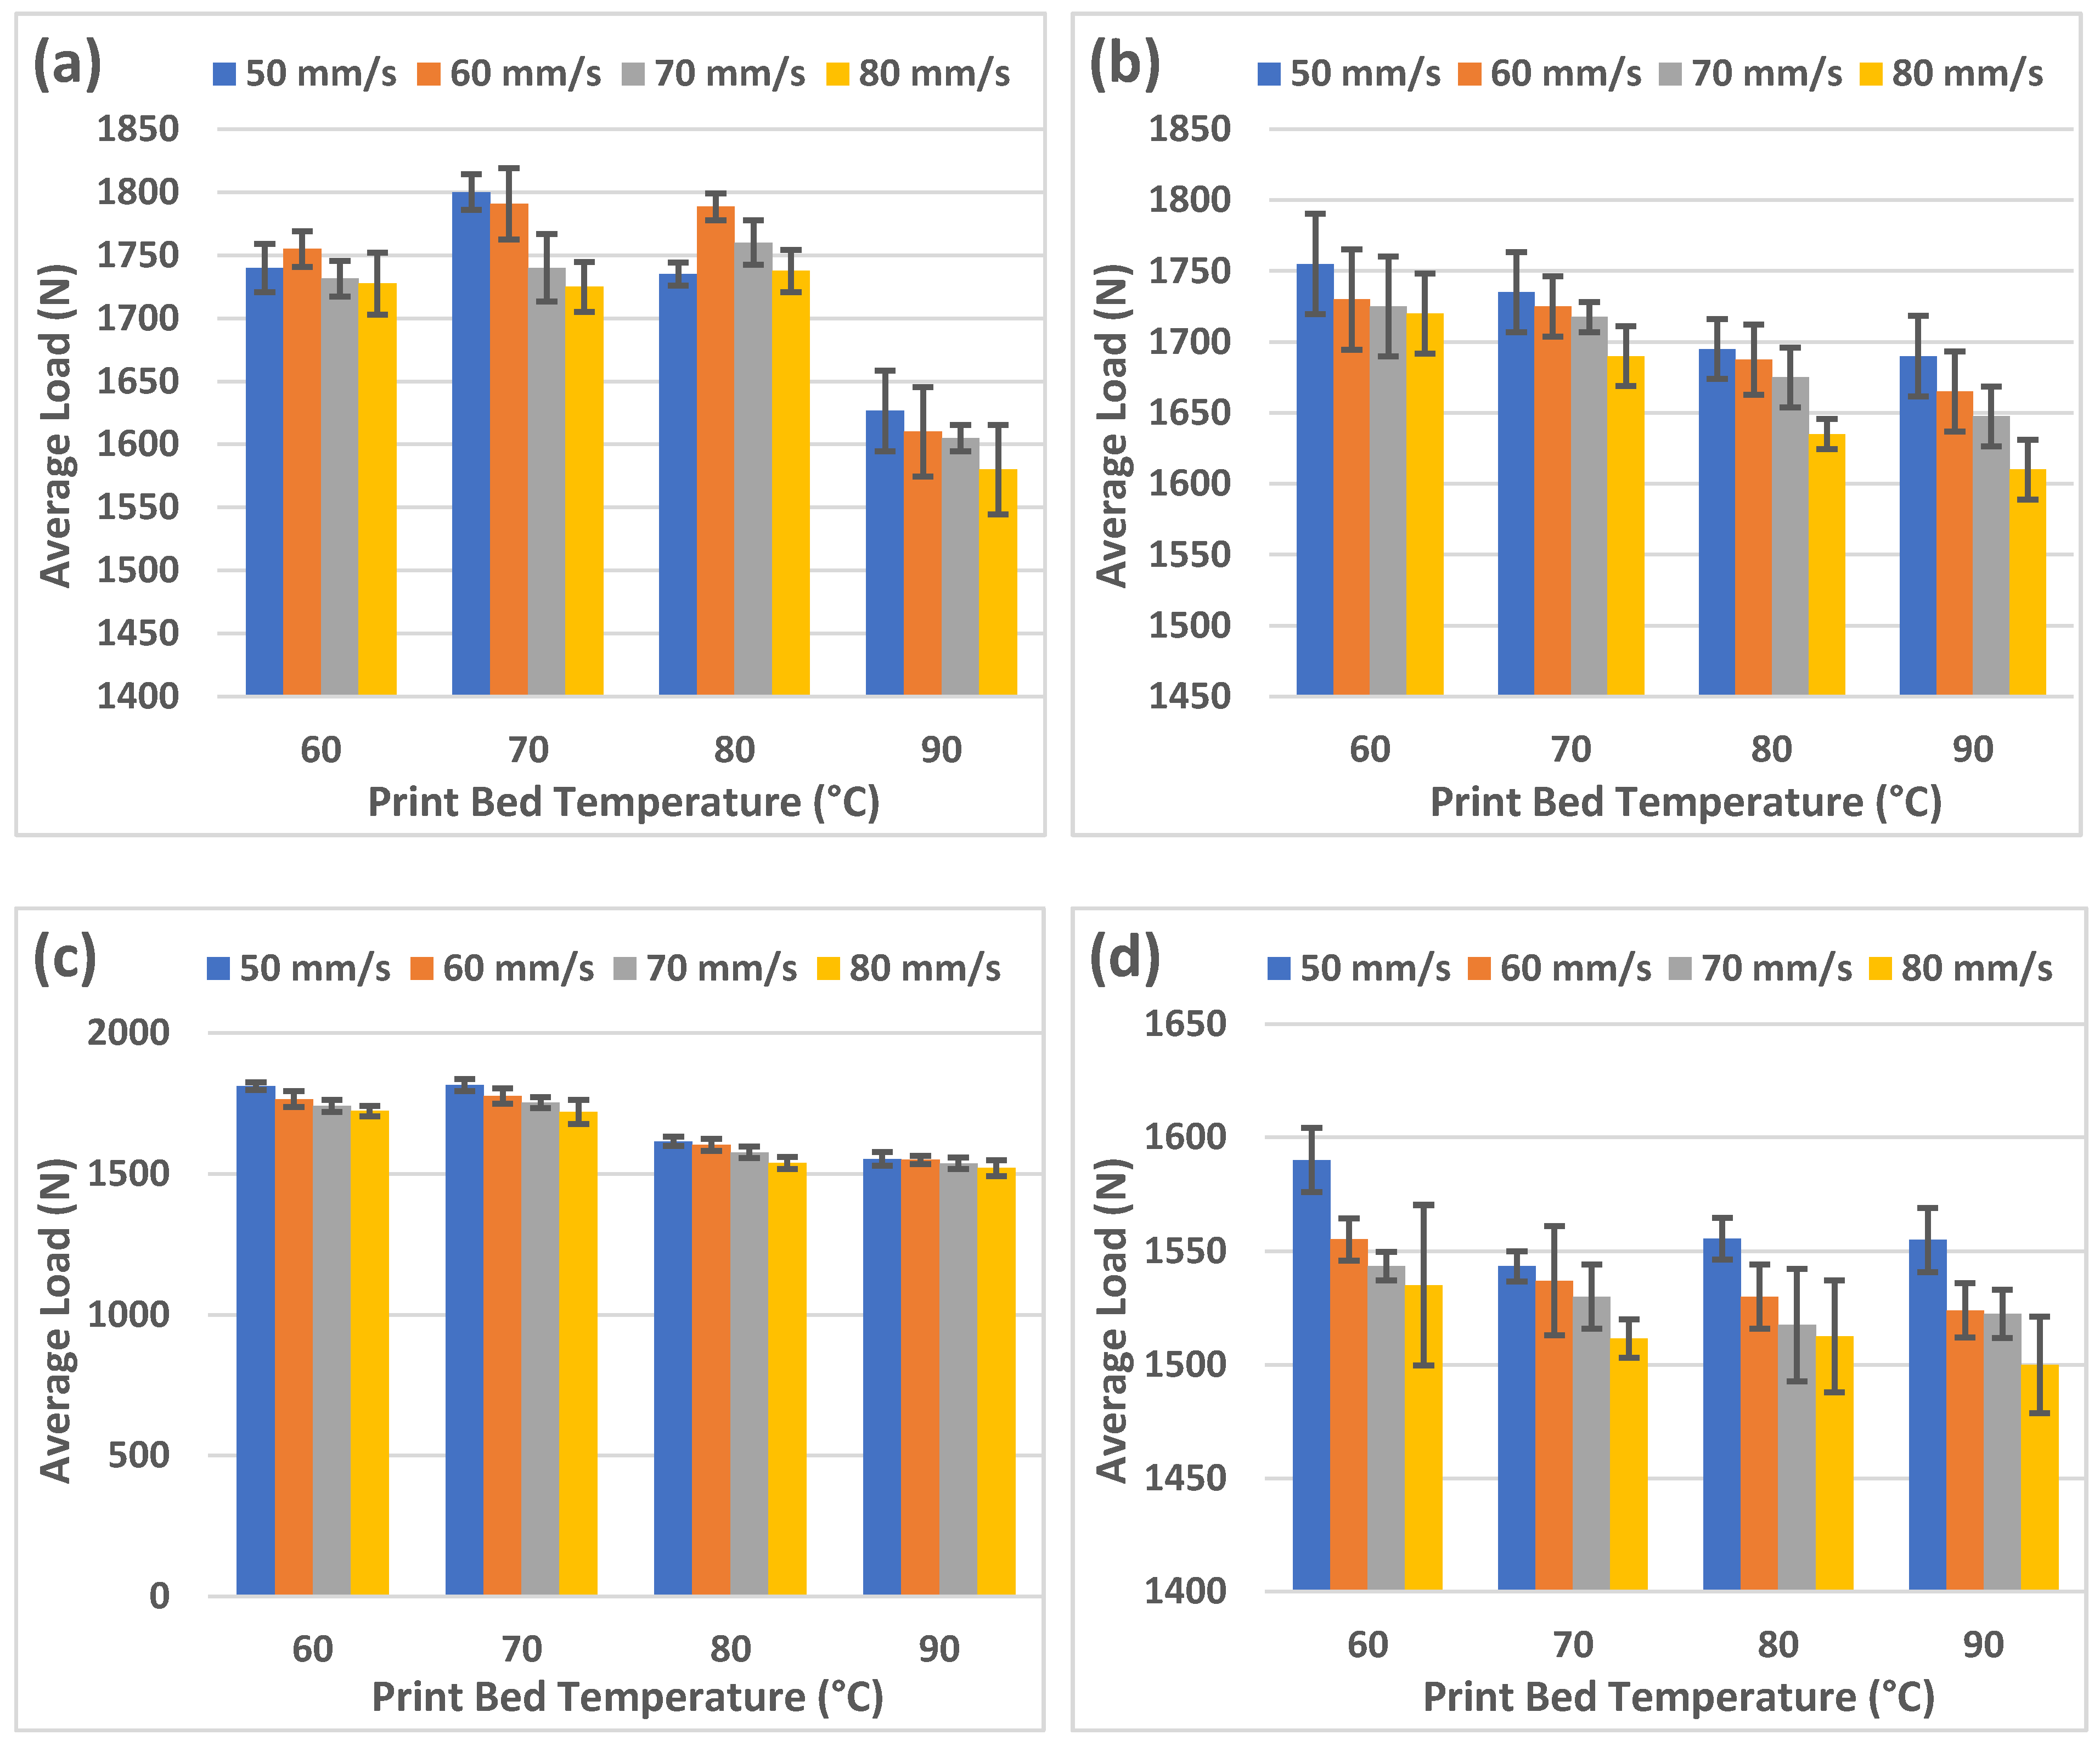
3.3. Tensile Testing

The results from the tensile testing for the different nozzle temperatures are shown in Figure 4. The highest values of load were observed at 180 °C and, as the nozzle temperature increased, the average load values decreased. Nozzle temperatures of 190 °C (Figure 4b) and 210 °C (Figure 4d) showed a decrease in average load values as the print bed temperature increased.
For 180 °C (Figure 4a) and 200 °C (Figure 4c), the average load values increased until 70 °C and then decreased with the increase in print bed temperature. Furthermore, all the samples showed a decrease in average load values with an increase in print speed [37,38], indicating that high print speeds affect the structural integrity of the samples. Linking these results to the ultrasonic testing (Section 3.1), it becomes evident that the same conclusions cannot be drawn. Average fracture loads are clearly affected by print speed whereas UT did not capture significant differences in transmission times as a result of changing print speeds. UT should be able to evaluate the porosity of the printed samples [8,15,22] and lower porosity should lead to higher fracture load values. However, it is to be noted that the differences in the average transmission times and the average loads at different nozzle temperatures is not significantly high. This could be the reason for the UT not being able to capture the impact of changing print speeds.

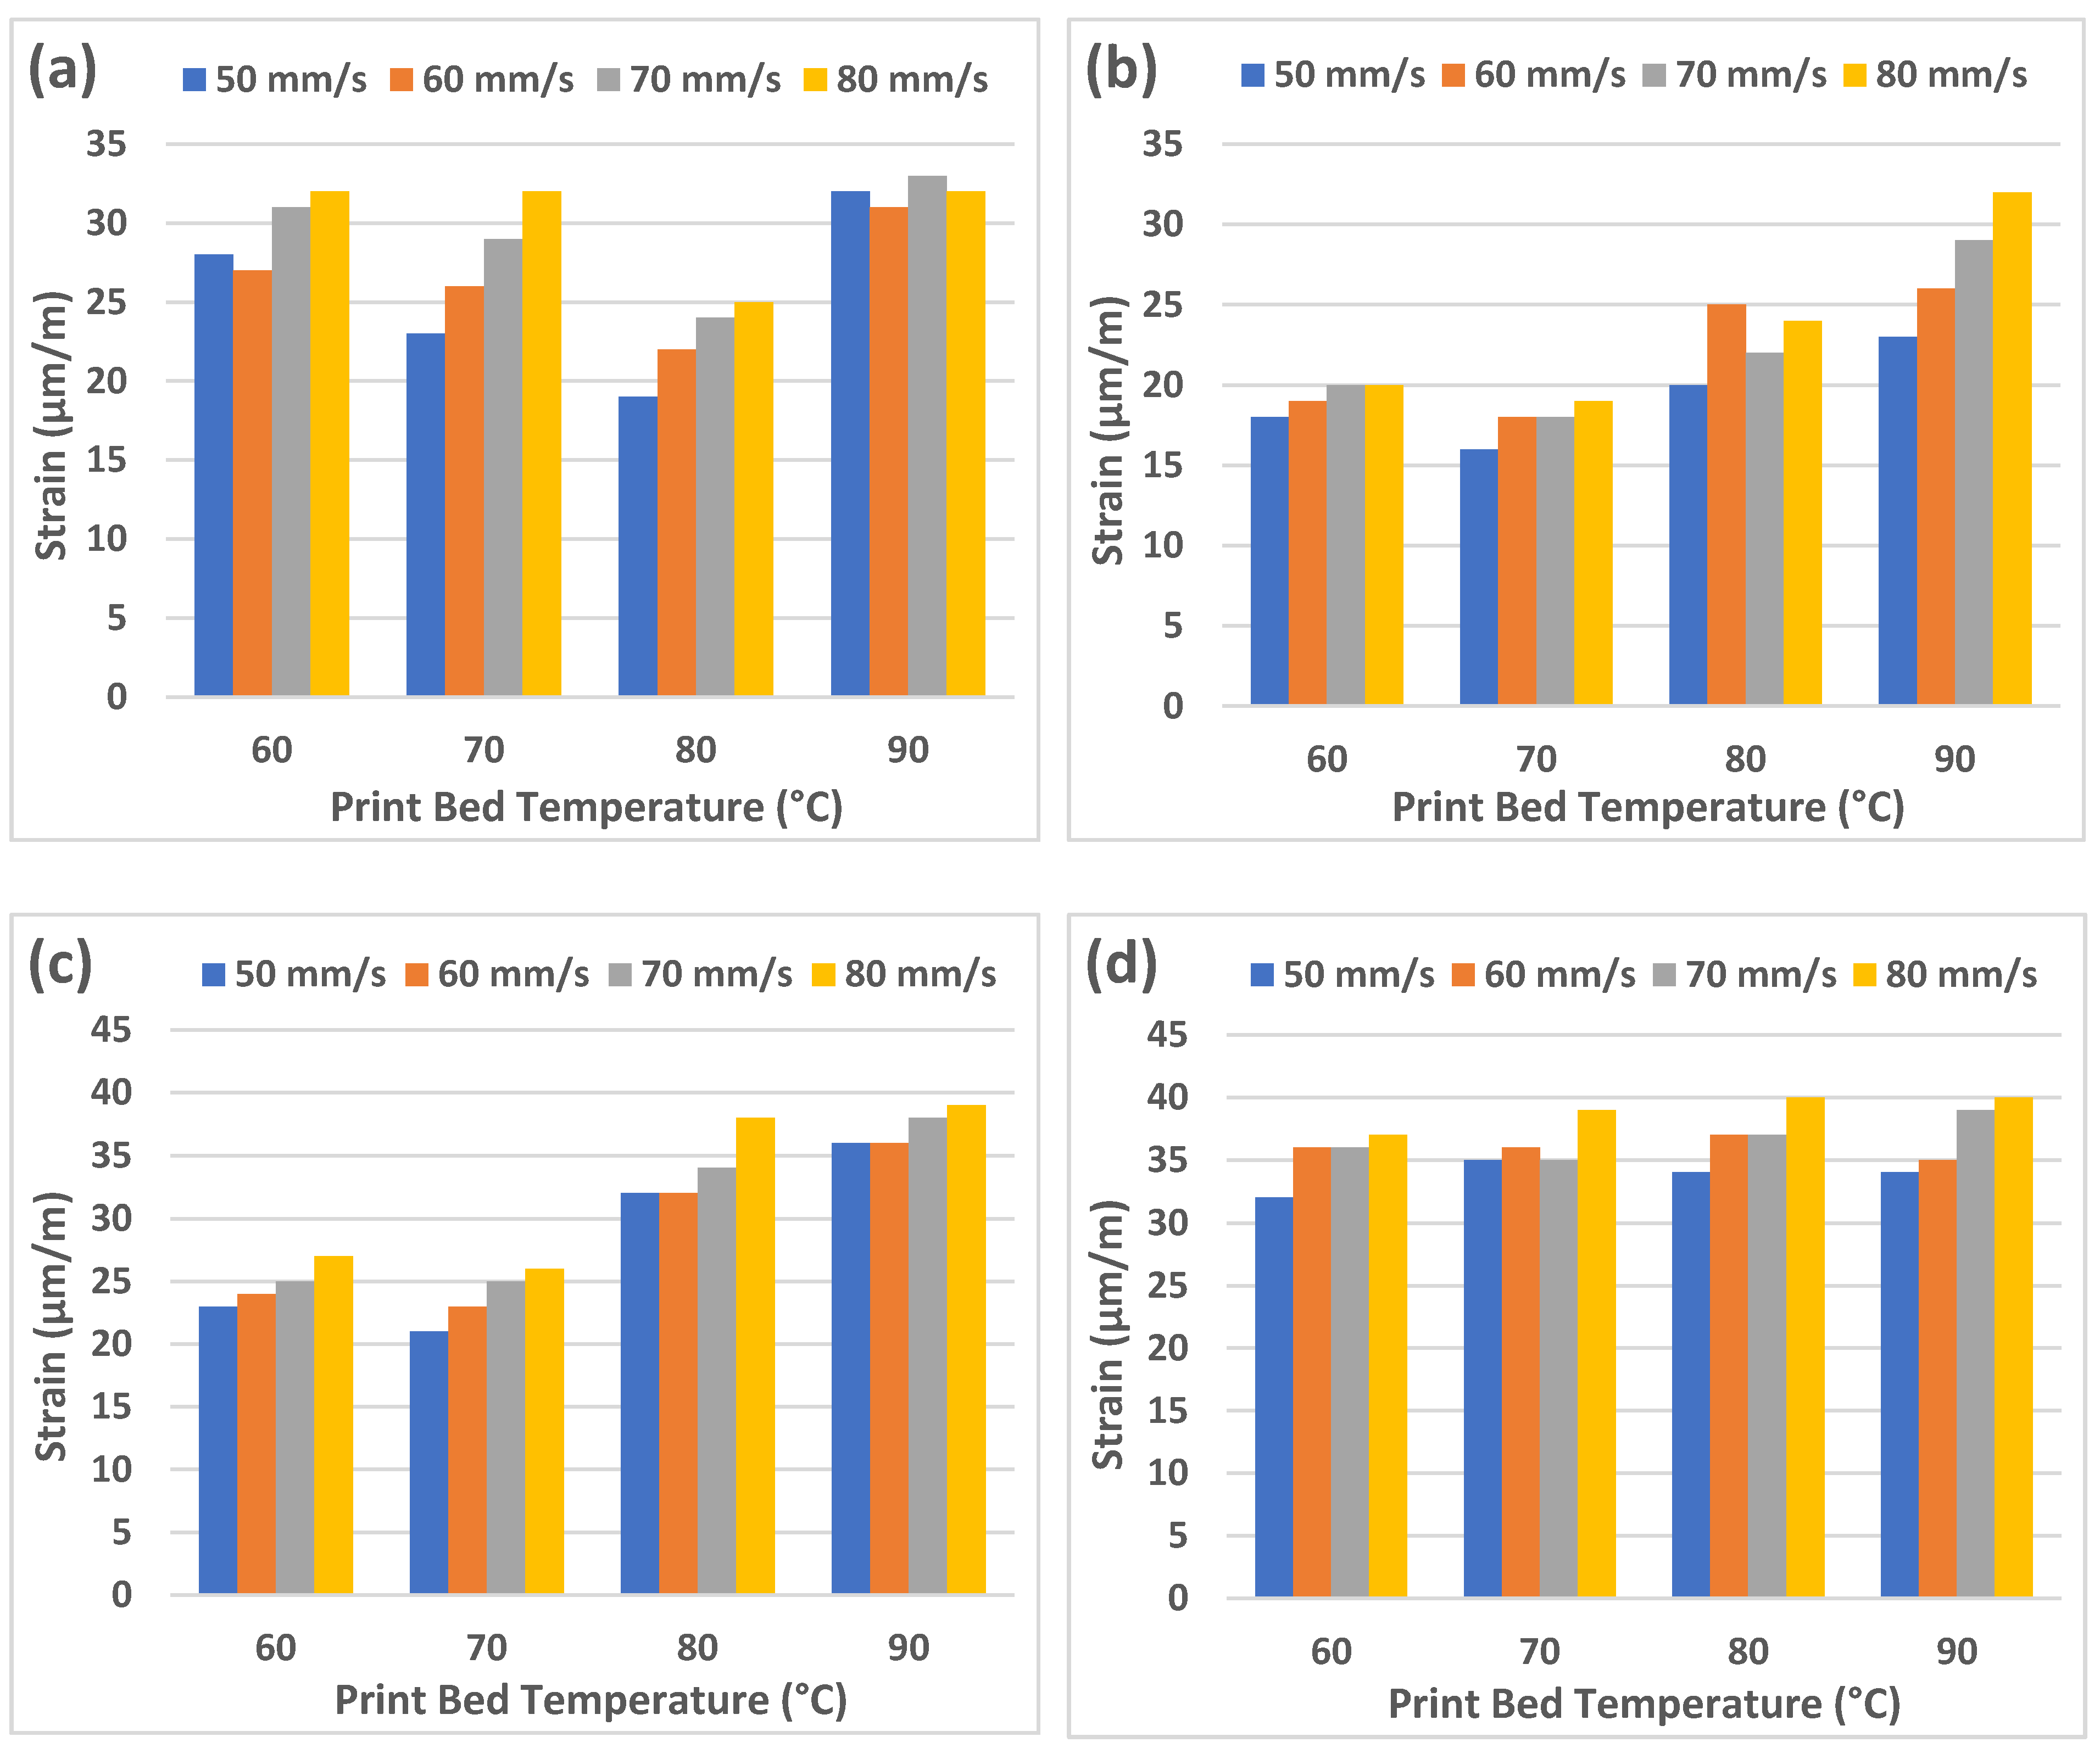
3.4. Strain Measurement

Strain is a crucial factor in determining the strength of a material. In this study, two 350-ohm strain gauges were bonded to all the rectangular samples to measure strain upon the application of a static load of 1000 g (1 kg) at room temperature. The samples were placed on two rollers of 10 mm-diameter, and the strain values were recorded using the HBM QuantumX MX 1615B system. The upper strain gauge recorded the compressive strain whereas the lower gauge measured the tensile strain as the load was being applied in the middle of the sample where the gauges were bonded [33]. The results of the static loading are shown in Figure 5.
Two aspects are evident from Figure 5—i.e., firstly, the nozzle temperature of 190 °C showed the lowest strain values; secondly, the strain values increased with the increase in print speed. The highest strain values were observed at the nozzle temperature of 210 °C in excess of 30 μm/m. Increasing print bed temperatures also affected the strain values with the lowest being observed at 70 °C for nozzle temperatures of 190 °C (Figure 5b) and 200 °C (Figure 5c) before rising sharply. Nozzle temperatures of 180 °C and 210 °C showed slightly different behaviour. With 180 °C, the lowest strain value was observed at 80 °C before rising sharply (Figure 5a) whereas 210 °C nozzle temperature showed the lowest value at the lowest print bed temperature of 60 °C and then gradually rose (Figure 5d). These results indicate that strain measurements represent the effect of the three processing parameters (i.e., nozzle temperature, print bed temperature, and print speed) more effectively compared to ultrasonic testing and hardness testing as both tests were not significantly affected by the print speed. It is to be noted that several factors could affect the strain measurements. They include the size and placement of the strain gauges as well as ambient noise and temperature. This non-destructive test forms the basis for evaluating the flexural properties of the GPLA samples.

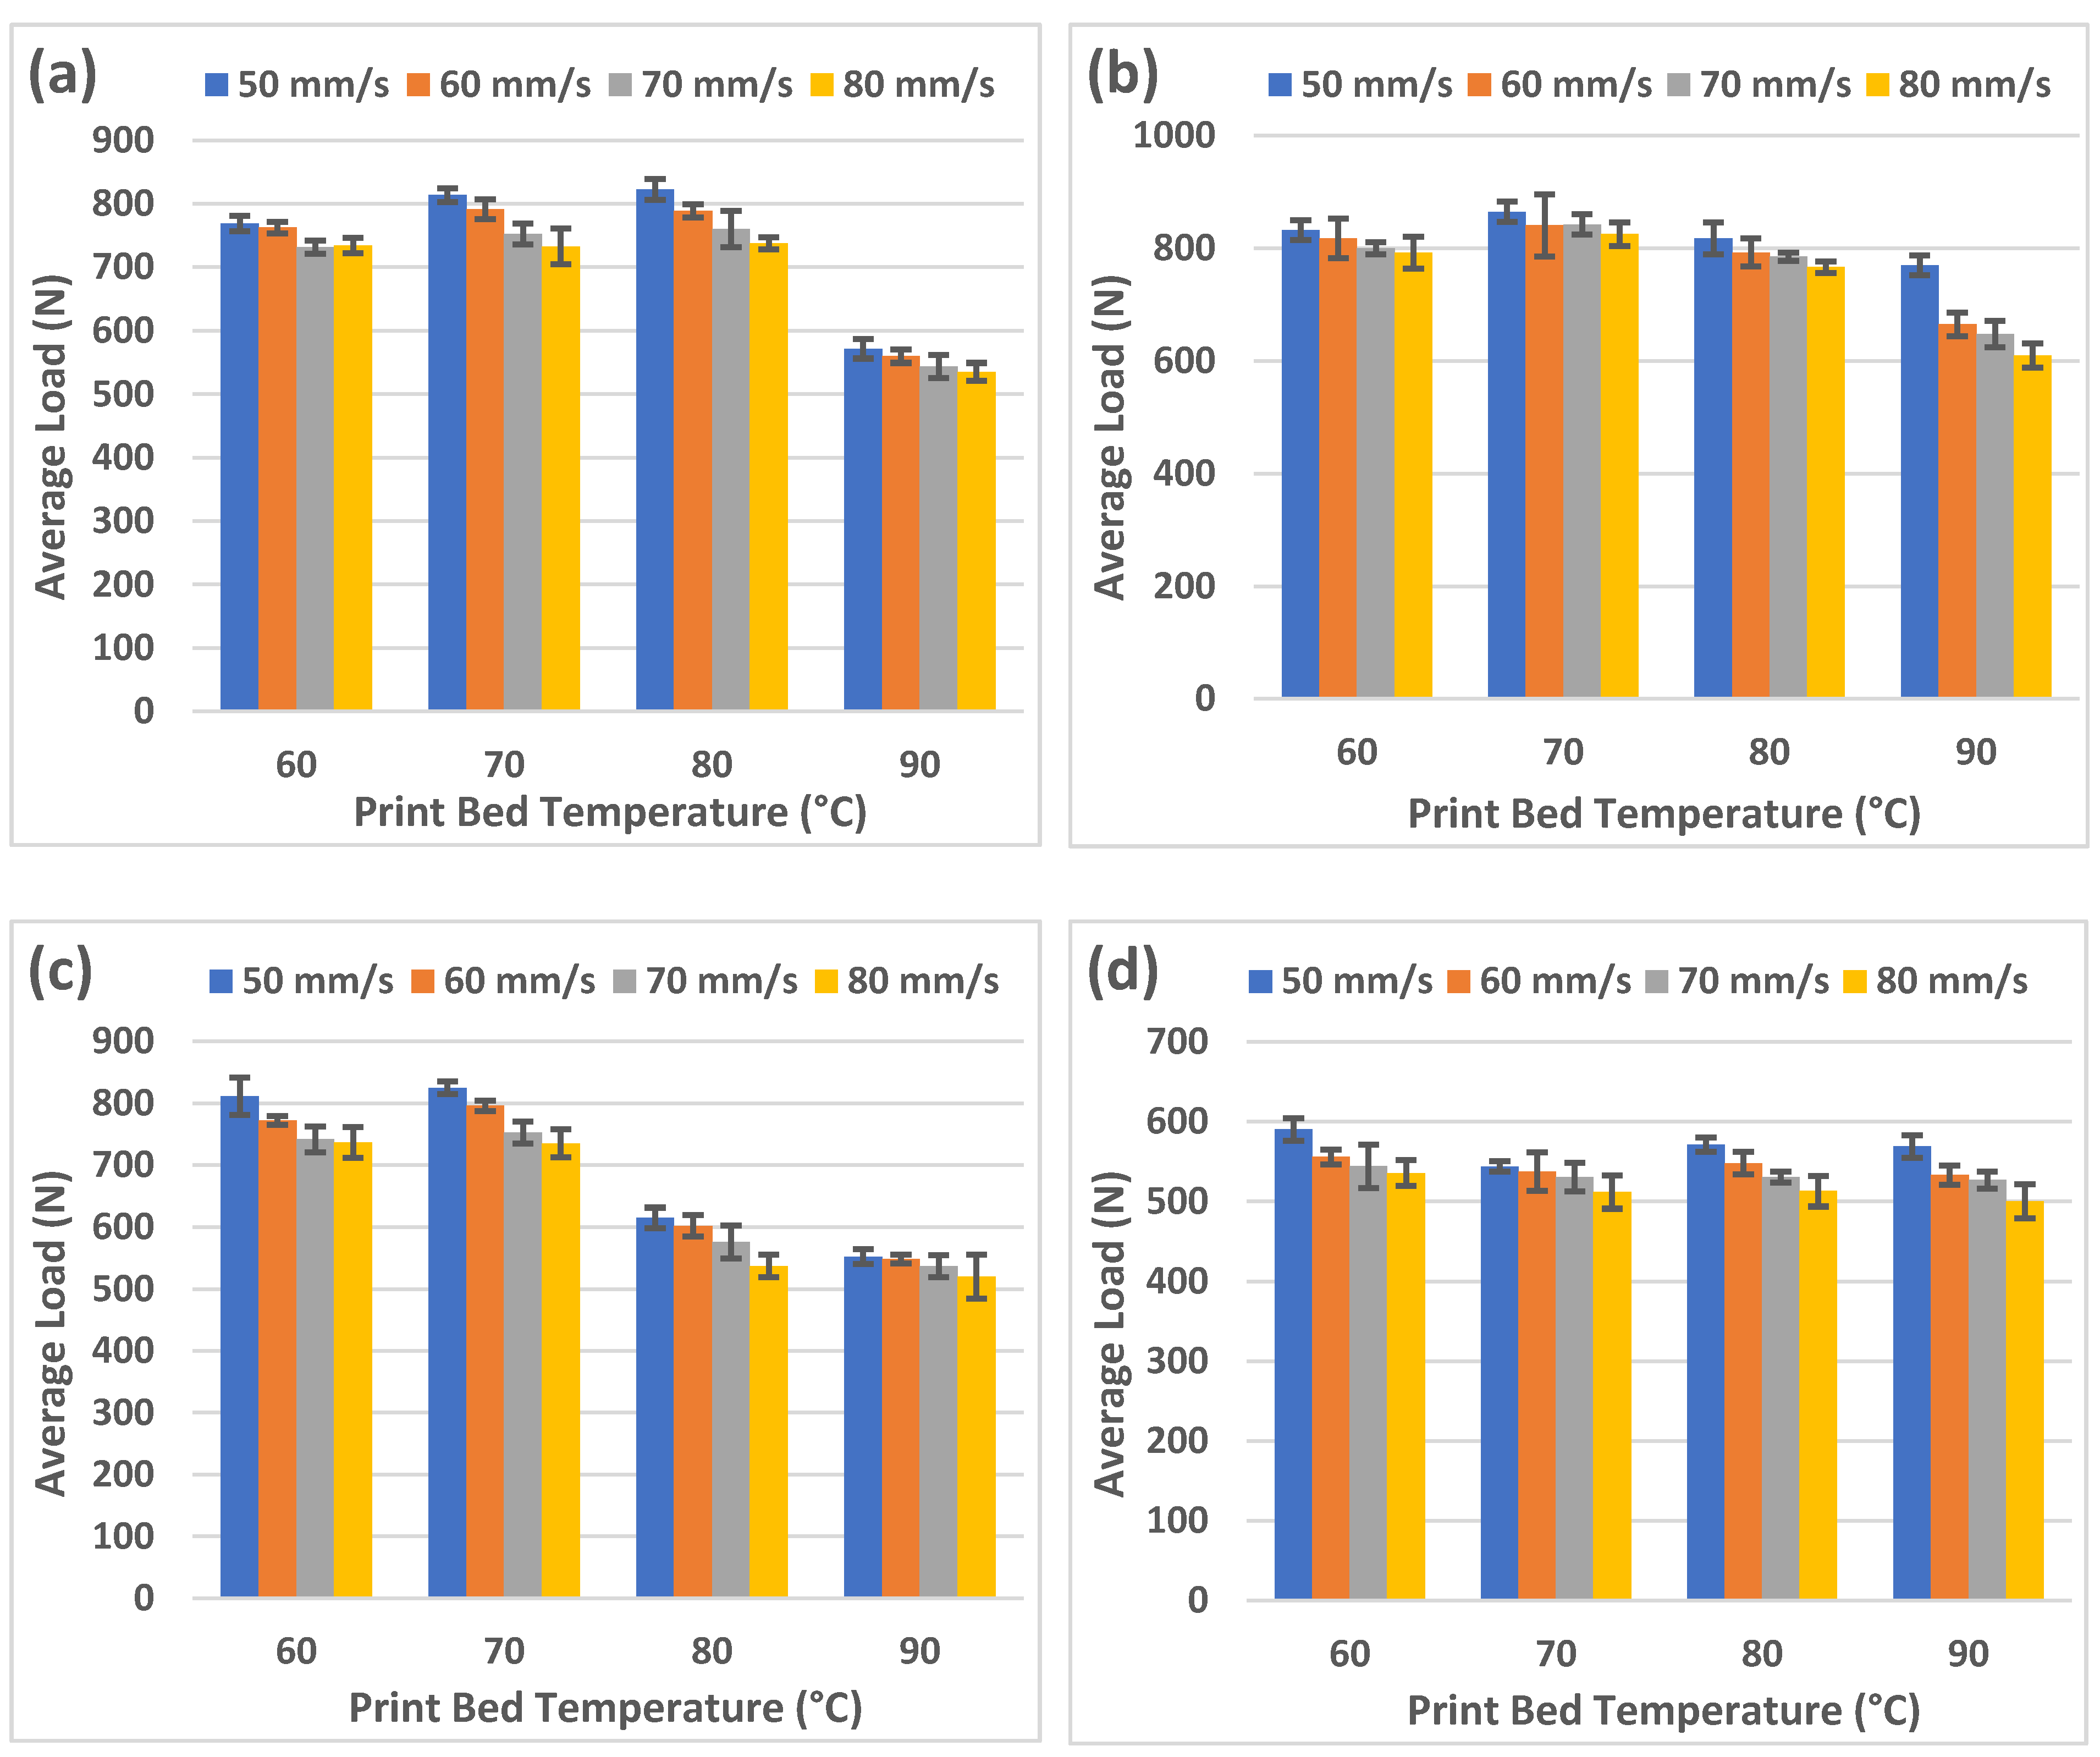
3.5. Three-Point Flexural Testing

This is a destructive test that measures the force required to bend a beam under three-point loading conditions. It is used to determine the flex or bending properties of a material and for selection of parts that will support loads without flexing [6,24,39]. The results from the three-point flexural testing are shown in Figure 6. As the nozzle temperature increased, the average load required to break the samples also increased by reaching its peak at 190 °C but then falling sharply as the temperature increased. With the increase in print bed temperature, the maximum load was observed at 70 °C for nozzle temperatures of 190 °C (Figure 6b) and 200 °C (Figure 6c) before falling sharply. For nozzle temperatures of 180 °C (Figure 6a) and 210 °C (Figure 6d), the maximum load values were observed at 80 °C before falling rapidly. It is also evident from Figure 6 that as the print speed increased, the load values decreased for all the samples, indicating that high print speeds affect the structural integrity of the samples (similar to tensile testing, as discussed in Section 3.3).

4. Correlation between Non-Destructive and Destructive Testing

4.1. For Tensile Testing

This work focuses on analysing the impact of nozzle temperature, print bed temperature, and print speed on the tensile and flexural properties of graphene-enhanced PLA material. It also analyses the effectiveness of three non-destructive methods to evaluate the strength of GPLA. It is important to note that NDT methods should be chosen based on their applicability to assess a certain material property. In this study, the NDT methods of ultrasonic and hardness testing are linked to the tensile properties [8,12,15,22,35,36] of GPLA. These NDT methods can help assess the tensile strength of GPLA samples without breaking them. To verify their effectiveness, Figure 7 shows the correlation between the ultrasonic results and the tensile strength of all the dog-bone samples. It is evident that there is a good correlation between the two test results with the average transmission time falling with rising tensile strength [8,15,22]. This is because samples with higher strength are more closely packed and possess better adhesion of their layers that allow the sound waves to travel quickly through them. It can also be seen in Figure 7 that the transmission times did not significantly change at higher nozzle temperatures, indicating a good correlation as the same aspect was observed from tensile testing results (Section 3.3). However, it is to be noted that ultrasonic testing could not capture all the variations as the values did not show a strong correlation with print speed. Nonetheless, these results help in evaluating the tensile properties of GPLA and ultrasonic testing is a viable NDT method for this purpose.
Similar to ultrasonic testing, hardness also correlates well to tensile properties of a material [35,36]. As can be seen in Figure 8, the hardness values increased with the increase in tensile strength of GPLA and vice versa. This is a useful NDT that can help ascertain the properties of a material without fracturing it. However, imprints are left after a hardness test due to the indentation and can cause issues if surface roughness is a concern. In short, both ultrasonic and hardness testing have shown their capability in correlating well with the tensile properties of GPLA as three of its processing parameters (nozzle temperature, print bed temperature, and print speed) were modified.

4.2. For Flexural Testing

The strain values observed through the non-destructive test (Section 3.4) showed a larger range compared to transmission times and hardness values. This could be attributed to the fact that the setup for strain measurements is quite similar to the three-point flexural testing as a load, albeit static, is being applied at the middle of the rectangular sample [33]. The correlation between strain measurements and flexural strength is shown in Figure 9.
It is evident that the effect of all three processing parameters, i.e., nozzle temperature, print bed temperature, and print speed, has been captured with this correlation for flexural testing. The strain values show a clear dip upon an increase in flexural strength as samples exhibiting higher resistance to bending show lower strain values [40]. It can be observed that all the strain values match very well with the flexural strength values for GPLA. They fall with an increase in flexural strength and rise with a decrease in flexural strength, indicating that this NDT method has captured the impact of all three processing parameters better than the methods used to evaluate the tensile properties of GPLA.

5. Conclusions

Optimisation of process parameters is critical for the fused filament fabrication process to achieve desired results. It is important to understand how different parameters interact and the resulting material properties. One way to evaluate such properties is to use non-destructive testing methods and verify their effectiveness through correlation with destructive testing. In this work, such a correlation has been presented for graphene-enhanced PLA material manufactured using the FFF process at four different nozzle temperatures (180 °C, 190 °C, 200 °C, 210 °C), four different print bed temperatures (60 °C, 70 °C, 80 °C, 90 °C), and four different print speeds (50 mm/s, 60 mm/s, 70 mm/s, 80 mm/s). The presence of graphene nanoplatelets in the PLA matrix can adversely affect the effectiveness of the NDT methods in evaluating the mechanical properties of GPLA with changes in the processing parameters. The results from the mechanical testing showed that the tensile strength of the GPLA samples decreased with an increase in nozzle temperature. Nozzle temperatures of 190 °C and 210 °C showed a decrease in tensile strength as the print bed temperature increased. For 180 °C and 200 °C, the tensile strength increased until 70 °C and then decreased with the increase in print bed temperature. Furthermore, all the samples showed a decrease in average load values with an increase in print speed. Flexural testing showed that as the nozzle temperature increased, the flexural strength increased by reaching its peak at 190 °C, but then falling sharply as the temperature increased. With the increase in print bed temperature, the maximum flexural strength was observed at 70 °C for nozzle temperatures of 190 °C and 200 °C, before falling sharply. For nozzle temperatures of 180 °C and 210 °C, the maximum flexural strength was observed at 80 °C before falling rapidly. Similar to tensile testing, the flexural strength decreased with an increase in print speed.
NDT methods of ultrasonic and hardness testing have been correlated with the tensile properties of GPLA. Both the NDT methods exhibited a limited range of values and did not show significant variations due to changes in print speed. However, their correlation was still valid and highlighted their applicability to evaluate tensile strength obtained through destructive tensile testing. The NDT method of strain measurement showed a wide range of values corresponding to the changes in the three process parameters. These measurements also showed a better correlation with the destructive three-point flexural test because the application of load, albeit static, was similar to how the load is applied during flexural testing. The results presented in this work show a good correlation between non-destructive and destructive tests to highlight the effectiveness of these practices in evaluating the properties of different materials manufactured using the fused filament fabrication process. They also indicate that the presence of graphene nanoplatelets in the PLA matrix did not adversely affect the results of the NDT tests and such tests can be used to evaluate the properties of composite FFF filaments effectively. Furthermore, these results hold significant scientific, technological, and industrial merit as they can help manufacturers identify and understand how different processing parameters interact and which NDT methods are effective in analysing the required material properties. Furthermore, the quantitative values for the mechanical properties of GPLA can support complex simulations for the optimisation of intricate geometries to be printed.

Author Contributions

Conceptualization, J.B.; methodology, J.B.; validation J.B.; formal analysis J.B.; investigation, J.B.; writing—original draft preparation, J.B.; writing—review and editing, J.B.; resources, J.B., R.B. and V.M.; data curation, J.B., R.B. and V.M.; visualization, J.B. and R.B.; project administration, J.B. and R.B. All authors have read and agreed to the published version of the manuscript.

Funding

This research received no external funding.

Data Availability Statement

The data used in this research work can be made available upon request.

Conflicts of Interest

The authors declare no conflict of interest.

References

  1. Gomes, T.E.; Cadete, M.S.; Dias-de-Oliveira, J.; Neto, V. Controlling the properties of parts 3D printed from recycled thermoplastics: A review of current practices. Polym. Degrad. Stab. 2022, 196, 109850. [Google Scholar] [CrossRef]
  2. Butt, J.; Shirvani, H. Additive, subtractive, and hybrid manufacturing processes. In Advances in Manufacturing and Processing of Materials and Structures; CRC Press: Boca Raton, FL, USA, 2018; pp. 187–218. [Google Scholar]
  3. Gardner, J.M.; Stelter, C.J.; Sauti, G.; Kim, J.W.; Yashin, E.A.; Wincheski, R.A.; Schniepp, H.C.; Siochi, E.J. Environment control in additive manufacturing of high-performance thermoplastics. Int. J. Adv. Manuf. Technol. 2022, 119, 6423–6433. [Google Scholar] [CrossRef]
  4. Gao, J. Production of multiple material parts using a desktop 3D printer. In Advances in Manufacturing Technology XXXI, Proceedings of the 15th International Conference on Manufacturing Research, Incorporating the 32nd National Conference on Manufacturing Research, University of Greenwich, London, UK, 5–7 September 2017; IOS Press: Amsterdam, The Netherlands, 2017; Volume 6, p. 148. [Google Scholar]
  5. Butt, J.; Onimowo, D.A.; Gohrabian, M.; Sharma, T.; Shirvani, H. A desktop 3D printer with dual extruders to produce customised electronic circuitry. Front. Mech. Eng. 2018, 13, 528–534. [Google Scholar] [CrossRef]
  6. Butt, J.; Oxford, P.; Sadeghi-Esfahlani, S.; Ghorabian, M.; Shirvani, H. Hybrid Manufacturing and Mechanical Characterization of Cu/PLA Composites. Arab. J. Sci. Eng. 2020, 45, 9339–9356. [Google Scholar] [CrossRef]
  7. Struzziero, G.; Barbezat, M.; Skordos, A.A. Assessment of the benefits of 3D printing of advanced thermosetting composites using process simulation and numerical optimisation. Addit. Manuf. 2022, 54, 102719. [Google Scholar] [CrossRef]
  8. Butt, J.; Bhaskar, R. Investigating the effects of annealing on the mechanical properties of FFF-printed thermoplastics. J. Manuf. Mater. Process. 2020, 4, 38. [Google Scholar] [CrossRef]
  9. Lu, Q.Y.; Wong, C.H. Applications of non-destructive testing techniques for post-process control of additively manufactured parts. Virtual Phys. Prototyp. 2017, 12, 301–321. [Google Scholar] [CrossRef]
  10. Boyes, W. (Ed.) Instrumentation Reference Book; Butterworth-Heinemann: Oxford, UK, 2009. [Google Scholar]
  11. Mwema, F.M.; Akinlabi, E.T.; Fatoba, O.S. Visual assessment of 3D printed elements: A practical quality assessment for home-made FDM products. Mater. Today Proc. 2020, 26, 1520–1525. [Google Scholar] [CrossRef]
  12. Fayazbakhsh, K.; Honarvar, F.; Amini, H.; Varvani-Farahani, A. High frequency phased array ultrasonic testing of thermoplastic tensile specimens manufactured by fused filament fabrication with embedded defects. Addit. Manuf. 2021, 47, 102335. [Google Scholar] [CrossRef]
  13. Seppala, J.E.; Migler, K.D. Infrared thermography of welding zones produced by polymer extrusion additive manufacturing. Addit. Manuf. 2016, 12, 71–76. [Google Scholar] [CrossRef] [Green Version]
  14. Li, F.; Yu, Z.; Yang, Z. Failure characterization of PLA parts fabricated by fused deposition modeling using acoustic emission. Rapid Prototyp. J. 2020, 26, 1177–1182. [Google Scholar] [CrossRef]
  15. Butt, J.; Hewavidana, Y.; Mohaghegh, V.; Sadeghi-Esfahlani, S.; Shirvani, H. Hybrid manufacturing and experimental testing of glass fiber enhanced thermoplastic composites. J. Manuf. Mater. Process. 2019, 3, 96. [Google Scholar] [CrossRef] [Green Version]
  16. Heidari-Rarani, M.; Rafiee-Afarani, M.; Zahedi, A.M. Mechanical characterization of FDM 3D printing of continuous carbon fiber reinforced PLA composites. Compos. Part B Eng. 2019, 175, 107147. [Google Scholar] [CrossRef]
  17. Yu, S.; Hwang, Y.H.; Hwang, J.Y.; Hong, S.H. Analytical study on the 3D-printed structure and mechanical properties of basalt fiber-reinforced PLA composites using X-ray microscopy. Compos. Sci. Technol. 2019, 175, 18–27. [Google Scholar] [CrossRef]
  18. Mohan, V.B.; Lau, K.T.; Hui, D.; Bhattacharyya, D. Graphene-based materials and their composites: A review on production, applications and product limitations. Compos. Part B Eng. 2018, 142, 200–220. [Google Scholar] [CrossRef]
  19. Caminero, M.Á.; Chacón, J.M.; García-Plaza, E.; Núñez, P.J.; Reverte, J.M.; Becar, J.P. Additive manufacturing of PLA-based composites using fused filament fabrication: Effect of graphene nanoplatelet reinforcement on mechanical properties, dimensional accuracy and texture. Polymers 2019, 11, 799. [Google Scholar] [CrossRef] [Green Version]
  20. El Magri, A.; Vanaei, S.; Shirinbayan, M.; Vaudreuil, S.; Tcharkhtchi, A. An investigation to study the effect of process parameters on the strength and fatigue behavior of 3D-printed PLA-graphene. Polymers 2021, 13, 3218. [Google Scholar] [CrossRef]
  21. García, E.; Núñez, P.J.; Chacón, J.M.; Caminero, M.A.; Kamarthi, S. Comparative study of geometric properties of unreinforced PLA and PLA-Graphene composite materials applied to additive manufacturing using FFF technology. Polym. Test. 2020, 91, 106860. [Google Scholar] [CrossRef]
  22. Butt, J.; Bhaskar, R.; Mohaghegh, V. Investigating the effects of extrusion temperatures and material extrusion rates on FFF-printed thermoplastics. Int. J. Adv. Manuf. Technol. 2021, 117, 2679–2699. [Google Scholar] [CrossRef]
  23. Cicero, S.; Martínez-Mata, V.; Castanon-Jano, L.; Alonso-Estebanez, A.; Arroyo, B. Analysis of notch effect in the fracture behaviour of additively manufactured PLA and graphene reinforced PLA. Theor. Appl. Fract. Mech. 2021, 114, 103032. [Google Scholar] [CrossRef]
  24. Camargo, J.C.; Machado, Á.R.; Almeida, E.C.; Silva, E.F.M.S. Mechanical properties of PLA-graphene filament for FDM 3D printing. Int. J. Adv. Manuf. Technol. 2019, 103, 2423–2443. [Google Scholar] [CrossRef]
  25. Vidakis, N.; Petousis, M.; Savvakis, K.; Maniadi, A.; Koudoumas, E. A comprehensive investigation of the mechanical behavior and the dielectrics of pure polylactic acid (PLA) and PLA with graphene (GnP) in fused deposition modeling (FDM). Int. J. Plast. Technol. 2019, 23, 195–206. [Google Scholar] [CrossRef]
  26. Bustillos, J.; Montero, D.; Nautiyal, P.; Loganathan, A.; Boesl, B.; Agarwal, A. Integration of graphene in poly (lactic) acid by 3D printing to develop creep and wear-resistant hierarchical nanocomposites. Polym. Compos. 2018, 39, 3877–3888. [Google Scholar] [CrossRef]
  27. Haydale. Available online: https://www.haydale.com/products/ (accessed on 7 April 2022).
  28. BS EN ISO 527-2:2012; Plastics—Determination of Tensile Properties–Part 2: Test Conditions for Moulding and Extrusion Plastics. British, European and International Standard: London, UK, 2012.
  29. BS EN ISO 178:2019; Plastics—Determination of Flexural Properties. British, European and International Standard: London, UK, 2011.
  30. Ultimaker Cura: Advanced 3D Printing Software, Made Accessible. Available online: https://ultimaker.com/en/products/ultimaker-cura-software (accessed on 9 April 2022).
  31. Test Equipment Center: Proceq PUNDIT PL-200. Available online: http://testequipmentscenter.com/index.php?route=product/product&product_id=76 (accessed on 10 April 2022).
  32. BS EN ISO 868:2003; Plastics and Ebonite—Determination of Indentation Hardness by Means of a Durometer (Shore Hardness). British, European and International Standard: London, UK, 2003.
  33. Butt, J.; Shirvani, H. Experimental analysis of metal/plastic composites made by a new hybrid method. Addit. Manuf. 2018, 22, 216–222. [Google Scholar] [CrossRef]
  34. HBM: Strain Gauge Amplifier—QuantumX MX1615B/MX1616B. Available online: https://www.hbm.com/en/3053/quantumx-mx1615b-bridge-amplifier-for-strain-gauges/ (accessed on 11 April 2022).
  35. Hanon, M.M.; Dobos, J.; Zsidai, L. The influence of 3D printing process parameters on the mechanical performance of PLA polymer and its correlation with hardness. Procedia Manuf. 2021, 54, 244–249. [Google Scholar] [CrossRef]
  36. Anderson, I. Mechanical properties of specimens 3D printed with virgin and recycled polylactic acid. 3D Printing. Addit. Manuf. 2017, 4, 110–115. [Google Scholar]
  37. Ansari, A.A.; Kamil, M. Effect of print speed and extrusion temperature on properties of 3D printed PLA using fused deposition modeling process. Mater. Today Proc. 2021, 45, 5462–5468. [Google Scholar] [CrossRef]
  38. Afonso, J.A.; Alves, J.L.; Caldas, G.; Gouveia, B.P.; Santana, L.; Belinha, J. Influence of 3D printing process parameters on the mechanical properties and mass of PLA parts and predictive models. Rapid Prototyp. J. 2021, 27, 487–495. [Google Scholar] [CrossRef]
  39. Rajpurohit, S.R.; Dave, H.K. Flexural strength of fused filament fabricated (FFF) PLA parts on an open-source 3D printer. Adv. Manuf. 2018, 6, 430–441. [Google Scholar] [CrossRef]
  40. Aliheidari, N.; Tripuraneni, R.; Hohimer, C.; Christ, J.; Ameli, A.; Nadimpalli, S. The impact of nozzle and bed temperatures on the fracture resistance of FDM printed materials. In Behavior and Mechanics of Multifunctional Materials and Composites 2017; SPIE: Palermo, Italy, 2017; Volume 10165, pp. 222–230. [Google Scholar]
Figure 1. Samples for testing: (a) tensile sample; (b) flexural sample. Dimensions are in mm.
Jcs 06 00148 g001
Figure 2. Results from ultrasonic testing at different nozzle temperatures: (a) 180 °C; (b) 190 °C; (c) 200 °C; (d) 210 °C.
Jcs 06 00148 g002
Figure 3. Results from hardness testing at different nozzle temperatures: (a) 180 °C; (b) 190 °C; (c) 200 °C; (d) 210 °C.
Jcs 06 00148 g003
Figure 4. Results from tensile testing at different nozzle temperatures: (a) 180 °C; (b) 190 °C; (c) 200 °C; (d) 210 °C.
Jcs 06 00148 g004
Figure 5. Results from strain measurement at different nozzle temperatures: (a) 180 °C; (b) 190 °C; (c) 200 °C; (d) 210 °C.
Jcs 06 00148 g005
Figure 6. Results from three-point flexural testing at different nozzle temperatures: (a) 180 °C; (b) 190 °C; (c) 200 °C; (d) 210 °C.
Jcs 06 00148 g006
Figure 7. Correlation between average transmission times and tensile strength.
Jcs 06 00148 g007
Figure 8. Correlation between hardness and tensile strength.
Jcs 06 00148 g008
Figure 9. Correlation between strain and flexural strength.
Jcs 06 00148 g009
Table 1. Characteristics of graphene-enhanced PLA material.
PropertiesTypical Value
Specific gravity (23 °C)1.11 g/cm3
Melt flow index (210 °C/2.16 kg)11.7 g/10 min
Diameter (Tolerance)1.75 mm (±0.01 mm)
Glass Transition Temperature75 °C
Melting Temperature160 °C
Table 2. Combination of processing parameters (N = nozzle temperature; B = print bed temperature; P = print speed).
SamplesParametersSamplesParameters
S1180 N, 60 B, 50 PS33200 N, 60 B, 50 P
S2180 N, 60 B, 60 PS34200 N, 60 B, 60 P
S3180 N, 60 B, 70 PS35200 N, 60 B, 70 P
S4180 N, 60 B, 80 PS36200 N, 60 B, 80 P
S5180 N, 70 B, 50 PS37200 N, 70 B, 50 P
S6180 N, 70 B, 60 PS38200 N, 70 B, 60 P
S7180 N, 70 B, 70 PS39200 N, 70 B, 70 P
S8180 N, 70 B, 80 PS40200 N, 70 B, 80 P
S9180 N, 80 B, 50 PS41200 N, 80 B, 50 P
S10180 N, 80 B, 60 PS42200 N, 80 B, 60 P
S11180 N, 80 B, 70 PS43200 N, 80 B, 70 P
S12180 N, 80 B, 80 PS44200 N, 80 B, 80 P
S13180 N, 90 B, 50 PS45200 N, 90 B, 50 P
S14180 N, 90 B, 60 PS46200 N, 90 B, 60 P
S15180 N, 90 B, 70 PS47200 N, 90 B, 70 P
S16180 N, 90 B, 80 PS48200 N, 90 B, 80 P
S17190 N, 60 B, 50 PS49210 N, 60 B, 50 P
S18190 N, 60 B, 60 PS50210 N, 60 B, 60 P
S19190 N, 60 B, 70 PS51210 N, 60 B, 70 P
S20190 N, 60 B, 80 PS52210 N, 60 B, 80 P
S21190 N, 70 B, 50 PS53210 N, 70 B, 50 P
S22190 N, 70 B, 60 PS54210 N, 70 B, 60 P
S23190 N, 70 B, 70 PS55210 N, 70 B, 70 P
S24190 N, 70 B, 80 PS56210 N, 70 B, 80 P
S25190 N, 80 B, 50 PS57210 N, 80 B, 50 P
S26190 N, 80 B, 60 PS58210 N, 80 B, 60 P
S27190 N, 80 B, 70 PS59210 N, 80 B, 70 P
S28190 N, 80 B, 80 PS60210 N, 80 B, 80 P
S29190 N, 90 B, 50 PS61210 N, 90 B, 50 P
S30190 N, 90 B, 60 PS62210 N, 90 B, 60 P
S31190 N, 90 B, 70 PS63210 N, 90 B, 70 P
S32190 N, 90 B, 80 PS64210 N, 90 B, 80 P
Publisher’s Note: MDPI stays neutral with regard to jurisdictional claims in published maps and institutional affiliations.

