Article

Mechanical, Thermal and Electrical Properties of Epoxy Nanocomposites with Amine-Functionalized Reduced Graphene Oxide via Plasma Treatment

by
Annika C. Ackermann
1,2,3,*,
Michael Fischer
1,3,
Alexander Wick
1,3,
Stefan Carosella
1,3,
Bronwyn L. Fox
2,3 and
Peter Middendorf
1,3
1
Institute of Aircraft Design, University of Stuttgart, 70569 Stuttgart, Germany
2
Manufacturing Futures Research Institute, Swinburne University of Technology, Melbourne, VIC 3122, Australia
3
ARENA2036 Research Campus, 70569 Stuttgart, Germany
*
Author to whom correspondence should be addressed.
J. Compos. Sci. 2022, 6(6), 153; https://0-doi-org.brum.beds.ac.uk/10.3390/jcs6060153
Submission received: 8 April 2022 / Revised: 25 April 2022 / Accepted: 27 April 2022 / Published: 24 May 2022
(This article belongs to the Special Issue Carbon-Based Polymer Nanocomposites)

Abstract

:
A suitable functionalization of graphene and its derivatives can further enhance the material properties of nanocomposites. In contrast to chemical functionalization methods that have been extensively researched, functionalization by plasma treatment is relatively unexplored. In this work, we compare the mechanical, thermal and electrical characteristics of an epoxy matrix incorporating loadings from 0.00 to 1.50 wt% of non-functionalized (rGO) and amine-functionalized reduced graphene oxide (frGO) for which the functionalization is realized by plasma processing. No significant difference between the rGO- and frGO-including nanocomposites was observed with respect to the stiffness, strength, specific heat capacity, coefficient of thermal expansion and electrical conductivity. Yet, the composites with 1.50 wt% frGO (rGO) exhibited a thermal conductivity that was 27% (20%) higher than the neat polymer due to the enhanced interface, which enabled a better transfer of heat. In addition, a considerable increase in the specific heat capacity and thermal conductivity was established with rising temperatures. This information will facilitate the choice of materials depending on the loading and functionalization of graphene materials for composite applications with an epoxy matrix.

1. Introduction

With increasing demands on the properties of composite materials, the use of new materials has gained much interest. Graphene is of particular importance due to its outstanding mechanical, thermal and electrical properties, which are a result of the special structure of its carbon atoms [1,2,3]. In addition, graphene and its derivatives exhibit a very large surface area, which enables a significant impact on the characteristics of the composite material using very low weight fractions of the used additive [4,5].
There is a vast number of manufacturing methods to produce graphene and its related materials. At the same time, the production of large quantities at comparatively low costs that is of interest for the composite industry is currently only possible via the Hummers’ method and its associated varieties [6,7]. With the Hummers’ method, graphite is first oxidized using different chemicals, such as sulfuric acid, potassium permanganate and hydrogen peroxide, which leads to graphene oxide (GO) as the reaction product [8]. By a subsequent chemical or thermal reduction, the GO is transformed to create reduced graphene oxide [9]. As this procedure is associated with relatively harsh conditions, the quality of the resulting material is significantly lower than the characteristics that may be achieved with other methods, such as mechanical exfoliation or chemical vapor deposition [6,10]. However, the functional groups that remain on the surface of the GO and reduced graphene oxide particles usually allow better coupling actions with polymeric matrices and, hence, these nanocomposites mostly demonstrate a better performance than nanocomposites with single-layer graphene inclusions [11,12].
To further enhance the bonding of the graphene materials with the polymeric matrix and to improve the dispersibility, a tailored functionalization may be applied to the particles [13,14]. In general, it is possible to differentiate between two types of functionalization, non-covalent and covalent functionalization, where the latter enables a larger spectrum of properties and a stronger bonding of the functional groups to the nanoparticle [13]. Furthermore, a covalent bonding between the particles and matrix allows an improved transfer of mechanical loads, phonons and electrons across the interface, which results in a more homogeneous dispersion, as well as superior mechanical, thermal and electrical properties [15,16,17,18]. When using epoxies as the matrix material, a surface functionalization of the particles with amines is of particular interest, since these groups can participate in the polymerization process, especially when an epoxy resin is cured with amine-based hardeners that are commonly used for most composite applications [19,20].
The covalent functionalization of graphene and its derivatives is usually conducted using tedious chemical processes, in which large quantities of hazardous reagents and solvents are used in a number of different non-robust processing steps that currently cannot be scaled to larger volumes [21,22]. An alternative is the use of plasma treatment, which uses the ionized forms of gases, such as NH3 or O2, to create the respective functional groups on the particle’s surface [13]. Even though specialized equipment is required, it is easier to scale by, e.g., increasing the number or size of the reactors. Furthermore, it is a very quick method with typical process times of a few seconds to minutes and does not require further processing steps, such as purification, which is mandatory in chemical functionalization processes [23]. In addition, the plasma typically only impairs the particle’s surface up to depths of a few nanometers, while the bulk composition of the inner layers of few-layered graphene derivatives remain unaffected [24,25,26]. This might result in an enlarged surface roughness, which can be associated with an enhanced interlocking with the matrix and, hence, improved shear modulus and strength [27]. However, the performance of nanocomposites with plasma-functionalized graphene and its derivatives is currently poorly understood.
In this study, we report the influence of increasing the weight fraction from 0.00 to 1.50 wt% of two forms of reduced graphene oxide on the mechanical, thermal and electrical characteristics of nanocomposite samples with a matrix consisting of a bisphenol-A-(epichlorohydrin) epoxy resin and an amine-based hardener. A non-functionalized grade of reduced graphene oxide (rGO) is compared to an amine-functionalized form of reduced graphene oxide (frGO), for which the functional groups are realized via plasma treatment. First, the impact of the plasma processing on the morphology and elemental composition of the rGO and frGO powders is evaluated. Second, a thorough characterization of the mechanical, thermal and electrical properties is carried out to classify the effects of both rGO and frGO. We believe that this information will help to predict the properties of nanocomposites with inclusions of rGO as well as frGO, and will also facilitate the choice of materials with respect to the use of functionalized additives. It will also enable further areas of applications, such as the use in fiber-reinforced polymers [28], thermal interface materials [29,30], electromagnetic shielding [31] or sensory materials [32,33].

2. Materials and Methods

2.1. Materials

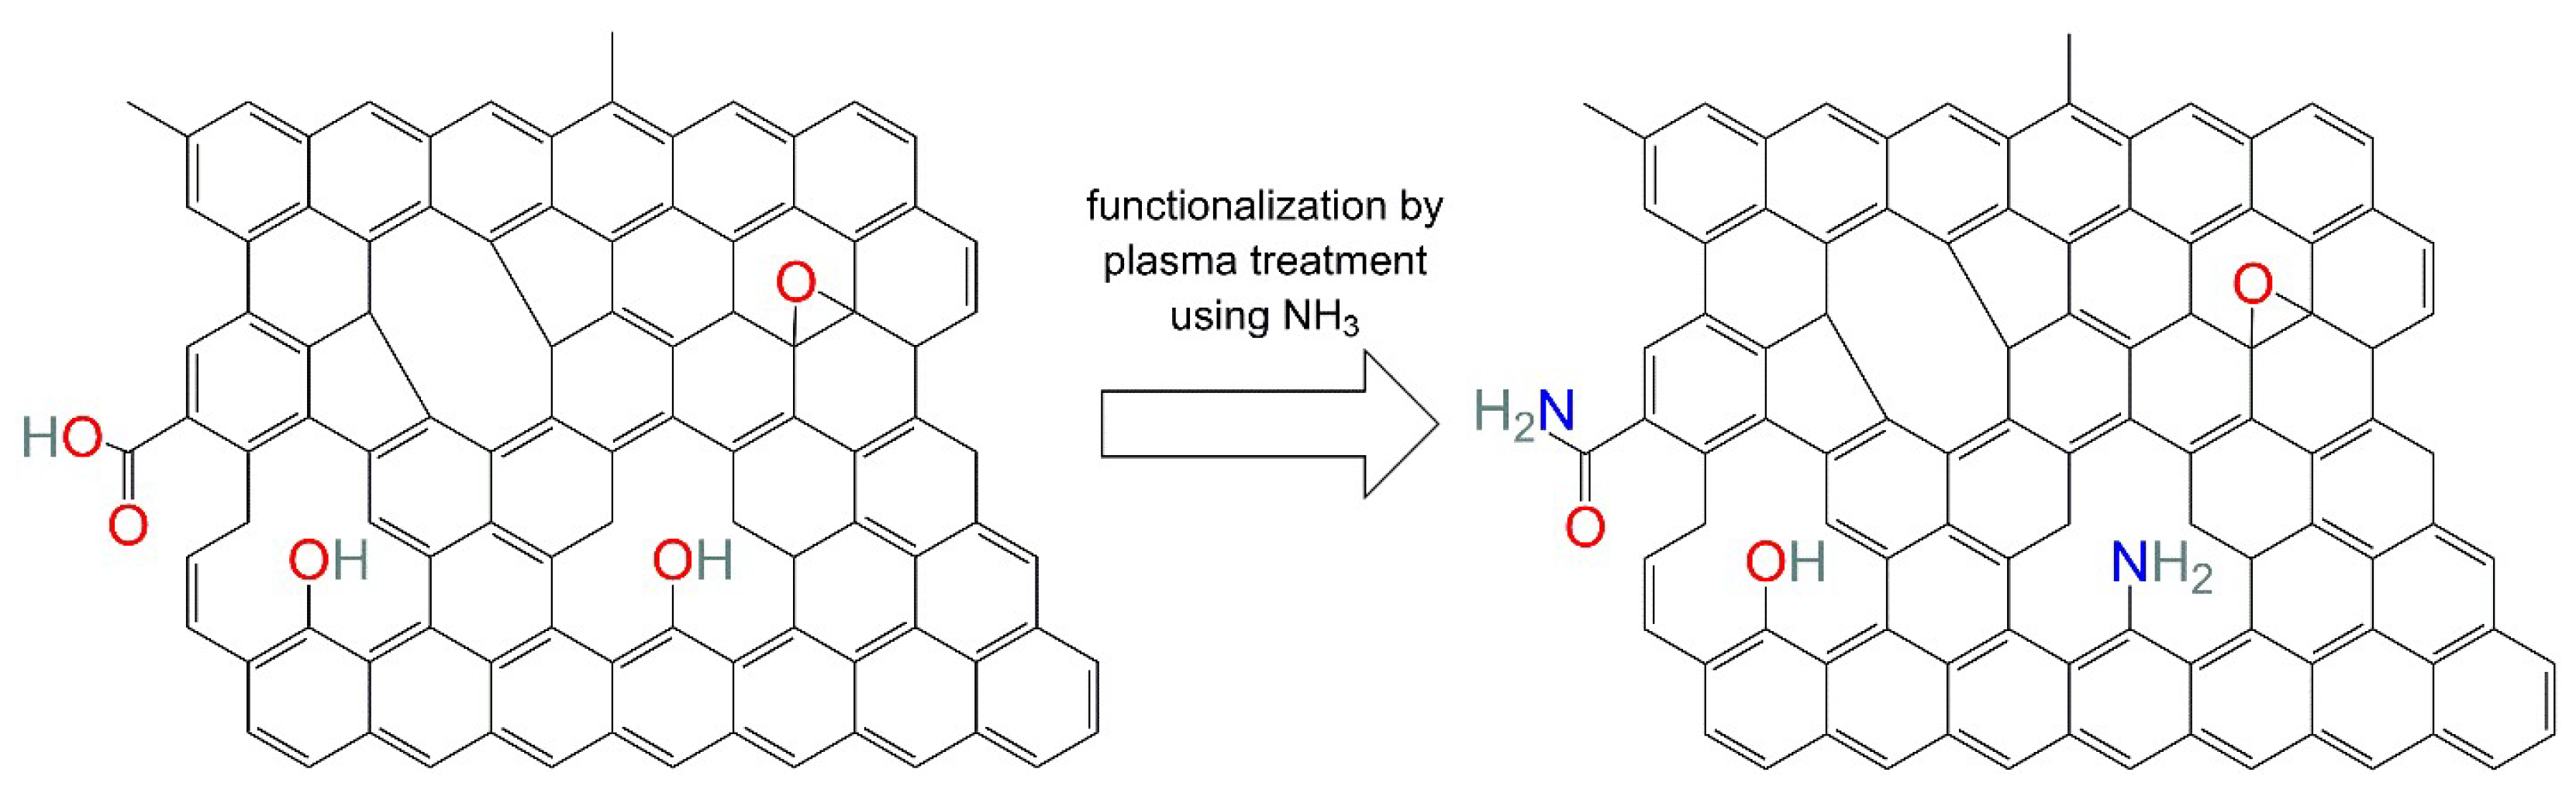
Two varieties of reduced graphene oxide were supplied by Graphit Kropfmühl (Hauzenberg, Germany). Both particles were produced by the manufacturer by treating natural graphite flakes (RFL 99,5 O) with a modified Hummers’ method. EXG 98 300 R was used as the non-functionalized form of reduced graphene oxide (rGO). The material EXG 98 300 R FNH was exposed to a cold, low-pressure gas plasma process using NH3 as the source for the plasma treatment and, hence, leading to an amine-functionalized form of reduced graphene oxide (frGO). The two powder materials were used as received.
The bisphenol-A-(epichlorohydrin) epoxy resin Biresin® CR83 was used in conjunction with the amine-based hardener Biresin® CH83-10 from Sika Deutschland (Stuttgart, Germany) to create the matrix material. This two-part system has a low-mixed viscosity (155 mPa s at 25 °C), which facilitates the manufacturing of nanocomposite samples. Furthermore, the amine-based hardener matches the applied functionalization of the frGO particles.

2.2. Sample Preparation

In order to achieve a homogeneous dispersion of the particles in the polymeric matrix, the rGO or frGO particles were pre-dispersed in the neat epoxy resin by manual mixing. This suspension was subsequently led through the three-roll mill 80S PLUS from EXAKT Advanced Technologies (Norderstedt, Germany) using eight cycles with different gap widths, as stated in Table 1. During the dispersion process, the three-roll mill was running at a speed ratio of 1:3:9, where the velocity of the fastest roller was set to 200 rpm. The hereby-created masterbatches allowed the production of specimens with a maximum concentration of 1.50 wt% rGO or frGO. For the manufacturing of the nanocomposite samples with concentrations of 0.25 wt%, 0.50 wt%, 0,75 wt%, 1.00 wt% and 1.50 wt%, the hardener was added to the respective amount of masterbatch and, if required, more resin was added to dilute the masterbatch to lower concentrations. A constant resin/hardener mixing ratio of 100:30 parts by weight was applied for all nanocomposite and neat polymer samples. The respective suspension was subsequently stirred by hand and degassed in a vacuum chamber. Later, the uncured materials were casted into molds and left to cure for 48 h at room temperature. Next, the various cured material configurations underwent a thermal treatment, in which they were heated from room temperature to 70 °C at a rate of 0.2 °C min−1, kept at 70 °C for 12 h and subsequently cooled to room temperature at a rate of 0.5 °C min−1.

2.3. Sample Characterization

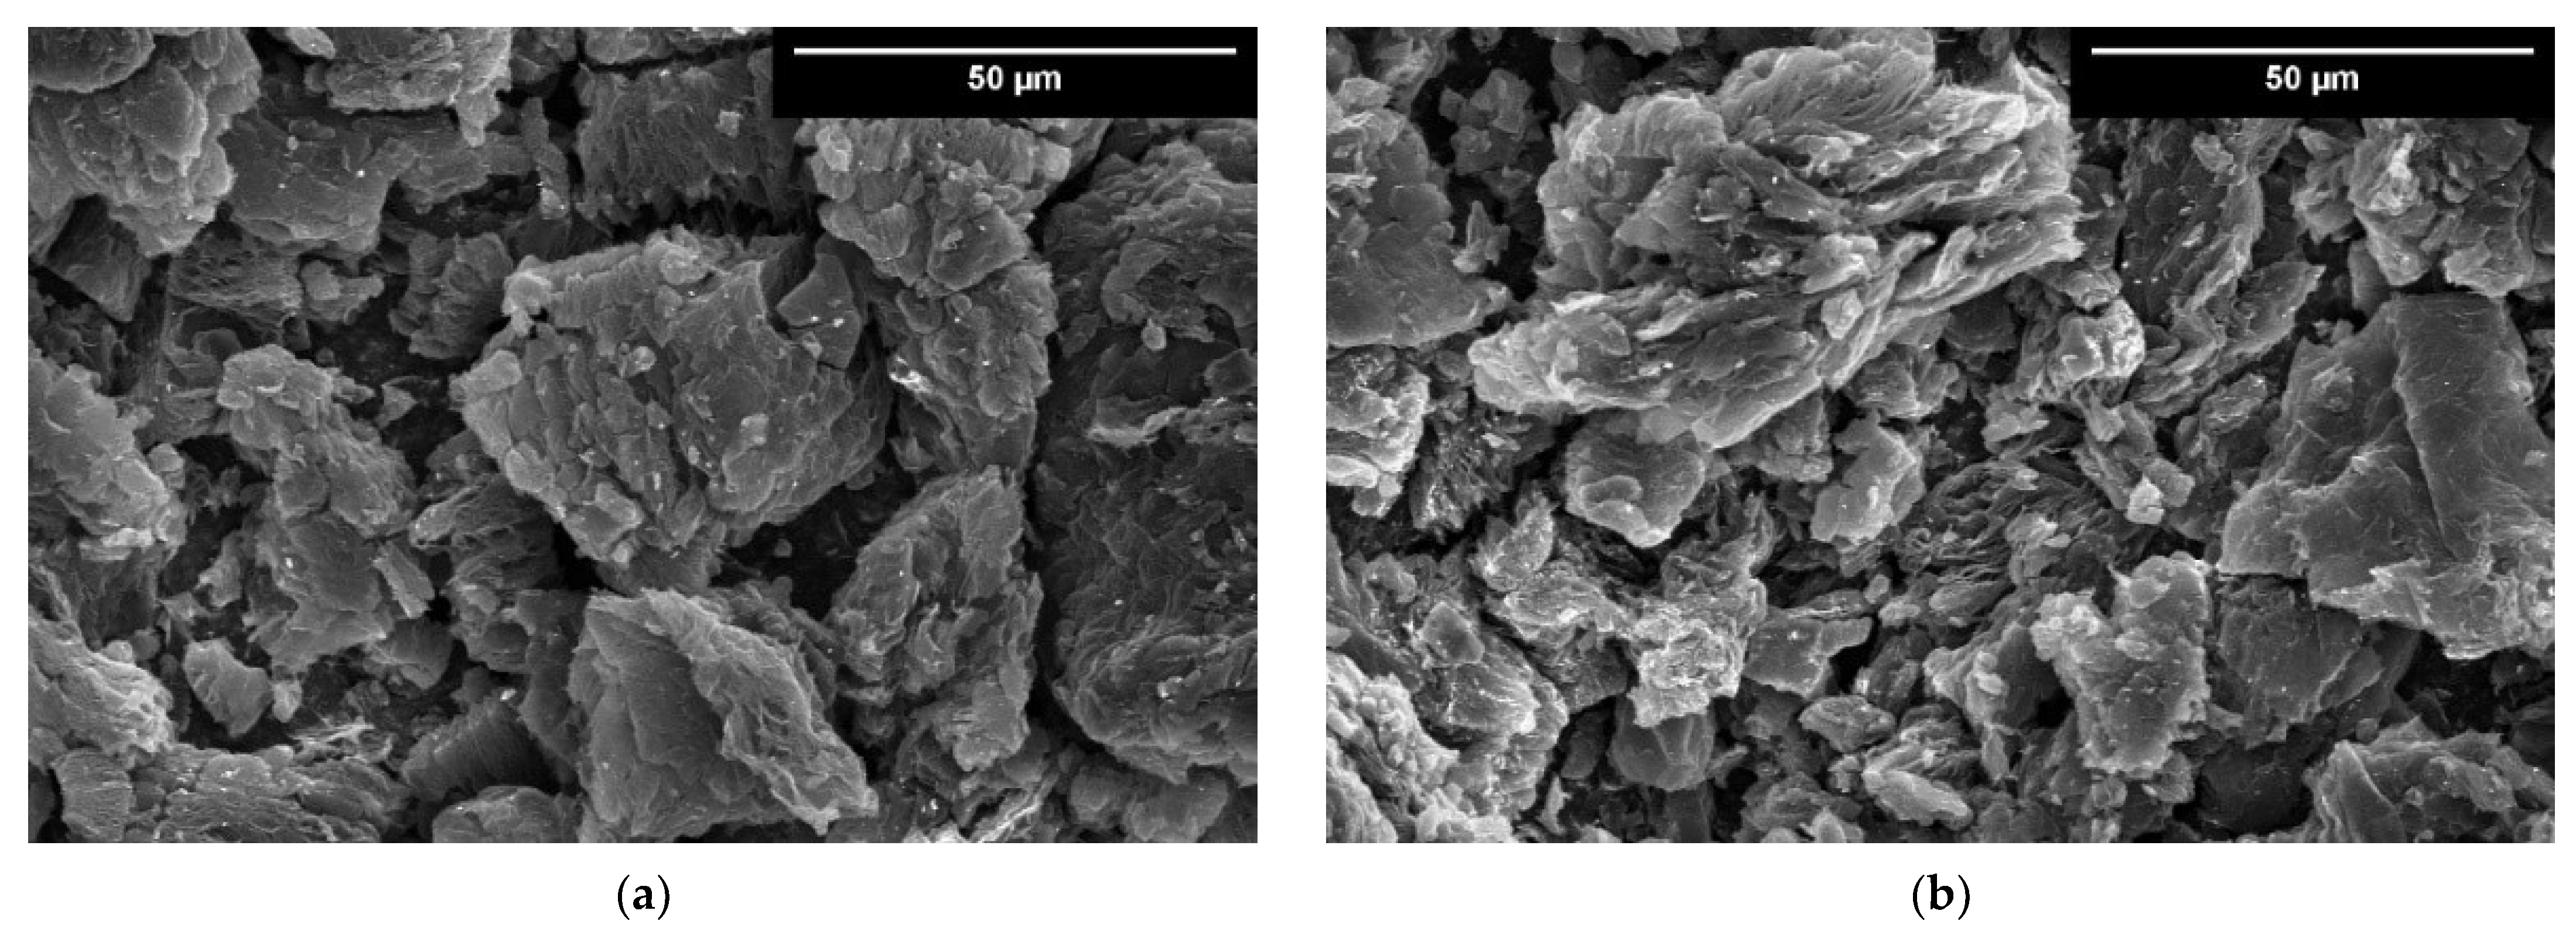
The morphology and elemental composition of the powder materials was examined by scanning electron microscopy (SEM), as well as energy-dispersive X-ray spectroscopy (EDX) with an FEI (Hillsboro, OR, USA) Helios NanoLab 600 equipped with an X-Max (50 mm2) detector from Oxford Instruments (High Wycombe, UK). The elemental analysis was obtained using an operating voltage and current of 10 kV and 11 nA, respectively, for the area visible at a magnification of 200×, and the powders were deposited on carbon tape.
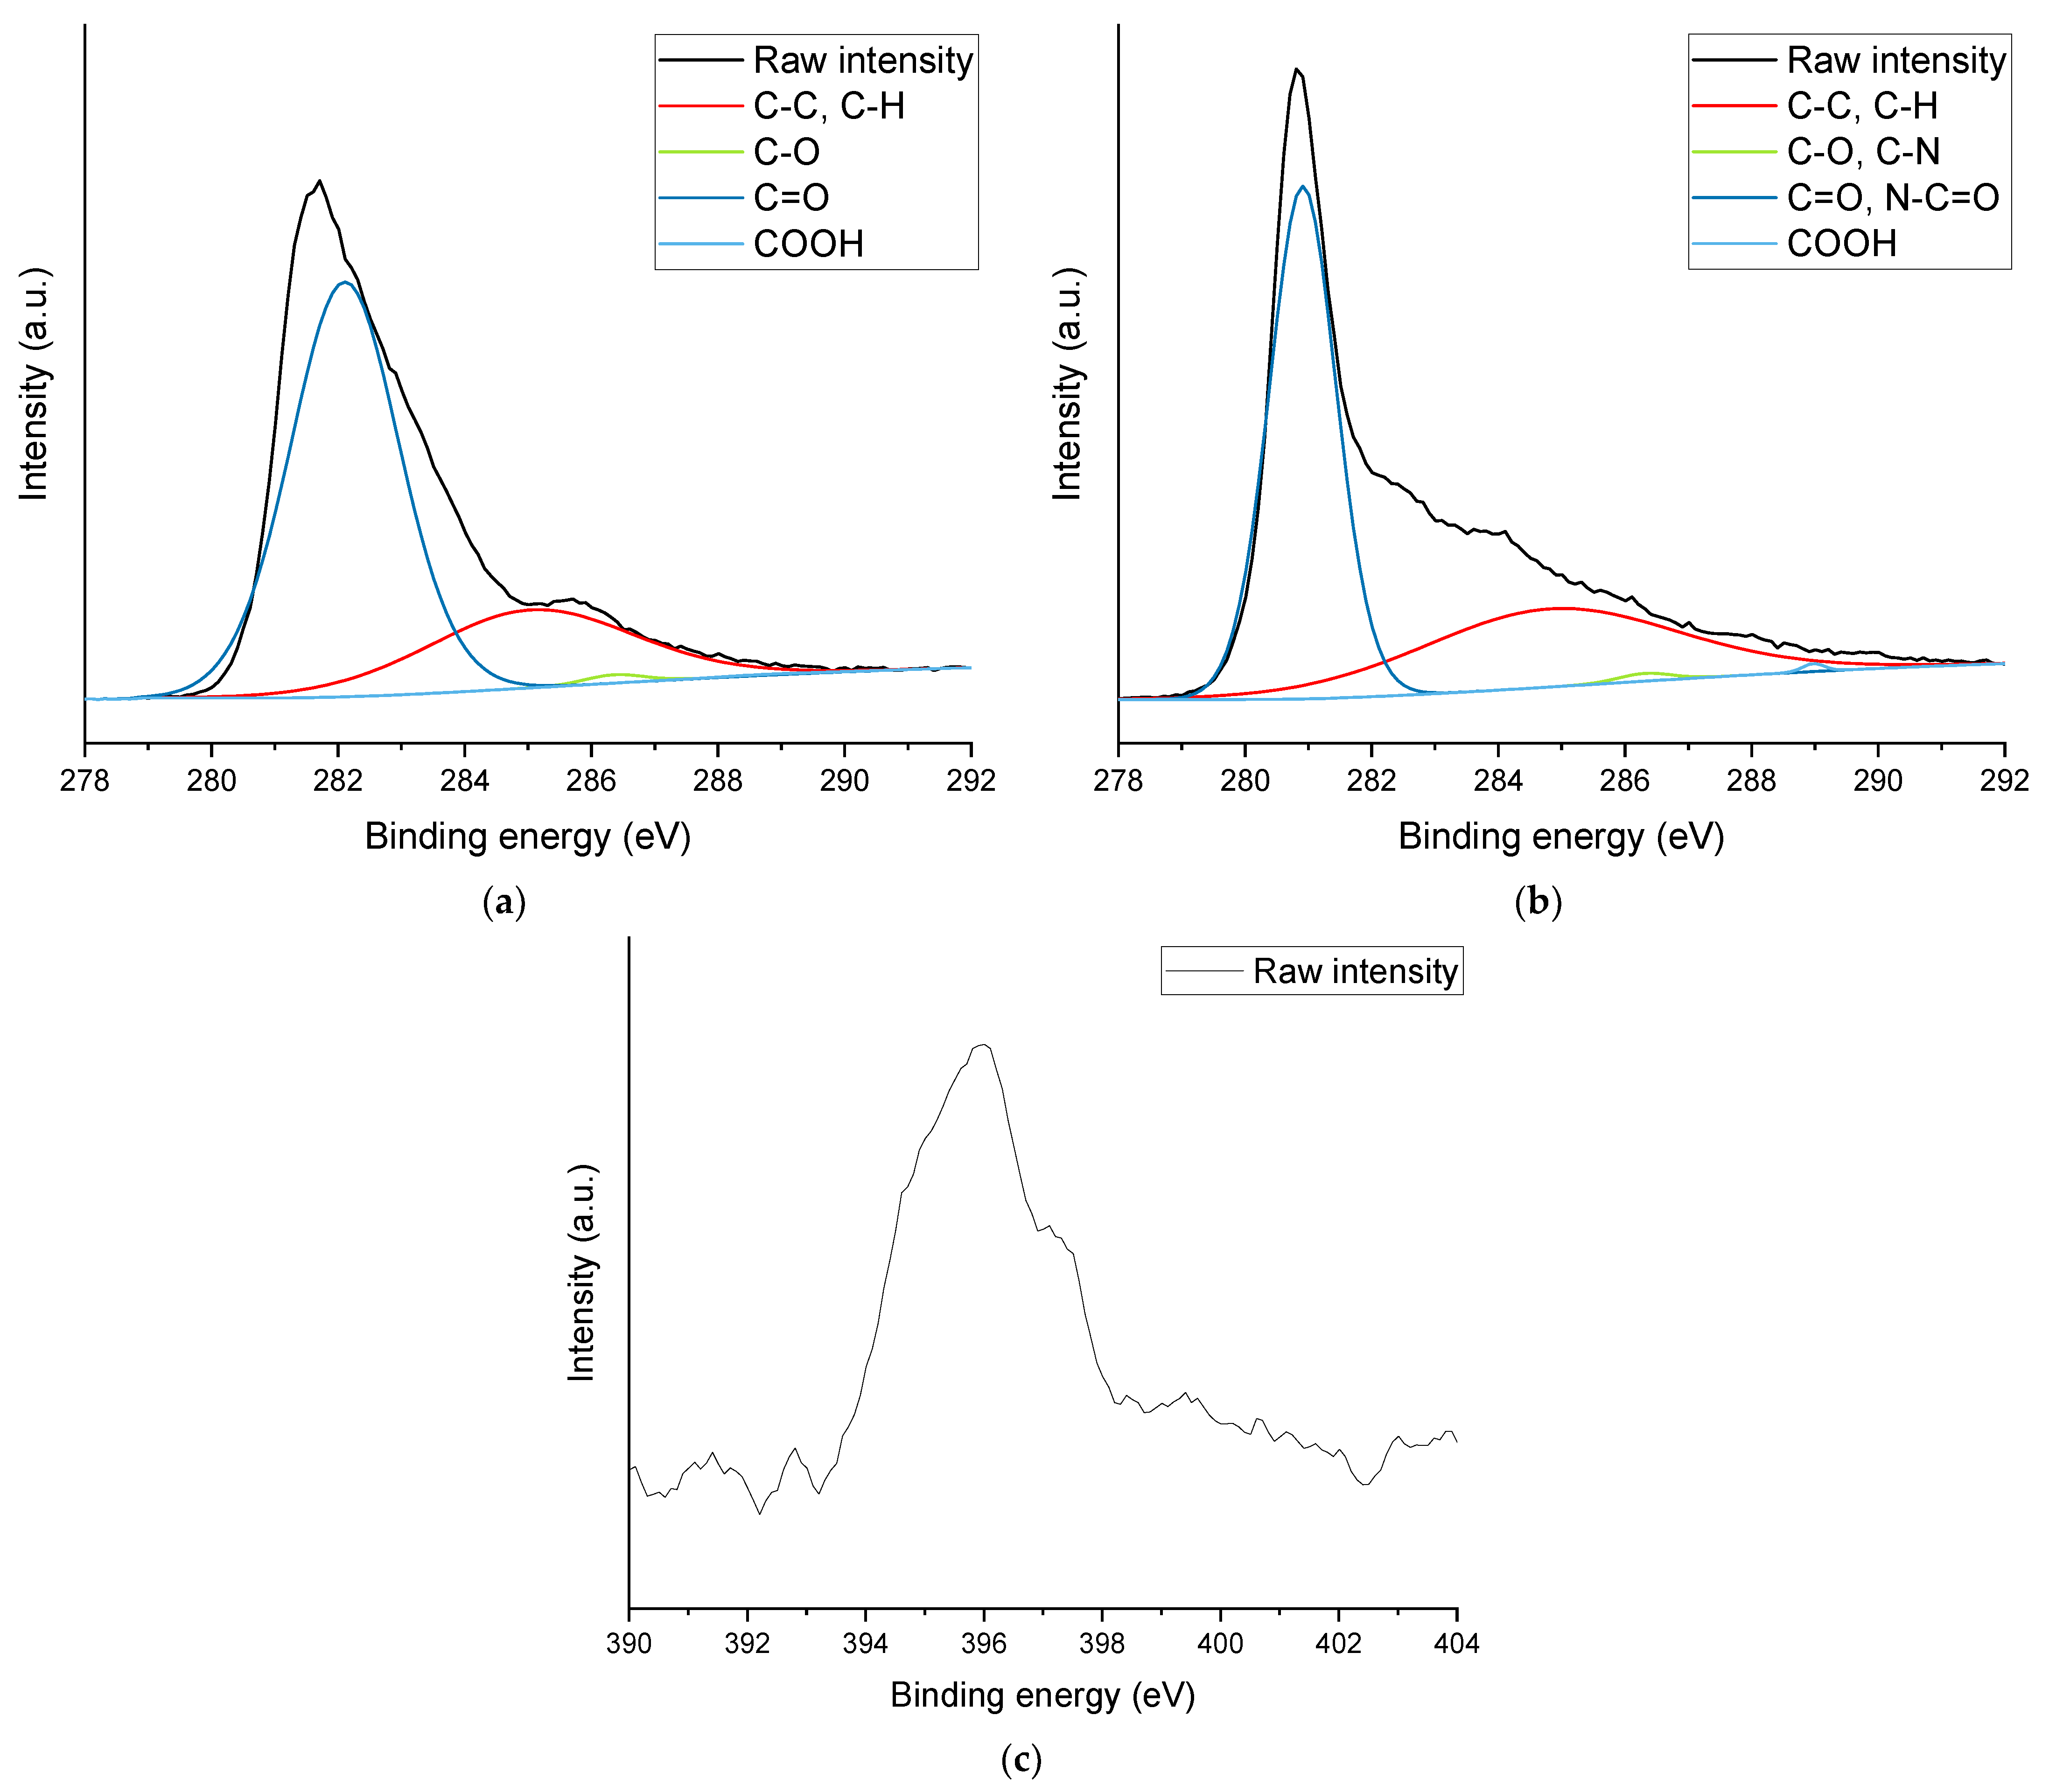
X-ray photoelectron spectroscopy (XPS) was used to confirm the presence of nitrogen and, hence, amine functional groups and the elemental composition of the powder materials. It was performed using a Kratos (Manchester, UK) AXIS Nova using a monochromatic Al kα X-ray source operating at a power of 225 W. Survey and detailed spectra were obtained at 160 eV and 20 eV, respectively. Three spots with an elliptical area of 0.3 × 0.7 mm were examined for each powder material.
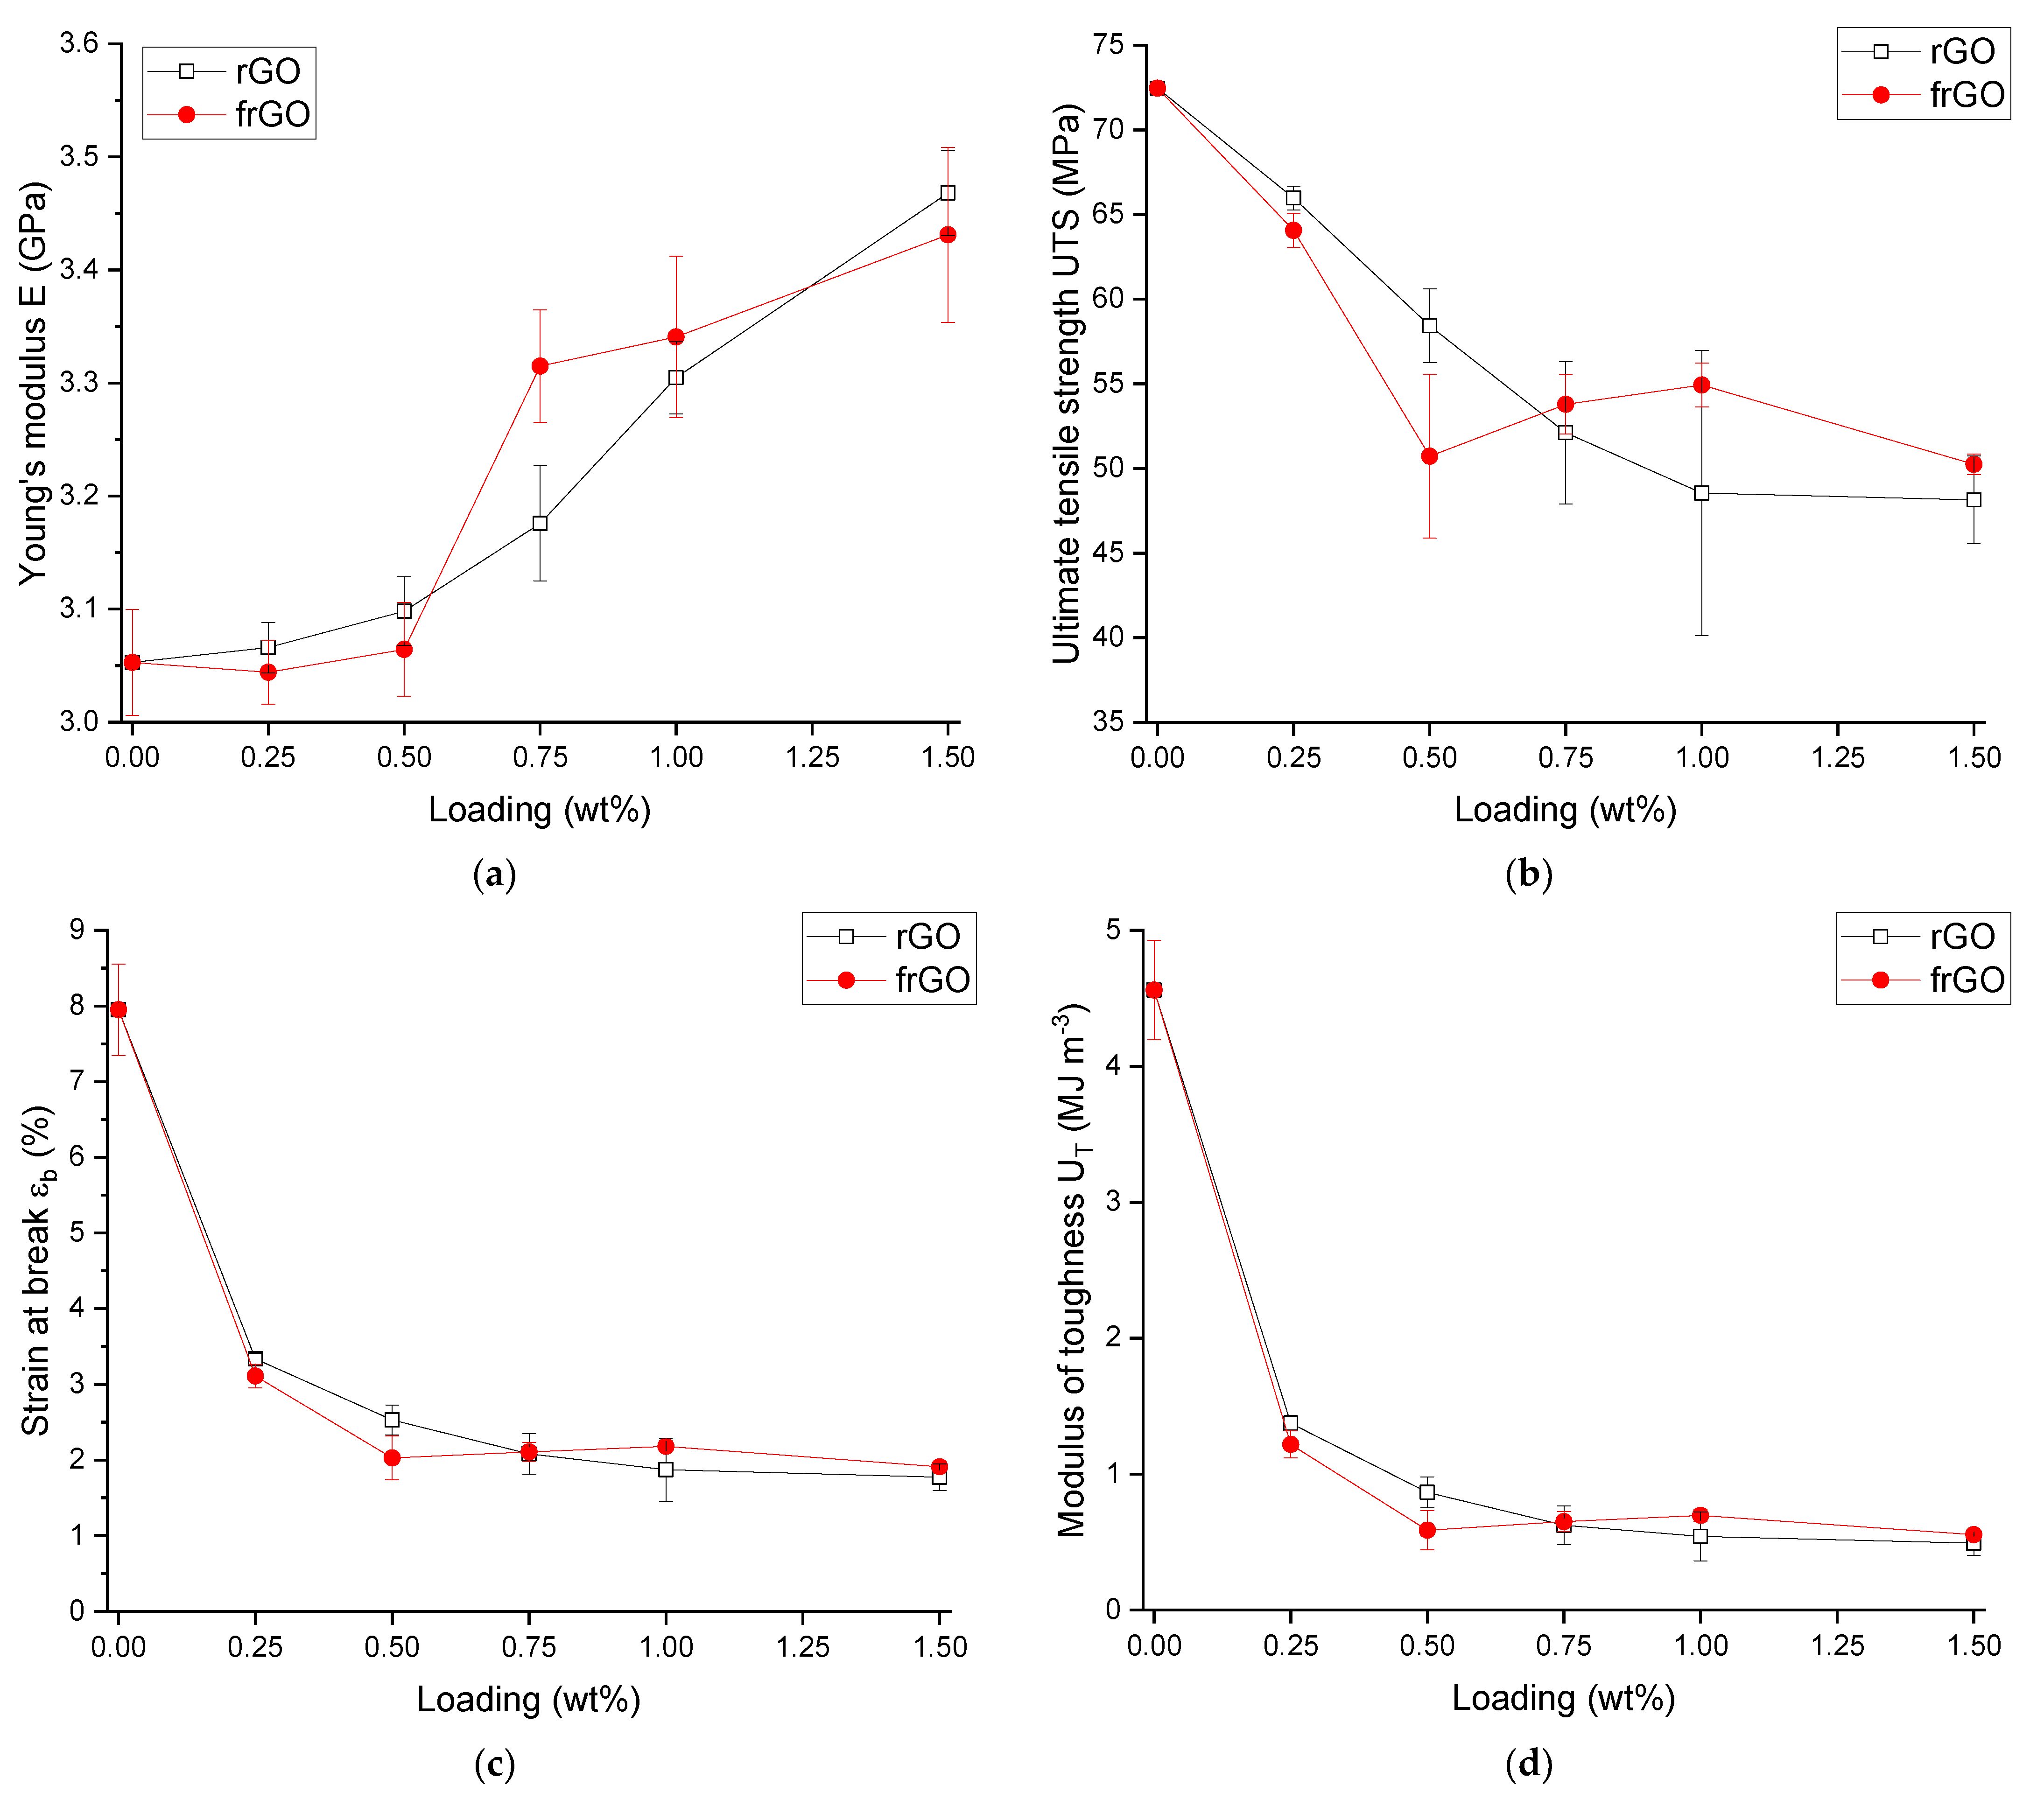
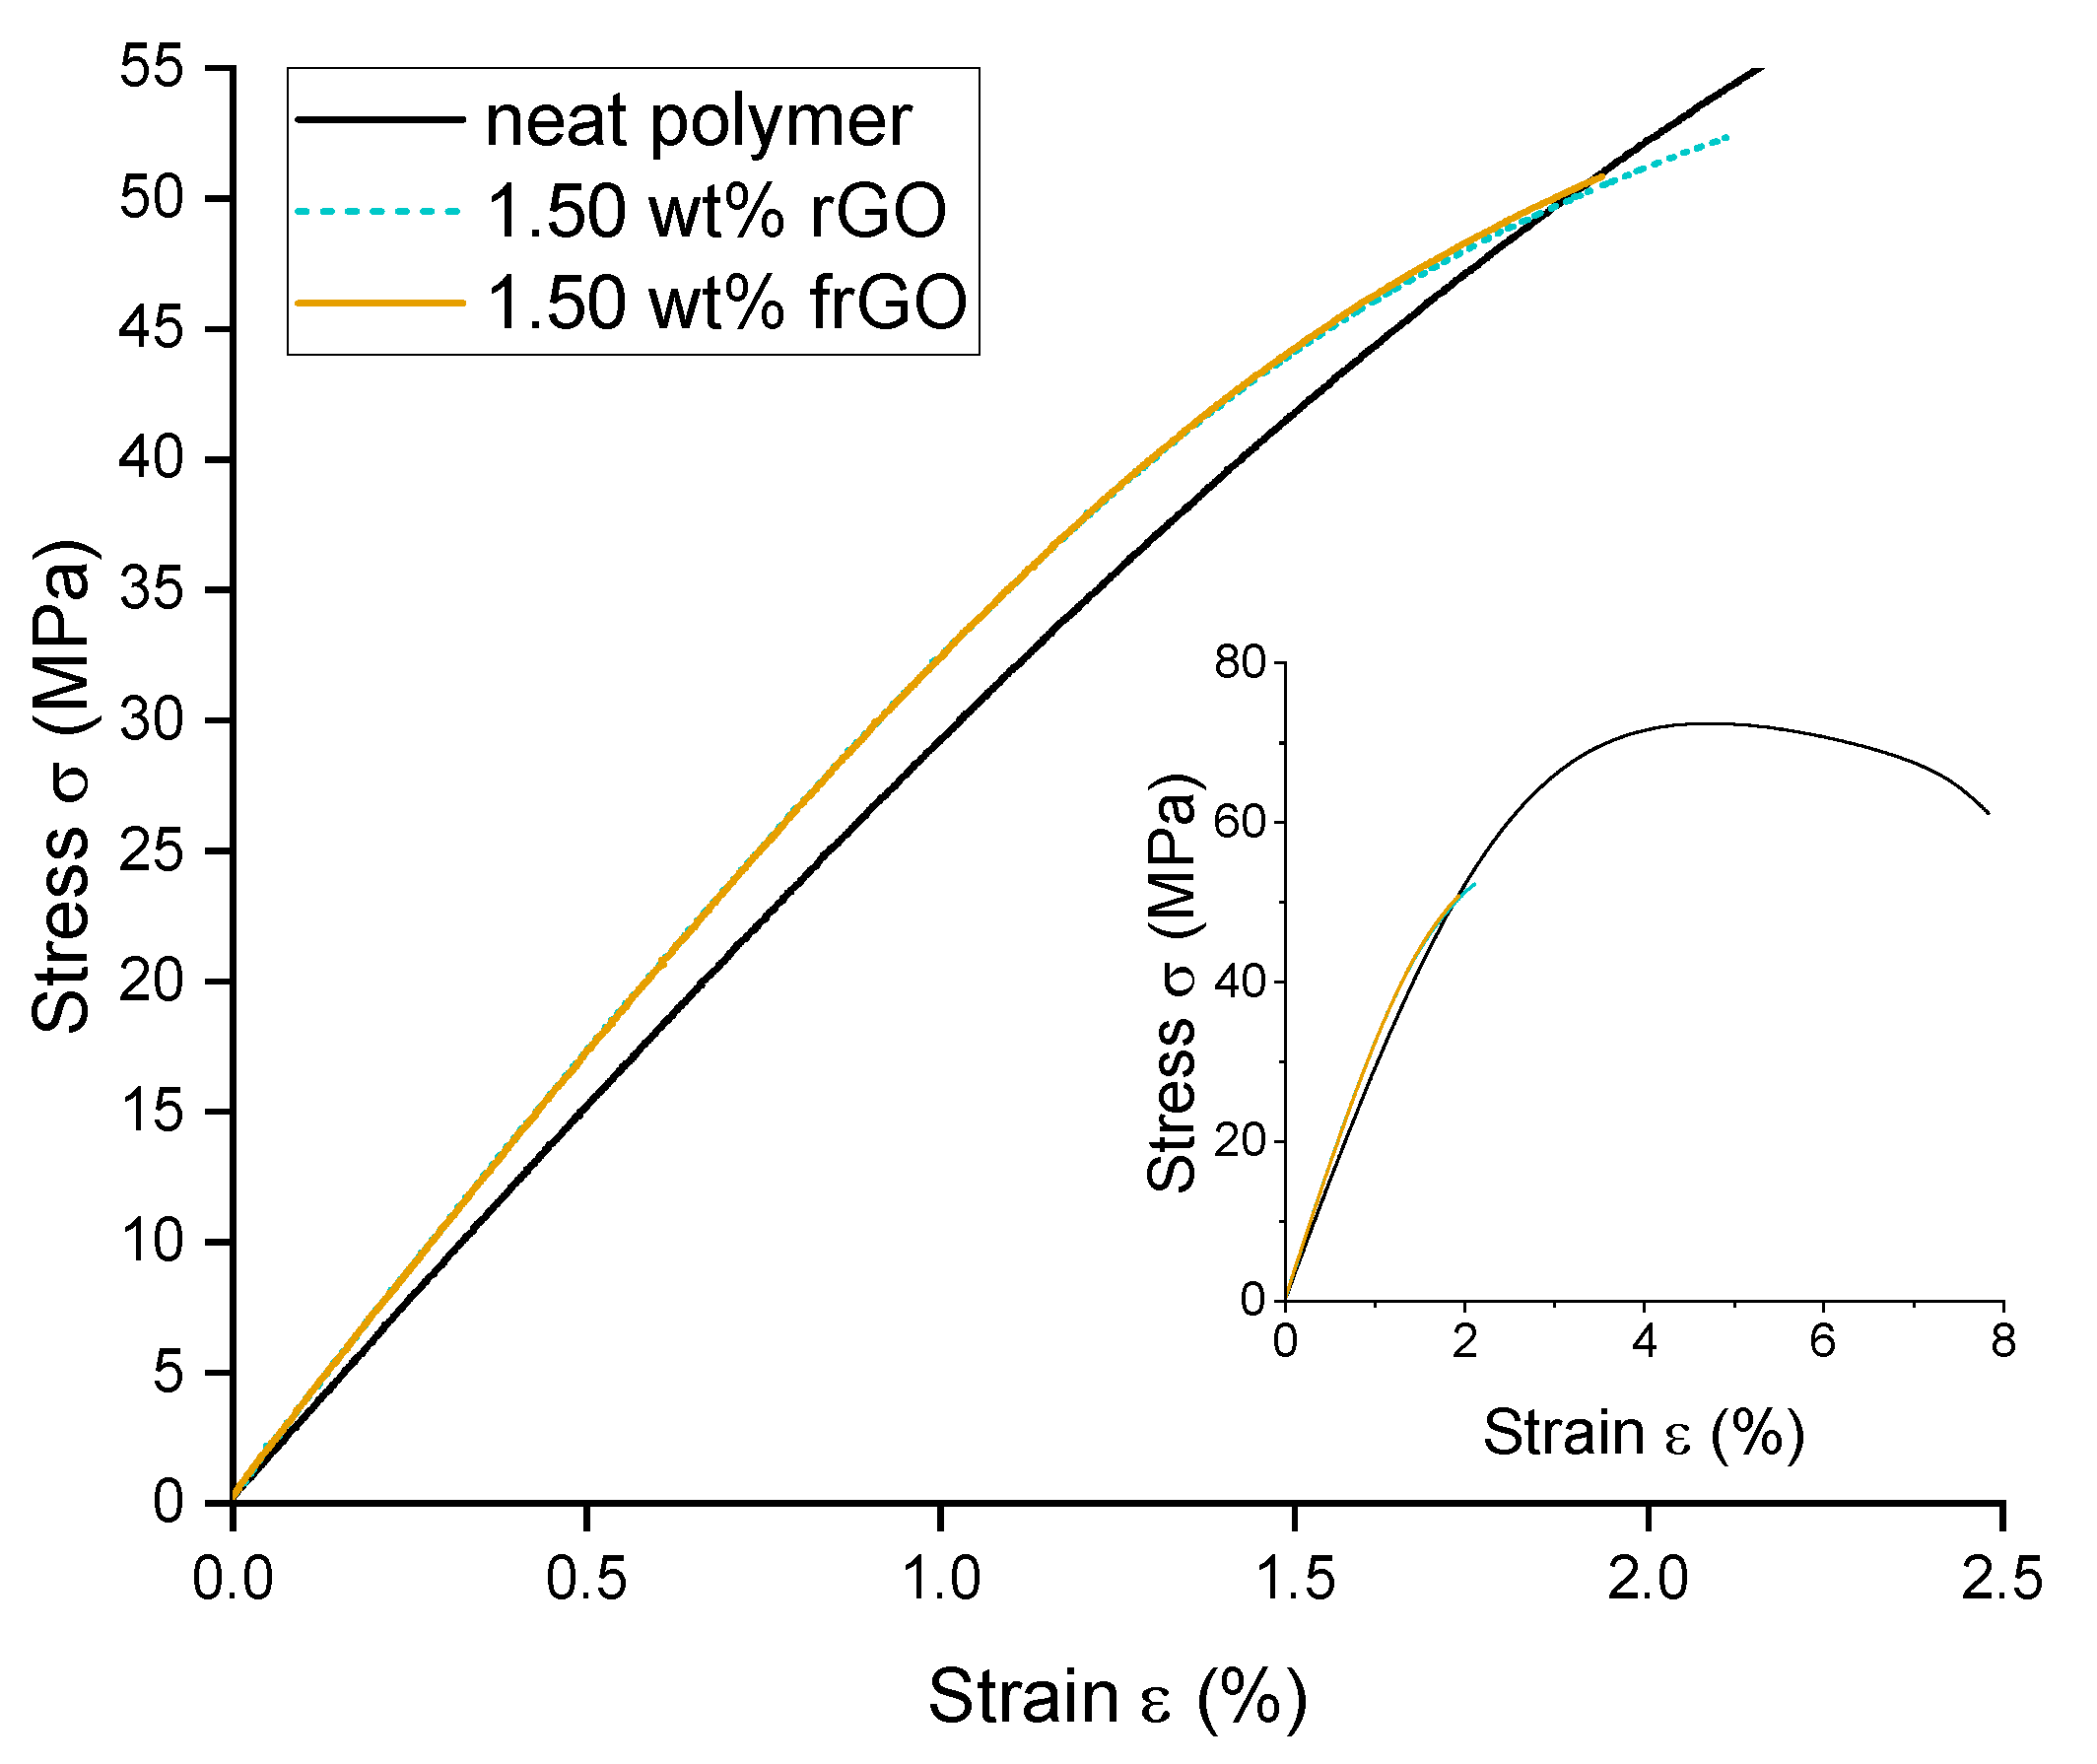
The tensile properties of the various material configurations were evaluated according to DIN EN ISO 527-2:2012 [34] and using specimen-type 1B. The tensile tests were performed at room temperature using the universal testing machine Inspekt Table 20 kN from Hegewald and Peschke (Nossen, Germany). A total of 5 samples were measured per material configuration with a pre-force of 10 N and a testing speed of 1 mm min
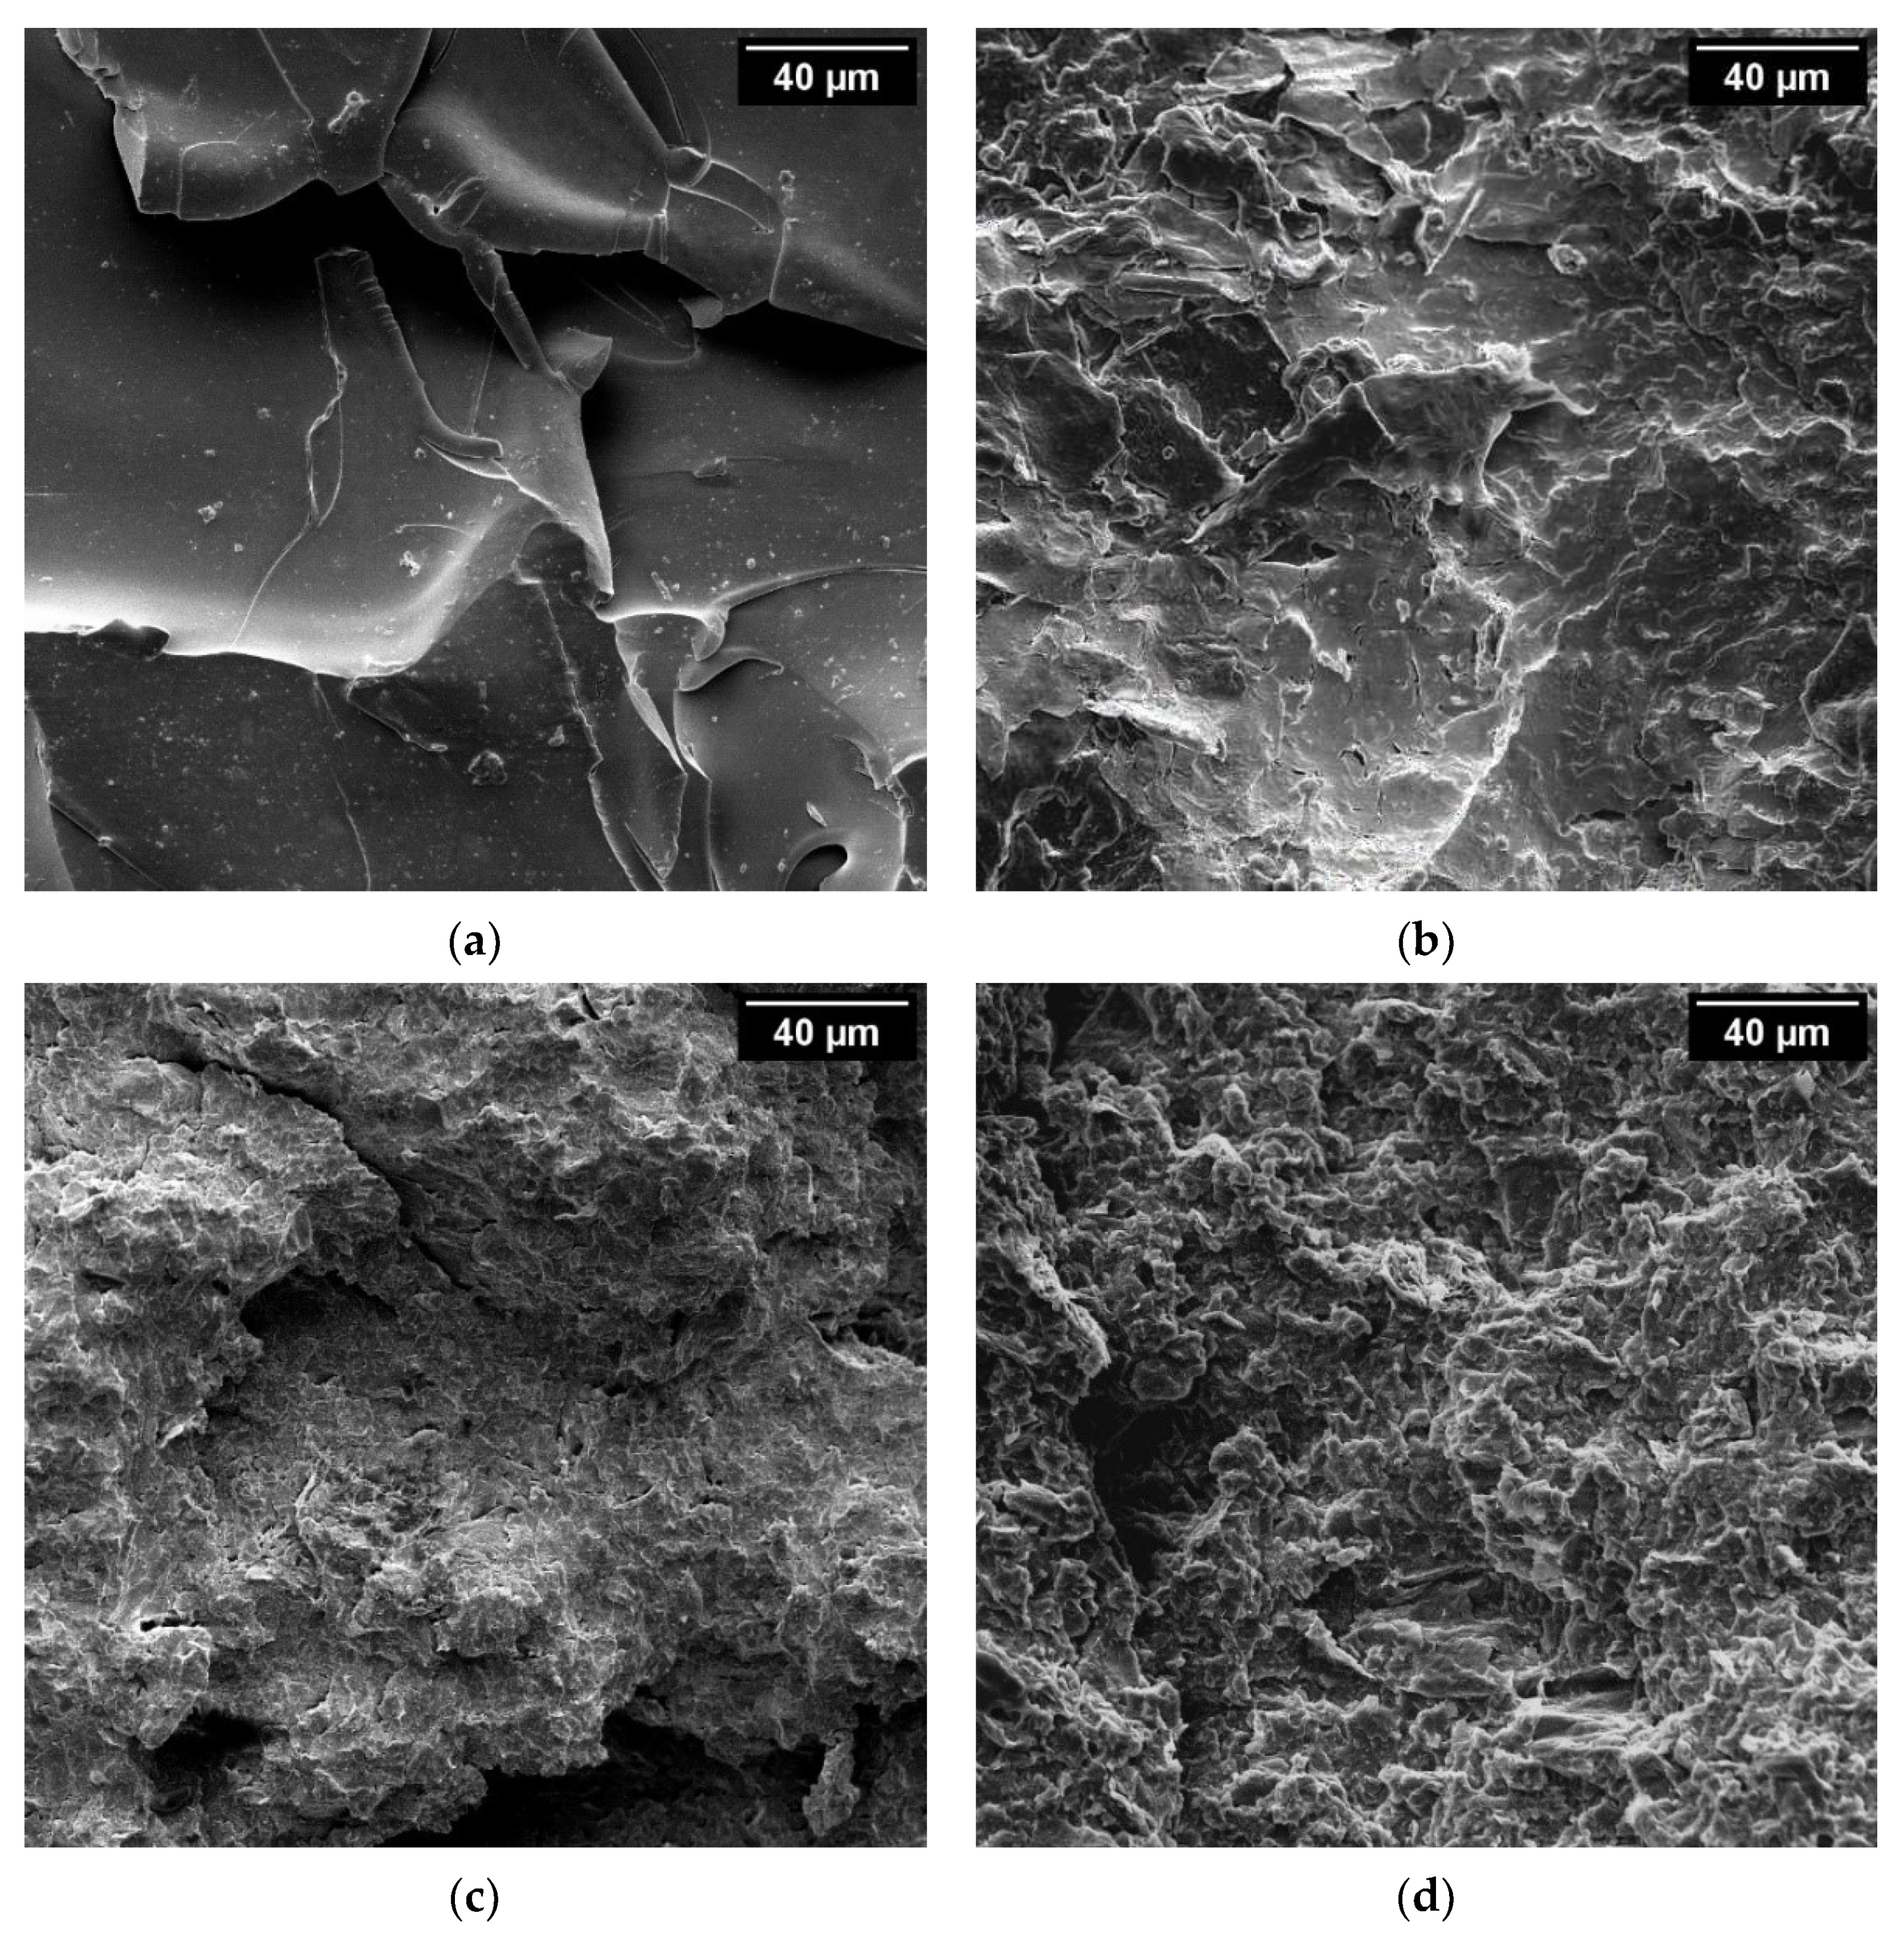
−1. The morphology of the respective fracture surfaces were subsequently analyzed by scanning electron microscopy (SEM) using a Zeiss (Oberkochen, Germany) DSM 940.
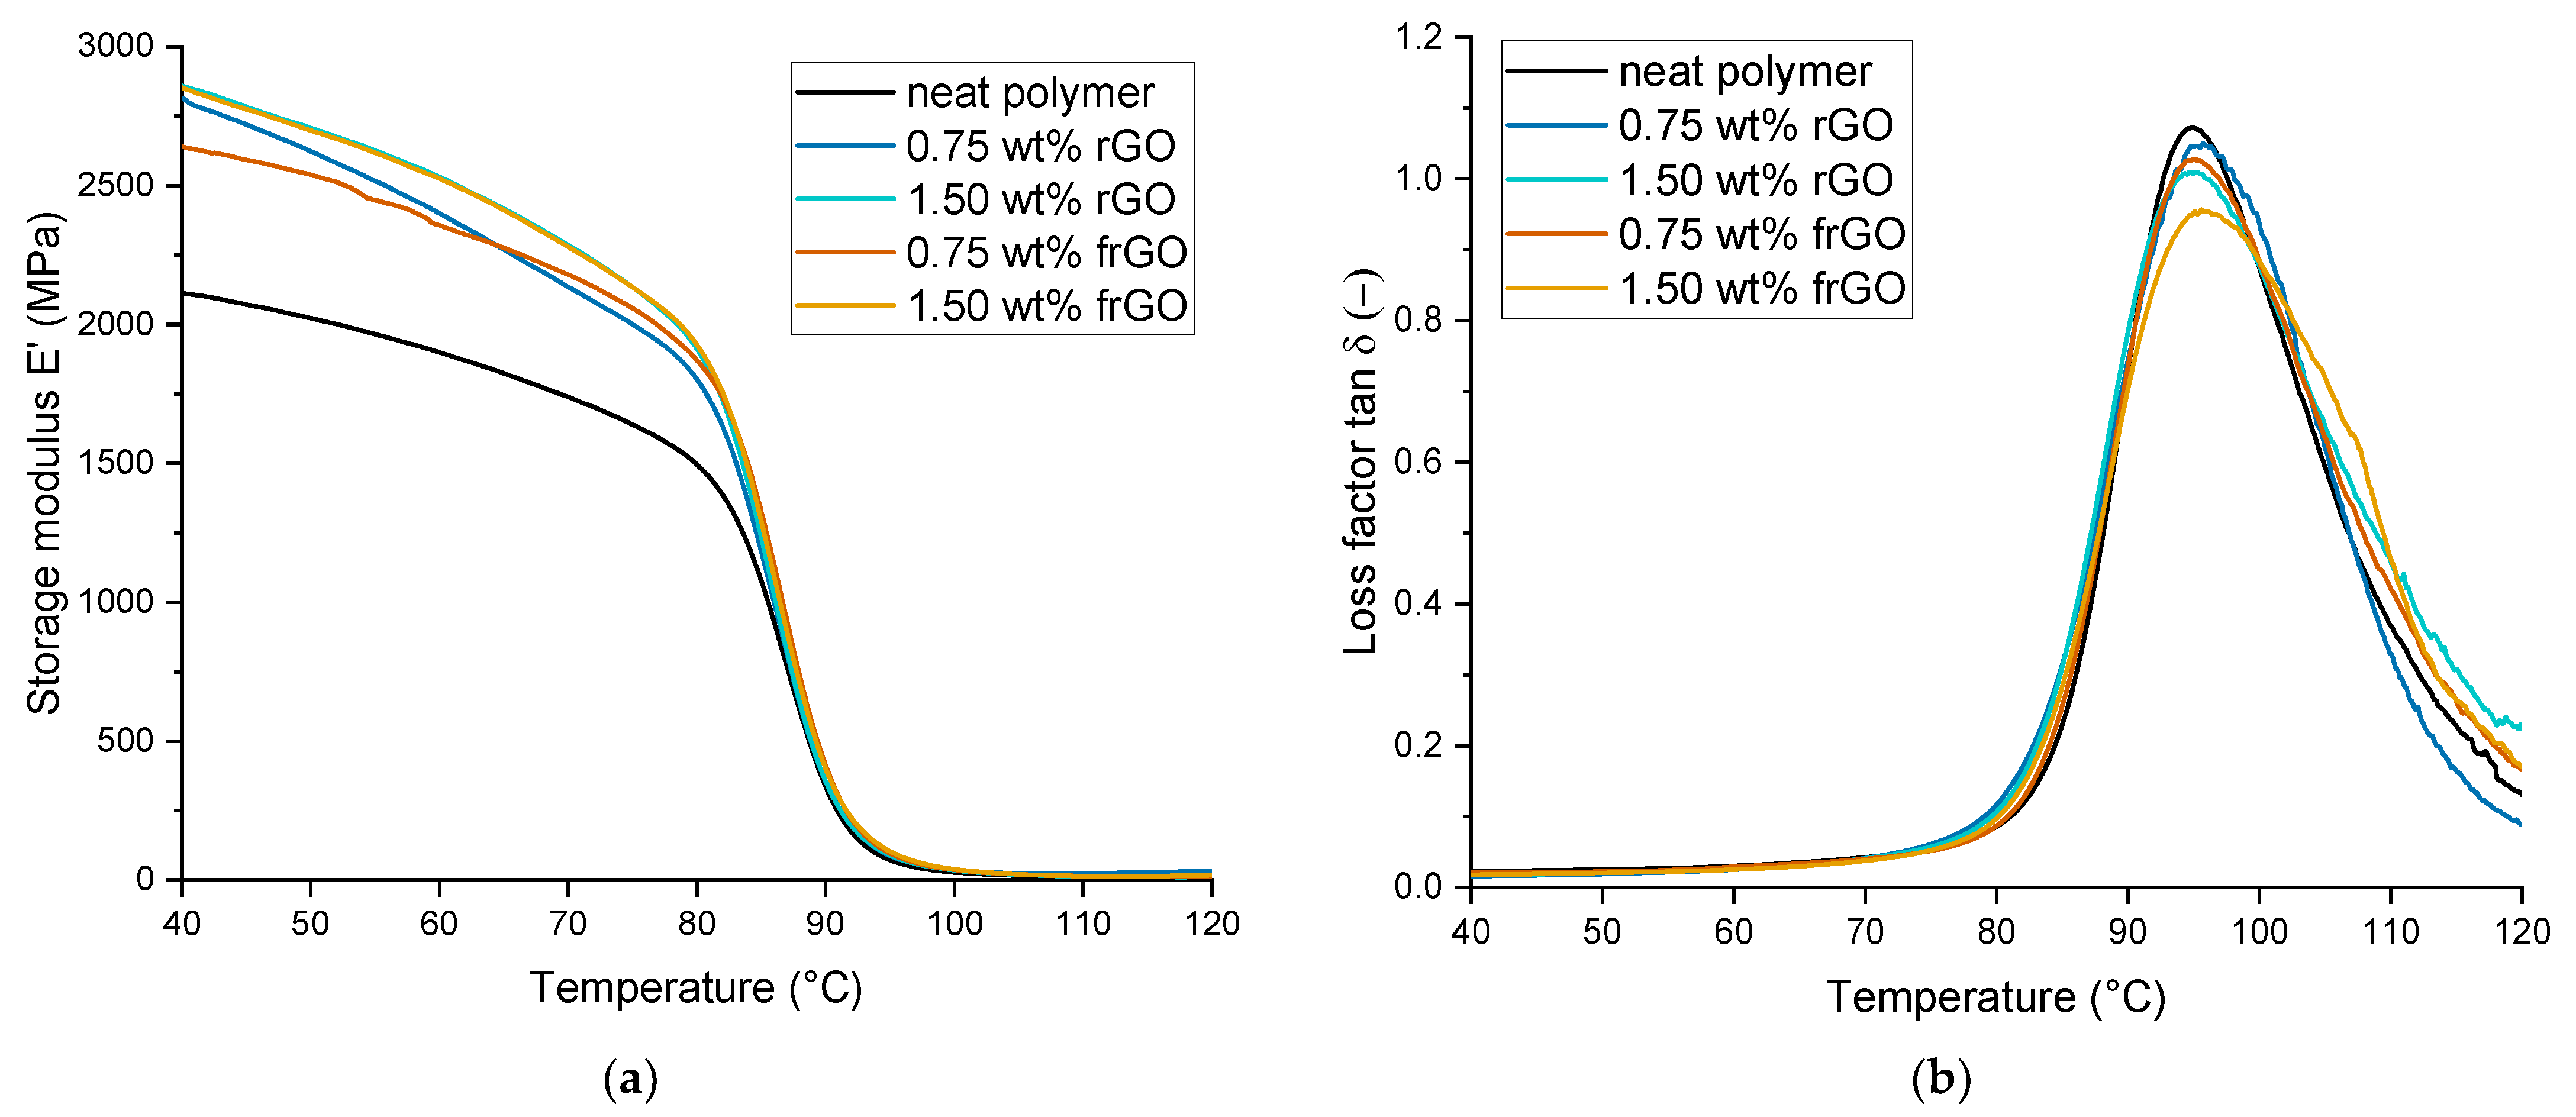
The thermomechanical as well as viscoelastic behavior was evaluated by dynamic mechanical analysis (DMA) and using a DMA 2980 from TA Instruments (New Castle, DE). In accordance to DIN 65583:1999 [35], the tests were executed in dual-cantilever mode at a frequency of 1 Hz within a temperature range of room temperature to 130 °C and at a heating rate of 3 °C min−1. A total of three specimens per material configuration was evaluated.
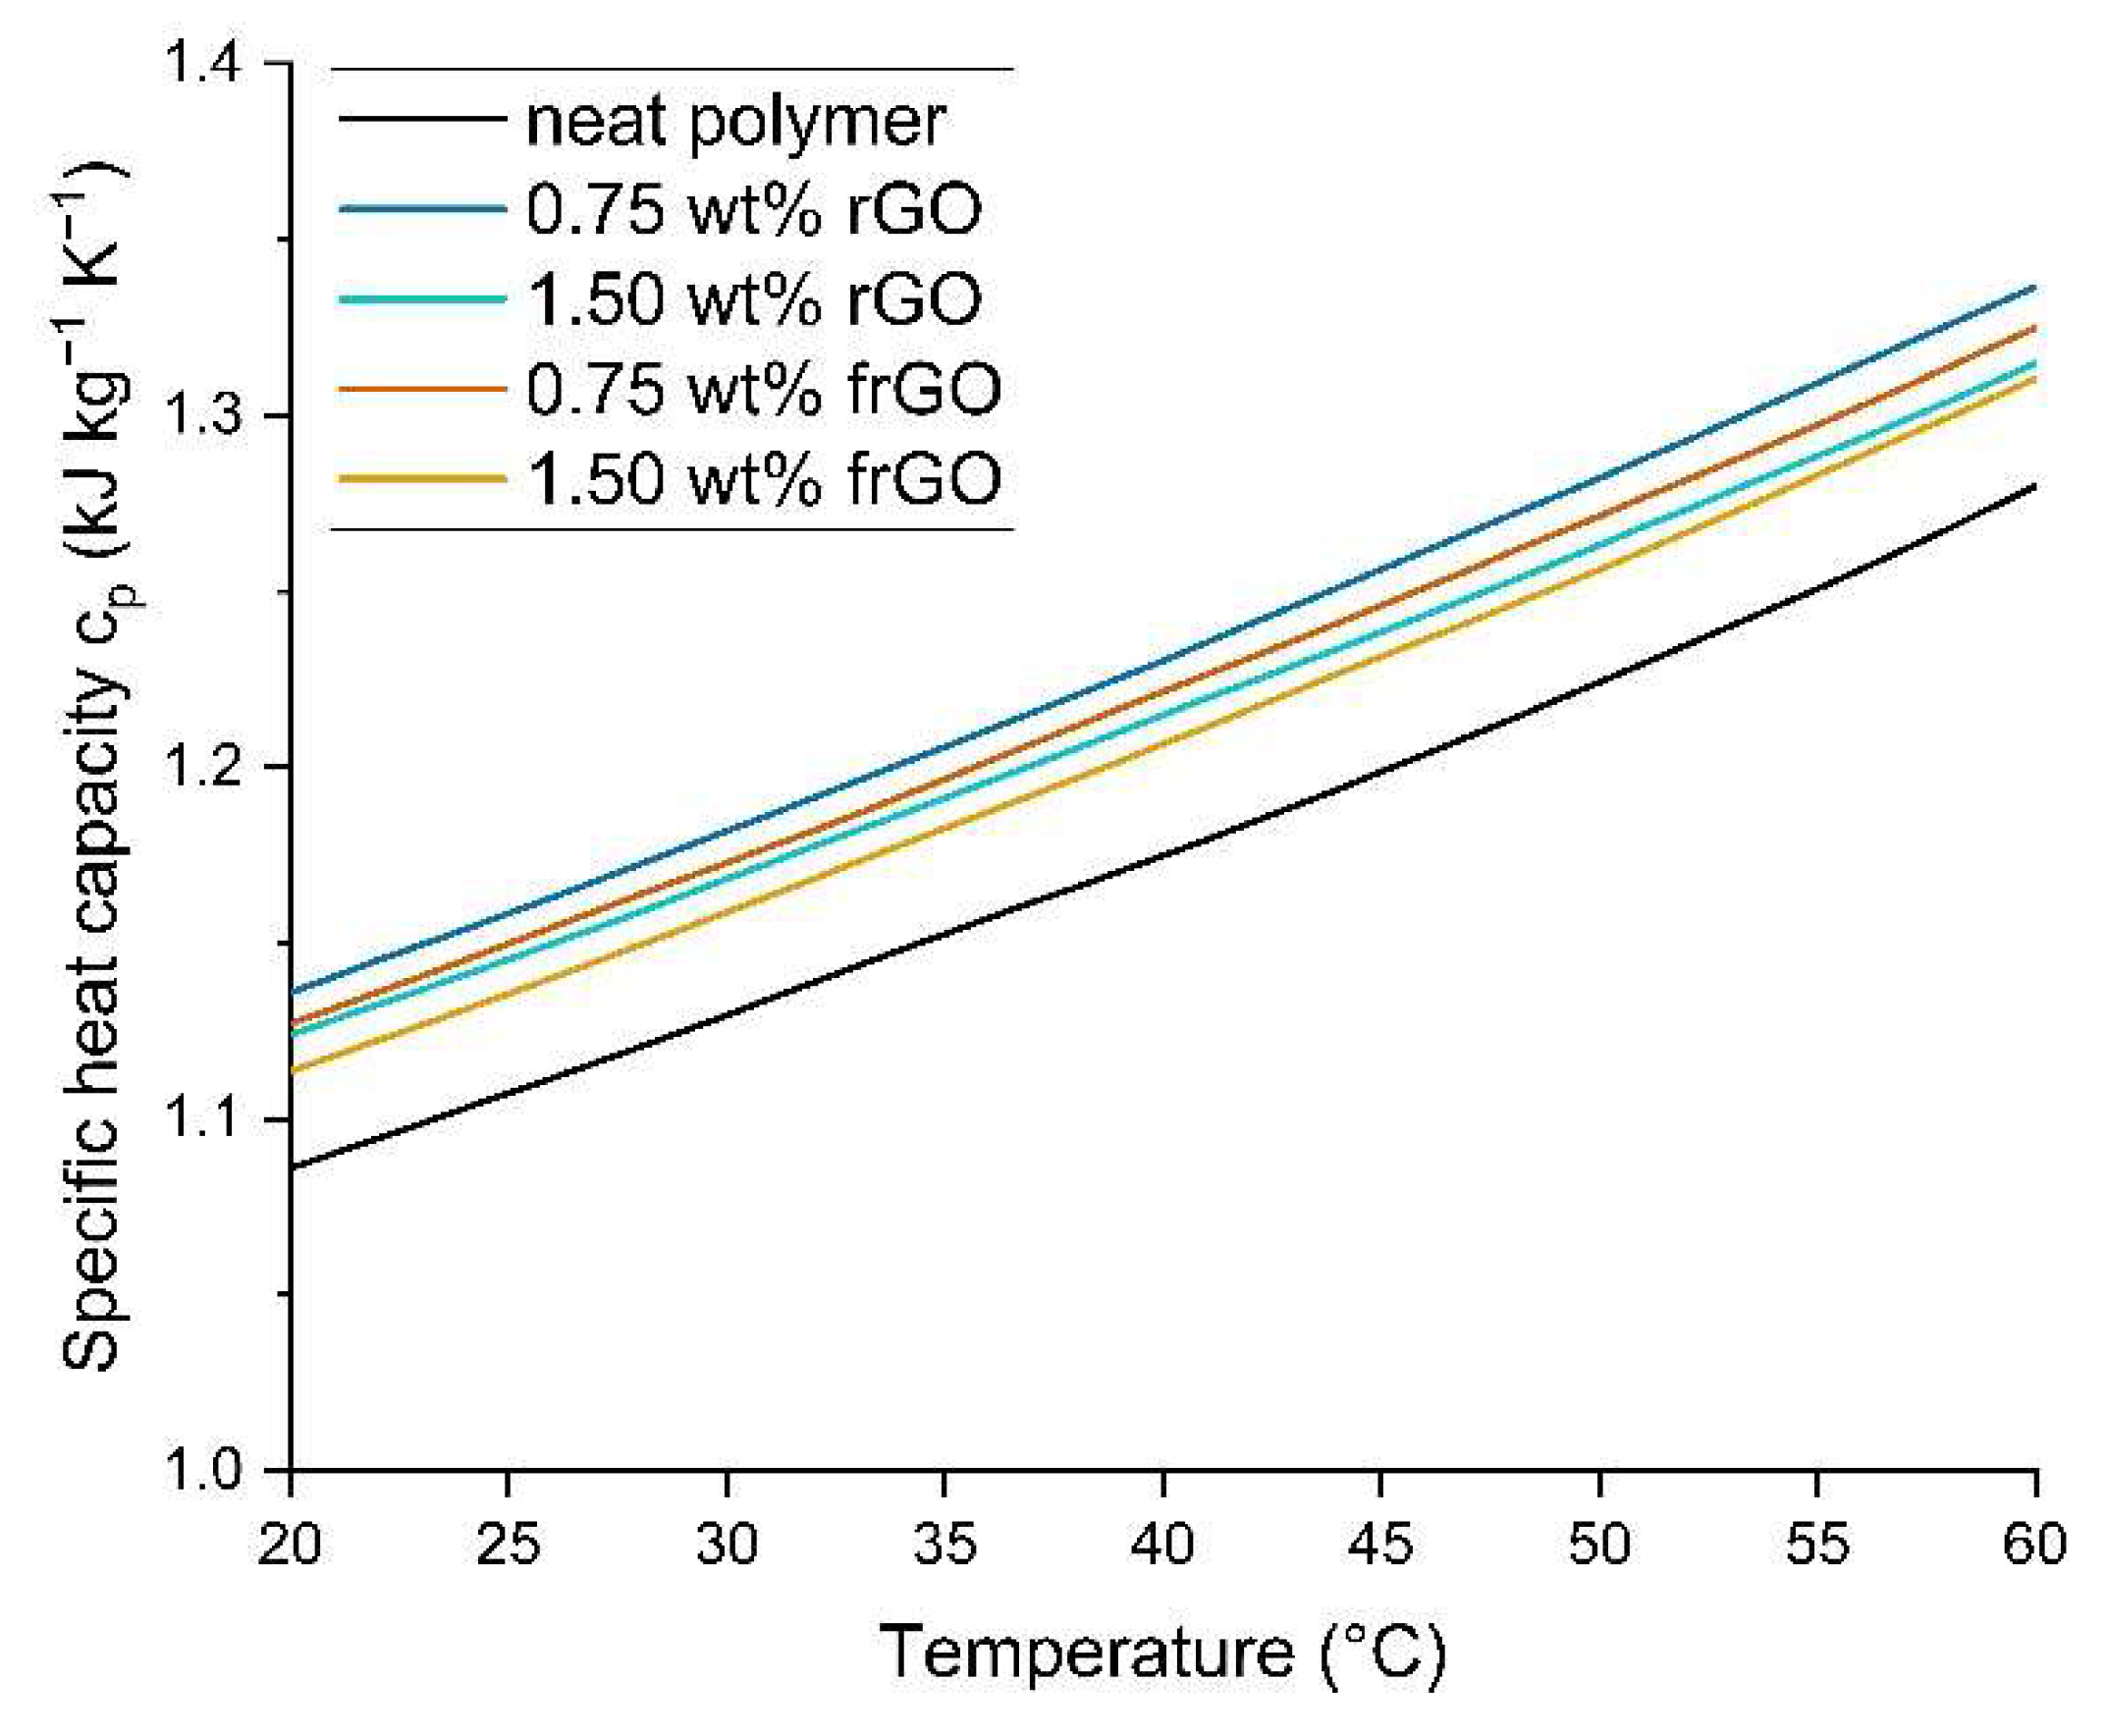
Differential scanning calorimetry (DSC) was performed using a DSC 2920 from TA Instruments and according to DIN EN ISO 11357-4:2021 [36] to determine the specific heat capacity cp of the neat polymer and nanocomposite samples. The respective sample was initially kept at −20 °C for 2 min and then heated using a modulated DSC from −20 °C to 70 °C at a heating rate of 5 °C min−1. Each measurement was acquired in a nitrogen atmosphere and measurements were obtained from three samples of the respective material.
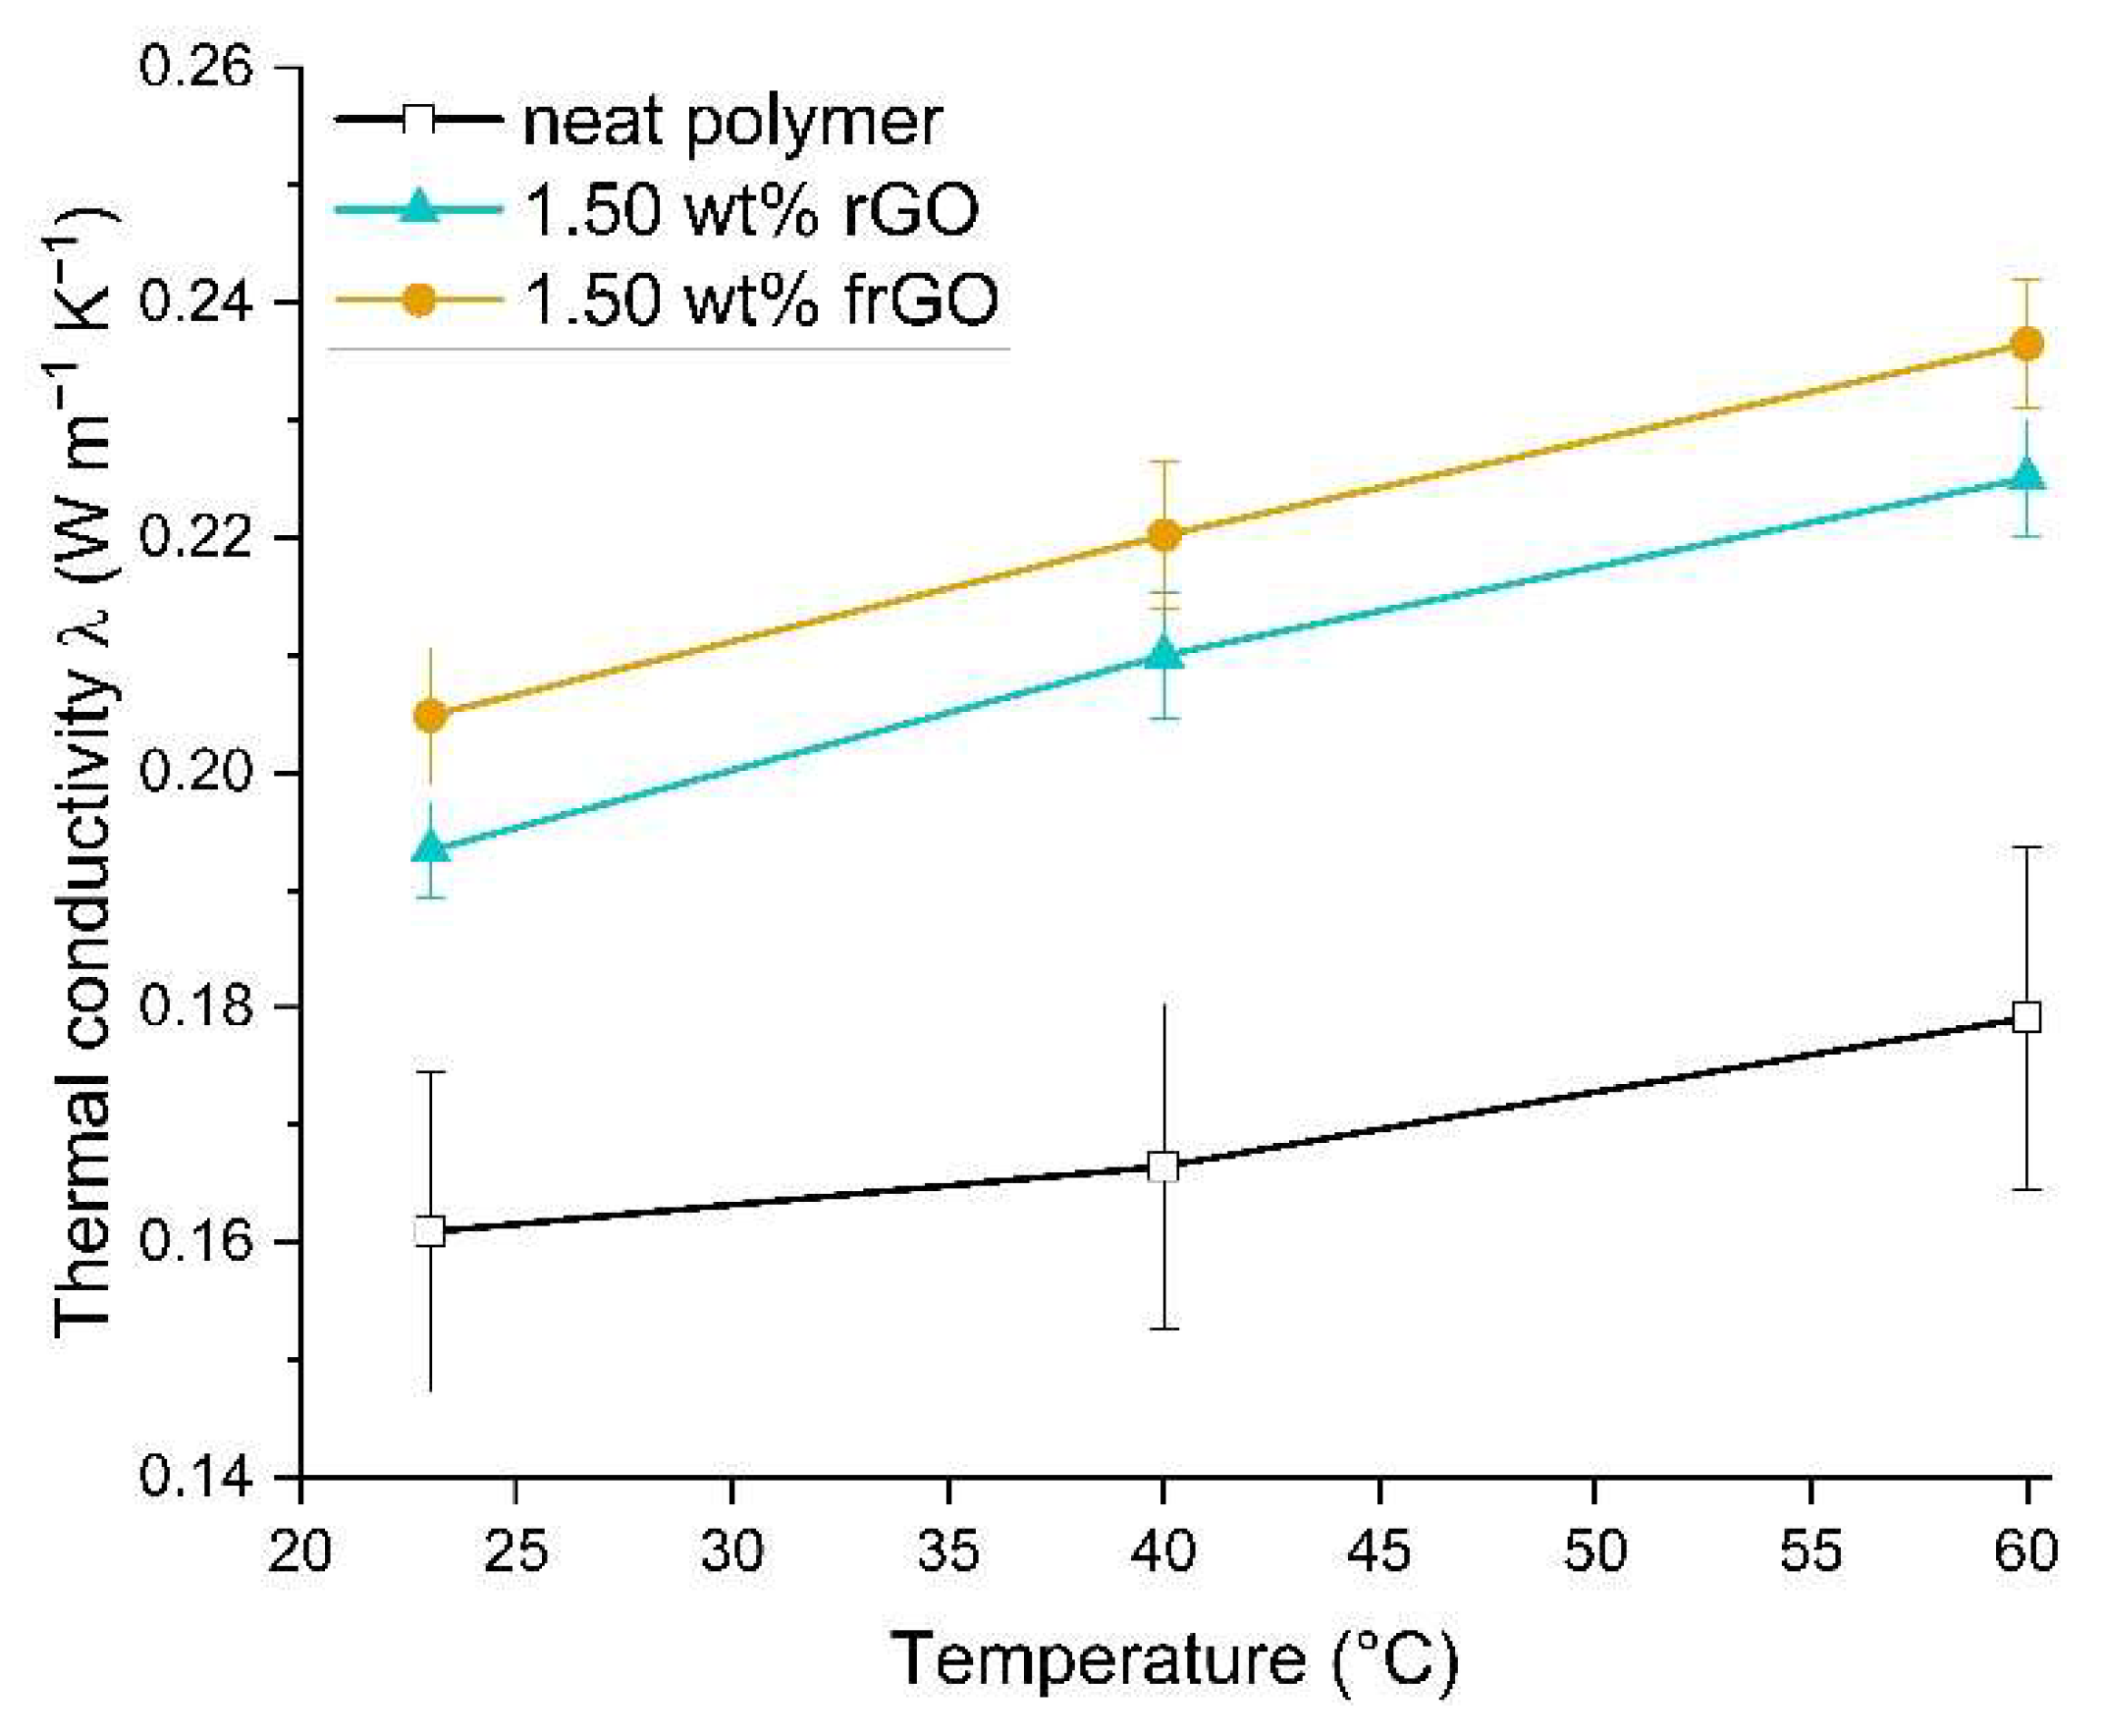
Laser flash analysis (LFA) was conducted in accordance to DIN EN ISO 22007-4:2017 [37] and using a Netzsch (Selb, Germany) Nanoflash LFA 447. The thermal diffusivity a of each specimen was evaluated four times in series at each isothermal testing temperature of room temperature, 40 °C and 60 °C. A total of three specimens was analyzed for each material configuration. This was used to evaluate the thermal conductivity λ using
λ = cpaρ,
where cp is the specific heat capacity and ρ is the density of the material.
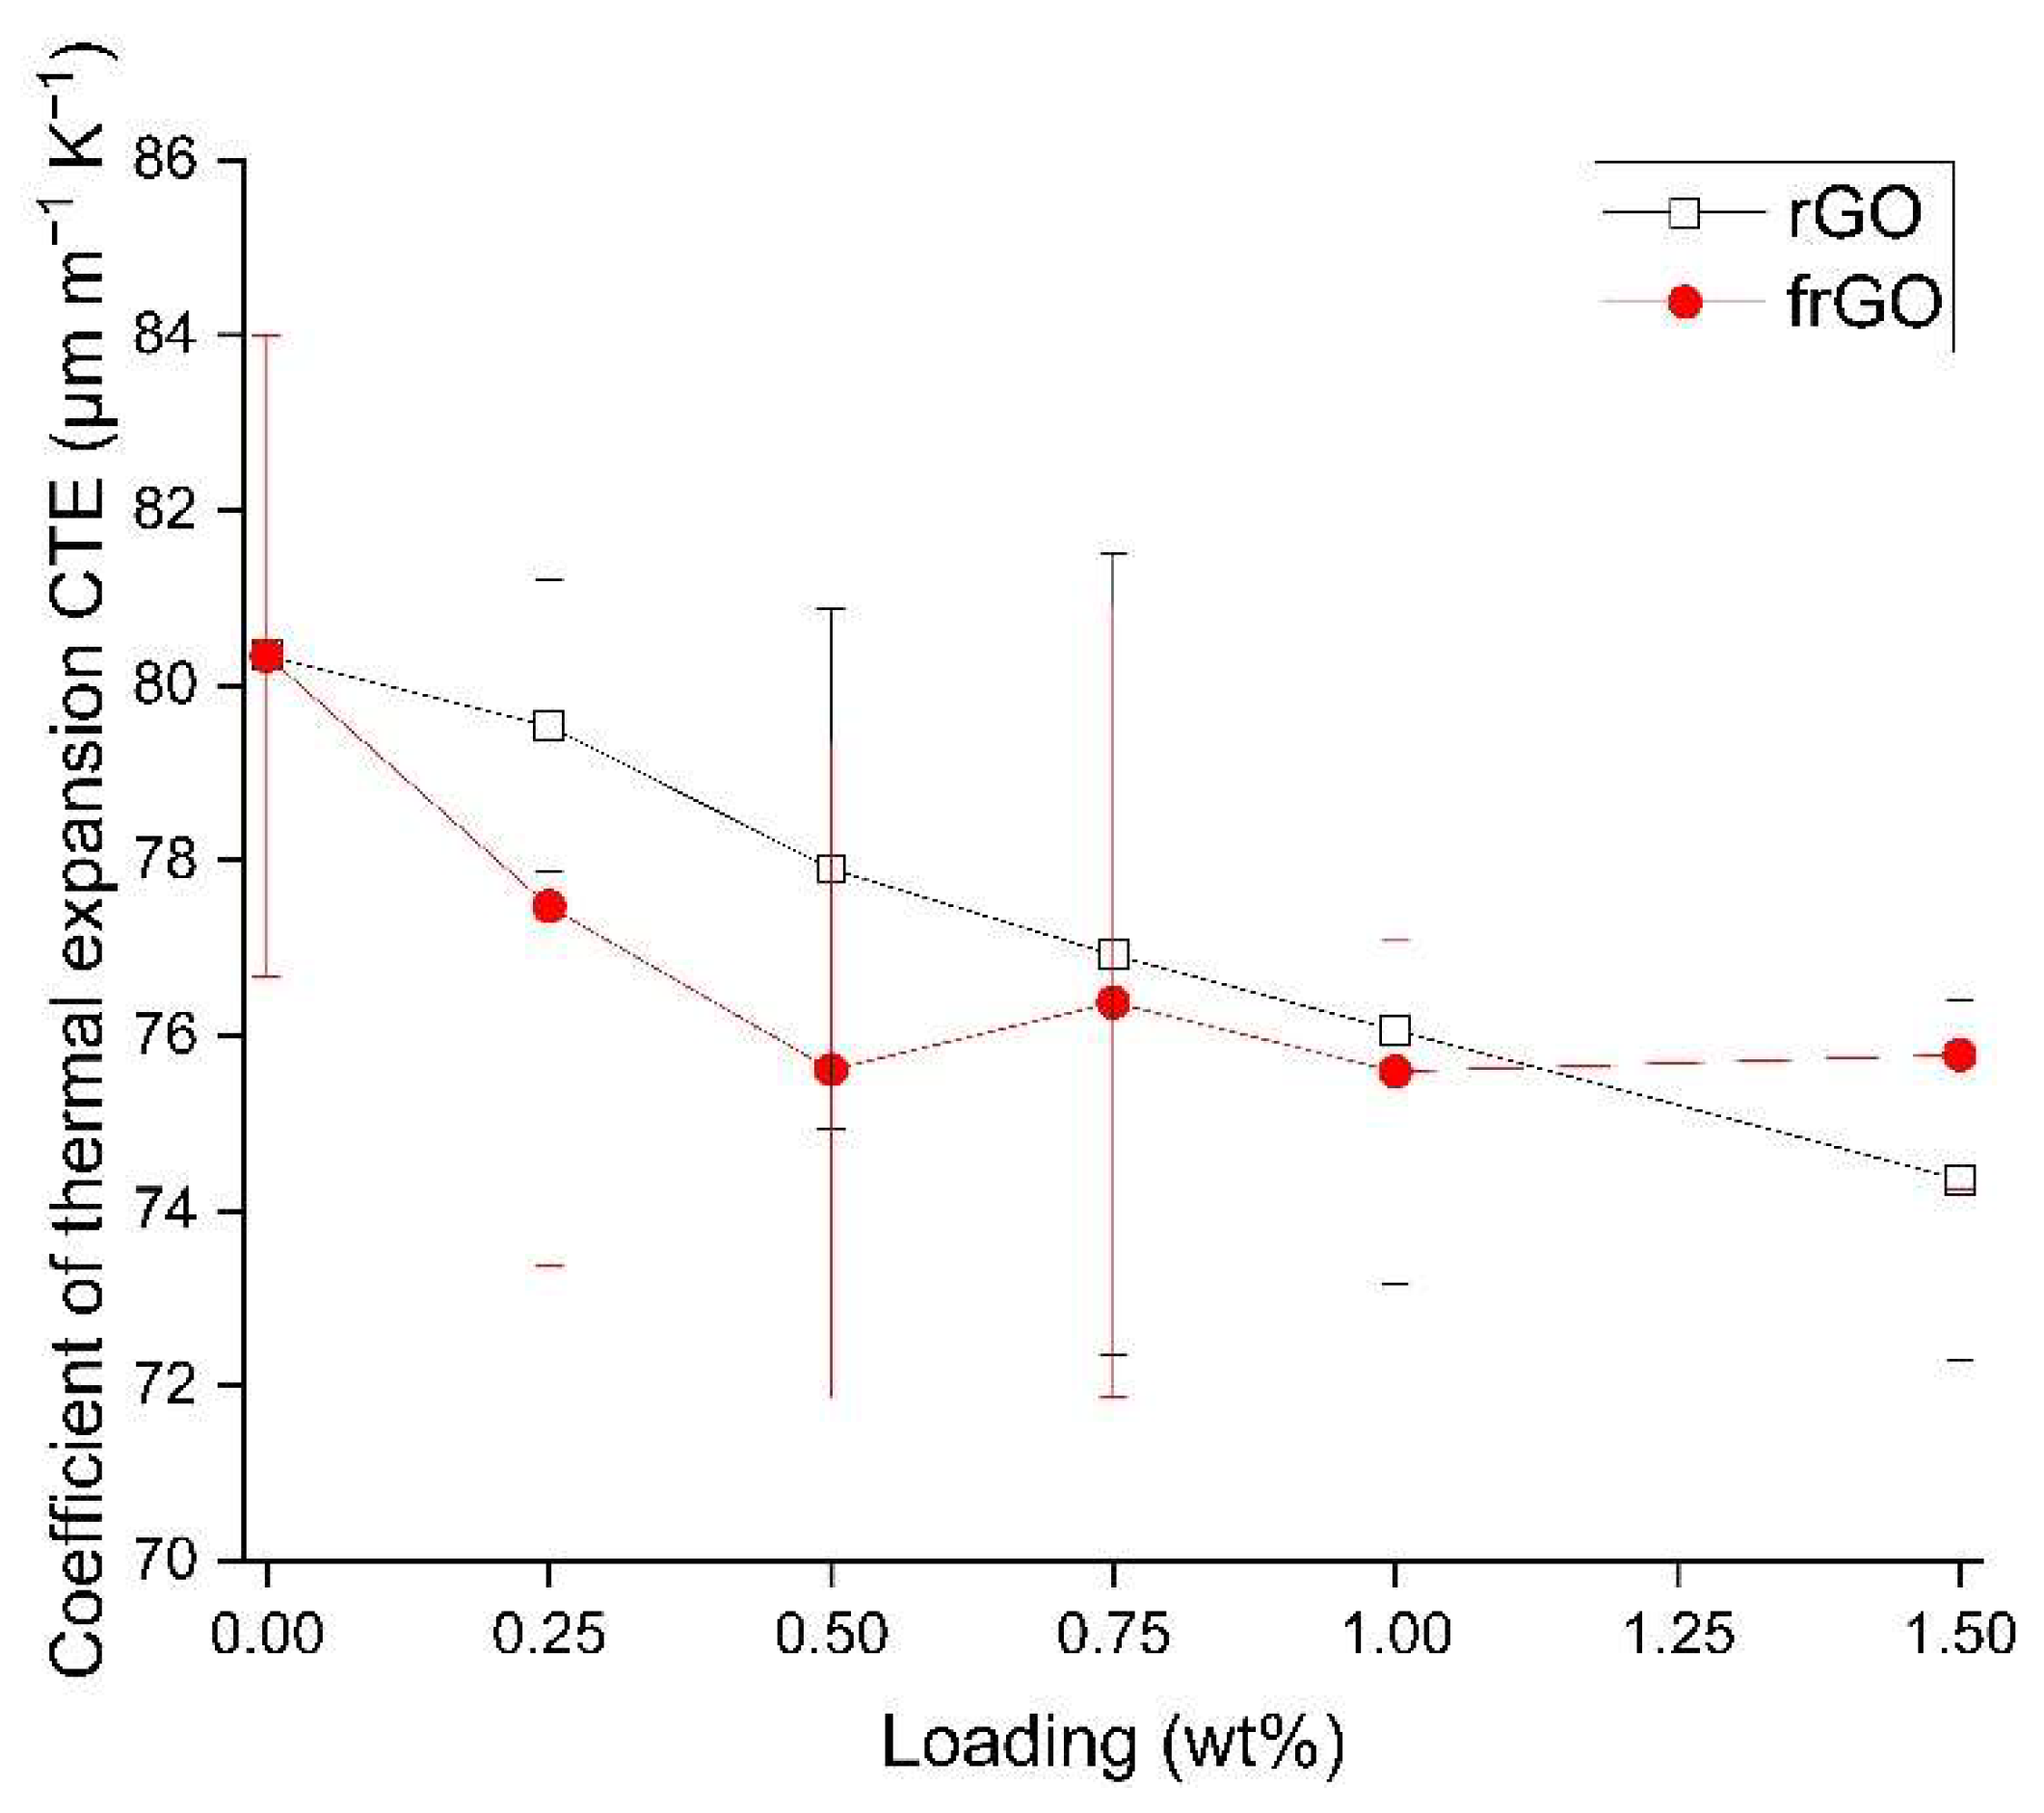
The coefficient of thermal expansion (CTE) of the examined materials was evaluated based on thermomechanical analysis (TMA) and using a TA Instruments TMA 2940. In accordance to DIN 53752:1980 [38], a total of three samples was assessed for each material configuration. Each specimen was heated 3 times in succession from room temperature to 70 °C at a heating rate of 3 °C min−1.
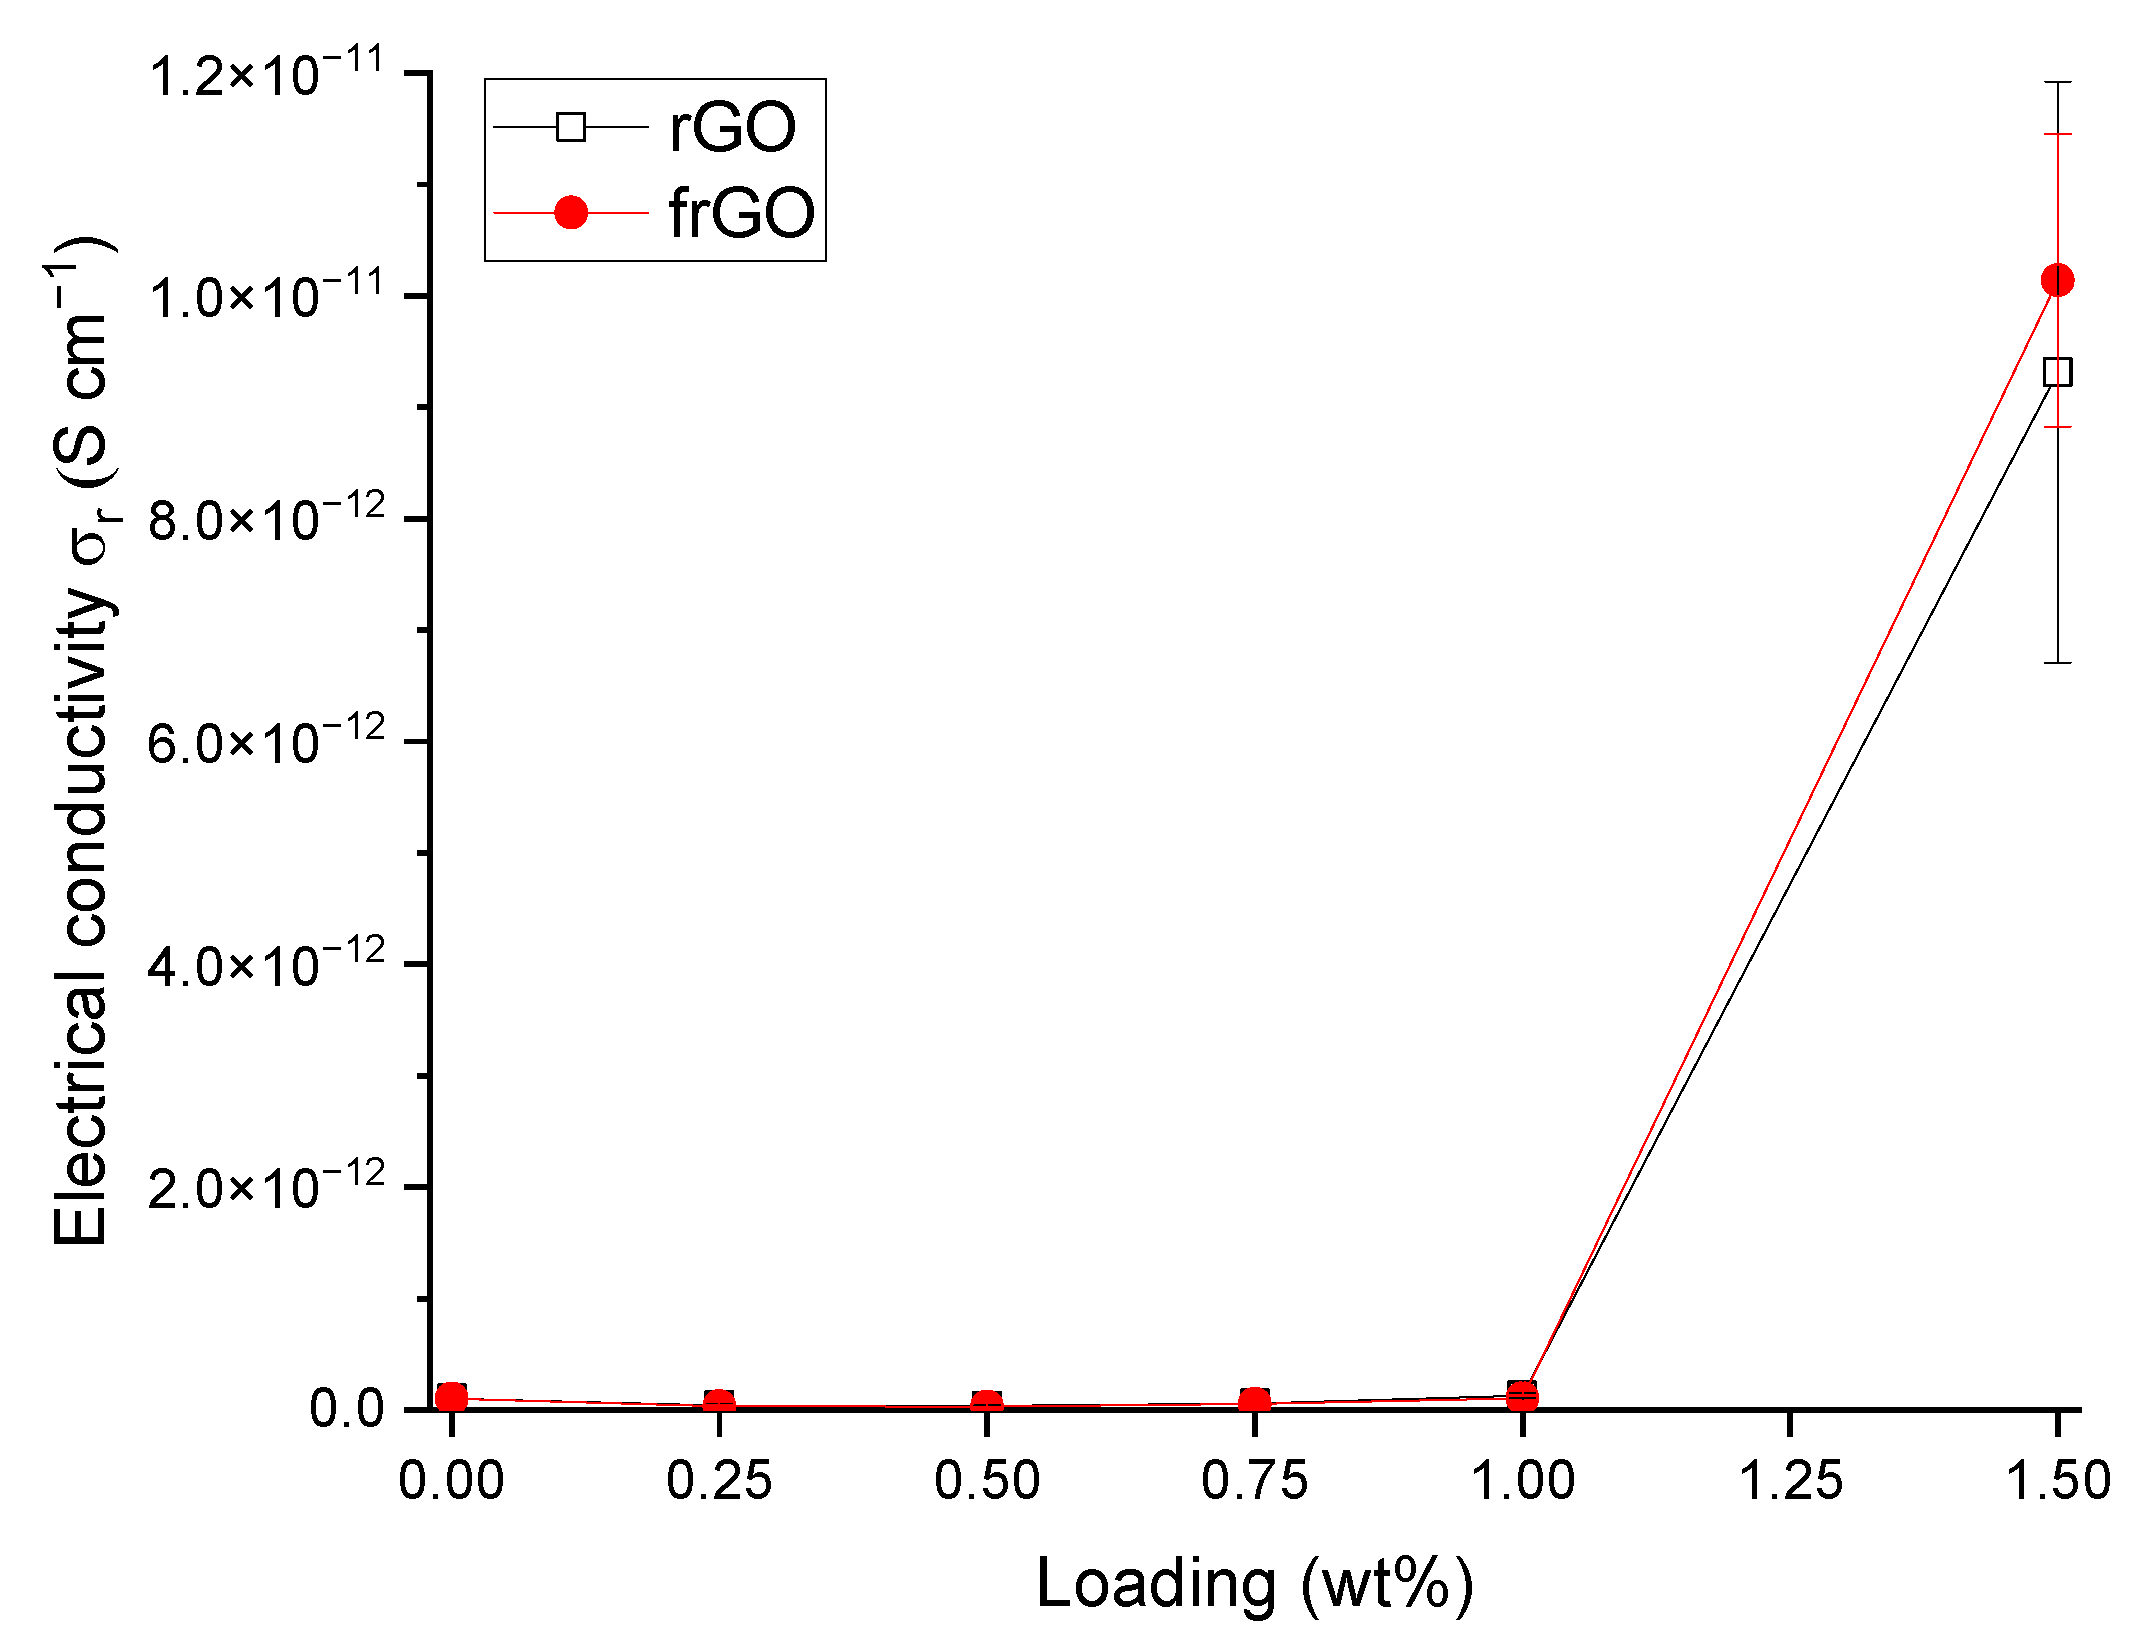
In order to determine the electrical conductivity of the neat polymer and nanocomposite samples, the volume resistance of these materials was measured based on DIN EN 62631-3-1 (VDE 0307-3-1):2017 [39] and using a Keysight (Santa Rosa, CA, USA) N1424 resistivity cell connected to a Keysight N1424 volume/surface selector box, which was attached to a Keysight B2987A electrometer/high resistance meter. The respective specimen was clamped with a force of 5 kg using a circular electrode with a diameter of 88 mm. The volume resistance Rx was noted after each specimen was exposed to the voltage source for 1 min to allow a settling of the measured resistance. The volume resistance was used to obtain the sample’s electrical conductivity σ r by
σ r = h R x A ¢ ,
where A ¢ is the effective area of the electrode and h is the specimen’s mean height. The electrical conductivity was assessed based on three specimens for each material configuration, where each sample was measured three times. As the measurement procedure might lead to the charging of the sample, it was ensured that repetitive measurements of the respective sample were only repeated after 24 h.

3. Results and Discussion

3.1. Characterization of the Powder Materials

The general morphology of rGO and frGO as obtained by SEM is shown in Figure 1. As expected, both rGO and frGO exhibited a very rough surface and can be classified as a material with multiple layers of graphene stacked on top of each other. Furthermore, the frGO powder samples appear to have a slightly rougher surface than the rGO particles, which is also indicated by the brighter appearance of the edges of the frGO particles. These brighter edges are caused by the increased emission of electrons at very thin regions of the material and, hence, indicate a more pronounced surface roughness [40].
To evaluate the chemical composition and to verify the presence of the amine functional groups in the case of frGO, the powder materials were analyzed using EDX as well as XPS and the obtained results are stated in Table 2 and Table 3, respectively. In addition, exemplary XPS spectra of rGO and frGO are shown in Figure 2. As expected, the graphite powder primarily consists of carbon with some impurities that can be typically found in natural graphite [41]. As the graphene derivatives are manufactured via a modified Hummers’ method, the carbon-to-oxygen (C/O) ratios of both rGO and frGO are much lower than the C/O ratio of graphite or graphene, which typically range between 20/1 to 50/1 [42,43]. Yet, both C/O ratios are in the range of the various grades of reduced graphene oxide that typically exhibit a C/O ratio of up to 16/1 [44]. These ratios are also much higher than the C/O ratio of GO, which can be as low as 2/1 [45]. However, the rGO and frGO used in this work demonstrate different C/O ratios, even though they share an identical manufacturing process and only vary in the subsequent plasma treatment of the frGO particles. Furthermore, the presence of amine functional groups on the surface of the frGO particles with a share of 1.2 At% was confirmed in the XPS data. The presence of amines was not detected by EDX as the underlying measuring principle is not able to detect either nitrogen or hydrogen atoms. Moreover, both measurement techniques were able to obtain very similar results. Hence, it can be postulated that a number of oxygen-containing functional groups were removed from the particles’ surfaces during the plasma treatment and were replaced with a number of amine functional groups. This change in the chemical structure of rGO to frGO is shown in Scheme 1.

3.2. Mechanical Properties

The mechanical characteristics of the neat polymer and nanocomposite samples were measured by tensile tests in conjunction with an evaluation of the resulting fracture surfaces as well as DMA. The results of the conducted tensile tests are summarized in Figure 3 and Table 4. The stress–strain curves of exemplary samples are illustrated in Figure 4. With increasing rGO and frGO loadings, an increase in the Young’s modulus of up to 14% was observed, indicating an increased stiffness of the nanocomposite samples. A significant difference of the rGO and frGO nanocomposites was only observed at a medium loading of 0.75 wt%, where the nanocomposite with the addition of frGO displayed a higher Young’s modulus than the rGO-including nanocomposite. However, the increase in the Young’s modulus with increasing (f)rGO loadings was also associated with a drastic decrease in the ultimate tensile strength by up to 34% in comparison to the neat polymer. These results match the findings available in the literature in which an increase in the ultimate tensile strength in epoxy composites was only observed at very low rGO loadings of ≤0.1 wt% and then started to decrease, while the Young’s modulus continued to increase for higher weight fractions [47,48]. In addition, the modulus of toughness can be established by evaluating the area under the stress–strain curve [49]. In agreement with the strong decrease in the ultimate tensile strength for loadings ≥0.25 wt% (f)rGO, the toughness of the rGO- as well as the frGO-including nanocomposites was inferior to the neat polymer samples and deteriorated with increasing additive content with no significant difference between rGO and frGO. This decrease in toughness for graphene derivatives/epoxy nanocomposites was also observed in other studies in which a homogeneous dispersion of the particles, but a weak interface with the polymer, was observed [50,51,52]. This particular behavior with respect to tensile strength as well as toughness can be explained by the increasingly brittleness due to the presence of graphene-related materials. At higher proportions of graphene and its derivatives, more areas with microcracks are formed, as illustrated in the SEM images in Figure 5. This leads to a decreasing interparticle distance and, hence, the coalescence of microcracks, which facilitates the propagation of cracks and consequently a reduction in the ultimate tensile strength and toughness [53]. Furthermore, the presence of particles is also associated with local stress concentrations, which also result in a decreasing strength and toughness of the nanocomposites [54].
Exemplary fracture surfaces as obtained after the tensile tests are shown in Figure 5. The neat polymer sample displayed a comparatively smooth surface with a flow pattern that is typical for epoxies. In contrast to this, the fracture surfaces of the nanocomposite samples appeared more coarse. This roughness was created by the (f)rGO particles that deflected cracks and consequently led to numerous smaller fractured surfaces and, hence, a rugged appearance. However, the specimens with lower particle loadings (Figure 5b) appeared smoother than the samples with higher particle loadings. They also showed the slab-like appearance that was also observed in the neat polymer samples. This is an indication of some degree of agglomeration at lower particle loadings that was also observed in our previous work [55]. At higher particle loadings (Figure 5c,d), a strongly increased surface roughness was observed in both the rGO- and frGO-including nanocomposite materials. Nonetheless, the sample with frGO inclusions demonstrated a more uniform rugged appearance with larger height variations than the rGO-loaded sample with identical additive loadings. This overall increased roughness indicates that the frGO particles were more homogeneously dispersed and deflected cracks better than the rGO particles. Nonetheless, the tensile strength and toughness of the frGO-including nanocomposites were only marginally higher than the rGO-including nanocomposites, which is an indication that the adhesion of the used particles with the epoxy-based matrix is not drastically improved by the plasma treatment [56].
DMA was conducted to evaluate the glass transition temperature, the storage modulus in the glassy region as well as the loss factor of the various material configurations, and the obtained results are reported in Figure 6 and Table 5. The glass transition temperature of the various samples was obtained based on the position of tan δpeak, and a glass transition temperature of 95 °C was measured in the case of the neat polymer sample. For loadings up to 1.00 wt%, the addition of the used (f)rGO particles did not lead to a major change in the glass transition temperature. If the additive content was however increased to 1.50 wt%, a small increase in the glass transition temperature by 2% was assessed in the case of rGO inclusions. Similar to the Young’s modulus, the storage modulus in the glassy region can be used to approximate the stiffness of materials. As all nanocomposites show a higher glassy storage modulus than the neat polymer, the increased stiffness with increasing (f)rGO loadings was also confirmed by the DMA measurements over the entire temperature range in the glassy plateau. The results from the tensile tests that there was no significant difference between the frGO- and rGO-including nanocomposites was also visible in the DMA data. Given that tan δmax is defined as the ratio between the loss modulus and storage modulus, it can be used to estimate the internal friction in nanocomposites [57]. Even though the presence of rGO led to an increase in the storage modulus at any weight fraction, as well as an increase in the glass transition temperature at 1.50 wt%, no significant effect on tan δmax was established. In contrast to this, the frGO-including composites demonstrated an increase in tan δmax up to a loading of 0.50 wt%. From 0.75 to 1.50 wt% frGO, the values of tan δmax started to decrease and, at 1.50 wt%, the value of tan δmax was significantly lower than the value of the neat polymer. This reduction in tan δmax in conjunction with an increased peak broadness at higher frGO loadings implies an enhanced interfacial bonding due to the amine functionalization of these particles [58].

3.3. Thermal Properties

Despite the low intrinsic thermal conductivity of polymers, graphene and its derivatives may be used to improve the thermal properties, such as the specific heat capacity, thermal diffusivity, as well as the thermal conductivity of such materials. The results obtained for the (f)rGO/epoxy nanocomposites evaluated in this work are reported in Table 6. A slight increase in the specific heat capacity was observed in the case of all nanocomposite samples, but the error of the obtained measurements was too large to confirm a significant effect of the used particles. Yet, a strong dependence of the specific heat capacity was observed with respect to temperature (Figure 7). All samples share an identical gradient with rising temperatures leading to increasing specific heat capacities. In contrast to this, the values of the thermal diffusivity remained approximately constant with increasing temperatures, but are strongly dependent on the presence of (f)rGO. For the composites with weight fractions of ≥0.75 wt% (f)rGO, the thermal diffusivities are significantly higher than for the neat polymer. Furthermore, a stronger effect of frGO can be noticed where the thermal diffusivity at room temperature of 1.50 wt% frGO is 7% and 24% higher than the thermal diffusivities of the 1.50 wt% rGO and neat polymer samples, respectively. As expected, the thermal conductivity showed a behavior that is linked to the characteristics of both the specific heat capacity and thermal diffusivity. Figure 8 illustrates the dependence of the thermal conductivity on temperature. Similar to the specific heat capacity, a gradual increase in the thermal conductivity with rising temperatures was established. In agreement with the thermal diffusivity, an approximately linear growth of the thermal conductivity was observed with increasing weight fractions of the used additives. This linear increase with the absence of a percolation behavior has previously been reported elsewhere [59,60], and similar findings for the change in specific heat capacity, thermal diffusivity, and thermal conductivity in an epoxy matrix were observed in other work [61,62,63]. Furthermore, the effect of frGO on the thermal conductivity was found to be stronger than the influence of rGO. For example, 1.50 wt% frGO resulted in a rise of the thermal conductivity by 27%, while 1.50 wt% rGO only allowed an increase of 20%, in comparison to the neat polymer at room temperature. This superior performance of the nanocomposite samples with frGO inclusions can be explained by the improved interface between the particles and the matrix. Given that thermal energy in graphene and its derivatives is transferred by lattice vibrations (i.e., phonons), the poor coupling of the vibration modes at the graphene material/polymer interface leads to a significant degree of phonon scattering and thermal resistance (i.e., Kapitza resistance) [64,65,66]. If a suitable functionalization is applied to the used additive, a covalent bonding between the particle and the matrix can lead to a significantly higher thermal conductivity [63,67,68].
In addition to the thermal characteristics mentioned above, the coefficient of thermal expansion of the various material configurations was established. Huh et al. [69] determined the coefficient of thermal expansion of rGO to be equal to 15 × 106 µm m−1 K−1, which is much lower than the coefficient of thermal expansion of epoxies and suggests a decrease in the coefficient of thermal expansion with increasing weight fractions of (f)rGO. This was confirmed in our data that are reported in Figure 9. With 1.50 wt% rGO, a maximum reduction in the coefficient of thermal expansion by 7%, in comparison to the neat polymer, was established. This is comparable to the relative changes obtained by Wang et al. [70] for epoxies with inclusions of graphite, GO and single-wall carbon nanotubes. Furthermore, our samples with inclusions of rGO showed a steady decrease in the coefficient of thermal expansion, while the specimens with frGO exhibited a less linear reduction in the coefficient of thermal expansion, even though no significant difference was observed at the various weight fractions. The more pronounced difference between the rGO- and frGO-including nanocomposites at lower weight fractions was also established by Seong and Kim [71] for epoxies with non-functionalized and amine-functionalized graphene nanoplatelets. An explanation of this different behavior in the case of the functionalized particles might be due to the restricted mobility of the polymer chains caused by the improved bonding between matrix and frGO [72].

3.4. Electrical Properties

In order to conduct a thorough characterization of the prepared nanocomposites, the electrical conductivity of the various material configurations was determined. As can be deduced from Figure 10, a percolation network started to develop after a loading of 1.00 wt% was exceeded, and no significant difference can be observed between rGO and frGO. The electrical conductivity obtained at 1.50 wt% (f)rGO was approximately three orders of magnitude lower than the electrical conductivity of (f)rGO-including epoxies presented in other work [47,73]. The quality of the used particles, the interface of the matrix with the additives, and the intrinsic conductance of the used polymer may explain this discrepancy. First, the intrinsic electrical conductivity of rGO is strongly dependent on the C/O ratio, where a higher oxygen content implies a lower electrical conductivity [74,75,76]. For instance, the work by Tschoppe et al. [47] used rGO and nitrogen-containing frGO that was functionalized using cyanamide, and both particulate materials exhibited a higher C/O ratio and should consequently have a higher intrinsic electrical conductivity than the powder materials used in this work. Second, good interfaces in which the particles experience, e.g., a covalent bonding with the matrix, allow an efficient transfer of electrons across their boundary layers [16]. As shown by the results from the mechanical and thermal properties detailed above, the interface between the frGO particles and the matrix is improved, but this enhancement is not strong enough to significantly affect factors, such as the Young’s modulus, toughness, or electrical conductivity. Third, epoxies are insulating materials with an electrical conductivity in the range of 10−12 to 10−15 S cm−1 [77]. The electrical conductivity of the neat polymer used in this study was found to be equal to (1.0 ± 0.3) × 10−13 S cm−1 and, hence, is located at the lower bound of the aforementioned range. Given that the electrical conductivity of the nanocomposite is influenced by the electrical conductivities of both the used graphene derivative and matrix material, a low intrinsic electrical conductivity of the constituent materials affects the resulting conductivity of the composite as a whole.

4. Conclusions

This work evaluated the influence of an amine-functionalization of reduced graphene oxide on the mechanical, thermal and electrical properties of epoxy/amine-based hardener nanocomposites. The morphology as examined by the use of SEM images of the rGO and frGO particles showed that no major visual differences were observed between the used additives. The elemental composition, however, demonstrated a marginally higher C/O ratio and the presence of nitrogen functionalities in the case of the frGO particles. The mechanical characteristics of the produced nanocomposites were examined by the use of tensile tests, the evaluation of the resulting fracture surfaces and DMA. As proven by both the tensile tests and DMA, an increased stiffness with increasing weight fractions of (f)rGO was determined for all material configurations, but this comes at the cost of a deterioration of the strength and toughness, as well as a more brittle fracture behavior. Furthermore, the more rugged fracture surfaces and the DMA measurements of the frGO-including nanocomposites indicated an improved interfacial bonding caused by the amine-functionalities on the frGO particles. Hence, the bonding, as achieved by the used plasma functionalization process, seems to be too weak to result in a significant enhancement of the mechanical properties. A similar behavior with no significant difference between the rGO- and frGO-including nanocomposites was observed in the case of the coefficient of thermal expansion, specific heat capacity and electrical conductivity of the prepared nanocomposites. However, the frGO-including nanocomposite demonstrated significantly higher values of the thermal diffusivity and thermal conductivity than the nanocomposites with rGO as the used additive. This confirms the effectiveness of the used functionalization by the applied plasma processing with respect to the thermal conductivity. Furthermore, an approximately linear increase in the thermal conductivity was observed with both increasing weight fractions of the used additives and rising temperatures. These findings suggest the potential of rGO and especially frGO to further increase the thermal performance in composite materials at room temperature, but also at elevated temperatures. This will be useful to enable applications, such as the use in thermal interface materials or fiber-reinforced polymers.

Author Contributions

Conceptualization, A.C.A.; methodology, A.C.A.; validation, A.C.A.; formal analysis, A.C.A., M.F. and A.W.; investigation, A.C.A., M.F. and A.W.; resources, A.C.A. and P.M.; data curation, A.C.A.; writing—original draft preparation, A.C.A.; writing—review and editing, S.C., B.L.F. and P.M.; visualization, A.C.A.; supervision, B.L.F. and P.M.; project administration, A.C.A., S.C. and P.M.; funding acquisition, S.C. and P.M. All authors have read and agreed to the published version of the manuscript.

Funding

This research and development project is funded by the German Federal Ministry of Education and Research (BMBF) within the framework concept “Forschungscampus” ARENA2036 (funding number: 02P18Q643) and managed by the Project Management Agency Karlsruhe (PTKA). The author is responsible for the contents of this publication.

Data Availability Statement

Not applicable.

Acknowledgments

The authors thank Graphit Kropfmühl GmbH and Sika Deutschland GmbH for the supply of materials and Mhamed Assebban (Friedrich-Alexander University Erlangen-Nürnberg, Institute of Advanced Materials and Processes–ZMP) for the preparation of the SEM and EDX analysis of the powder materials.

Conflicts of Interest

The authors declare no conflict of interest.

References

  1. Balandin, A.A.; Ghosh, S.; Bao, W.; Calizo, I.; Teweldebrhan, D.; Miao, F.; Lau, C.N. Superior thermal conductivity of single-layer graphene. Nano Lett. 2008, 8, 902–907. [Google Scholar] [CrossRef]
  2. Bolotin, K.I.; Sikes, K.J.; Hone, J.; Stormer, H.L.; Kim, P. Temperature-Dependent Transport in Suspended Graphene. Phys. Rev. Lett. 2008, 101, 1–4. [Google Scholar] [CrossRef] [Green Version]
  3. Lee, C.; Wei, X.; Kysar, J.W.; Hone, J. Measurement of the elastic properties and intrinsic strength of monolayer graphene. Science 2008, 321, 385–388. [Google Scholar] [CrossRef]
  4. Zhu, Y.; Murali, S.; Cai, W.; Li, X.; Suk, J.W.; Potts, J.R.; Ruoff, R.S. Graphene and graphene oxide: Synthesis, properties, and applications. Adv. Mater. 2010, 22, 3906–3924. [Google Scholar] [CrossRef]
  5. Saritha, A.; Malhotra, S.K.; Thomas, S.; Joseph, K.; Goda, K.; Sreekala, M.S. State of the Art—Nanomechanics. In Polymer Composites: Volume 2: Nanocomposites, 1st ed.; Thomas, S., Joseph, K., Malhotra, S.K., Goda, K., Sreekala, M.S., Eds.; Wiley-VCH: Weinheim, Germany, 2013; pp. 1–12. [Google Scholar]
  6. Raccichini, R.; Varzi, A.; Passerini, S.; Scrosati, B. The role of graphene for electrochemical energy storage. Nat. Mater. 2015, 14, 271–279. [Google Scholar] [CrossRef]
  7. Tkachev, S.V.; Buslaeva, E.Y.; Gubin, S.P. Graphene: A novel carbon nanomaterial. Inorg. Mater. 2011, 47, 1–10. [Google Scholar] [CrossRef]
  8. Hummers, W.S.; Offeman, R.E. Preparation of Graphitic Oxide. J. Am. Chem. Soc. 1958, 80, 1339. [Google Scholar] [CrossRef]
  9. Warner, J.H. Reduced Graphene Oxide. In Graphene: Fundamentals and Emergent Applications, 1st ed.; Warner, J.H., Schäffel, F., Rümmeli, M.H., Bachmatiuk, A., Eds.; Elsevier: Amsterdam, The Netherlands, 2013; pp. 155–163. [Google Scholar]
  10. Backes, C.; Abdelkader, A.M.; Alonso, C.; Andrieux-Ledier, A.; Arenal, R.; Azpeitia, J.; Balakrishnan, N.; Banszerus, L.; Barjon, J.; Bartali, R.; et al. Production and processing of graphene and related materials. 2D Mater. 2020, 7, 22001. [Google Scholar] [CrossRef]
  11. Wang, F.; Drzal, L.T.; Qin, Y.; Huang, Z. Mechanical properties and thermal conductivity of graphene nanoplatelet/epoxy composites. J. Mater. Sci. 2015, 50, 1082–1093. [Google Scholar] [CrossRef]
  12. Papageorgiou, D.G.; Kinloch, I.A.; Young, R.J. Mechanical properties of graphene and graphene-based nanocomposites. Prog. Mater. Sci. 2017, 90, 75–127. [Google Scholar] [CrossRef]
  13. Alam, A.; Wan, C.; McNally, T. Surface amination of carbon nanoparticles for modification of epoxy resins: Plasma-treatment vs. wet-chemistry approach. Eur. Polym. J. 2017, 87, 422–448. [Google Scholar] [CrossRef]
  14. Li, Z.; Chu, J.; Yang, C.; Hao, S.; Bissett, M.A.; Kinloch, I.A.; Young, R.J. Effect of functional groups on the agglomeration of graphene in nanocomposites. Compos. Sci. Technol. 2018, 163, 116–122. [Google Scholar] [CrossRef]
  15. Burger, N.; Laachachi, A.; Ferriol, M.; Lutz, M.; Toniazzo, V.; Ruch, D. Review of thermal conductivity in composites: Mechanisms, parameters and theory. Prog. Polym. Sci. 2016, 61, 1–28. [Google Scholar] [CrossRef]
  16. Ma, J.; Meng, Q.; Zaman, I.; Zhu, S.; Michelmore, A.; Kawashima, N.; Wang, C.H.; Kuan, H.-C. Development of polymer composites using modified, high-structural integrity graphene platelets. Compos. Sci. Technol. 2014, 91, 82–90. [Google Scholar] [CrossRef]
  17. Ahmadi-Moghadam, B.; Sharafimasooleh, M.; Shadlou, S.; Taheri, F. Effect of functionalization of graphene nanoplatelets on the mechanical response of graphene/epoxy composites. Mater. Des. 2015, 66, 142–149. [Google Scholar] [CrossRef]
  18. Fang, H.; Bai, S.-L.; Wong, C.P. Microstructure engineering of graphene towards highly thermal conductive composites. Compos. A 2018, 112, 216–238. [Google Scholar] [CrossRef]
  19. Schürmann, H. Konstruieren mit Faser-Kunststoff-Verbunden, 2nd ed.; Springer: Berlin/Heidelberg, Germany, 2007. [Google Scholar]
  20. Pascault, J.-P.; Williams, R.J.J. General Concepts about Epoxy Polymers. In Epoxy Polymers: New Materials and Innovations, 1st ed.; Pascault, J.-P., Williams, R.J.J., Eds.; Wiley-VCH: Weinheim, Germany, 2010; pp. 1–12. [Google Scholar]
  21. Hirsch, A.; Englert, J.M.; Hauke, F. Wet chemical functionalization of graphene. Acc. Chem. Res. 2013, 46, 87–96. [Google Scholar] [CrossRef]
  22. Park, J.; Yan, M. Covalent functionalization of graphene with reactive intermediates. Acc. Chem. Res. 2013, 46, 181–189. [Google Scholar] [CrossRef]
  23. Paredes, J.; Martínez-Alonso, A.; Tascón, J.M.D. Atomic-scale scanning tunneling microscopy study of plasma-oxidized ultrahigh-modulus carbon fiber surfaces. J. Colloid. Interface Sci. 2003, 258, 276–282. [Google Scholar] [CrossRef]
  24. Bertóti, I.; Mohai, M.; László, K. Surface modification of graphene and graphite by nitrogen plasma: Determination of chemical state alterations and assignments by quantitative X-ray photoelectron spectroscopy. Carbon 2015, 84, 185–196. [Google Scholar] [CrossRef] [Green Version]
  25. Inagaki, N. Plasma Surface Modification and Plasma Polymerization, 1st ed.; Technomic Publishing: Lancaster, UK, 1996. [Google Scholar]
  26. Hegemann, D.; Brunner, H.; Oehr, C. Plasma treatment of polymers for surface and adhesion improvement. Nucl. Instrum. Methods. Phys. Res. Sect. B 2003, 208, 281–286. [Google Scholar] [CrossRef]
  27. Qin, H.; Sun, Y.; Liu, J.Z.; Liu, Y. Mechanical properties of wrinkled graphene generated by topological defects. Carbon 2016, 108, 204–214. [Google Scholar] [CrossRef]
  28. Mirabedini, A.; Ang, A.; Nikzad, M.; Fox, B.; Lau, K.; Hameed, N. Evolving Strategies for Producing Multiscale Graphene-Enhanced Fiber-Reinforced Polymer Composites for Smart Structural Applications. Adv. Sci. 2020, 7, 1903501. [Google Scholar] [CrossRef] [Green Version]
  29. Shahil, K.M.F.; Balandin, A.A. Graphene-multilayer graphene nanocomposites as highly efficient thermal interface materials. Nano Lett. 2012, 12, 861–867. [Google Scholar] [CrossRef] [Green Version]
  30. Chen, H.; Ginzburg, V.V.; Yang, J.; Yang, Y.; Liu, W.; Huang, Y.; Du, L.; Chen, B. Thermal conductivity of polymer-based composites: Fundamentals and applications. Prog. Polym. Sci. 2016, 59, 41–85. [Google Scholar] [CrossRef]
  31. Silva, A.A.; Stein, R.; Campos, D.; Indrusiak, T.; Soares, B.G.; Barra, G.M.O. Conducting Materials Based on Epoxy/Graphene Nanoplatelet Composites With Microwave Absorbing Properties: Effect of the Processing Conditions and Ionic Liquid. Front. Mater. 2019, 6, 156. [Google Scholar] [CrossRef]
  32. Balaji, R.; Sasikumar, R.; Sasikumar, M. Graphene based strain and damage prediction system for polymer composites. Compos. A 2017, 103, 48–59. [Google Scholar] [CrossRef]
  33. Reghat, M.; Mirabedini, A.; Tan, A.M.; Weizman, Y.; Middendorf, P.; Bjekovic, R.; Hyde, L.; Antiohos, D.; Hameed, N.; Fuss, F.K.; et al. Graphene as a piezo-resistive coating to enable strain monitoring in glass fiber composites. Compos. Sci. Technol. 2021, 211, 108842. [Google Scholar] [CrossRef]
  34. DIN Deutsches Institut für Normung e.V. Plastics—Determination of Tensile Properties—Part 2: Test Conditions for Moulding and Extrusion Plastics; 83.080.01 (DIN EN ISO 527-2); Beuth Verlag: Berlin, Germany, 2012. [Google Scholar]
  35. DIN Deutsches Institut für Normung e.V. Aerospace—Fibre Reinforced Materials—Determination of Glass Transition of Fibre Composites under Dynamic Load; 49.025.40 (DIN 65583); Beuth Verlag: Berlin, Germany, 1999. [Google Scholar]
  36. DIN Deutsches Institut für Normung e.V. Plastics—Differential Scanning Calorimetry (DSC)—Part 4: Determination of Specific Heat Capacity; 83.080.01 (DIN EN ISO 11357-4); Beuth Verlag: Berlin, Germany, 2021. [Google Scholar]
  37. DIN Deutsches Institut für Normung e.V. Plastics—Determination of Thermal Conductivity and Thermal Diffusivity—Part 4: Laser Flash Method; 83.080.01 (DIN EN ISO 22007-4); Beuth Verlag: Berlin, Germany, 2017. [Google Scholar]
  38. DIN Deutsches Institut für Normung e.V. Testing of Plastics; Determination of the Coefficient of Linear Thermal Expansion; 83.080.01 (DIN 53752); Beuth Verlag: Berlin, Germany, 1980. [Google Scholar]
  39. DIN Deutsches Institut für Normung e.V. Dielectric and Resistive Properties of Solid Insulating Materials—Part 3-1: Determination of Resistive Properties (DC Methods)—Volume Resistance and Volume Resistivity—General Method (IEC 62631-3-1:2016); 29.035.01 (DIN EN 62631-3-1 (VDE 0307-3-1)); Beuth Verlag: Berlin, Germany, 2017. [Google Scholar]
  40. Goldstein, J.; Newbury, D.E.; Michael, J.R.; Ritchie, N.W.M.; Scott, J.H.J.; Joy, D.C. Scanning Electron Microscopy and X-ray Microanalysis, 4th ed.; Springer: New York, NY, USA, 2018. [Google Scholar]
  41. Jalili, R.; Esrafilzadeh, D.; Aboutalebi, S.H.; Sabri, Y.M.; Kandjani, A.E.; Bhargava, S.K.; Della Gaspera, E.; Gengenbach, T.R.; Walker, A.; Chao, Y.; et al. Silicon as a ubiquitous contaminant in graphene derivatives with significant impact on device performance. Nat. Commun. 2018, 9, 5070. [Google Scholar] [CrossRef]
  42. Hofmann, D.; Wartig, K.-A.; Thomann, R.; Dittrich, B.; Schartel, B.; Mülhaupt, R. Functionalized Graphene and Carbon Materials as Additives for Melt-Extruded Flame Retardant Polypropylene. Macromol. Mater. Eng. 2013, 298, 1322–1334. [Google Scholar] [CrossRef]
  43. Moon, I.K.; Lee, J.; Ruoff, R.S.; Lee, H. Reduced graphene oxide by chemical graphitization. Nat. Commun. 2010, 1, 73. [Google Scholar] [CrossRef] [Green Version]
  44. Boukhvalov, D.W.; Katsnelson, M.I. Modeling of graphite oxide. J. Am. Chem. Soc. 2008, 130, 10697–10701. [Google Scholar] [CrossRef] [Green Version]
  45. Bianco, A.; Cheng, H.-M.; Enoki, T.; Gogotsi, Y.; Hurt, R.H.; Koratkar, N.; Kyotani, T.; Monthioux, M.; Park, C.R.; Tascon, J.M.; et al. All in the graphene family—A recommended nomenclature for two-dimensional carbon materials. Carbon 2013, 65, 1–6. [Google Scholar] [CrossRef]
  46. Vacchi, I.A.; Ménard-Moyon, C.; Bianco, A. Chemical Functionalization of Graphene Family Members. Phys. Sci. Rev. 2017, 2, 20160103. [Google Scholar] [CrossRef]
  47. Tschoppe, K.; Beckert, F.; Beckert, M.; Mülhaupt, R. Thermally Reduced Graphite Oxide and Mechanochemically Functionalized Graphene as Functional Fillers for Epoxy Nanocomposites. Macromol. Mater. Eng. 2015, 300, 140–152. [Google Scholar] [CrossRef]
  48. Zang, J.; Wan, Y.-J.; Zhao, L.; Tang, L.-C. Fracture Behaviors of TRGO-Filled Epoxy Nanocomposites with Different Dispersion/Interface Levels. Macromol. Mater. Eng. 2015, 300, 737–749. [Google Scholar] [CrossRef]
  49. Callister, W.D. Materials Science and Engineering: An Introduction, 6th ed.; Wiley: New York, NY, USA, 2003. [Google Scholar]
  50. Prolongo, M.G.; Salom, C.; Arribas, C.; Sánchez-Cabezudo, M.; Masegosa, R.M.; Prolongo, S.G. Influence of graphene nanoplatelets on curing and mechanical properties of graphene/epoxy nanocomposites. J. Therm. Anal. Calorim. 2016, 125, 629–636. [Google Scholar] [CrossRef] [Green Version]
  51. Trusiano, G.; Matta, S.; Bianchi, M.; Rizzi, L.G.; Frache, A. Evaluation of nanocomposites containing graphene nanoplatelets: Mechanical properties and combustion behavior. Polym. Eng. Sci. 2019, 59, 2062–2071. [Google Scholar] [CrossRef]
  52. Salom, C.; Prolongo, M.G.; Toribio, A.; Martínez-Martínez, A.J.; de Cárcer, I.A.; Prolongo, S.G. Mechanical properties and adhesive behavior of epoxy-graphene nanocomposites. Int. J. Adhes. Adhes. 2018, 84, 119–125. [Google Scholar] [CrossRef]
  53. Park, Y.T.; Qian, Y.; Chan, C.; Suh, T.; Nejhad, M.G.; Macosko, C.W.; Stein, A. Epoxy Toughening with Low Graphene Loading. Adv. Funct. Mater. 2015, 25, 575–585. [Google Scholar] [CrossRef]
  54. Eqra, R.; Moghim, M.H. Effect of strain rate on the fracture behaviour of epoxy–graphene nanocomposite. Bull. Mater. Sci. 2016, 39, 1197–1204. [Google Scholar] [CrossRef] [Green Version]
  55. Ackermann, A.C.; Carosella, S.; Rettenmayr, M.; Fox, B.L.; Middendorf, P. Rheology, dispersion, and cure kinetics of epoxy filled with amine- and non-functionalized reduced graphene oxide for composite manufacturing. J. Appl. Polym. Sci. 2022, 139, e51664. [Google Scholar] [CrossRef]
  56. Fang, M.; Zhang, Z.; Li, J.; Zhang, H.; Lu, H.; Yang, Y. Constructing hierarchically structured interphases for strong and tough epoxy nanocomposites by amine-rich graphene surfaces. J. Mater. Chem. 2010, 20, 9635. [Google Scholar] [CrossRef]
  57. Bashir, M.A. Use of Dynamic Mechanical Analysis (DMA) for Characterizing Interfacial Interactions in Filled Polymers. Solids 2021, 2, 108–120. [Google Scholar] [CrossRef]
  58. Panwar, V.; Pal, K. Dynamic Mechanical Analysis of Clay–Polymer Nanocomposites. In Clay-Polymer Nanocomposites, 1st ed.; Jlassi, K., Chehimi, M.M., Thomas, S., Eds.; Elsevier: Amsterdam, The Netherlands, 2017; pp. 413–441. [Google Scholar]
  59. Li, Y.; Zhang, H.; Porwal, H.; Huang, Z.; Bilotti, E.; Peijs, T. Mechanical, electrical and thermal properties of in-situ exfoliated graphene/epoxy nanocomposites. Compos. A 2017, 95, 229–236. [Google Scholar] [CrossRef]
  60. Kim, H.S.; Bae, H.S.; Yu, J.; Kim, S.Y. Thermal conductivity of polymer composites with the geometrical characteristics of graphene nanoplatelets. Sci. Rep. 2016, 6, 26825. [Google Scholar] [CrossRef] [Green Version]
  61. Chatterjee, S.; Wang, J.W.; Kuo, W.S.; Tai, N.H.; Salzmann, C.; Li, W.L.; Hollertz, R.; Nüesch, F.A.; Chu, B. Mechanical reinforcement and thermal conductivity in expanded graphene nanoplatelets reinforced epoxy composites. Chem. Phys. Lett. 2012, 531, 6–10. [Google Scholar] [CrossRef]
  62. Olowojoba, G.B.; Eslava, S.; Gutierrez, E.S.; Kinloch, A.J.; Mattevi, C.; Rocha, V.G.; Taylor, A.C. In situ thermally reduced graphene oxide/epoxy composites: Thermal and mechanical properties. Appl. Nanosc. 2016, 6, 1015–1022. [Google Scholar] [CrossRef]
  63. Ganguli, S.; Roy, A.K.; Anderson, D.P. Improved thermal conductivity for chemically functionalized exfoliated graphite/epoxy composites. Carbon 2008, 46, 806–817. [Google Scholar] [CrossRef]
  64. Pollack, G.L. Kapitza Resistance. Rev. Mod. Phys. 1969, 41, 48–81. [Google Scholar] [CrossRef]
  65. Pop, E.; Varshney, V.; Roy, A.K. Thermal properties of graphene: Fundamentals and applications. MRS Bull. 2012, 37, 1273–1281. [Google Scholar] [CrossRef] [Green Version]
  66. Shtein, M.; Nadiv, R.; Buzaglo, M.; Kahil, K.; Regev, O. Thermally Conductive Graphene-Polymer Composites: Size, Percolation, and Synergy Effects. Chem. Mater. 2015, 27, 2100–2106. [Google Scholar] [CrossRef]
  67. Huang, X.; Iizuka, T.; Jiang, P.; Ohki, Y.; Tanaka, T. Role of Interface on the Thermal Conductivity of Highly Filled Dielectric Epoxy/AlN Composites. J. Phys. Chem. C 2012, 116, 13629–13639. [Google Scholar] [CrossRef]
  68. Yao, H.; Hawkins, S.A.; Sue, H.-J. Preparation of epoxy nanocomposites containing well-dispersed graphene nanosheets. Compos. Sci. Technol. 2017, 146, 161–168. [Google Scholar] [CrossRef]
  69. Huh, S.H.; Choi, S.-H.; Ju, H.-M.; Kim, D.-H. Properties of interlayer thermal expansion of 6-layered reduced graphene oxide. J. Korean Phys. Soc. 2014, 64, 615–618. [Google Scholar] [CrossRef]
  70. Wang, S.; Tambraparni, M.; Qiu, J.; Tipton, J.; Dean, D. Thermal Expansion of Graphene Composites. Macromolecules 2009, 42, 5251–5255. [Google Scholar] [CrossRef]
  71. Seong, M.; Kim, D.S. Effects of facile amine-functionalization on the physical properties of epoxy/graphene nanoplatelets nanocomposites. J. Appl. Polym. Sci. 2015, 132, 42269. [Google Scholar] [CrossRef]
  72. Chhetri, S.; Adak, N.C.; Samanta, P.; Murmu, N.C.; Kuila, T. Functionalized reduced graphene oxide/epoxy composites with enhanced mechanical properties and thermal stability. Polym. Test. 2017, 63, 1–11. [Google Scholar] [CrossRef]
  73. Yousefi, N.; Sun, X.; Lin, X.; Shen, X.; Jia, J.; Zhang, B.; Tang, B.; Chan, M.; Kim, J.-K. Highly aligned graphene/polymer nanocomposites with excellent dielectric properties for high-performance electromagnetic interference shielding. Adv. Mater. 2014, 26, 5480–5487. [Google Scholar] [CrossRef]
  74. Morimoto, N.; Kubo, T.; Nishina, Y. Tailoring the Oxygen Content of Graphite and Reduced Graphene Oxide for Specific Applications. Sci. Rep. 2016, 6, 21715. [Google Scholar] [CrossRef]
  75. Meng, Q.-L.; Liu, H.-C.; Huang, Z.; Kong, S.; Lu, X.; Tomkins, P.; Jiang, P.; Bao, X. Mixed conduction properties of pristine bulk graphene oxide. Carbon 2016, 101, 338–344. [Google Scholar] [CrossRef]
  76. Colonna, S.; Monticelli, O.; Gomez, J.; Novara, C.; Saracco, G.; Fina, A. Effect of morphology and defectiveness of graphene-related materials on the electrical and thermal conductivity of their polymer nanocomposites. Polymer 2016, 102, 292–300. [Google Scholar] [CrossRef] [Green Version]
  77. Licari, J.J. Coating Materials for Electronic Applications: Polymers, Processes, Reliability, Testing, 1st ed.; Noyes Publications: Norwich, UK; William Andrew Publication: Norwich, UK, 2003. [Google Scholar]
Figure 1. SEM images of the used powder materials at a magnification of 1500×. (a) rGO; (b) frGO.
Jcs 06 00153 g001
Figure 2. Exemplary XPS spectra of (a) rGO C1s, (b) frGO C1s, and (c) frGO N1s.
Jcs 06 00153 g002
Scheme 1. Representation of the functionalization process of rGO to frGO based on the molecular structure as suggested by Vacchi et al. Adapted with permission from Ref. [46]. Copyright 2022 De Gruyter.
Jcs 06 00153 sch001
Figure 3. Tensile behavior of the examined materials with respect to the mean of the characteristic parameter and respective expanded uncertainty for a coverage probability of 95%. (a) Young’s modulus; (b) ultimate tensile strength; (c) strain at break; and (d) modulus of toughness.
Jcs 06 00153 g003
Figure 4. Exemplary stress–strain curves of the neat polymer and nanocomposite samples as obtained from the conducted tensile tests.
Jcs 06 00153 g004
Figure 5. SEM images of the fracture surfaces after tensile testing taken at a magnification of 400× showing increased fracture surface roughness with increasing nanoparticle loading. (a) Neat polymer; (b) 0.25 wt% frGO; (c) 1.50 wt% rGO; and (d) 1.50 wt% frGO.
Jcs 06 00153 g005
Figure 6. Dynamic mechanical properties of neat polymer and nanocomposite samples as obtained by DMA. (a) Mean storage modulus as a function of temperature. Note that the mean curves of 1.50 wt% rGO and 1.50 wt% frGO are nearly identical; (b) mean loss factor as a function of temperature.
Jcs 06 00153 g006
Figure 7. Mean specific heat capacity versus temperature of neat polymer and exemplary (f)rGO/epoxy nanocomposite samples.
Jcs 06 00153 g007
Figure 8. Mean thermal conductivity and respective expanded uncertainty for a coverage probability of 95% versus temperature of neat polymer and exemplary (f)rGO/epoxy nanocomposite samples.
Jcs 06 00153 g008
Figure 9. Mean coefficient of thermal expansion and respective expanded uncertainty for a coverage probability of 95% of the examined materials.
Jcs 06 00153 g009
Figure 10. Mean electrical conductivity and respective expanded uncertainty for a coverage probability of 95% of the examined materials.
Jcs 06 00153 g010
Table 1. Gap widths used for the dispersion of the rGO and frGO particles in the used epoxy resin using a three-roll mill.
Cycle NumberWidth of First Gap (µm)Width of Second Gap (µm)
19030
29030
36020
46020
53010
63010
7155
8155
Table 2. Elemental composition of the powder materials as evaluated by EDX.
Powder MaterialElemental Composition (At%)Atomic C/O Ratio
COSiSCaN
graphite96.73.30.00.00.00.029.3/1
rGO84.215.10.10.30.20.05.6/1
frGO89.310.30.00.40.00.08.7/1
Table 3. Elemental composition and respective expanded uncertainty for a coverage probability of 95% of the powder materials as evaluated by XPS.
Powder MaterialElemental Composition (At%)Atomic C/O Ratio
COSiSCaN
graphite96.0 ± 1.53.5 ± 1.50.2 ± 0.20.0 ± 0.00.3 ± 0.30.0 ± 0.027.4/1
rGO86.8 ± 0.113.2 ± 0.10.0 ± 0.00.0 ± 0.00.0 ± 0.00.0 ± 0.06.6/1
frGO88.6 ± 0.710.1 ± 0.70.0 ± 0.00.0 ± 0.00.1 ± 0.11.2 ± 0.18.8/1
Table 4. Characteristic parameters of the conducted tensile tests with respective expanded uncertainty for a coverage probability of 95%, and relative change of the respective parameter with respect to the mean of the neat polymer sample.
MaterialYoung’s Modulus EUltimate Tensile Strength UTSStrain at Break εbModulus of Toughness UT
(GPa)(%)(MPa)(%)(%)(%)(MJ m−3)(%)
Neat polymer3.05 ± 0.05-72.46 ± 0.11-7.95 ± 0.60-4.56 ± 0.37-
0.25 wt% rGO3.07 ± 0.02065.98 ± 0.69−93.34 ± 0.08−581.37 ± 0.06−70
0.25 wt% frGO3.04 ± 0.03064.07 ± 0.81−123.11 ± 0.16−611.22 ± 0.10−73
0.50 wt% rGO3.10 ± 0.03158.43 ± 2.18−192.53 ± 0.20−680.87 ± 0.11−81
0.50 wt% frGO3.06 ± 0.04050.72 ± 4.84 −302.03 ± 0.29−740.59 ± 0.14−87
0.75 wt% rGO3.18 ± 0.05452.11 ± 4.20−282.08 ± 0.27−740.62 ± 0.14−86
0.75 wt% frGO3.32 ± 0.05953.78 ± 1.75−262.11 ± 0.13−740.65 ± 0.07−86
1.00 wt% rGO3.30 ± 0.03848.54 ± 8.34−331.87 ± 0.42−760.54 ± 0.18 −88
1.00 wt% frGO3.34 ± 0.07954.93 ± 1.30−242.18 ± 0.07−730.70 ± 0.04−85
1.50 wt% rGO3.47 ± 0.041448.14 ± 2.60−341.77 ± 0.18−780.49 ± 0.09−89
1.50 wt% frGO3.43 ± 0.081250.25 ± 0.60−311.91 ± 0.05−760.56 ± 0.02−88
Table 5. Characteristic parameters of the conducted DMA experiments with respective expanded uncertainty for a coverage probability of 95%, and relative change of the respective parameter with respect to the mean of the neat polymer sample.
MaterialStorage Modulus E’g at 40 °CLoss Factor tan δmaxGlass Transition Temperature Tg Based on tan δpeak
(GPa)(%)(-)(%)(°C)(%)
Neat polymer2.11 ± 0.41-1.07 ± 0.07-95 ± 0-
0.25 wt% rGO2.65 ± 0.14251.06 ± 0.01−195 ± 10
0.25 wt% frGO2.56 ± 0.21211.12 ± 0.03596 ± 11
0.50 wt% rGO2.52 ± 0.11191.07 ± 0.01−195 ± 00
0.50 wt% frGO2.53 ± 0.11201.23 ± 0.081495 ± 11
0.75 wt% rGO2.82 ± 0.09331.06 ± 0.04−197 ± 23
0.75 wt% frGO2.64 ± 0.28251.04 ± 0.02−495 ± 10
1.00 wt% rGO2.86 ± 0.16351.02 ± 0.04−595 ± 10
1.00 wt% frGO2.75 ± 0.30301.00 ± 0.03−795 ± 00
1.50 wt% rGO2.92 ± 0.12381.10 ± 0.03299 ± 25
1.50 wt% frGO2.85 ± 0.07350.97 ± 0.00−1096 ± 22
Table 6. Characteristic parameters of the evaluated thermal properties at room temperature with respective expanded uncertainty for a coverage probability of 95%, and relative change of the respective parameter with respect to the mean of the neat polymer sample.
MaterialSpecific Heat Capacity cpThermal Diffusivity aThermal Conductivity λ
(kJ kg−1 K−1)(%)(mm2 s−1)(%)(W m−1 K−1)(%)
Neat polymer1.099 ± 0.086-0.126 ± 0.004-0.161 ± 0.014-
0.25 wt% rGO1.135 ± 0.05930.127 ± 0.00400.167 ± 0.0103
0.25 wt% frGO1.141 ± 0.03340.125 ± 0.002−10.165 ± 0.0052
0.50 wt% rGO1.130 ± 0.01830.143 ± 0.004130.187 ± 0.00616
0.50 wt% frGO1.161 ± 0.01160.133 ± 0.00450.178 ± 0.00611
0.75 wt% rGO1.150 ± 0.06950.136 ± 0.00580.181 ± 0.01312
0.75 wt% frGO1.141 ± 0.04840.146 ± 0.005160.193 ± 0.01020
1.00 wt% rGO1.160 ± 0.02460.133 ± 0.00450.179 ± 0.00711
1.00 wt% frGO1.132 ± 0.01630.145 ± 0.002150.190 ± 0.00418
1.50 wt% rGO1.137 ± 0.01230.147 ± 0.003160.193 ± 0.00420
1.50 wt% frGO1.127 ± 0.02730.157 ± 0.002240.205 ± 0.00627
Publisher’s Note: MDPI stays neutral with regard to jurisdictional claims in published maps and institutional affiliations.

