1. Introduction
The novel coronavirus, also known as COVID-19, created a global health crisis early in 2020. The disease originates from the virus known as a severe acute respiratory syndrome or coronavirus 2, also called SARS-CoV-2 [
1], a socially transmitted disease and can infect individuals because of close contact to the infected patients. The number of infected individuals from COVID-19 cases surpasses 30 million, and death raises close to one million as of 09 September 2020 [
2]. While many COVID-19 cases exhibit mild symptoms, a small percentage suffers from severe or critical conditions [
3]. In increasingly genuine cases, the contamination can cause pneumonia, extreme intense respiratory discomfort, multi-organ failure, and death [
4]. The health systems have been overwhelmed among developed countries such as the USA, UK, and Italy due to the expanding demand for intensive care units, as those units filled with COVID-19 patients with severe medical conditions [
5].
Until no fruitful vaccine is developed, expanding the screening and isolating the COVID-19 patients from the mass population is the only solution to reduce the transmissions on a large scale. Currently, all over the world, reverse transcription-polymerase chain reaction (RT-PCR) has been used as a standard gold test to detect COVID-19 patients. However, the test results often produce false alarms, and the current success rate is merely 70% [
4]. Additionally, test results take time to acquire, leaving behind a higher risk and possibility of spreading the disease among other peoples by the patients.
Therefore, to limit the dependency on limited test kits and control the exponential growth of COVID-19 patients, many studies suggested chest radiograph (X-ray) based screening procedures at the early stages of this pandemic and demonstrated satisfactory results by achieving higher accuracy than the RT-PCR test. However, since the disease outbreak in 2020, most of the studies had to deal with limited data and reported their result with those available resources. For example, Ghoshal et al. (2020) [
6] experimented on a dataset comprises of 70 COVID-19 images from one source [
7] and non-COVID-19 images from another sources [
8]. Their proposed Bayesian CNN model improves the detection rate from 85.7% to 92.9% along with the VGG16 model [
9]. Similarly, Narin et al. (2020) [
10] used only 100 images to conduct that experiment, and the dataset consist, 50 chest X-rays of COVID-19 and 50 normal chest X-ray of non-COVID-19 patients. Additionally, Zhang et al. (2020) presented the ResNet model, using 70 COVID-19 and 1008 non-COVID-19 pneumonia patients from different data sources. The evaluation result showed 96% sensitivity, 70.7% specificity and 0.952 of AUC [
11]. Wang et al. (2020) introduced a deep CNN based model known as COVID-Net, which attained 83.5% accuracy to detect COVID-19 patients from a dataset of 5941 images which includes 1203 healthy, 931 bacterial pneumonia, 660 viral pneumonia, and 45 individuals with COVID-19 cases [
12].
Apart from chest X-ray, some literature suggested chest computed tomography (CT) based screening to distinguish between COVID-19 and non-COVID-19 patients [
11,
13,
14,
15,
16,
17]. For instance, Chen et al. (2020) used UNet++ to classify COVID-19 and non-COVID-19 patients considering 132 sample images using 51 COVID-19, 55 non-COVID-19, 16 viral pneumonia, and 11 non-pneumonia patients and revealed that artificial intelligence reduces the reading time of radiologists up to 65% [
13]. Zhang et al. (2020) [
11] used the UNet model for lung segmentation, considering 540—included 313 COVID-19 and 229 non-COVID-19 patients’ CT scan—images, and reported the result with 90.7% sensitivity and 91.1% specificity score. Besides, several studies employed the ResNet model to detect COVID-19 patients from the chest CT [
14,
15,
16]. Jin et al. (2020) [
14] proposed the ResNet15V2 model for detecting COVID-19 patients with the dataset of 1881 images (496 COVID-19 and 1385 non-COVID-19) and study result shows 94.1% of sensitivity, and 95.5% of specificity [
14]. Song et al. (2020) and Li et al. (2020) implemented ResNet50 to detect COVID-19 patients from chest CT scan and achieved 86% and 96% accuracy, respectively [
15,
17].
Since most of the early studies used limited data, therefore questions raised regarding their models’ stability. Thereby, a better approach to present such limited data result is to provide the result with confidence intervals, which are missing almost in every study. The existing proposed models either demonstrated their potential on chest radiography or CT scan-based datasets, not in both scenarios. Therefore, a model developed with mixed data—chest radiography and CT scan—might provide that answer.
Recently, explanatory artificial intelligence (EAI) gained much popularity in medical image analysis as it helps to understand, visualize, and interpret any machine learning models used for disease prediction [
18,
19]. Ribeiro et al. (2016) proposed Local Interpretable Model-agnostic Explanations (LIME), a novel approach that explains any classifier’s performance in an interpretable manner [
20]. LIME drew much attention by showing superiority in explaining how Google’s pre-trained network predicts by merely analyzing some random images [
21]. Holzinger et al. (2017) consent that explainable-AI might be the next future in medical domains when health professionals rely on AI to understand the patients’ conditions [
22]. Thus, an AI that explains the X-ray or CT scan images’ infectious regions might help the general practitioners— doctors, nurses, and health professionals, especially in rural areas— to detect between COVID-19 patients with others.
In general, this investigation found that a large portion of the study either considered chest X-ray or CT scan image analysis with a couple of deep learning models because of the time constraints. However, in accordance with the recent literature and extending the current work one step further, this research contributes as follows: (1) Proposed and tested eight individual convolutional neural network-based models—VGG16 [
23], InceptionResNetV2 [
24], ResNet50 [
25], DenseNet201 [
26], VGG19 [
23], MobileNetV2 [
27], NasNetMobile [
28], and ResNet15V2 [
29]—to detect COVID-19 patients using CT scan and chest X-ray images; (2) analyzed between existing models with the proposed ones in terms of accuracy, precision, recall, and f1-score; and (3) finally, applied LIME to explain features that help the model to identify COVID-19 patients from others.
The rest of the paper is organized as follows:
Section 2 discusses the research methodology of this study. This is followed by the results of the proposed research for detecting COVID-19 from chest X-rays and CT scan in
Section 3.
Section 4 then provides detailed discussion and insight by analyzing the results in terms of models’ overall performances, comparing with the previous studies, and others. Finally,
Section 5 concludes the article summarizing our findings, with an identification of opportunities for future work.
2. Methodology
This research uses two distinct datasets containing X-ray and CT scan images collected from the open-source Kaggle datasets repository [
8]. At the time of the study, one dataset contains 400 chest X-ray images, and another includes 400 CT scan images.
Table 1 summarizes the datasets used in this study. As commonly adopted in data mining techniques, this study used 80% data for training, whereas the remaining 20% was used for testing. The experiment was repeated two times and the model’s performance was evaluated by averaging those two outcomes.
A transfer learning technique was implemented to develop the models [
30] by acquiring model’s weight from pre-trained models (i.e., ImageNet [
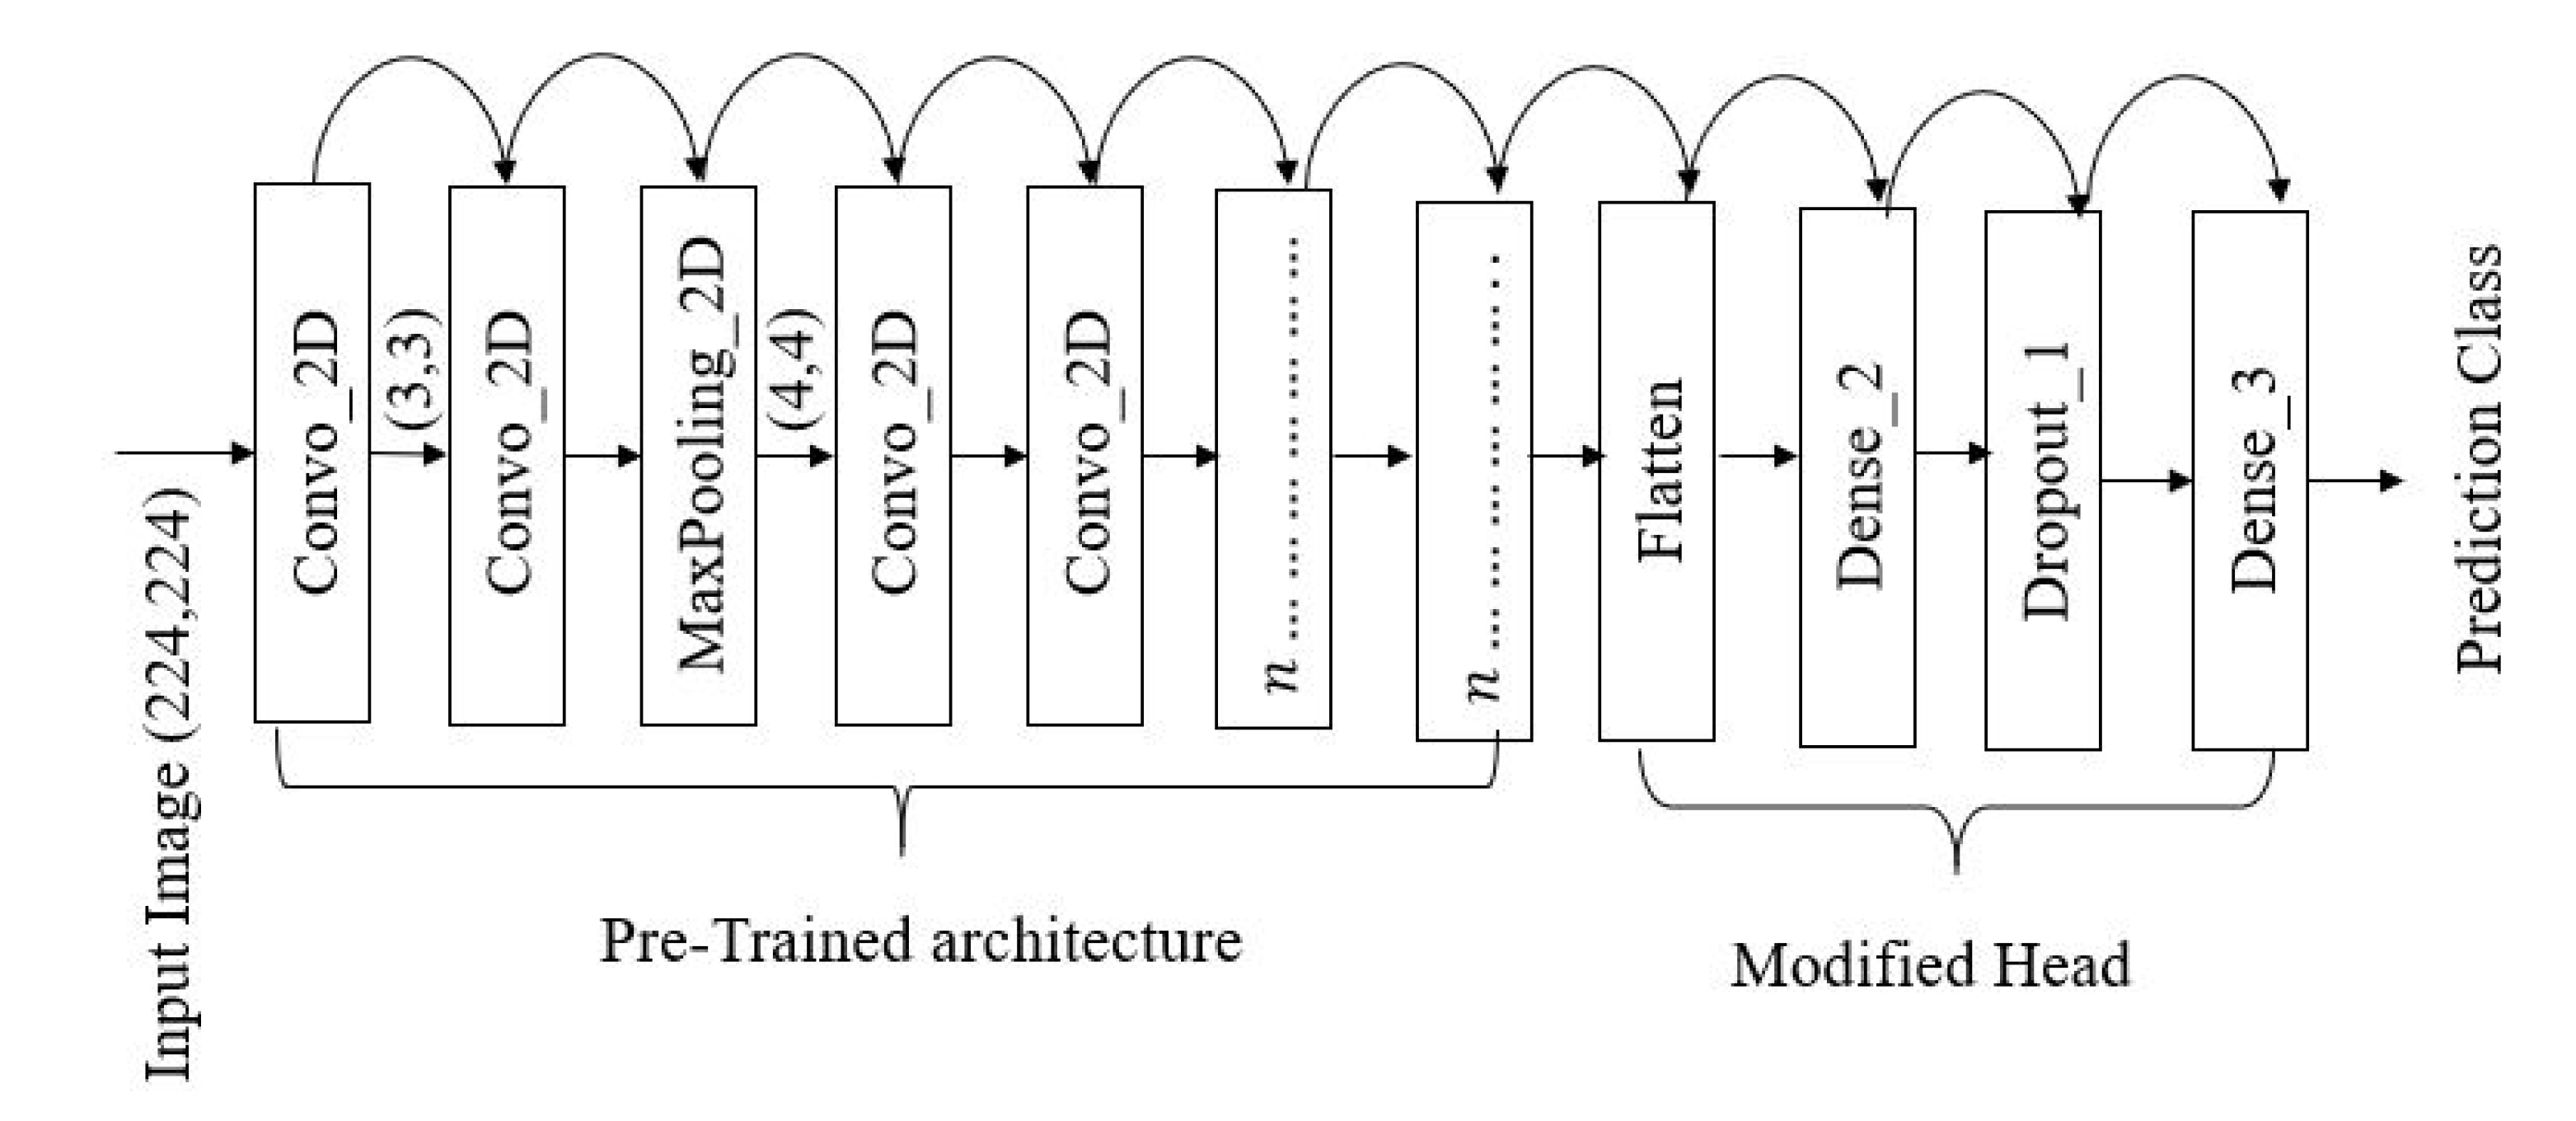
31]). The primary model’s architecture contains three components—pre-trained network, modified head, and prediction class (inspired from [
11]). The pre-trained networks are employed to extract the high-level features and connected to the modified network and classification head, respectively.
Figure 1 illustrates one of the modified proposed models’ architecture. The architecture contains 16 [
32] CNN layers with different filter numbers, sizes, and stride values.
The proposed models are constructed using three basic layers:
If
is considered as the input layer, then the proposed models layout for VGG16 may be expressed as:
A robust model also relays on proper feature extraction techniques as well [
33]. Let the letter,
Then the two-dimensional convolutional operation can be expressed as follows [
34]:
where * represents the discrete convolution operation [
34]. Kernel, K slides over the images with the stride parameters. The Rectified Linear unit (ReLu) is used as an activation function in the dense layer. ReLu function can be calculated with the following equations [
34]:
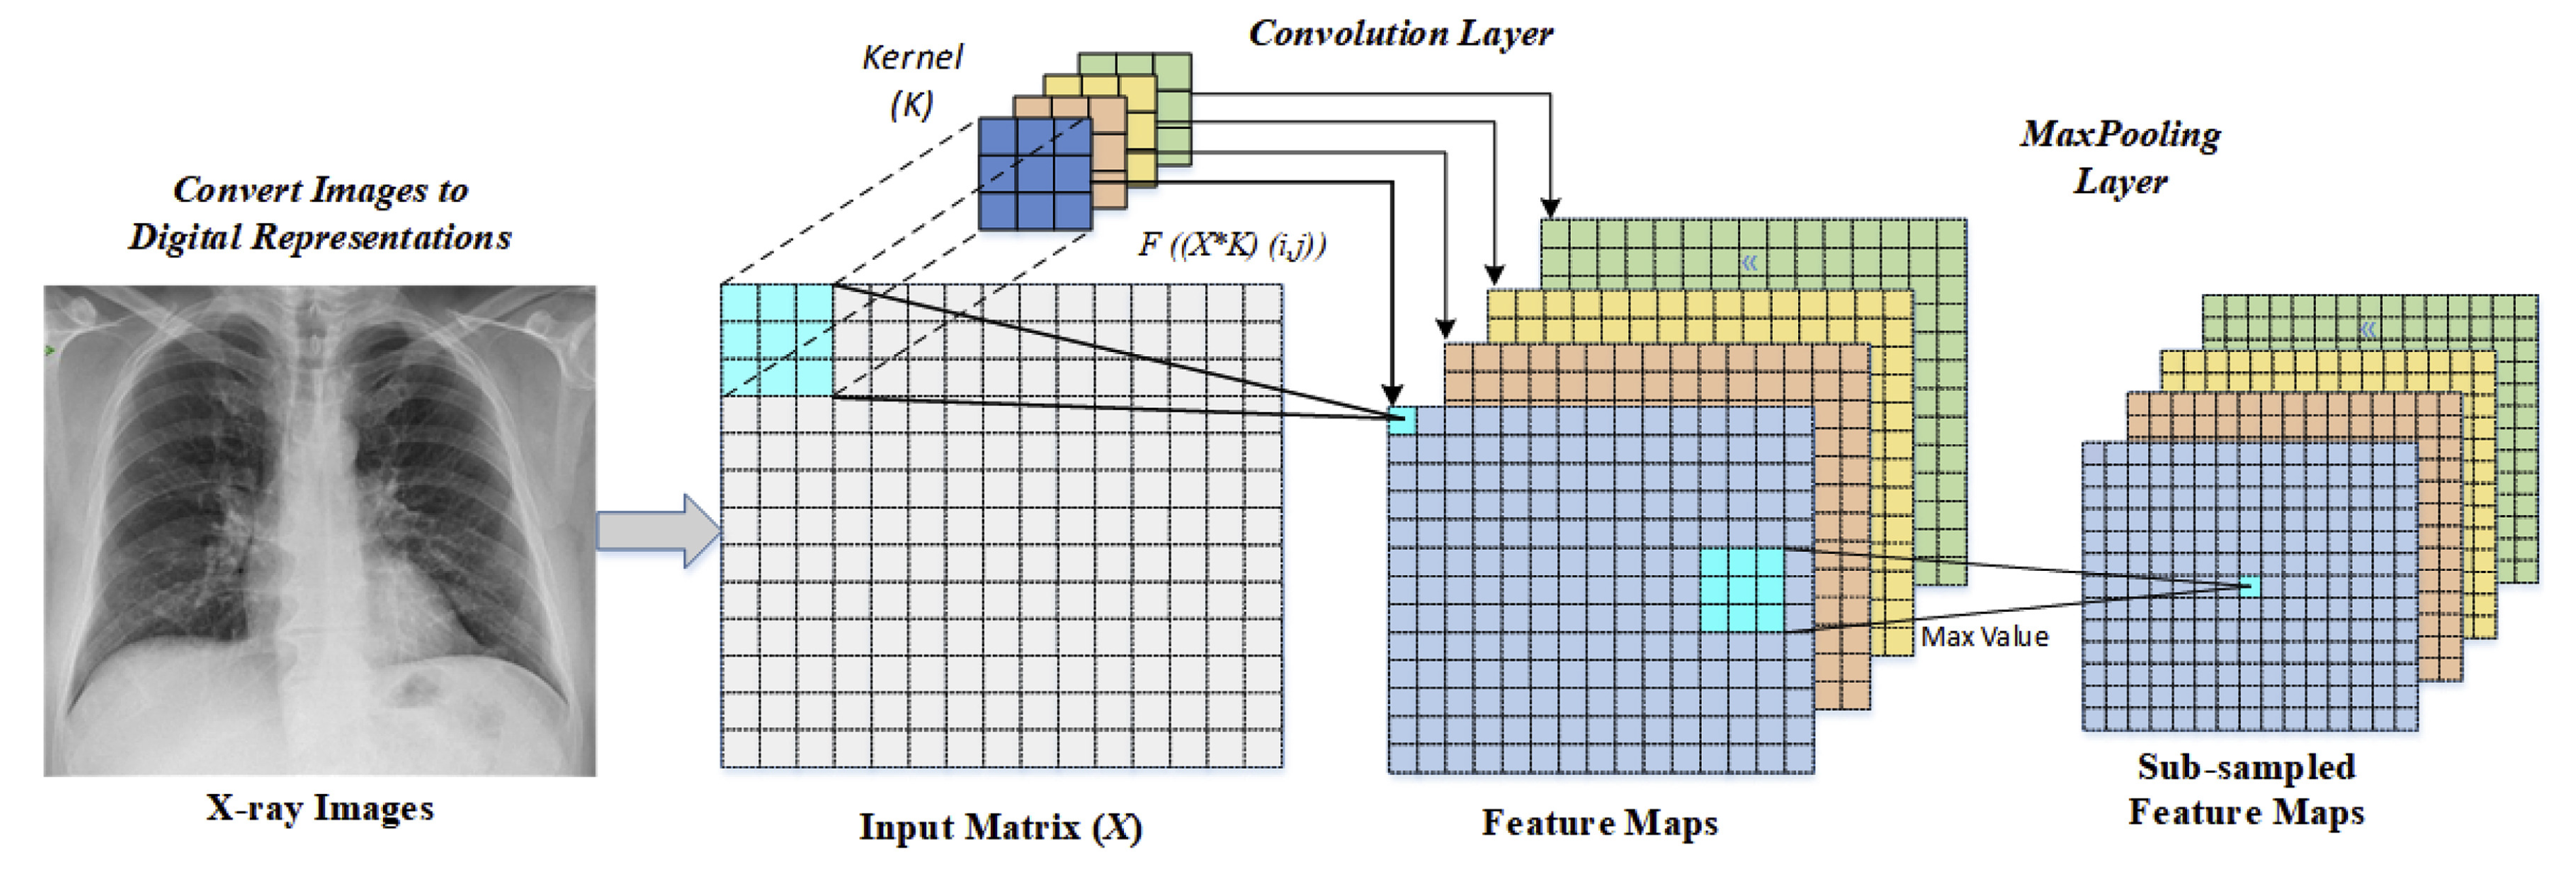
During this experiment
convolution filter with
pool size is used for feature extraction [
23]. An illustration of input images flows from the convolutional layer to the Maxpooling layer is given in
Figure 2.
As a part of parameter tuning, initially, the batch size, the number of epochs and learning rate are considered [
35]. Following parameters are randomly selected at the beginning of the experiment:
Finally, using grid search methods the optimal parameters are found as follows:
During the training phase, an optimization algorithm requires to set to optimize the model [
36]. Some of the most popular optimization algorithms includes- adaptive learning rate optimization algorithm (Adam) [
37], stochastic gradient descent (Sgd) [
38], and root means square propagation (Rmsprop) [
39]. To optimize the model, Adam is used due to its effectiveness in binary image classification [
40,
41].
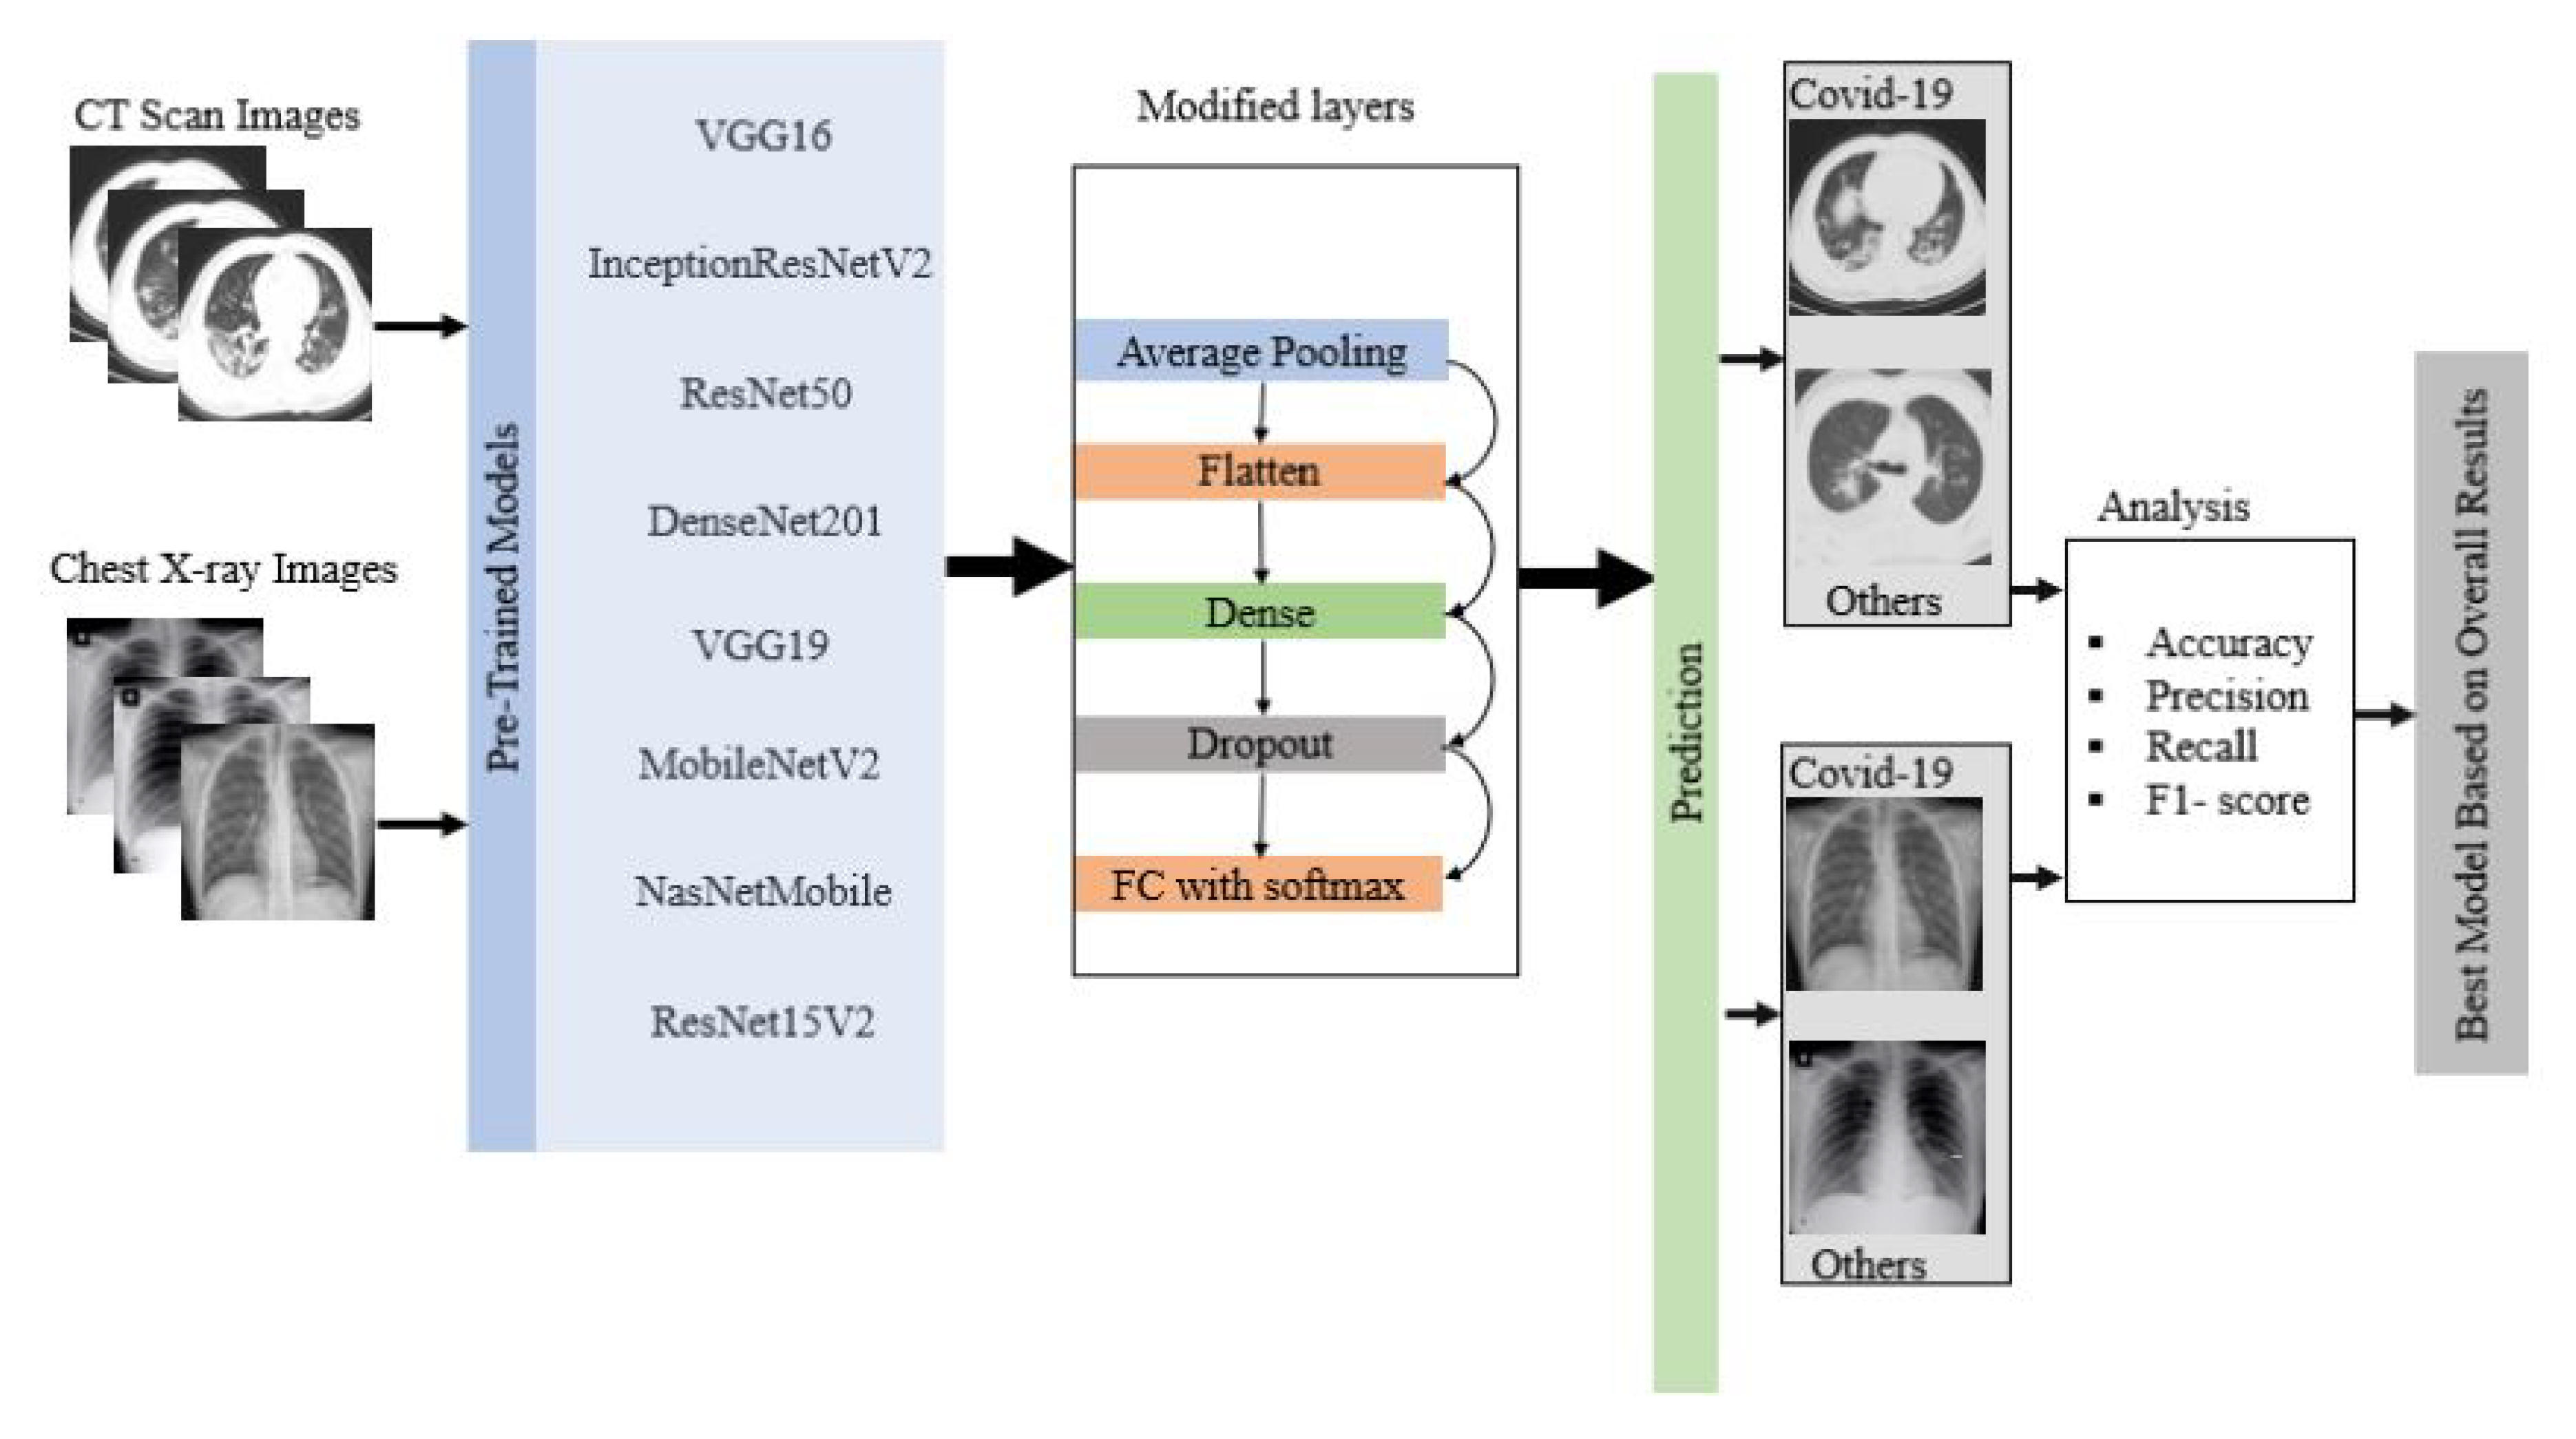
Finally, the overall result was statistically analyzed based on accuracy, precision, recall, and f1-score [
42]:
where True Positive (
)= COVID-19 patient classified as patient, False Positive (
)= Healthy people classified as patient, True Negative (
)=Healthy people classified as healthy, and False Negative (
)= COVID-19 patient classified as healthy.
Figure 3 shows the overall flow diagram of the experiment. The best model was selected based on the statistical analysis on CT scan and chest X-ray image datasets.
4. Discussion
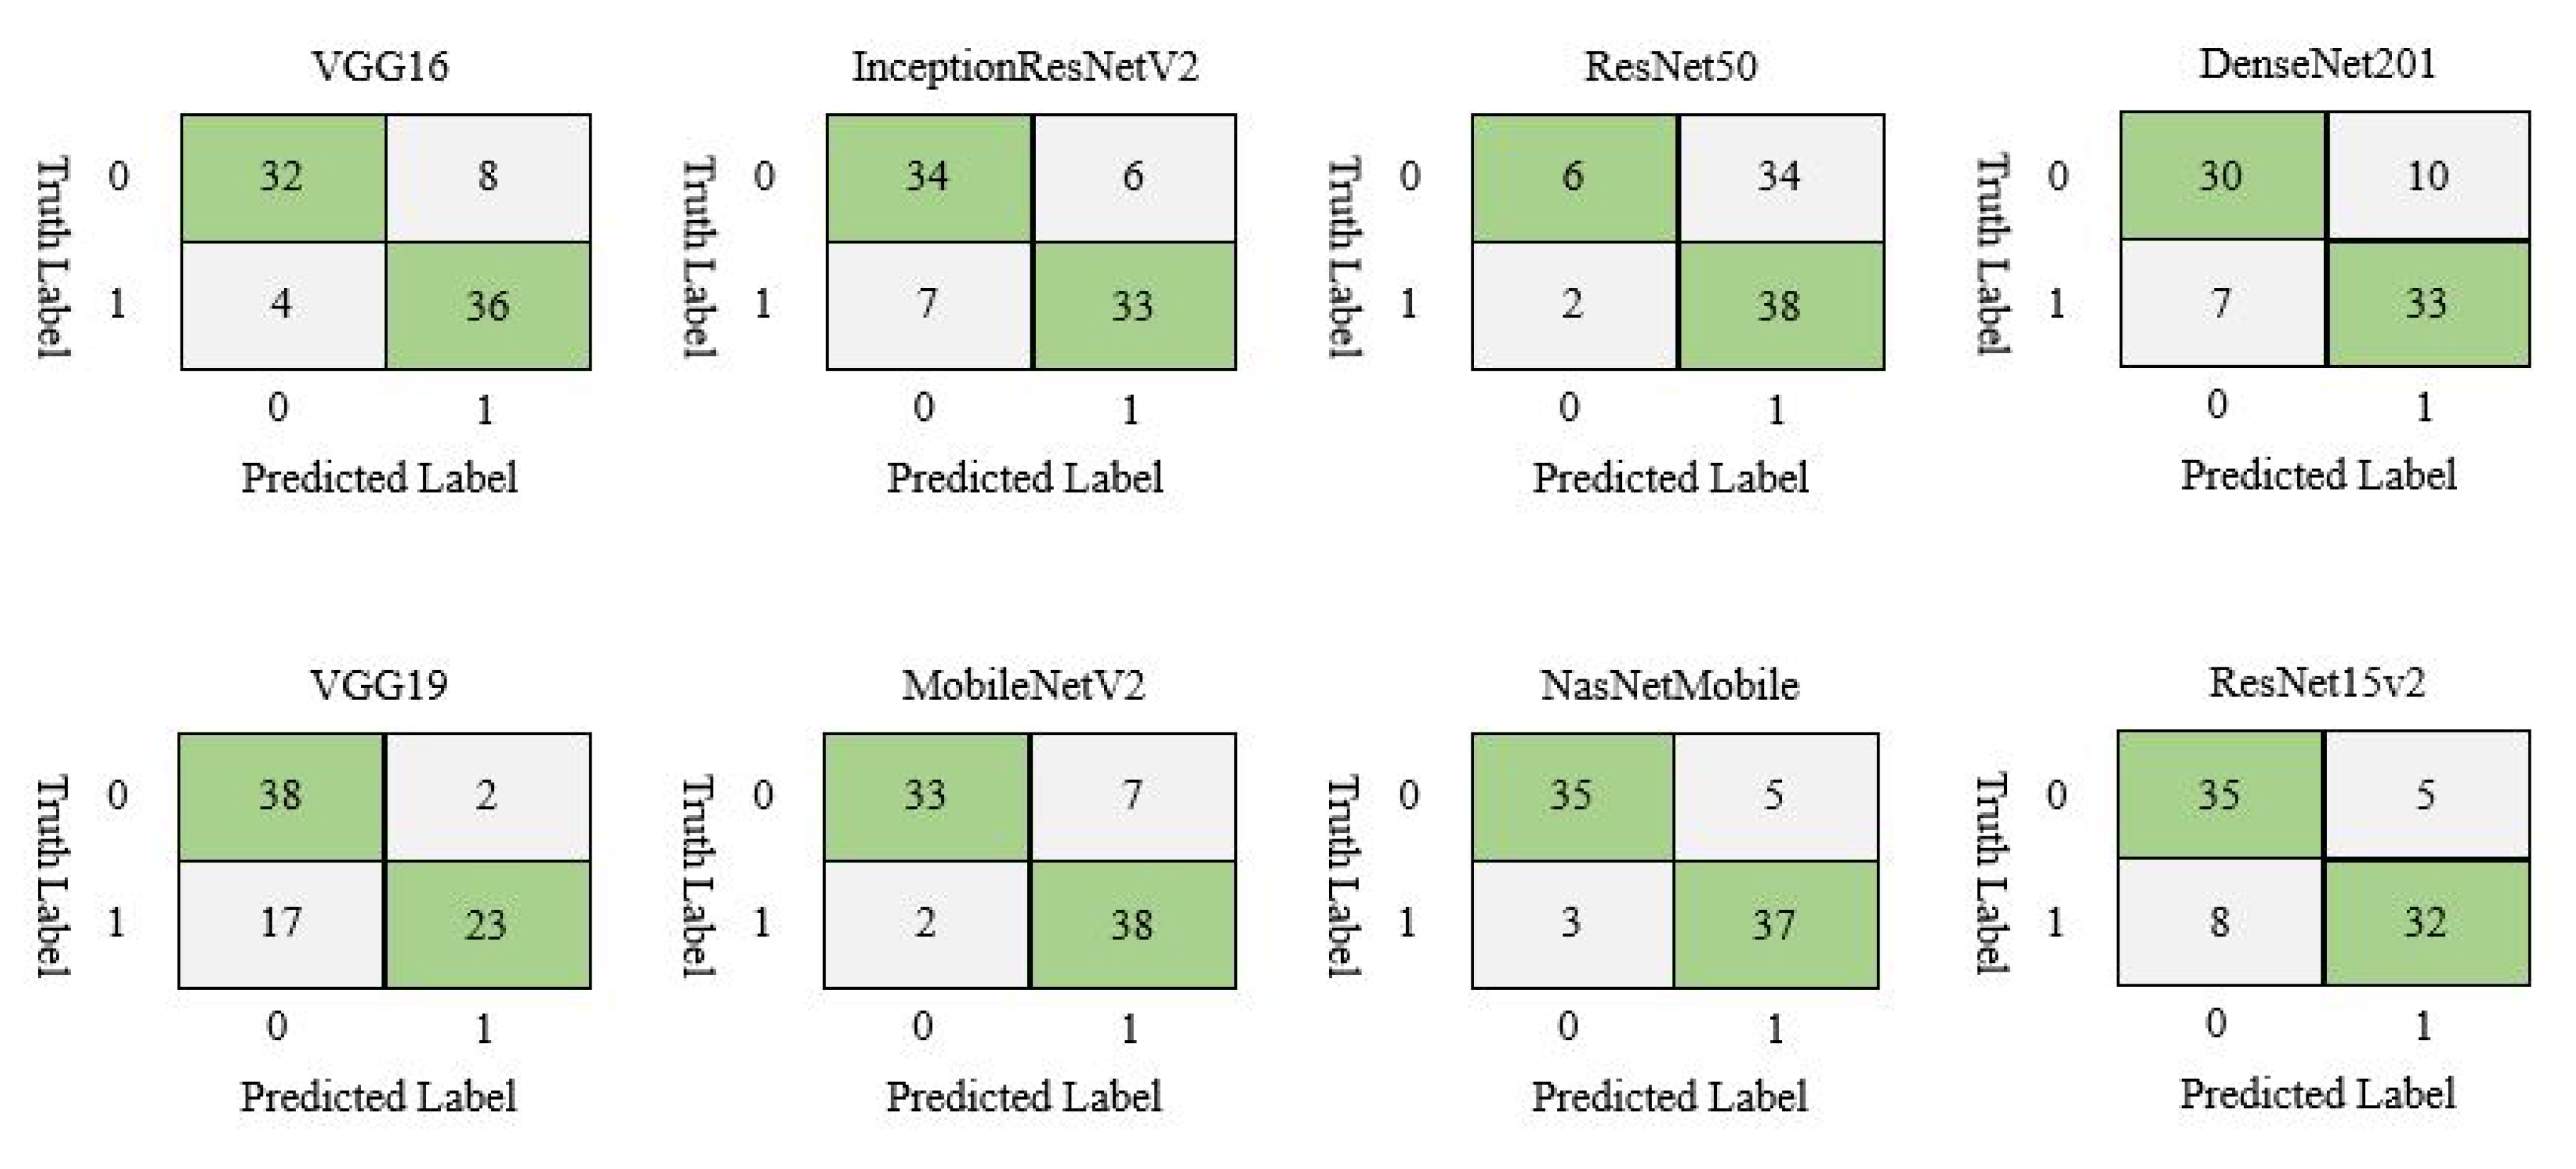
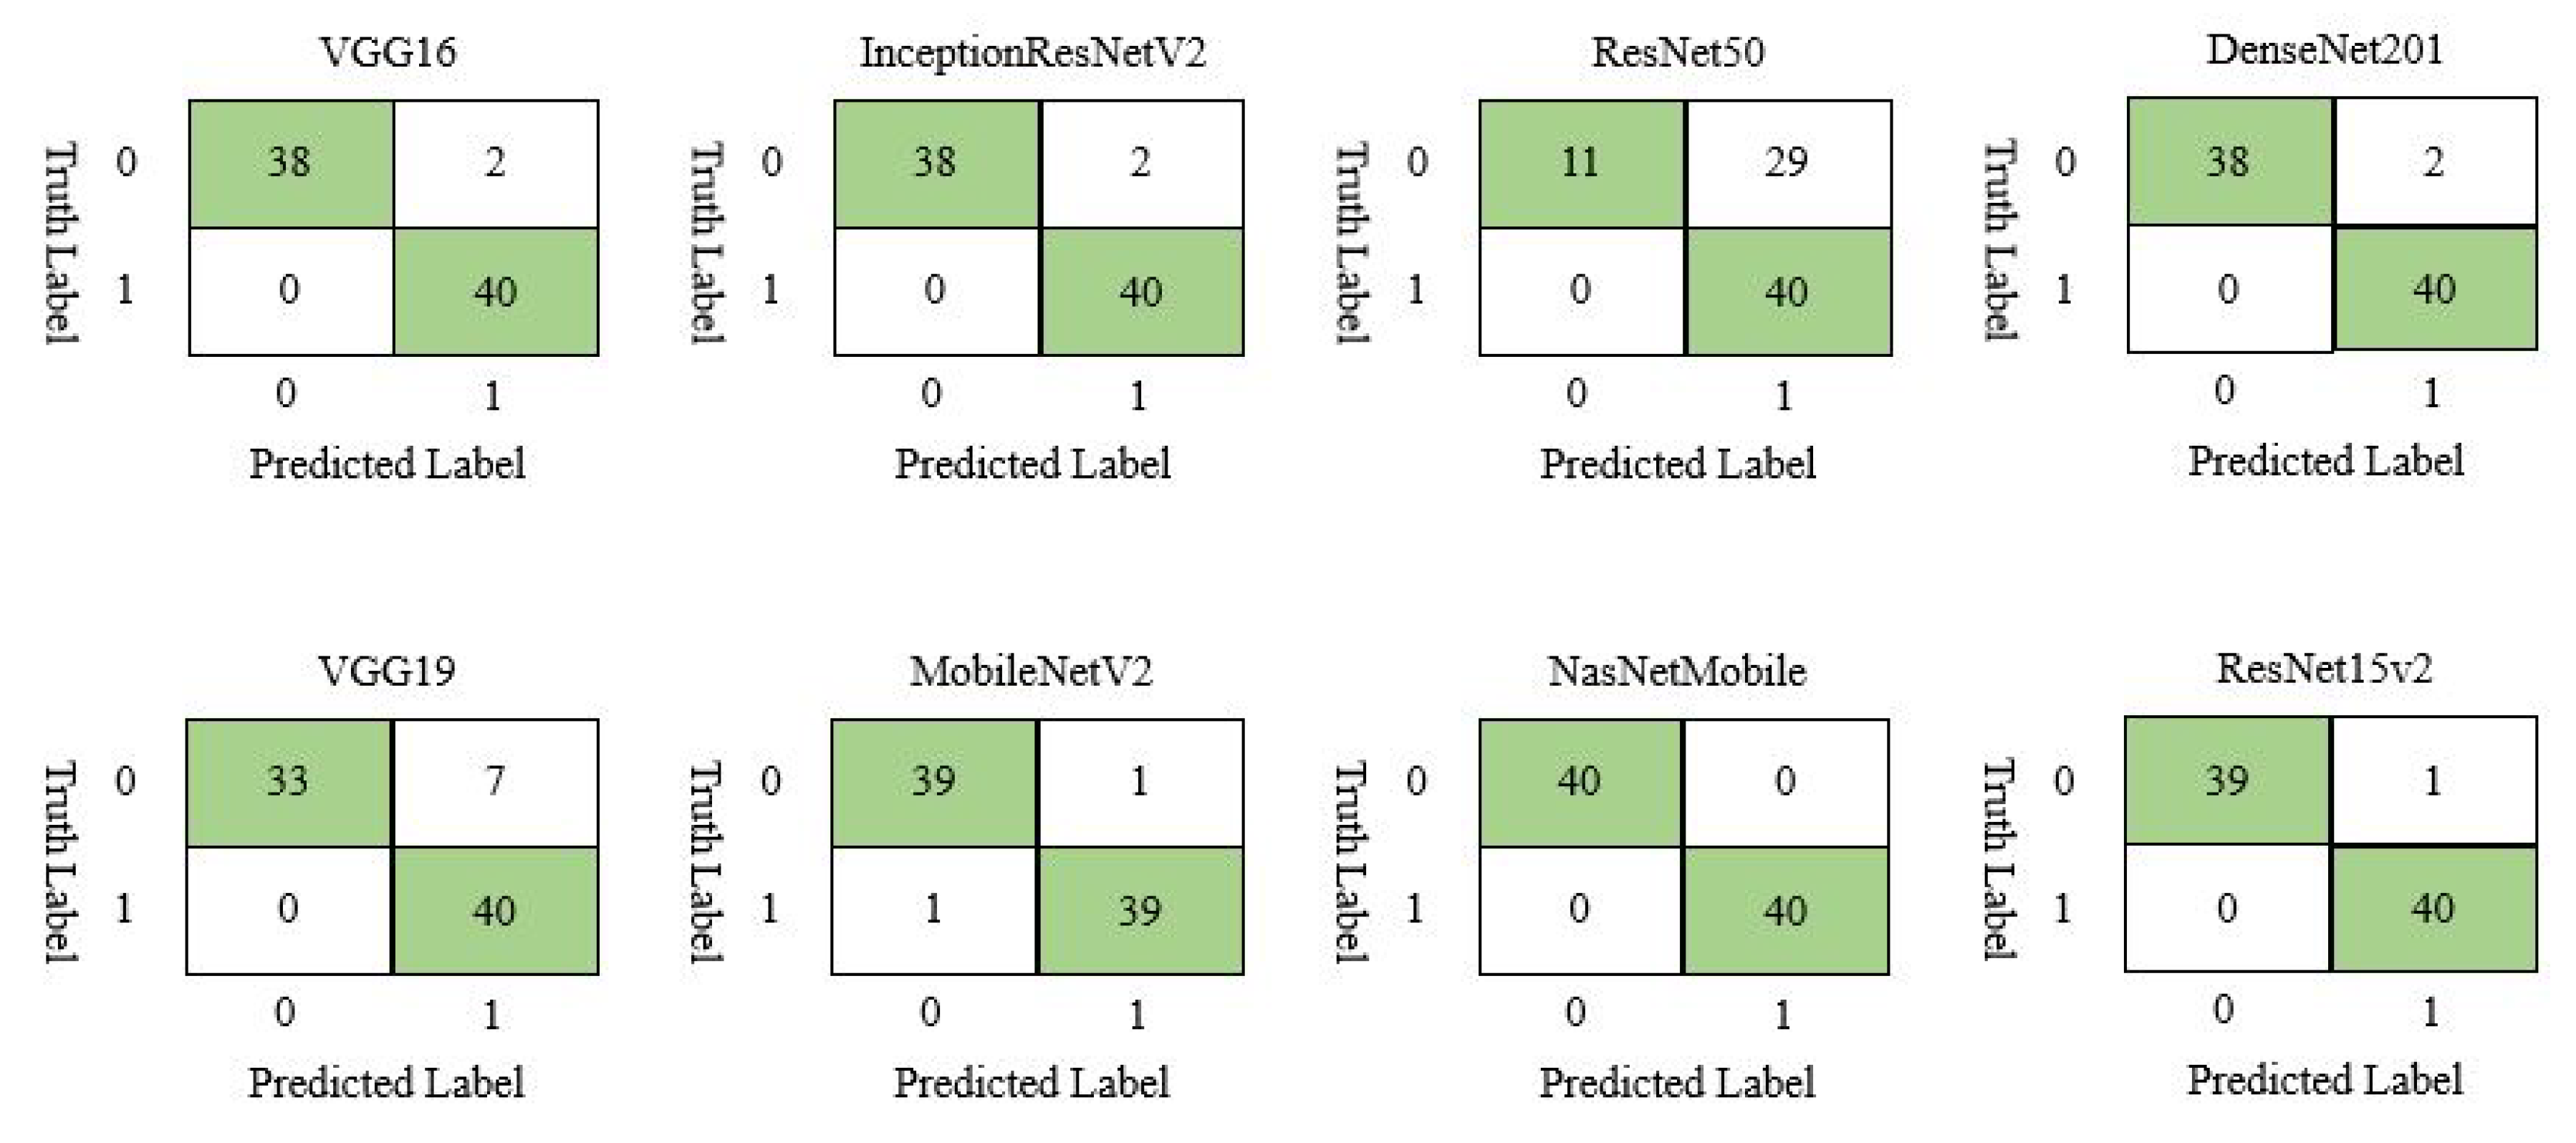
MobileNetV2 and NasNetMobile outperformed all other models in terms of accuracy, precision, recall, and f1-score on train set and test set, respectively as shown in
Table 7. Additionally, the misclassification difference between MobileNetV2 and NasNetMobile is just one which indicates that both models almost equally performed on the CT scan image dataset.
Similarly, on chest X-ray data set,
Table 8 showed that NasNetMobile outperformed all of the models taking into account the statistical measurement as such accuracy (100%), precision (100%), recall (100%), f1-score (100%), confusing matrix (100%), and loss calculation.
To find out the best model among MobileNetV2 and NasNetMobile, a comparison was made between those two models. The models’ performance was calculated by averaging the overall performance both on the train and test set. From
Table 9, MobileNetV2 outperformed NasNetMobile in terms of accuracy, precision, recall, and f1-score. However, misclassification rate for MobileNetV2 (11.25%) is slightly higher than NasNetMobile (10%). Since the dataset is small, the error rate may not be significant, yet, for a larger dataset, the misclassification rate may significantly impact.
Average accuracy was calculated by averaging the training and testing accuracy of all the models.
Table 10 shows the average accuracy for CT scan and chest X-ray image dataset. Results show that almost all models performed better on the X-ray image data set compared to the CT scan. The average accuracy for all the models on CT scan and X-ray image dataset is 82.94% and 93.94%, respectively.
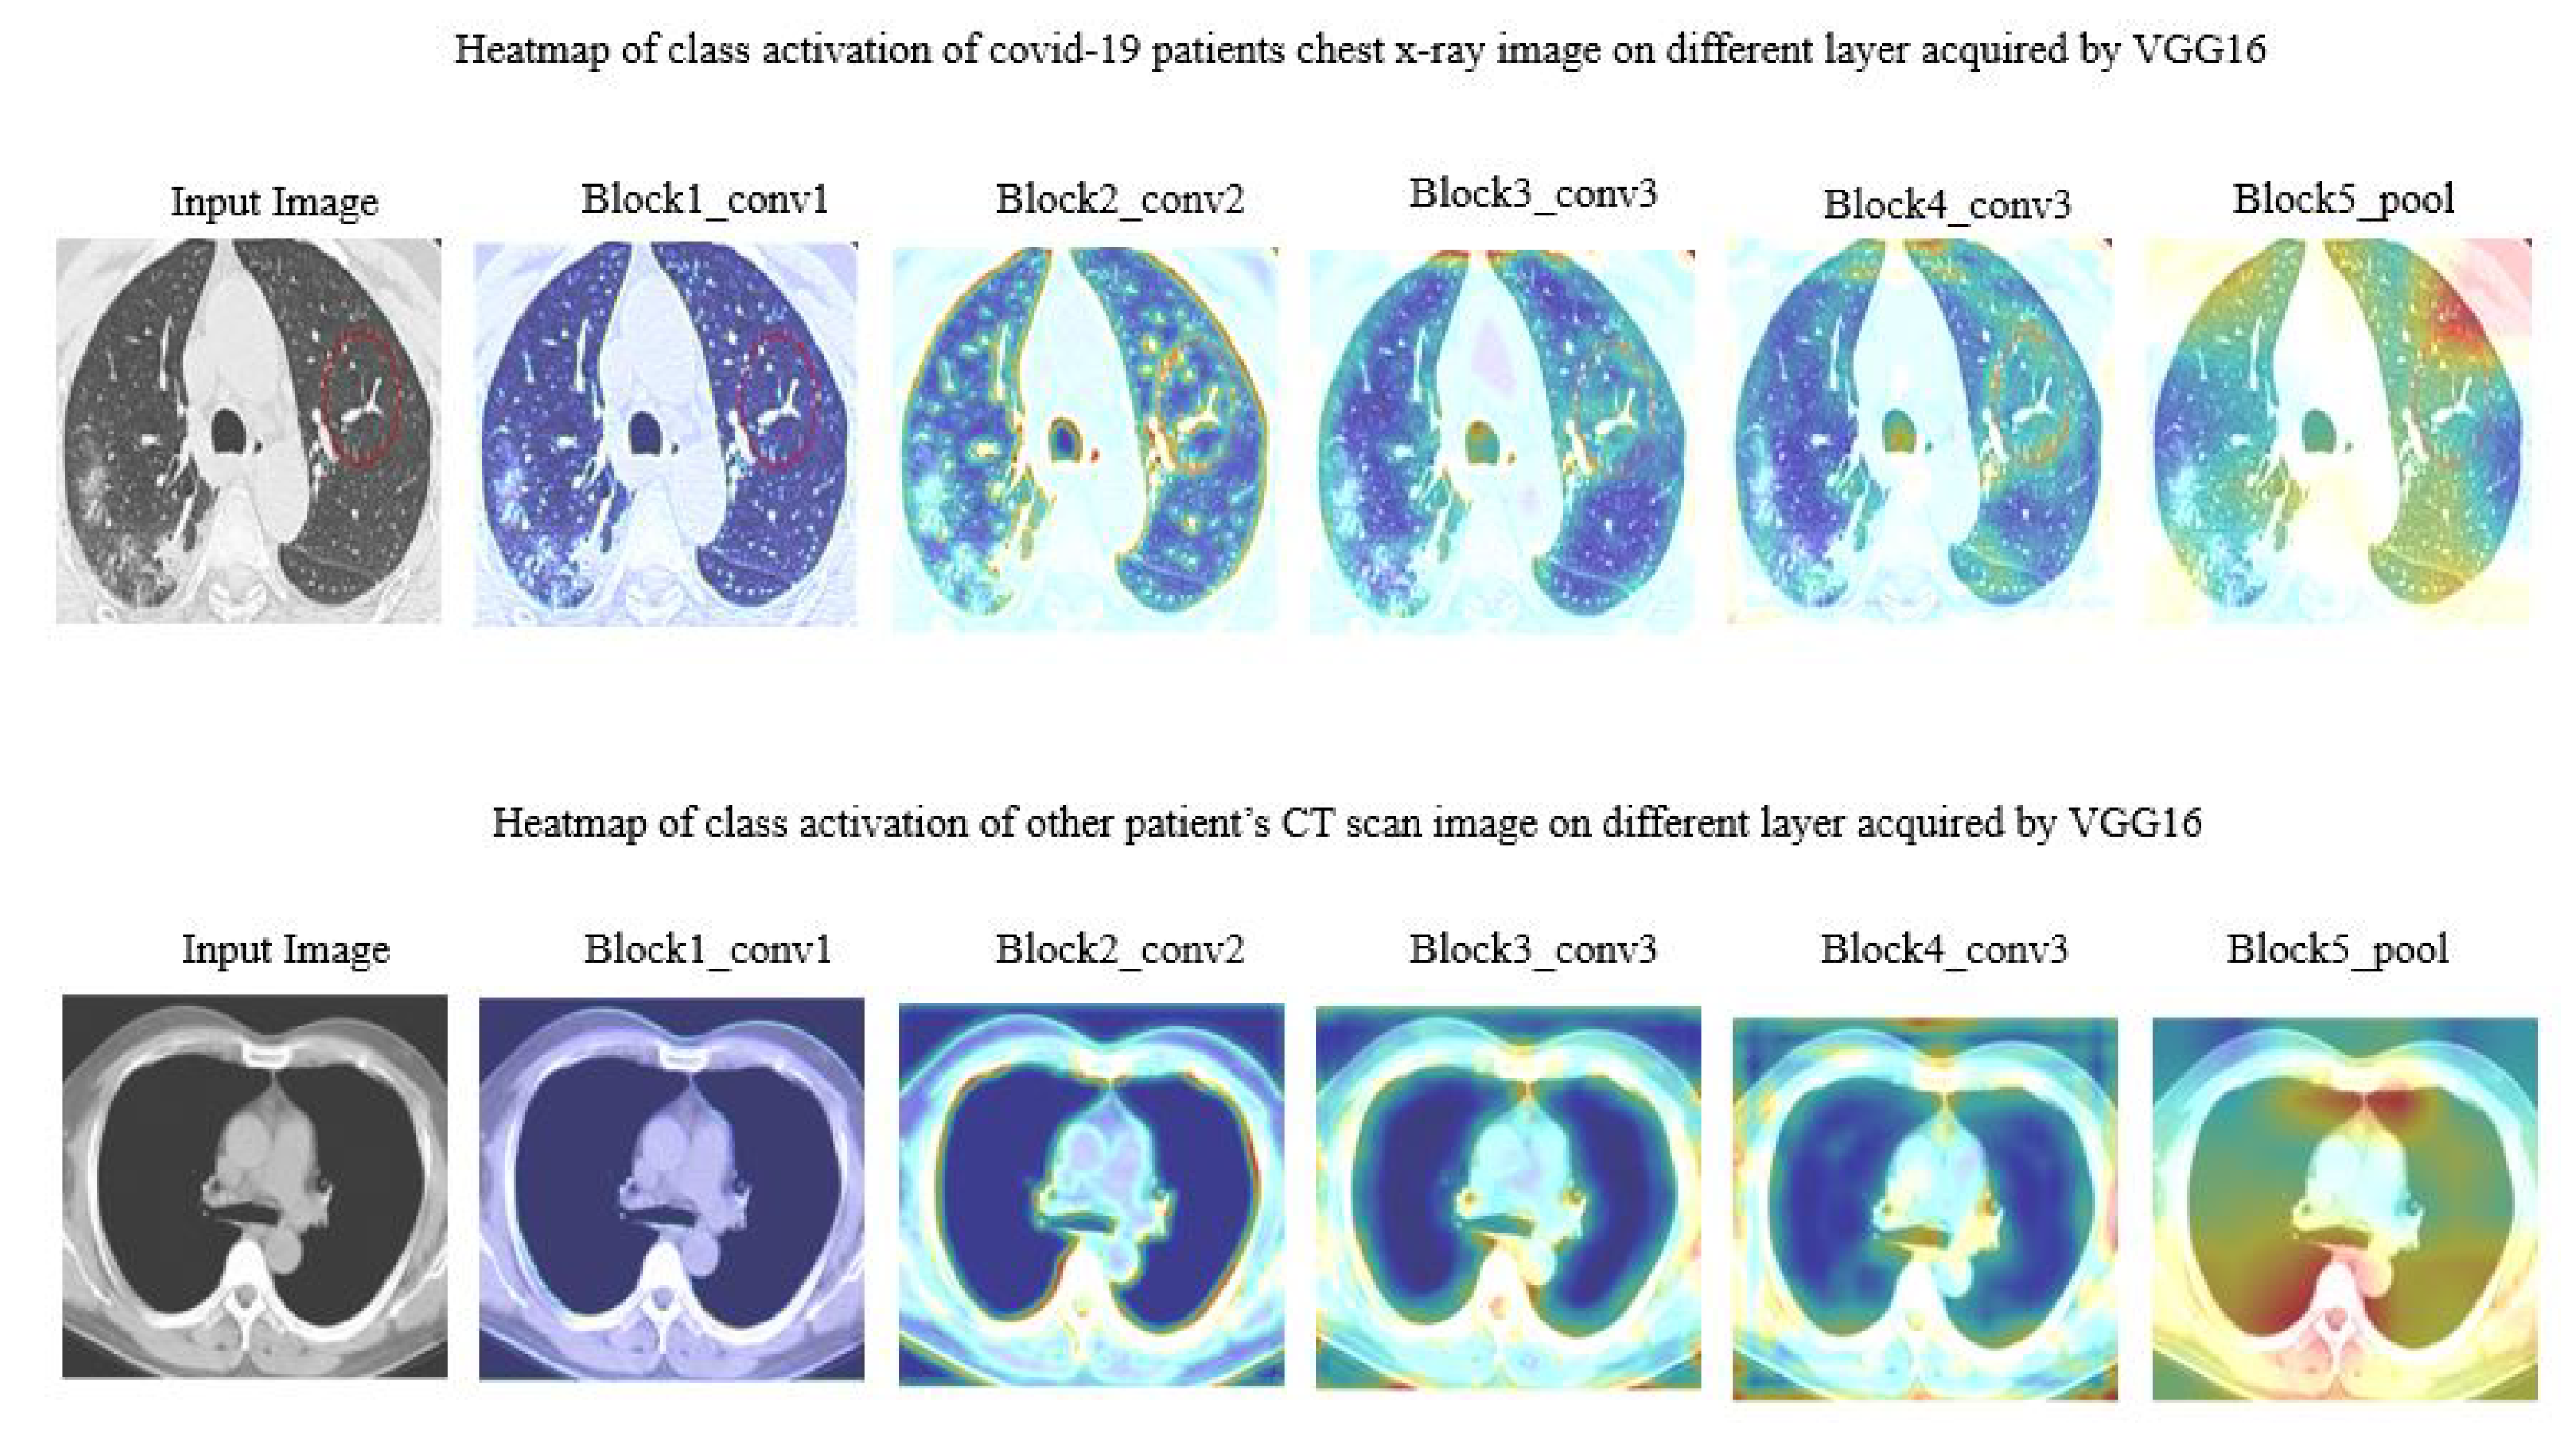
4.1. Feature Territory Highlighted by the Model on Different Layer
In this work, we tried to understand how each layer dealt with the actual image.
Figure 6 demonstrated CT scan images during different layers. Note that, just a few of the layers from VGG16 were addressed here.
Figure 7 manifested the different layer’s activity of model ResNet50 on chest X-ray images. The region spotted by model ResNet50 was highlighted with a heatmap.
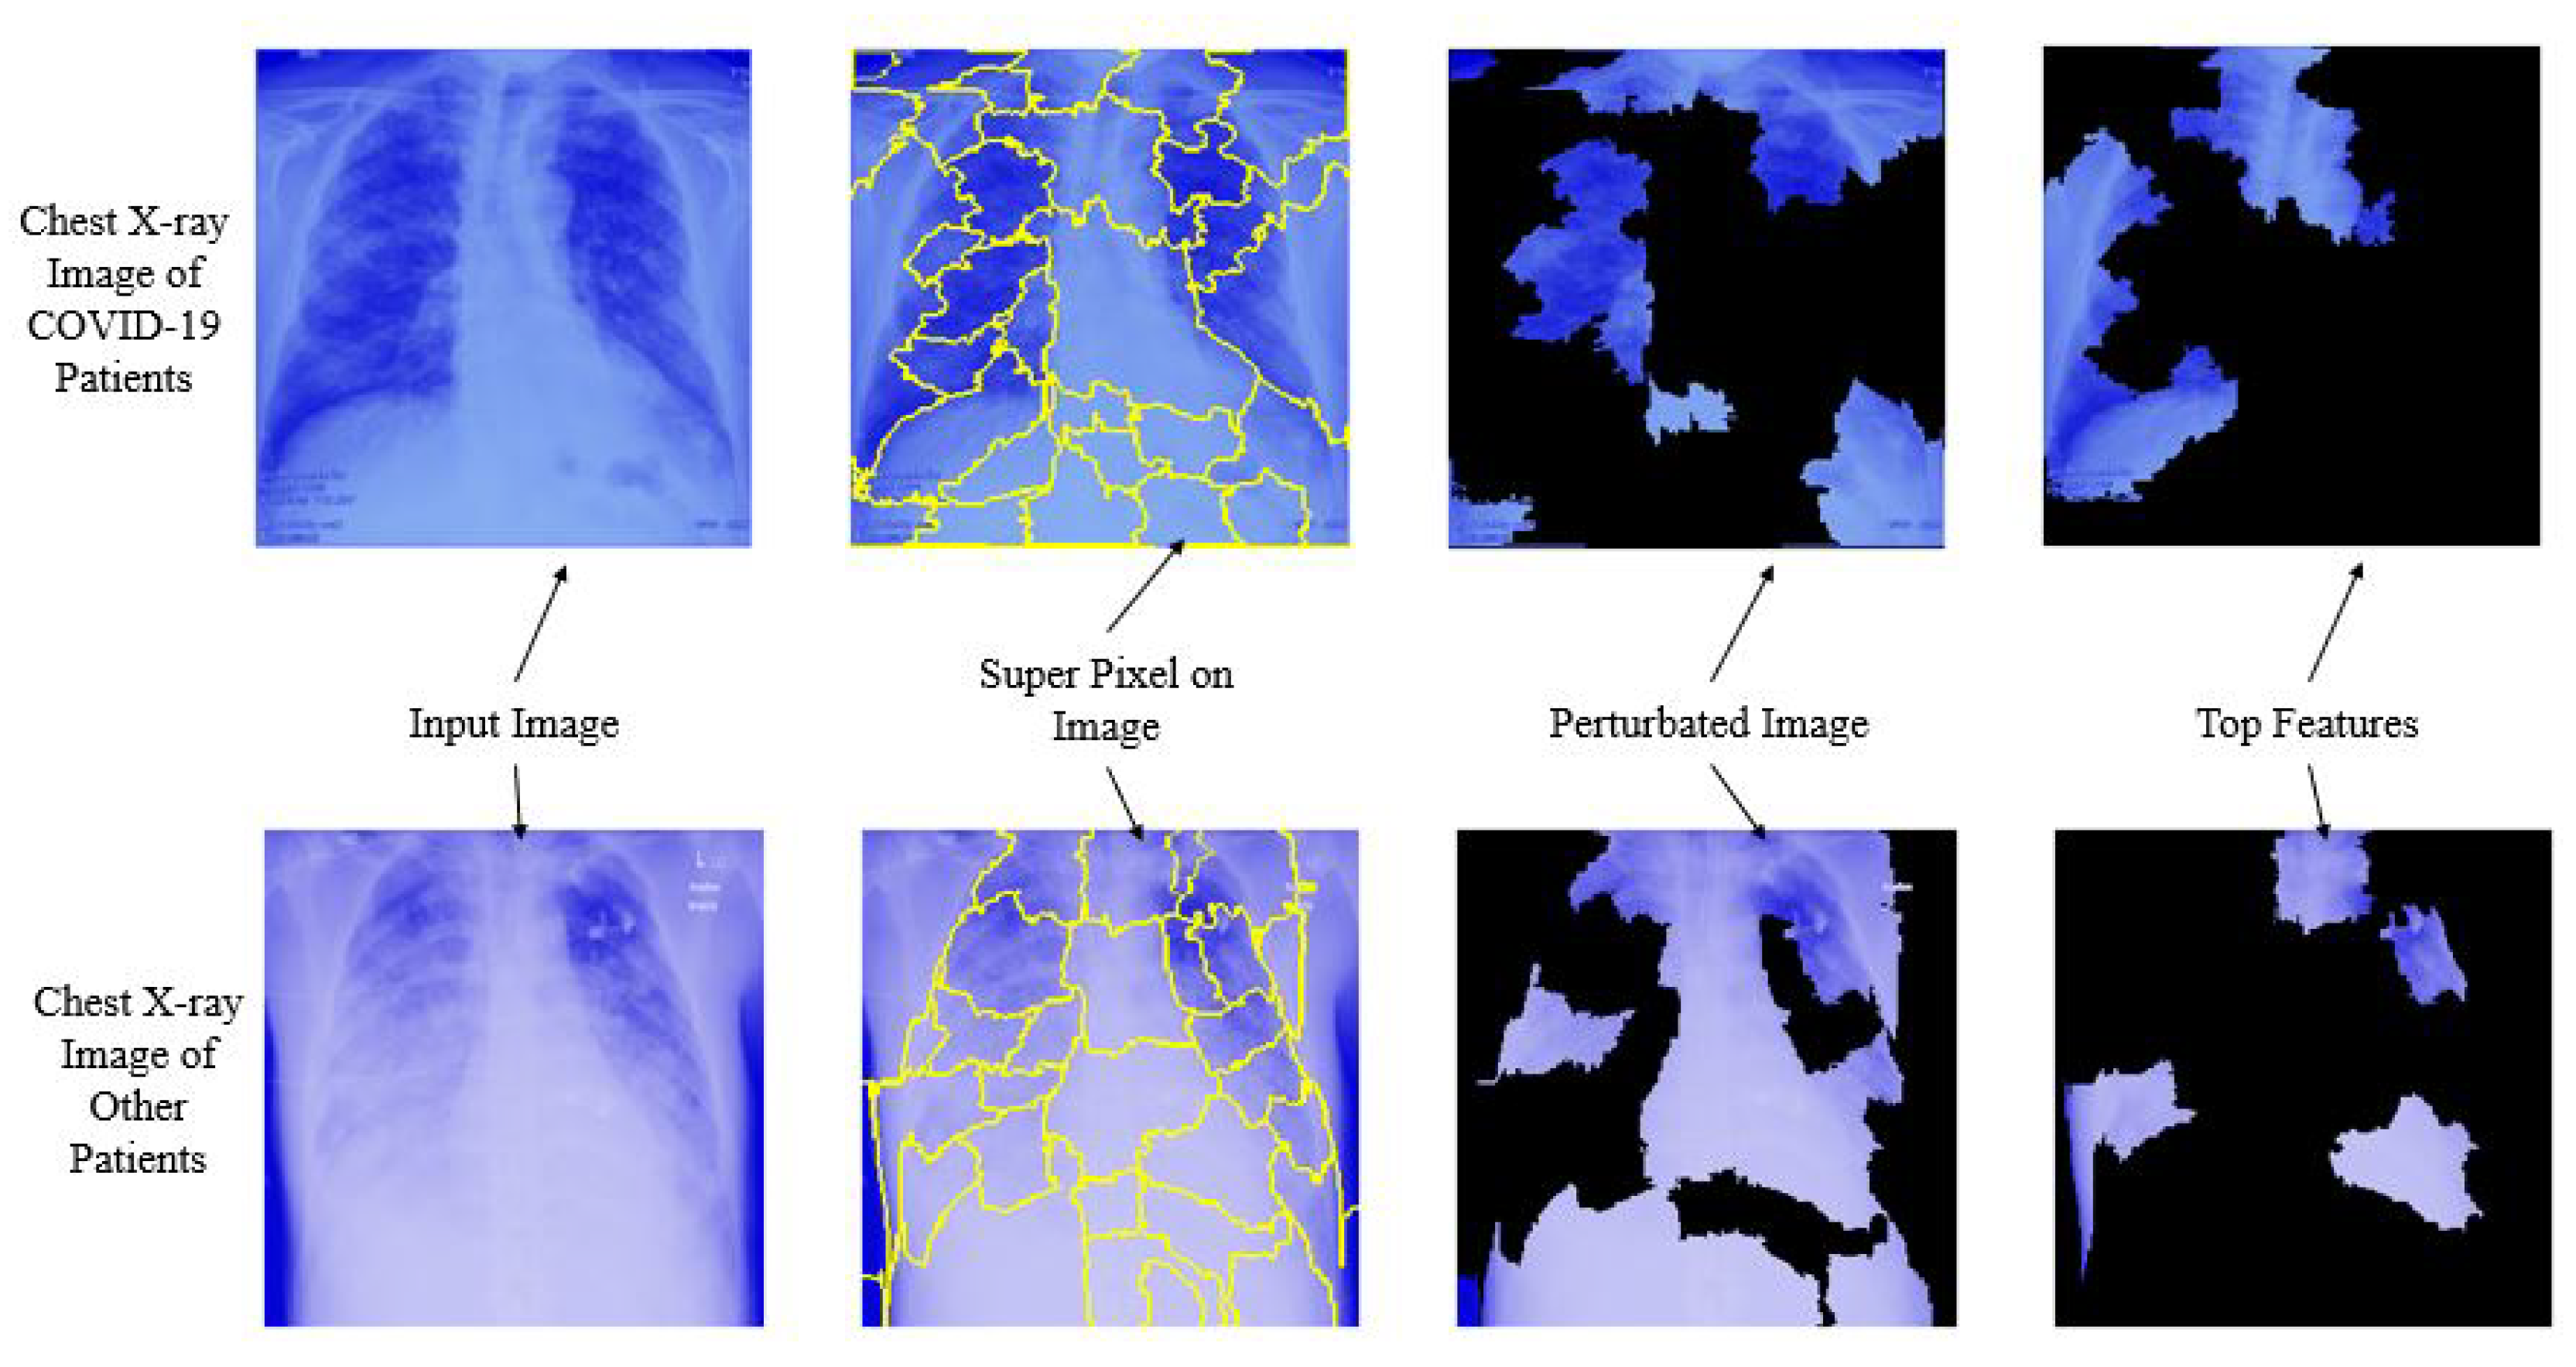
4.2. Models Interpretability with LIME
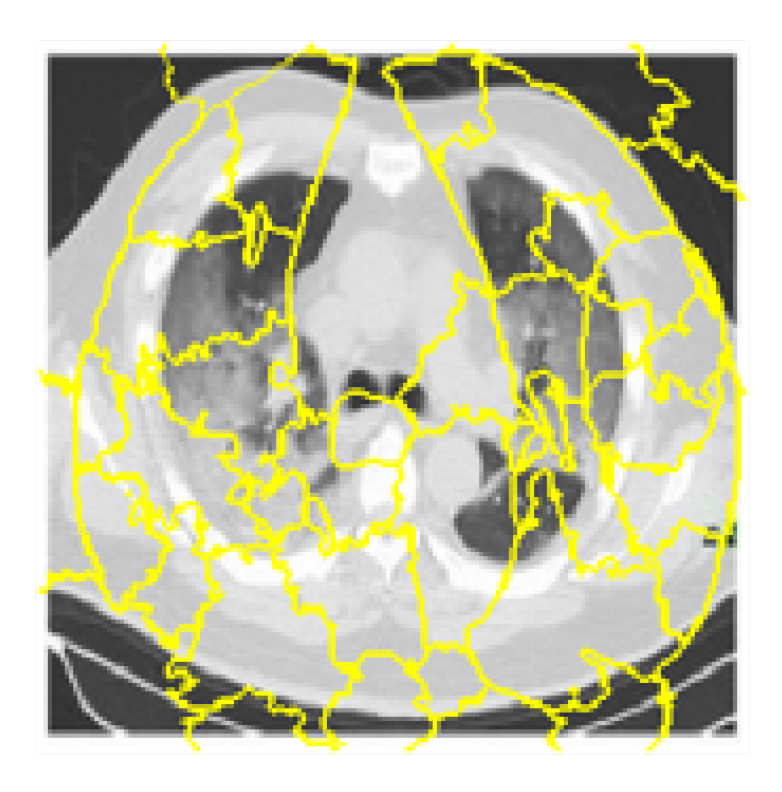
To identify which specific features help the deep learning model (MobileNetV2, NasNetMobile) to differentiate between COVID-19 and non-COVID-19 patients, Local Interpretable Model-agnostic Explanations (LIME) was used. LIME is a procedure that helps to understand how the input features of a deep learning model affect its predictions. For example, for image classification, LIME finds the set of super-pixels with the most grounded relationship with a prediction label [
46]. LIME makes clarifications by creating another dataset of random perturbations (with their separate forecasts) around the occasion being clarified and afterward fitting a weighted neighborhood proxy model. This neighborhood model is usually a more straightforward model with natural interpretability, such as a linear regression model. LIME creates perturbations by turning on and off a portion of the super-pixels in the image. A quick shift strategy was utilized with the following parameters in order to calculate the super pixel, as shown in
Table 11:
Figure 8 is the output after computing the super-pixels on a sample chest CT scan image.
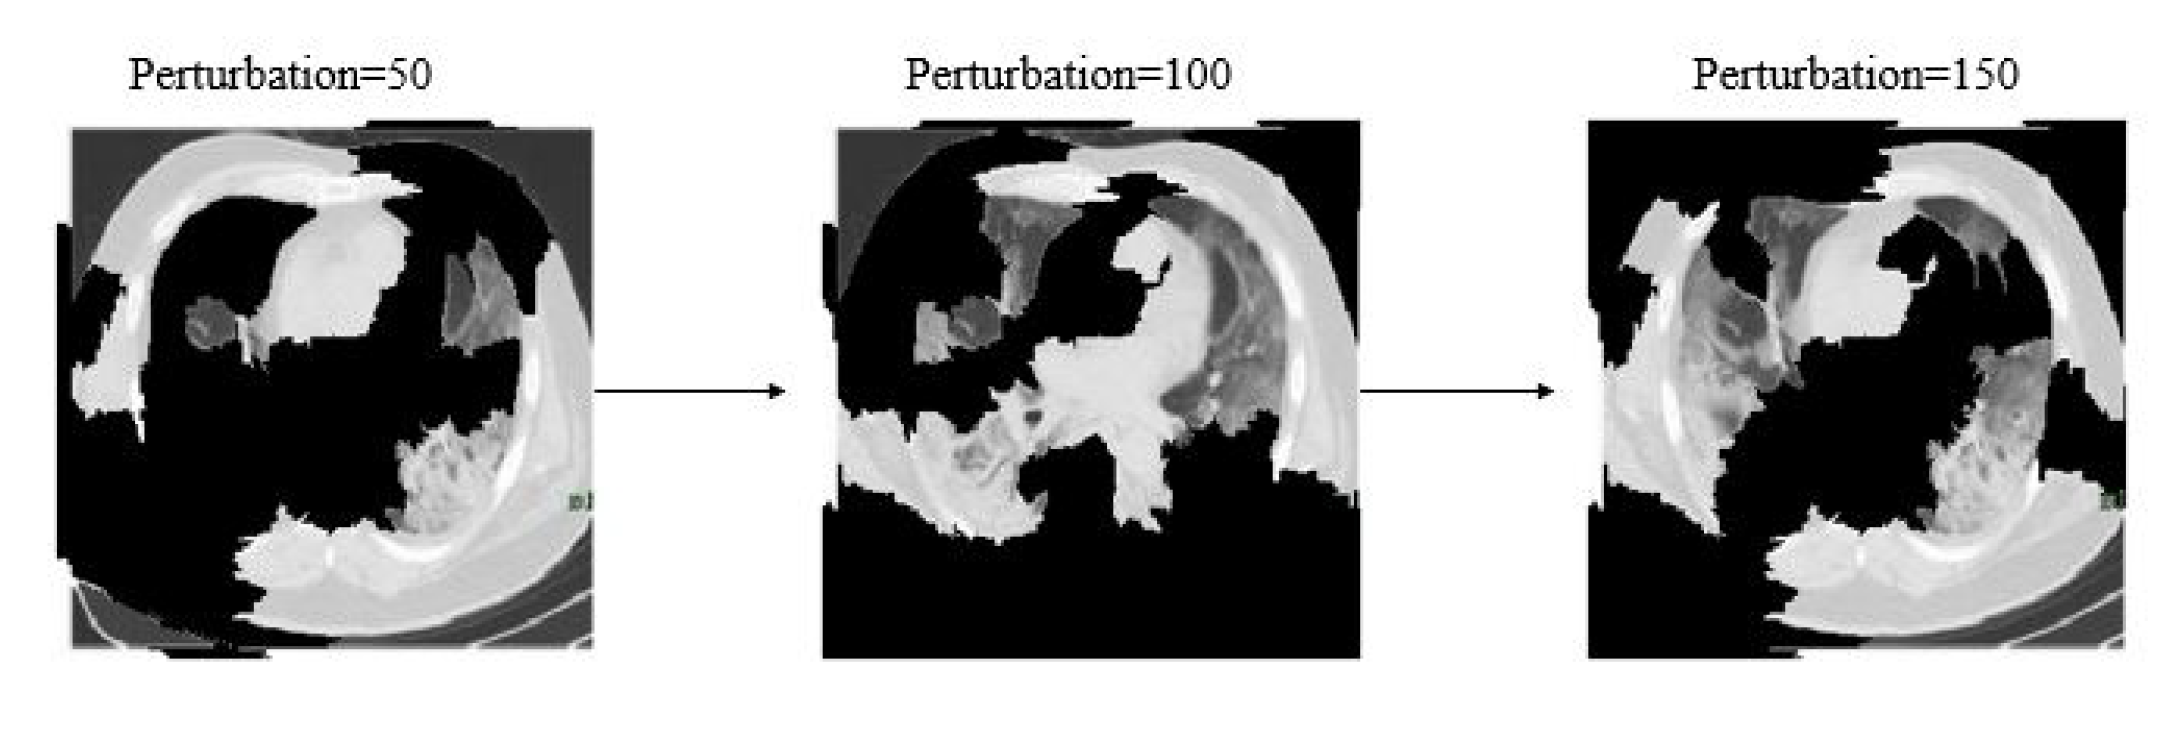
Additionally,
Figure 9 shows different image conditions considering perturbation vectors and perturbed images. To predict the class, during this experiment 150 perturbations were used.
The distance metric was utilized to assess how far each perturbation is from the original image. Cosine metrics were used with kernel width as 1/4 to measure the original image’s distance and perturbed images. A weighted linear model was used to explain the overall model. A coefficient was found for every superpixel in the picture that represents how solid the superpixels impact in the prediction of COVID-19 patients. Finally, top features were sorted in order to determine what are the most important superpixel. Here,
Figure 10 demonstrates the top four critical features.
Here
Figure 11, depicts the overall interpretability for image classification with LIME on chest X-ray images considering each step. The prediction was conducted using NasNetMobile.
In brief, based on the overall experiment, this study found that, among all eight deep learning models, MobileNetv2 and NasNetMobile performed better both on CT scan and chest X-ray image datasets. Additionally, all deep learning models performed well on the chest X-ray image dataset compared to CT scan images with an average 8% higher accuracy. This research addressed that existing deep learning approaches could be used along with RT-PCR testing as an alternative approach for detecting COVID-19 patients on a mixed datasets. The study results also revealed that, NasNetMobile can be used to identify COVID-19 patients both CT scan and chest X-ray images. Additionally, the proposed models detect the top features along with the predictions, which might assist the general practitioners to understand about the virus and the infectious regions.

 ,
, 


