1. Introduction
The assignment of wildland fire suppression resources is one of the primary tasks of the fire management agencies responsible for controlling fire spread and mitigating fire risks [
1]. Our current understanding of suppression resource use during fire events may still be limited, including how resources interact together and whether they can work synergistically [
2]. Some past studies show that both ground and aerial resources may be assigned to a fire to accomplish multiple tasks such as fireline production, mop-up, preparation for burnout operations, or point protection [
3]. Suppression resource ordering and assignments follow certain patterns and identifying those patterns could help improve our understanding of suppression resource demands, collaborations, and effectiveness. For example, ref. [
4,
5] suggest that suppression resources allocation, assignment, and interaction could be influenced by factors such as values to be protected, fire growth potential, and landscape conditions. Managers often use weather forecasts to predict fire growth and order resources accordingly [
6]. In a study of aerial resource uses, ref. [
7] suggested that large airtankers generally follow guidelines for operational speed and altitude, but their uses are not always effective with respect to fire response phase, terrain, fuels, and time of day. Meanwhile, ref. [
8] demonstrated that suppression resource use may vary between incident management teams, e.g., 17 out of the 89 teams in the US exhibit significantly higher resources demands than the median level of all teams. Those discoveries provide the base for us to continuously study fire suppression resource ordering and assignment in the US, and potentially in other regions of the world as well.
Many machine-learning models have been implemented to study wildfire risks and managements. A complete review of those efforts is provided by [
9]. Here are a few examples. Ref. [
10] compared the performances of an artificial neural network model (ANN) and a support vector machine (SVM) model to predict fire occurrence in Canada based on the normalized difference vegetation index, the land surface temperature, and the thermal anomalies. Ref. [
11] compared a LogitBoost ensemble decision tree method with SVM, random forest (RF), and Kernel logistic regression models to predict forest fire susceptibility in Vietnam. Ref. [
12] developed an RF model to estimate the probability of containing fire in different locations of a landscape based on topography, distance to natural and anthropogenic barriers to fire spread, suppression difficulties at those locations, and the travel costs for suppression resources to reach those locations. Ref. [
13] developed an ANN model to estimate wildfire probability as a function of biophysical and human-related drivers in Italy. Those studies demonstrate the potential of using machine learning models to study wildfire problems.
The US National Interagency Fire Center (NIFC) divides the US into regions known as Geographic Area Coordination Centers (GACC) to support fire suppression decision-making and regional forecasting. The western contiguous USA includes seven GACCs: Southern California, Northern California, Northwest, Northern Rockies, Rocky Mountains, Great Basin, and Southwest. Due to the differences in climate, topography, and social economic conditions, ref. [
14] suggested there are many differences in fire complexity dynamics between those regions. Fire suppression resource utilization also varies between GACCs. Ref. [
15] suggest the capacity of contracted fire suppression equipment varies across the western US and is concentrated more in the northwest and northern California. Ref. [
16] found significant variation of suppression resource demands between the central/southern Rockies and California.
The US National Wildfire Coordinating Group (NWCG) fire suppression tactical guide (referred to as the “suppression guide” in this study) [
17] summarizes GACC-specific fire suppression tactics and resource use considerations, including certain similarities and distinctions between GACCs. The NWCG suppression guide are informative, but it is difficult to compare regions based only on qualitative descriptions. In this study, we implement unsupervised learning models including principle component analysis (PCA) and association rule analysis (ARA) to mine the historical daily fire suppression resources ordering and assignment data to quantitatively compare the suppression resource use patterns between selected GACCs. For simplicity, our study combines the two GACCs of California into one common GACC referred to as ‘CA’ because both the northern California and southern California GACCs share common governance structures for wildland fire suppression. CA is selected due to its long history of large and damaging fires. We also include the Rocky Mountain GACC (RMC) and the Southwest GACC (SWC) into analyses. According to [
17], all three GACCs have diversified topography, fuel types, and weather conditions that support different fire behaviors. SWC may have the least favorable road access conditions comparing with the other two GACCs, while CA may have the best road system to support equipment and crew transportation. CA may also have the highest levels of engine, hand crew, dozer, and aircraft availability. Our analysis also compares resource use under different preparedness levels (PLs) [
18].
Discoveries from our study could help fire managers and policymakers better understand the suppression resource ordering, assignment, and collaborations for different regions. Results may help national or regional resource dispatching authorities to predict demands for suppression resources and inform agency and interagency resource acquisition and allocation strategies. Discoveries through the unsupervised learning methods also help us identify and prioritize future research directions to explore regional suppression resource needs and potential limitations as well as improve the efficiency of resource allocation and collaboration.
3. Results
3.1. PCA for General Resoruce Ordering and Assignment
PCA allows us to reduce the dimension of ROSS data to visualize the suppression resource orders and assignments. Our testing shows that PC 1 can explain 61.3% of the total variance of the original ROSS data; PC 2 explains an additional 22.1% of the total variance; and PC 3 explains an additional 7.4% of the total variance. Adding more components into PCA would explain more of the variance, but visualizing data in a high-dimensional space is usually challenging.
Figure 3 shows four 2D scatter plots based on the PC 1 and PC 2 calculated from the daily resource ordering and assignment data. Both the resource ordering and resource assignment scatter plots show that more points stretch toward the right end of the
x-axis (denoting PC 1) at the higher PLs. Since PC 1 explains 61.3% of the variance, this pattern reveals that more resources were likely ordered and subsequently assigned to each fire in each fire day at higher PLs in all GACCs (
Figure 3).
Comparing daily resource ordering and daily resource assignments also shows that CA in general tends to order and assign more resources to each fire in each fire day than the other two GACCs, especially at higher PLs. This is consistent with the discoveries from previous studies e.g., [
8]. The SWC has the lowest daily resource ordering amount and maintains the lowest daily resource assignment level at lower PLs. However, at higher PLs, both RMC and SWC show similar daily resource ordering and assignment patterns based on PC 1 and PC 2 (
Figure 3). This suggests that SWC might have sent fewer resources to a fire in each day than both RMC and CA when the fire danger and the resource scarcity levels are both low (represented by lower PLs); on the other hand, CA seems to be much more risk averse and tends to order/assign more resources to a fire than the other two GACCs in each day.
3.2. Resource Ordering Rule Supports
Calculating and displaying association rule support in a “heatmap” (using the
seaborn library [
33] for
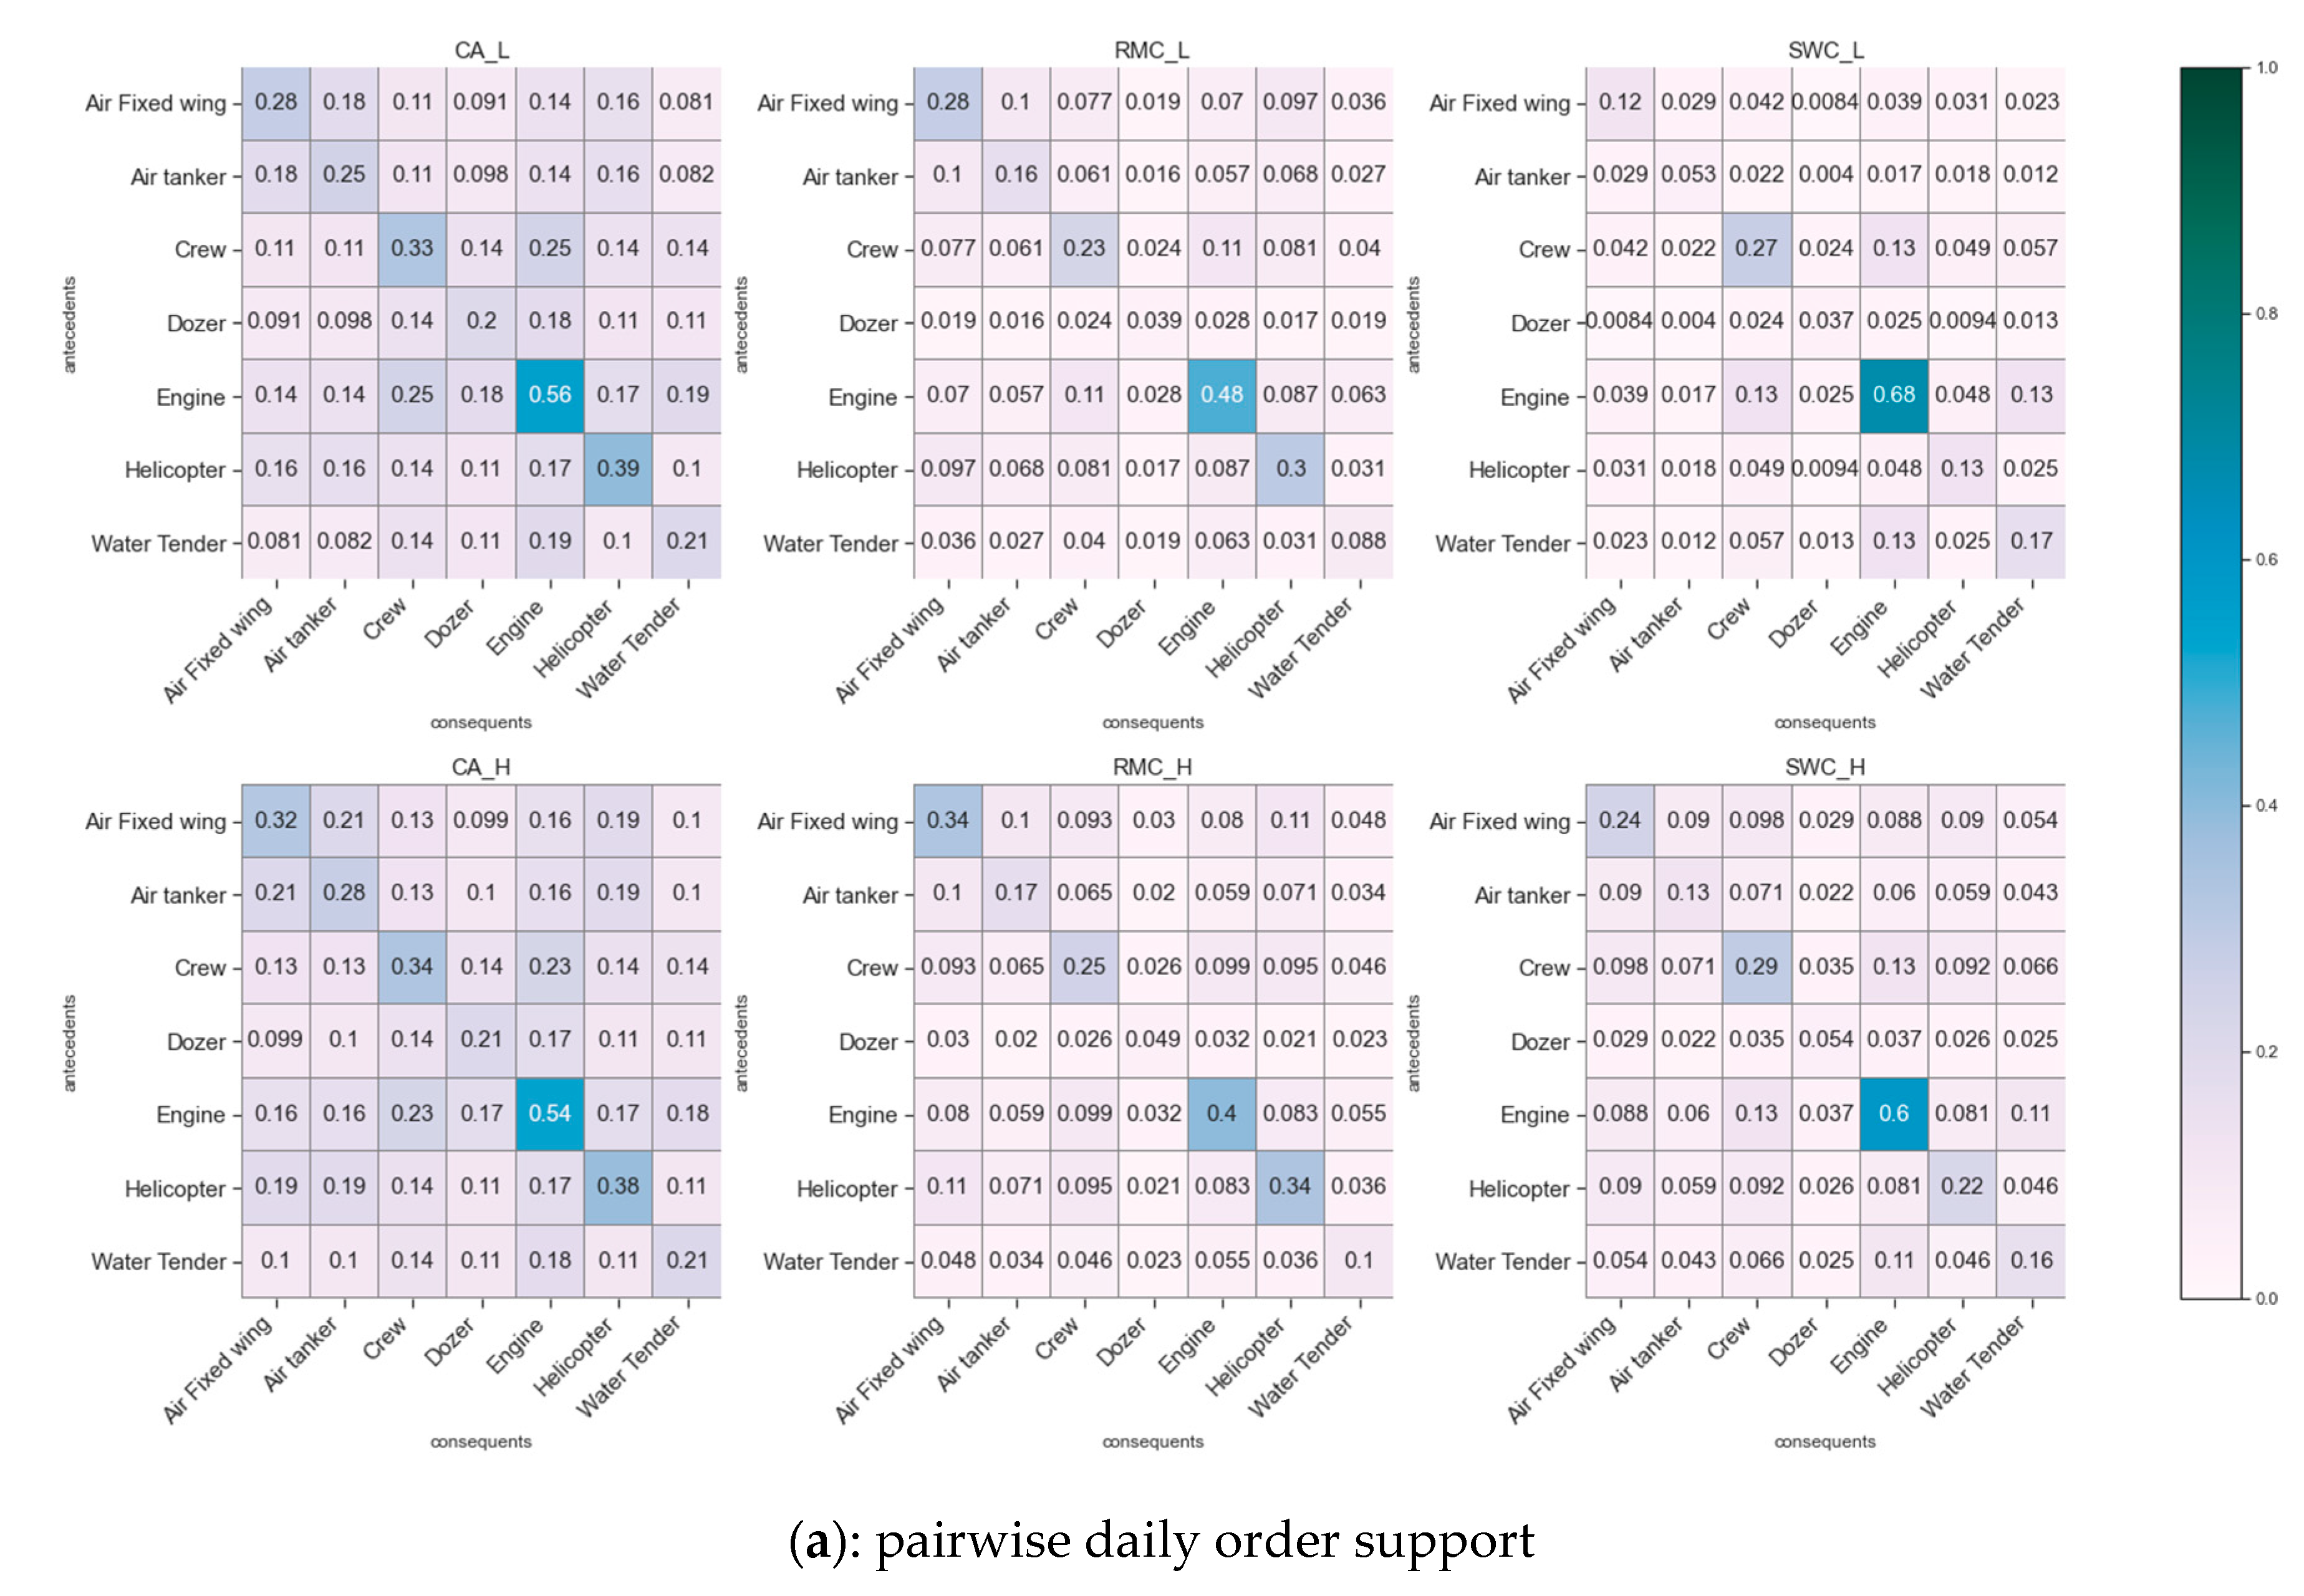
python) reveals the probability that each resource category or each pair of resource categories may be ordered to a fire incident in the same fire day. The diagonal cells in the support heatmaps (
Figure 4a) show the probabilities of ordering each individual resource category in each day. Engines are the resource type that is most likely to be ordered to a fire each day in all three GACCs under both high and low PLs. The likelihood of ordering at least one engine to a fire incident during a fire day is between 40% to 68% in all tested GACCs and under both PLs. Helicopters are the second most likely ordered resource type in CA and RMC (30 to 39%), but not in SWC, which is more likely to order a crew (e.g., 27% support at lower PLs and 29% at higher PLs) than a helicopter (13% at lower PLs and 22% at higher PLs). Both CA and RMC also show a higher likelihood of ordering other aerial resources such as airtankers or fixed-wing planes than SWC (
Figure 4). Instead, SWC is more likely to order water tenders (16% support at lower PLs or 17% support at higher PLs) than RMC (9% or 10% support at lower or higher PLs).
The most frequently ordered pairs of resources also show similarities across GACCs and between PLs (
Figure 4a). For example, the engine/crew pair were most likely to be ordered in CA (25% support at lower PL and 23% at higher PL), which could be simply due to the abundance of both resource categories in California [
17]. Other resources that were highly likely to be ordered in pairs in CA include engine/water tender, engine/dozer, engine/helicopter, airtanker/helicopter, and airtanker/fixed-wing. In RMC, the support for engine/crew, airtanker/fixed-wing, and helicopter/fixed-wing pairs are the highest for both high and low PLs. In SWC, engine/crew and engine/water tender are the two most likely ordered resource pairs at both high and low PLs. One interesting discovery is that at higher PLs, the likelihood that a fire in the SWC will order airtanker/fixed-wing or helicopter/crew pairs is tripled or almost doubled when compared with their orders at lower PLs.
3.3. Resource Assignment Rule Supports
Suppression resource daily assignment (
Figure 4b) reflect the cumulative effects of daily resource ordering less demobilization. Observation of the association rule support heatmaps (
Figure 4) shows that the assignment support of many single resource types or pairs of resources types often are not substantially different between high and low PL, although some differences do exist. For example, engines, crews, and helicopters are the single resource types most likely to be assigned to fire suppression in all three GACCs at both PLs, except at lower PLs in SWC, in which water tender replaces helicopter as the third most likely assigned single resource category. The engine/crew combination is the most likely assigned resource pair to each fire in each day for all GACCs at both high and low PLs. However, the second most likely assigned resource pair varies between GACCs and PLs, i.e., engine/water tender in CA, engine/helicopter in RMC, and engine/water tender at low PL and engine/helicopter at high PL in SWC.
CA shows overall a substantially higher probability of having paired resources assigned to each fire in each day, which is true even for resources that were not commonly paired in other regions. For example, we typically see a low probability of using both an airtanker and dozer together in all GACCs on the same fire day. However, the assignment association rule supports for the airtanker/dozer pair in CA are around 13% at both PLs, while the support for the same pair in RMC is only 1.9% at lower PLs and 3.5% at higher PLs, and in SWC, it is as low as 0.4% at lower PLs and 2.5% at higher PLs.
3.4. Resource Ordering Rule Confidences
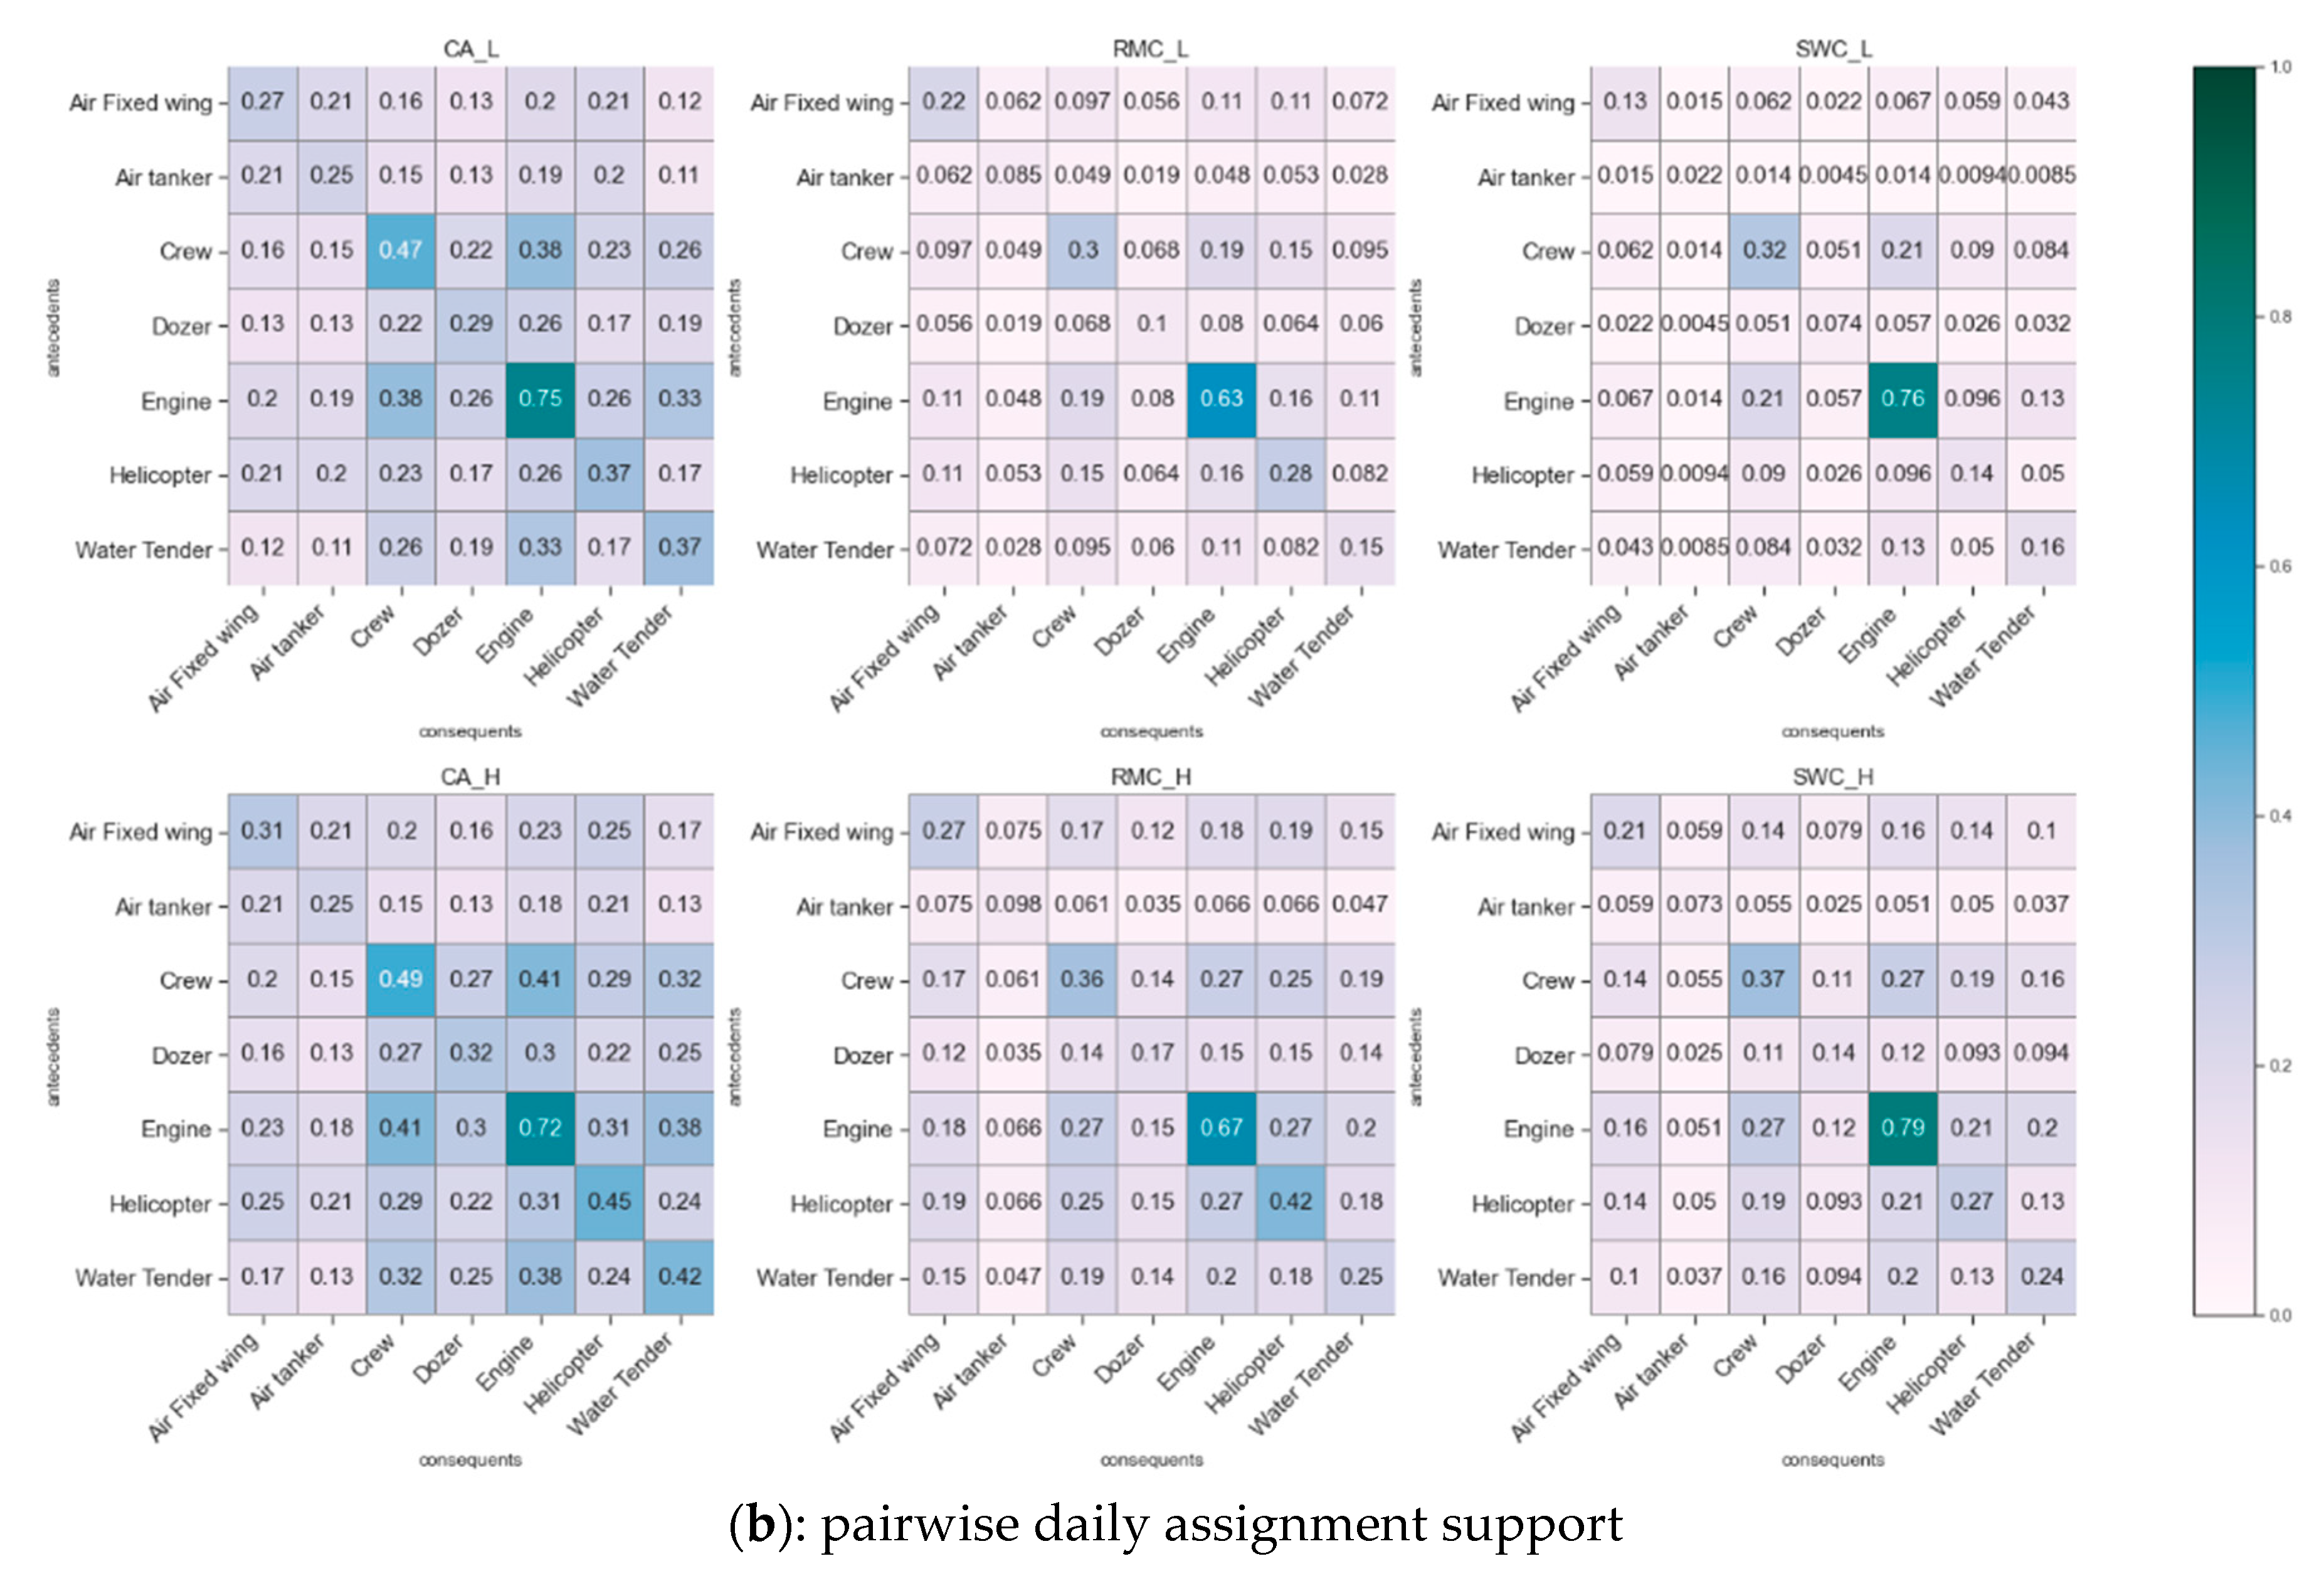
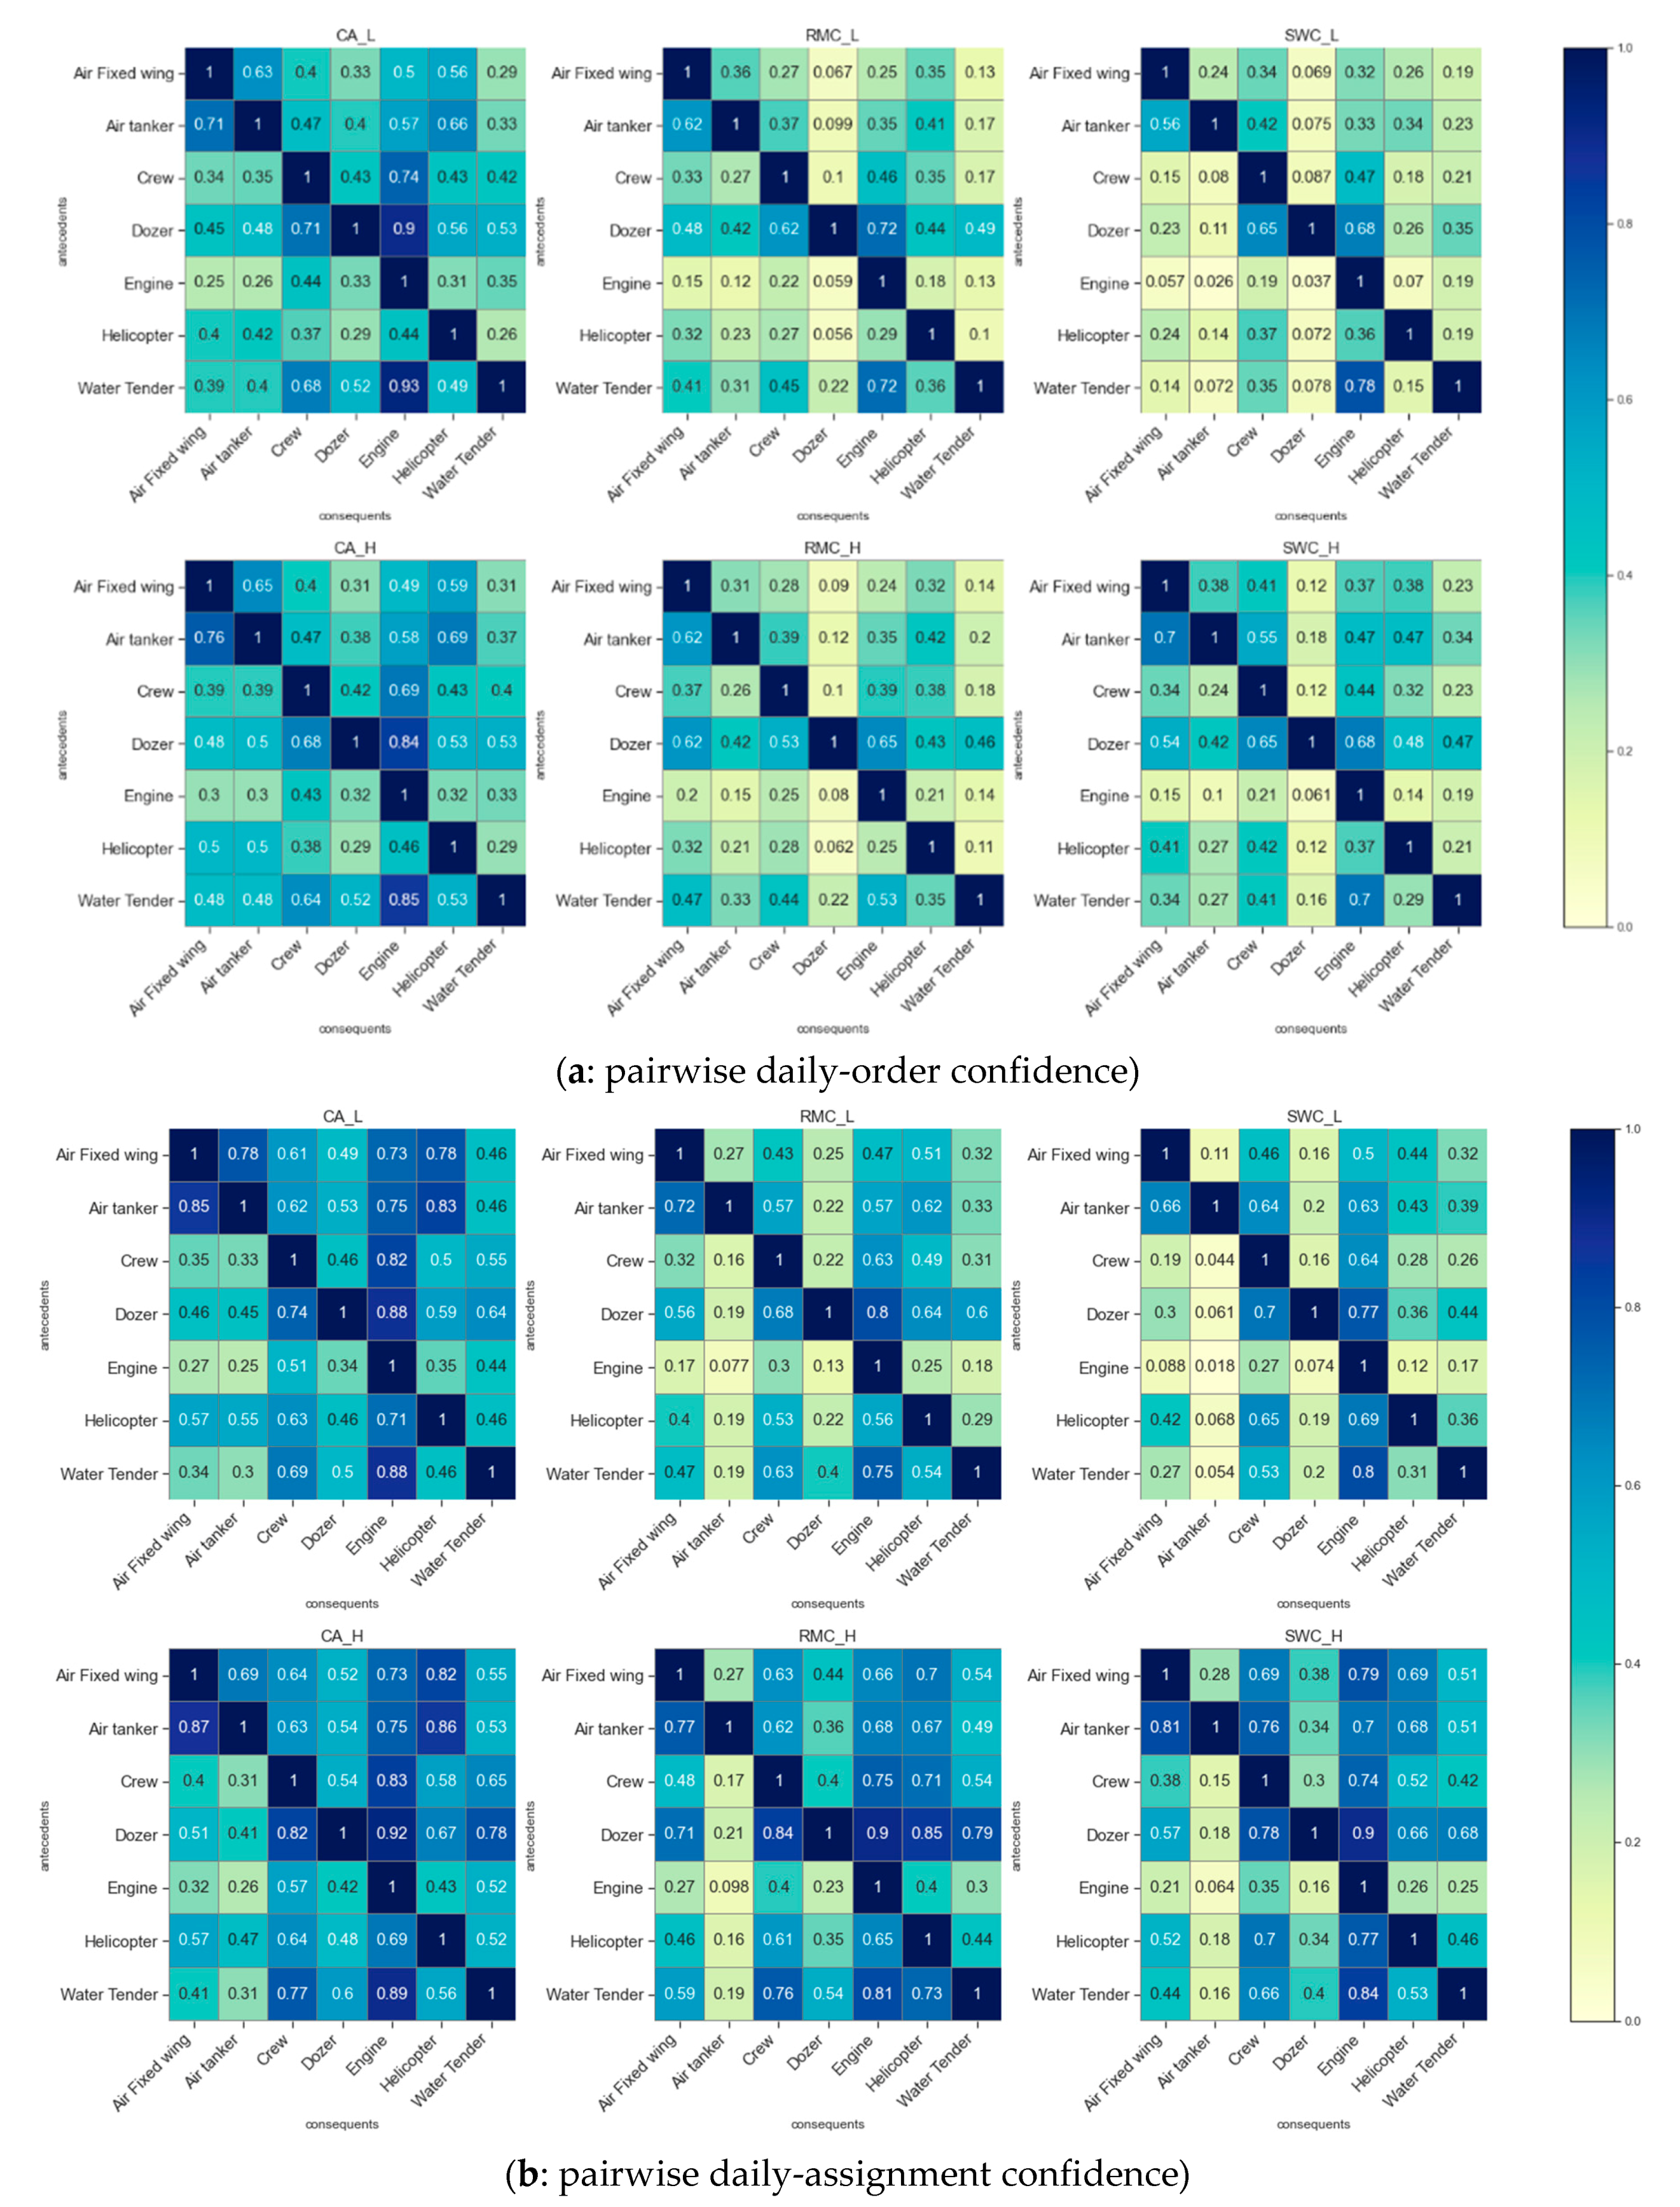
Resource ordering association rule confidence heatmaps (
Figure 5a) display the conditional probability of ordering the set of consequent resources if the set of antecedent resources is ordered. Our study focuses on pairwise resource associations, in which a single resource category is included in the antecedent resource set and the consequent resource set. Each row of the heatmap displays the confidences of all association rules sharing the same antecedent resource type (
Figure 5). In general, a lighter colored row in
Figure 5a (lower confidences) indicates that a resource type is often ordered independently without the other resources; in other words, the consequent resource types are less likely to be ordered when the antecedent resource (one for each row) is ordered during a fire day. In contrast, a darker colored row in
Figure 5a (higher confidences) represents the case that when an antecedent resource type is ordered, we can expect a high likelihood of consequent resource types being ordered on the same day. Comparing the seven general resource categories, engines were more likely to be ordered alone, while dozers were often ordered together with other resources (
Figure 5). This is consistent with descriptions from [
17], in which it indicates that dozers were often followed by hand crews to either finish the fire line, manage burn out based on dozer lines, hold the fire using dozer lines, or combat spot fires across dozer lines.
For aerial resources, order association rules with an airtanker as the antecedent often show higher confidences. When an airtanker was ordered, there is high confidence that either fixed-wing aircrafts, helicopters, crews, or engines would also be ordered together in the same day. Compared with airtankers, helicopters have much lower probabilities of being ordered together with other resource categories (e.g., their ordering association rules’ confidence is mostly ≤50%, shown in
Figure 5a). This indicates helicopters are more likely to work independently than airtankers and other fixed wing aerial resources.
In contrast to association rule support, association rule confidence is usually not symmetric. For example, the confidence of the crew ⟹ engine order association is 74% at low PL and 69% at high PL in CA. It indicates that when crews were ordered, there is about a 70% chance that at least one engine would also be ordered at the same day for the same incident in California. However, the confidences of the engine ⟹ crew ordering associations are typically less than 50% at both PLs in CA, which means engines are much more likely to be ordered without crews than with crews in California during each fire day. The association between engine and dozer orders shows another example of asymmetric association confidence. Compared with the high confidences of dozer ⟹ engine order associations, e.g., around 70% in RMC and SWC, around 84% and 90% in CA, the engine ⟹ dozer order association is substantially lower, i.e., only from 3.7% to 8% in RMC and SWC, and slightly above 30% in CA. Thus, it is common for managers to order engine(s) when a dozer is ordered, but it is less common for them to order any dozer when an engine is ordered.
3.5. Resource Assignment Rule Confidences
Unsurprisingly, we find similar patterns in the association rules for daily resource assignments (
Figure 5b) and daily resource orders (
Figure 5a). The highest confidences between ground resource assignments are still found in dozer ⟹ engine and water tender ⟹ engine associations at both PLs. For example, if any water tender was assigned to a fire, the likelihood for an engine being assigned to the same fire in the same day is about 90% in CA, 75% at low PL, and 81% at high PL in RMC, and 80% at low PL and 84% at high PL in SWC, which means there is only about a 10% chance in CA and less than a 25% chance in the other two GACCs for water tender to work on a fire during a fire day without an engine.
Higher confidences can be found for most rules at high PL than at lower PL in all three GACCs. This pattern is more apparent in the assignment confidence heatmap (
Figure 5b) than in the ordering confidence heatmap (
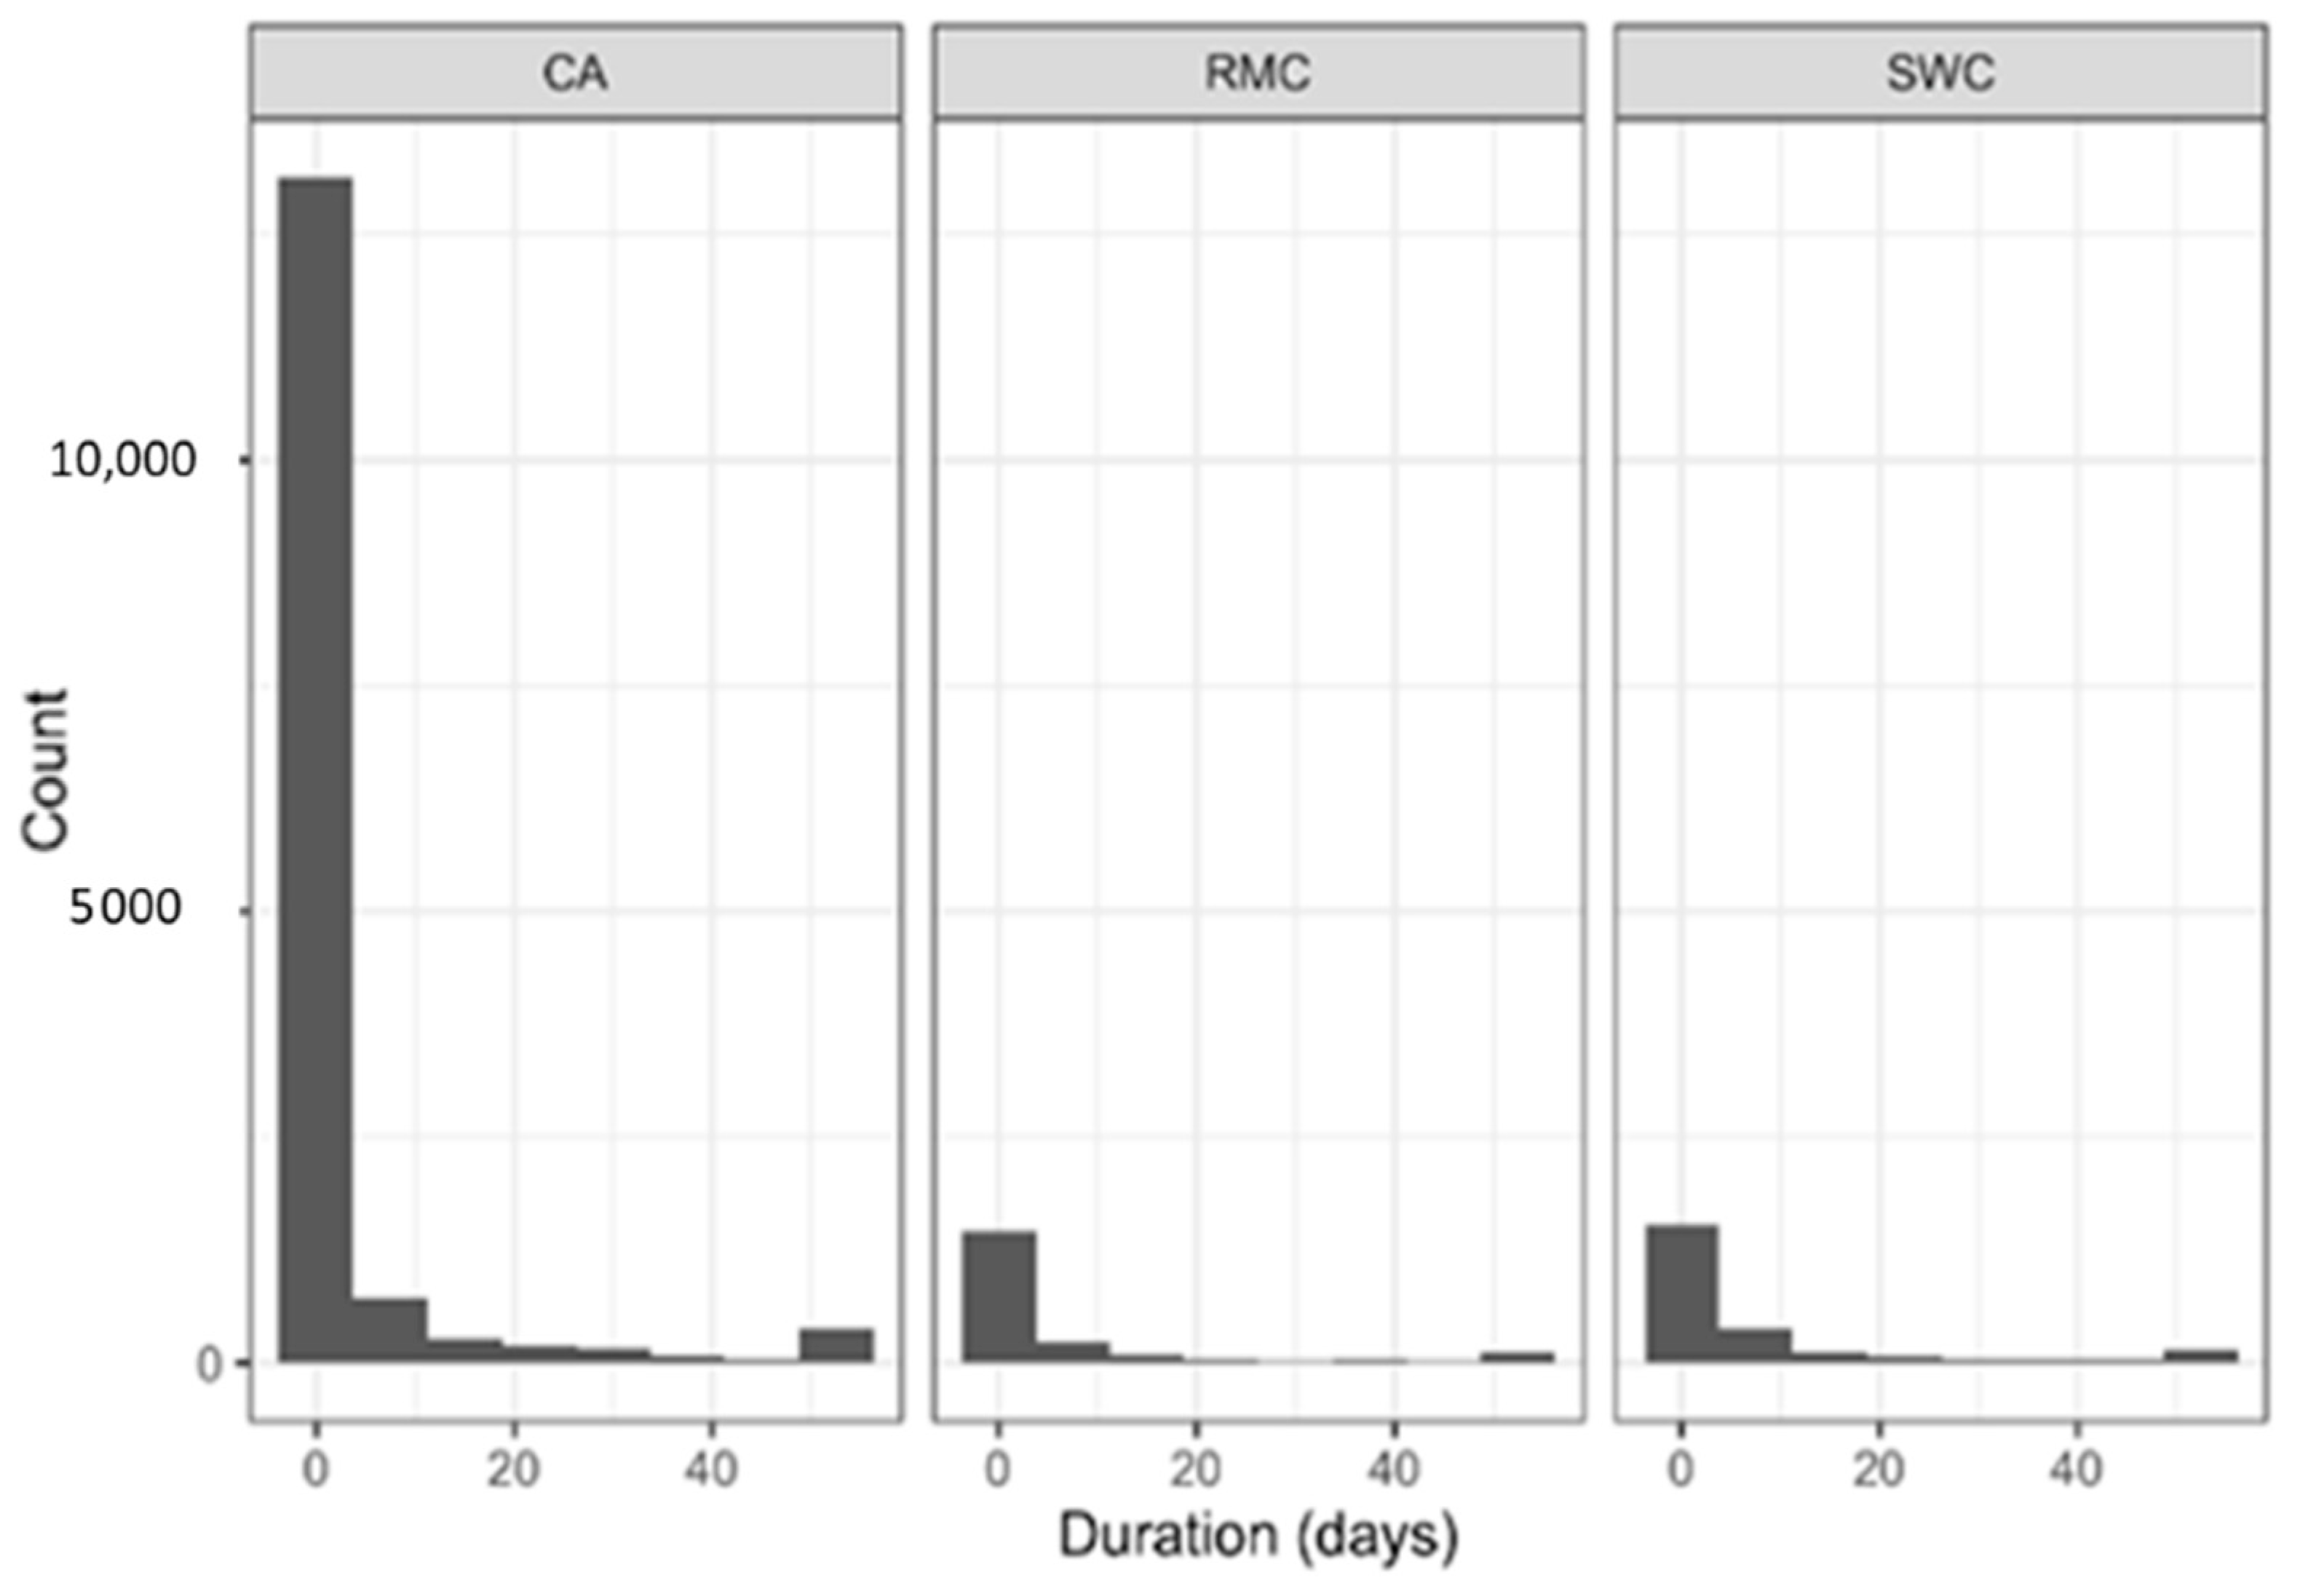
Figure 5a) due to cumulative resource requests over multiple days. For example, after a crew is assigned, it may stay on a fire for up to 14 days, and resources ordered on other days may end up working together with that crew during their overlapping shifts. Higher assignment association confidence at higher PLs could be attributed to the higher resource collaboration requirements of more severe fire situations, longer shift lengths on large fires, or simply because more resources were assigned to the same fires at higher PLs.
Airtankers are a resource type that has unique assignment patterns. For the most part, they are nationally owned strategic resources that may be ordered, dispatched, and reassigned to multiple fires within the same day [
1,
7]. Unlike the other resource types examined in this analysis, the assignment associations with an airtanker as the consequent resource often show lower confidences than the corresponding ordering rules (comparing
Figure 5a,b). Using the airtanker and crew association as an example, after an airtanker was ordered on a fire day, it could be reassigned to a different fire in the same day or in the next day while crews are still working on the same fire to finish their 14-day shift. This would lead to lower confidence for the crew ⟹ airtanker assignment rule than the corresponding crew ⟹ airtanker ordering rule. In fact, the crew ⟹ airtanker assignment rule confidences are much lower and vary dramatically between GACCs and PLs, i.e., a little bit above 30% in CA, about 16% or 17% in RMC, and only 4.4% in SWC at lower PLs and 15% at higher PLs. It indicates: (1) crews often work on fires independently without airtanker support during each fire day; (2) crews in California are much more likely to work together with an airtanker than crews in the other two GACCs; (3) crews rarely work with airtankers in the SWC at low PL, but that probability increases four times at high PL. In the opposite direction, airtanker ⟹ crew assignment associations consistently have much higher confidences, e.g., between 57% and 76% in all GACCs. It indicates that the probability of having an airtanker working on a fire without an on-the-ground crew is relatively low (24% to 43%) in all GACCs, which is consistent with discoveries from [
26].
3.6. Confidence vs. Support
Individual heatmaps display either association rule confidence or support (
Figure 4 and
Figure 5). In this section, we plot the two indicators together for selected rules using the
matplotlib.pyplot library [
34] from python. To improve the readability of those graphs, we select the highest confidence rule out of all the rules that share the same antecedent resource type (we call it “most confident” rule of the antecedent resource) and graph the confidence and support of those rule as “bubbles” in
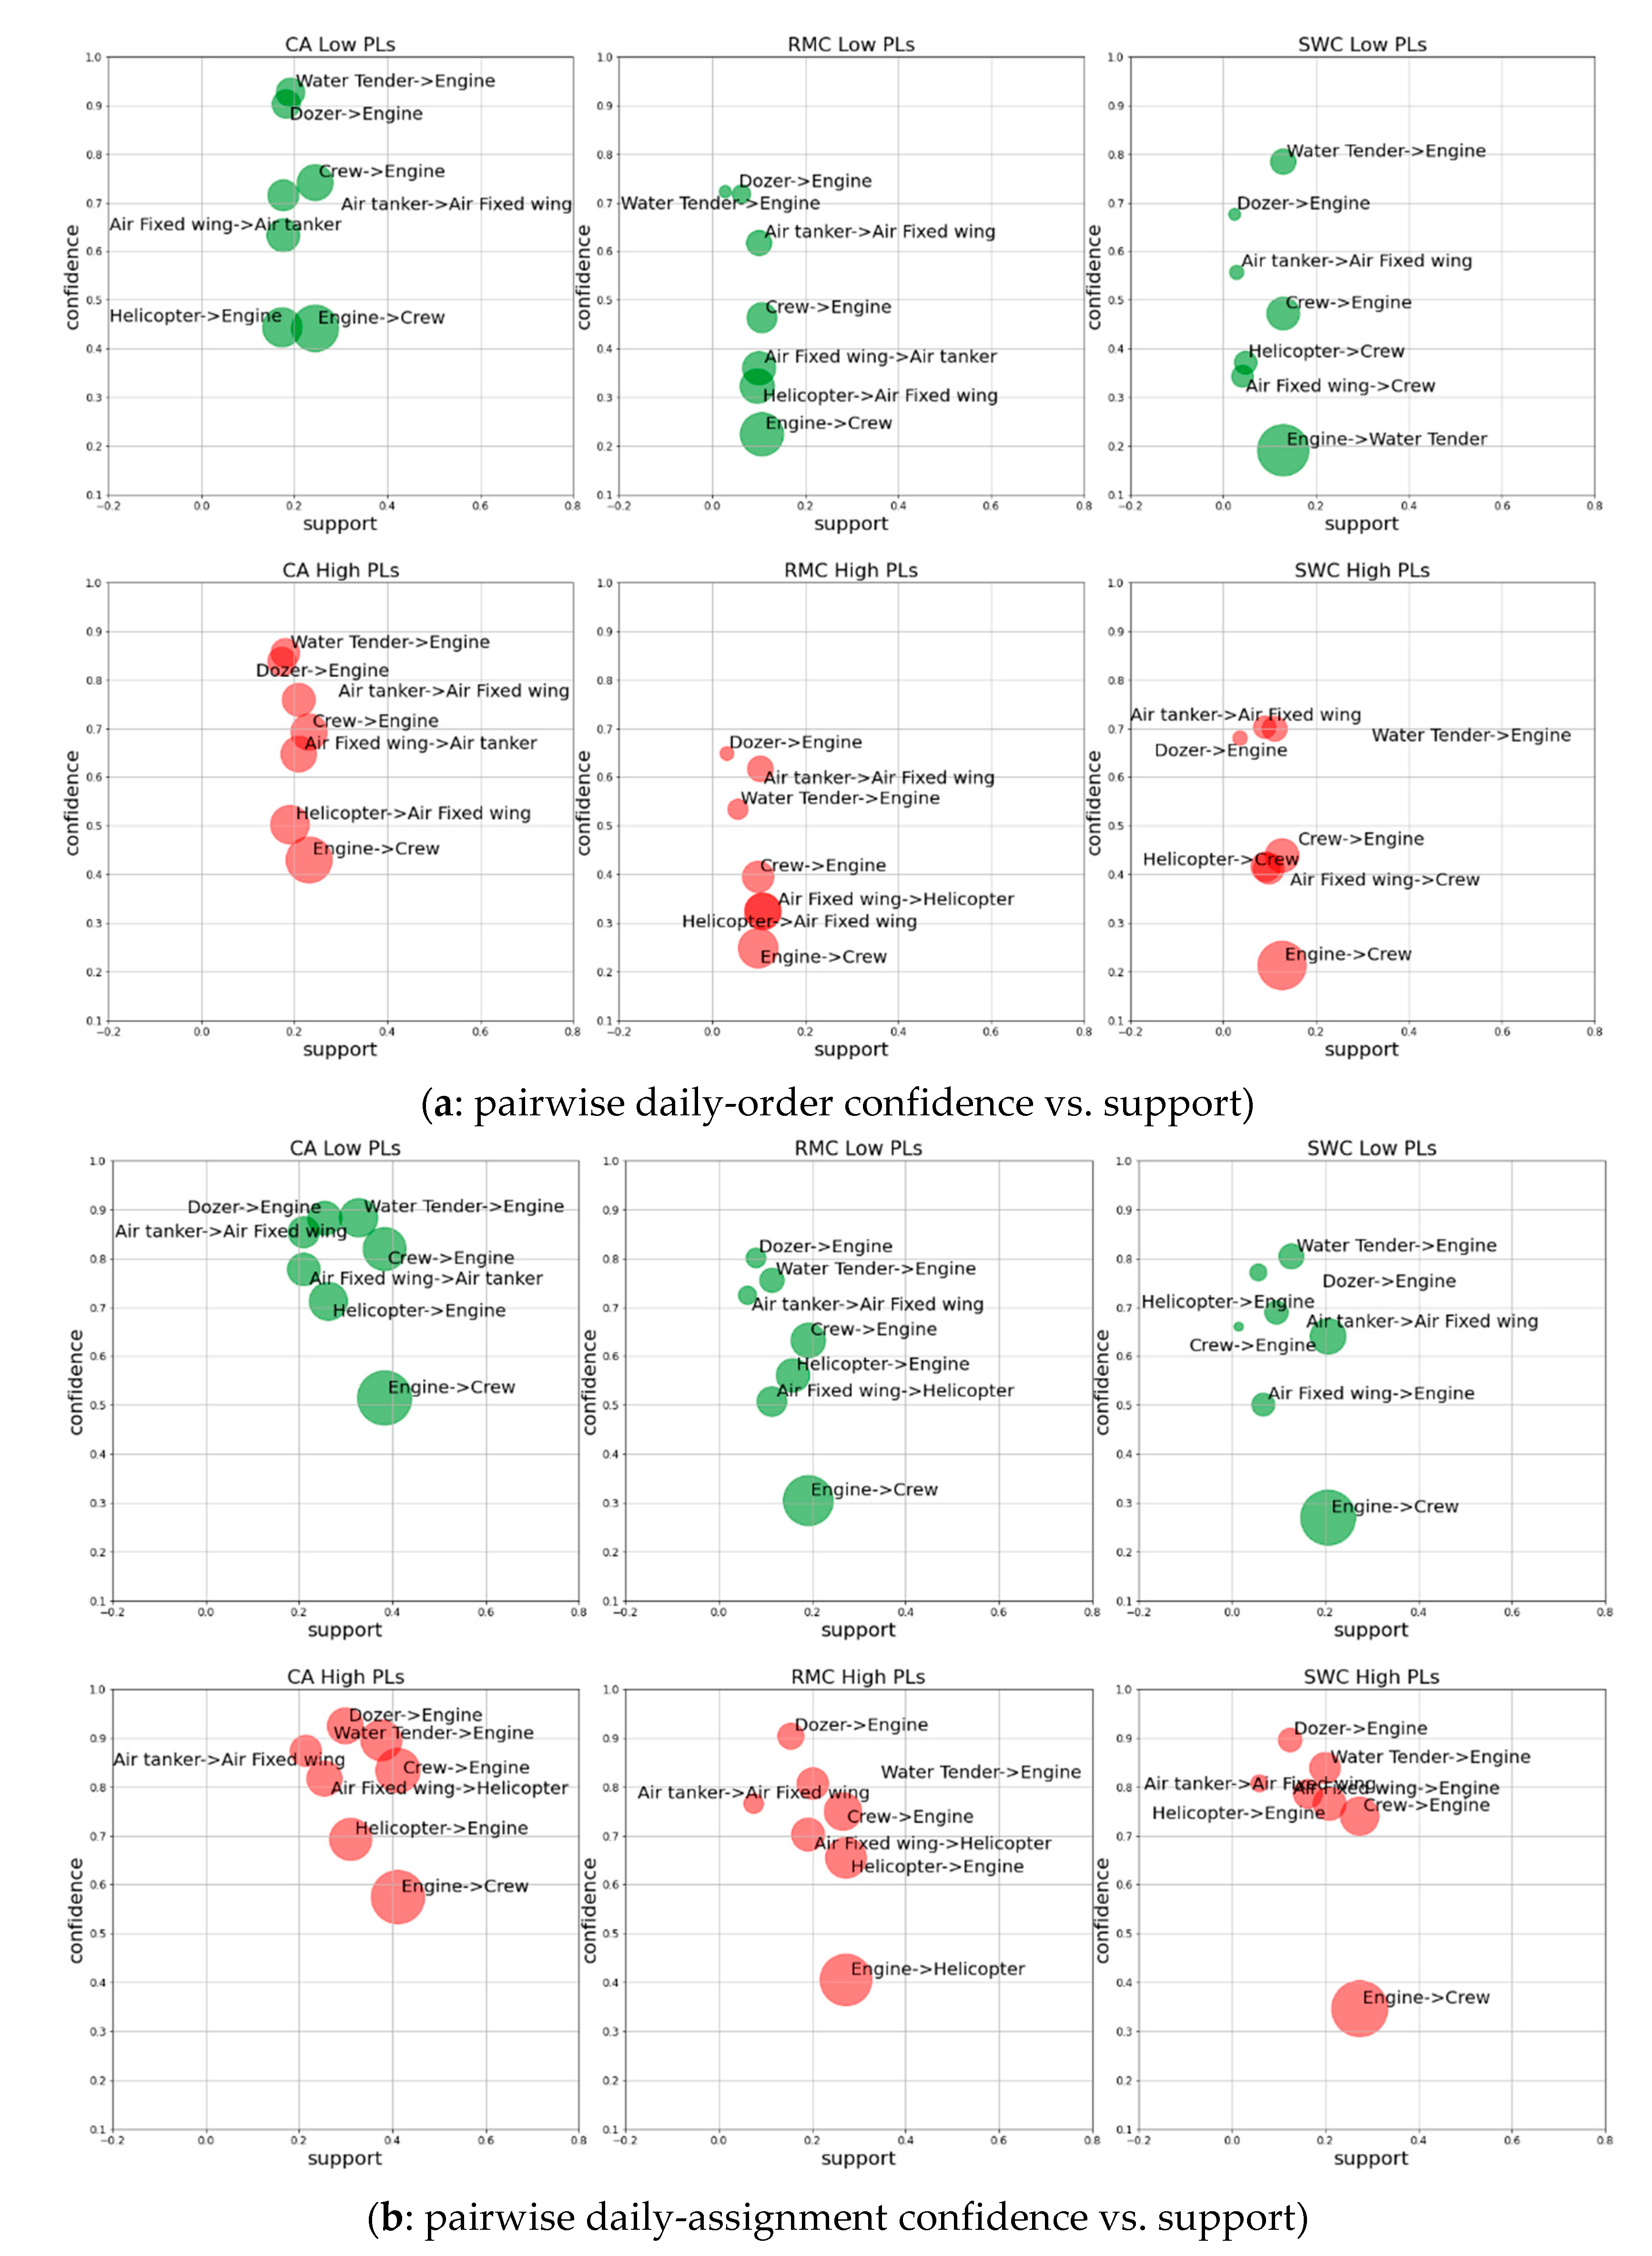
Figure 6. The position of the center of each circle is determined by both the confidence and support for the corresponding rule; the size of each circle is proportional to the support of the antecedent suppression resource.
Resource collaboration patterns can be observed through those plots (
Figure 6). For example, the support for engines (proportional to the bubble sizes with engine as the antecedent resource) is always the highest in all GACCs at both PLs for either resource order or assignment. The engine/crew pair is among the most likely pair of collaborators according to their assignment rule supports (
Figure 6b). Again, the confidences for engine ⟹ crew order and assignment are always much lower than the opposite crew ⟹ engine order and assignment. In fact, the engine ⟹ crew order and assignment always have the lowest confidences among all the most confident rules plotted (
Figure 6). Within other rules with an engine as the consequent resource, both the dozer ⟹ engine and water tender ⟹ engine order and assignment rules have high confidences. For aerial resources, the most confident rules with the fixed-wing aircraft as antecedent are either with airtanker, helicopter, engine, or crew as the consequent resources. This indicates that fixed-wing aircraft are likely ordered and assigned to support a variety of resource types including helicopters, airtankers and ground resources; this discovery is also consistent to the findings from [
26].
Within the selected most confident rules, the support of each rule is not always correlated with the confidence of that rule. We note that the supports for the selected resource ordering rules (
Figure 6a) are within a narrow range in all GACCs, e.g., around 20% in CA, and less than 20% in RMC and SWC, but their confidences vary substantially, e.g., around 40% to 95% in CA, and 20% to 80% in the other two GACCs. For resource assignments (
Figure 6b), we find slightly wider support range for the selected rules, e.g., around 20% to 40% in CA, and less than 30% in the other two GACCs; the confidence ranges of those rules are still much wider, e.g., about 40% to 95% in CA and 20% to 80% in the other two GACCs. Comparing the rules with similar support but lower confidence indicates that the antecedent resource would more likely be ordered or assigned independently from the other resource types. Engines and helicopters consistently fall into this category, followed by fixed-wing airplanes. The other resource types such as dozers, airtankers, and water tenders tend to require more collaborations from other resource types.
3.7. Association Rules between Resource Subcategory Assignments
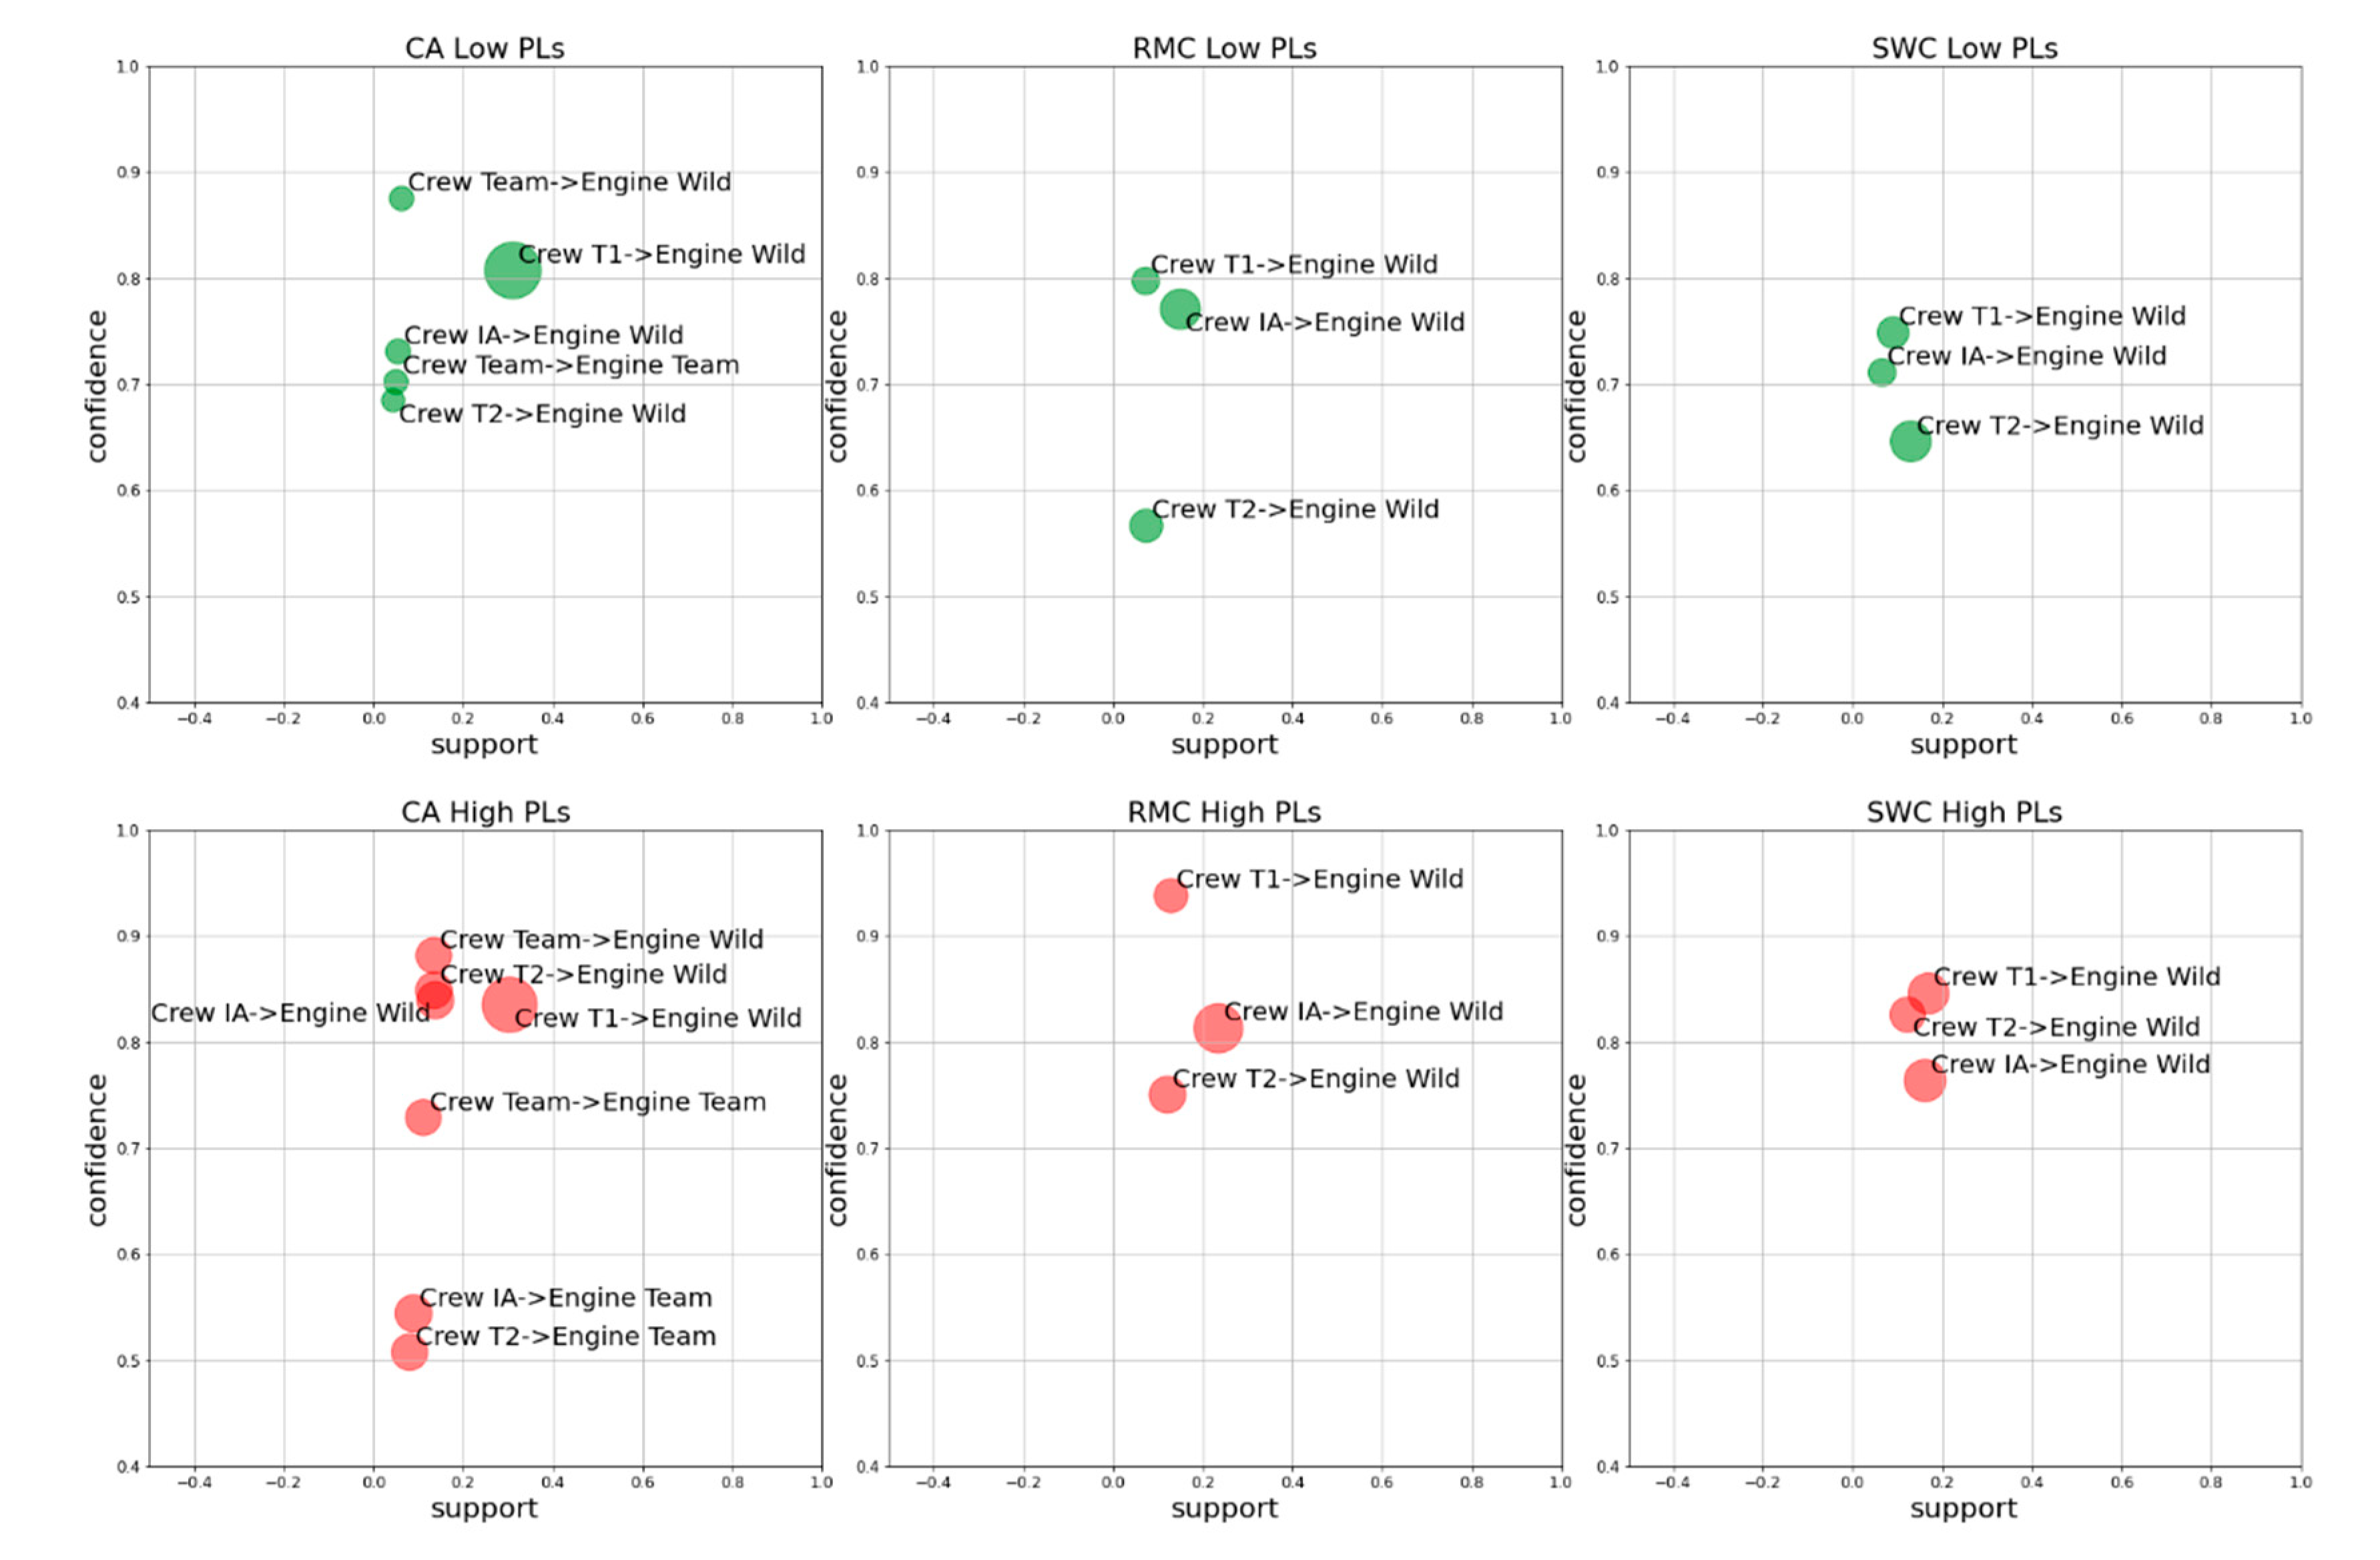
Analysis of the assignment of resource subcategories (
Table 1) reveals some finer-scale patterns in daily suppression resources collaboration. We first display association rules with multiple crew subcategories, including crew teams, type 1 crew, initial attack (IA) crew, or type 2 crew as the antecedent items, and with engine subcategories including engine teams, structure engines, or wildland engines as the consequent items. To make the graph simpler to read, we only list those subcategory assignment rules with a support >5% and a confidence >50% (
Figure 7). Test results show that the type 1 crew ⟹ wildland engine assignment associations often have the highest confidences (around 80%) in RMC and SWC at both PLs. In CA, the crew team ⟹ wildland engine association has the highest confidence (about 90%), while the type 1 crew ⟹ wildland engine assignment associations still have above 80% confidence at both PLs. This figure also indicates that fires in CA were more likely to use a type 1 crew (represented by the large circles in
Figure 7) than a type 2 crew or IA crew, which is different from the other two GACCs, as both RMC and SWC show a similar likelihood of using type 1, 2, or IA crews. In CA at higher PL, we found similar confidence of using wildland engine to support either type 1, 2, or IA crews. However, in RMC and SWC, type 1 crews have a higher likelihood of being assigned together with wildland engines than the less trained type 2 crews.
We also studied airtanker or fixed wing airplane subcategories, including small airtankers, large airtankers, lead planes, tactical planes, cargo planes, infrared planes, passenger planes, recon planes, or smokejumper planes as either the antecedent or consequent resources (
Figure 8). For simplicity, we only display those assignment rules with support >1% and confidence >50%. We find more association rules meet those support and confidence thresholds at higher PLs than at lower PLs for all three GACCs. In fact, at lower PLs, we cannot find airtanker or fixed-wing aerial assignment associations in SWC that meet the above support and confidence thresholds, which indicates that those resources are less commonly used in SWC at lower PLs. Results also reveal that small airtanker and fixed-wing tactical plane are the two most used fixed-wing aerial resource types in CA. At lower PLs, if one of the two types are assigned, we would likely see the other type being assigned at the same day. In CA, a small airtanker is much more likely to be assigned to a fire during a fire day than a large airtanker (reflected by the bubble size in
Figure 8), potentially because the California Department of Forestry and Fire Protection (CAL FIRE) owned many small airtankers that are dedicated for CA only. Both large airtankers and small airtankers typically work together with fixed-wing tactical planes or fixed-wing lead planes. Large airtankers very likely work with small airtankers in the same fire day in CA and RMC at both PLs (e.g., about 80% in CA and 70% in RMC), or in SWC at higher PLs (about 60%), but not in SWC at lower PLs.
4. Discussion and Conclusions
This study implemented the PCA and ARA methods to study fire suppression resource ordering and assignment patterns using the 2016 to 2018 ROSS data on filled suppression resource requests. We studied three GACCs in the western US at both higher and lower PLs. ARA identifies the frequent co-ordering or co-assignment of multiple resources during each fire day and helps us understand how resources interact together and whether they can work synergistically. We calculated supports for single resource categories or pairs of resource categories that were ordered or assigned to each fire during each day. We calculated the confidences of association rules between pairs of resource categories (or subcategories). Our analysis quantitatively revealed some daily suppression resource order and assignment patterns based on existing empirical data; many of them are consistent with the qualitative descriptions from [
17,
26] and previous research findings.
Our study found that engines, crews, and helicopters were the most frequently ordered and assigned single resource types in each fire day for each fire. Engines were also most likely to be ordered or assigned independently without the need to collaborate with other resources. The common use of engines is potentially due to its abundance across the nation [
35], flexibility of achieving a variety of suppression objectives, including fireline construction, dozer line cleanup, crew and equipment transportation, point protection, burnout, etc. In contrast, dozer, water tender or airtankers were more likely ordered and assigned together with other resource categories.
Most unsupervised learning methods such as PCA and ARA are good at discovering patterns by mining unlabeled empirical data. Those discoveries could be used to configure hypotheses, identify correlations, and predict future outcomes. However, unsupervised learning does not typically analyze the causes behind many of the identified patterns, nor prove or reject certain identified hypotheses. Additional research is necessary to further investigate the causal relationships behind those discoveries.
Here are some examples of potential future investigations based on the discoveries from the ARA. Aerial resource orders and assignments in SWC at lower PLs are much lower than the other two GACCs. Several reasons could lead to this, for example, fewer natural water sources available for aerial resource use, higher cost of aerial resource use (especially if the retardant system were used), relative fewer values at risk comparing with the other regions, fire management policy, or other challenges including the “density altitude” as described in [
17]. However, we also noticed at higher PLs that the probability of using aerial resources increases substantially in SWC. One hypothesis is that at higher PLs, managers may be more aggressive in attacking the fire away from roads to reduce the total amount of fire on the landscape; therefore, they might be less concerned about the higher cost of using aerial resources and they might rely more on retardant instead of natural water sources to take advantage of the speed and flexibility of aerial resources. Further studying this pattern in SWC could lead to better understanding of the impact of water source availability, cost, values at risk, and altitude affecting the use of helicopters, fixed wings, and airtankers in comparison of using ground-based resources such as water tenders.
Discoveries from this study also suggested the need to further investigate the potential collaboration or substitution between different types of suppression resources. For example, dozer ⟹ engine order and assignment rules have much high confidences in all regions at both PLs than the opposite engine ⟹ dozer order and assignment rules. Future research could be designed to study how each resource type may be used for different tasks but collaboratively to achieve common suppression objectives. Engines and dozers may also be suitable for different road conditions and raise different environmental concerns. Another future research direction could include extending the ARA analyses to study resource ordering and assignment patterns under different fire situations, i.e., for different fire size classes, durations, incident management team types, fire suppression stages (as suggested by [
23]), etc.
Comparing the three GACCs studied, managers in CA were more likely to use multiple types of suppression resources together as described by other past studies [
8,
36]. CA is also more likely to use “teams” formed by either multiple engines (engine team) or multiple crews (crew team). Given its higher population density in CA, there is generally more concerns of fire risk in this region. Higher risk creates a demand for more resources. Plus, there may be more resources available in California than the other two GACCs. Abundant supplies make it easier for CA to coordinate multiple resource types during fire suppression, which is reflected by higher supports and confidences of suppression resource ordering and assignment rules. Future research may need to collect additional information such as fire suppression objectives and whether they have been better achieved in CA to study the potential return of investment by using multiple resource types together. Future studies may also help us understand how factors such as topography, fire season, fuel conditions, or climate factors [
37] would influence the efficiency of suppression resource collaborations.
Studying the daily fire incident level resource ordering and assignments data helps reveal some interesting patterns of suppression resource use and collaboration. However, to more thoroughly study the patterns and efficiency of fire suppression decisions, we may need to collect finer-scale fire suppression data at the individual fireline level and synchronize different types of data at finer temporal scales, e.g., hourly. One reason is many of the key events and decisions occurred during large fire suppression, i.e., retardant drop, line breaching, and fire spotting, are associated with fire behaviors and suppression decisions at specific time and locations. Collecting finer scale spatial and temporal data is critical in helping us conduct in-depth studies in fire suppression resource use and its effectiveness. This would require improving the tracking of individual suppression resources movement, recording and predicting real time weather near key fire control locations, as well as conducting detailed and consistent documentation of fire suppression objectives at different spatial scales, e.g., at incident, division, and fireline levels.


