Wetting and Evaporation of Solvents on Thin Soluble Substrates


Institute for Technical Thermodynamics, Technical University of Darmstadt, 64287 Darmstadt, Germany
*
Author to whom correspondence should be addressed.
Colloids Interfaces 2020, 4(4), 48; https://0-doi-org.brum.beds.ac.uk/10.3390/colloids4040048
Submission received: 9 September 2020
/
Revised: 14 October 2020
/
Accepted: 19 October 2020
/
Published: 30 October 2020
(This article belongs to the Special Issue Exclusive Papers of the Editorial Board Members of Colloids and Interfaces)
Abstract
:In this work, the wetting and evaporation behaviour of non-polar solvent droplets on thin soluble coatings is investigated experimentally. The wetting process on spin-coated polymer layers by toluene is captured using shadowgraphy. Initial spontaneous dynamic wetting as well as later stages of wetting are recorded and evaluated. Furthermore, structures obtained by wetting and subsequent evaporation of solvents on polymer coatings are studied by confocal microscopy. The solubility of the substrate has been varied by using polymers with different molecular masses. We observe that initial spreading dynamics does not depend on the molar mass in the studied range. However, we find a strong influence of the molar mass on the late stage wetting dynamics and on the surface structure after solvent evaporation.
1. Introduction
Wetting processes are crucial for a multitude of applications in different industrial sectors, including agriculture, textiles and the food industry. Wetting properties determine whether a process liquid can spread across a substrate or a product. Wetting dynamics limits fast coating processes and is therefore often a bottleneck in production processes. Droplet evaporation is important for a multitude of technical processes, including ink jet printing, fuel evaporation in combustion engines and spray cooling, as well as for the natural phenomena. Wetting and evaporation of solvents on thin soluble coatings are relevant to functional printing or cleaning processes. The latter wetting scenario differs fundamentally from cases on inert surfaces, as competition between wetting dynamics, evaporation and chemical processes leads to additional spreading mechanisms and the appearance of new surface structures after solvent evaporation. The redistribution of substrate material leading to formation of surface topography during droplet spreading and evaporation is a promising method for micro manufacturing processes [1].
Wetting dynamics on inert, non-soluble substrates has been extensively studied over the last several decades. It has been found that spontaneous spreading of drops on inert substrates follows the relation
with r being the wetted radius, the wetting time and a wetting exponent, which depends on the dominant forces driving or limiting the spreading process [2]. Biance et al. [3] suggest that at short times immediately after the start of spontaneous wetting the spreading dynamics, which is driven by the surface tension, is limited by inertia. Based on the balance between the surface tension and inertia, Biance et al. [3] propose the value , which they also observe in their experiments. Bird et al. [4] have confirmed this behaviour for perfectly wetting cases experimentally. However, for non-zero contact angles (), they observe a deviation from the fixed exponent. For the highest static contact angles within their measurements, they report exponents as low as . At later times of spreading, inertia becomes negligible, and viscosity becomes the dominant mechanism limiting the spreading dynamics on inert surfaces. Within the viscosity-limited regime, the wetting process on inert, perfectly wetting substrates slows down, and the wetting exponent can be found to be for small drops () and for large drops () with the Bond number B0 being the ratio of gravitational forces to capillary [5,6]. The crossover between the two regimes with and corresponds to the characteristic time [3]:
with and R being the liquid density, surface tension, dynamic viscosity and the initial droplet radius, respectively. During wetting on inert surfaces, the dynamic contact angle for complete wetting cases is described by the Hoffman–Voinov–Tanner law: , with the capillary number , where U is the contact line velocity [6,7]. For partial wetting cases, modified models have been suggested, which relate the dynamic contact angle to the capillary number and the static contact angle [8,9].
On soluble surfaces, solvent droplets evoke additional physico-chemical processes, such as swelling, dissolution or precipitation. These processes strongly interact with wetting, evaporation and condensation.
Muralidhar et al. [10] investigate the dynamic wetting of toluene on thick polystyrene (PS) substrates of multiple solubilities and find at the initial stage of spontaneous wetting. Within their measurements with good solvents, no strong dependence of substrate solubility on wetting dynamics was observed. They also report lower wetting exponents of for water on the same substrates. However, as water shows substantially higher static contact angles on polystyrene, these findings could also be related to regular partial wetting scenarios on inert surfaces. The authors report contact line pinning after the fast spreading stage and do not observe any further spreading beyond the initial stage.
Dupas et al. [11] studied the late stage spreading of droplets and forced wetting on soluble surfaces. They report that the advancing dynamic contact angle on polar soluble coatings scales with the product of film thickness and contact line velocity for a defined range of contact line speeds and coating thicknesses. Their findings suggest that the spreading of water droplets on maltodextrin relies on the dominant way of solvent transfer into the substrate. Dupas [12] also composes regime maps which depict the dominant solvent transfer mechanism.
As many common solvents are highly volatile, their spreading may overlap with evaporation. The mass loss by evaporation affects the spreading law. Using a framework by Morris [13], Jambon-Puillet et al. [14] developed a model predicting the evolution of the contact radius and contact angle of spreading droplets on inert surfaces in the presence of evaporation. The theoretical results have been compared with experimental results for alkanes on glass substrates showing a good agreement.
Bonaccurso et al. [15] identify the evaporation of solvent droplets on thick polystyrene substrates as a way to produce microvessels and microlenses. They generate spherically shaped cavities with variable radii of curvature and a rim along their circumference. Geometrical characteristics like cavity depth, diameter and curvature can be tuned by subsequently adding multiple solvent droplets on top of each other. Li et al. [16] expand those investigations by using polystyrene substrates of different molecular mass. They find qualitative different shapes after solvent evaporation for different substrates and relate their finding to the variation of substrate solution rates and diffusion constants. Gonuguntla and Sharma [17] use several different solvents on poly(methyl methacrylate) coatings with fixed molecular mass within diverse atmospheric conditions to produce variable surface structures via droplet deposition and evaporation. Yet, a systematic and quantitative relation of surface structures to experimental parameters is lacking. Several authors use solvent droplets on polymer surfaces to produce via-holes and further structures on circuit boards [1,18,19,20,21]. Grimaldi et al. [22] use mixtures of different solvents to control the geometry of the structures after evaporation. However, those investigations mainly aim at a qualitative description of the etching process and do not take the spreading of droplets into account. A consequent evaluation of the influence of film solubility on the development of etched structures is still pending, too.
In the subsequent sections, we examine the whole life course of non-polar solvent droplets from wetting until complete evaporation on thin polystyrene coatings of different molecular masses and thereby solubilities [23].
First, we present the materials used for our investigations as well as the method for production of thin polymer coatings. We outline our test set-up and experimental routine. The results are split into findings on wetting, evaporation and surface restructuring.
2. Materials and Methods
2.1. Materials
For substrate preparation, amorphous polystyrene polymers with averaged molecular masses = (192, 280, 320, 335, 524) −1 are spin-coated onto commercial glass slides. Polymers of −1 and of −1 have been bought from PSS Polymer Standards Service and have a narrow molar mass distribution (). The remaining polymers having wider molar mass distribution have been bought from Sigma-Aldrich and Carl Roth. Prior to the coating process for substrate preparation, glass slides are cleaned in an ultra sonic bath of acetone and then in ethanol for 30 each and dry blown in a nitrogen stream. We use solutions of 6 polystyrene in toluene (analytical grade, Carl Roth) for the coating process. By varying the rotation speeds in the range of 1401 to 4615 RPM, we achieve a coating thickness of . Substrates with coatings of −1 represent outliers with a typical thickness of nm. The thicknesses are measured by pealing of a small area of coating and comparing the surface level of the glass substrate to the coating. The coatings show smooth surfaces with arithmetical mean roughness of . The properties of the coatings are reported in Table 1. Surface roughness and coating thickness are obtained using a µsoft expert confocal microscope profilometer from NanoFocus AG. For the experiments, toluene (analytical grade, Carl Roth) is used as the wetting solvent.
2.2. Experimental Set-Up and Measurement Procedure
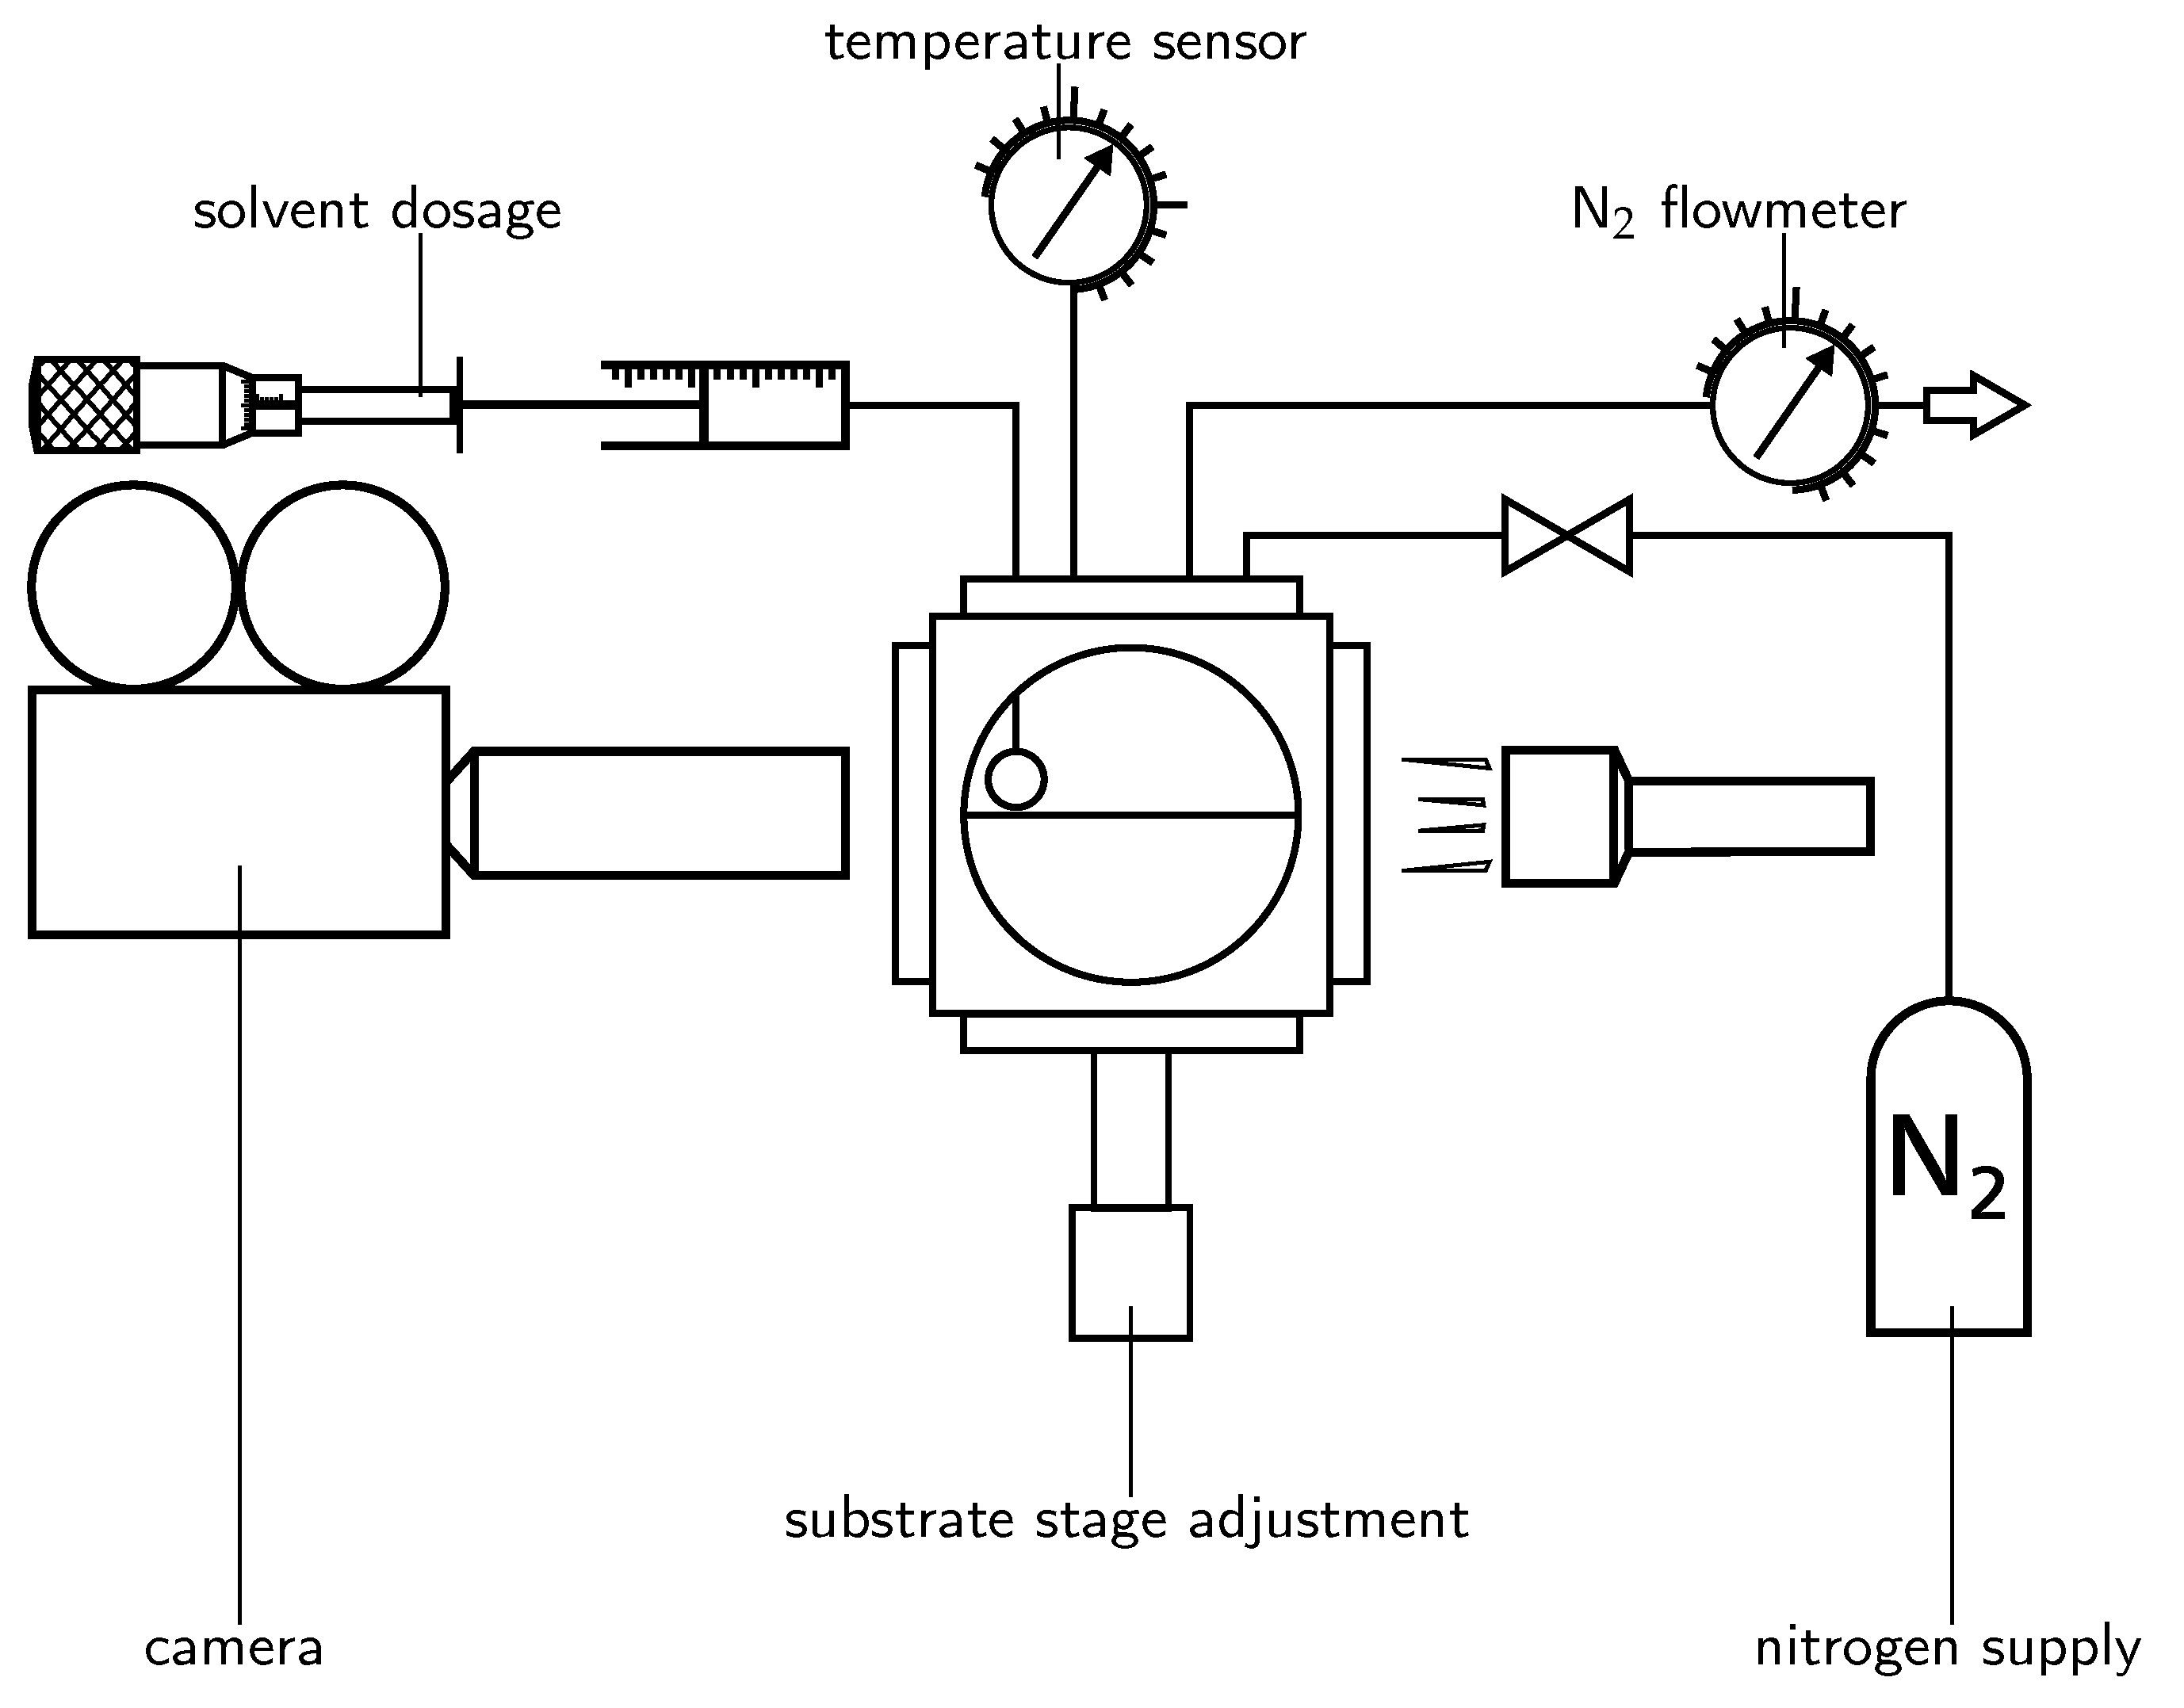
Experiments on dynamic wetting and evaporation are performed in a closed test cell which is flushed with nitrogen before and during the experiments (see Figure 1). Inside the test cell, hanging droplets are generated by pushing solvent through a PTFE sheathed metal cannula. Solvent displacement is realised by a syringe and a micrometer screw. The distance between cannula and substrate can be adjusted and thereby the initial solvent droplet diameter can be controlled. For the experiments presented in this work, the distance is set to be which results in initial droplet volumes of . As soon as a sufficient amount of solvent has flowed through the cannula, the droplet tip reaches the surface and spontaneous wetting of the solvent droplet starts. At contact, a capillary wave forms and propagates towards the cannula. As soon as the wave reaches the cannula, the droplet detaches and relaxes without the influence of the cannula. The first milliseconds of wetting are shown in Figure 2. On average, each experiment is carried out four times. One exception is the late stage wetting experiment with reduced temporal resolution for −1. This is performed a single time in lack of a sufficient amount of substrates. The temperature inside the test cell was measured to be (20–23) C during the experiments. The wetting process is recorded using a Photron SA-X2 high speed camera at a temporal resolution of 3 , 1 or 20 , depending on the wetting stage. For visualising the droplet shape during spreading, we use a shadowgraphy set-up in which collimated light reaches the camera sensor through telecentric lenses. Only those rays of the originally collimated light that pass through the droplet are refracted and do not reach the camera sensor. The spatial resolution during experiments is /−1. The same set-up is used for the observation of droplet evaporation. Image processing of the wetting (contact angle, contact radius and droplet volume) is performed using in house MATLAB codes.
We use a µsoft expert confocal microscope profilometer from NanoFocus AG for recording the coating surface topography after droplet evaporation. Lateral and axial resolution are /−1 and , respectively. Structure recognition and measurement within the acquired surface maps is performed using in house MATLAB codes together with the ridge detection algorithm of Steger [24] implemented in the ImageJ software by Wagner et al. [25].
3. Results and Discussion
3.1. Wetting
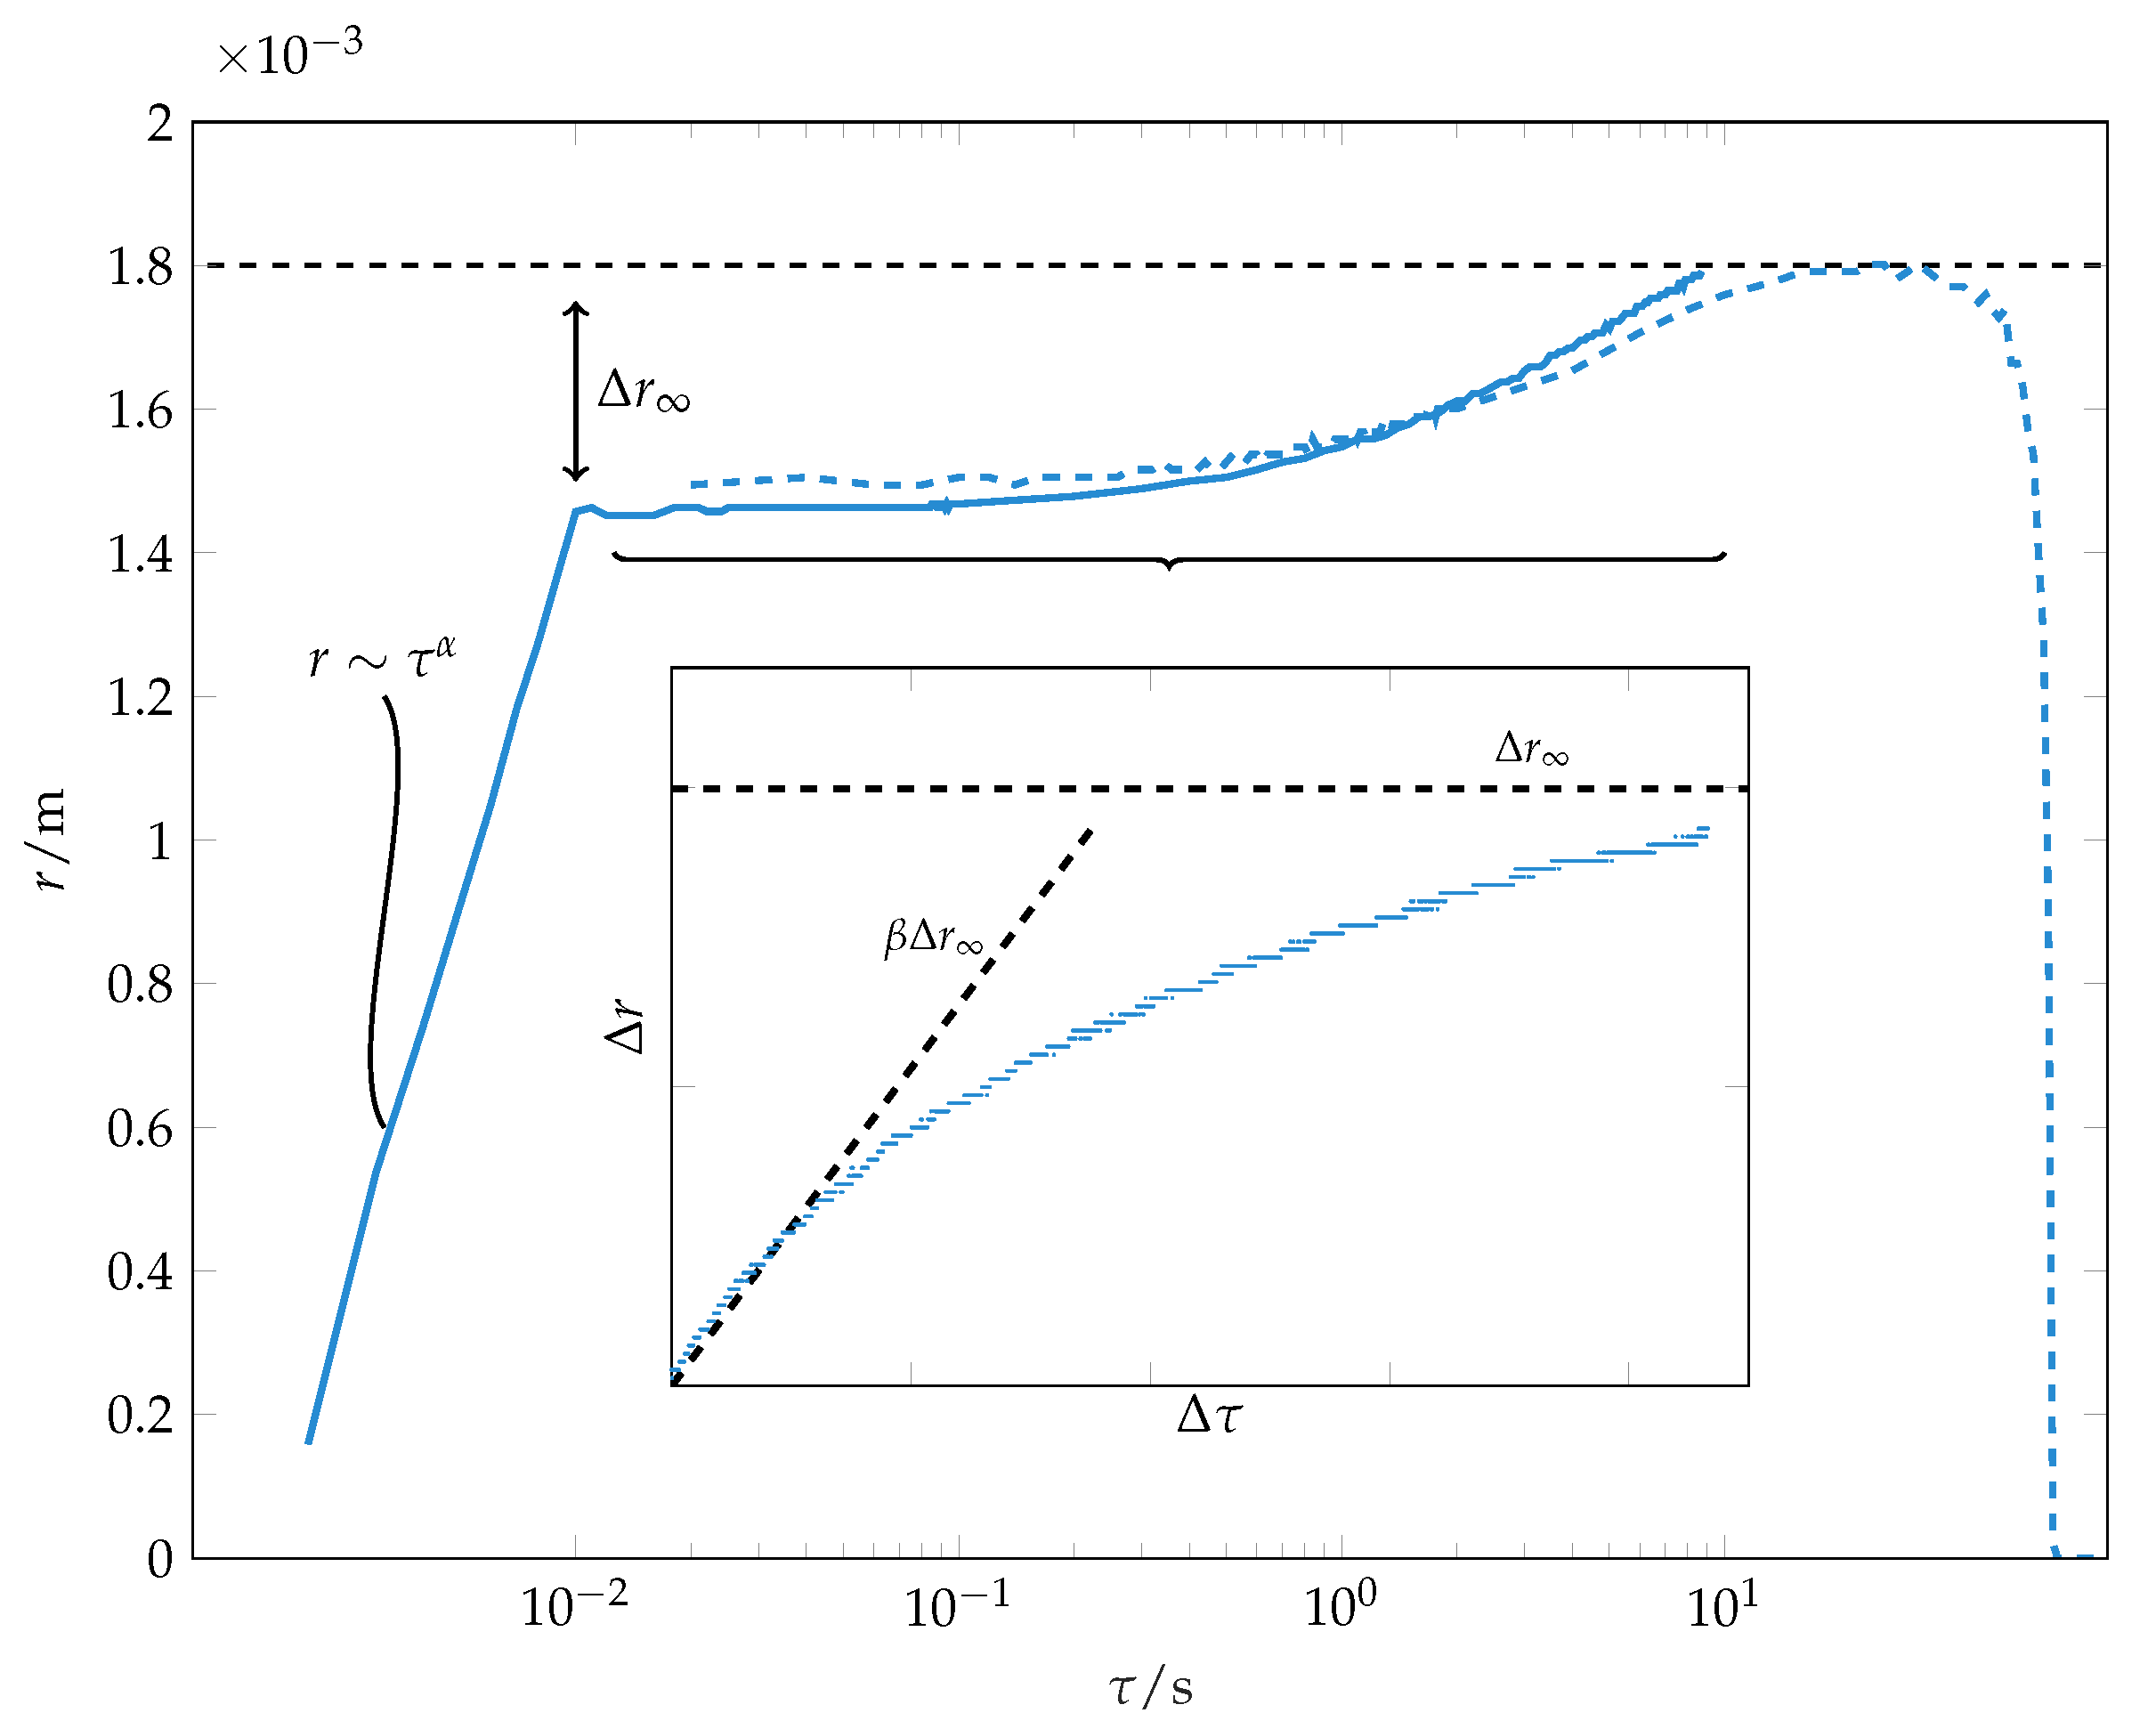
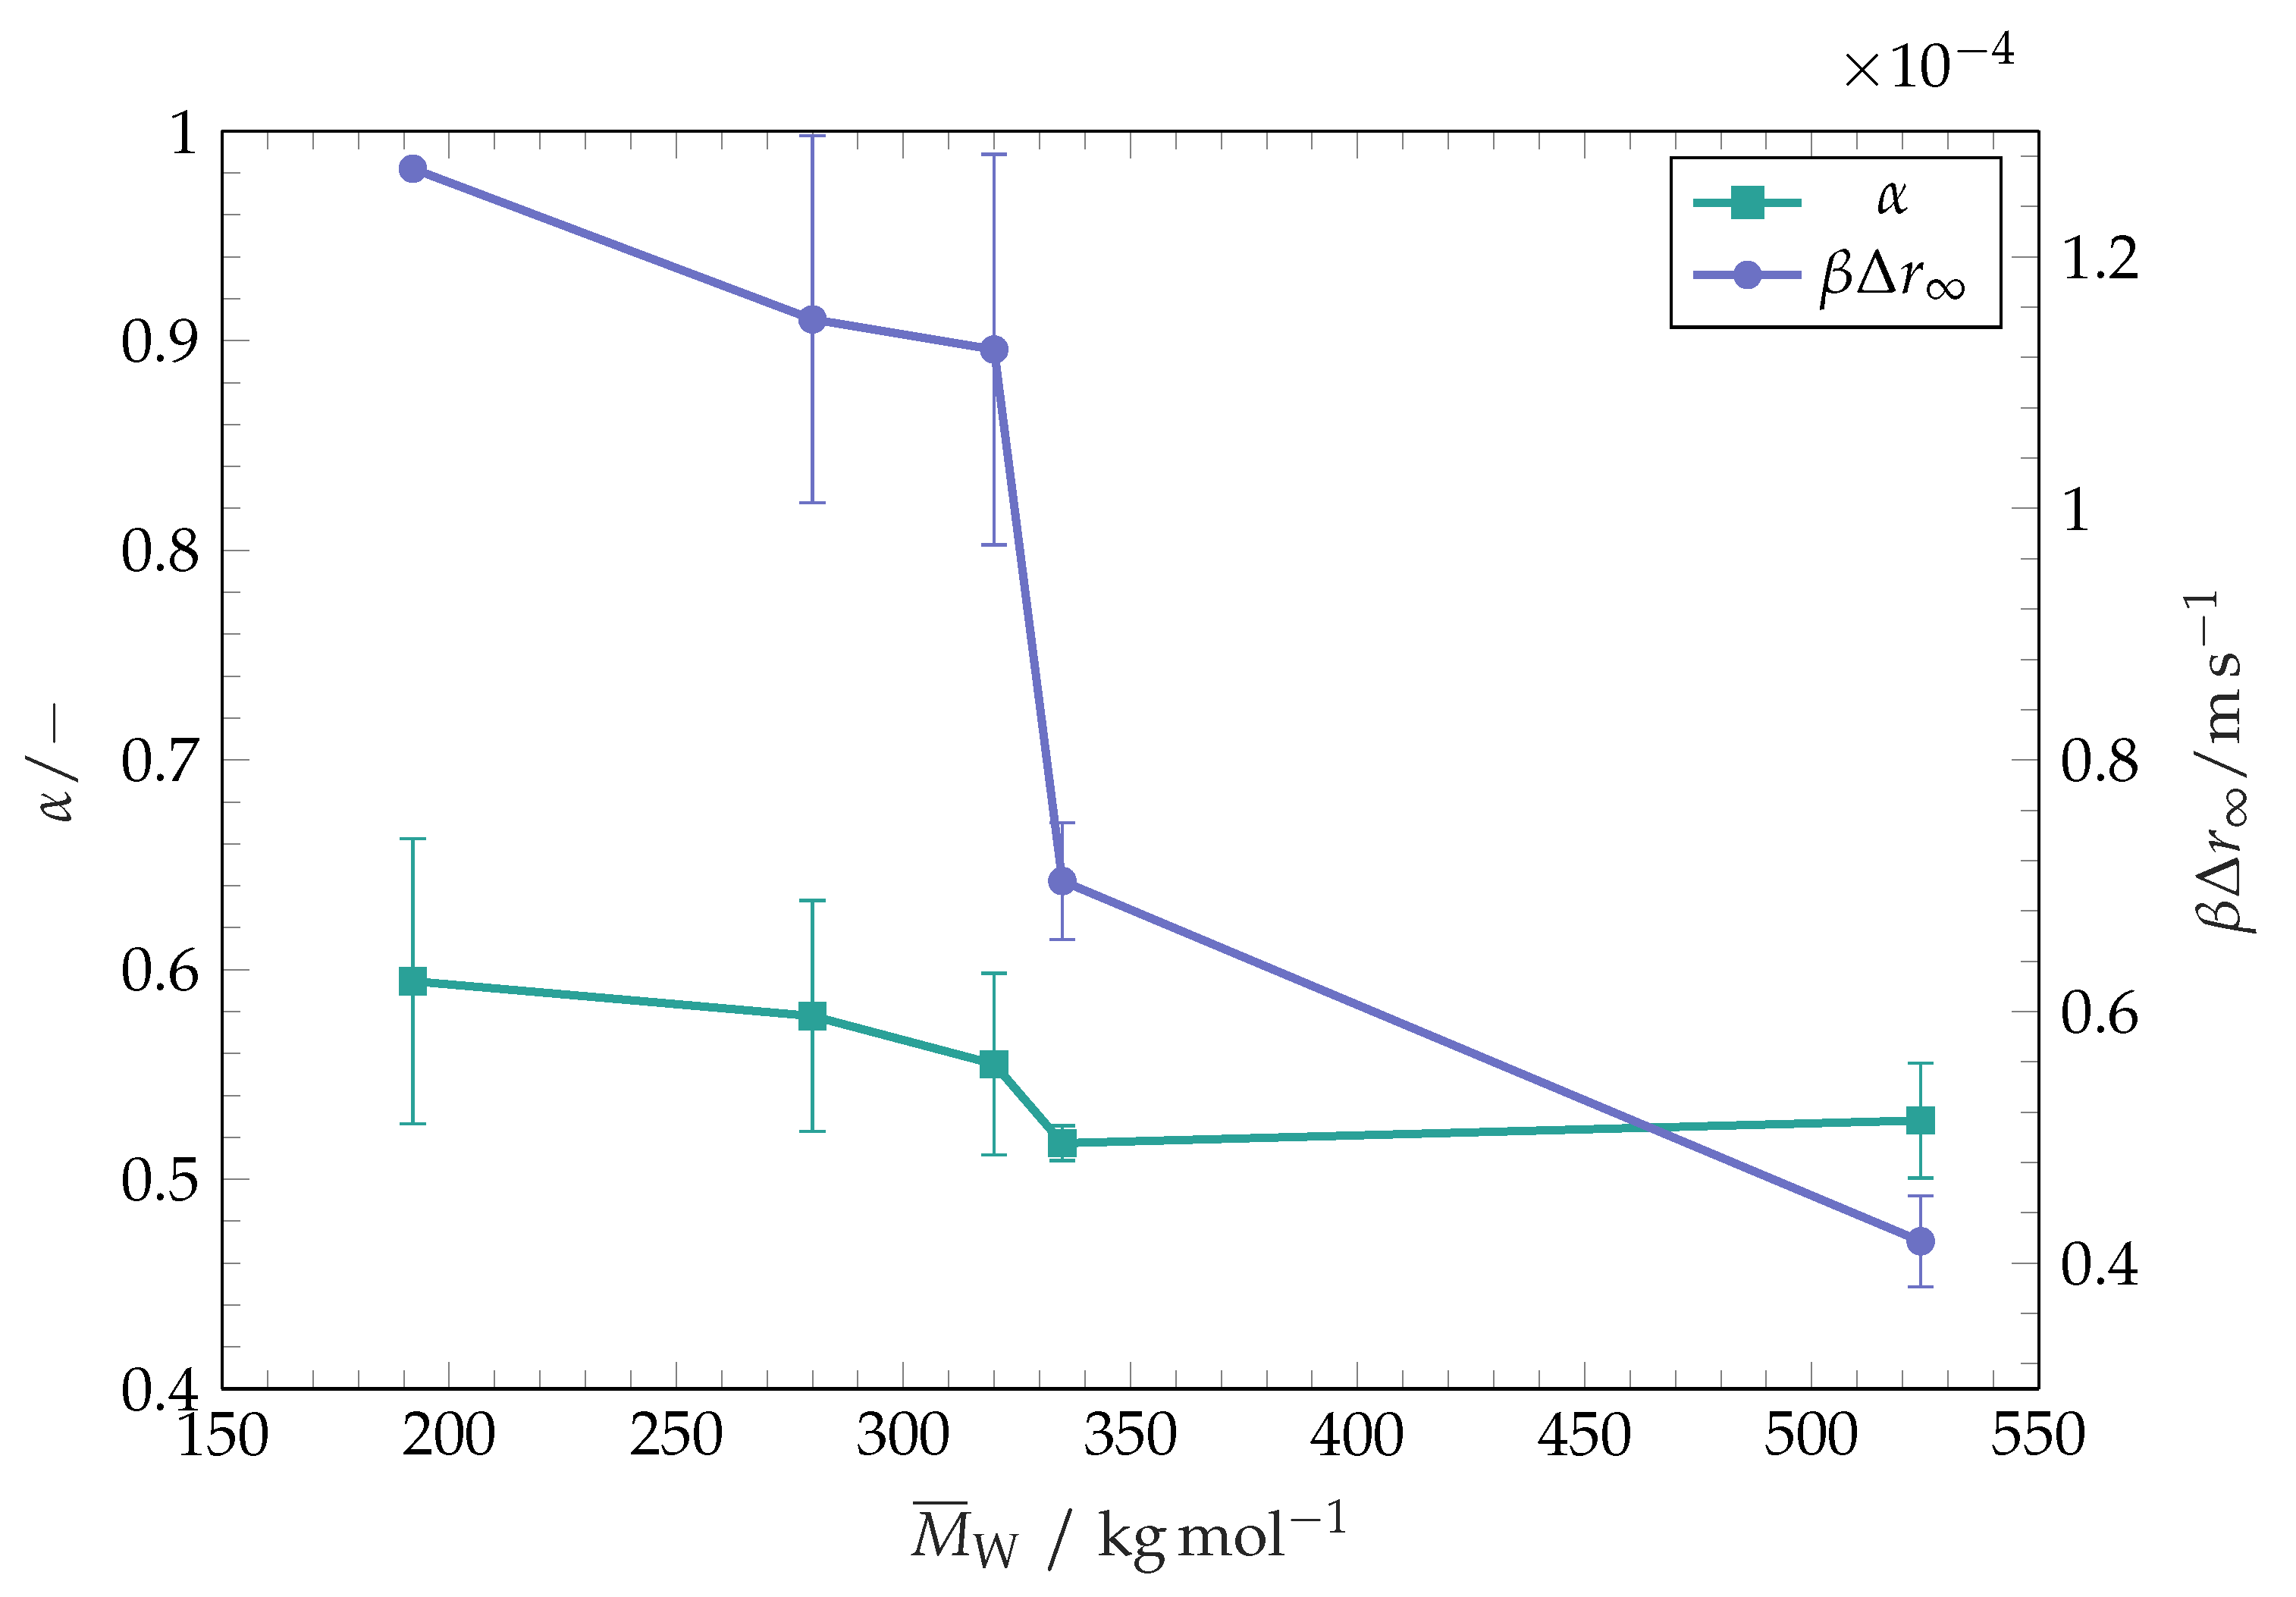
The evolution of wetting radius during spreading and evaporation of a solvent droplet is depicted in Figure 3. After , the first stage of wetting finishes. This agrees with the results of Muralidhar et al. [10] and with the characteristic time of initial wetting estimated by Equation (2), which corresponds to for toluene. It has been reported that even a small inclination of a side view camera results in wrong contact radius measurements for small times with in spontaneous spreading, since the actual droplet foot is concealed by the droplet surface [26]. Typically (1–2) ms before the end of initial spreading, surface waves propagate towards the three phase contact line, which interfere with the spreading mechanics taken into account in scaling laws like Equation (1). In order to suppress the influence of these phenomena on the final result and therefore to minimise the error in experimental determination of , we discard the first microseconds of wetting as well as the last for fitting the wetting exponents . For the initial stage of wetting, we observe the wetting exponents of . They only weakly depend on the substrate polymer within the range of polymer molar masses used in the experiments (Figure 4). From our experiments, we observe a slight decrease in for increasing polymer molar masses, especially for polymers with −1. As the molar mass determines the solubility of the polymer, this result also indicates that the dissolution process does not significantly affect the initial stage spreading and that the time scale for dissolution processes of our coatings is larger than . Wetting exponents exceed the prediction of Biance et al. [3] for liquids on inert surfaces. As already pointed out by Muralidhar et al. [10], a possible release of Gibbs free energy during spreading on non-inert surfaces generates an additional driving force for wetting [27]. The difference in free Gibbs energy for solution processes of polymers in solvents can be expressed by Flory–Huggins theory [28,29]. Accordingly, free Gibbs energy varies with the degree of polymerisation. If the additional release of Gibbs free energy were a dominant mechanism for initial stage wetting, we would have observed a strong dependency of on . This is not the case: the variation of with is comparable with the error bars in Figure 4. The weak dependence of on supports our hypothesis that solution processes do not affect initial stage wetting. Muralidhar et al. [10] reported for the same solvent–substrate combination on thick polymer substrates, which is close to our findings. The trend reported here, however is inverse to the findings of Muralidhar et al. who found a slight increase in with increasing of polymer molar mass.
Beyond the initial wetting stage, we observe further spreading, which is characterised by a much slower dynamics compared to the initial stage spreading (see Figure 3). This stage has not been observed in previous investigations of wetting of thick () polymer soluble substrates [10]. In our experiments, the second spreading phase is responsible for 15% of the final wetting radius, thus approximately for 30% of the wetted area. For this late stage wetting, the spreading does not follow the power law (1).
The spreading during the second phase can be described by an empirical law:
In this, is the difference between wetting radius and the wetting radius at the end of the initial wetting stage. corresponds to a final wetting radius. Note that this is a fitting parameter and not the actual measured final wetting radius. However, this fitting parameter is usually very close to the measured difference between the final wetting radius and the wetting radius at the end of the initial wetting stage, as seen in Figure 3. The parameter characterises the inverse time scale of spreading and has to be fitted empirically. The time instant corresponds to the end of the early wetting stage. The initial contact line speed of this late stage wetting can be used to characterise the late stage wetting dynamics.
The initial wetting speed at the second wetting stage strongly decreases with increasing of the polymer molar mass, as seen in Figure 4. It is known that the dissolution rate of polymers decreases with increasing molar mass [23]. The trend presented in Figure 4 indicates that the initial wetting speed in the second wetting phase increases with increasing of the substrate dissolution rate. An especially sharp decrease in wetting speed for polymers with −1 is observed, with a prominent difference between the substrates having close values of (−1 and −1). The substrate coatings with −1 and −1 differ from each other in two respects (see Table 1): the molar mass distribution of the polymer (or polydispersity) and thickness. Both of these parameters can affect the total lateral dissolution rates of the substrate coating and therefore the wetting dynamics. The substrate coatings with −1 have a narrower distribution of molar mass than the substrates with −1. As reported by Körner et al. [30], the molar mass distribution affects the dissolution rate of polymers. A broader molar mass distribution is accompanied by the presence of long polymer chains which reportedly dominate the dissolution process and limit the polymer dissolution rate [31]. This effect would lead to a higher dissolution rate of the substrate coating with −1 in comparison to the substrate coating with −1 and promote a faster spreading for the polymer with −1, as the polymer with −1 is expected to contain a higher fraction of long polymer chains. However, the substrate with a narrower molar mass distribution (−1) is characterised by a much slower initial wetting speed, which indicates that the presence of long polymer chains does not dominate the dissolution and spreading process in this case. Yet, a broader molar mass distribution is also accompanied by the presence of short polymer chains. Although they do not dominate the overall dissolution process, single chains are prone to enter the bulk solvent early. Those chains affect the viscosity near their original position in the substrate. It has been established that for semi-dilute polystyrene solutions in benzene, which is a non-polar solvent, the viscosity of solutions scales as with c being the volume concentration of the polymer and the dynamic viscosity of the pure solvent [32]. It can be expected that a similar trend is followed by the viscosity of polystyrene solutions in toluene. Therefore, we suggest that the presence of short polymer chains in the liquid does not lead to the change of the wetting behaviour. As seen from Figure 1, the substrate coating with (−1) used in these experiments is thicker than all other coatings (700 thick in comparison to approximately 600 ). We suggest that this difference could be responsible for longer absolute dissolution times of the coating and lower late stage wetting speeds. We note that the qualitative behaviour of lower late stage wetting speed for high molar mass substrates holds for both groups (narrow and broad molar mass distribution) of polymers presented within this work.
From the results presented in Figure 4, it is evident that the late wetting stage is governed by the dissolution rate of the polymer coating. Although this stage has not been observed by spreading of toluene over thick polystyrene substrates [10], a solubility-governed wetting dynamics has been reported for wetting of substrates coated with thin maltodextrin layers [11,12,33] and thin poly(dimethylacrylamide) layers [34,35,36] by water. In these works, however, no correlations for the spreading radius as a function of time during the solubility-governed wetting stage have been suggested, such as an empirical law suggested in our work (Equation (3)). Instead, Tay et al. [35] and Dupas et al. [11] present their results in terms of the contact angle dependence on the contact line velocity, or on the product of the contact line velocity and the coating thickness. The relationship between the dynamic contact angle and the dimensionless contact line speed (capillary number) during the late stage wetting derived from our experiments is plotted in Figure 5. It is seen that the relationship is approximately linear in the studied parameter range. Dupas et al. [11] and Tay et al. [35] report dynamic contact angles over three orders of magnitude of contact line velocity. Within this wide range of velocities, Dupas et al. [33] report a kink in contact angles versus contact line velocity dependence for high contact line velocities in a dry atmosphere. Dupas et al. [33] relate this kink to the glass transition which takes place in front of the contact line for low contact line velocities in a dry atmosphere and is not observed within our late stage wetting experiments. Further contact angle investigations at high wetting speeds can be performed in the future to check whether the system toluene-polystyrene shows similar behaviour. Additionally, future experiments on polystyrene coatings with multiple thicknesses would elucidate if the system polystyrene-toluene shows a scaling of contact angle in , as it does for the system water–maltodextrin [11,12,33]. The case studied by Muralidhar et al. [10] would correspond to the limit of thick substrates.
The vertical position of the lines in Figure 5 and their slopes are different for different substrates. However, the results do not allow to derive any clear trend.
The late stage of spreading is accompanied by evaporation of the toluene [10,37,38]. The mass loss by evaporation is expected to affect the wetting dynamics [14], in addition to the influence of the dissolution process on wetting and spreading. The dissolution of coating polymer into the drop together with evaporation of solvent cause a change in properties of the liquid. These changes are expected to be differently pronounced at different positions within the droplet. From studies on evaporation of sessile droplets on inert surfaces, it is known that the evaporation mass flux is nonuniformly distributed across a droplet’s surface [39]. Especially for droplets with low contact angles, the region close to the contact line shows a high evaporation flux. This drives an internal flow which transports bulk fluid to the contact line [40]. Both the high evaporation flux itself and the accompanied Deegan flow can lead to an accumulation of polymer near the contact line [15]. As a consequence, the influence of dissolution on late stage wetting dynamics is supposed to be especially strong. The exemplary literature data presented in Table 2 demonstrate that the polymer concentration has a weak impact on surface tension for concentrations of up to 30 , but a distinct influence on the viscosity of the spreading liquid for polystyrene of chain lengths within the range used in this work. It should be noted that the capillary number in Figure 5 has been computed based on the properties of pure solvent. Using a capillary number based on (presently unknown) local properties could affect the dependencies shown in Figure 5.
3.2. Evaporation
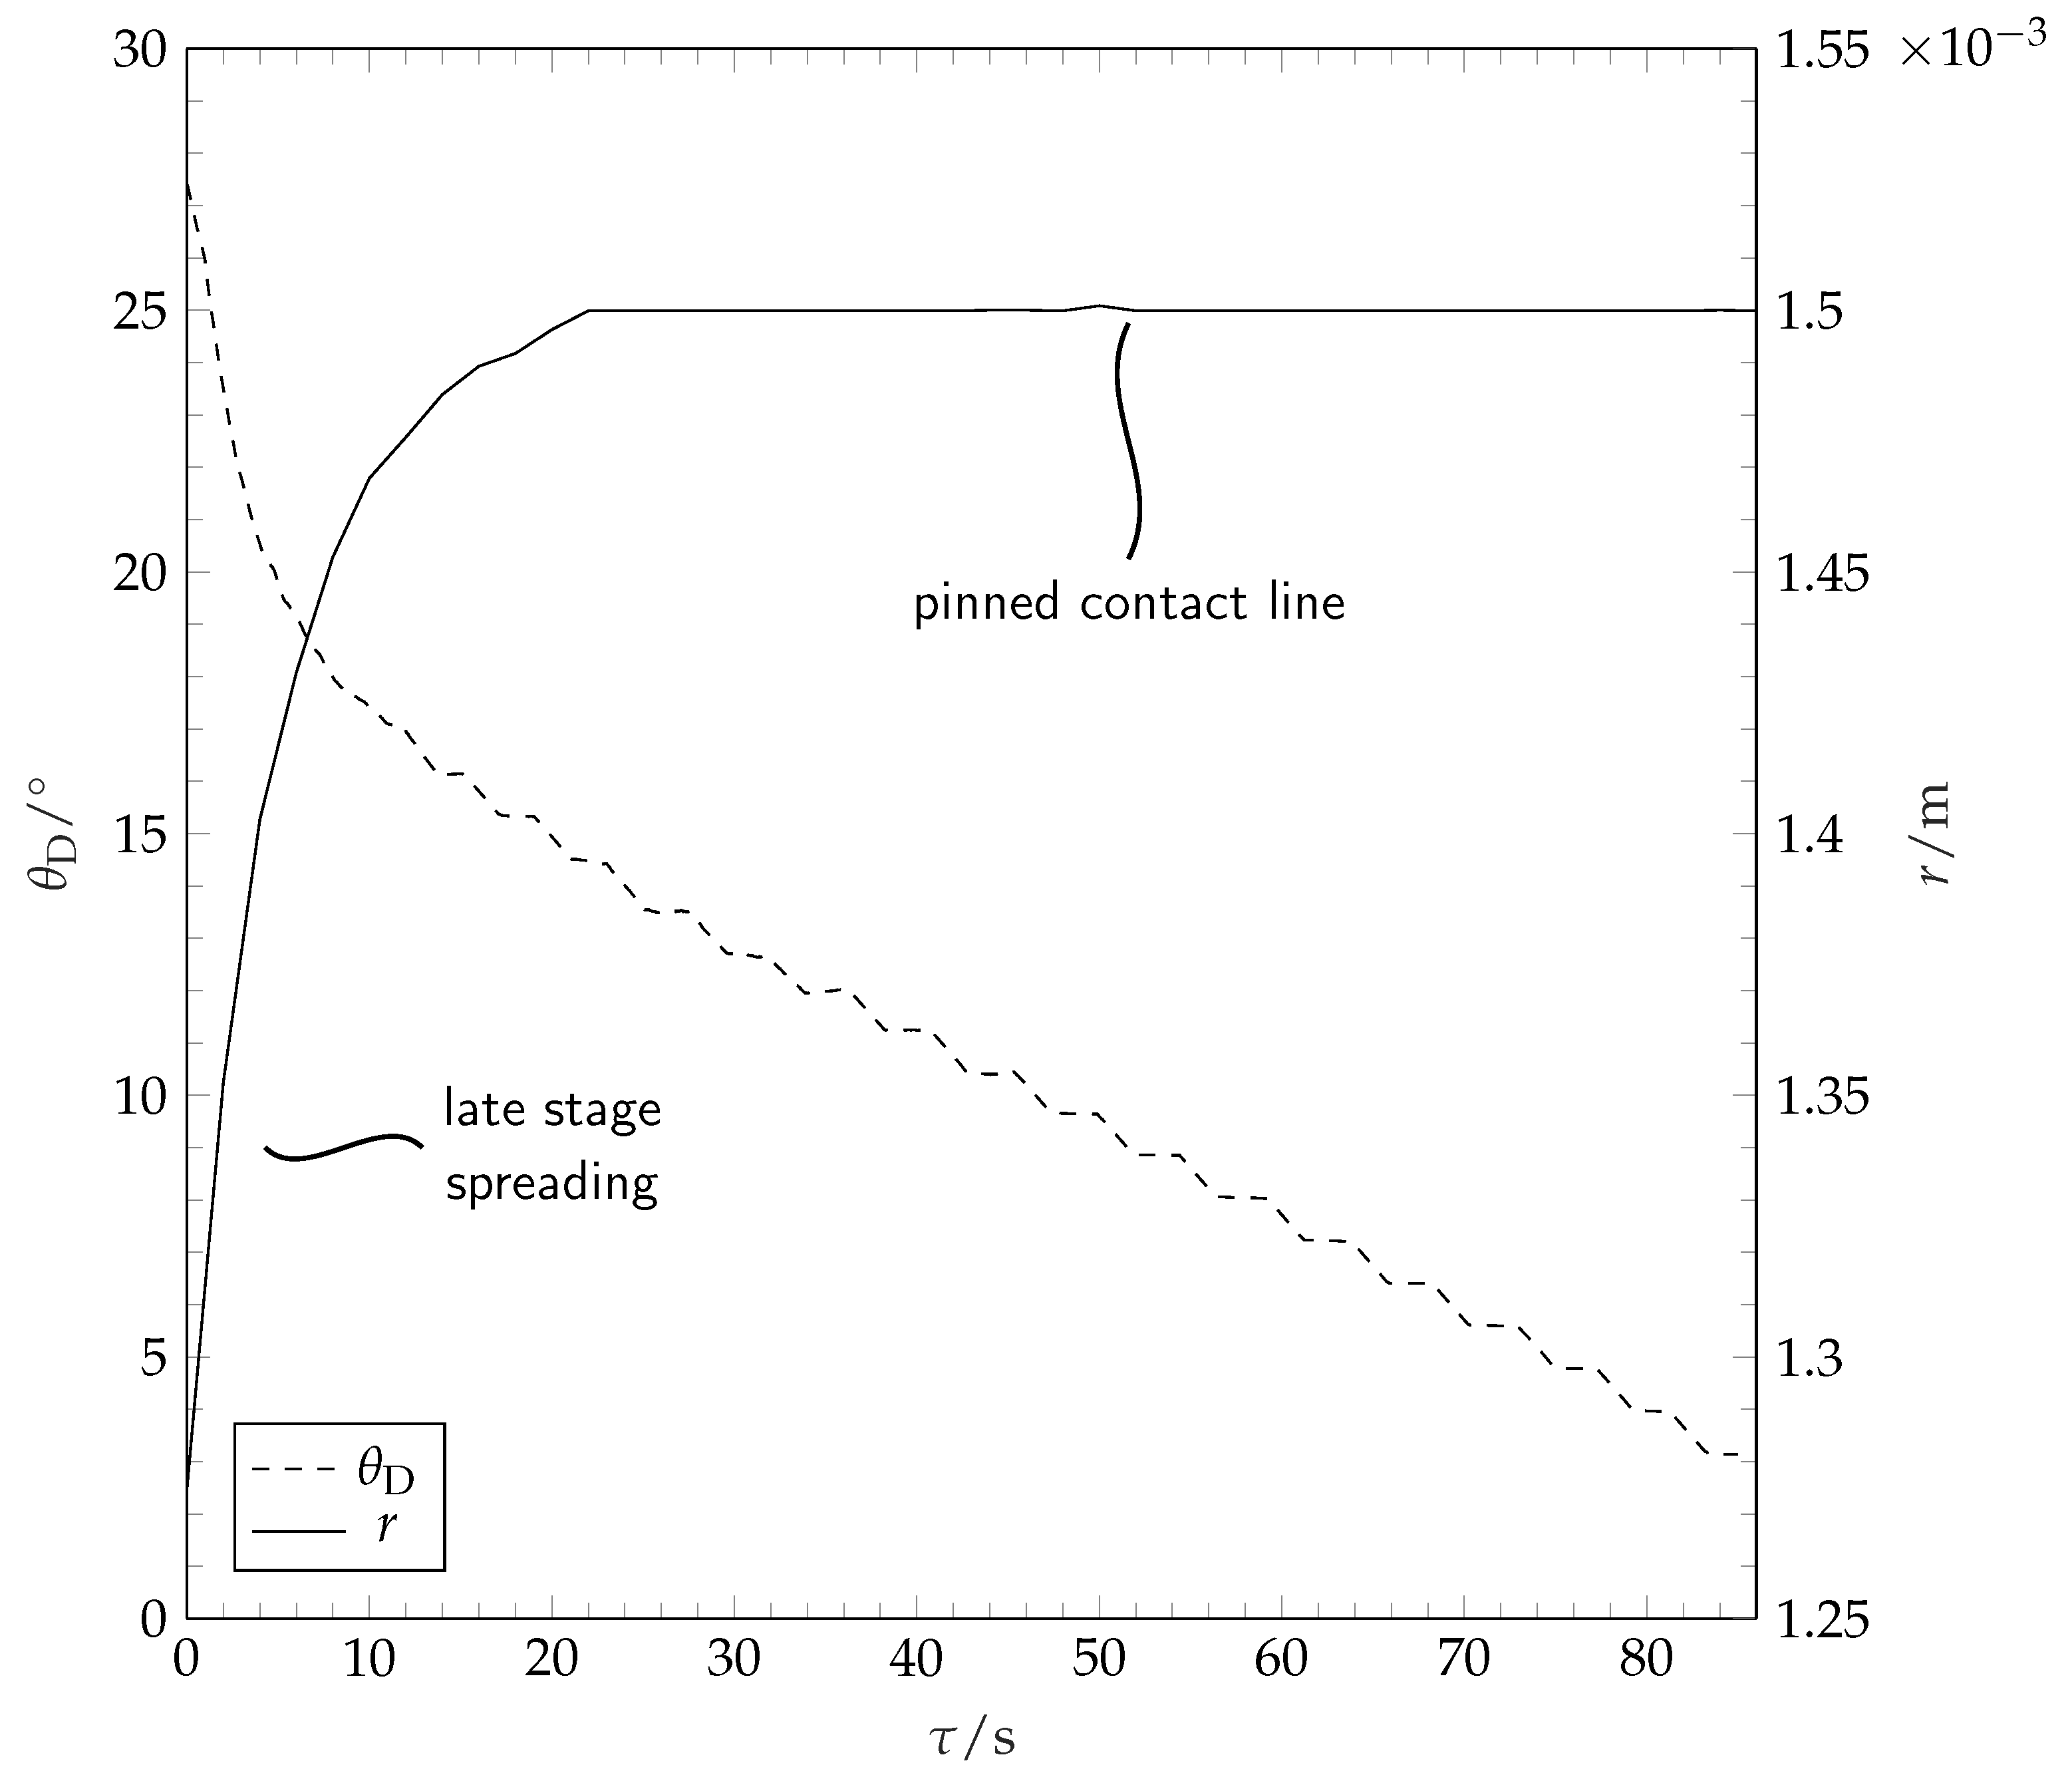
During and after spreading, the solvent droplet evaporates into the dry nitrogen atmosphere. The contact radius and the contact angle during these stages are depicted in Figure 6.
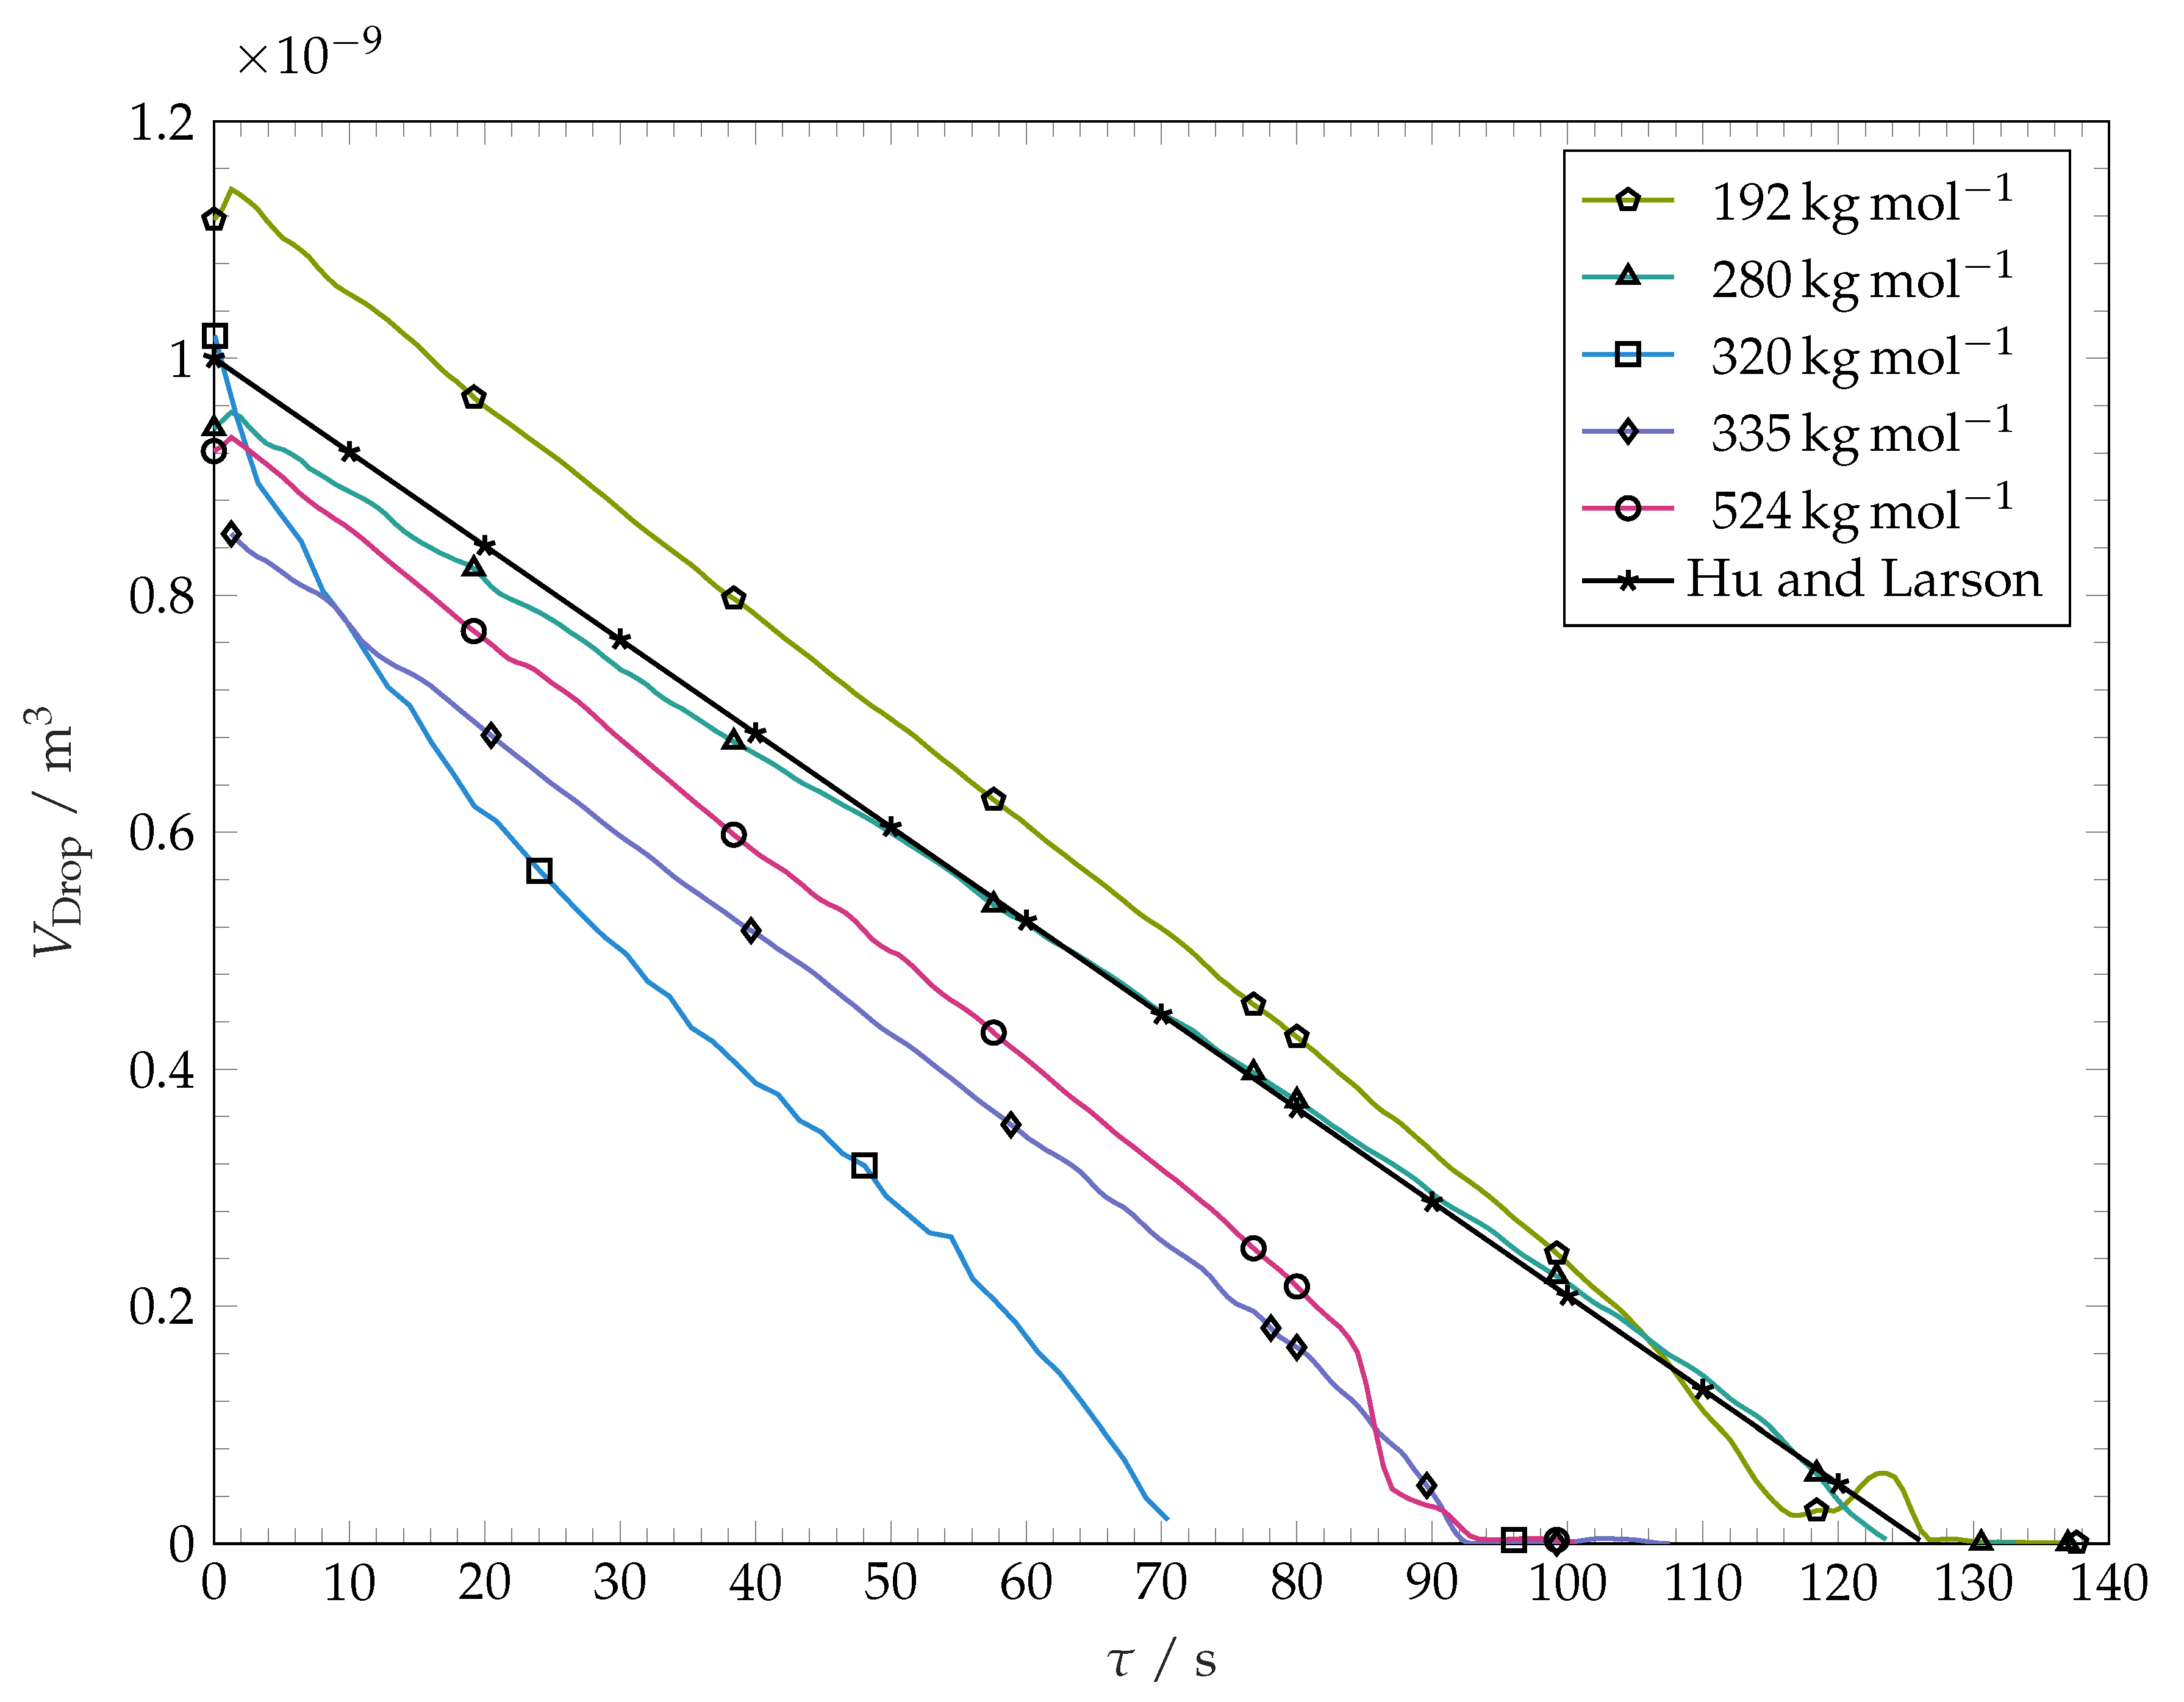
After reaching the maximum spreading, the solvent droplet contact line remains pinned. The decrease in solvent droplet volume during this stage of constant contact radius results in a linear decrease in contact angle until the contact line depins. The contact angle prior to depinning lies well below 2. During the final stages of evaporation, the droplet contact radius shrinks. Because of optical limitations, the receding contact angles, as well as the contact angle and the contact radius during the final stages of evaporation cannot be measured by our method and are not reported in this work. The volume evolution of the drop during evaporation is shown in Figure 7. It is seen that the volume decreases approximately linearly with time. The evaporation rate does not vary substantially with variation of the molar mass of the coating. The curve for −1 is an example for the sensitivity of droplet evaporation experiments on droplet spreading. The drop spreading over this substrate resulted in an unusually high spreading radius within this particular experiment, leading to a higher surface area of the droplet and therefore higher total mass loss per time.
For contact angles below 40, the rate of the evaporation mass loss for sessile droplets of pure liquids is nearly independent from the contact angle and can be predicted using the relation [39]
with D, H and being the wetting fluid’s vapour diffusivity in the gas, the relative vapour pressure in the ambient air, and the vapour saturation concentration at the temperature of the liquid–gas interface, respectively. The black line in Figure 7 represents the computed volume of evaporating sessile droplet having an initial volume of 1 mm3. with the evaporation rate determined from Equation (4). We use the material properties of pure toluene at : m2s−1 and as derived from the work in [37]. As the test cell is flushed with nitrogen before and during experiments, we set . Equation (4) predicts a linear decrease of droplet mass (and thereby volume) with time. This prediction agrees well with our experimental findings. Within Figure 7, it can be seen that evaporation kinetics predicted from Equation (4) is close to our experimental findings. This confirms that the presence of polymer inside our droplets does not influence the evaporation strongly. Additionally, this serves as evidence that the weak nitrogen flow through the test cell does not enact a strong convective evaporation. However, the most of our evaporating drops show a slightly larger rate of the volume loss than predicted by Equation (4). This could be due to the chosen coefficient D, which according to [37] fluctuates within 4 by up to 10%.
3.3. Surface Structure
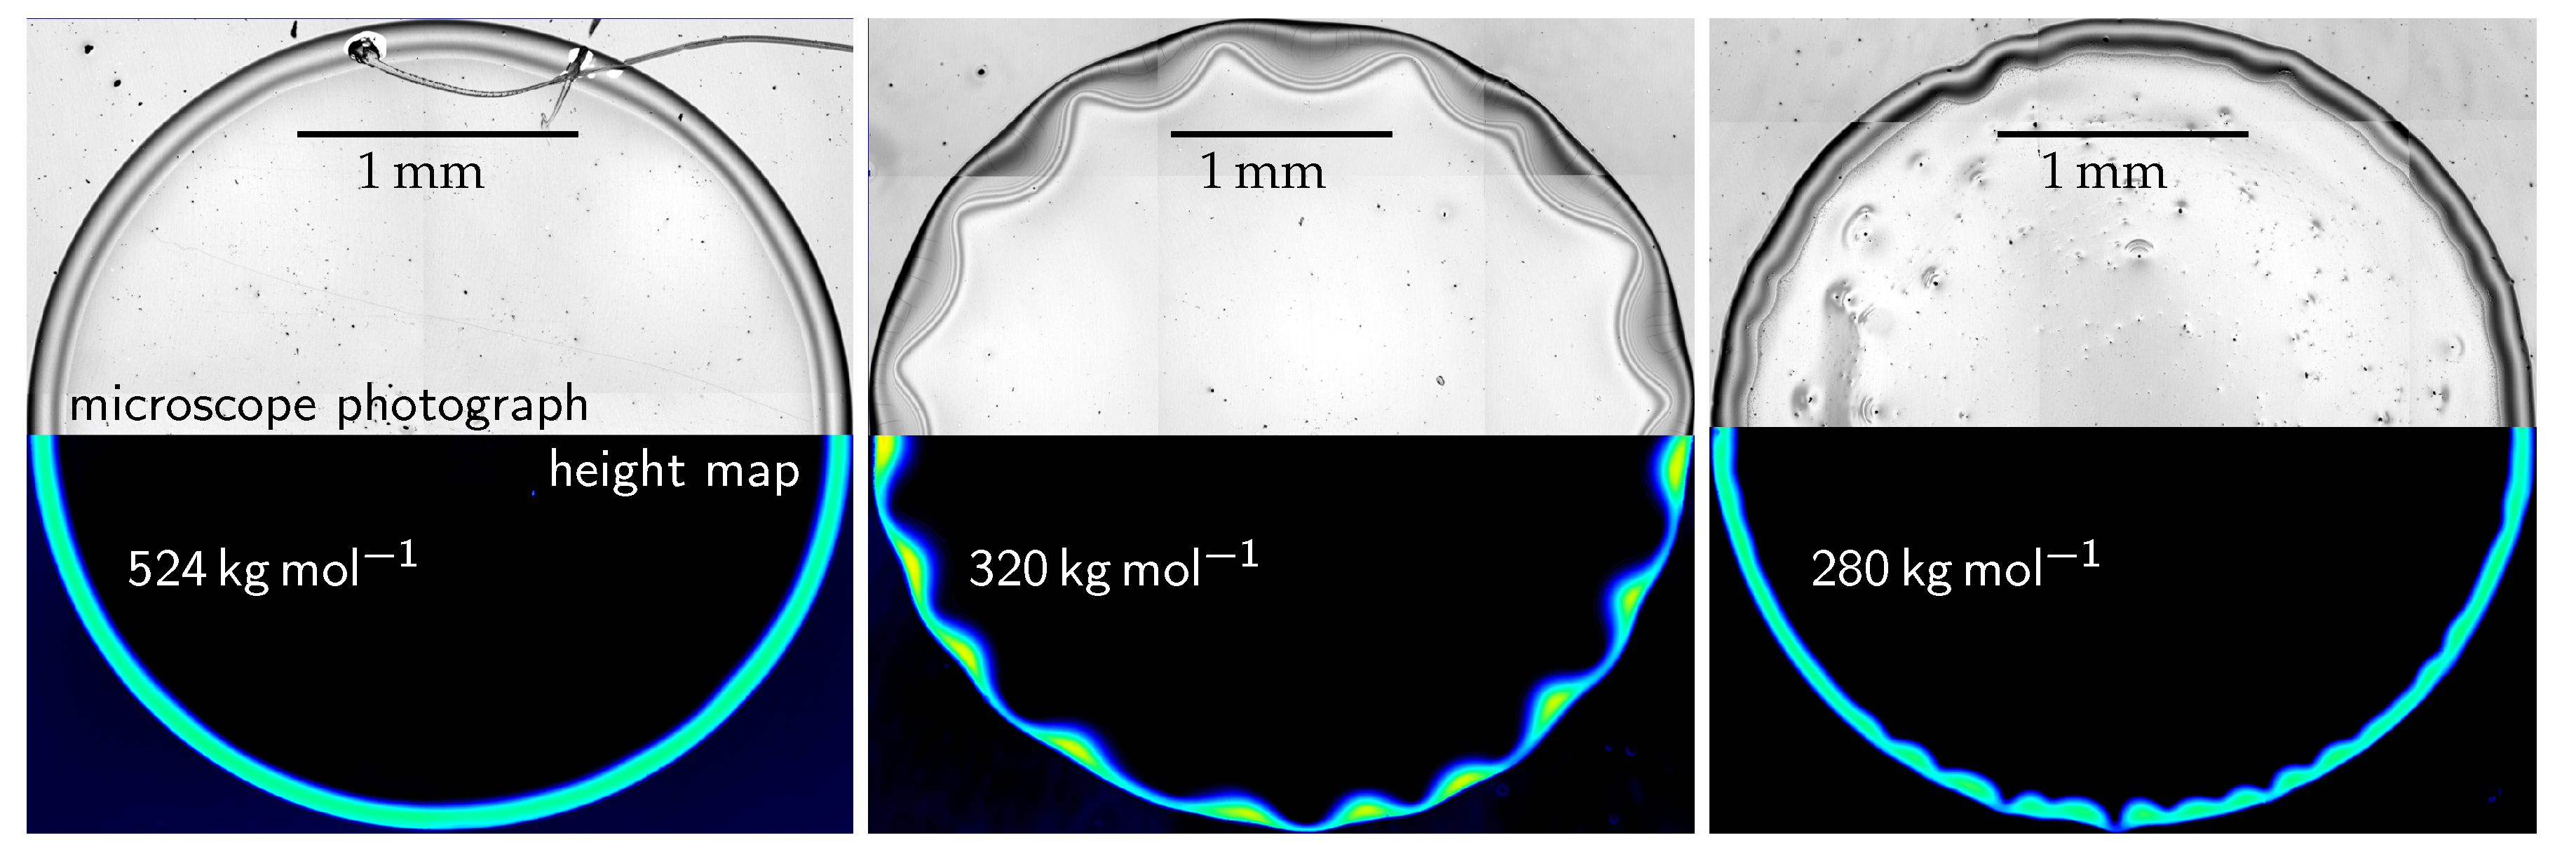
The late stage of spreading and evaporation processes are accompanied by mass transport between the solvent and polymer coating. Solvent molecules penetrate into the polymer matrix and swell it, thereby softening the substrate. Single polymer chains or clusters dissolve into the bulk fluid. Evaporation induced flow inside the droplet transports the dissolved polymer molecules through the solvent. Evaporation of solvent leads to an increase of the local concentration of polymer. If the rate of evaporation overcomes the diffusion of bulk solvent into the areas of increased local polymer concentration, that local polymer solution becomes highly viscous and eventually solid (glassy). As Corneliussen et al. [42] report the interaction parameters of for the system toluene-polystyrene, the process of solidification is assumed to be smooth. Sudden changes in phase or physical state (as seen in precipitation processes or spinodal segregation, e.g.,) are not expected [43]. This smooth solidification process is assumed to occur mainly within areas of high evaporation rates and can therefore lead to a local increase of coating thickness. The structure of the polymer coating after complete drop evaporation for different molar masses is shown in Figure 8. Within our experiments, we observe the formation of circular structures which resemble coffee rings. For the well known experiments with volatile droplets of suspensions on inert surfaces, such structures result from a radial flow towards the contact line, where the evaporation rate is the highest [40].
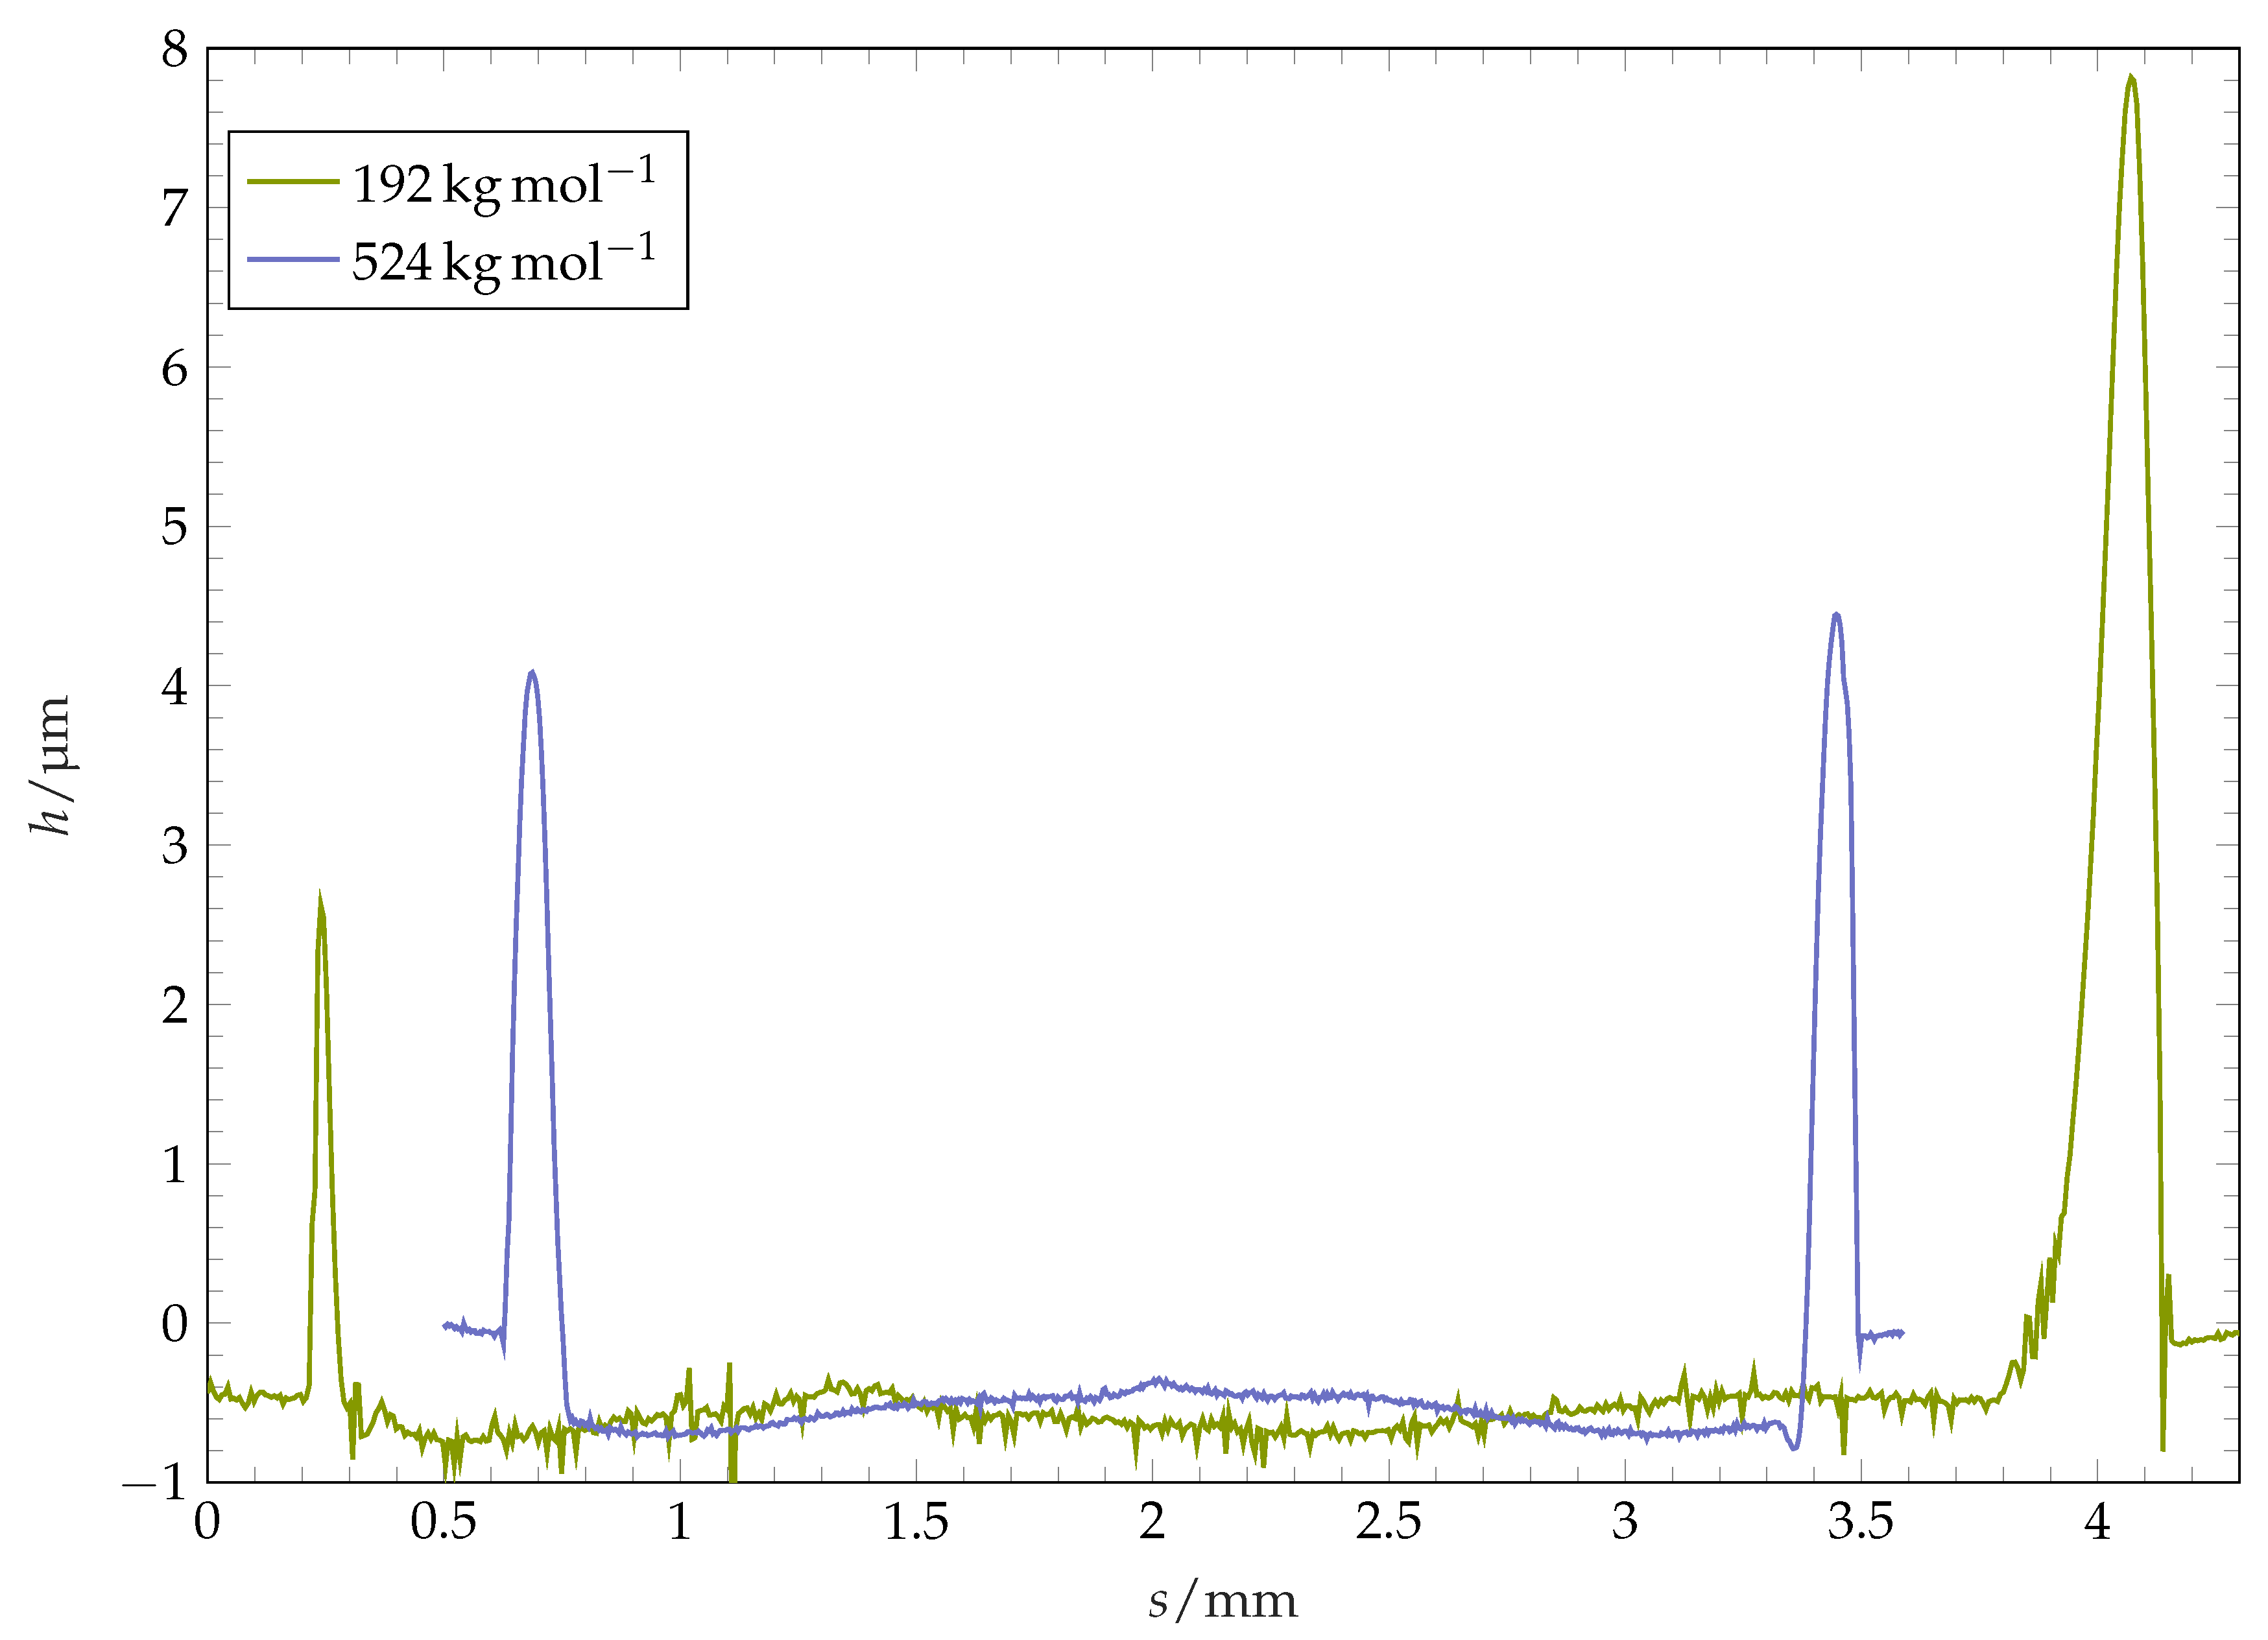
In context of soluble surfaces, further mechanisms can contribute to the formation of the resulting structure. Bonaccurso et al. [15] observe an overall increase of solid phase volume after deposition and drying of toluene drops on thick plates of polystyrene. They relate this observation to an increase in polymer radius of gyration, which is a measure for the mean distance of monomers to the centre of gravity within a polymer chain. Gonuguntla and Sharma [17] suggest Marangoni- and osmotic pressure-driven flows and the presence of Rayleigh–Benard cells as a cause for their observed poly(methyl methacrylate) surfaces after wetting with multiple solvents. Our circular structures formed at the pinning position have a shape of a ridge. The typical cross-sectional form of the ridge is visualised in Figure 9, where the height profile of the coating along its diameter after the complete evaporation of a drop is plotted. For some of the coatings, this ridge is axially symmetric: the ridge radial position and the ridge height are almost constant over the circumference (see Figure 8, left image). For other coatings, the shape of ridge after the complete drop evaporation is highly perturbed (see Figure 8, image in the middle). The width of the ridge in these cases is distributed highly inhomogeneously along the perimeter, with agglomerates protruding towards the centre of the structure. The polymer mass is highly accumulated within these perturbed regions, which can be observed in form of local maxima of ridge height within the agglomerates. Aside from the fingers, the ridge consists of thin, comparably low strands.
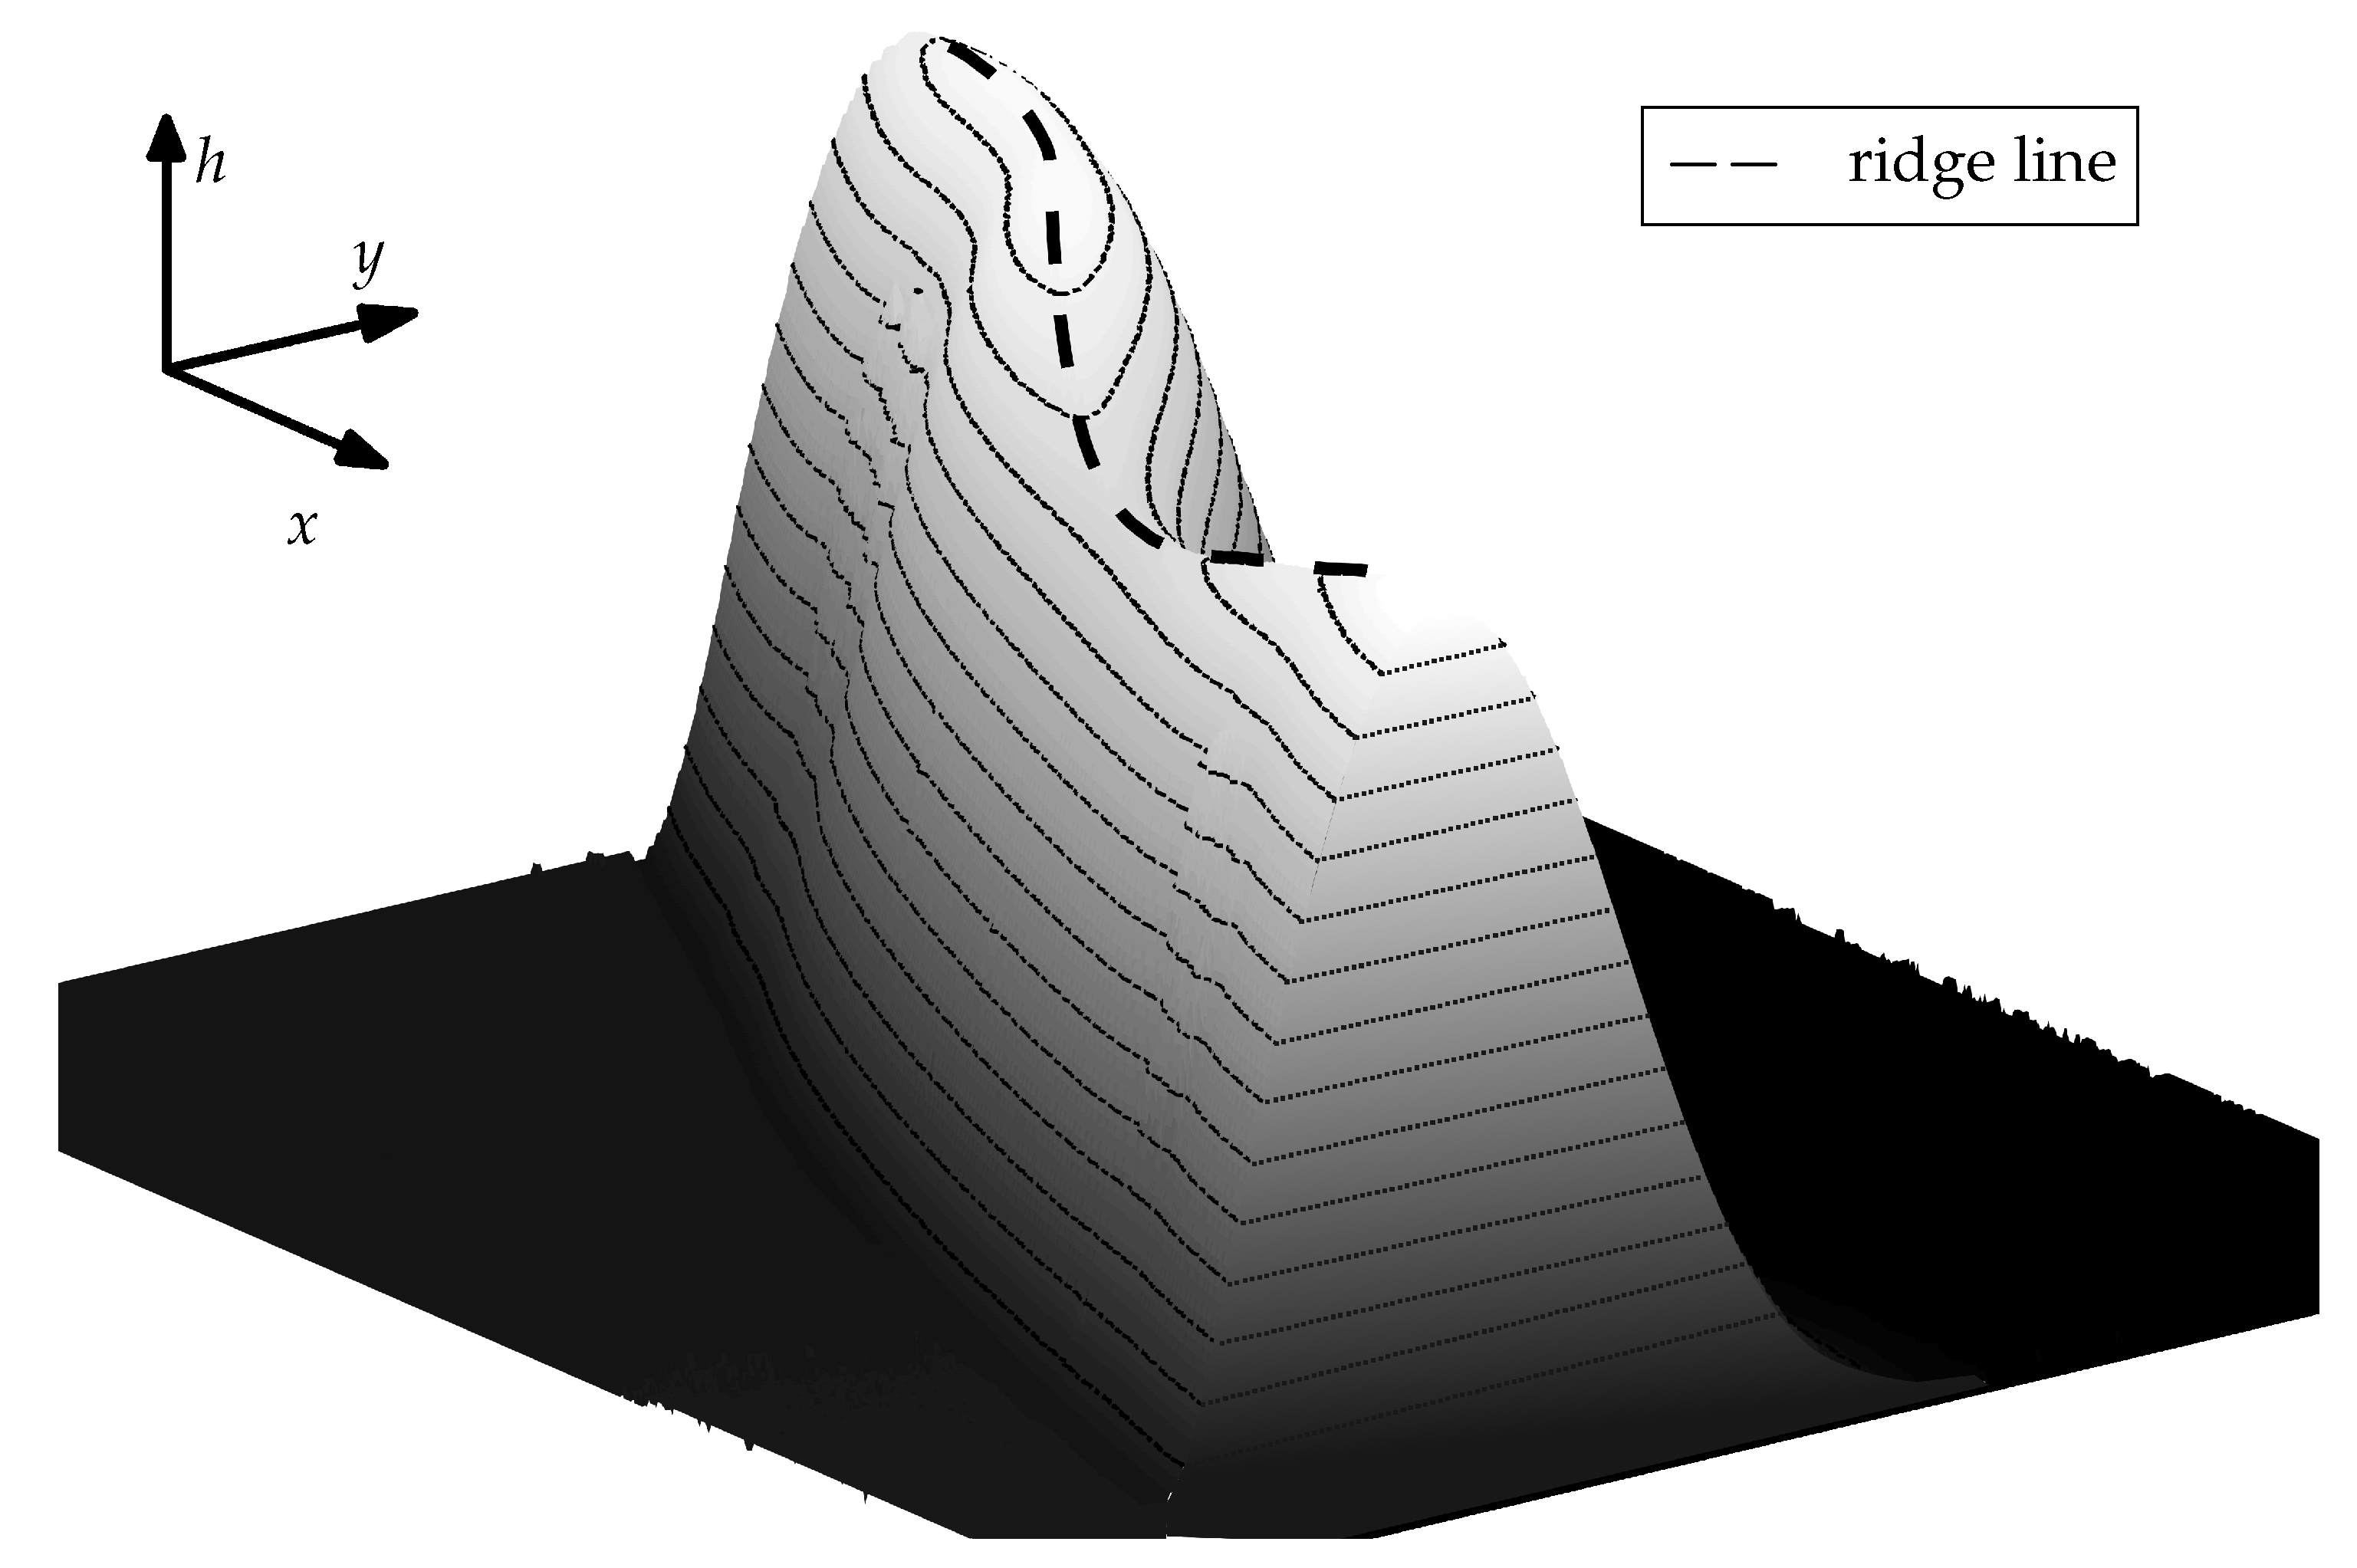
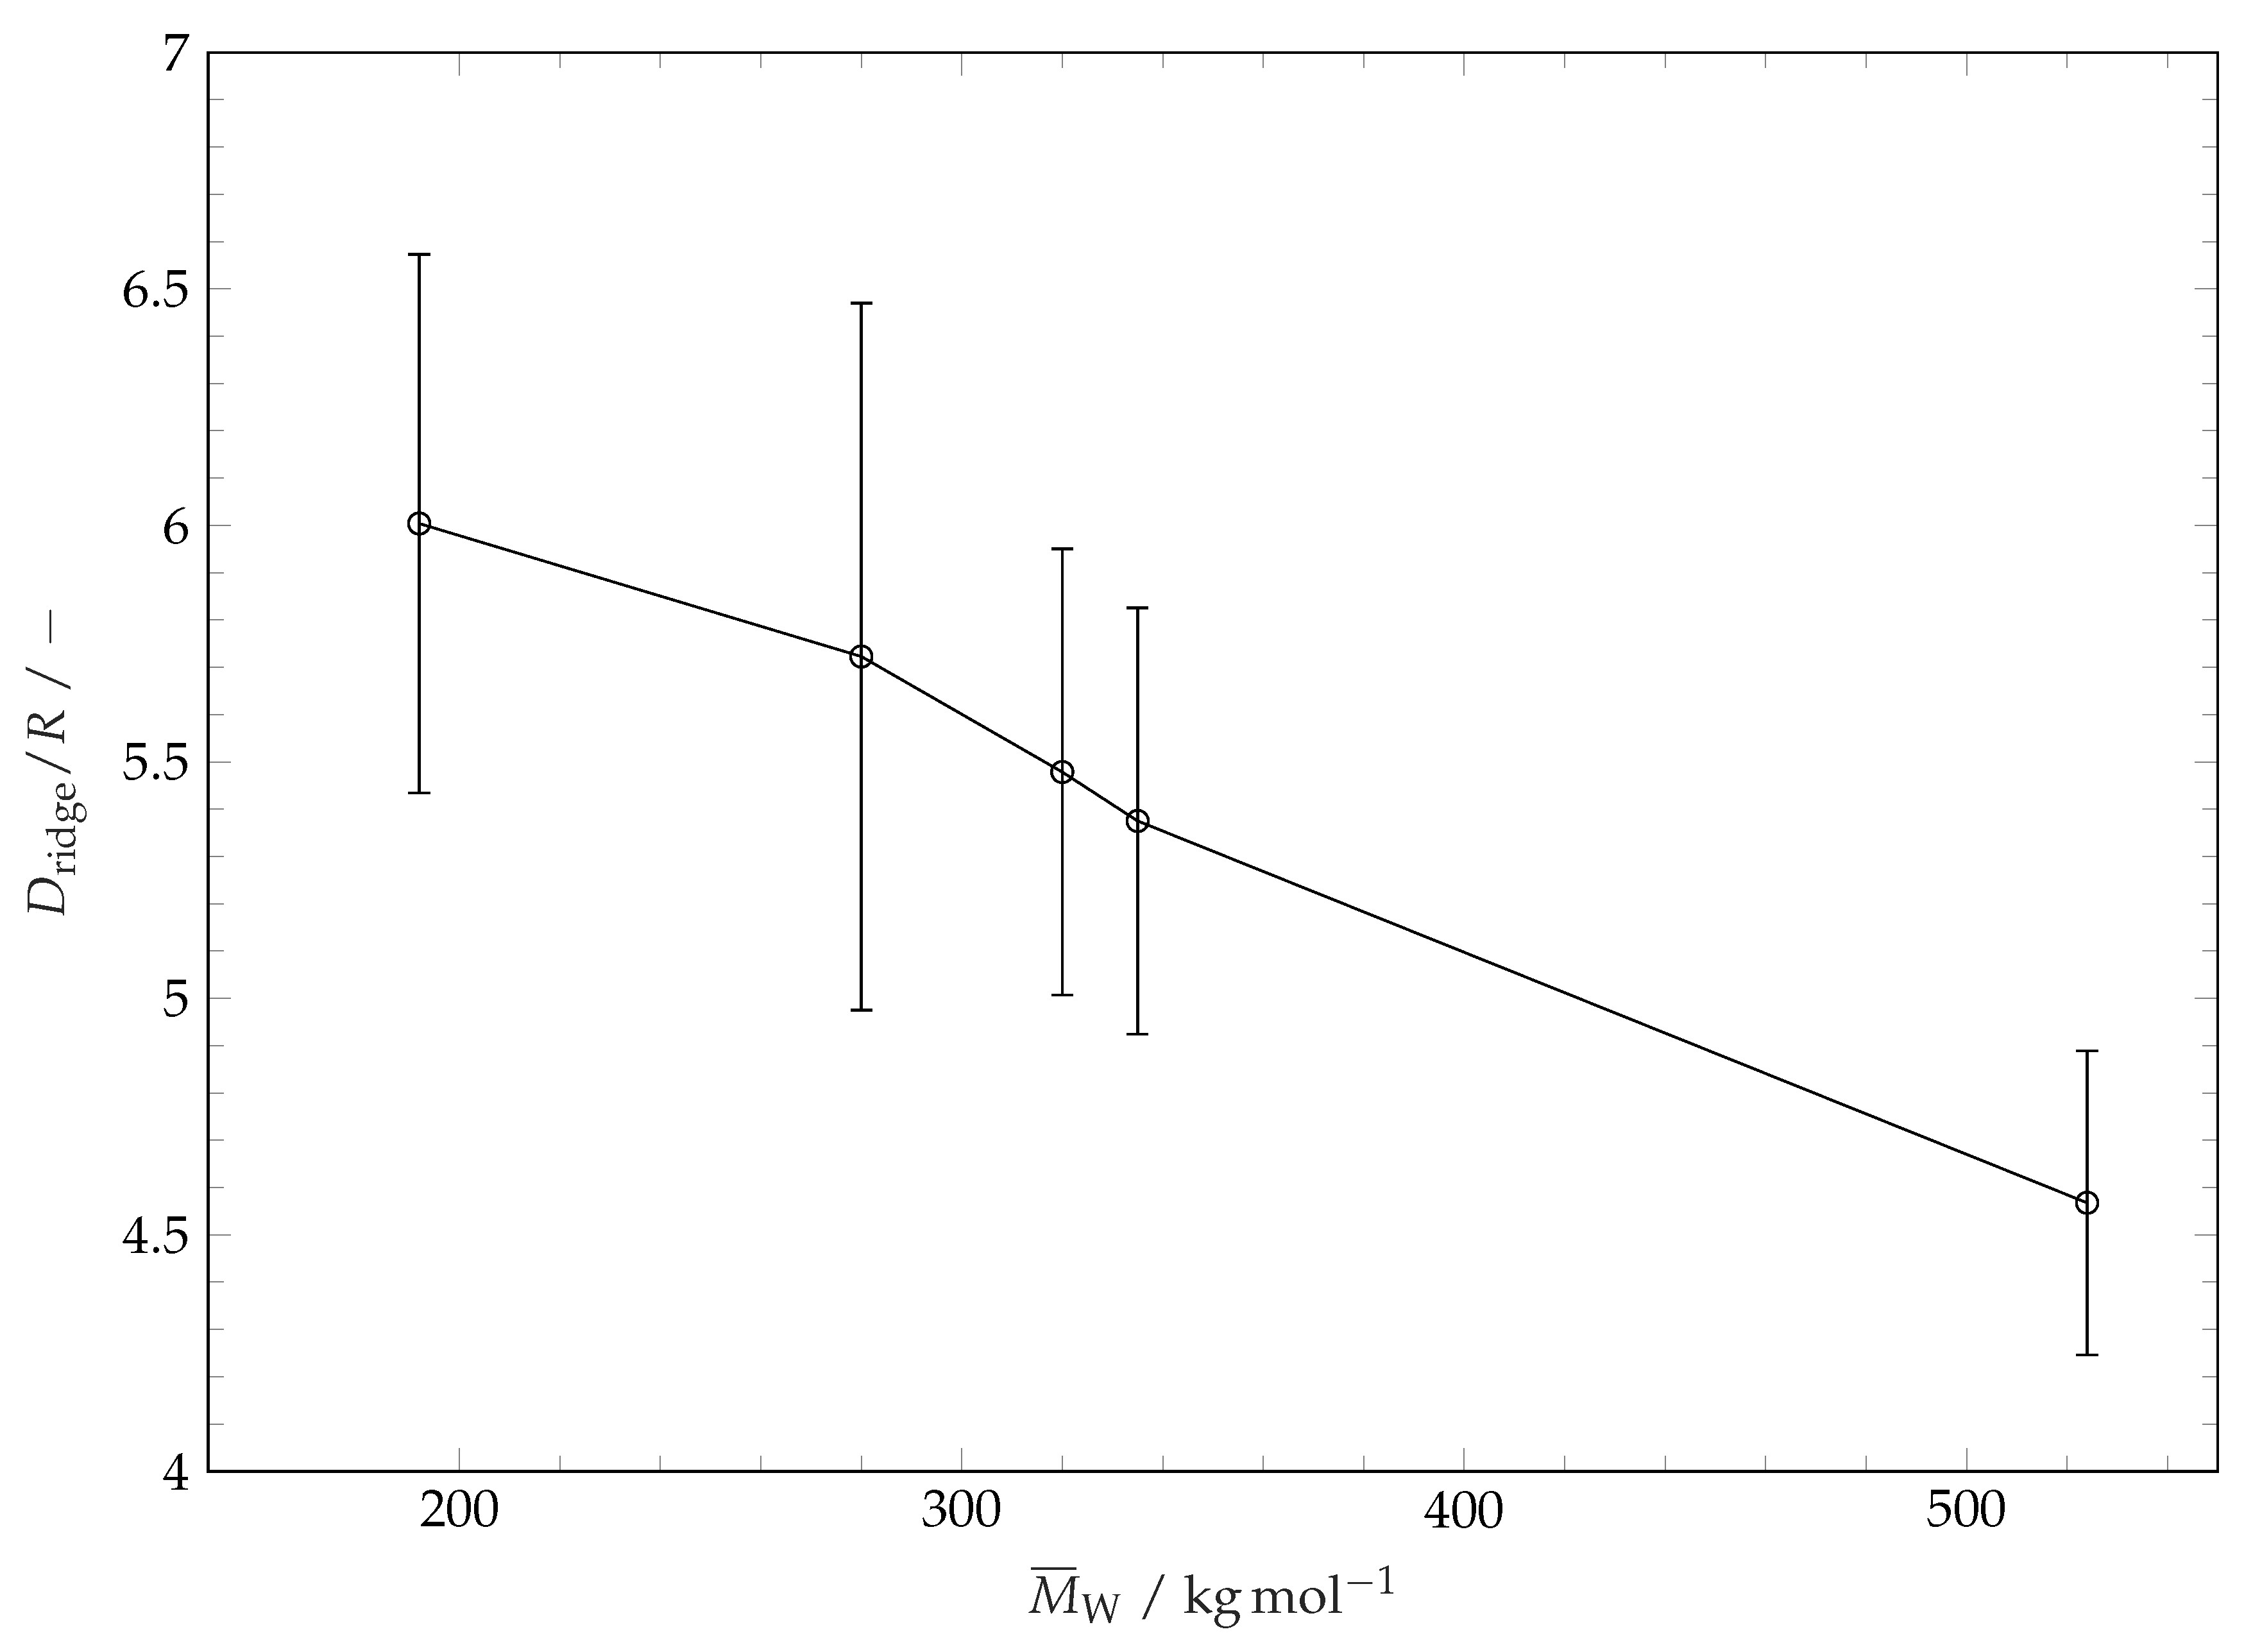
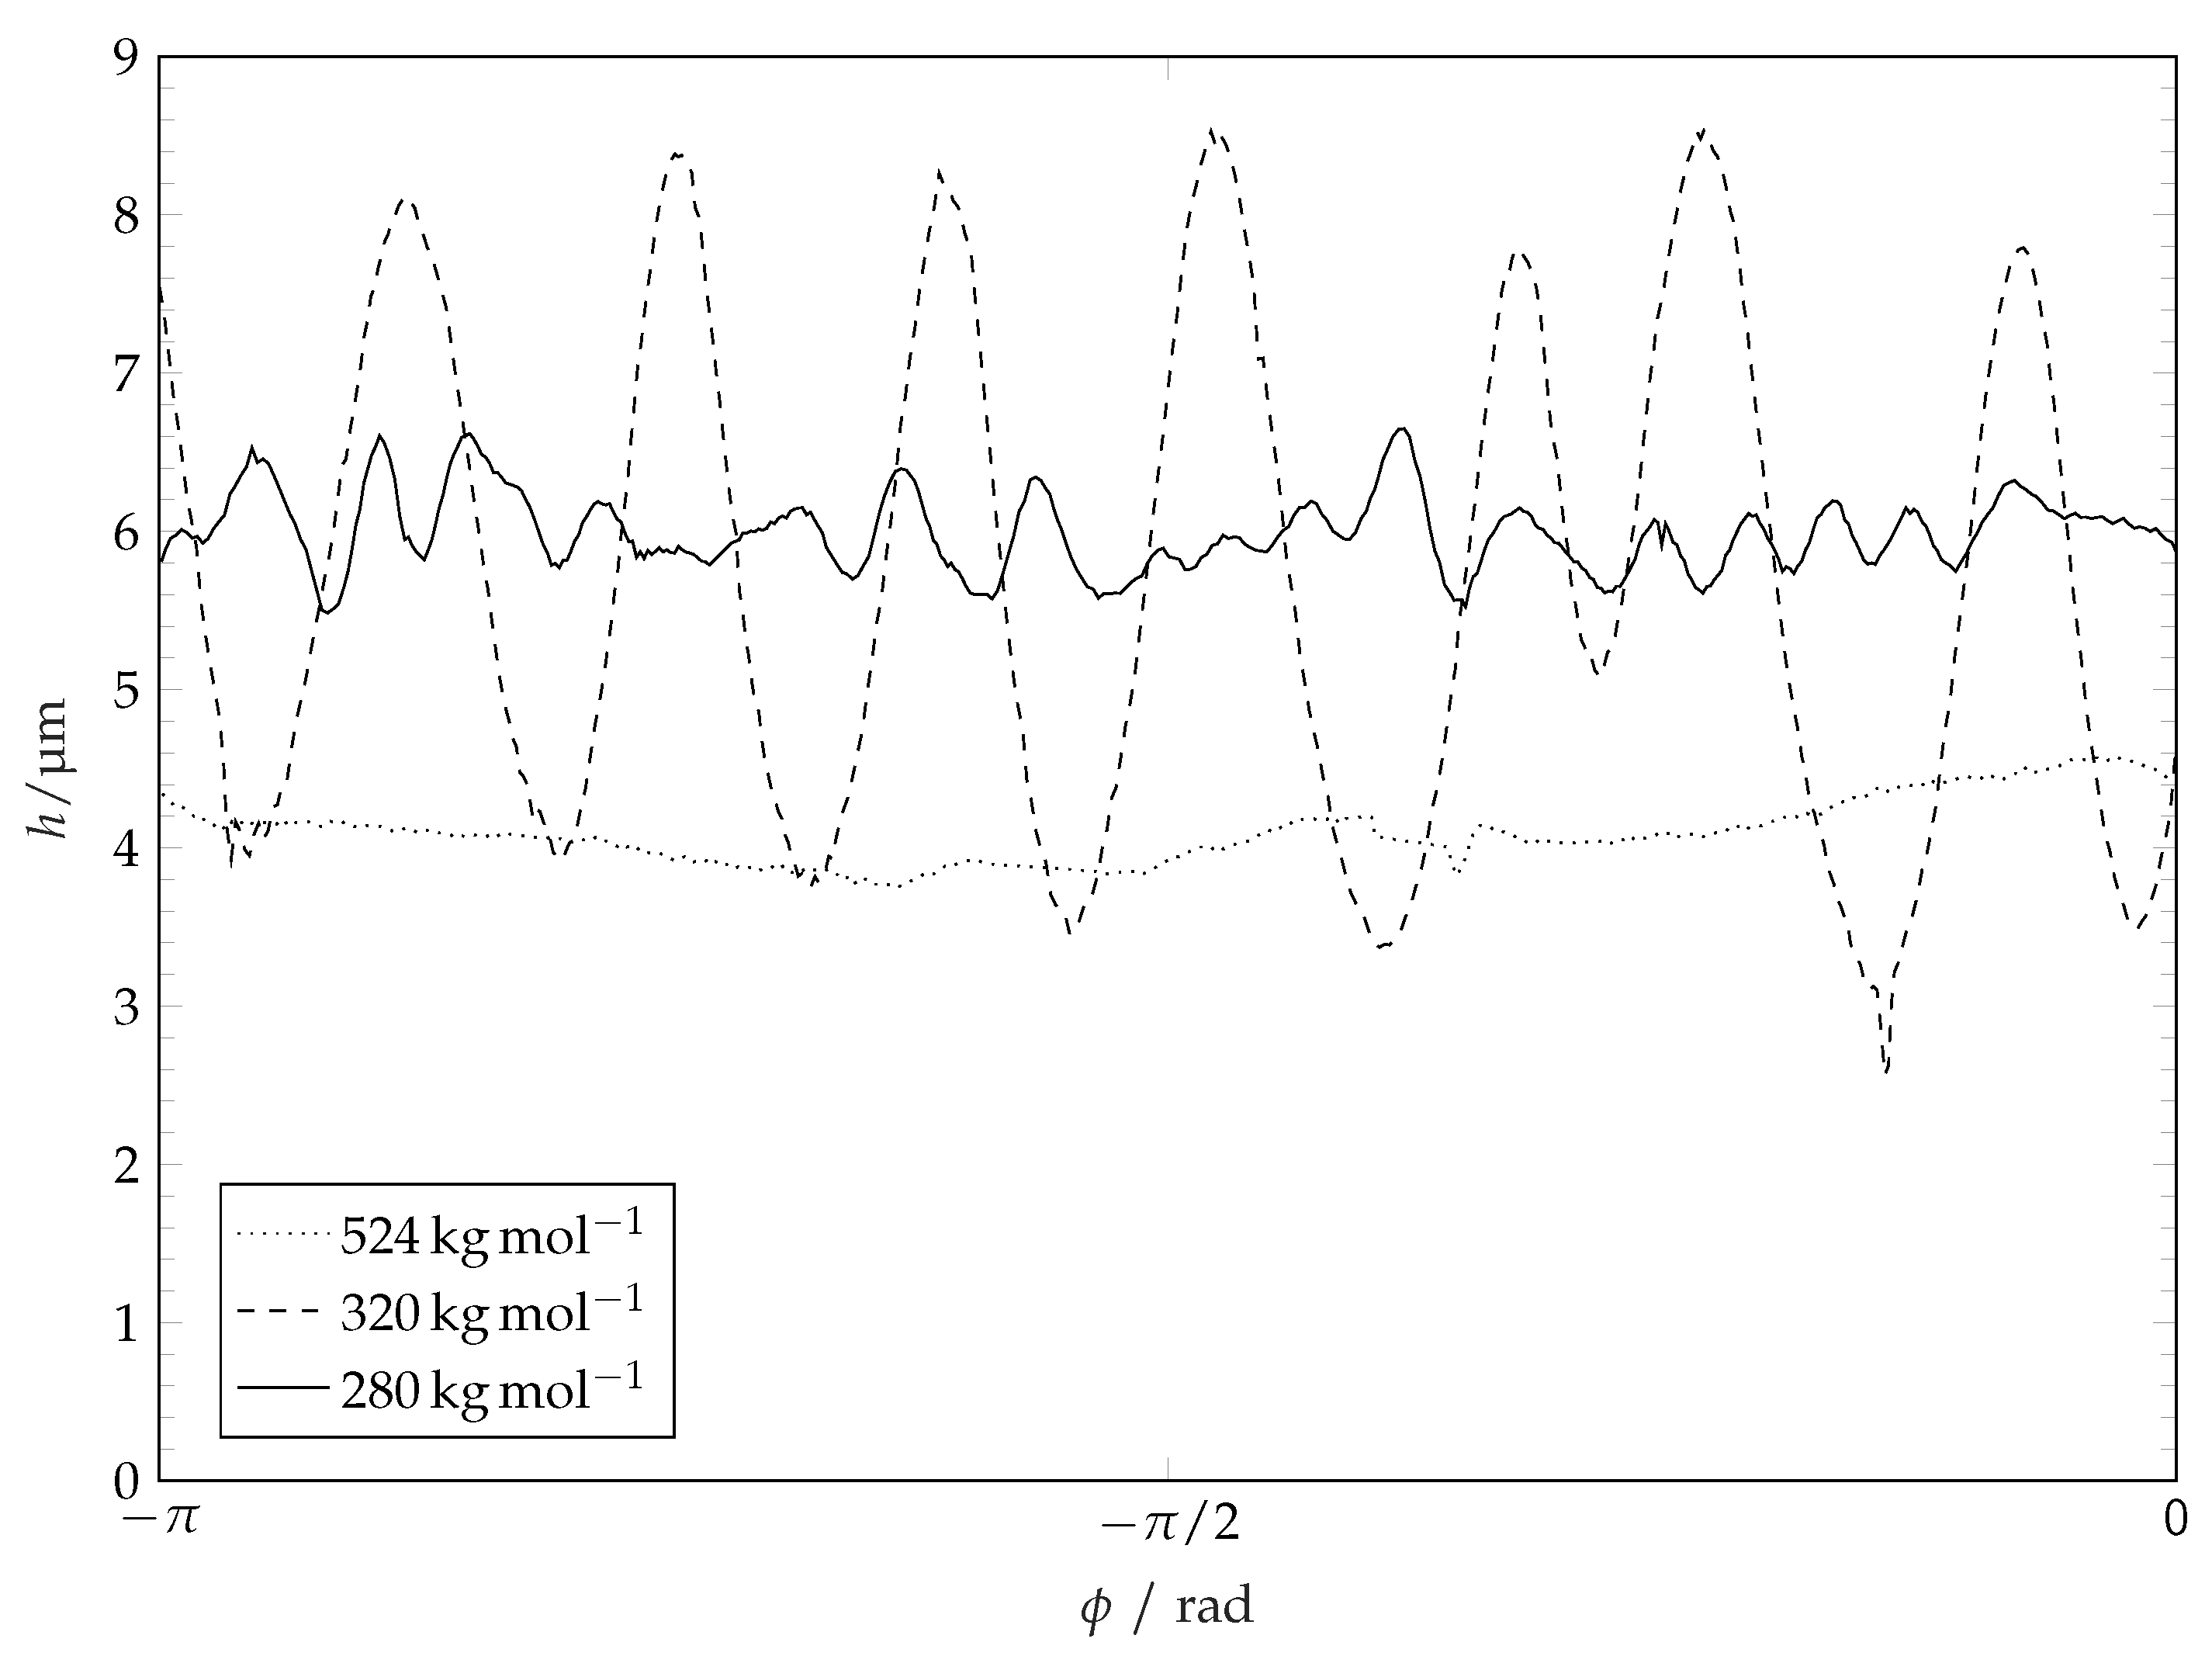
In the following we shall refer to the closed curve connecting the points on the top of the ridge as a ridge line. The course of the ridge line over a small section of the ridge is illustrated in Figure 10. For characterization of the coating structure after the evaporation of solvent and restructuring we consider the diameter of the ridge line and the distribution of the height of the coating along the ridge line. The influence of molar mass of polymer coating (or coating solubility) on the ridge line diameter is plotted in Figure 11. This diameter is determined by fitting a circle to the projection of the extracted ridge line onto the substrate plane. This parameter is very close to the maximum drop spreading diameter (see Figure 3 and Figure 6). It is seen in Figure 11 that the ridge line diameter decreases with increasing of polymer molar mass (i.e., decreasing solubility). The distribution of the coating thickness along the ridge line circumference is shown in Figure 12. It is seen that the average height of the ridge, the amplitude and the wave length of the ridge height oscillations depend on the molar mass of the coating (and thereby the solubility [44,45]). Smooth ridge lines can be obtained with the coatings having high molar mass (or lower solubility, respectively). The increased solubility of low molar weight polymers results in perturbations along the ridge line. These perturbations manifest themselves in oscillations of the ridge height along the ridge line and in fingers which reach towards the centre of the circle. Polymers with a high molar mass (−1) show smooth ridge lines with only low amplitude long wave perturbations. Polymers with a medium molar mass (−1 and −1) tend to show low numbers of perturbations along the ridge line (or perturbations with a long average wave length) with high amplitude. Polymers with a low molar mass (−1 and −1) tend to produce many perturbations along the ridge line (or perturbations with a short wave length) with lower amplitudes. These characteristics are not related to the initial surface roughness of the coatings. The roughness of the surface coatings is just slightly higher () for lower polymer molar masses on our overall smooth surfaces (see Table 1). A possible explanation for the formation of ridge perturbations was delivered by Poulard and Damman [46]. They conducted drying experiments with droplets of polydimethyolsiloxane (PDMS) solutions on inert surfaces and measured the surface left behind after complete solvent evaporation. Some of their structures resemble the ones we present within this work and also show perturbations. For their system, Poulard and Damman [46] have attributed the appearance of perturbations to the Rayleigh–Plateau instability and related the number of observed fingers to the critical wavelength of the Rayleigh–Plateau theory: W, with the perturbations wavelength and the ridge cross-sectional width W. However, this principle cannot be observed for the full range of our experiments. A possible explanation for this discrepancy lies in viscosity. Near the contact line a PS solution in a semi-diluted state is created. For this case, the relative viscosity of PS solutions in similar solvents scales with and [32] as already mentioned earlier. Solutions of polymers with a high degree of polymerisation are therefore highly viscous compared to solutions with low molar mass polymers at the same volumetric concentration. A high viscosity near the contact line represents a damping mechanism which could suppress the development of ridge deformation.
Figure 10.
Illustration of the term ridge line used within this work. The figure shows a portion of a pertubed ridge as depicted in Figure 8. Image obtained with a PS of 335 /−1.
Figure 10.
Illustration of the term ridge line used within this work. The figure shows a portion of a pertubed ridge as depicted in Figure 8. Image obtained with a PS of 335 /−1.

Figure 11.
Ridge line diameters after wetting and evaporation of solvent droplets on different substrates. For comparability, ridge line diameters are divided by the initial solvent droplets radius R. The error bars represent the standard deviation of the mean values.
Figure 11.
Ridge line diameters after wetting and evaporation of solvent droplets on different substrates. For comparability, ridge line diameters are divided by the initial solvent droplets radius R. The error bars represent the standard deviation of the mean values.

Figure 12.
Ridge heights over angular coordinate show pertubations along ridge line. Graphs show heights above original coating level. Coating molar mass shows influence on pertubation frequency and amplitude. For a better visualisation, only half cycles are depicted.
Figure 12.
Ridge heights over angular coordinate show pertubations along ridge line. Graphs show heights above original coating level. Coating molar mass shows influence on pertubation frequency and amplitude. For a better visualisation, only half cycles are depicted.

4. Conclusions
In this work, we investigate the spreading and evaporation of a non-polar solvent drop on a substrate with soluble polymer coating. Spontaneous wetting and evaporation into a dry nitrogen atmosphere are observed using a high speed video camera. Solution-induced surface restructuring of the polymer substrate is studied using confocal microscopy.
- (a)
- The spreading of a solvent droplet on thin non-polar coatings can be divided into two qualitatively different stages. During a first rapid stage, the droplet spreads in accordance with the power law found in literature for inert surfaces. For this stage, which ends after ≈10 ms, the spreading kinetics is independent from the molar mass, or solubility, of the coating. After this initial stage, the contact line speed slows down dramatically and continues spreading for ≈10 ms. The spreading does not scale with a simple power law, as the spreading mechanism and the liquid material properties change during the process. For this late stage wetting, which makes up 30% of the wetted area within our experiments, spreading kinetics strongly depends on coating solubility. Higher solubility results in higher wetting speeds and larger final wetted area.
- (b)
- During evaporation, solvent droplet contact lines stay pinned at the final wetting radius. This results in a linear decrease in volume over time. The molecular weight of the dissolved polymer has no dominant impact on the observed evaporation rates.
- (c)
- Solvent evaporation leads to the formation of coffee ring-like structures. The shape of these circular structures depends on the solubility of the coating polymer. Low solubility leads to smooth structures. Highly soluble polymers create highly perturbed structures.
Author Contributions
Conceptualisation, C.W. and T.G.-R.; methodology, C.W.; software, C.W.; validation, C.W.; formal analysis, C.W. and T.G.-R.; investigation, C.W. and T.G.-R.; data curation, C.W.; writing—original draft preparation, C.W.; writing—review and editing, T.G.-R.; visualisation, C.W.; supervision, T.G.-R.; project administration, T.G.-R. All authors have read and agreed to the published version of the manuscript.
Funding
The authors thank the German Research Foundation (DFG) for supporting this work within the scope of the research project BO 2965/10-1.
Conflicts of Interest
The authors declare no conflict of interest.
References
- Kawase, T.; Sirringhaus, H.; Friend, R.H.; Shimoda, T. Inkjet printed via—Hole interconnections and resistors for all—polymer transistor circuits. Adv. Mater. 2001, 13, 1601–1605. [Google Scholar] [CrossRef]
- Bonn, D.; Eggers, J.; Indekeu, J.; Meunier, J.; Rolley, E. Wetting and spreading. Rev. Mod. Phys. 2009, 81, 739–805. [Google Scholar] [CrossRef]
- Biance, A.L.; Clanet, C.; Quéré, D. First steps in the spreading of a liquid droplet. Phys. Rev. E 2004, 69, 016301. [Google Scholar] [CrossRef] [PubMed] [Green Version]
- Bird, J.C.; Mandre, S.; Stone, H.A. Short-time dynamics of partial wetting. Phys. Rev. Lett. 2008, 100, 234501. [Google Scholar] [CrossRef] [Green Version]
- Cazabat, A.M.; Cohen Stuart, M.A. Dynamics of wetting: Effects of surface roughness. J. Phys. Chem. 1986, 90, 5845–5849. [Google Scholar]
- Tanner, L.H. The spreading of silicone oil drops on horizontal surfaces. J. Phys. D Appl. Phys. 1979, 12, 1473. [Google Scholar] [CrossRef]
- Voinov, O.V. Hydrodynamics of wetting. Fluid Dyn. 1976, 11, 714–721. [Google Scholar] [CrossRef]
- Kistler, S.F. Hydrodynamics of wetting. Wettability 1993, 6, 311–430. [Google Scholar]
- Seaver, A.E.; Berg, J.C. Spreading of a droplet on a solid surface. J. Appl. Polym. Sci. 1994, 52, 431–435. [Google Scholar] [CrossRef]
- Muralidhar, P.; Bonaccurso, E.; Auernhammer, G.K.; Butt, H.J. Fast dynamic wetting of polymer surfaces by miscible and immiscible liquids. Colloid Polym. Sci. 2011, 289, 1609–1615. [Google Scholar] [CrossRef]
- Dupas, J.; Verneuil, E.; Ramaioli, M.; Forny, L.; Talini, L.; Lequeux, F. Dynamic wetting on a thin film of soluble polymer: Effects of nonlinearities in the sorption isotherm. Langmuir 2013, 29, 12572–12578. [Google Scholar] [CrossRef] [PubMed]
- Dupas, J. Wetting of Soluble Polymers. Ph.D. Thesis, Université Pierre et Marie Curie, Paris, France, 2012. [Google Scholar]
- Morris, S.J.S. On the contact region of a diffusion-limited evaporating drop: A local analysis. J. Fluid Mech. 2014, 739, 308–337. [Google Scholar] [CrossRef] [Green Version]
- Jambon-Puillet, E.; Carrier, O.; Shahidzadeh, N.; Brutin, D.; Eggers, J.; Bonn, D. Spreading dynamics and contact angle of completely wetting volatile drops. J. Fluid Mech. 2018, 844, 817–830. [Google Scholar] [CrossRef] [Green Version]
- Bonaccurso, E.; Butt, H.J.; Hankeln, B.; Niesenhaus, B.; Graf, K. Fabrication of microvessels and microlenses from polymers by solvent droplets. Appl. Phys. Lett. 2005, 86, 124101. [Google Scholar] [CrossRef]
- Li, G.; Butt, H.J.; Graf, K. Microstructures by solvent drop evaporation on polymer surfaces: Dependence on molar mass. Langmuir 2006, 22, 11395–11399. [Google Scholar] [CrossRef]
- Gonuguntla, M.; Sharma, A. Polymer patterns in evaporating droplets on dissolving substrates. Langmuir 2004, 20, 3456–3463. [Google Scholar] [CrossRef]
- Kawase, T.; Shimoda, T.; Newsome, C.; Sirringhaus, H.; Friend, R.H. Inkjet printing of polymer thin film transistors. Thin Solid Film. 2003, 438, 279–287. [Google Scholar] [CrossRef]
- Sirringhaus, H.; Kawase, T.; Friend, R.H.; Shimoda, T.; Inbasekaran, M.; Wu, W.; Woo, E.P. High-resolution inkjet printing of all-polymer transistor circuits. Science 2000, 290, 2123–2126. [Google Scholar] [CrossRef] [Green Version]
- Gans, B.J.D.; Hoeppener, S.; Schubert, U.S. Polymer—Relief microstructures by inkjet etching. Adv. Mater. 2006, 18, 910–914. [Google Scholar] [CrossRef]
- Lee, W.H.; Park, Y.D. Inkjet etching of polymers and its applications in organic electronic devices. Polymers 2017, 9, 441. [Google Scholar] [CrossRef] [Green Version]
- Grimaldi, I.A.; De Girolamo Del Mauro, A.; Nenna, G.; Loffredo, F.; Minarini, C.; Villani, F. Microstructuring of polymer films by inkjet etching. J. Appl. Polym. Sci. 2011, 122, 3637–3643. [Google Scholar] [CrossRef]
- Asmussen, F.; Ueberreiter, K. Velocity of dissolution of polymers. Part II. J. Polym. Sci. 1962, 57, 199–208. [Google Scholar] [CrossRef]
- Steger, C. An unbiased detector of curvilinear structures. IEEE Trans. Pattern Anal. Mach. Intell. 1998, 20, 113–125. [Google Scholar] [CrossRef] [Green Version]
- Wagner, T.; Hiner, M.; Raynaud, X. Ij-Ridgedetection: Ridge Detection [Image Processing]. 2017. Available online: https://zenodo.org/record/845874 (accessed on 26 October 2020).
- Eddi, A.; Winkels, K.G.; Snoeijer, J.H. Short time dynamics of viscous drop spreading. Phys. Fluids 2013, 25, 013102. [Google Scholar] [CrossRef]
- Warren, J.A.; Boettinger, W.J.; Roosen, A.R. Modeling reactive wetting. Acta Mater. 1998, 46, 3247–3264. [Google Scholar] [CrossRef]
- Flory, P.J. Fifteenth spiers memorial lecture. Thermodynamics of polymer solutions. Discuss. Faraday Soc. 1970, 49, 7–29. [Google Scholar] [CrossRef]
- Rauch, J. Diffusion und Thermodiffusion in Polymerlösungen. Ph.D. Thesis, Universität Bayreuth, Bayreuth, Germany, 2006. [Google Scholar]
- Körner, A.; Larsson, A.; Andersson, Å.; Piculell, L. Swelling and polymer erosion for poly (ethylene oxide) tablets of different molecular weights polydispersities. J. Pharm. Sci. 2010, 99, 1225–1238. [Google Scholar] [CrossRef]
- Körner, A.; Larsson, A.; Piculell, L.; Wittgren, B. Molecular information on the dissolution of polydisperse polymers: Mixtures of long and short poly (ethylene oxide). J. Phys. Chem. B 2005, 109, 11530–11537. [Google Scholar] [CrossRef]
- Adam, M.; Delsanti, M. Viscosity of semi-dilute polymer solutions. J. Phys. Fr. 1982, 43, 549–557. [Google Scholar] [CrossRef]
- Dupas, J.; Verneuil, E.; van Landeghem, M.; Bresson, B.; Forny, L.; Ramaioli, M.; Lequeux, F.; Talini, L. Glass Transition Accelerates the Spreading of Polar Solvents on a Soluble Polymer. Phys. Rev. Lett. 2014, 112, 188302. [Google Scholar] [CrossRef]
- Tay, A.; Lequeux, F.; Bendejacq, D.; Monteux, C. Wetting properties of charged and uncharged polymeric coatings—effect of the osmotic pressure at the contact line. Soft Matter 2011, 7, 4715–4722. [Google Scholar] [CrossRef]
- Tay, A.; Bendejacq, D.; Monteux, C.; Lequeux, F. How does water wet a hydrosoluble substrate? Soft Matter 2011, 7, 6953–6957. [Google Scholar] [CrossRef]
- Monteux, C.; Tay, A.; Narita, T.; Wilde, Y.D.; Lequeux, F. The role of hydration in the wetting of a soluble polymer. Soft Matter 2009, 5, 3713–3717. [Google Scholar] [CrossRef]
- Erbil, H.Y.; Avci, Y. Simultaneous determination of toluene diffusion coefficient in air from thin tube evaporation and sessile drop evaporation on a solid surface. Langmuir 2002, 18, 5113–5119. [Google Scholar] [CrossRef]
- Saritha, S.; Neogi, P.; Wang, J.C. Wetting by polymer solutions. Polymer 2006, 47, 6263–6266. [Google Scholar] [CrossRef]
- Hu, H.; Larson, R.G. Evaporation of a sessile droplet on a substrate. J. Phys. Chem. B 2002, 106, 1334–1344. [Google Scholar] [CrossRef]
- Deegan, R.D.; Bakajin, O.; Dupont, T.F.; Huber, G.; Nagel, S.R.; Witten, T.A. Capillary flow as the cause of ring stains from dried liquid drops. Nature 1997, 389, 827. [Google Scholar] [CrossRef]
- Jarusuwannapoom, T.; Hongrojjanawiwat, W.; Jitjaicham, S.; Wannatong, L.; Nithitanakul, M.; Pattamaprom, C.; Koombhongse, P.; Rangkupan, R.; Supaphol, P. Effect of solvents on electro-spinnability of polystyrene solutions and morphological appearance of resulting electrospun polystyrene fibers. Eur. Polym. J. 2005, 41, 409–421. [Google Scholar] [CrossRef]
- Corneliussen, R.; Rice, S.A.; Yamakawa, H. On the thermodynamic properties of solutions of polar polymers. A comparison of experiment and theory. J. Chem. Phys. 1963, 38, 1768–1778. [Google Scholar] [CrossRef]
- De Gennes, P.G.; Gennes, P.G. Scaling Concepts in Polymer Physics; Cornell University Press: Ithaca, NY, USA, 1979. [Google Scholar]
- Powers, P.O. Solubility of polystyrene. Ind. Eng. Chem. 1949, 41, 2213–2217. [Google Scholar] [CrossRef]
- Powers, P.O. Solubility of Polystyrene in Hydrocarbons. Ind. Eng. Chem. 1949, 41, 126–130. [Google Scholar] [CrossRef]
- Poulard, C.; Damman, P. Control of spreading and drying of a polymer solution from Marangoni flows. Europhys. Lett. 2007, 80, 64001. [Google Scholar] [CrossRef]
Figure 1.
Sketch of the experimental set-up. Contact between solvent and substrate is initiated by increasing the volume of a solvent droplet until it touches the substrate. The distance between cannula and substrate (and thereby the initial drop diameter) can be varied by adjusting the vertical position of the substrate holder. Collimated light reaches the CMOS sensor of a high-speed camera through telecentric optics. Dry nitrogen is used to ensure a controlled atmosphere within the test cell.

Figure 2.
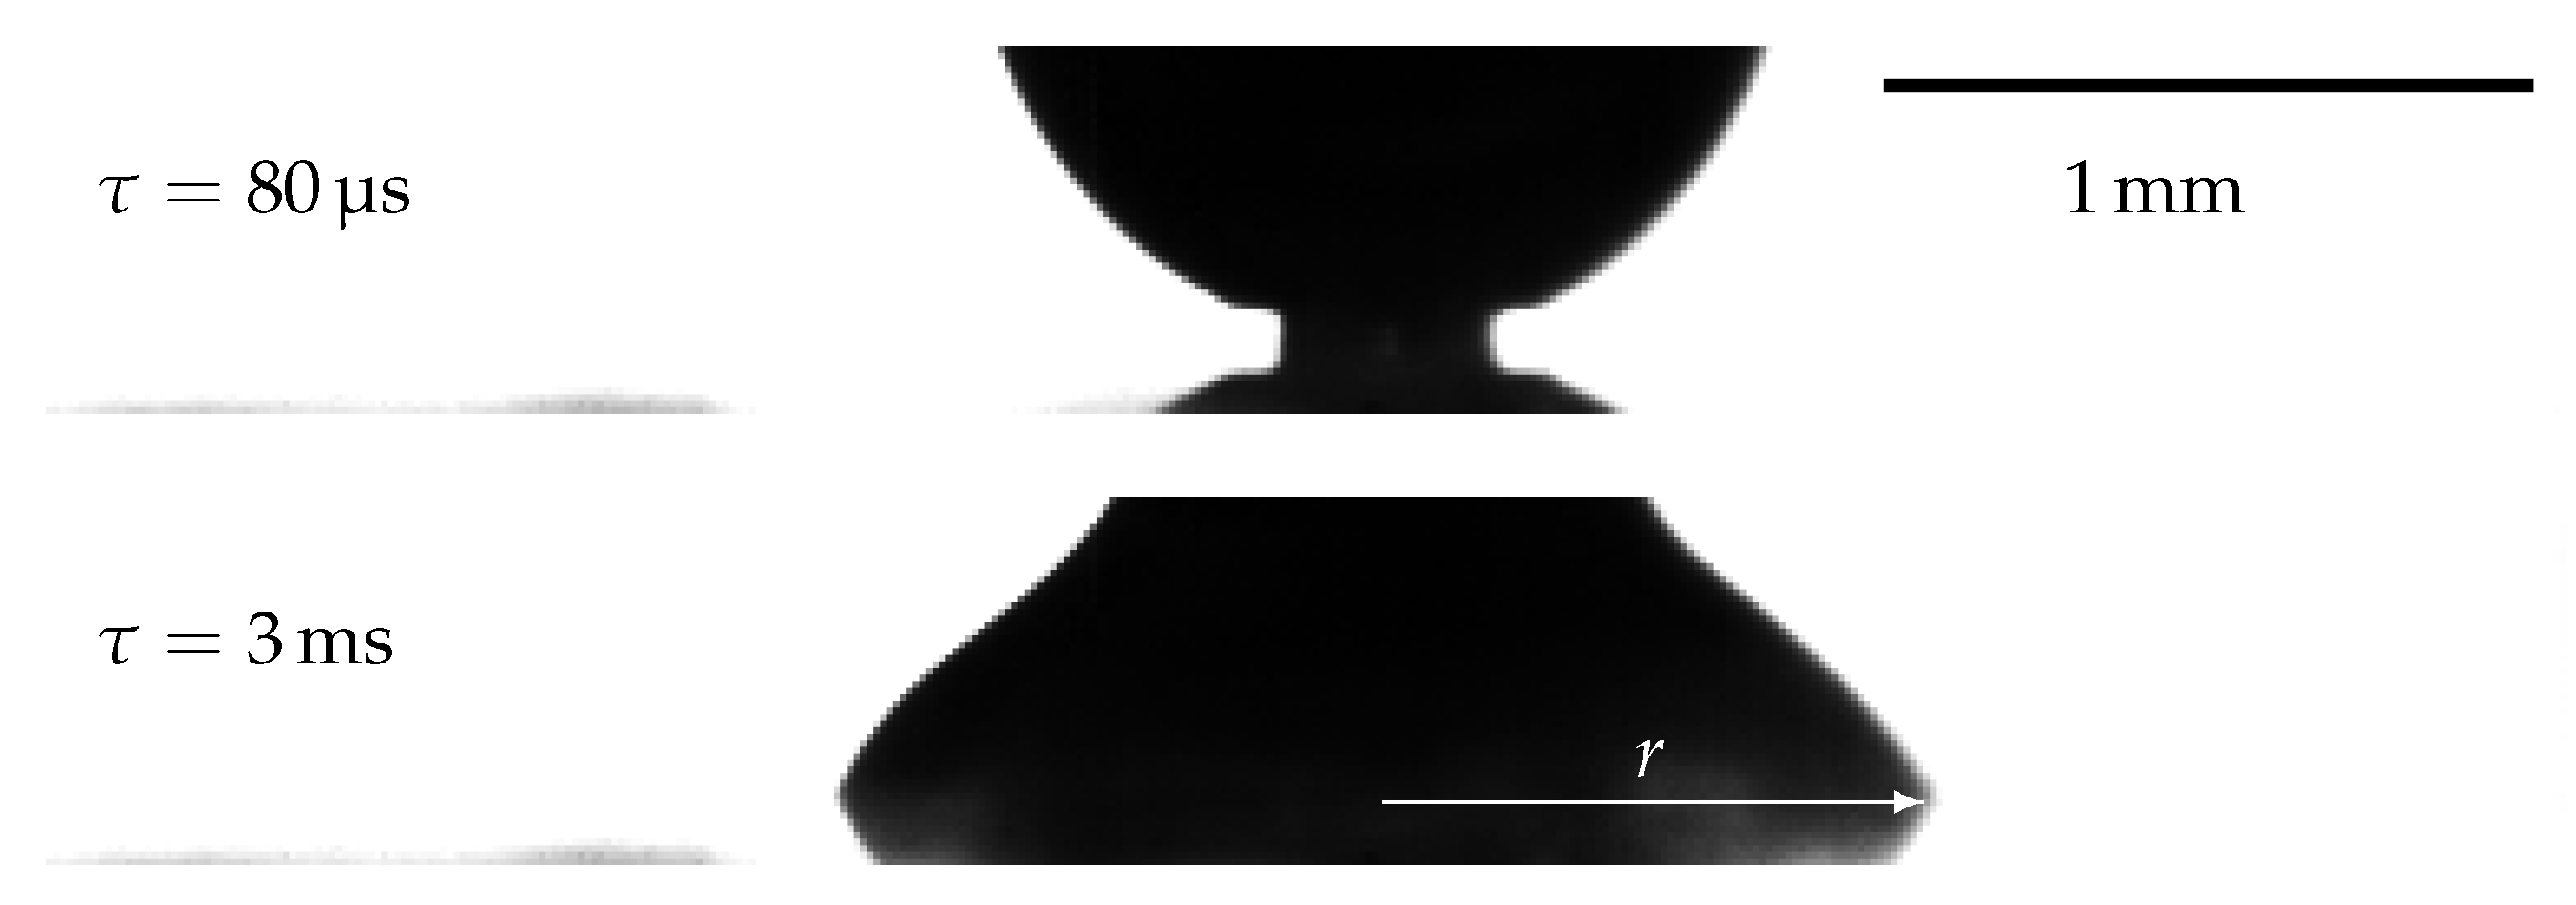
Two images of wetting experiments at the initial stage. The reflection of the actual droplet shadow can be observed at the bottom region of the pictures due to the camera alignment. Toluene on PS (−1).
Figure 2.
Two images of wetting experiments at the initial stage. The reflection of the actual droplet shadow can be observed at the bottom region of the pictures due to the camera alignment. Toluene on PS (−1).

Figure 3.
Wetting radius over time for a whole droplet life course. Two separate recordings ( resolution, solid line and resolution, dashed line) are shown within the same plot. The sudden change in wetting speed at marks the end of the initial wetting phase. The insert magnifies the wetting process for in linear representation. The parameter (see Equation (3)) and the initial wetting speed are given as dashed lines for toluene drops on PS ( 320 /−1).

Figure 4.
Wetting characteristics for initial and late stage wetting of toluene on polystyrene coatings with different molar masses. Initial wetting dynamics are characterised by from Equation (3). Late stage dynamics are characterised by the first temporal derivation of Equation (1) at , or the inaugural wetting speed of late stage wetting, respectively. The error bars represent the standard deviation of the mean values. The experimental point corresponding to for −1 contains no bars. This experiment has been performed only once.

Figure 5.
Dynamic contact angle over capillary number during late stage spreading. Ca is calculated with the initial material properties of pure toluene.
Figure 5.
Dynamic contact angle over capillary number during late stage spreading. Ca is calculated with the initial material properties of pure toluene.

Figure 6.
Contact angle (dashed line) and contact radius over time during late stage spreading and a large part of evaporation. Because of the low temporal resolution, the initial wetting stage as presented in Figure 3 cannot be observed. After approximately 10 , late stage wetting stops and the contact radius stays constant. The contact angle decreases linearly after the contact line is pinned. The last seconds of evaporation are excluded due to faulty image processing as the ridge formation interferes with contact angle determination. Toluene on PS (−1).

Figure 7.
Solvent droplet volume over time during spreading and evaporation as obtained by image evaluation. The black line represents the results of computations according to the model presented in Hu and Larson [39]. Plot markers are placed for easier distinction between curves.
Figure 7.
Solvent droplet volume over time during spreading and evaporation as obtained by image evaluation. The black line represents the results of computations according to the model presented in Hu and Larson [39]. Plot markers are placed for easier distinction between curves.

Figure 8.
Surface appearance after evaporation of solvent droplets on different substrates. The top half of each image displays microscope photographs. The bottom half displays height maps. Both representations are recorded simultaneously using a confocal microscope.
Figure 8.
Surface appearance after evaporation of solvent droplets on different substrates. The top half of each image displays microscope photographs. The bottom half displays height maps. Both representations are recorded simultaneously using a confocal microscope.

Figure 9.
Coatings height profile along diameter after solvent evaporation for different coating molar masses. The non-symmetry for −1 stems from perturbations along the ridge line as presented in Figure 8 and Figure 12. Profiles are magnified in height.


Table 1.
Substrate properties used in this work.
| Substrate Properties | |||
|---|---|---|---|
| mass average molar mass | dispersity of chain lengths | thickness | roughness |
| e | |||
| / | / | / | |
| /−1 | - | ||
| 192 | |||
| 280 | |||
| 320 | |||
| 335 | 1.04 | ||
| 524 | 1.04 | ||
Table 2.
Influence of polymer concentration on material properties of PS-toluene solutions (−1) [41].
Table 2.
Influence of polymer concentration on material properties of PS-toluene solutions (−1) [41].
| Mass Fraction of PS in Toluene / % | ||||
|---|---|---|---|---|
| 0 | 10.3 | 18.7 | 25.7 | |
| 0.52 | 33 | 236 | 1098 | |
| −1 | 27.4 | 30.2 | 30.0 | 29.9 |
Publisher’s Note: MDPI stays neutral with regard to jurisdictional claims in published maps and institutional affiliations. |
© 2020 by the authors. Licensee MDPI, Basel, Switzerland. This article is an open access article distributed under the terms and conditions of the Creative Commons Attribution (CC BY) license (http://creativecommons.org/licenses/by/4.0/).
Share and Cite
MDPI and ACS Style
Wolf, C.; Gambaryan-Roisman, T. Wetting and Evaporation of Solvents on Thin Soluble Substrates. Colloids Interfaces 2020, 4, 48. https://0-doi-org.brum.beds.ac.uk/10.3390/colloids4040048
AMA Style
Wolf C, Gambaryan-Roisman T. Wetting and Evaporation of Solvents on Thin Soluble Substrates. Colloids and Interfaces. 2020; 4(4):48. https://0-doi-org.brum.beds.ac.uk/10.3390/colloids4040048
Chicago/Turabian StyleWolf, Christian, and Tatiana Gambaryan-Roisman. 2020. "Wetting and Evaporation of Solvents on Thin Soluble Substrates" Colloids and Interfaces 4, no. 4: 48. https://0-doi-org.brum.beds.ac.uk/10.3390/colloids4040048