Microparticle Deposition on Human Serum Albumin Layers: Unraveling Anomalous Adsorption Mechanism


1
Jerzy Haber Institute of Catalysis and Surface Chemistry Polish Academy of Science, Niezapominajek 8 Street, 30-239 Cracow, Poland
2
Department of Medical Chemistry, Pomeranian Medical University, Rybacka 1 Street, 70-204 Szczecin, Poland
*
Authors to whom correspondence should be addressed.
Colloids Interfaces 2020, 4(4), 51; https://0-doi-org.brum.beds.ac.uk/10.3390/colloids4040051
Submission received: 30 September 2020
/
Revised: 26 October 2020
/
Accepted: 2 November 2020
/
Published: 5 November 2020
(This article belongs to the Special Issue Outstanding Scientists in Colloids and Interfaces: Emil Chibowski)
Abstract
:Human serum albumin (HSA) layers are adsorbed on mica under controlled diffusion transport at pH 3.5 and various ionic strengths. The surface concentration of HSA is directly determined by AFM imaging of single molecules. It is shown that the adsorption kinetics derived in this way is quantitatively described using the random sequential (RSA) adsorption model. The electrokinetic characteristics of the HSA layers at various pHs comprising their zeta potential are acquired in situ while using the streaming potential method. It is shown that at pH 3.5 the zeta potential of mica becomes positive for HSA concentrations above 3000 μm−2. At larger pHs, HSA layers exhibit negative zeta potential for the entire range of coverage. Thorough characteristics of these monolayers at various pHs were performed applying the colloid deposition method involving negatively charged polystyrene microparticles. The kinetics of their deposition and their maximum coverage are determined as a function of the HSA layer surface concentration, pH, and ionic strength. An anomalous deposition of microparticles on substrates also exhibiting a negative zeta potential is observed, which contradicts the Derjaguin, Landau, Vervey, Overbeek (DLVO) theory. This effect is interpreted in terms of heterogeneous charge distribution that results from molecule concentration fluctuations. It is also shown that the maximum concentration of microparticles abruptly decreases with the electric double-layer thickness that is regulated by changing ionic strength, which indicates that their deposition is governed by electrostatic interactions. One can argue that the results obtained in this work can be exploited as useful reference data for the analysis of deposition phenomena of bioparticles on protein layers.
1. Introduction
Controlled protein adsorption is a prerequisite for their efficient purification and separation by filtration, chromatography, for biosensing, bioreactors, immunological assays, tissue culture, etc. Particularly important are adsorption phenomena of blood plasma proteins on various biomaterials, because they govern the response of the human body to implanted materials [1]. For example, the most abundant protein in blood plasma, human serum albumin (HSA) is used for preparing anti-adherent coatings preventing the adsorption of proteins, platelets, viruses, and bacteria on hemodializer membranes, pacemakers, prostheses, catheters, etc. [2,3,4]. HSA also serves as a biomarker of several diseases such as rheumatoid arthritis, ischemia, cancer, obesity [5,6] and is applied in medicine to treat blood loss, hemorrhage, chronic and acute liver failure, or hypoalbuminemia [7]. Another application of HSA concerns its use as a blocking agent by preparing immunoglobulin covered microparticles (latexes) exploited in a plethora of agglutination immunoassays [8].
The albumin molecule is a α-chain protein consisting of 585 amino acids with the molar mass calculated from its primary chemical structure of 66,439 g mol−1 [9]. The crystalline structure of the albumin molecule consists of 69% α-helix and it contains 17 disulphide bonds [9,10,11,12]. The isoelectric point of the molecule is equal to 5 [12,13,14]. Its shape is irregular exhibiting no symmetry, approximately resembling a heart shape [11,15], which corresponds to the N-form existing for the pH above 4.3 and below 8.0 [7]. For pH below 4, the HSA molecule acquires in NaCl solutions a more extended conformation, the so called F-form.
Because of its significance, the adsorption of albumins on various substrates has been studied by a variety of experimental techniques, such as radioisotope labeling [16], in situ fluorescent TIRF technique [17,18], reflectometry [19], X-ray photoelectron spectroscopy (XPS) [20,21,22], ellipsometry [23,24], OWLS [25,26], atomic force microscopy [27,28], the streaming potential method [27,28], and the quartz crystal microbalance (QCM) [29,30].
However, despite its significance, no research so far has been devoted to the interesting issue of colloid particle deposition on albumin layers, with the exception of Ref. [31], where only a single pH equal to 3.5 was studied.
Because of the deficit of systematic studies, the primary goal of this work is to quantitatively determine the adsorption kinetics of albumin molecules on the model substrate consisting of mica sheets. The HSA monolayers of well-defined coverage produced in this way are used as the supporting substrates for investigation the deposition of negatively charged polymer microparticles. Valid information about mechanisms of microparticles binding to protein layers can be acquired because the particle coverage is directly determined by the optical and the atomic force microscopies and interpreted in terms of the random sequential adsorption (RSA) model. This has significance for basic sciences because our results obtained for a well-defined system can serve as reference data for assessing the range of validity of the mean-field electrostatic interaction theory.
Additionally, our results can be utilized as useful reference data for the analysis of deposition phenomena of bioparticles at protein covered surfaces. This has practical significance for the regulation of the bioadhesive properties of surfaces.
2. Materials and Methods
In this work, human serum albumin in the form of a lyophilized powder 99% ((Sigma–Aldrich (Merck), St. Louis, MO, USA) having the nominal fatty acid content of 0.02% was used. The purity of albumin solutions and its molar mass were determined by the Gel Filtration Chromatography using Superdex 200-column (San Francisco, CA, USA) and via SDS-PAGE electrophoresis in Laemmli system [32]. Afterward, the gel was fixed and silver stained [33].
The mass concentration of albumin after dissolving the powder in appropriate electrolyte solutions at various pHs and after filtration was determined by the densitometer (Anton Paar, type DMA 5000M, Graz, Austria). Accordingly, the density of concentrated albumin solutions (500–2000 mg L−1) as well as the supernatant solutions that were acquired by membrane ultrafiltration were measured while using regenerated cellulose filter (Millipore, NMWL 30 kDa, Tullagreen, Ireland). Afterward, the mass concentration of the albumin solution was calculated from the formula derived in Ref. [27]. These concentrated stock solutions of albumin were diluted to a desired bulk concentration (usually 0.1–10 mg L−1) prior to each adsorption experiment without using the filtration procedure.
Negatively charged sulfate microparticles, a commercial product of Invitrogen (Eugene, OR, USA), were used in the colloid deposition experiments.
The diffusion coefficient of albumin molecules and particles was determined by dynamic light scattering (DLS) while using the Zetasizer Nano ZS instrument from Malvern (Cambridge, UK). The hydrodynamic diameter was calculated from the Stokes–Einstein equation.
The particle size distribution was also determined using the laser diffractometer (Particle Size Analyzer LS 13 320, Beckman Coulter, Indianapolis, IN, USA).
The electrophoretic mobilities of albumin molecules and particles were measured while using the Laser Doppler Velocimetry (LDV) technique.
The adsorption of HSA on freshly cleaved mica sheets was carried out under diffusion conditions in a thermostated cell. The HSA coverage was adjusted varying the adsorption time and its bulk concentration. The surface concentration of HSA layers formed in this way was determined by AFM imaging in air using the NT-MDT Solver BIO device (Moscow, Russia) with the SMENA SFC050L scanning head [28,31,34,35]. From the AFM micrographs, the average number of adsorbed albumin molecules per unit area was determined by an image analysis software (1945).
These protein covered mica sheets were used in the particle deposition experiments separately performed in the diffusion cell for a defined time up to 24 h. The particle coverage was determined in situ by a direct optical microscope imaging under wet conditions, and ex situ via AFM imaging according to the method that was described in our previous works [1,31]. Briefly, the particles were counted over 10 equal sized areas chosen at random over mica sheets. The net number of considered particles was ca. 2000. The relative error of these measurements was less than 2%, as determined by variance analysis. In this way, the surface concentration of particles (number of particles per unit area), Nl, was determined as a function of deposition time.
The electrokinetic characteristics of albumin layers were acquired in situ using the streaming potential (SP) method [27,28,36,37]. A microfluidic cell in the form of the parallel plate channel was applied where a laminar flow of the electrolyte (or the protein suspension) was generated applying the regulated hydrostatic pressure difference: ΔP. The resulting streaming potential is measured by a pair of AgCl electrodes for various pressures in order to obtain the slope of the Es vs. ΔP dependence. The overall cell electric conductivity (Ke) was determined using another pair of platinum electrodes. Knowing the slope of the streaming potential ΔEs vs. ΔP dependence, the zeta potential of HSA layers on mica was calculated from the Smoluchowski relationship
where η is the dynamic viscosity of the solvent and ε is the dielectric permittivity of the electrolyte.
The ionic strength of the albumin and particle suspensions was fixed by the addition of NaCl solutions, whereas the pH was adjusted by the addition of either HCl or NaOH solutions, with the exception of pH 7.4, fixed by a PBS buffer. In order to keep the ionic strength at a constant level, while the HCl concentration was increased the NaCl concentration was decreased by the same amount. In the case of PBS buffer, the ionic strength was fixed at either 0.01 or 0.15 M. The pH value was measured before and after each experiments and the registered changes amounted to ca. 2% for pH 7.4 and ca. 5% for pH 5.5 (kept fixed without any addition of HCl or NaOH) for the maximum particle deposition time of 24 h. In the case of HSA adsorption runs, lasting up to 30 min, the pH change was only 1%.
The temperature of all experiments was equal to 298 K.
3. Results and Discussion
3.1. Physicochemical Characteristics of Albumin Solutions
The primary bulk characteristics of albumin solutions comprised the diffusion coefficient, the hydrodynamic diameter and the electrophoretic mobility that were determined at various pHs and ionic strengths while using the DLS and the LDV methods, respectively. The average diffusion coefficient of HSA molecules for the NaCl concentration range of 10−3 to 0.15 M and pH 3.5–9 was equal to 6.1 ± 0.20 × 10⁻⁷ cm2s−1 (at T = 298 K). Knowing the experimental values of the diffusion coefficient, the hydrodynamic diameter denoted by dH was calculated from the Stokes–Einstein relationship
where k is the Boltzmann constant, T is the absolute temperature, and D is the diffusion coefficient of the molecule.
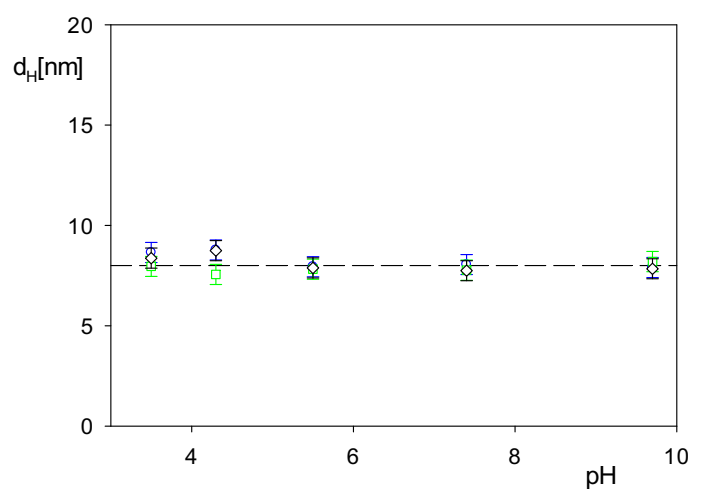
Figure 1 shows the experimental values of the hydrodynamic diameter calculated from Equation (2) for various ionic strengths and pHs. One can observe that the average value of dH was equal to 7.5 ± 0.20 nm for pH 3–9.
On the other hand, the electrophoretic mobility of HSA molecules for various ionic strengths and pHs, denoted by μe, was measured while using the LDV method. The zeta potential ζp, was calculated from the Henry formula [1,31,38].
where is the dimensionless Henry function, a = dH/2, is the electric double-layer thickness, e is the elementary charge, and I is the ionic strength of the electrolyte solution.
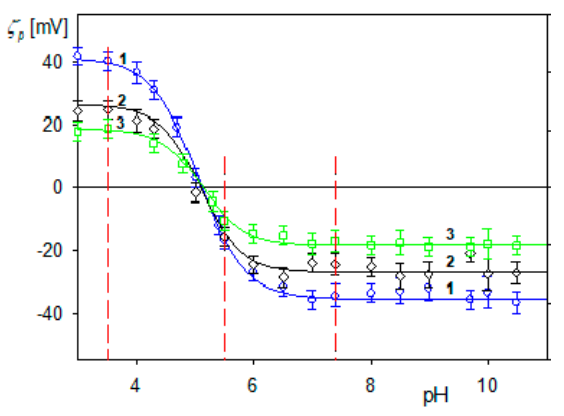
Figure 2 shows the dependence of ζp on pH calculated from Equation (3) for various ionic strength. As seen, the zeta potential of HSA molecules remains positive for pH < 5 for all ionic strengths. At pH 3.5 it is equal to 45 and 22 mV for ionic strength of 10−2 M and 0.15 M, respectively. For pH range above 5 it becomes negative and equal to −42 and −20 mV at pH 7.4 and ionic strength of 10−2 M and 0.15 M, respectively. Therefore, the results that are shown in Figure 2 indicate that the isoelectric point of HSA appears at pH 5.
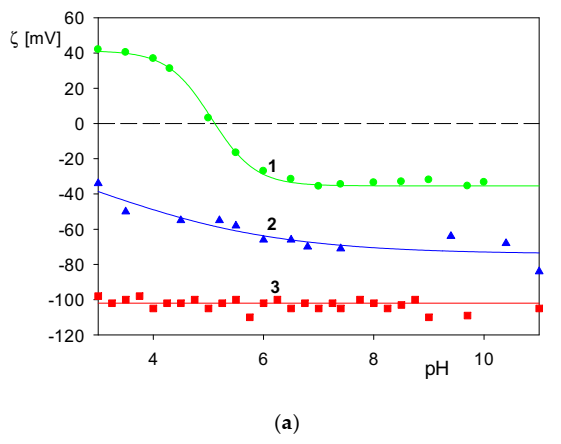
Analogous characteristics were acquired for the polystyrene particles applying the DLS, the laser diffractometry and the LDV methods. The hydrodynamic diameter of particles was equal to 810 ± 10 nm, which agrees with the laser diffractometry value of 820 ± 10 nm. Their zeta potential calculated from Equation (3) while using the measured electrophoretic mobility was strongly negative and equal to −100 and −60 mV at pH 3.5, for ionic strength of 0.01 and 0.15 M, respectively (see Figure 3). It is also practically independent of pH. On the other hand, the zeta potential of the mica substrate was determined using the streaming potential method. It was also negative and equal to −40 and −30 mV at pH 3.5, for ionic strengths of 0.01 and 0.15 M, respectively (at pH 3.5). However, in contrast to the particle zeta potential, it markedly decreased with pH (see Figure 3).
3.2. Adsorption Kinetics of HSA on Mica
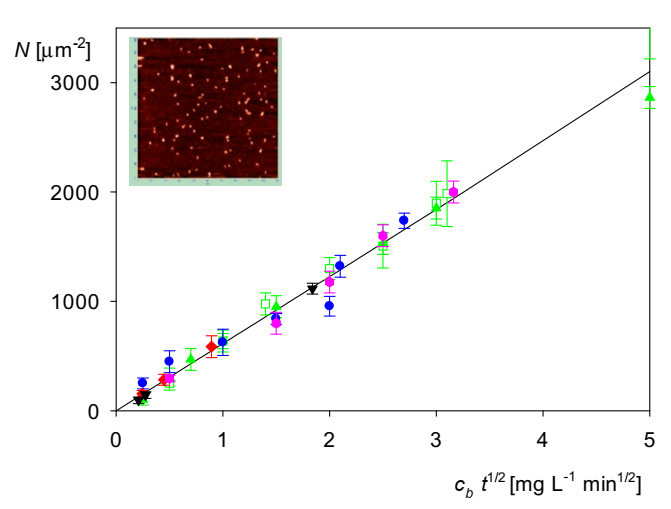
The adsorption of HSA layers on mica was carried out under diffusion-controlled transport according to the procedure that was described in previous works [28,31,36]. Single molecules adsorbed on the freshly cleaved mica sheets after a defined prescribed period of time were imaged using the ex situ AFM. Figure 4 presents a typical monolayer adsorbed at pH 3.5 and ionic strength equal to 10−2 M. Using the AFM enumeration technique, the average number of HSA molecules adsorbed on unit area of the substrate is directly determined. The molecule surface concentration acquired in this way is expressed as the number of HSA molecules per one square micrometer. One should underline that this procedure is advantageous, because, in the determination of the surface concentration, no information about the shape and hydration degree of the HSA molecules is needed.
HSA adsorption experiments that were carried out at pH 3.5 for various bulk mass concentrations, denoted by cb and expressed in mg L−1, are shown in Figure 4 as the dependence of the surface concentration of HSA on the surface concentration of the cb t1/2 parameter. As seen, the experimental data that were obtained for various bulk concentrations and ionic strengths agree with theoretical results (depicted by the solid line) stemming from the hybrid random sequential adsorption model [39]. In the case of an irreversible, diffusion-controlled adsorption mechanism, this model predicts the following formula for lower protein surface concentration range, where the blocking effects are negligible [39,40]
where nb = cb/m1 is the bulk number concentration of HSA molecules and m1 is the mass of a single molecule.
However, for larger surface concentrations, a direct AFM enumeration of adsorbed albumin molecules becomes less accurate.
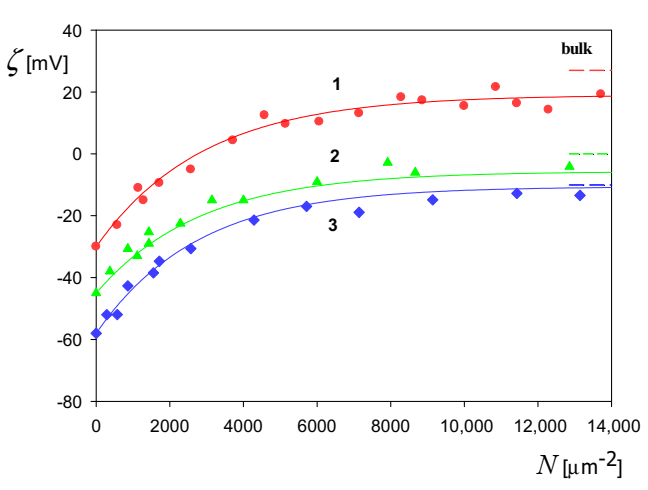
Therefore, in this case, the streaming potential method was applied, which allows for studying in situ the adsorption/desorption kinetics of HSA under various physicochemical conditions. Additionally, using this method, thorough acid-base characteristics of the protein layers can be carried out. The experimental data that were acquired at pH 3.5, 5.5, 7.4, are shown in Figure 5. It can be observed that at pH 3.5, the zeta potential of mica abruptly increases with the albumin surface concentration and becomes positive for N > 3000 µm−2. For larger N, the zeta potential asymptotically attains a plateau value that is close to the bulk zeta potentials of HSA, determined by the electrophoretic mobility method.
The solid lines denote exact theoretical results calculated from the three-dimensional (3D) electrokinetic model, Equations (5) and (6) and the dashed lines show the bulk zeta potentials of HSA derived from the bulk electrophoretic mobility measurements.
The experimental dependence of the zeta potential on the surface concentration of albumin derived from the streaming potential measurements is interpreted in terms of the electrokinetic model described in Ref. [41], where the three-dimensional fluid velocity and electric potential distributions are considered. While using this approach, the expression for the streaming potential of interfaces covered by protein molecules assumes the form
where Θ = N Sg is the absolute (dimensionless) coverage of HSA molecules, Sg is the characteristic cross-section of molecules, ζi is the zeta potential of bare interface, ζp is the particle (protein) zeta potential in the bulk, and are the dimensionless functions.
The Fi function accounts for the decreased flow rate in the vicinity of the interface due to adsorbed molecules, and the Fp function characterizes the magnitude of the streaming current originating from the electrical double-layer surrounding the adsorbed molecules.
The functions were calculated for a broad range of coverage by numerically evaluating the flow field past spherical particles that were attached to a planar interface [41] while using the multipole expansion method. The exact numerical results were interpolated by the following analytical functions [42]
where the Ci, ap and bp dimensionless coefficients assume for spherical particles and thin electric double-layers the limiting values of 10.2 and 0.202 and 0.618, respectively [42].
The absolute coverage was calculated using the characteristic cross-section of HSA molecules Sg that was equal to 37 nm2 [1,27,31].
The experimental data obtained at pH 3.5 are adequately reflected by the electrokinetic model expressed by Equations (5) and (6) (depicted by the solid line 1) indicating that the plateau coverage of HSA is ca. 10,000 µm−2, which corresponds to the absolute coverage 0.37, as seen in Figure 5. Given that at pH 3.5 the zeta potential of albumin molecules is positive and opposite to the zeta potential of mica, such an efficient adsorption of HSA can be adequately rationalized in terms of the attractive electrostatic interactions as quantitatively performed in previous works [1,31].
However, a more complicated situation appears at pH 5.5 and 7.4 (curves 2 and 3 in Figure 5), where a significant adsorption of HSA is also observed with the maximum coverage attaining ca. 8000 µm−2. This is anomalous behavior because HSA molecules exhibit at these pHs a negativel zeta potential (see Figure 2), i.e., of the same sign as the mica substrate zeta potential. Therefore, from the mean-field DLVO theory [43,44], one can predict that the electrostatic interaction between albumin molecules and the mica should be repulsive, prohibiting HSA molecule adsorption.
However, this effect can be explained if one realizes that the zeta potential determined either by the electrophoretic or the streaming potential methods is a mean-field quantity averaged over the entire molecule or large substrate surface areas. In the scale of nanometers, the charge distribution over the HSA molecule is largely heterogeneous for the entire range of pH and it is characterized by the presence of positive and negative patches [27]. This prediction has been confirmed by molecular dynamic modeling that was performed for analogous bovine serum albumin (BSA) molecule [45,46]. Such a heterogeneous charge distribution is expected to play an appreciable role for the length scale below the size of the HSA molecule, which can be approximated by its hydrodynamic diameter equal to 7.5 nm. Because, for the electrostatic interactions, the appropriate length scale is the electric double-layer thickness, one can calculate that this corresponds to the ionic strength above 0.002 M [40].
In order to quantitatively prove this hypothesis, extensive series of particle deposition experiments were carried out where the kinetics and the maximum coverage were determined as a function of the HSA layer density at various ionic strengths and pHs.
3.3. HSA Layer Characteristics by Colloid Deposition
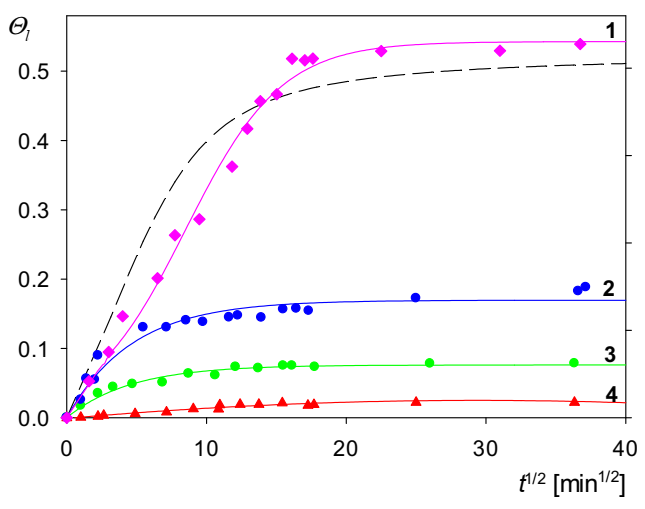
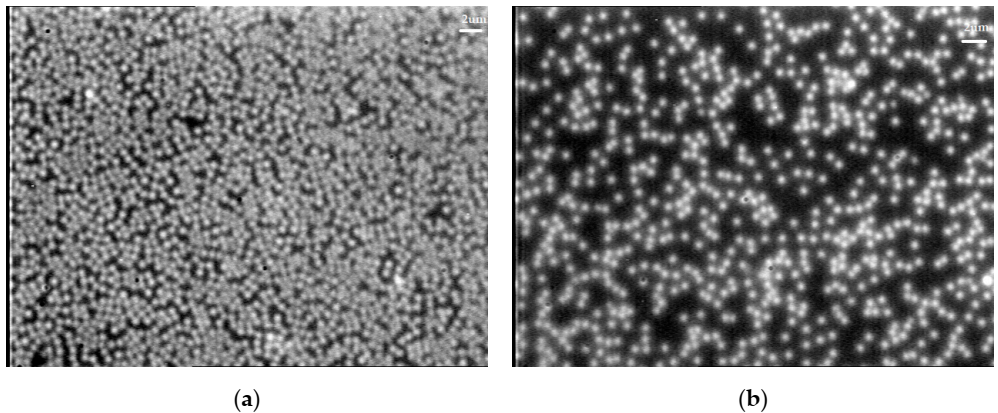
The polymer particle deposition on HSA layers was carried out according to the following procedure: firstly, the albumin layer of a defined coverage was adsorbed on a mica sheet, as described above, afterward the mica sheet without drying was immersed in the particle suspension of the defined bulk concentration. Then, after completing the particle deposition, the particle surface concentration, denoted and Nl, was determined by the optical microscopy under wet conditions or AFM imaging. For this purpose, the number of particles deposited over equal-sized surface areas was determined and their dimensionless coverage was calculated as Θl = Nl × Sgl (where Sgl is the cross-section area of the microparticle). Figure 6 presents the deposition kinetics derived in this way as the dependence of Θl on t1/2 determined for various HSA monolayer surface concentrations, pH 5.5 and ionic strength of 0.15 M. It can be observed that for the largest HSA surface concentration of 2 × 103 µm−2, the microparticle coverage increases almost linearly with t1/2 and afterward, for t1/2 > 15 min 1/2 (225 min) the maximum coverage, denoted hereafter by Θmx, is asymptotically attained. It was equal to 0.52 for the adsorption time of 1400 min, which almost coincides with the maximum coverage predicted from the RSA model [40] equal to 0.51 for particles of 820 nm in diameter at the ionic strength of 0.01 M. Figure 7a shows a micrograph of the particle monolayer deposited under these conditions acquired by optical microscopy under wet condition. This means that the entire HSA covered mica surface was available for particle deposition, which exhibited the behavior of a uniformly accessible surface. It is also confirmed in separate measurements that no particle desorption occurred over prolonged time period (up to 48 h) if they were conditioned in electrolyte solution of the same pH and ionic strength.
Given that the zeta potential of the HSA layer of the surface concentration equal to 2 × 103 µm−2 is negative and equal to −20 mV and the particle zeta potential is equal to −60 mV, the results that are represented by curve 1 in Figure 6 are anomalous and cannot be accounted for by the DLVO theory.
However, for smaller HSA surface concentration of N = 7.5 × 102 µm−2, the particle deposition was considerably less efficient (see line 2 in Figure 6), being characterized by the maximum coverage equal to 0.13 (attained after 24 h) i.e., four times smaller than previously. Finally, for N equal to 3 × 102 µm−2, the particle deposition was practically negligible.
The results that are shown in Figure 6 confirm that the particle coverage is uniquely related to the surface concentration of the supporting albumin layer. As suggested in Ref. [1,31] this functional dependence, albeit nonlinear, can be exploited for a precise determination of the surface concentration of albumin or for the determination of its bulk concentration at the level of 10−9 M. In Ref. [31] analogous kinetic runs as those shown in Figure 6 (measured for HSA layers at pH 3.5) are quantitatively interpreted applying the random site sequential adsorption (RSSA) model.
In order to further investigate this anomalous particle deposition kinetics, systematic experiments were performed that were aimed at determining the influence of ionic strength at different pHs on the maximum coverage of particle attained after 24 h.
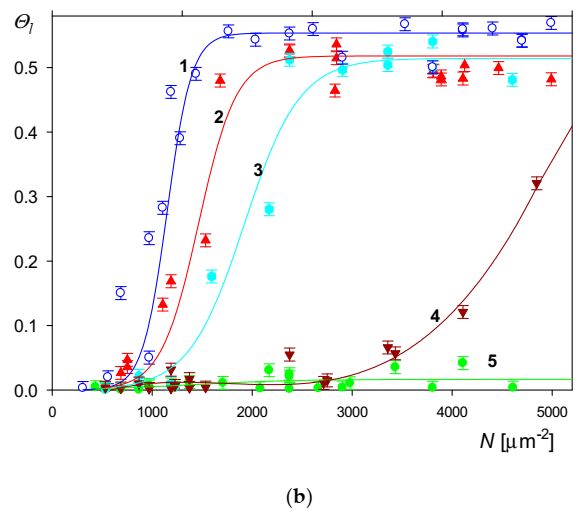
In Figure 8a,b, the results of such measurements performed at pH 5.5 and 7.4, respectively, and ionic strengths varying between 0.15 and 0.02 M are presented. As seen, the dependencies of the maximum particle coverage on the HSA surface concentration exhibit an interesting feature. Thus, the particle deposition efficiency (parametrized as the maximum coverage attained after 24 h) remains negligible at low HSA coverage and rapidly increases after exceeding the threshold values of N, depending on ionic strength. Accordingly, at pH 5.5, these threshold concentrations are equal to 1000 and ca. 2000 µm−2 for ionic strengths of 0.05 and 0.03 M, respectively. It should be mentioned that an analogous behavior was previously reported for particle deposition on HSA layers at pH 3.5, although the threshold coverage was significantly lower [31]. Interestingly, at ionic strength of 0.02 M the particle deposition efficiency becomes practically negligible. Analogous results are acquired at pH 7.4 (see Figure 8b), where the threshold value of HSA is equal to 1000 and ca. 3000 µm−2 for ionic strength of 0.05 and 0.03 M, respectively. Given that ionic strength does not affect the van der Waals interactions, these results unequivocally confirm that particle deposition on HSA layers was mainly governed by electrostatic interactions. However, these interactions should be treated as discrete in the nanoscale rather than continuous, as assumed by the DLVO theory.
This concept was previously applied to quantitatively interpret the particle deposition data on fibrinogen [43,44] and HSA [1,31] layers. It is assumed that, due to the density fluctuations, a few closely spaced protein molecules form adsorption sites (clusters) that exhibit a local positive charge, whereas the average charge of the layer remains negative. The magnitude of the charge, and hence the binding strength of a site, increases with the number of protein molecules. It is also considered that the probability of forming sites composed of larger number of molecules rapidly increases with the coverage of the adsorbed layer. However, one should emphasize that this model can produce physically sound results if there appear patches on adsorbed molecules that bear a charge of opposite sign to the particles, i.e., positive in the present case of albumin molecules. Because of this assumption, the results that are shown in Figure 8 indicate that at pH 5.5 and 7.4 such patches indeed existed on HSA molecules yielding a heterogeneous charge distribution in the monolayer. Moreover, these results allow for deriving information regarding the size of the positive patches on HSA molecules at these pHs. This becomes feasible if the particle deposition efficiency is plotted against the double-layer thickness described by the formula.
One can calculate that the double-layer thickness varies between 0.79 and 3.05 nm for the NaCl concentration of 0.15 and 0.01 M, pertinent to the measurements shown in Figure 8.
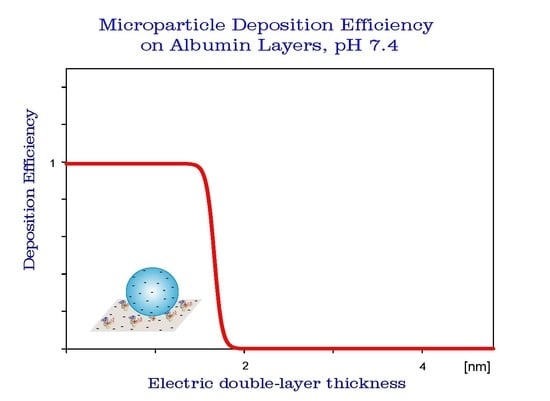
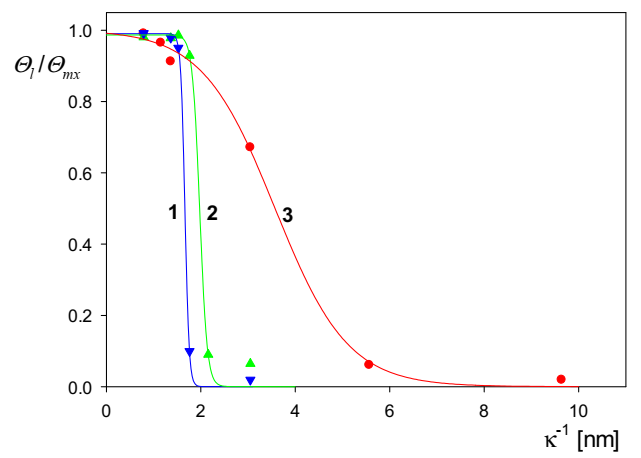
In Figure 9, these experimental data are plotted as the dependence of the normalized particle coverage Θl/Θmx on the electric double-layer thickness . It is seen that the normalized microparticle coverage abruptly decreases attaining a negligible value at > 2 nm for both pHs of 5.5. and 7.4. Hence, these results confirm that, at pH above the isoelectric point, there exists positively charged patches on HSA molecules with a characteristic dimension of 2 nm, which is considerably lower than the HSA molecule dimension of 7.5 nm. For comparison, it is seen in Figure 9 that, at pH 3.5, the decrease in the particle deposition efficiency with the double-layer thickness is less abrupt because it vanishes at the distance of 6 nm, which is comparable with the HSA molecule size.
4. Conclusions
Applying the AFM, the streaming potential and in situ colloid deposition methods involving negatively charged polystyrene particles, thorough characteristics of human serum albumin (HSA) layers on mica were acquired.
It was shown that albumin molecules irreversibly adsorb at pH up to 7.4, where both the mica substrate and the molecules exhibit a negative zeta potential. This anomalous effect, contradicting the mean-field DLVO theory, was rationalized in terms of a heterogeneous charge distribution on the HSA molecule characterized by the presence of positive and negative patches.
The kinetics and the maximum coverage of the particles were determined as a function of the HSA layer surface concentration, in order to quantitatively verify this hypothesis. It was confirmed that, for ionic strength of 0.15 M, the HSA layers efficiently immobilize the particles at pH 5.5 and 7.4. It is suggested that the quasi-linear functional relationships between the particle coverage and the HSA molecule surface concentration acquired in this way can be exploited in order to quantitatively determine the coverage of albumin under in situ conditions.
On the other hand, for ionic strength below 0.15 M, the irreversible immobilization of particles was only observed after attaining a threshold HSA surface concentration, which abruptly increased for lower ionic strength. This anomalous deposition of negatively charged particles on surfaces bearing negative zeta potential was interpreted in terms of the random site adsorption model when considering the presence of positively charged patches on HSA molecules at pHs above its isoelectric point. It was also confirmed that the characteristic size of the positively charged patches is equal to ca. 2 nm.
Our results indicating that, for a defined range of ionic strength, the non-specific deposition of particles on HSA layers of controlled surface concentration can be suppressed, which has a practical significance for efficiently performing immunological assays.
Author Contributions
Conceptualization, M.N.-R. and Z.A.; methodology, M.N.-R. and M.D.; software, Z.A.; validation, M.N.-R. and M.D.; formal analysis, M.N.-R., Z.A. and M.D.; investigation, Z.A.; resources, M.N.-R. and M.D.; data curation, M.N.-R. and Z.A.; writing—original draft preparation, M.N.-R. and Z.A.; writing—review and editing, M.N.-R. and Z.A., supervision, Z.A. All authors have read and agreed to the published version of the manuscript.
Funding
This work was supported by the Statutory activity of the Jerzy Haber Institute of Catalysis and Surface Chemistry PAS.
Acknowledgments
The authors are deeply indebted to Marta Kujda-Kruk for the electrophoretic mobility measurements of the albumin solutions and to Katarzyna Kusak for the help in preparing the manuscript and the artwork.
Conflicts of Interest
The authors declare no conflict of interest.
References
- Adamczyk, Z.; Nattich-Rak, M.; Dąbkowska, M.; Kujda-Kruk, M. Albumin adsorption at solid substrates: A quest for a unified approach. J. Colloid Interface Sci. 2018, 514, 769–790. [Google Scholar] [CrossRef] [PubMed]
- Reynolds, E.C.; Wong, A. Effect of adsorbed protein on hydroxyapatite zeta potential and Streptococcus mutans adherence. Infect. Immun. 1983, 39, 1285–1290. [Google Scholar] [CrossRef] [PubMed] [Green Version]
- Hogt, A.H.; Dankert, J.; Feijen, J. Adhesion of Staphylococcus epidermidis and taphylococcus saprophyticus to a hydrophobic biomaterial. J. Gen. Microbiol. 1985, 131, 2485–2491. [Google Scholar] [CrossRef] [PubMed] [Green Version]
- Brokke, P.; Dankert, J.; Carballo, J.; Feijen, J. Adherence of Coagulase-Negative Staphylococci onto Polyethylene Catheters in vitro and in vivo: A Study on the Influence of various Plasma Proteins. J. Biomater. Appl. 1991, 5, 204–226. [Google Scholar] [CrossRef] [PubMed]
- Duffy, M.J.; McDermott, E.W.; Crown, J. Blood-based biomarkers in breast cancer: From proteins to circulating tumor cells to circulating tumor DNA. Tumor Biol. 2018, 40, 1–11. [Google Scholar] [CrossRef] [Green Version]
- Moidu, N.A.; Rahman, N.S.A.; Syafruddin, S.E.; Low, T.Y.; Mohtar, M.A. Secretion of pro-oncogenic AGR2 protein in cancer. Heliyon 2020, 6, 1–11. [Google Scholar] [CrossRef] [PubMed]
- Fanali, G.; Di Masi, A.; Trezza, V.; Marino, M.; Fasano, M.; Ascenzi, P. Human serum albumin: From bench to bedside. Mol. Asp. Med. 2012, 33, 209–290. [Google Scholar] [CrossRef]
- Martin-Rodriguez, A.; Ortega-Vinuesa, J.L.; Hidalgo-Alvarez, R. Electrokinetics of Protein-coated Latex Particles. In Surface Science Series, Volume 106. Interfacial Electrokinetics and Electrophoresis; Delgado, A.V., Ed.; Dekker: New York, NY, USA; Basel, Switzerland, 2002; Volume 22, pp. 641–670. [Google Scholar]
- Peters, T., Jr. All About Albumin: Biochemistry, Genetics and Medical Applications; Academic Press: Amsterdam, The Netherlands, 1996. [Google Scholar]
- Curry, S.; Mandelkow, H.; Brick, P.; Franks, N. Crystal structure of human serum albumin complexed with fatty acid reveals an asymmetric distribution of binding sites. Nat. Genet. 1998, 5, 827–835. [Google Scholar] [CrossRef]
- Protein Data Bank Code 3P7K. Available online: http://www.pdb.org (accessed on 1 June 2012).
- Norde, W. Adsorption of proteins from solution at the solid-liquid interface. Adv. Colloid Interface Sci. 1986, 25, 267–340. [Google Scholar] [CrossRef]
- Akson, M.L.; Hoboken; Edsall, J.T. Advances in Protein Chemistry. Am. J. Med. Sci. 1948, 215, 114. [Google Scholar] [CrossRef] [Green Version]
- Jachimska, B.; Wasilewska, M.; Adamczyk, Z. Characterization of Globular Protein Solutions by Dynamic Light Scattering, Electrophoretic Mobility, and Viscosity Measurements. Langmuir 2008, 24, 6866–6872. [Google Scholar] [CrossRef] [PubMed]
- Gorudko, I.V.; Grigorieva, D.V.; Shamova, E.V.; Kostevich, V.A.; Sokolov, A.V.; Mikhalchik, E.V.; Cherenkevich, S.N.; Arnhold, J.; Panasenko, O.M. Hypohalous acid-modified human serum albumin induces neutrophil NADPH oxidase activation, degranulation, and shape change. Free Radic. Biol. Med. 2014, 68, 326–334. [Google Scholar] [CrossRef]
- Van Dulm, P.; Norde, W. The adsorption of human plasma albumin on solid surfaces, with special attention to the kinetic aspects. J. Colloid Interface Sci. 1983, 91, 248–255. [Google Scholar] [CrossRef]
- Wertz, C.F.; Santore, M.M. Effect of Surface Hydrophobicity on Adsorption and Relaxation Kinetics of Albumin and Fibrinogen: Single-Species and Competitive Behavior. Langmuir 2001, 17, 3006–3016. [Google Scholar] [CrossRef]
- Ding, Y.-X.; Streitmatter, S.; Wright, B.E.; Hlady, V. Spatial Variation of the Charge and Sulfur Oxidation State in a Surface Gradient Affects Plasma Protein Adsorption. Langmuir 2010, 26, 12140–12146. [Google Scholar] [CrossRef] [PubMed] [Green Version]
- Elgersma, A.V.; Zsom, R.L.; Lyklema, J.; Norde, W. Kinetics of single and competitive protein adsorption studied by reflectometry and streaming potential measurements. Colloids Surf. 1992, 65, 17–28. [Google Scholar] [CrossRef]
- Blomberg, E.; Claesson, P.M.; Tilton, R.D. Short-Range Interaction between Adsorbed Layers of Human Serum Albumin. J. Colloid Interface Sci. 1994, 166, 427–436. [Google Scholar] [CrossRef]
- Blomberg, E.; Claesson, P.M.; Fröberg, J.C. Surfaces coated with protein layers: A surface force and ESCA study. Biomaterials 1998, 19, 371–386. [Google Scholar] [CrossRef]
- Sousa, S.R.; Moradas-Ferreira, P.; Saramago, B.; Melo, L.; Barbosa, M.A. Human Serum Albumin Adsorption on TiO2from Single Protein Solutions and from Plasma. Langmuir 2004, 20, 9745–9754. [Google Scholar] [CrossRef]
- Malmsten, M. Ellipsometry Studies of Protein Layers Adsorbed at Hydrophobic Surfaces. J. Colloid Interface Sci. 1994, 166, 333–342. [Google Scholar] [CrossRef]
- Ortega-Vinuesa, J.; Tengvall, P.; Lundström, I. Molecular packing of HSA, IgG, and fibrinogen adsorbed on silicon by AFM imaging. Thin Solid Films 1998, 324, 257–273. [Google Scholar] [CrossRef]
- Kurrat, R.; Ramsden, J.J.; Prenosil, J.E. Kinetic model for serum albumin adsorption: Experimental verification. J. Chem. Soc. Faraday Trans. 1994, 90, 587. [Google Scholar] [CrossRef]
- Kurrat, R.; Prenosil, J.; Ramsden, J. Kinetics of Human and Bovine Serum Albumin Adsorption at Silica–Titania Surfaces. J. Colloid Interface Sci. 1997, 185, 1–8. [Google Scholar] [CrossRef]
- Dąbkowska, M.; Adamczyk, Z. Human Serum Albumin Monolayers on Mica: Electrokinetic Characteristics. Langmuir 2012, 28, 15663–15673. [Google Scholar] [CrossRef] [PubMed]
- Dąbkowska, M.; Adamczyk, Z.; Kujda, M. Mechanism of HSA adsorption on mica determined by streaming potential, AFM and XPS measurements. Colloids Surf. B Biointerfaces 2013, 101, 442–449. [Google Scholar] [CrossRef] [PubMed]
- Pomorska, A.; Adamczyk, Z.; Nattich-Rak, M.; Sadowska, M. Kinetics of human serum albumin adsorption at silica sensor: Unveiling dynamic hydration function. Colloids Surf. B Biointerfaces 2018, 167, 377–384. [Google Scholar] [CrossRef]
- Adamczyk, Z.; Pomorska, A.; Nattich-Rak, M.; Wytrwal-Sarna, M.; Bernasik, A. Protein adsorption mechanisms at rough surfaces: Serum albumin at a gold substrate. J. Colloid Interface Sci. 2018, 530, 631–641. [Google Scholar] [CrossRef] [PubMed]
- Nattich-Rak, M.; Adamczyk, Z.; Kujda, M. Revealing deposition mechanism of colloid particles on human serum albumin monolayers. Colloids Surf. B Biointerfaces 2016, 137, 176–182. [Google Scholar] [CrossRef]
- Laemmli, U.K. Cleavage of Structural Proteins during the Assembly of the Head of Bacteriophage T4. Nat. Cell Biol. 1970, 227, 680–685. [Google Scholar] [CrossRef]
- Blum, H.; Beier, H.; Gross, H.J. Improved silver staining of plant proteins, RNA and DNA in polyacrylamide gels. Electrophoresis 1987, 8, 93–99. [Google Scholar] [CrossRef]
- Sofińska, K.; Adamczyk, Z.; Kujda, M.; Nattich-Rak, M. Recombinant Albumin Monolayers on Latex Particles. Langmuir 2013, 30, 250–258. [Google Scholar] [CrossRef]
- Adamczyk, Z.; Bratek-Skicki, A.; Dąbrowska, P.; Nattich-Rak, M. Mechanisms of Fibrinogen Adsorption on Latex Particles Determined by Zeta Potential and AFM Measurements. Langmuir 2011, 28, 474–485. [Google Scholar] [CrossRef] [PubMed]
- Dąbkowska, M.; Adamczyk, Z. Ionic strength effect in HSA adsorption on mica determined by streaming potential measurements. J. Colloid Interface Sci. 2012, 366, 105–113. [Google Scholar] [CrossRef]
- Adamczyk, Z.; Nattich, M.; Wasilewska, M.; Zaucha, M. Colloid particle and protein deposition—Electrokinetic studies. Adv. Colloid Interface Sci. 2011, 168, 3–28. [Google Scholar] [CrossRef] [PubMed]
- Swan, J.W.; Furst, E.M. A simpler expression for Henry’s function describing the electrophoretic mobility of spherical colloids. J. Colloid Interface Sci. 2012, 388, 92–94. [Google Scholar] [CrossRef]
- Smoluchowski, M. Drei Vortreag ueber diffusion, Brownische Molekularbewegung und Koagulation von Kolloidteilchen. Phys. Zeit 1916, 17, 557–571. [Google Scholar]
- Adamczyk, Z. Particles at Interfaces: Interactions, Deposition, Structure; Elsevier B.V.: Amsterdam, The Netherlands, 2006. [Google Scholar]
- Adamczyk, Z.; Sadlej, K.; Wajnryb, E.; Nattich-Rak, M.; Ekiel-Jeżewska, M.; Bławzdziewicz, J. Streaming potential studies of colloid, polyelectrolyte and protein deposition. Adv. Colloid Interface Sci. 2010, 153, 1–29. [Google Scholar] [CrossRef]
- Ekiel-Jeżewska, M.L.; Adamczyk, Z.; Bławzdziewicz, J. Streaming Current and Effective ζ-Potential for Particle-Covered Surfaces with Random Particle Distributions. J. Phys. Chem. C 2019, 123, 3517–3531. [Google Scholar] [CrossRef]
- Van Oss, C.J.; Docoslis, A.; Wu, W.; Giese, R.F. Influence of macroscopic and microscopic interactions on kinetic rate constants I. Role of the extended DLVO theory in determining the kinetic adsorption constant of proteins in aqueous media, using von Smoluchowski’s approach. Colloids Surf. B Biointerfaces 1999, 14, 99–104. [Google Scholar] [CrossRef]
- Van Oss, C.J. Chapter Three—The Extended DLVO Theory. Interface Sci. Technol. 2008, 16, 31–48. [Google Scholar]
- Kubiak-Ossowska, K.; Tokarczyk, K.; Jachimska, B.; Mulheran, P.A. Bovine Serum Albumin Adsorption at a Silica Surface Explored by Simulation and Experiment. J. Phys. Chem. B 2017, 121, 3975–3986. [Google Scholar] [CrossRef] [Green Version]
- Nattich-Rak, M.; Adamczyk, Z.; Wasilewska, M.; Sadowska, M. Revealing fibrinogen monolayer conformations at different pHs: Electrokinetic and colloid deposition studies. J. Colloid Interface Sci. 2015, 449, 62–71. [Google Scholar] [CrossRef] [PubMed]
Figure 1.
Dependence of the hydrodynamic diameter of human serum albumin (HSA) molecules on pH calculated from Equation (2): (□) 0.15 M, (◊) 5 × 10⁻² M, (○) 10−2 M. The dashed line shows the average value of the hydrodynamic diameter equal to 7.5 nm.
Figure 1.
Dependence of the hydrodynamic diameter of human serum albumin (HSA) molecules on pH calculated from Equation (2): (□) 0.15 M, (◊) 5 × 10⁻² M, (○) 10−2 M. The dashed line shows the average value of the hydrodynamic diameter equal to 7.5 nm.

Figure 2.
The dependence of the zeta potential of HSA molecules on pH calculated from Equation (3) using the experimental values of the electrophoretic mobility μe: (1) (○) 10−2 M; (2) (◊) 5 × 10⁻² M; (3). (□) 0.15 M. The solid lines are the fits of experimental data and the vertical dashed lines denote the pH values of 3.5, 5.5, and 7.4, respectively, used in the microparticle deposition experiments.

Figure 3.
The dependence of the zeta potential on pH: (1) (●) HSA (Laser Doppler Velocimetry (LDV) method); (2) (▲) bare mica (streaming potential method); (3) (■) microparticles (LDV method). Part (a) ionic strength 10−2 M; part (b) ionic strength 0.15 M.
Figure 3.
The dependence of the zeta potential on pH: (1) (●) HSA (Laser Doppler Velocimetry (LDV) method); (2) (▲) bare mica (streaming potential method); (3) (■) microparticles (LDV method). Part (a) ionic strength 10−2 M; part (b) ionic strength 0.15 M.


Figure 4.
Dependence of the surface concentration of HSA, N [µm−2] on the cb t1/2 [mg L−1 min1/2] parameter. The points denote experimental results obtained by a direct AFM enumeration of adsorbed HSA molecules at pH 3.5, I = 0.15 and 0.01 M and cb range 0.2 to 1 mg L−1. The inset shows the AFM image of the HSA layer on mica.

Figure 5.
The dependence of the zeta potential of mica
on the surface concentration of HSA expressed in µm−2. The points denote experimental results obtained from the streaming potential measurements for I = 0.15 M and various pH: (1) (●) pH 3.5; (2) (▲) pH 5.5; and, (3) (♦) pH 7.4.
Figure 5.
The dependence of the zeta potential of mica
on the surface concentration of HSA expressed in µm−2. The points denote experimental results obtained from the streaming potential measurements for I = 0.15 M and various pH: (1) (●) pH 3.5; (2) (▲) pH 5.5; and, (3) (♦) pH 7.4.

Figure 6.
The kinetics of particle deposition on HSA layers determined by optical microscopy and AFM imaging for ionic strength 0.15 M, pH 5.5, bulk microparticle concentration 0.5% (5000 mg L−1). The points denote the experimental data obtained for various HSA monolayer coverage adsorbed at pH 3.5 and ionic strength of 0.01 M: (1) (♦) N = 2 × 10³ [µm−2]; (2) (●) N = 7.5 × 10² [µm−2]; (3) (●) N = 3 × 10² [µm−2]; (4) (▲) N = 80 [µm−2]. The solid lines are fits of experimental data and the dashed line shows the theoretical results calculated from the RSA model for positively charged particles of the size equal to 820 nm.

Figure 7.
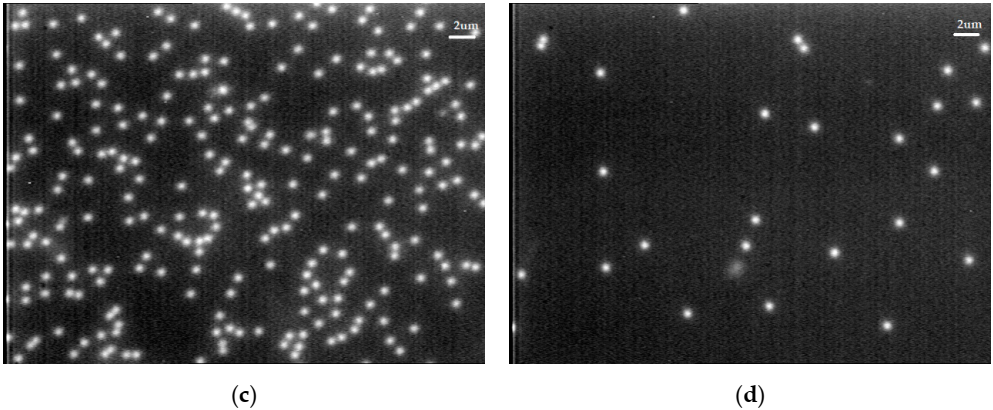
Micrographs of particle layers on top of HSA layers on mica acquired by optical microscopy under wet conditions, dark field illumination. (a) particle coverage 0.52, HSA surface concentration N = 2 × 103 µm−2, (b)particle coverage 0.20, HSA surface concentration N = 7.5 × 102 µm−2, (c) particle coverage 0.08, HSA surface concentration N = 6 × 102 µm−2, and (d) particle coverage 0.02, HSA surface concentration N = 4 × 102 µm−2.
Figure 7.
Micrographs of particle layers on top of HSA layers on mica acquired by optical microscopy under wet conditions, dark field illumination. (a) particle coverage 0.52, HSA surface concentration N = 2 × 103 µm−2, (b)particle coverage 0.20, HSA surface concentration N = 7.5 × 102 µm−2, (c) particle coverage 0.08, HSA surface concentration N = 6 × 102 µm−2, and (d) particle coverage 0.02, HSA surface concentration N = 4 × 102 µm−2.


Figure 8.
The dependence of the maximum coverage of microparticles on the HSA layers of various surface concentration determined by optical microscopy and AFM imaging. The points denote the experimental data obtained for various ionic strengths of the particle suspension: (1) (○) 0.15 M; (2) (▲) 0.05 M; (3) ( ![Colloids 04 00051 i001]() ) 0.04 M; (4) (
) 0.04 M; (4) ( ![Colloids 04 00051 i002]() ) 0.03 M; (5) (■) 0.02 M. The solid lines are fits of experimental data. Part (a), pH 5.5; part (b), pH 7.4 (PBS).
) 0.03 M; (5) (■) 0.02 M. The solid lines are fits of experimental data. Part (a), pH 5.5; part (b), pH 7.4 (PBS).
 ) 0.04 M; (4) (
  ) 0.03 M; (5) (■) 0.02 M. The solid lines are fits of experimental data. Part (a), pH 5.5; part (b), pH 7.4 (PBS).
Figure 8.
The dependence of the maximum coverage of microparticles on the HSA layers of various surface concentration determined by optical microscopy and AFM imaging. The points denote the experimental data obtained for various ionic strengths of the particle suspension: (1) (○) 0.15 M; (2) (▲) 0.05 M; (3) ( ![Colloids 04 00051 i001]() ) 0.04 M; (4) (
) 0.04 M; (4) ( ![Colloids 04 00051 i002]() ) 0.03 M; (5) (■) 0.02 M. The solid lines are fits of experimental data. Part (a), pH 5.5; part (b), pH 7.4 (PBS).
) 0.03 M; (5) (■) 0.02 M. The solid lines are fits of experimental data. Part (a), pH 5.5; part (b), pH 7.4 (PBS).
) 0.04 M; (4) ( ) 0.03 M; (5) (■) 0.02 M. The solid lines are fits of experimental data. Part (a), pH 5.5; part (b), pH 7.4 (PBS).

Figure 9.
The normalized maximum coverage of microparticles on the saturated HSA monolayer vs. the electric double-layer thickness : 1 ( ![Colloids 04 00051 i003]() ) pH 7.4, 2 (▲) pH 5.5, 3 (●) pH 3.5 (previous data from Ref. [31]). The solid lines are fits of experimental data.
) pH 7.4, 2 (▲) pH 5.5, 3 (●) pH 3.5 (previous data from Ref. [31]). The solid lines are fits of experimental data.
 ) pH 7.4, 2 (▲) pH 5.5, 3 (●) pH 3.5 (previous data from Ref. [31]). The solid lines are fits of experimental data.
Figure 9.
The normalized maximum coverage of microparticles on the saturated HSA monolayer vs. the electric double-layer thickness : 1 ( ![Colloids 04 00051 i003]() ) pH 7.4, 2 (▲) pH 5.5, 3 (●) pH 3.5 (previous data from Ref. [31]). The solid lines are fits of experimental data.
) pH 7.4, 2 (▲) pH 5.5, 3 (●) pH 3.5 (previous data from Ref. [31]). The solid lines are fits of experimental data.
) pH 7.4, 2 (▲) pH 5.5, 3 (●) pH 3.5 (previous data from Ref. [31]). The solid lines are fits of experimental data.
Publisher’s Note: MDPI stays neutral with regard to jurisdictional claims in published maps and institutional affiliations. |
© 2020 by the authors. Licensee MDPI, Basel, Switzerland. This article is an open access article distributed under the terms and conditions of the Creative Commons Attribution (CC BY) license (http://creativecommons.org/licenses/by/4.0/).
Share and Cite
MDPI and ACS Style
Nattich-Rak, M.; Dąbkowska, M.; Adamczyk, Z. Microparticle Deposition on Human Serum Albumin Layers: Unraveling Anomalous Adsorption Mechanism. Colloids Interfaces 2020, 4, 51. https://0-doi-org.brum.beds.ac.uk/10.3390/colloids4040051
AMA Style
Nattich-Rak M, Dąbkowska M, Adamczyk Z. Microparticle Deposition on Human Serum Albumin Layers: Unraveling Anomalous Adsorption Mechanism. Colloids and Interfaces. 2020; 4(4):51. https://0-doi-org.brum.beds.ac.uk/10.3390/colloids4040051
Chicago/Turabian StyleNattich-Rak, Małgorzata, Maria Dąbkowska, and Zbigniew Adamczyk. 2020. "Microparticle Deposition on Human Serum Albumin Layers: Unraveling Anomalous Adsorption Mechanism" Colloids and Interfaces 4, no. 4: 51. https://0-doi-org.brum.beds.ac.uk/10.3390/colloids4040051