
Evaporation of Sessile Droplets of Polyelectrolyte/Surfactant Mixtures on Silicon Wafers

 ,
, 
 and
and 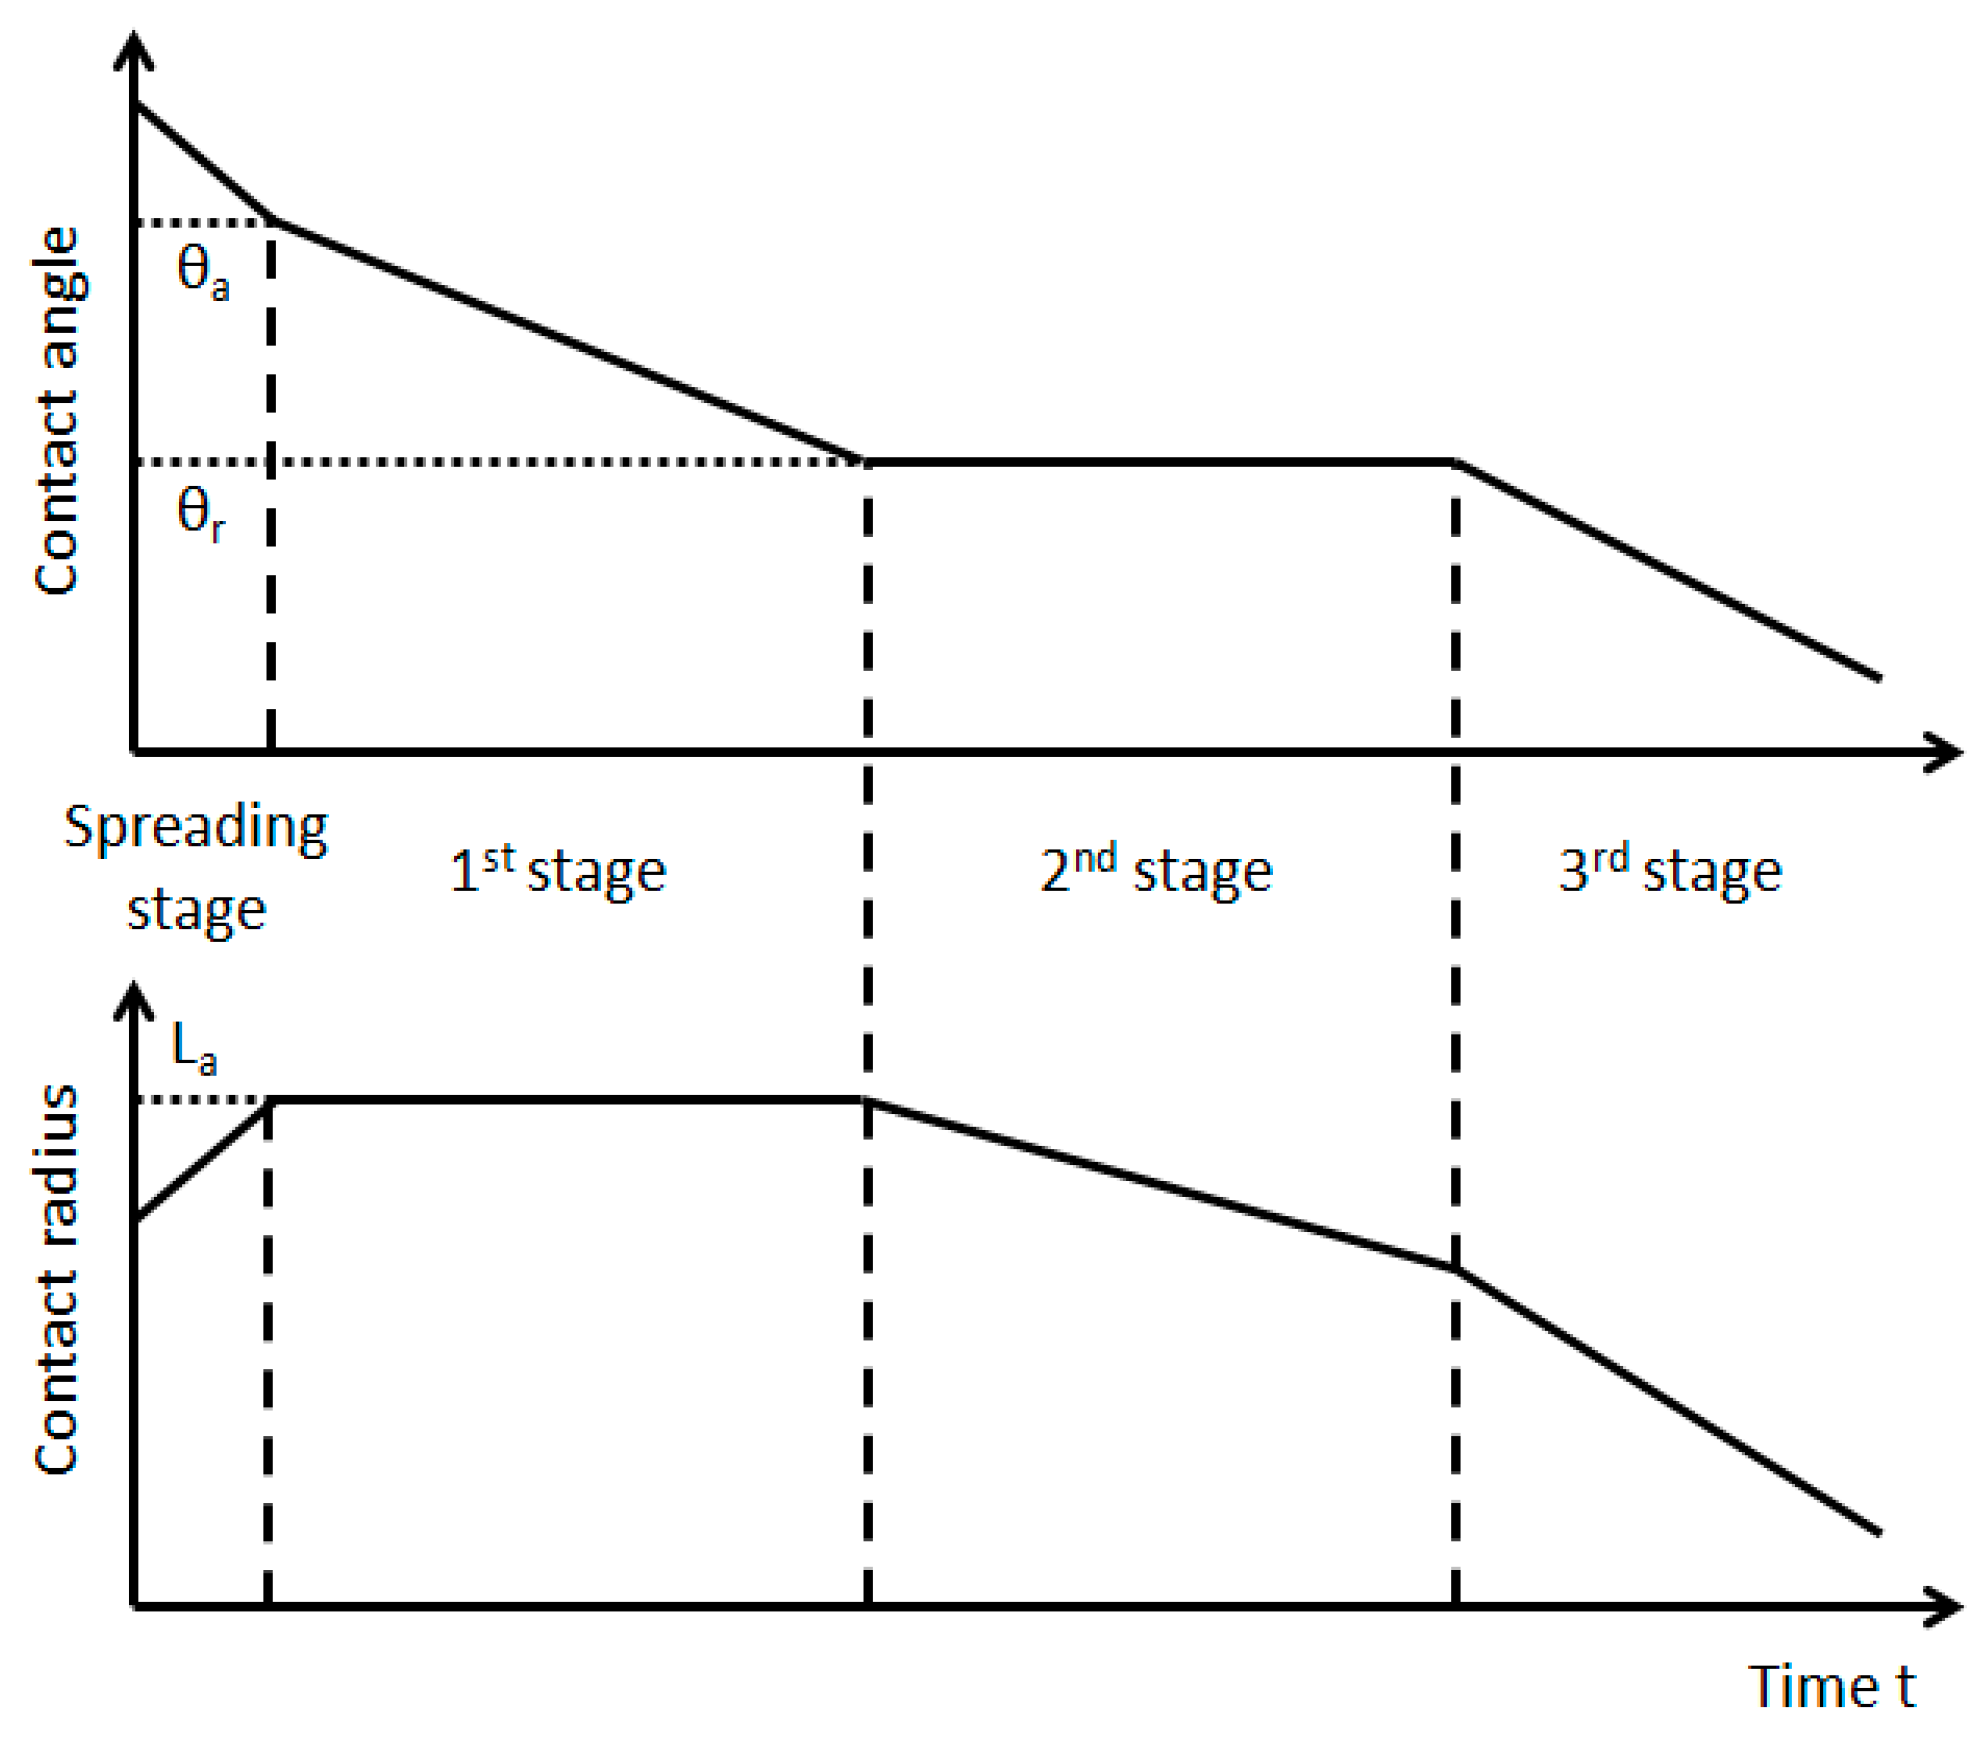
Abstract
:1. Introduction
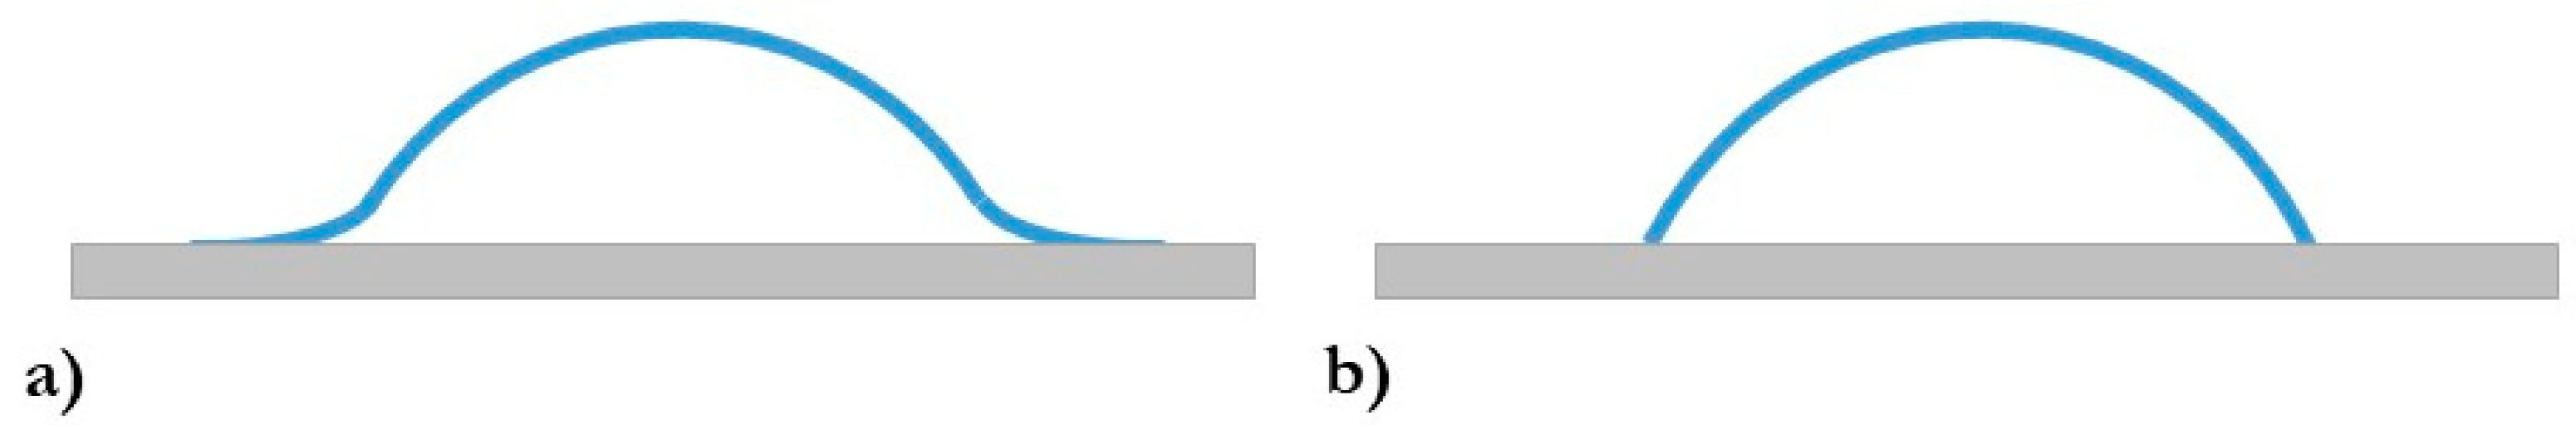
2. The Stages of the Evaporation Process of a Sessile Droplet
3. Materials and Methods
3.1. Chemicals
3.2. Polyelectrolyte–Surfactant Aqueous Mixtures Preparation
3.3. Techniques
3.3.1. Polyelectrolyte–Surfactant Association in Solution
3.3.2. Adsorption of Polyelectrolyte–Surfactant Aqueous Mixtures to Interfaces
3.3.3. Evaporation and Spreading of Droplets of Polyelectrolyte–Surfactant Aqueous Mixtures on Silicon Wafers
4. Results and Discussion
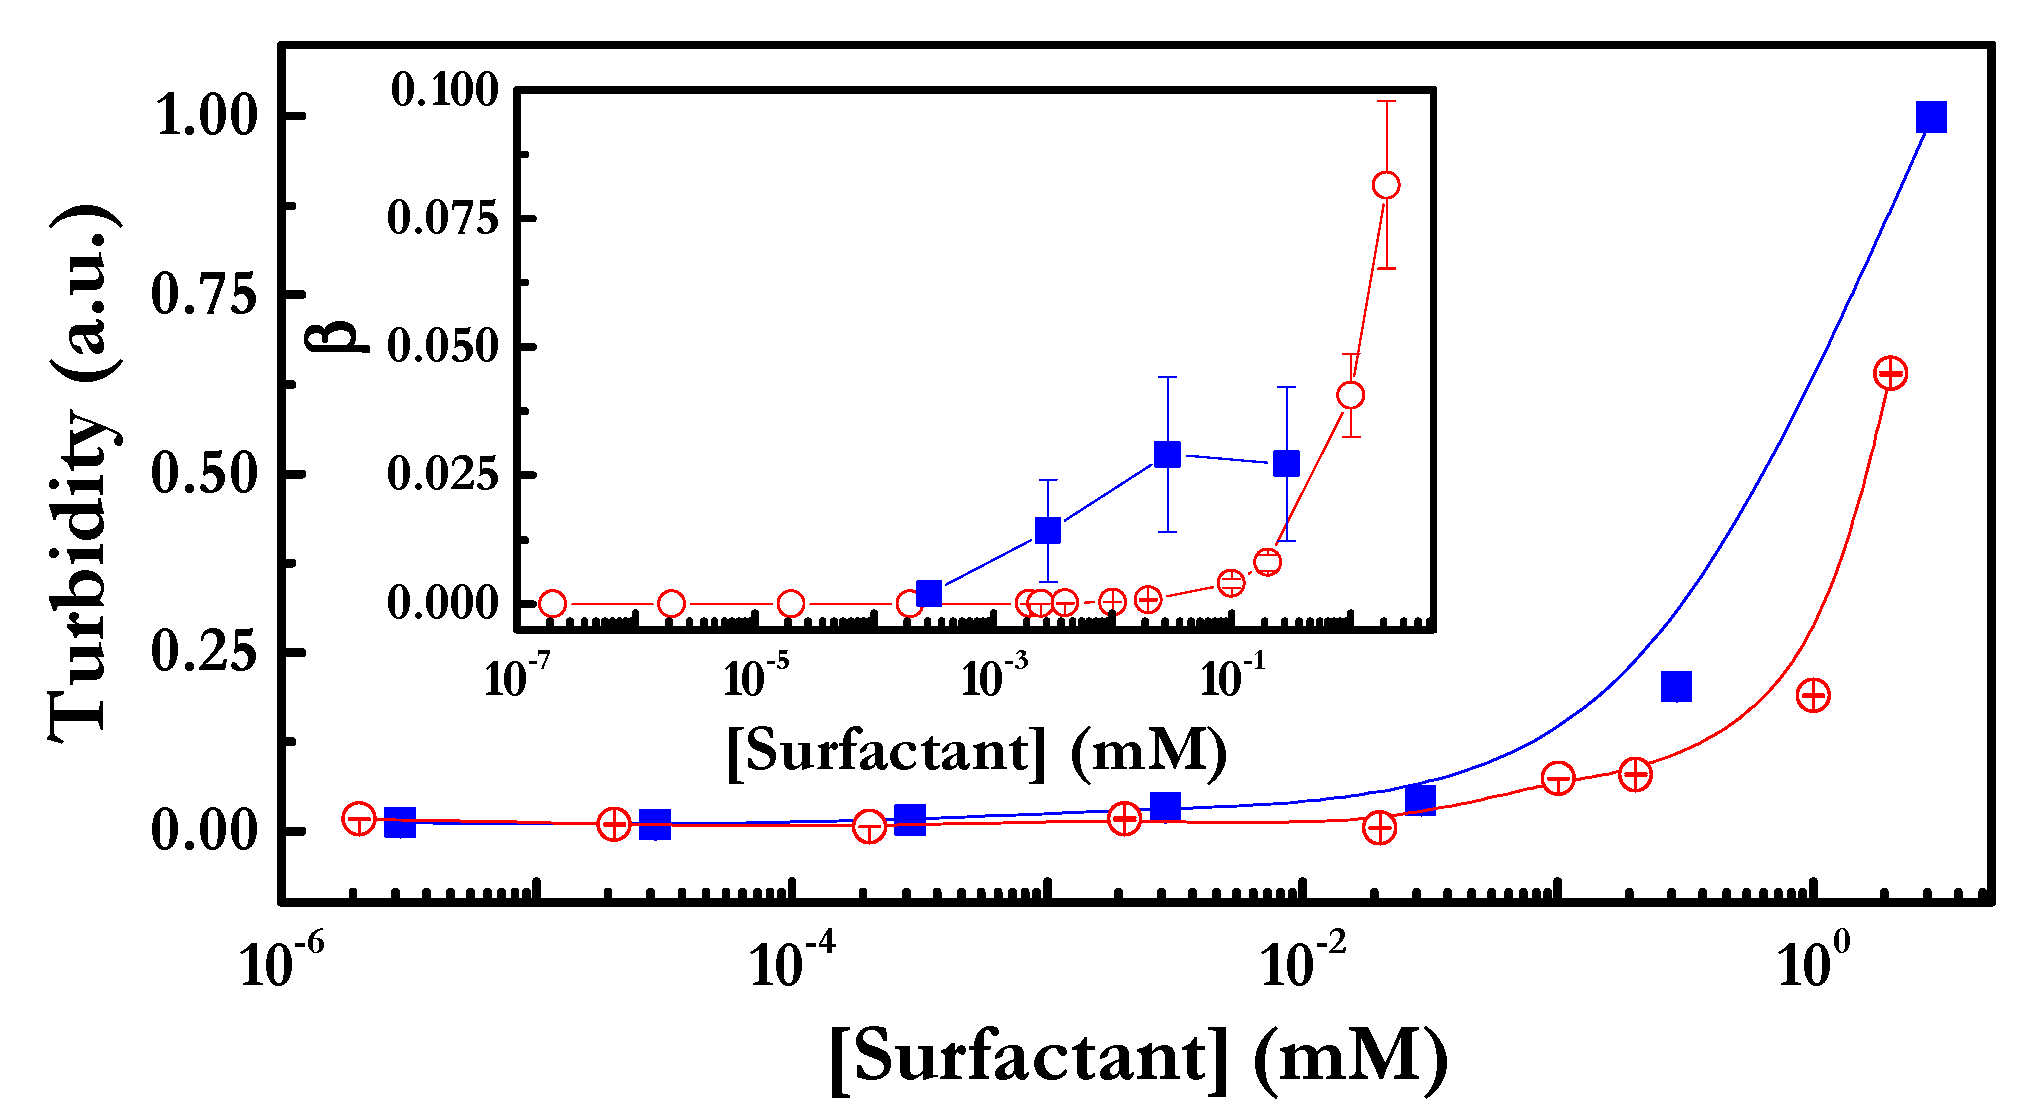
4.1. PDADMAC–Surfactant Association in Solution
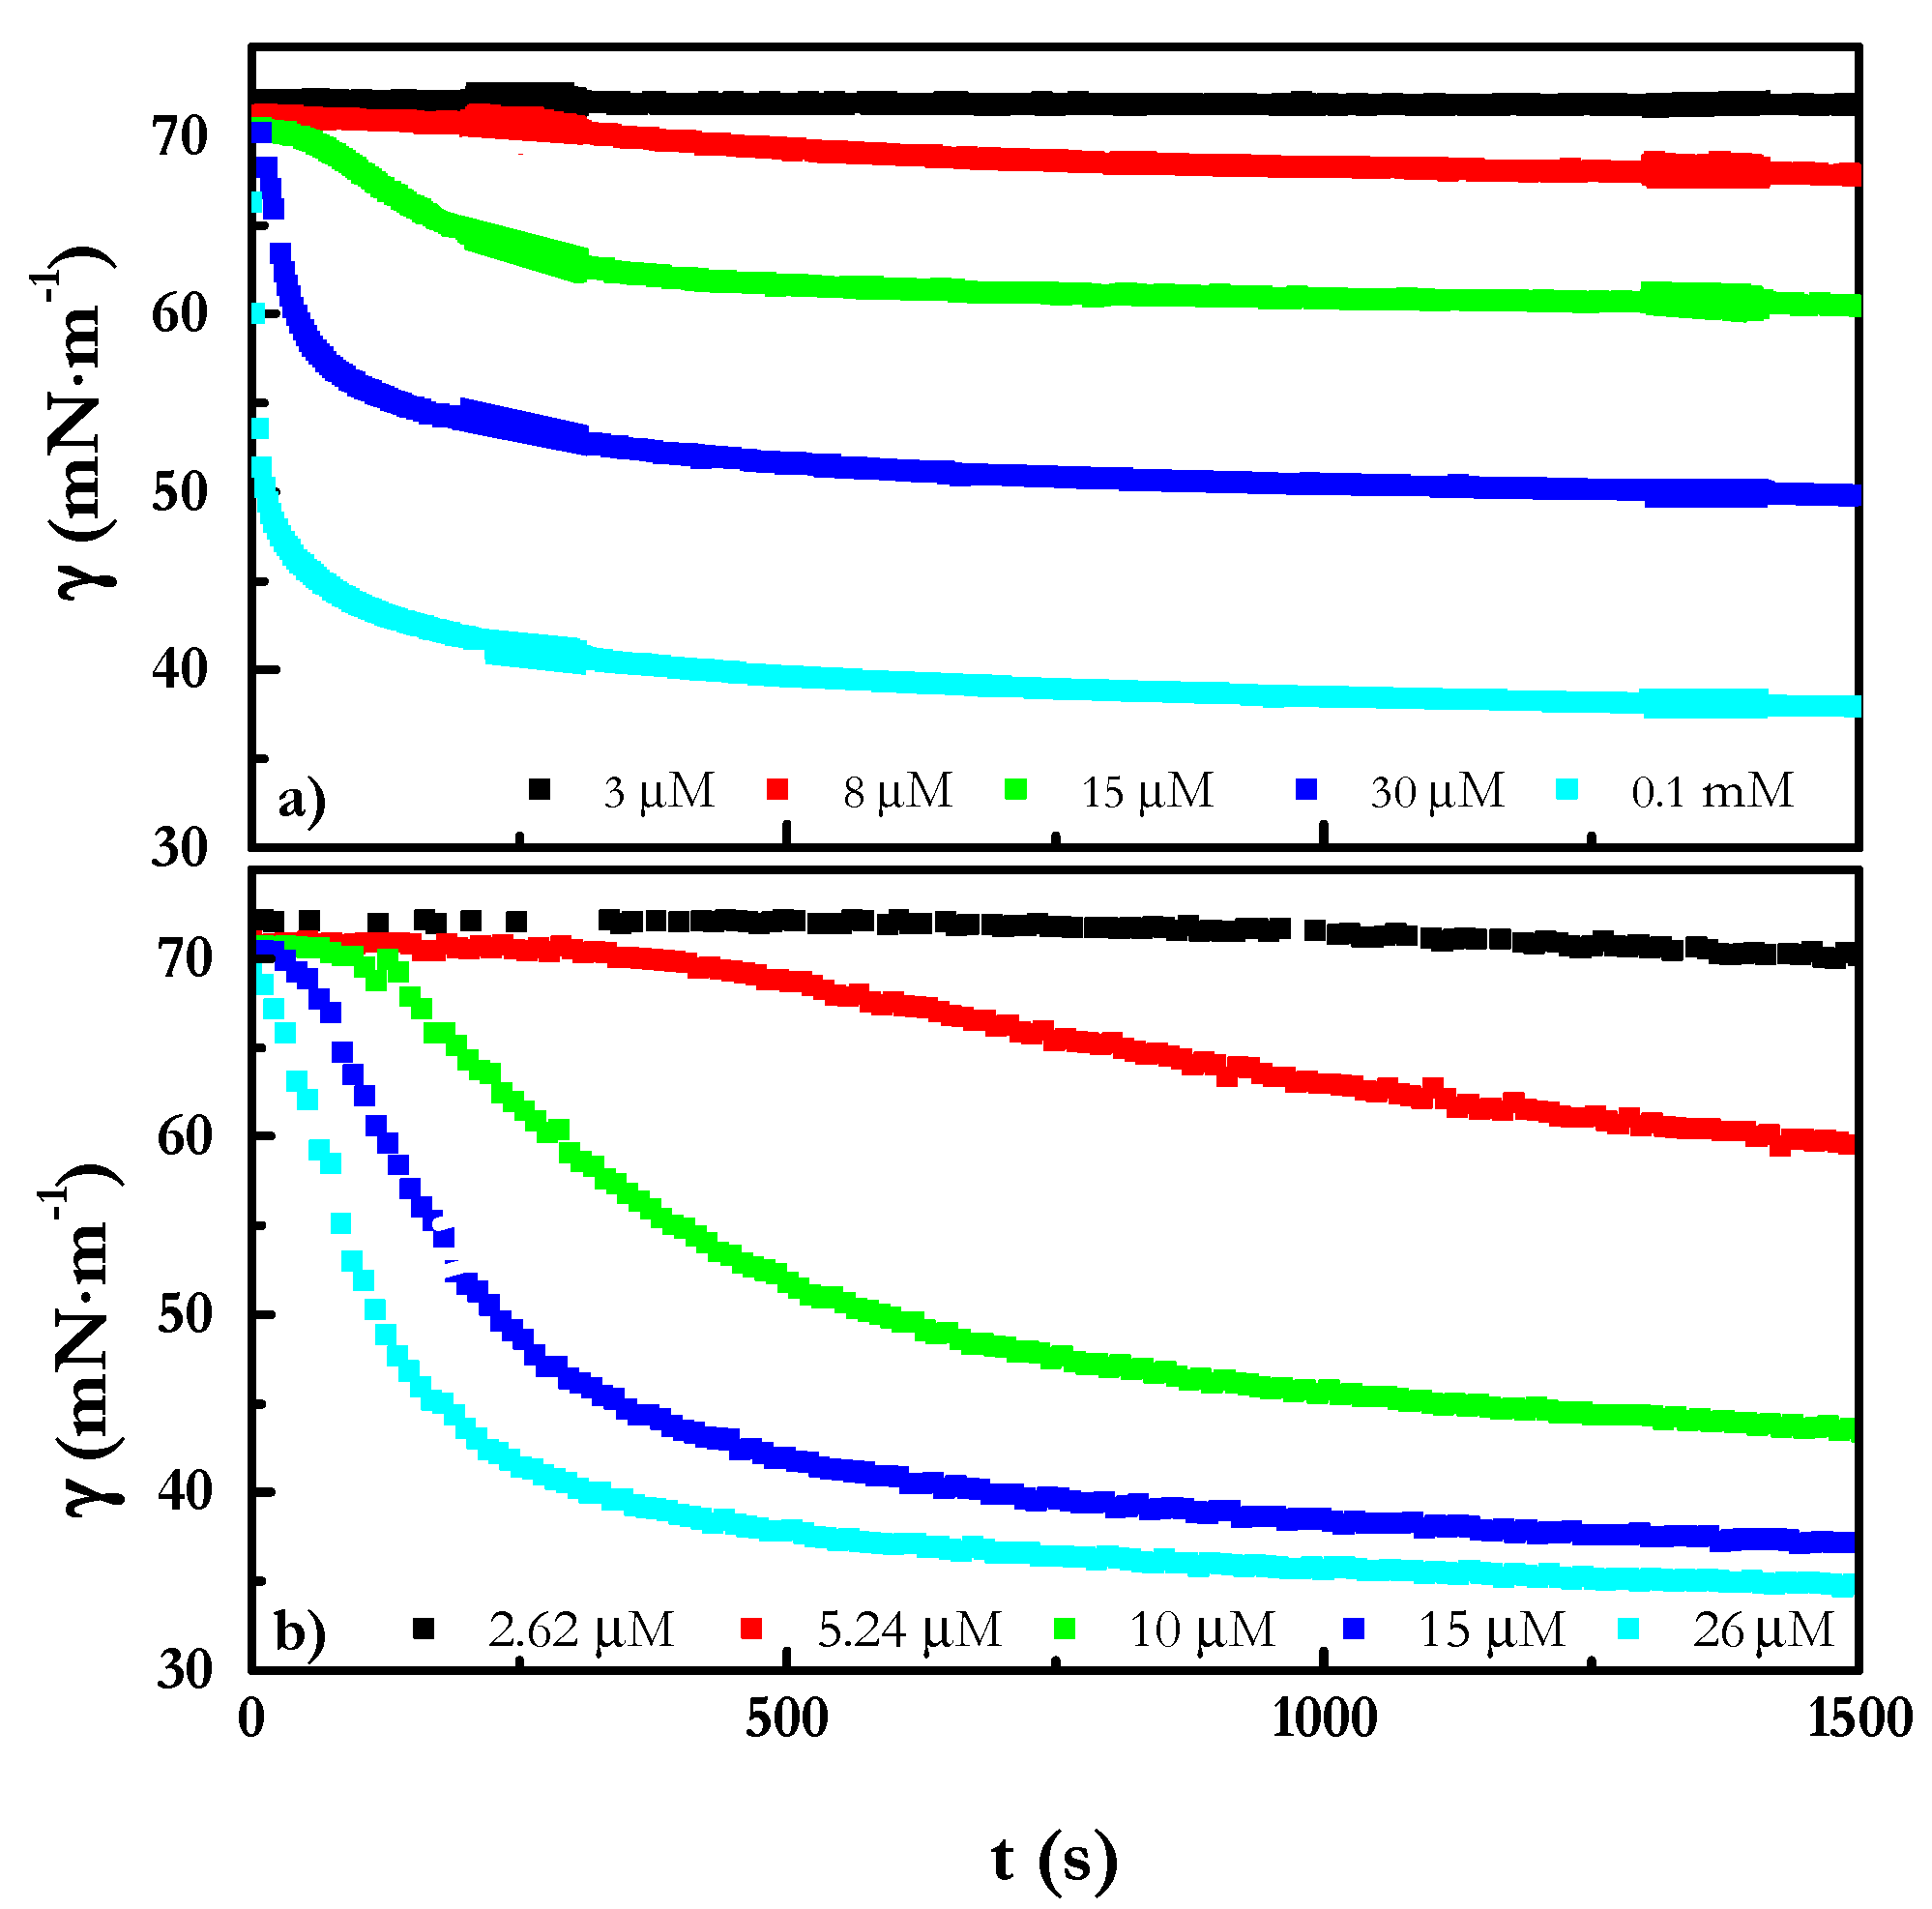
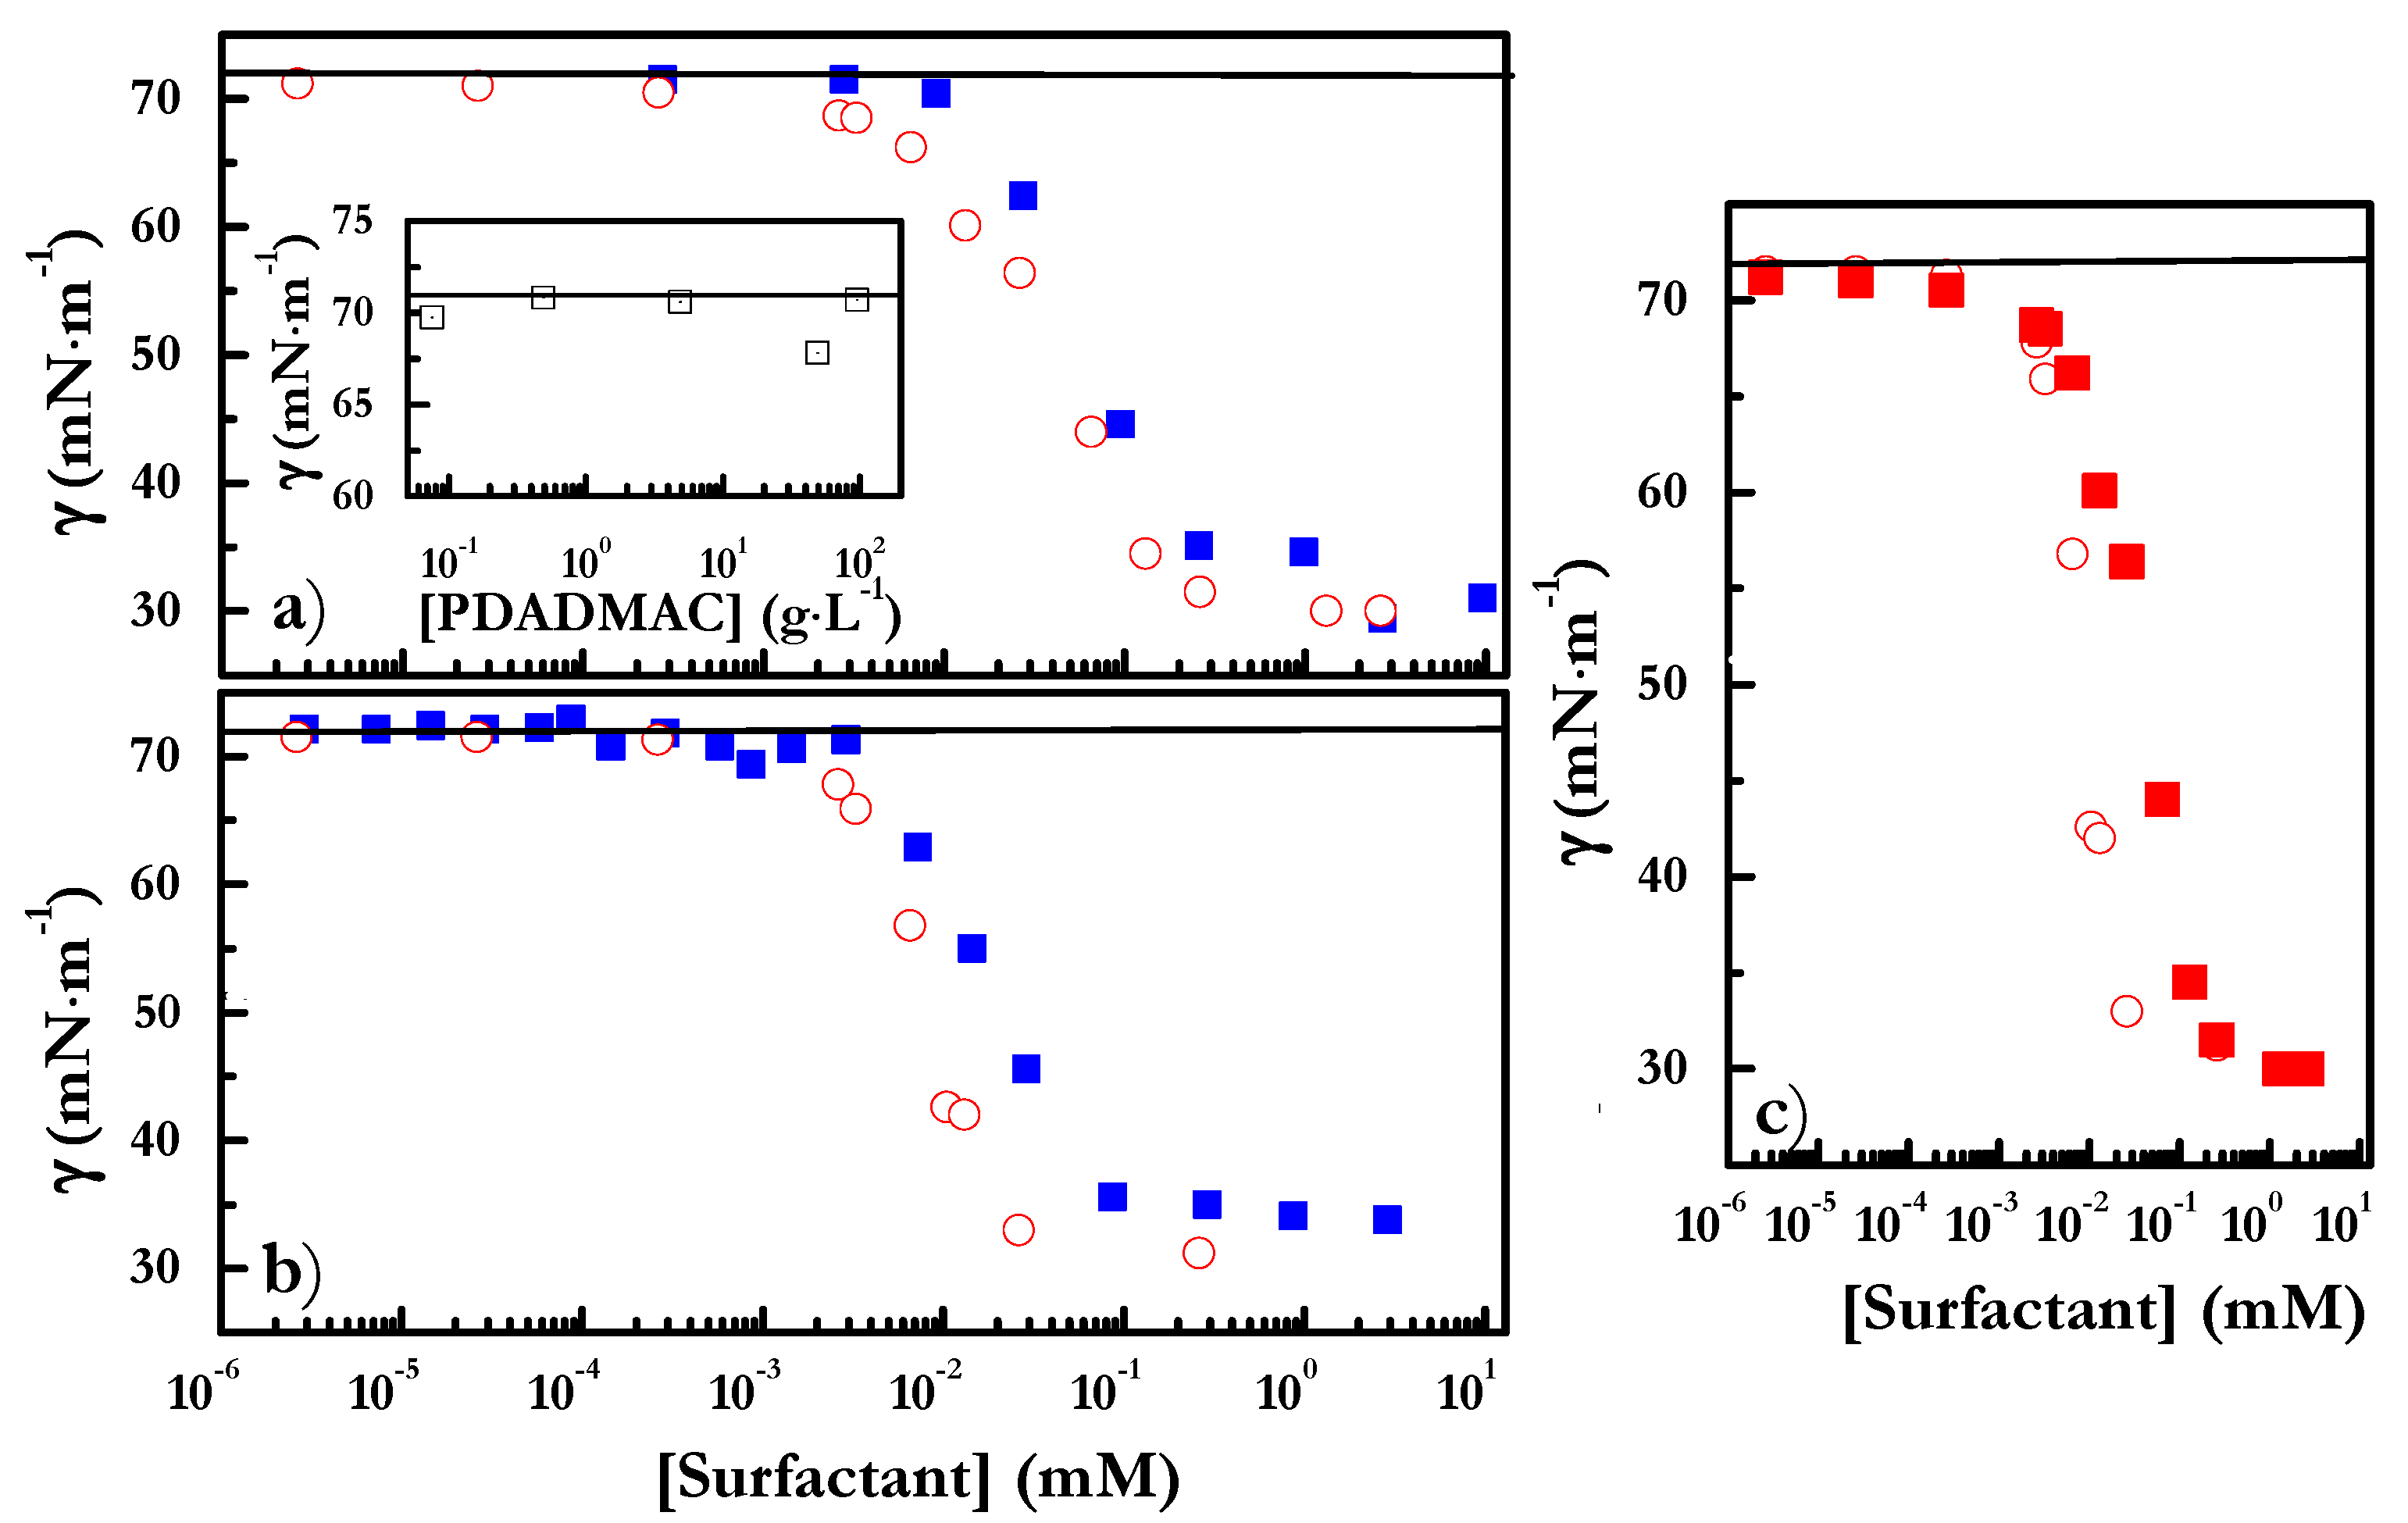
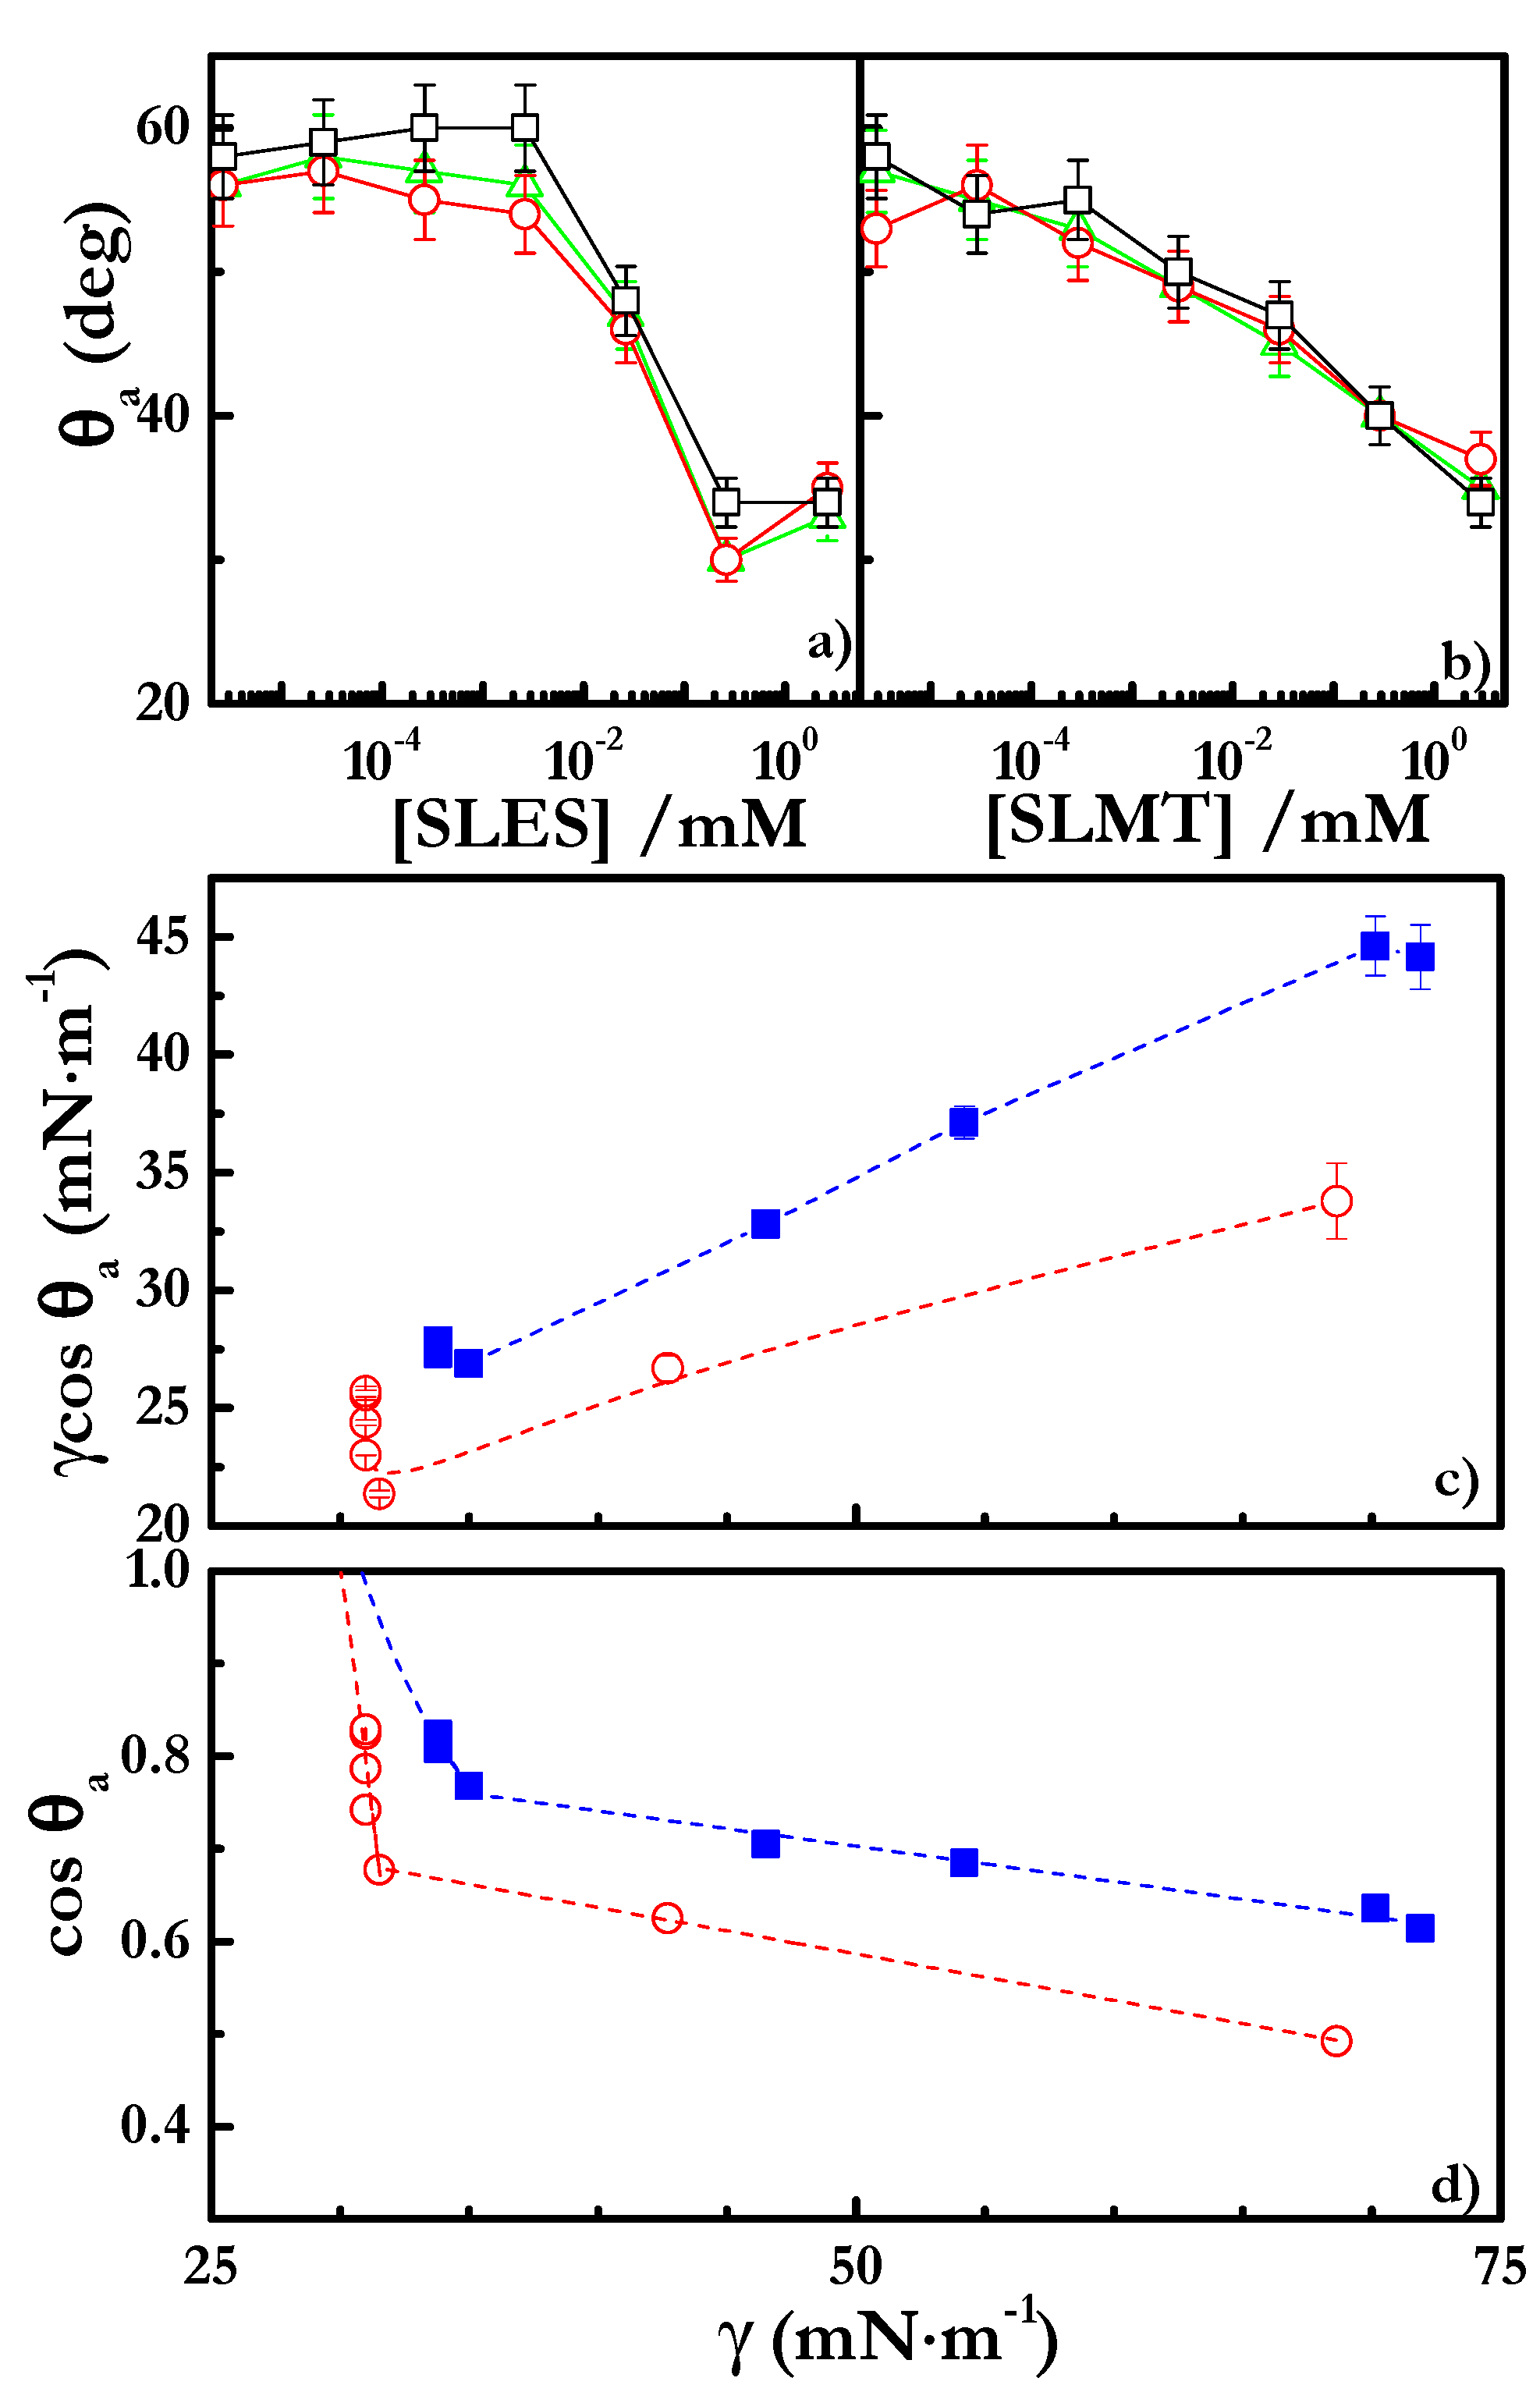
4.2. Adsorption at the Liquid/Vapor Interface
4.3. Spreading Behavior
4.4. Evaporation Behavior
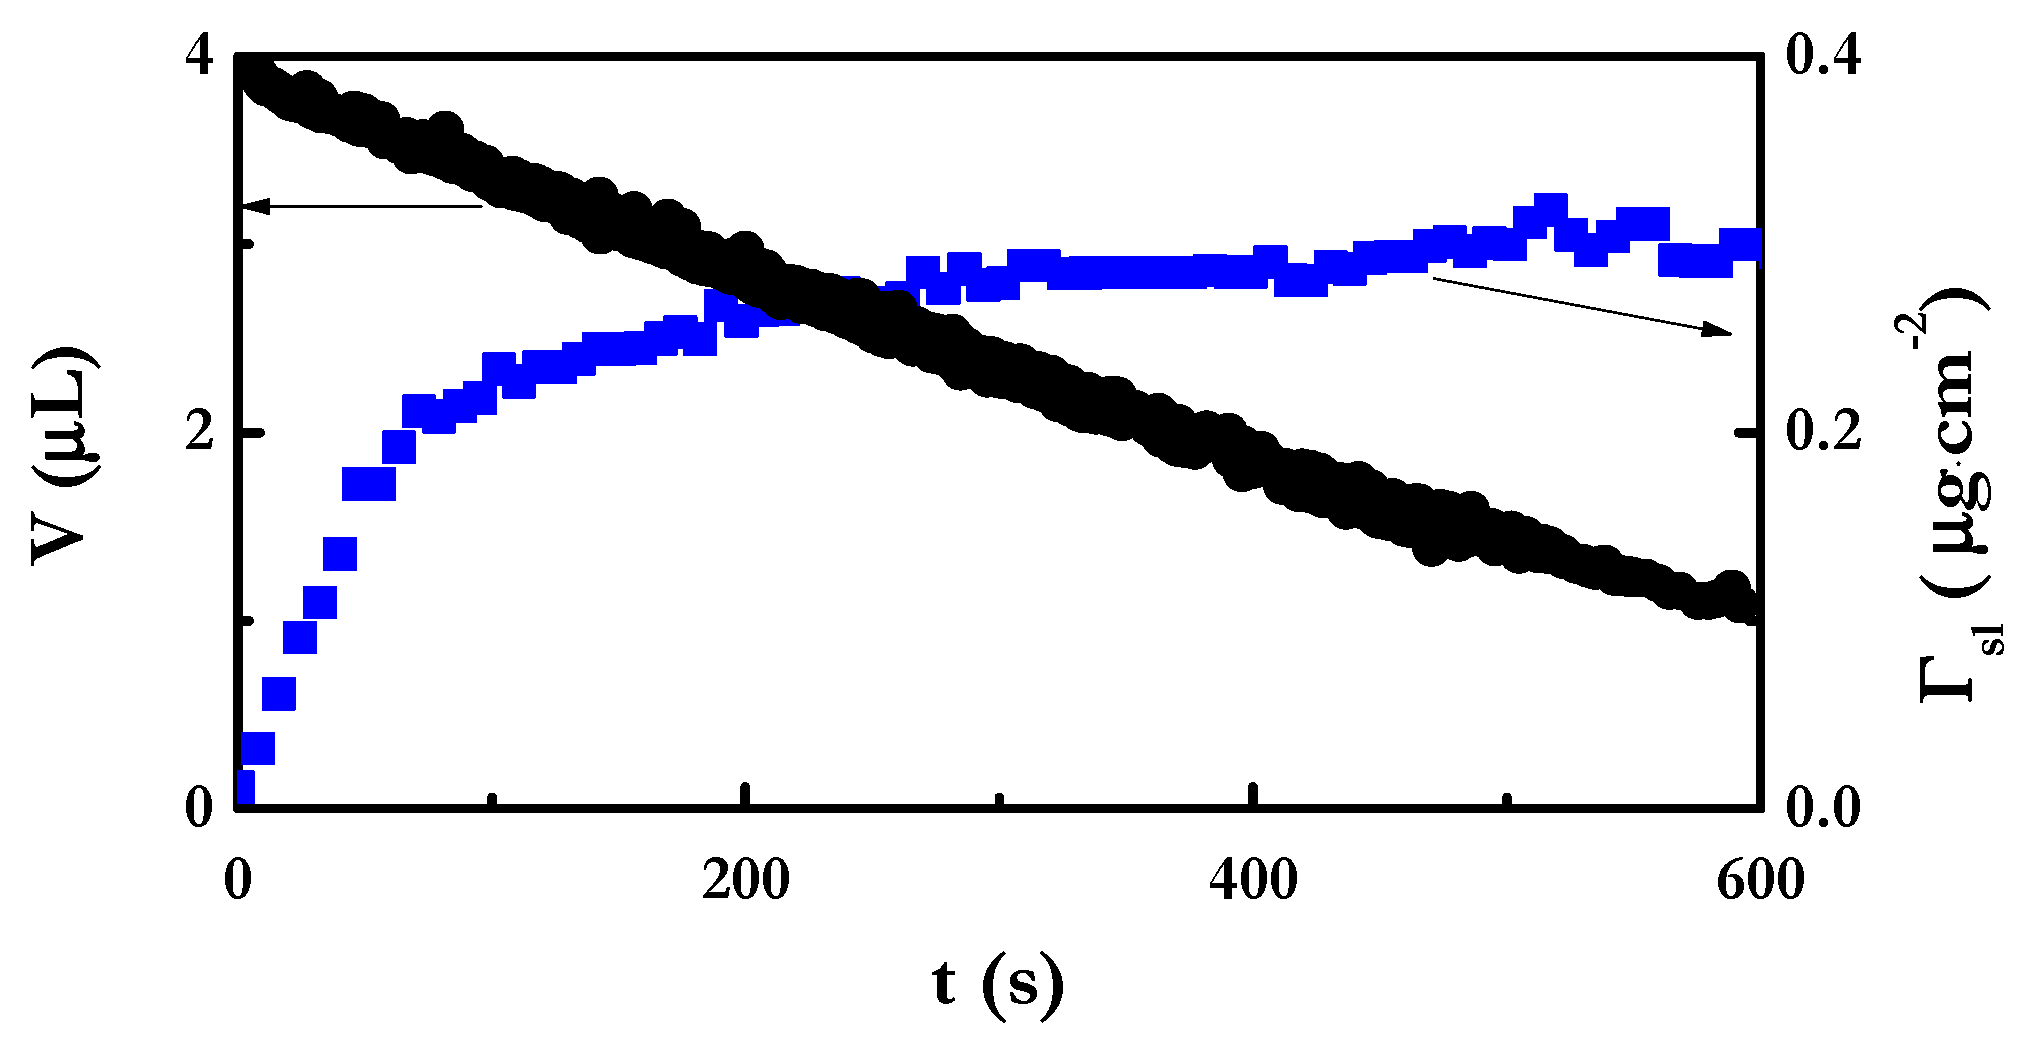
4.4.1. Kinetics of Evaporation of the Mixtures
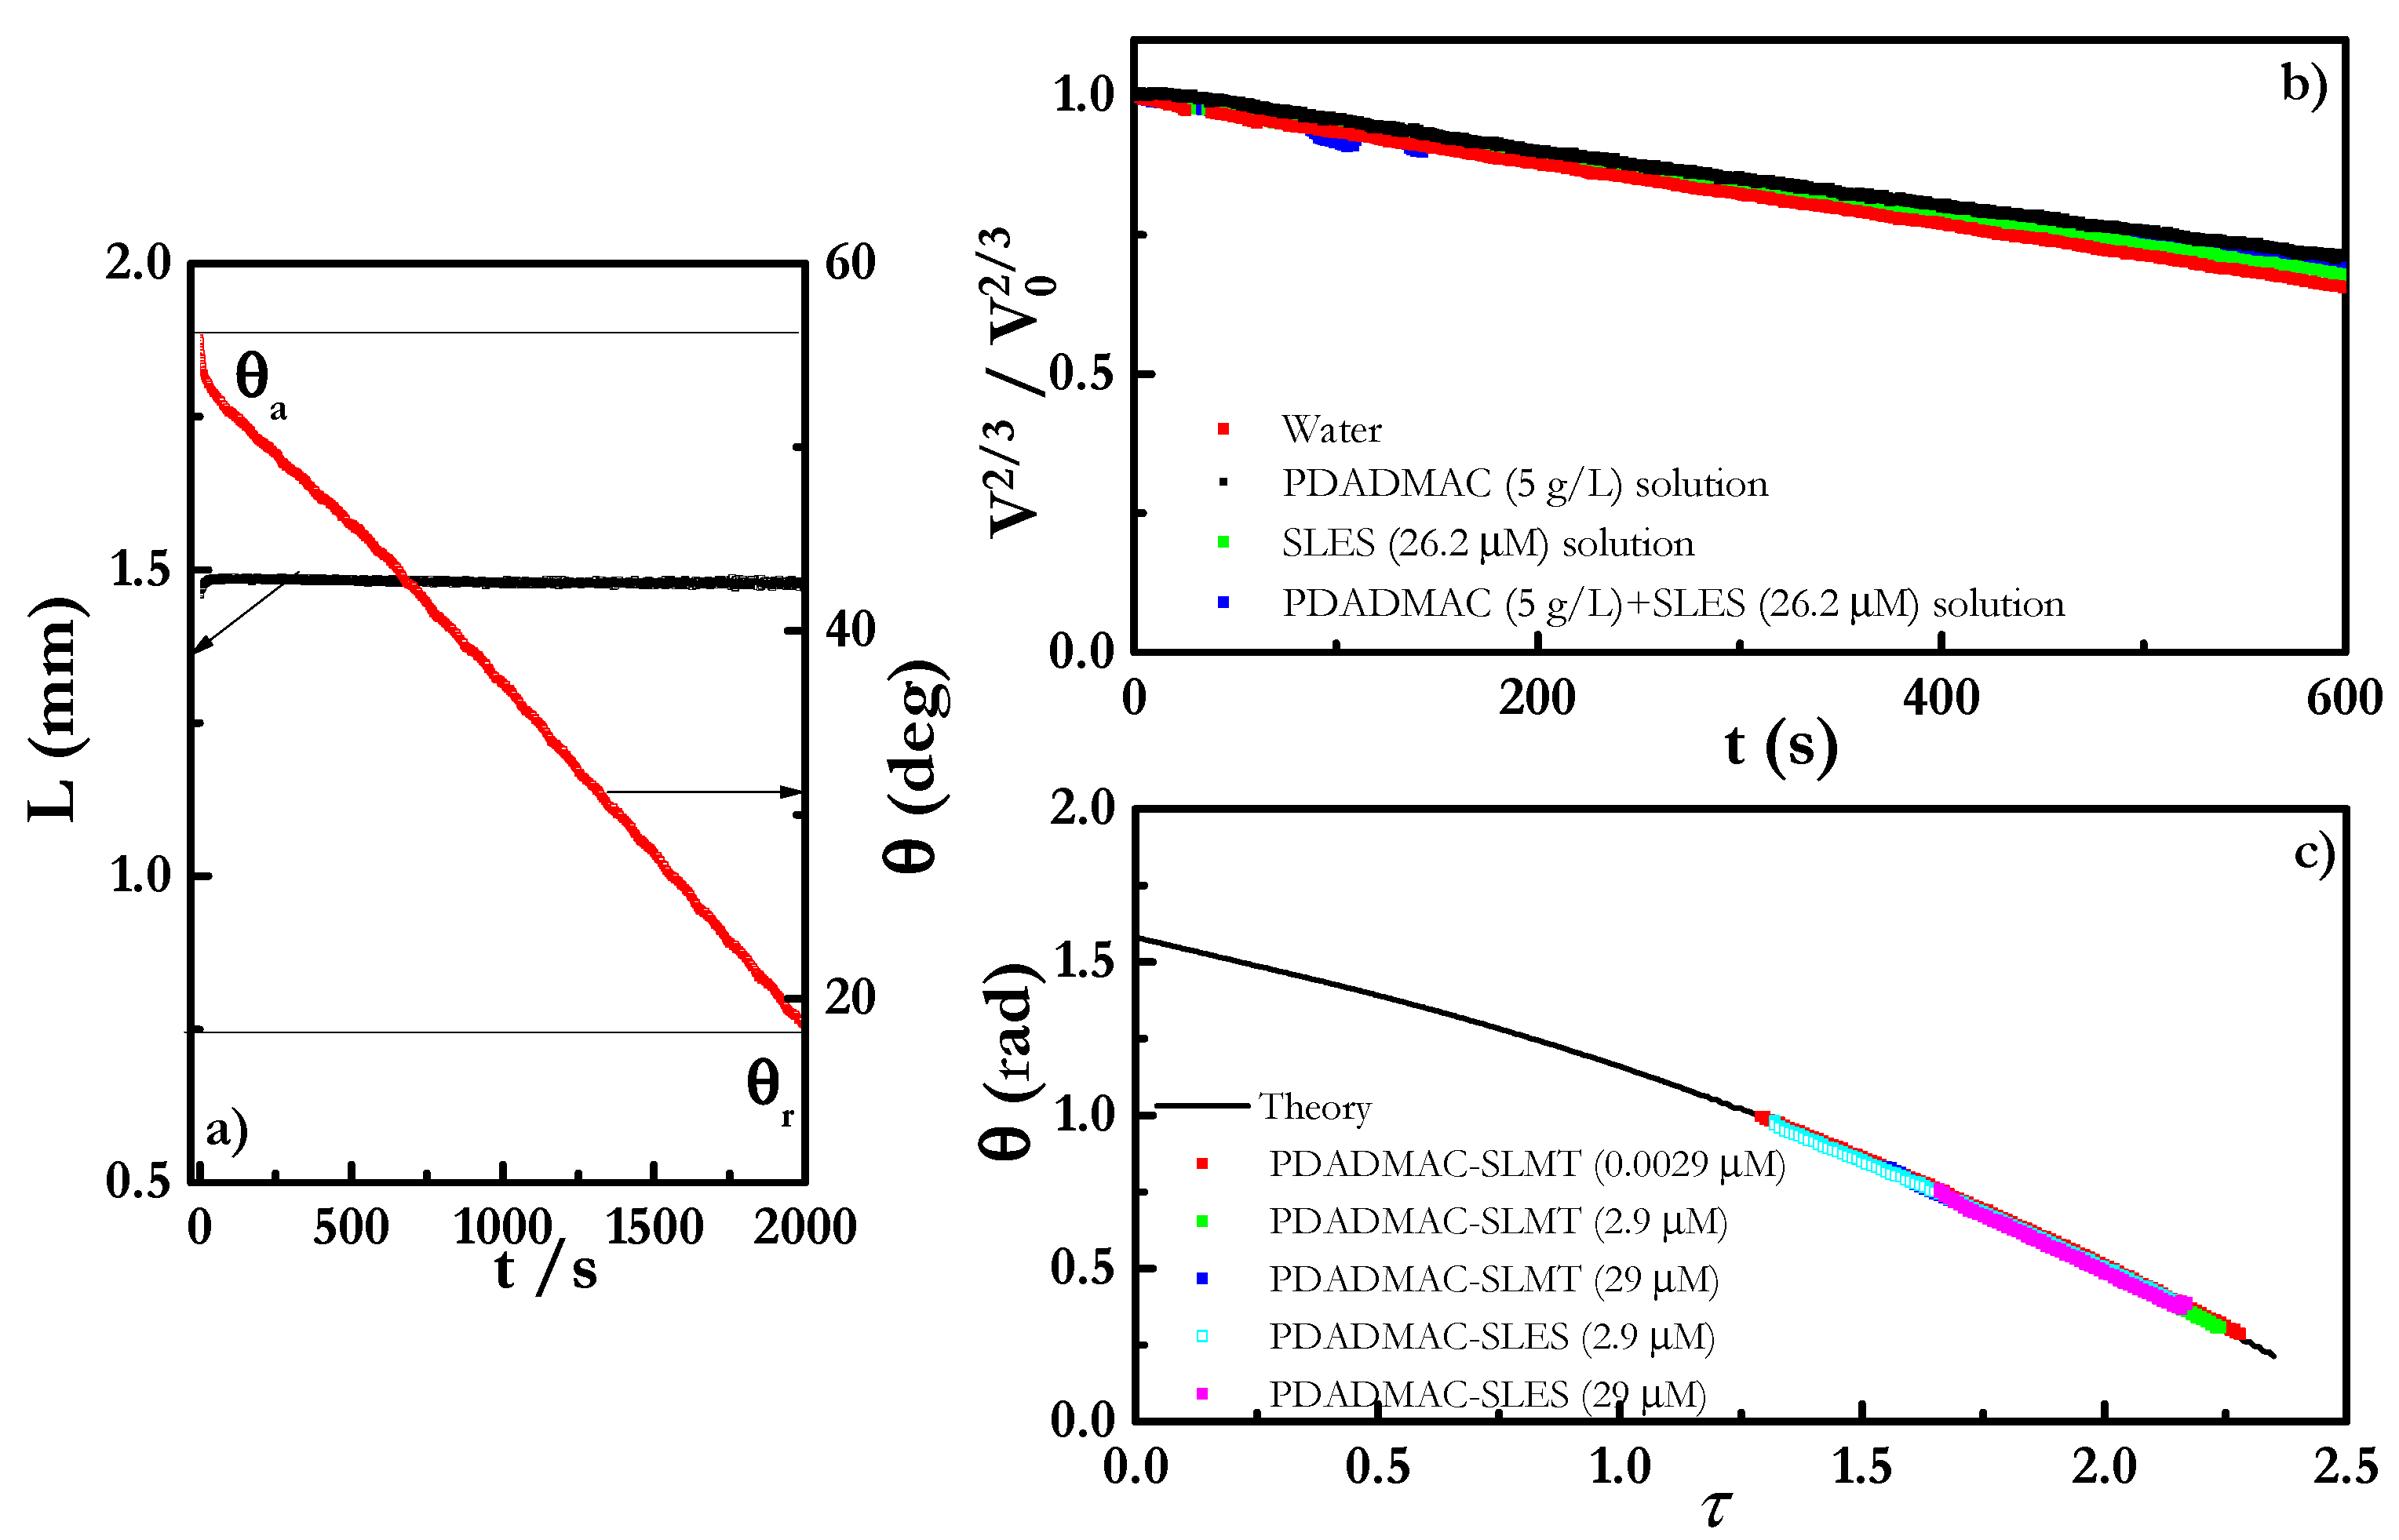
4.4.2. Theoretical Analysis of Evaporation of the Mixtures
5. Conclusions
Author Contributions
Funding
Data Availability Statement
Acknowledgments
Conflicts of Interest
Appendix A. Theoretical Description of the Evaporation
Appendix B. Adsorbed Surface Layers and Evaporation Rate
Appendix C. Effect of the Change of the Solution Concentration on the Contact Angle during the Evaporation


References
- Diddens, C.; Tan, H.; Lv, P.; Versluis, M.; Kuerten, J.G.M.; Zhang, X.; Lohse, D. Evaporating pure, binary and ternary droplets: Thermal effects and axial symmetry breaking. J. Fluid Mech. 2017, 823, 470–497. [Google Scholar] [CrossRef] [Green Version]
- Worden, J.; Noone, D.; Bowman, K. Importance of rain evaporation and continental convection in the tropical water cycle. Nature 2007, 445, 528–532. [Google Scholar] [CrossRef]
- Fakhru’l-Razi, A.; Pendashteh, A.; Abdullah, L.C.; Biak, D.R.A.; Madaeni, S.S.; Abidin, Z.Z. Review of technologies for oil and gas produced water treatment. J. Hazard. Mat. 2009, 170, 530–551. [Google Scholar] [CrossRef] [PubMed]
- Kitano, T.; Nishio, J.; Kurose, R.; Komori, S. Evaporation and combustion of multicomponent fuel droplets. Fuel 2014, 136, 219–225. [Google Scholar] [CrossRef] [Green Version]
- Perrin, L.; Castanet, G.; Lemoine, F. Characterization of the evaporation of interacting droplets using combined optical techniques. Exp. Fluids 2015, 56, 29. [Google Scholar] [CrossRef]
- Duan, F.; Ward, C.A. Investigation of Local Evaporation Flux and Vapor-Phase Pressure at an Evaporative Droplet Interface. Langmuir 2009, 25, 7424–7431. [Google Scholar] [CrossRef] [PubMed]
- He, C.; Liu, C.; Gao, H.; Xie, H.; Li, Y.; Wu, S.; Xu, J. The optimal evaporation temperature and working fluids for subcritical organic Rankine cycle. Energy 2012, 38, 136–143. [Google Scholar] [CrossRef]
- Günay, A.A.; Sett, S.; Oh, J.; Miljkovic, N. Steady Method for the Analysis of Evaporation Dynamics. Langmuir 2017, 33, 12007–12015. [Google Scholar] [CrossRef]
- Sáenz, P.J.; Wray, A.W.; Che, Z.; Matar, O.K.; Valluri, P.; Kim, J.; Sefiane, K. Dynamics and universal scaling law in geometrically-controlled sessile drop evaporation. Nature Comm. 2017, 8, 14783. [Google Scholar] [CrossRef] [Green Version]
- Tan, H.; Diddens, C.; Lv, P.; Kuerten, J.G.M.; Zhang, X.; Lohse, D. Evaporation-triggered microdroplet nucleation and the four life phases of an evaporating Ouzo drop. Proc. Nat. Acad. Sci. USA 2016, 113, 8642–8647. [Google Scholar] [CrossRef] [PubMed] [Green Version]
- Sobac, B.; Brutin, D. Thermocapillary instabilities in an evaporating drop deposited onto a heated substrate. Phys. Fluids 2012, 24, 032103. [Google Scholar] [CrossRef]
- Gao, M.; Kong, P.; Zhang, L.-X. Evaporation dynamics of different sizes sessile droplets on hydrophilic and hydrophobic heating surface under constant wall heat fluxes conditions. Int. Comm. Heat Mass Transf. 2018, 93, 93–99. [Google Scholar] [CrossRef]
- Christy, J.R.E.; Sefiane, K.; Munro, E. A Study of the Velocity Field during Evaporation of Sessile Water and Water/Ethanol Drops. J. Bionic Eng. 2010, 7, 321–328. [Google Scholar] [CrossRef]
- He, M.; Qiu, H. Internal flow patterns of an evaporating multicomponent droplet on a flat surface. Int. J. Therm. Sci. 2016, 100, 10–19. [Google Scholar] [CrossRef] [Green Version]
- Shi, L.; Shen, P.; Zhang, D.; Lin, Q.; Jiang, Q. Wetting and evaporation behaviors of water–ethanol sessile drops on PTFE surfaces. Surf. Interface Anal. 2009, 41, 951–955. [Google Scholar] [CrossRef]
- Guéna, G.; Poulard, C.; Cazabat, A.M. Evaporating drops of alkane mixtures. Colloids Surf. A 2007, 298, 2–11. [Google Scholar] [CrossRef] [Green Version]
- Báez-López, D.; Báez-Villegas, D.A. Matlab Handbook with Applications to Mathermatics, Engineering and Finance; Chapman and Hall/CRC: Boca Ratón, FL, USA, 2019. [Google Scholar]
- Perrin, L.; Pajor-Swierzy, A.; Magdassi, S.; Kamyshny, A.; Ortega, F.; Rubio, R.G. Evaporation of Nanosuspensions on Substrates with Different Hydrophobicity. ACS Appl. Mat. Interfaces 2018, 10, 3082–3093. [Google Scholar] [CrossRef]
- Semenov, S.; Trybala, A.; Agogo, H.; Kovalchuk, N.; Ortega, F.; Rubio, R.G.; Starov, V.M.; Velarde, M.G. Evaporation of droplets of surfactant solutions. Langmuir 2013, 29, 10028–10036. [Google Scholar] [CrossRef] [Green Version]
- Pham, T.; Kumar, S. Drying of Droplets of Colloidal Suspensions on Rough Substrates. Langmuir 2017, 33, 10061–10076. [Google Scholar] [CrossRef] [PubMed]
- Larson, R.G. Transport and deposition patterns in drying sessile droplets. AIChE J. 2014, 60, 1538–1571. [Google Scholar] [CrossRef] [Green Version]
- Mampallil, D.; Eral, H.B. A review on suppression and utilization of the coffee-ring effect. Adv. Colloid Interface Sci. 2018, 252, 38–54. [Google Scholar] [CrossRef] [PubMed]
- Armstrong, S.; McHale, G.; Ledesma-Aguilar, R.; Wells, G.G. Pinning-Free Evaporation of Sessile Droplets of Water from Solid Surfaces. Langmuir 2019, 35, 2989–2996. [Google Scholar] [CrossRef] [PubMed] [Green Version]
- Vaynberg, A.; Stuart, M.; Wu, X.-F. Differential wetting characterization of hair fibers. J. Cosmet. Sci. 2012, 63, 33–41. [Google Scholar]
- Fernández-Peña, L.; Abelenda-Nuñez, I.; Hernández-Rivas, M.; Ortega, F.; Rubio, R.G.; Guzmán, E. Impact of the bulk aggregation on the adsorption of oppositely charged polyelectrolyte-surfactant mixtures onto solid surfaces. Adv. Colloid Interface Sci. 2020, 282, 102203. [Google Scholar] [CrossRef] [PubMed]
- Llamas, S.; Guzmán, E.; Akanno, A.; Fernández-Peña, L.; Ortega, F.; Campbell, R.A.; Miller, R.; Rubio, R.G. Study of the Liquid/Vapor Interfacial Properties of Concentrated Polyelectrolyte–Surfactant Mixtures Using Surface Tensiometry and Neutron Reflectometry: Equilibrium, Adsorption Kinetics, and Dilational Rheology. J. Phys. Chem. C 2018, 122, 4419–4427. [Google Scholar] [CrossRef]
- Llamas, S.; Guzmán, E.; Ortega, F.; Baghdadli, N.; Cazeneuve, C.; Rubio, R.G.; Luengo, G.S. Adsorption of polyelectrolytes and polyelectrolytes-surfactant mixtures at surfaces: A physico-chemical approach to a cosmetic challenge. Adv. Colloid Interface Sci. 2015, 222, 461–487. [Google Scholar] [CrossRef] [PubMed]
- Llamas, S.; Guzmán, E.; Baghdadli, N.; Ortega, F.; Cazeneuve, C.; Rubio, R.G.; Luengo, G.S. Adsorption of poly(diallyldimethylammonium chloride)—sodium methyl-cocoyl-taurate complexes onto solid surfaces. Colloids Surf. A 2016, 505, 150–157. [Google Scholar] [CrossRef]
- Guzmán, E.; Llamas, S.; Fernández-Peña, L.; Léonforte, F.; Baghdadli, N.; Cazeneuve, C.; Ortega, F.; Rubio, R.G.; Luengo, G.S. Effect of a natural amphoteric surfactant in the bulk and adsorption behavior of polyelectrolyte-surfactant mixtures. Colloids Surf. A 2020, 585, 124178. [Google Scholar] [CrossRef]
- Fernández-Peña, L.; Guzmán, E.; Leonforte, F.; Serrano-Pueyo, A.; Regulski, K.; Tournier-Couturier, L.; Ortega, F.; Rubio, R.G.; Luengo, G.S. Effect of molecular structure of eco-friendly glycolipid biosurfactants on the adsorption of hair-care conditioning polymers. Colloids Surf. B 2020, 185, 110578. [Google Scholar] [CrossRef]
- Fernández-Peña, L.; Guzmán, E.; Ortega, F.; Bureau, L.; Leonforte, F.; Velasco, D.; Rubio, R.G.; Luengo, G.S. Physico-chemical study of polymer mixtures formed by a polycation and a zwitterionic copolymer in aqueous solution and upon adsorption onto negatively charged surfaces. Polymer 2021, 217, 123442. [Google Scholar] [CrossRef]
- Llamas, S.; Guzmán, E.; Ortega, F.; Rubio, R.G. Adsorption of Mixtures of a Pegylated Lipid with Anionic and Zwitterionic Surfactants at Solid/Liquid. Colloids Interfaces 2020, 4, 47. [Google Scholar] [CrossRef]
- Lindman, B.; Antunes, F.; Aidarova, S.; Miguel, M.; Nylander, T. Polyelectrolyte-surfactant association—from fundamentals to applications. Colloid J. 2014, 76, 585–594. [Google Scholar] [CrossRef]
- Fernández-Peña, L.; Guzmán, E. Physicochemical Aspects of the Performance of Hair-Conditioning Formulations. Cosmetics 2020, 7, 26. [Google Scholar] [CrossRef] [Green Version]
- Hernández-Rivas, M.; Guzmán, E.; Fernández-Peña, L.; Akanno, A.; Greaves, A.; Léonforte, F.; Ortega, F.; Rubio, R.G.; Luengo, G.S. Deposition of Synthetic and Bio-Based Polycations onto Negatively Charged Solid Surfaces: Effect of the Polymer Cationicity, Ionic Strength, and the Addition of an Anionic Surfactant. Colloids Interfaces 2020, 4, 33. [Google Scholar] [CrossRef]
- Cheraghian, G. Evaluation of Clay and Fumed Silica Nanoparticles on Adsorption of Surfactant Polymer during Enhanced Oil Recovery. J. Japan Petr. Inst. 2017, 60, 85–94. [Google Scholar] [CrossRef] [Green Version]
- Cheraghian, G. An Experimental Study of Surfactant Polymer for Enhanced Heavy Oil Recovery Using a Glass Micromodel by Adding Nanoclay. Petr. Sci. Techn. 2015, 33, 1410–1417. [Google Scholar] [CrossRef]
- Kovalchuk, N.M.; Trybala, A.; Starov, V.M. Evaporation of sessile droplets. Curr. Opin. Colloid Interface Sci. 2014, 19, 336–342. [Google Scholar] [CrossRef] [Green Version]
- Semenov, S.; Starov, V.M.; Rubio, R.G.; Agogo, H.; Velarde, M.G. Evaporation of sessile water droplets: Universal behaviour in presence of contact angle hysteresis. Colloids Surf. A 2011, 391, 135–144. [Google Scholar] [CrossRef]
- Starov, V.M.; Velarde, M.G. Wetting and Spreading Dynamics; CRC Press: Boca Ratón, FL, USA, 2019. [Google Scholar]
- Semenov, S.; Trybala, A.; Rubio, R.G.; Kovalchuk, N.; Starov, V.; Velarde, M.G. Simultaneous spreading and evaporation: Recent developments. Adv. Colloid Interface Sci. 2014, 206, 382–398. [Google Scholar] [CrossRef] [Green Version]
- Craster, R.V.; Matar, O.K.; Sefiane, K. Pinning, Retraction, and Terracing of Evaporating Droplets Containing Nanoparticles. Langmuir 2009, 25, 3601–3609. [Google Scholar] [CrossRef] [Green Version]
- Bormashenko, E.; Musin, A.; Zinigrad, M. Evaporation of droplets on strongly and weakly pinning surfaces and dynamics of the triple line. Colloids Surf. A 2011, 385, 235–240. [Google Scholar] [CrossRef]
- Friedrich, L.C.; Silva, V.O.; Moreira, P.F., Jr.; Tcacenco, C.M.; Quina, F.H. Time-resolved fluorescence quenching studies of sodium lauryl ether sulfate micelles. J. Braz. Chem. Soc. 2013, 24, 241–245. [Google Scholar] [CrossRef]
- Llamas, S.; Fernández-Peña, L.; Akanno, A.; Guzmán, E.; Ortega, V.; Ortega, F.; Csaky, A.G.; Campbell, R.A.; Rubio, R.G. Towards understanding the behavior of polyelectrolyte–surfactant mixtures at the water/vapor interface closer to technologically-relevant conditions. Phys. Chem. Chem. Phys. 2018, 20, 1395–1407. [Google Scholar] [CrossRef]
- Mostafalu, R.; Banaei, A.; Ghorban, F. An Inaccuracy in the Determination of Cocoamidopropyl Betaine by the Potentiometric Method. J. Surfact. Deterg. 2015, 18, 919–922. [Google Scholar] [CrossRef]
- Mészáros, R.; Thompson, L.; Bos, M.; Varga, I.; Gilányi, T. Interaction of Sodium Dodecyl Sulfate with Polyethyleneiminie: Surfactant-Induced Polymer Solution Colloid Dispersion Transition. Langmuir 2003, 19, 609–615. [Google Scholar] [CrossRef]
- Mezei, A.; Pojják, K.; Mészaros, R. Nonequilibrium Features of the Association between Poly(vinylamine) and Sodium Dodecyl Sulfate: The Validity of the Colloid Dispersion Concept. J. Phys. Chem B 2008, 112, 9693–9699. [Google Scholar] [CrossRef]
- Akanno, A.; Guzmán, E.; Fernández-Peña, L.; Llamas, S.; Ortega, F.; Rubio, R.G. Equilibration of a polycation–anionic surfactant mixture at the water/vapor interface. Langmuir 2018, 34, 7455–7464. [Google Scholar] [CrossRef] [PubMed]
- Guzmán, E.; Fernández-Peña, L.; Akanno, A.; Llamas, S.; Ortega, F.; Rubio, R.G. Two Different Scenarios for the Equilibration of Polycation—Anionic Solutions at Water–Vapor Interfaces. Coatings 2019, 9, 438. [Google Scholar] [CrossRef] [Green Version]
- Luengo, G.S.; Galliano, A.; Dubief, C. Aqueous Lubrication in Cosmetics. In Aqueous Lubrication; Spencer, N.D., Ed.; World Scientific Publishing Co Pte Ltd.: Singapore, 2014; pp. 103–144. [Google Scholar]
- Gavazzoni Dias, M.F.R. Hair cosmetics: An overview. Int. J. Trichology 2015, 7, 2–15. [Google Scholar] [CrossRef]
- Mezei, A.; Mezaros, R. Novel Method for the Estimation of the Binding Isotherms of Ionic Surfactants on Oppositely Charged Polyelectrolytes. Langmuir 2006, 22, 7148–7151. [Google Scholar] [CrossRef]
- Wege, H.A.; Holgado-Terriza, J.A.; Cabrerizo-Vílchez, M.A. Development of a Constant Surface Pressure Penetration Langmuir Balance Based on Axisymmetric Drop Shape Analysis. J. Colloid Interface Sci. 2002, 249, 263–273. [Google Scholar] [CrossRef] [PubMed] [Green Version]
- Voinova, M.V.; Rodahl, M.; Jonson, M.; Kasemo, B. Viscoelastic Acoustic Response of Layered Polymer Films at Fluid-Solid Interfaces: Continuum Mechanics Approach. Phy. Script 1999, 59, 391–396. [Google Scholar] [CrossRef] [Green Version]
- Voinova, M.V.; Jonson, M.; Kasemo, B. ‘Missing mass’ effect in biosensor’s QCM applications. Biosens. Bioelectron. 2002, 17, 835–841. [Google Scholar] [CrossRef]
- Ivanova, N.; Starov, V.; Johnson, D.; Hilal, N.; Rubio, R. Spreading of Aqueous Solutions of Trisiloxanes and Conventional Surfactants over PTFE AF Coated Silicone Wafers. Langmuir 2009, 25, 3564–3570. [Google Scholar] [CrossRef] [PubMed]
- Kelly-Zion, P.L.; Pursell, C.J.; Vaidya, S.; Batra, J. Evaporation of sessile drops under combined diffusion and natural convection. Colloids Surf. A 2011, 381, 31–36. [Google Scholar] [CrossRef] [Green Version]
- Semenov, S.; Starov, V.M.; Rubio, R.G. Evaporation of pinned sessile microdroplets of water on a highly heat-conductive substrate: Computer simulations. Eur. Phys. J. Spec. Top. 2013, 219, 143–154. [Google Scholar] [CrossRef] [Green Version]
- Zdziennicka, A.; Szymczyk, K.; Jańczuk, B.; Longwic, R.; Sander, P. Adhesion of canola and diesel oils to some parts of diesel engine in the light of surface tension components and parameters of these substrates. Int. J. Adhes. Adhes. 2015, 60, 23–30. [Google Scholar] [CrossRef]
- Rotenberg, Y.; Boruvka, L.; Neumann, A.W. Determination of surface tension and contact angle from the shapes of axisymmetric fluid interfaces. J. Colloid Interface Sci. 1983, 93, 169–183. [Google Scholar] [CrossRef]
- Ferreira, G.A.; Loh, W. Liquid crystalline nanoparticles formed by oppositely charged surfactant-polyelectrolyte complexes. Curr. Opin. Colloid Interface Sci. 2017, 32, 11–22. [Google Scholar] [CrossRef]
- Guzmán, E.; Llamas, S.; Maestro, A.; Fernández-Peña, L.; Akanno, A.; Miller, R.; Ortega, F.; Rubio, R.G. Polymer–surfactant systems in bulk and at fluid interfaces. Adv. Colloid Interface Sci. 2016, 233, 38–64. [Google Scholar] [CrossRef]
- Guzmán, E.; Fernández-Peña, L.; Ortega, F.; Rubio, R.G. Equilibrium and kinetically trapped aggregates in polyelectrolyte–oppositely charged surfactant mixtures. Curr. Opin. Colloid Interface Sci. 2020, 48, 91–108. [Google Scholar] [CrossRef]
- Akanno, A.; Guzmán, E.; Fernández-Peña, L.; Ortega, F.; Rubio, R.G. Surfactant-Like Behavior for the Adsorption of Mixtures of a Polycation and Two Different Zwitterionic Surfactants at the Water/Vapor Interface. Molecules 2019, 24, 3442. [Google Scholar] [CrossRef] [PubMed] [Green Version]
- Guzmán, E.; Fernández-Peña, L.; Luengo, G.S.; Rubio, A.M.; Rey, A.; Léonforte, F. Self-Consistent Mean Field Calculations of Polyelectrolyte-Surfactant Mixtures in Solution and upon Adsorption onto Negatively Charged Surfaces. Polymers 2020, 12, 624. [Google Scholar] [CrossRef] [Green Version]
- Akanno, A.; Guzmán, E.; Ortega, F.; Rubio, R.G. Behavior of the water/vapor interface of chitosan solutions with an anionic surfactant: Effect of polymer–surfactant interactions. Phys- Chem. Chem. Phys. 2020, 22, 23360–23373. [Google Scholar] [CrossRef]
- Varga, I.; Campbell, R.A. General Physical Description of the Behavior of Oppositely Charged Polyelectrolyte/Surfactant Mixtures at the Air/Water Interface. Langmuir 2017, 33, 5915–5924. [Google Scholar] [CrossRef]
- Angus-Smyth, A.; Bain, C.D.; Varga, I.; Campbell, R.A. Effects of bulk aggregation on PEI–SDS monolayers at the dynamic air–liquid interface: Depletion due to precipitation versus enrichment by a convection/spreading mechanism. Soft Matter 2013, 9, 6103–6117. [Google Scholar] [CrossRef]
- Tummino, A.; Toscano, J.; Sebastian, F.; Noskov, B.A.; Varga, I.; Campbell, R.A. Effects of Aggregate Charge and Subphase Ionic Strength on the Properties of Spread Polyelectrolyte/Surfactant Films at the Air/Water Interface under Static and Dynamic Conditions. Langmuir 2018, 34, 2312–2323. [Google Scholar] [CrossRef]
- Campbell, R.A.; Tummino, A.; Noskov, B.A.; Varga, I. Polyelectrolyte/surfactant films spread from neutral aggregates. Soft Matter 2016, 12, 5304–5312. [Google Scholar] [CrossRef] [Green Version]
- Noskov, B.A.; Bilibin, A.Y.; Lezov, A.V.; Loglio, G.; Filippov, S.K.; Zorin, I.M.; Miller, R. Dynamic surface elasticity of polyelectrolyte solutions. Colloids Surf. A 2007, 298, 115–122. [Google Scholar] [CrossRef]
- Aoudia, M.; Al-Haddabi, B.; Al-Harthi, Z.; Al-Rubkhi, A. Sodium Lauryl Ether Sulfate Micellization and Water Solubility Enhancement Towards Naphthalene and Pyrene: Effect of the Degree of Ethoxylation. J. Surfact. Deterg. 2010, 13, 103–111. [Google Scholar] [CrossRef]
- Aoudia, M.; Al-Maamari, T.; Al-Salmi, F. Intramolecular and intermolecular ion–dipole interactions in sodium lauryl ether sulfates (SLES) self-aggregation and mixed micellization with Triton X-100. Colloids Surf. A 2009, 335, 55–61. [Google Scholar] [CrossRef]
- Penfold, J.; Thomas, R.K.; Taylor, D.J.F. Polyelectrolyte/surfactant mixtures at the air–solution interface. Curr. Opin. Colloid Interface Sci. 2006, 11, 337–344. [Google Scholar] [CrossRef]
- Langevin, D. Polyelectrolyte and surfactant mixed solutions. Behavior at surfaces and in thin films. Adv. Colloid Interface Sci. 2001, 89-90, 467–484. [Google Scholar] [CrossRef]
- Hołysz, L.; Mirosław, M.; Terpiłowski, K.; Szcześ, A. Influence of relative humidity on the wettability of silicon wafer surfaces. umcschem 2008, 63, 223–239. [Google Scholar] [CrossRef] [Green Version]
- Zdziennicka, A.; Szymczyk, K.; Krawczyk, J.; Jańczuk, B. Some remarks on the solid surface tension determination from contact angle measurements. Appl. Surface Sci. 2017, 405, 88–101. [Google Scholar] [CrossRef]
- Bose, A. Wetting by solution. In Wettability; Berg, J.C., Ed.; Marcel Dekker Inc.: New York, NY, USA, 1993; pp. 149–182. [Google Scholar]
- Staszak, K.; Wieczorek, D.; Michocka, K. Effect of sodium chloride on the surface and wetting properties of aqueous solutions of cocamidopropyl betaine. J. Surfactants Deterg. 2015, 18, 321–328. [Google Scholar] [CrossRef] [Green Version]
- Gau, C.-S.; Zografi, G. Relationships between adsorption and wetting of surfactant solutions. J. Colloid Interface Sci. 1990, 140, 1–9. [Google Scholar] [CrossRef]
- Lucassen-Reynders, E.H. Contact angle and adsoprtion of Solids. J. Phys. Chem. 1963, 67, 969–972. [Google Scholar] [CrossRef]
- Kovalchuk, N.M.; Simmons, M.J.H. Surfactant-mediated wetting and spreading: Recent advances and applications. Curr. Opin. Colloid Interface Sci. 2021. [Google Scholar] [CrossRef]
- Zdziennicka, A.; Jańczuk, B. Modification of adsorption, aggregation and wetting properties of surfactants by short chain alcohols. Adv Colloid Interface Sci 2020, 284, 102249. [Google Scholar] [CrossRef]
- Rezayi, T.; Entezari, M.H.; Moosavi, F. The variation of surface free energy of Al during superhydrophobicity processing. Chem. Eng. J. 2017, 322, 181–187. [Google Scholar] [CrossRef]
- Zisman, W.A. Relation of the equilibrium contact angle to liquid and solid constitution. In Contact Angle, Wettability, and Adhesion; Fowkes, F.M., Ed.; American Chemical Society: Washington, DC, USA, 1964; pp. 1–51. [Google Scholar]
- Extrand, C.; Kumagai, Y. An experimental study of contact angle hysteresis. J. Colloid Interface Sci. 1997, 191, 378–383. [Google Scholar] [CrossRef]
- Bourges-Monnier, C.; Shanahan, M.E.R. Influence of evaporation on contact Angle. Langmuir 1995, 11, 2820–2829. [Google Scholar] [CrossRef]
- Hu, H.; Larson, R.G. Analysis of the microfluid flow in an evaporating sessile droplet. Langmuir 2005, 21, 3963–3971. [Google Scholar] [CrossRef]
- Senses, E.; Black, M.; Cunningham, T.; Sukhishvili, S.A.; Akcora, P. Spatial ordering of colloids in a drying aqueous polymer droplet. Langmuir 2013, 29, 2588–2594. [Google Scholar] [CrossRef]
- Soulié, V.; Karpitschka, S.; Lequien, F.; Prené, P.; Zemb, T.; Moehwald, H.; Riegler, H. The evaporation behavior of sessile droplets from aqueous saline solutions. Phys. Chem. Chem. Phys. 2015, 17, 22296–22303. [Google Scholar] [CrossRef] [PubMed]
- Trybala, A.; Okoye, A.; Semenov, S.; Agogo, H.; Rubio, R.G.; Ortega, F.; Starov, V.M. Evaporation kinetics of sessile droplets of aqueous suspensions of inorganic nanoparticles. J. Colloid Interface Sci. 2013, 403, 49–57. [Google Scholar] [CrossRef]
- Deegan, R.D.; Bakajin, O.; Dupont, T.F.; Huber, G.; Nagel, S.R.; Witten, T.A. Contact line deposits in an evaporating drop. Phys. Rev. E 2000, 62, 756–762. [Google Scholar] [CrossRef] [Green Version]
- Moroi, Y.; Rusdi, M.; Kubo, I. Difference in surface properties between insoluble monolayer and adsorbed film from kinetics of water evaporation and BAM image. J. Phys. Chem B 2004, 108, 6351–6358. [Google Scholar] [CrossRef]
- Lunkenheimer, K.; Zembala, M. Attempts to Study a Water Evaporation Retardation by Soluble Surfactants. J. Colloids Interface Sci. 1997, 188, 363–371. [Google Scholar] [CrossRef]
- Nguyen, T.A.H.; Biggs, S.R.; Nguyen, A.V. Manipulating colloidal residue deposit from drying droplets: Air/liquid interface capture competes with coffee-ring effect. Chem. Eng. Sci. 2017, 167, 78–87. [Google Scholar] [CrossRef]
- Doganci, M.D.; Sesli, B.U.; Erbil, H.Y. Diffusion-controlled evaporation of sodium dodecyl sulfate solution drops placed on a hydrophobic substrate. J. Colloid Interface Sci. 2011, 362, 524–531. [Google Scholar] [CrossRef] [PubMed]
- Girard, F.; Antoni, M.; Faure, S.; Steinchen, A. Evaporation and marangoni driven convection in small heated water droplets. Langmuir 2006, 22, 11085–11091. [Google Scholar] [CrossRef]
- Girard, F.; Antoni, M.; Sefiane, K. On the effect of Marangoni flow on evaporation rates of heated water drops. Langmuir 2008, 24, 9207–9210. [Google Scholar] [CrossRef] [PubMed]
- Picknett, R.G.; Bexon, R. The evaporation of sessile or pendant drops in still air. J. Colloid Interface Sci. 1977, 61, 336–350. [Google Scholar] [CrossRef]


Publisher’s Note: MDPI stays neutral with regard to jurisdictional claims in published maps and institutional affiliations. |
© 2021 by the authors. Licensee MDPI, Basel, Switzerland. This article is an open access article distributed under the terms and conditions of the Creative Commons Attribution (CC BY) license (http://creativecommons.org/licenses/by/4.0/).
Share and Cite
Akanno, A.; Perrin, L.; Guzmán, E.; Llamas, S.; Starov, V.M.; Ortega, F.; Rubio, R.G.; Velarde, M.G. Evaporation of Sessile Droplets of Polyelectrolyte/Surfactant Mixtures on Silicon Wafers. Colloids Interfaces 2021, 5, 12. https://0-doi-org.brum.beds.ac.uk/10.3390/colloids5010012
Akanno A, Perrin L, Guzmán E, Llamas S, Starov VM, Ortega F, Rubio RG, Velarde MG. Evaporation of Sessile Droplets of Polyelectrolyte/Surfactant Mixtures on Silicon Wafers. Colloids and Interfaces. 2021; 5(1):12. https://0-doi-org.brum.beds.ac.uk/10.3390/colloids5010012
Chicago/Turabian StyleAkanno, Andrew, Lionel Perrin, Eduardo Guzmán, Sara Llamas, Victor M. Starov, Francisco Ortega, Ramón G. Rubio, and Manuel G. Velarde. 2021. "Evaporation of Sessile Droplets of Polyelectrolyte/Surfactant Mixtures on Silicon Wafers" Colloids and Interfaces 5, no. 1: 12. https://0-doi-org.brum.beds.ac.uk/10.3390/colloids5010012