1. Introduction
The decrease in oil discoveries during the last decades has suggested that enhanced oil recovery (EOR) technologies will play a key role to meet the growing energy demand in the immediate future. The most attractive technology is CO
2-EOR methods due to CO
2 availability, price and properties [
1]. In addition, our society is also facing the challenge of climate change. One immediate way to mitigate climate change is reducing the emissions of anthropogenic CO
2 by carbon capture and storage (CCS), where CO
2 is stored in underground sedimentary rocks [
2].
CO
2 injection into the subsurface rock adds some challenges in practice. The density difference between CO
2 and water results in gravity segregation and the low viscosity of CO
2 compared to waters leads to viscous fingering [
3,
4,
5]. Both mechanisms result in reduced CO
2 storage capacity, and in case of CO
2-EOR, also reduced oil production. One way to reduce the effect of these mechanisms is by increasing the viscosity of the injected fluid by means of CO
2-soluble polymers or by injecting CO
2-foam [
6,
7,
8].
Many studies on CO
2-foam have been done. These are usually addressed by observing the performance of foam flow through a rock core and by studying the foam stability [
9]. Foam core-flooding experiments are carried out at the desired pressure and temperature conditions and following different injection strategies. These usually are alternate injection of water (surfactant slug) and gas, known as Surfactant-Alternating Gas (SAG), and co-injection of both phases. During the injection, the pressure drop across the core is logged. This allows calculations of dynamic properties like apparent foam viscosities and mobility reduction factors [
10,
11,
12,
13]. On the other hand, the foam stability can also be determined in bulk measurements. One method to study foam stability is to, e.g., flow the gas phase through a cylinder containing the surfactant solution, then the generated foam volume is measured as well as its lifetime once the gas flow is stopped. However, this last method is often carried out at atmospheric pressure [
14,
15,
16,
17].
To adequately study CO
2 foam stability, a systematic study of the CO
2–water interface at relevant pressure and temperature conditions should be done. The interface characterization is of crucial interest since interfacial properties govern the stability mechanisms of dispersed systems [
18]. An effective technique for interface characterization is the axisymmetric drop shape analysis which relates interfacial phenomena to the drop/bubble shape via the Gauss-Laplace Equation [
19,
20]. Interfacial dilational viscoelasticity and dynamic interfacial tension can be determined by applying transient or harmonic perturbations of the drop shape and measuring the interface response [
21,
22]. Unfortunately, hitherto, there has not been any available suitable oscillating drop instruments for interface characterization at the conditions of interest.
In collaboration with DataPhysics Instruments GmbH (Germany), a prototype oscillating drop tensiometer has been developed, which is capable of operating at pressure and temperature conditions relevant for CO2 storage and CO2-EOR (up to 200 °C and 700 bar). This new instrument can become useful also for other applications, e.g., allowing a better understanding of mechanisms governing oil-water demulsification. In addition, it could contribute to fundamental science by allowing studies of the effect of pressure and temperature on interfacial layers. Moreover, the instrument can be used to develop effective and rapid screening methods for foaming agents, de-emulsifiers, nanomaterials, new chemicals, etc.
In this study, we perform dilational rheology measurements for a system of CO2 and synthetic seawater containing a linear alkyl ethoxylate under conditions of high pressure and high temperature. The purpose of this work is not primarily to investigate the properties of the selected test system in detail, but to demonstrate that measurements at high pressure and high temperature are possible and that the method is sensitive to pressure- and temperature-induced variations in the rheological parameters.
2. Materials and Methods
2.1. Methods
In an oscillating drop experiment, the drop volume is varied in a sinusoidal manner. This results in a sinusoidal variation of the interfacial area, A, which causes an interfacial tension response to the perturbation. The interfacial tension can be determined by fitting a Laplacian profile to the drop contour. When the variation of interfacial area follows from a small-amplitude single harmonic, the elastic modulus can be expressed as [
23]:
where
is the amplitude of interfacial tension response,
is the amplitude of the interfacial area variation and
is the average interfacial area during oscillations. For the simplest case, where both interactions between adsorbed surfactant molecules at the interface and mass transfer between interface and bulk can be neglected, the elasticity becomes constant when deformations are small, known as the Gibbs elasticity [
24,
25]. These assumptions give the Gibbs modulus as:
where
is the surfactant concentration at the interface. However, in cases where mass transfer cannot be neglected, the complex elastic modulus (
) should be considered. This modulus will depend on the oscillating frequency [
23,
26,
27].
The complex dilational elastic modulus can be expressed as the Fourier transform of the interfacial tension variation to the interfacial area change as a function of time. The elastic properties of the interface are defined by the real part (
E′), while the imaginary part describes the viscous properties (
E″) [
19]:
During measurements, it is important to work under conditions of mechanical equilibrium. By increasing the perturbation frequency, a situation can be reached where there is no more mechanical equilibrium. At this threshold, viscous forces occur causing shape distortion of the drop/bubble [
28,
29]. This limitation on the oscillation frequency may vary depending on the nature of the system, but studies have shown that for frequencies below 1 Hz, the drop can be considered to be in mechanical equilibrium [
22].
Performing these oscillating measurements in the laboratory will lead to practical complications. External disturbances may inflict harmonics with higher frequencies than the experimental frequency [
30]. Thus, it is important to extract the higher harmonics with respect to a sinusoidal fitting procedure. Loglio et al. described a mathematical procedure for the extraction of higher harmonics and amplitude values from the signal response [
31]. As a means to characterize the linearity of the system, the total harmonic distortion (
THD) parameter is used [
30,
31]:
where
is the fundamental frequency amplitude and
,
, …,
are the amplitudes for the higher harmonics. In this work, the amplitudes up to the fifth harmonic were considered and the
THD was expressed as a percentage of the fundamental frequency amplitude.
2.2. Experimental Set-Up
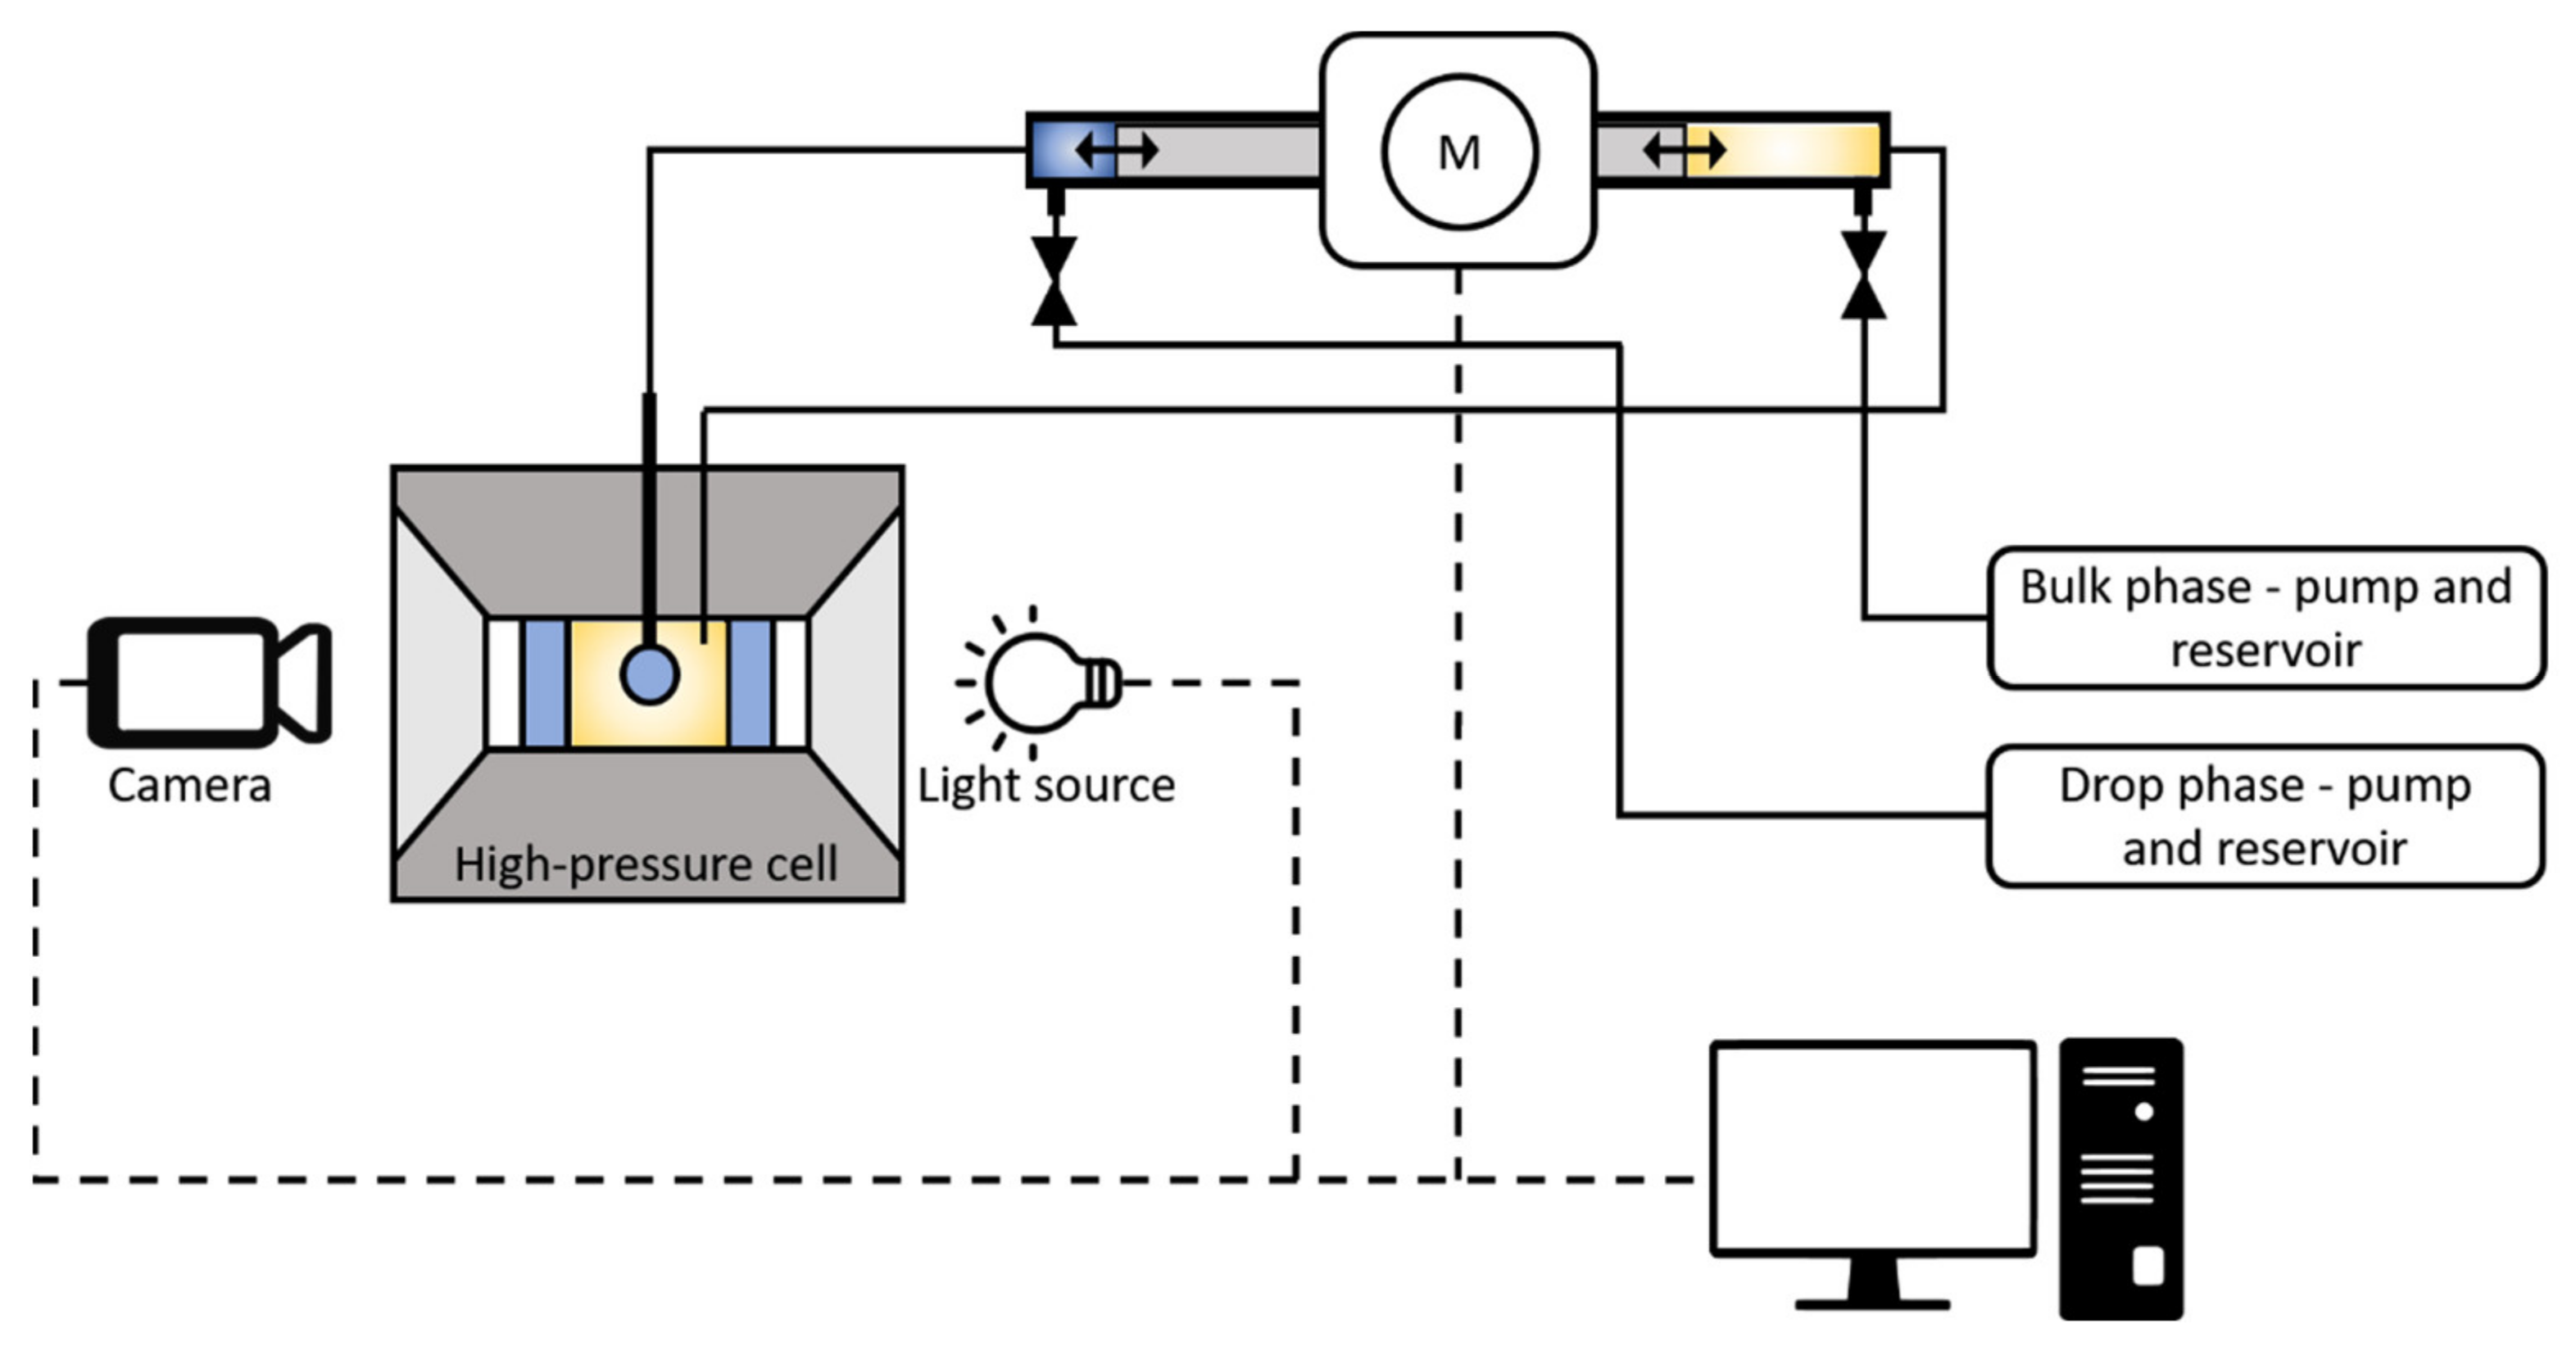
The experimental set-up consisted of two main parts: a high-pressure cell with visualizing windows, and a high-pressure drop oscillator. A schematic of the set-up is depicted in
Figure 1. The oscillator prototype and experimental set-up have been developed in cooperation between SINTEF Industry and DataPhysics Instruments GmbH.
The high-pressure cell incorporates two sapphire windows, allowing direct visualization, and it is surrounded by a heating element with a thermostat that allows for temperature control and covered with a thermal insulation material. The cell has two injection ports in the vertical plane, one at the top of the cell and one at the bottom. These ports allow needle tips to be installed inside the cell for the formation of an oscillating drop. In addition, there are two ports used for auxiliary purposes. The total volume of the cell is about 45 mL. The cell can operate at pressures up to 700 bar and is equipped with a heating system that allows temperatures up to 200 °C.
The oscillations are achieved by a double-shaft motor that actuates on two high-pressure pistons with a volume capacity of 14 µL. One piston is connected to one of the cell’s needle ports and the other one is connected to one of the cells auxiliary ports, in communication with the bulk phase. Hence, during oscillation measurements, a fluid volume equal to that injected in the drop is retracted from the bulk phase to maintain constant system volume. The oscillator was tested under pressure before the experimental set-up was assembled. Both oscillator chambers were connected to a pump, flooded with isopar-L (synthetic isoparaffinic oil, ExxonMobil), and pressurized. Then, the motor was turned on to check for leaks and malfunctions. No leaks or problems were detected. Tests were repeated successfully in increasing pressure steps up to 1300 bar. The device is limited to a maximum operating frequency of 2.0 Hz.
The light source, camera and oscillator are computer-controlled by using the software SCA20 for Microsoft Windows provided by DataPhysics Instruments GmbH. The lighting system and the high-performance camera were also received from DataPhysics Instruments GmbH.
The needle tip used in the tests had an external diameter of 1.57 mm. The initial drop volume was variable depending on the conditions of the system. The amplitude of the oscillations corresponded to 30–40% of the initial interfacial area. The reason for using such large amplitudes is explained in the Discussion Section. The frequency sweep was performed between 0.1 and 1.0 Hz.
2.3. Materials
The non-ionic linear alkyl ethoxylated surfactant Brij L23 (also known as Brij 35) was obtained from Sigma-Aldrich in solid form. CO
2 was obtained from AGA A.S. (purity 99.7%). The synthetic seawater (SSW) composition is shown below in
Table 1. The SSW was filtered using a 0.45 µm cellulose nitrate filter.
The aqueous phase studied in this work was composed of 100 ppm of Brij L23 in SSW (8.87 × 10⁻⁵ M). The cell was charged with CO2 together with SSW (approximately 23 mL) and allowed to equilibrate overnight prior to measurements. Thus, the CO2 was assumed to be water-saturated.
Brij L23 was selected as a surfactant due to its low CO
2 solubility and good performance as a foaming agent in core flooding experiments [
32,
33,
34].
3. Results
The sessile bubble method was considered at an initial stage of this work. Our intention was to study interfacial phenomena of CO2 bubbles in SSW, simulating conditions of CO2 foam flooding, where CO2 is dispersed in aqueous phase. However, many difficulties were encountered when studying this system. The main problem was that water crept into the needle when the pressure was increased, thus creating lamellas that altered the bubble oscillations. The experimental configuration was therefore changed to study an SSW drop in CO2 bulk phase (pendant drop method).
Air was displaced from the cell by CO2. Once the cell was filled with CO2, aqueous phase was injected through the needle, creating a pool of this phase at the bottom of the cell. Consecutively, the cell was pressurized with CO2 and heated to the desired conditions. Once the system reached thermal equilibrium, a few drops (4 or 5) were formed and allowed to detach from the needle tip to discard impurities. Then, a new drop was formed, and the measurement started.
Before performing oscillating measurements, the interface must be in mechanical equilibrium. A drop of constant volume must be kept stationary at the needle tip until the interfacial tension remains constant. Once the interface has reached equilibrium, the oscillator measurements can take place.
The pressure in the cell was carefully monitored during measurements. A small pressure decrease was usually observed during measurements, but the variations were no larger than 0.2–0.5 bar. This small pressure decrease was attributed to small leakages—not in the oscillating unit, but due to diffusion in the Viton seals of the high-pressure cell.
3.1. Interfacial Tension
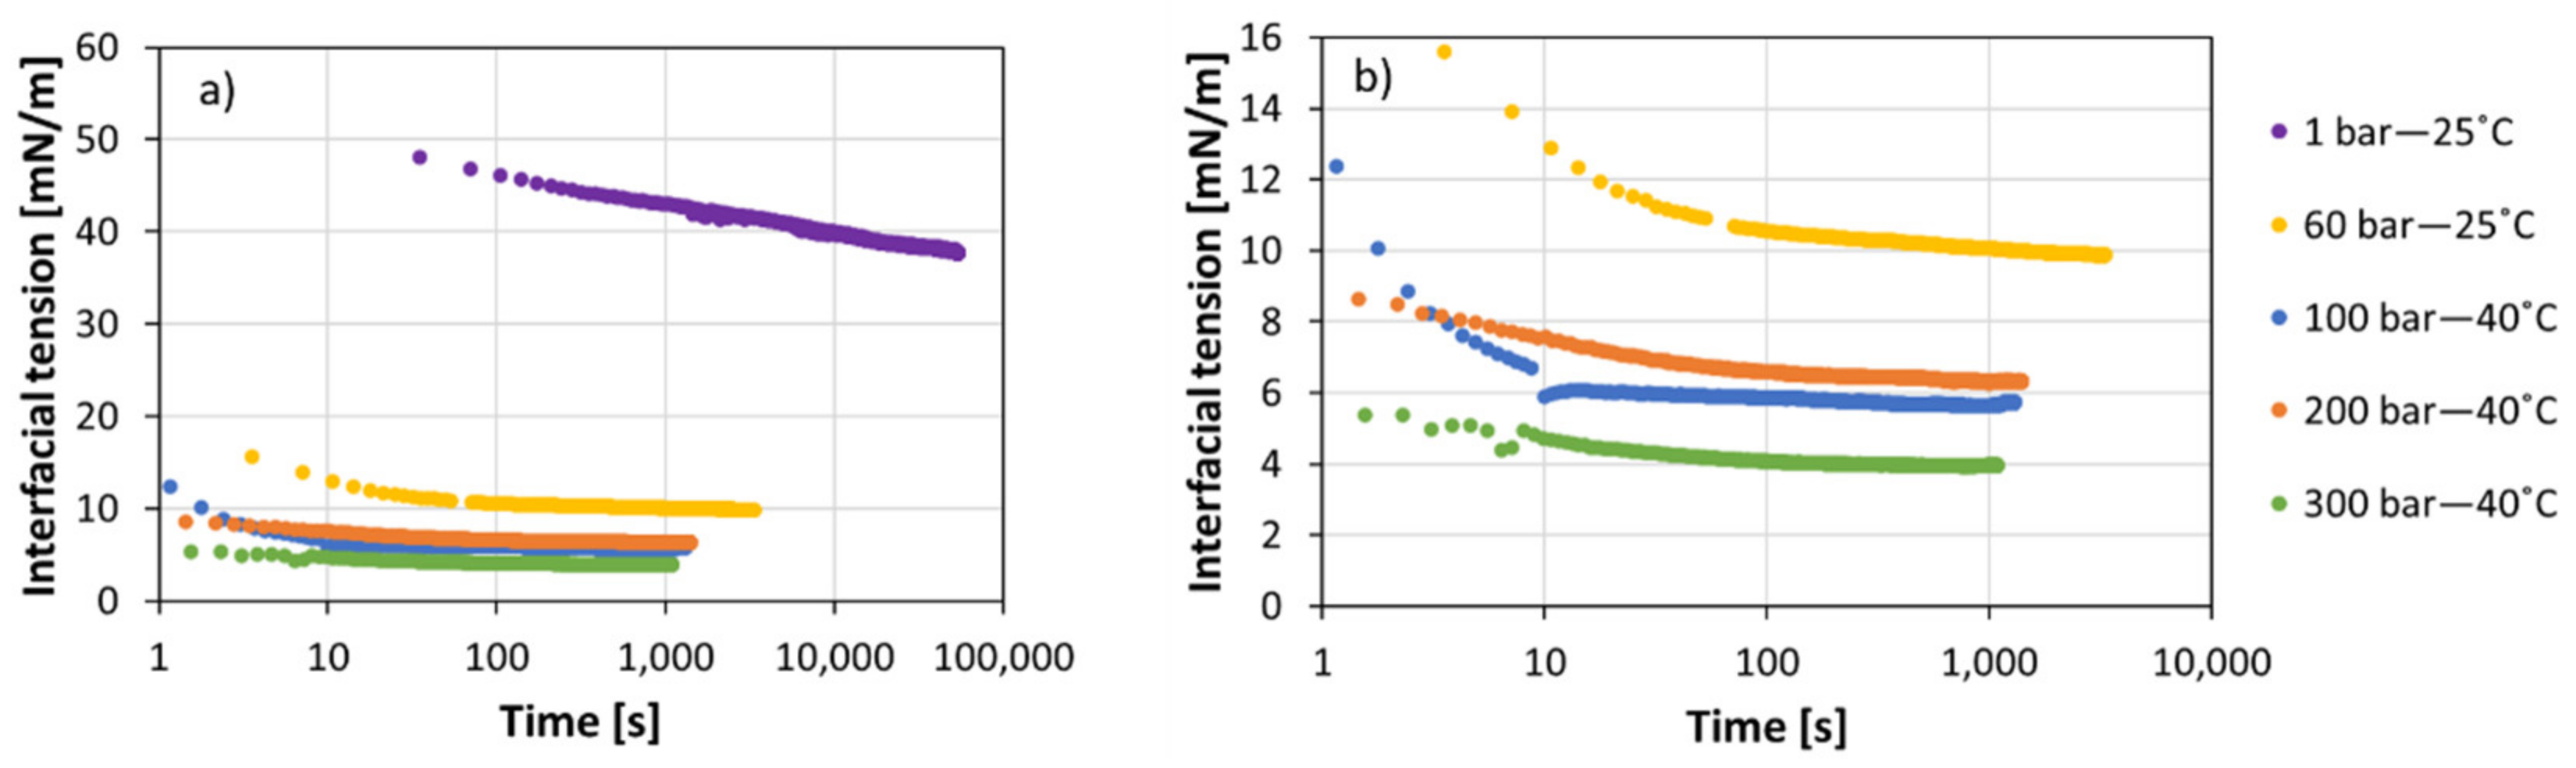
To verify that the drop was initially in mechanical equilibrium, dynamic interfacial tension measurements were performed.
Figure 2 shows the dynamic interfacial tension for the system composed of 100 ppm of Brij L23 in SSW droplet in CO
2 at different pressure and temperature conditions.
As pressure and temperature were increased, the systems reached equilibrium faster. At 60 bar and 25 °C, the system needed about 17 min (1000 s) to equilibrate. This was a considerable reduction in the equilibration time compared to the system at 1 bar (11 h). Systems at higher temperature and pressure showed comparable equilibration times shorter than 1000 s. Rheology measurements at 100, 200 and 300 bar were therefore started about 30 min after the drop was formed to ensure equilibrated interfaces.
At 80 °C, the system was equilibrated for 30 min before the oscillation measurements. The interfacial tensions (IFT) remained constant before and after measurements also at this temperature.
3.2. Effect of Pressure on Dilation Rheology
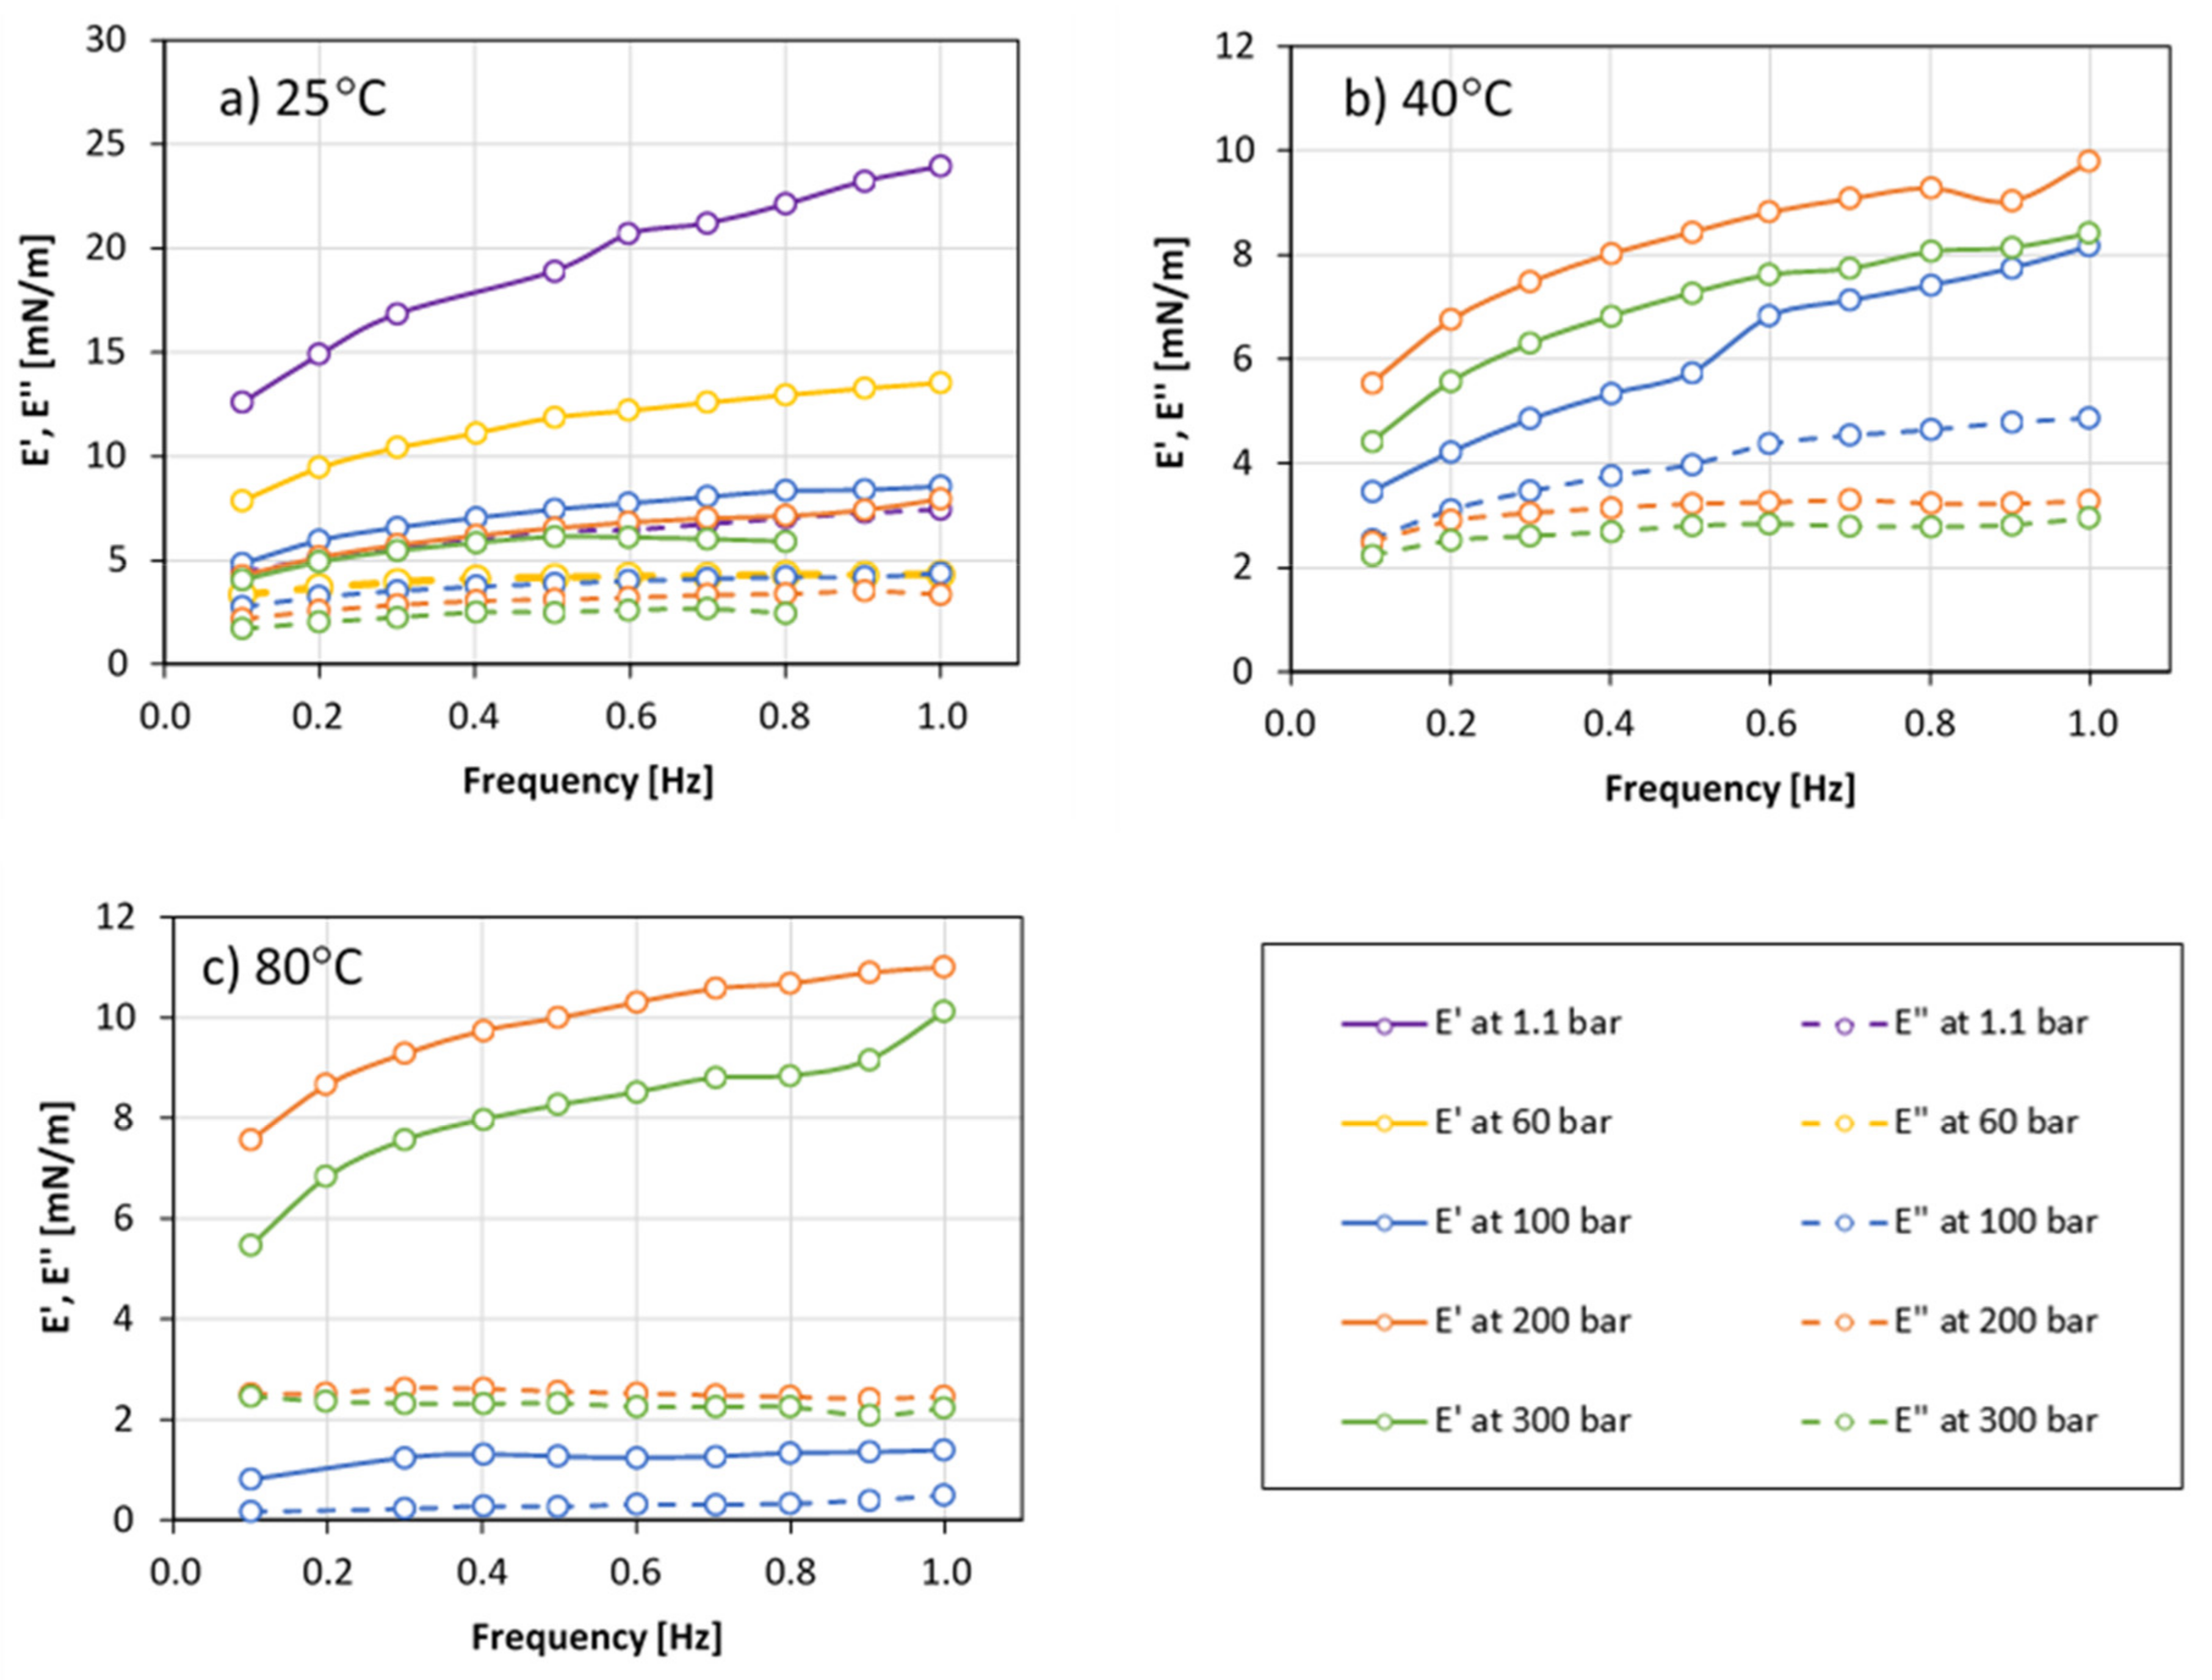
The systems were studied at 25, 40 and 80 °C at the pressures of 100, 200 and 300 bar. At 25 °C, pressures of 1.1 and 60 bar were also studied.
Figure 3 depicts the apparent complex elastic (
E′) and viscous (
E″) moduli as functions of the drop oscillating frequency for the different experimental conditions.
At 25 °C, both elastic and viscous modulus decreased as the pressure increased (
Figure 3a). There was a relatively significant decrease of both moduli as pressure increased from 1.1 to 100 bar. From 100 to 300 bar, the reduction of both moduli became less affected by increasing pressure within the range studied.
At temperatures of 40 and 80 °C, E′ passed through a maximum when the system was pressurized from 100 to 300 bar. The largest values were measured at 200 bar for both temperatures. E″ decreased as pressure increased at 40 °C. At 80 °C, the viscous modulus values were similar to the modulus values obtained at 40 °C at pressures of 200 and 300 bar, but the values obtained at 100 bar were anomalously low. The latter values were considered unreliable because of relatively high uncertainty in the analysis. The uncertainty was caused by condensation of water on the inner window surfaces (in the CO2 phase). This affected the drop contour recognition. The issue was addressed by protecting the windows with heat insulation material, allowing a small opening for direct visualization of the system. Despite that the system visualization improved, it was not good enough to obtain an accurate Laplacian fit of the drop contour, thus resulting in inferior measurement results. The condensation problem must be solved in order to perform measurements at all temperature/pressure conditions.
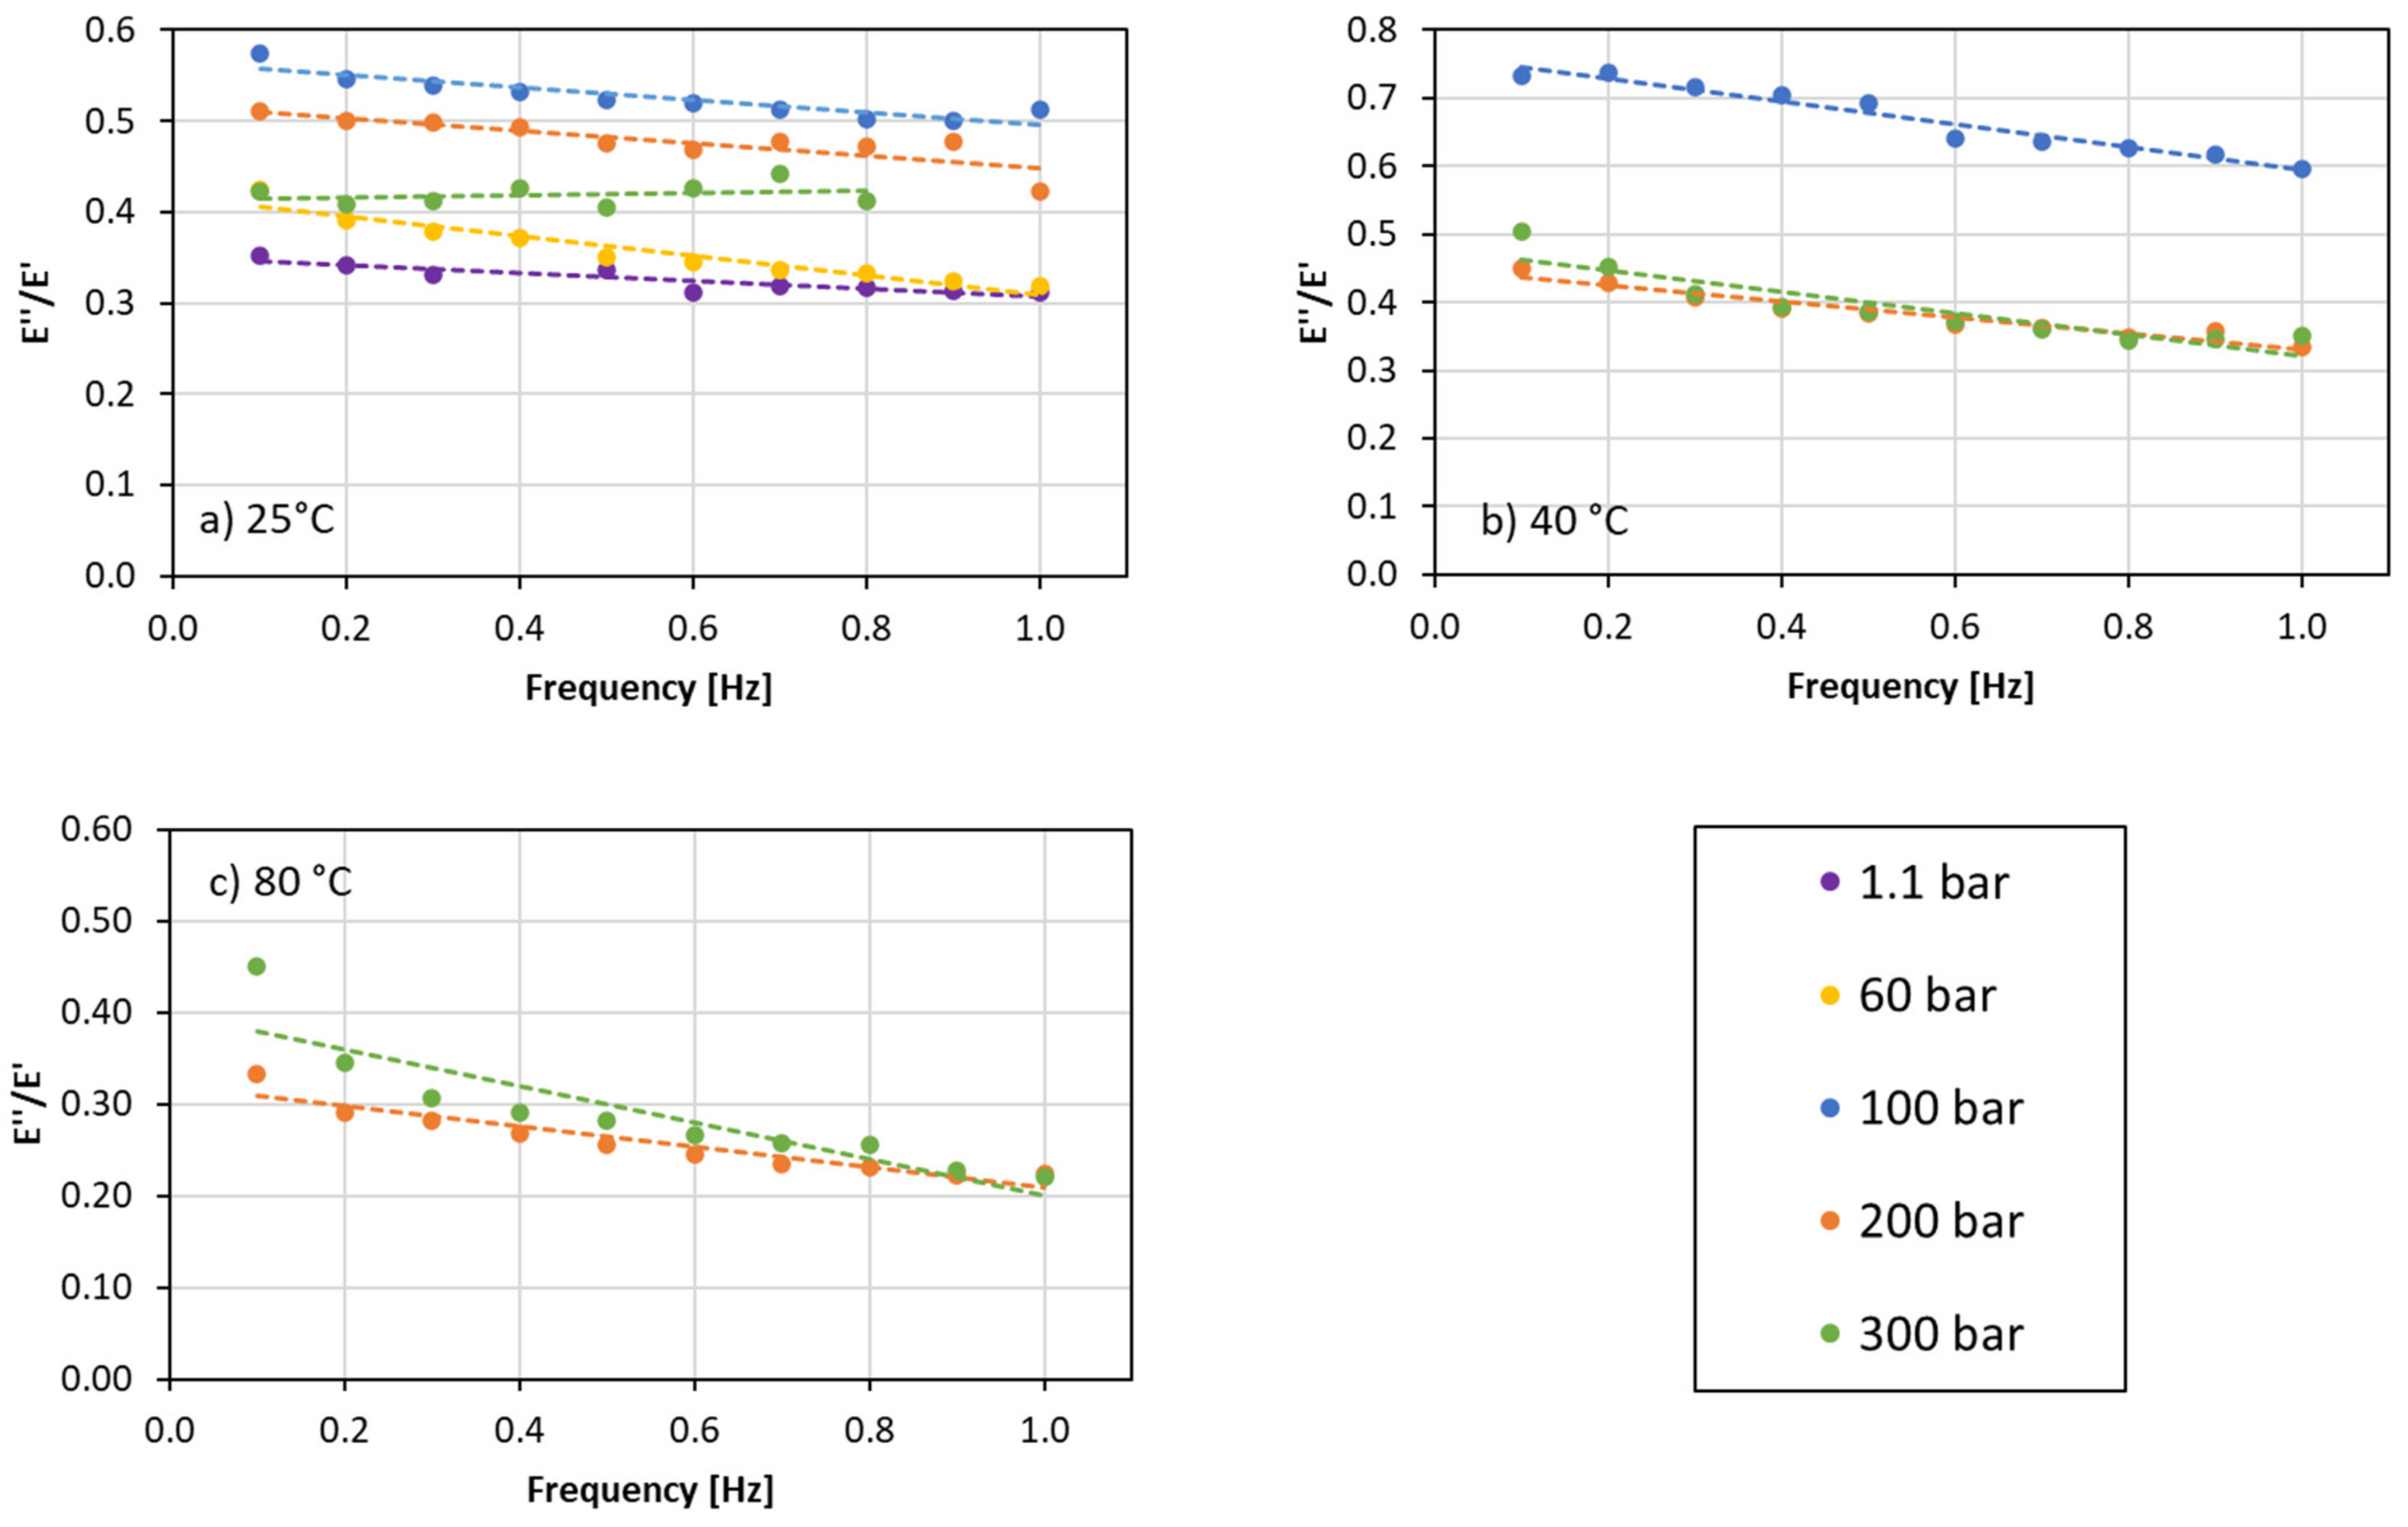
Figure 4 depicts the ratio between the viscous modulus and the elastic modulus. At 25 °C, the ratio increases with increasing pressure up to 200 bar, indicating that
E′ is reduced more than
E″ with pressure. From 200 to 300 bar however,
E″ decreased relatively more than
E′, causing a relative increase in the elastic behavior. At 40 °C, the interfacial elastic behavior increased as the pressure increased from 100 to 200 bar. Further increase of pressure to 300 bar did not cause a significant change in the elastic behavior. However, the elastic behavior decreased from 200 to 300 bar at 80 °C. It was also found that the slope of the ratio versus oscillating frequency decreased as temperature was increased.
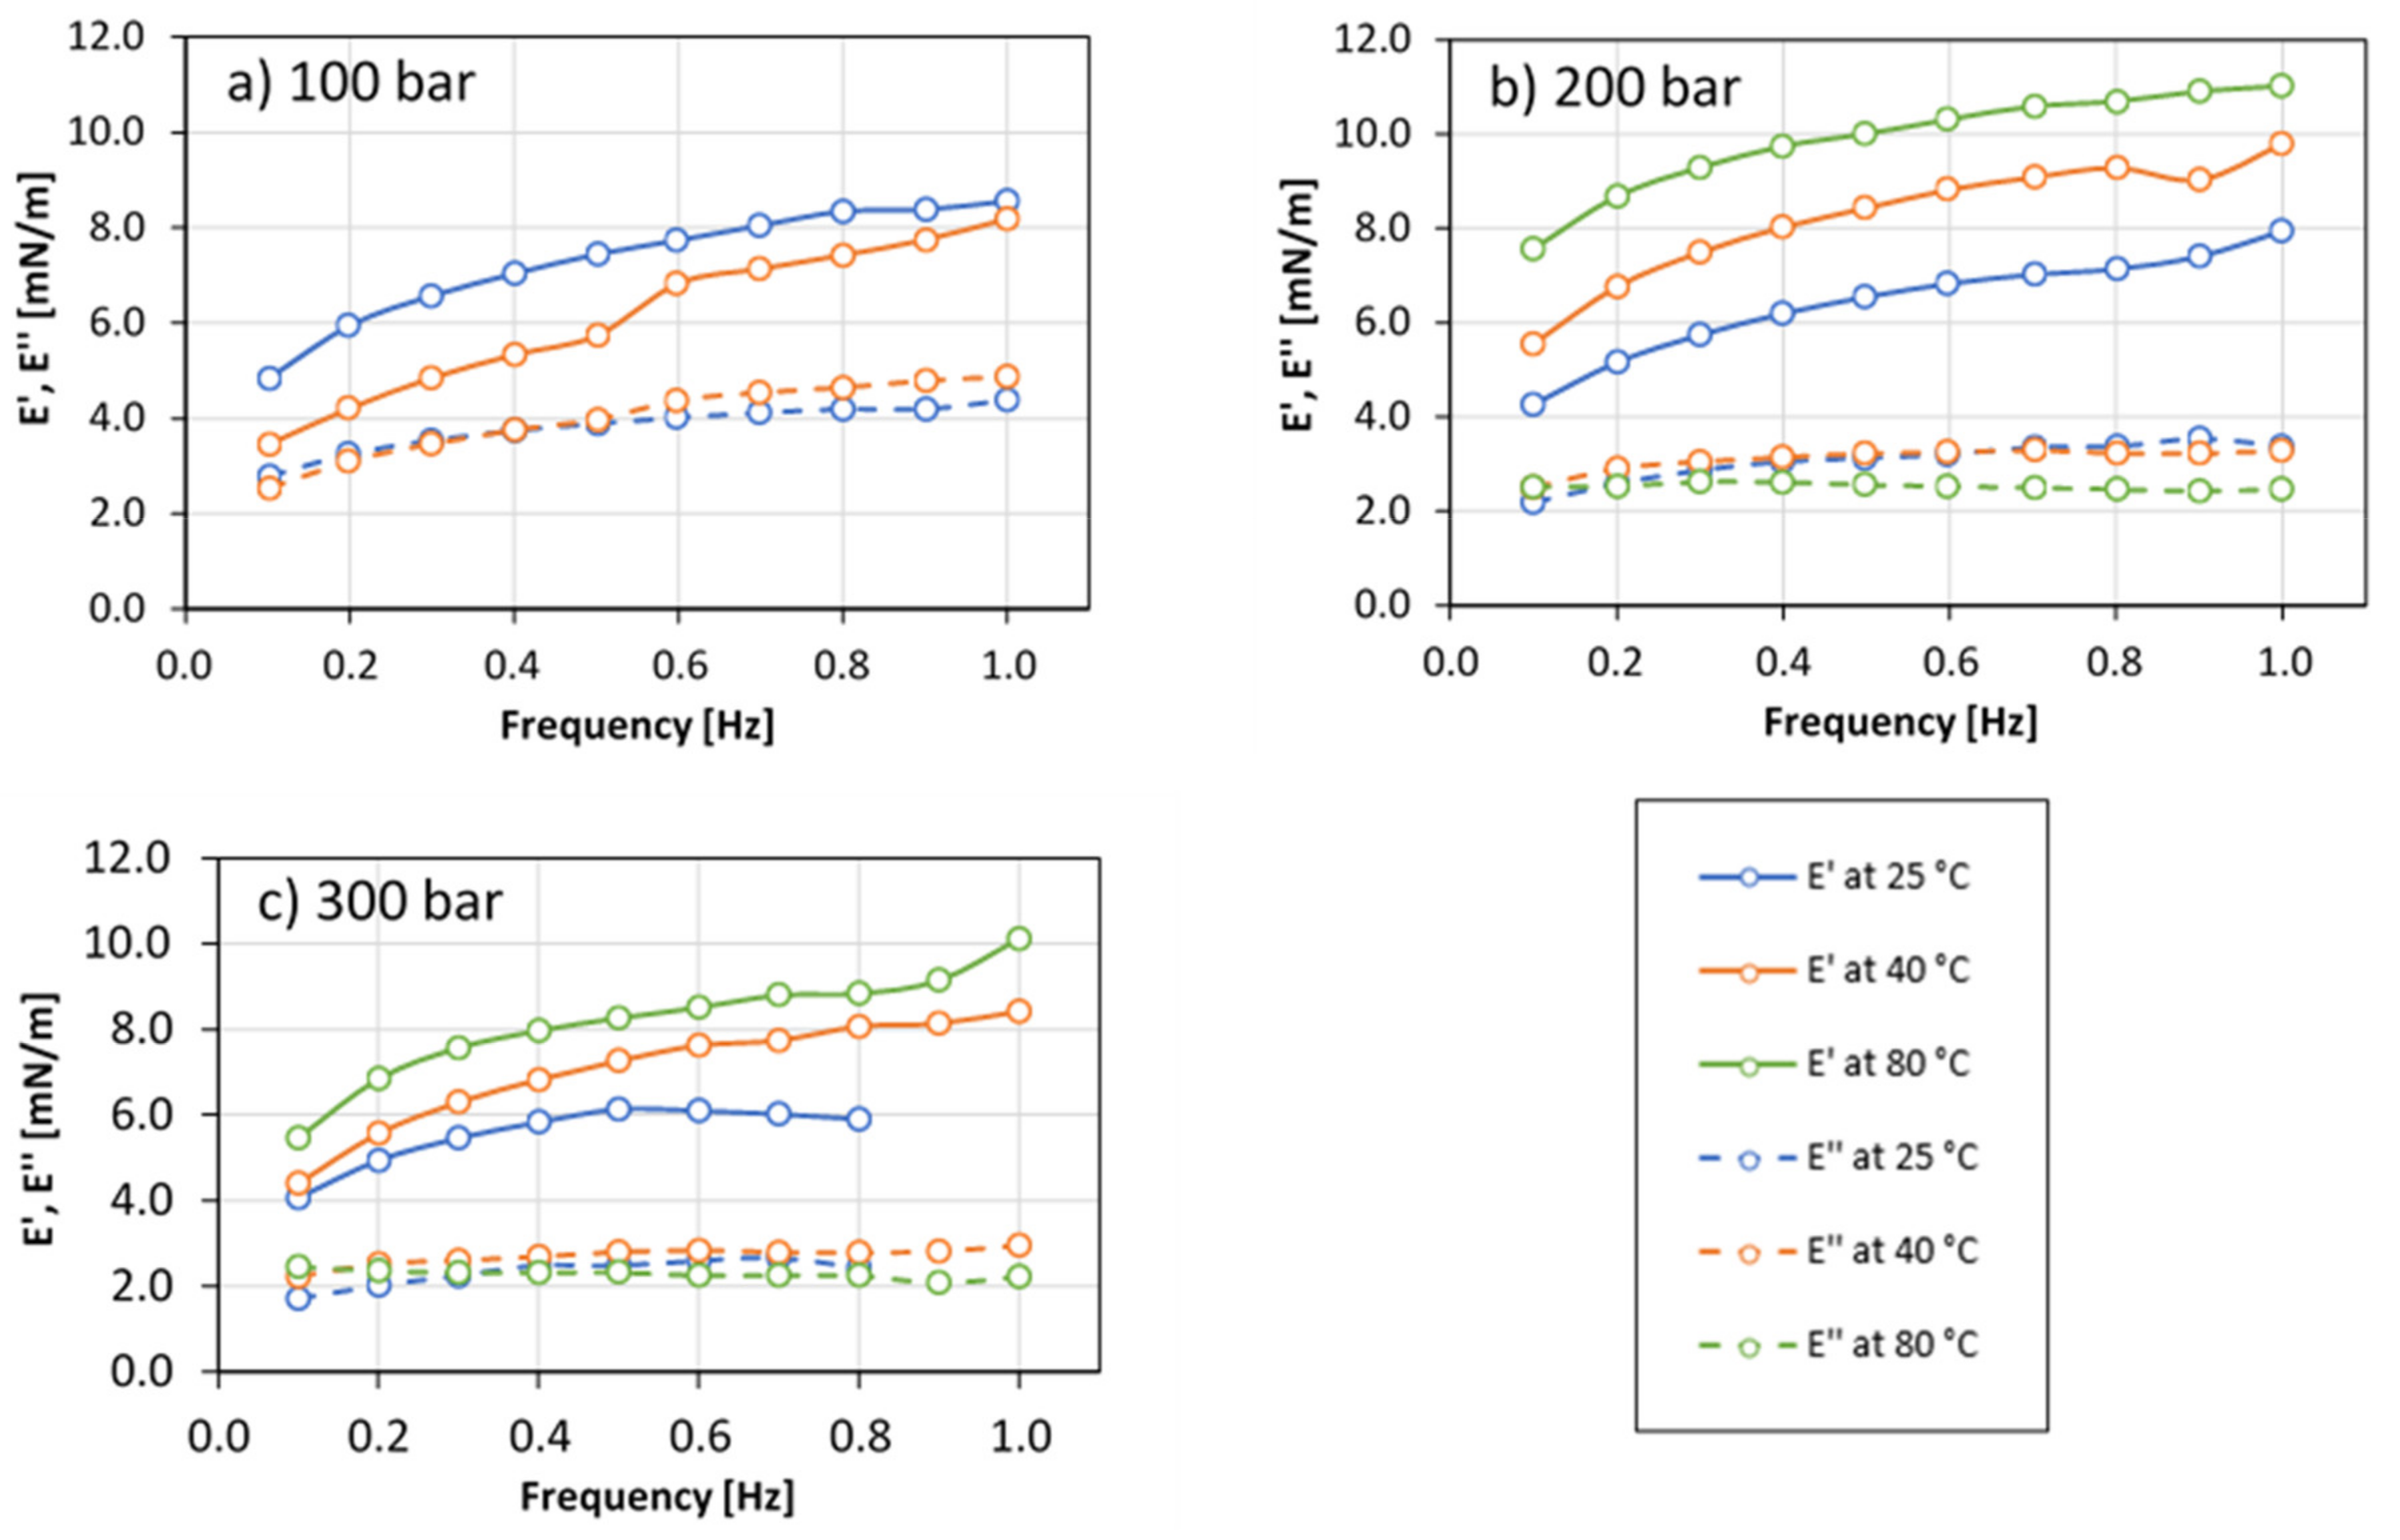
3.3. Effect of Temperature on Interfacial Rheology
Figure 5 presents the same data presented above but in terms of
E′ and
E″ versus frequency of oscillation for 100 bar (a), 200 bar (b) and 300 bar (c).
At 100 bar, it was observed that both moduli decreased as temperature was increased. As explained above, the measurements at 100 bar/80 °C must be discarded due to problems with water condensation at the cell windows. At 200 and 300 bar, E′ increased with increasing temperature. On the other hand, E″ had the tendency to decrease but the differences were minor.
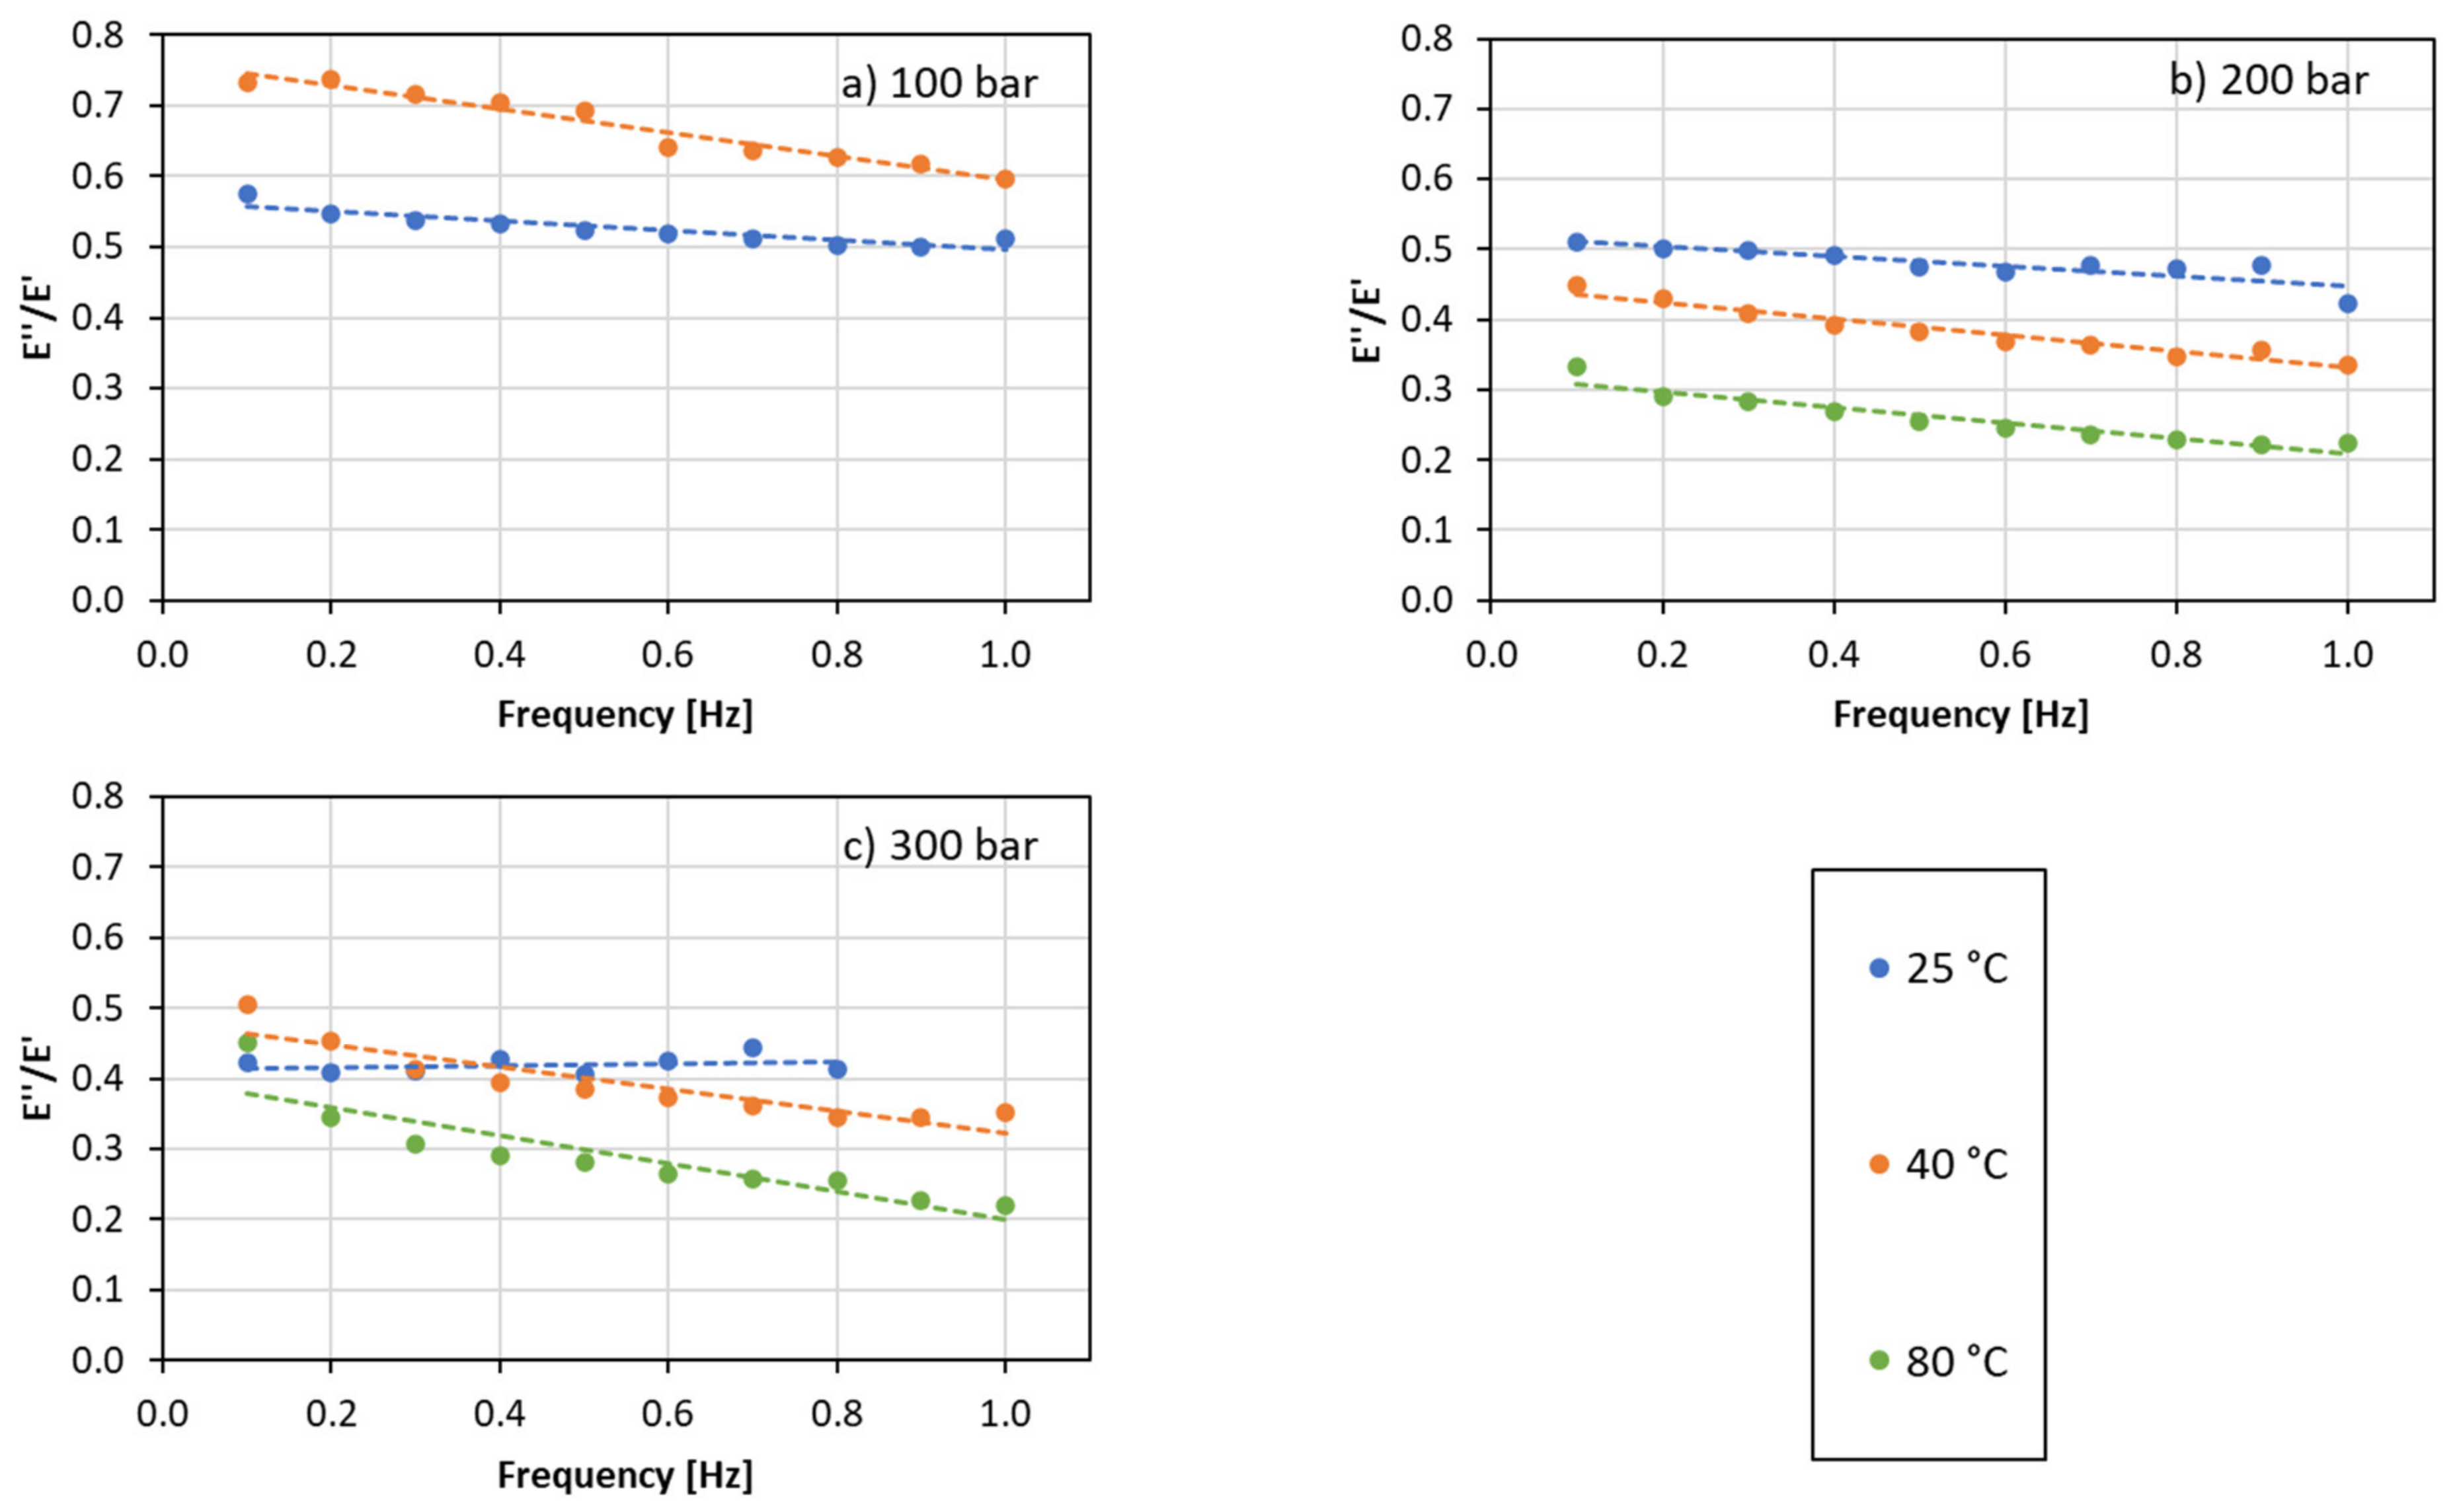
The ratio between
E″ and
E′ is depicted in
Figure 6. At 100 bar, there was an increase in the ratio when temperature was increased from 25 to 40 °C, implying that
E′ decreased more than
E″ and causing a relative decrease of the interface elastic behavior. The opposite trend was observed at 200 bar, where the ratio decreased with increasing temperature from 25 to 80 °C. The results at 300 bar were similar to those at 200 bar except that the temperature dependence was less pronounced.
4. Discussion
4.1. Observations
The measurements were performed using synthetic seawater and dense CO2 as this work was done within the frame of a CO2-EOR and CO2 storage project. The main findings of this research are the following.
The interfacial equilibration times using dense CO2 (100, 200 and 300 bar) were comparable and below 1000 s. This time was considerably reduced from the equilibration time observed at 1.1 bar (11 h). The development of a kinetic model that could explain the differences in the equilibration times between gas and dense phase was out of the scope of this work, however.
It has been possible to perform dilational oscillating interface rheology measurements under conditions of high pressure and high temperature. The visco-elastic properties of the studied interfaces were found to be affected by both temperature and pressure.
At 25 °C, both moduli decreased as pressure increased. However, a maximum between 100 and 300 bar was observed at 40 °C. At 80 °C and 100 bar, condensation of water vapor at the cell windows prevented accurate measurement, but the indications are that both moduli passed through a maximum also at that temperature.
Brij L23 is a non-ionic surfactant which partitions between CO
2 and aqueous phase. In general, and for CO
2/aqueous systems in particular, non-ionic surfactants tend to increase their partitioning into CO
2 with increasing temperature and pressure [
35,
36,
37]. The observed variations of the complex elastic moduli could possibly be explained by increased solubility of the surfactant in the CO
2 phase, resulting in:
An accurate mechanistic study is required to verify/falsify the hypothetical mechanisms proposed above. Determination of interface composition isotherms for the conditions studied is a requisite for a proper comprehension of the phenomena. However, the scope of the research presented here is limited to showing and validating that the measurements of interfacial rheology by the oscillating drop method under high-pressure and high-temperature conditions are possible as well as demonstrating that alteration of pressure and temperature might have a significant effect on the viscoelastic properties of interfaces.
4.2. Validity of Measurements
After the assembly of the instrument, pendant drop measurements were performed with a pure water (with 100 ppm Brij L23) air system at atmospheric pressure and room temperature. The measured IFT after interfacial equilibration was 40.27 mN/m ± 0.16. This result is in agreement with values reported in the literature [
38].
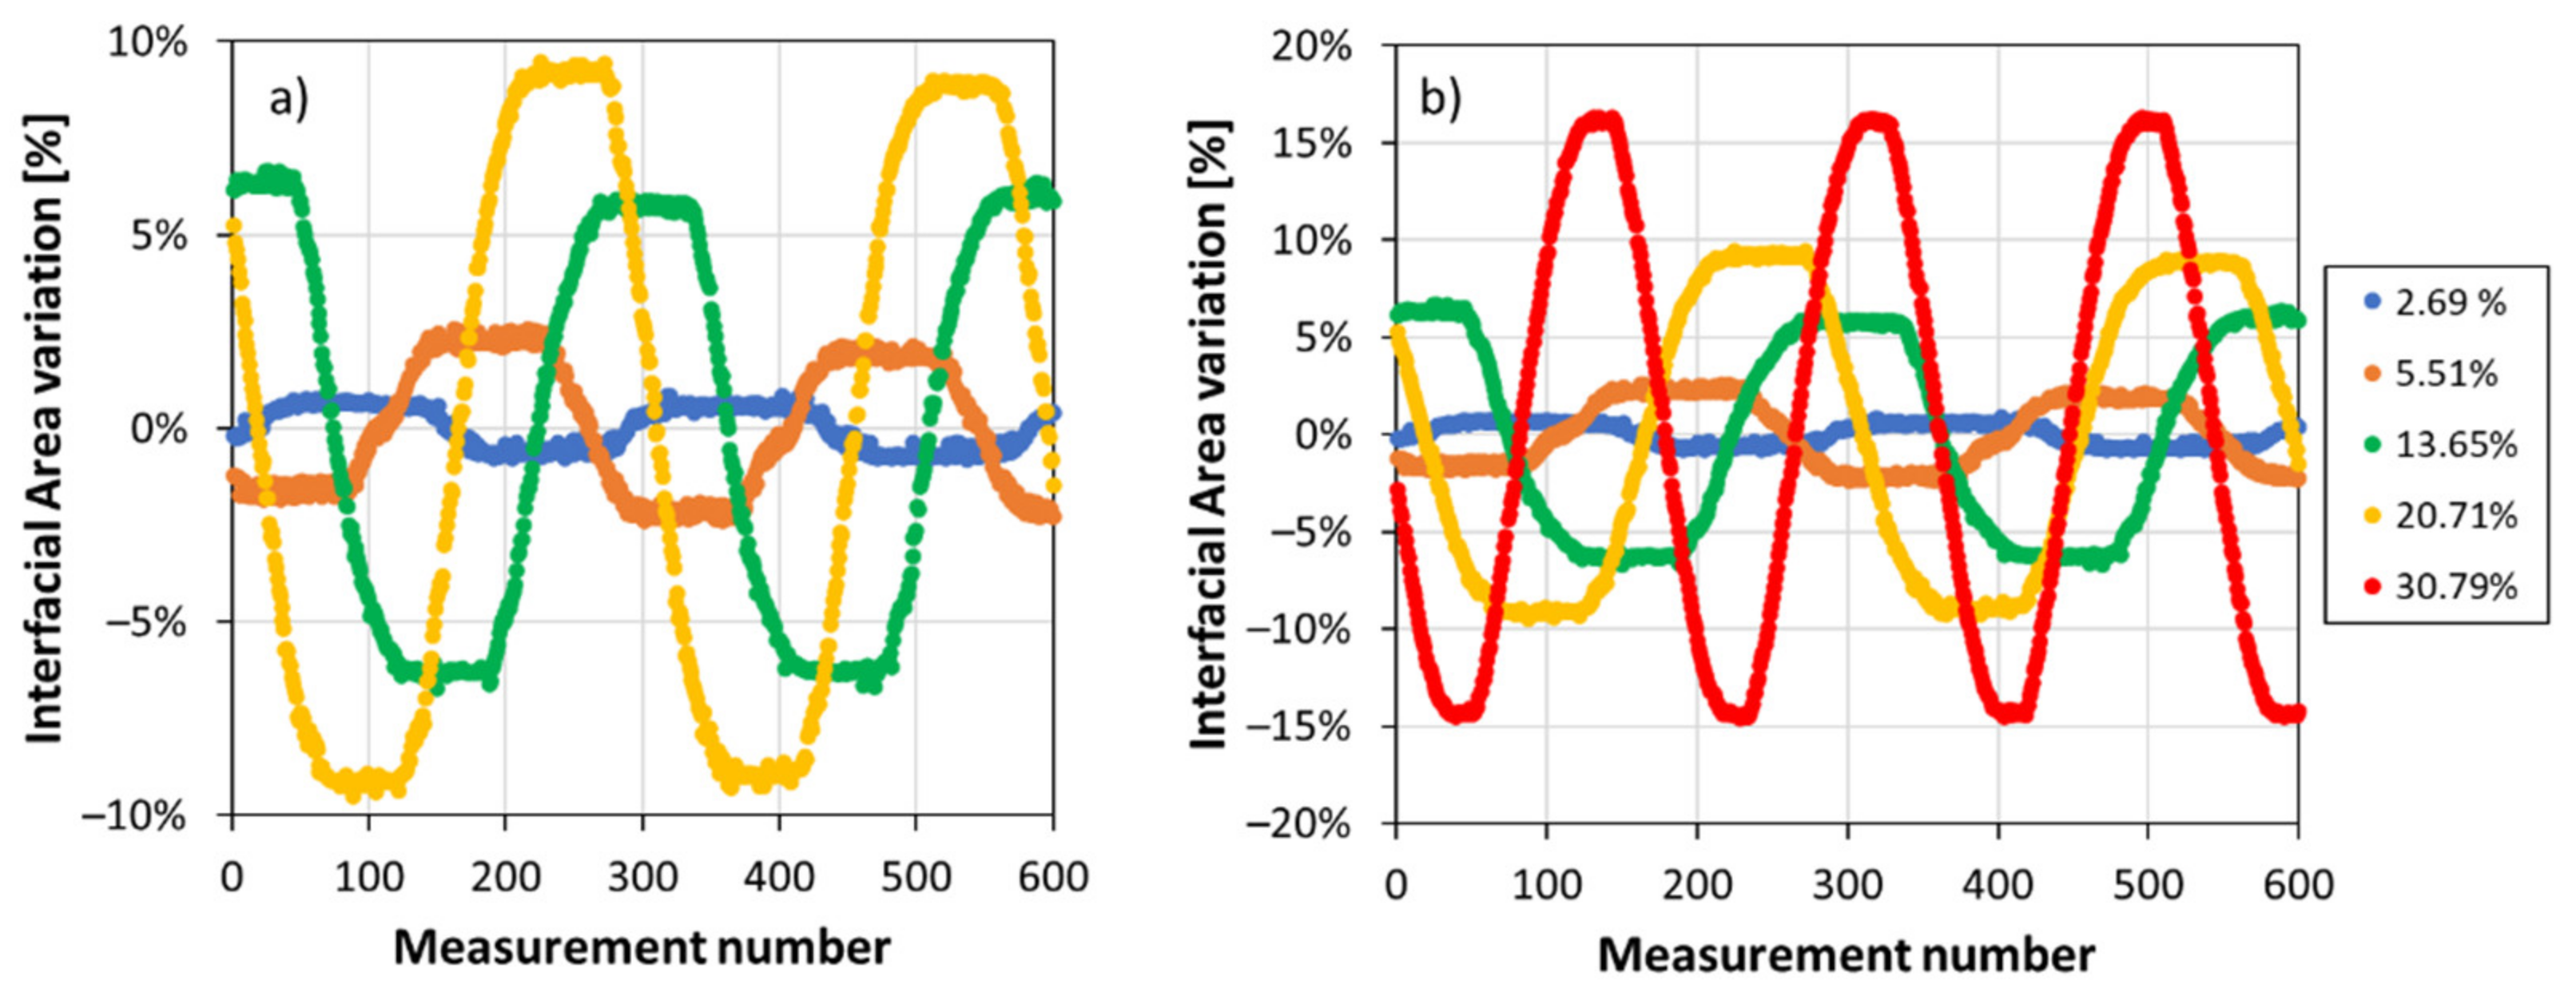
The instrument was found to allow satisfactory oscillating drop interfacial rheology measurements if the drop volume is sufficient to perform large enough volume variations. In the prototype design, backlash of the motor during change of the direction of the piston action perturbed the interfacial area response. The sinusoidal signal was flattened where maximum and minimum values were reached. This can be seen in
Figure 7, which shows the interfacial response of a drop of average interfacial area (IA) 18 mm
2 (corresponding to volume 7.6 µL) to oscillations with different amplitudes at frequency 0.05 Hz.
Figure 7b depicts the same information as
Figure 7a with the addition of IA amplitude of 30.79% to a drop with IA = 38 mm
2 and an oscillation frequency of 0.08 Hz. It can be noticed how the motor backlash influences the oscillations as the amplitude is reduced. Thus, because of constraints of the oscillator prototype design, the quality of measurements is influenced and limited by the amplitude of the oscillations.
Table 2 shows the data for the measurements shown in
Figure 7.
THDIA gives the total harmonic distortion calculated from the interfacial area perturbation, and
THDIFT was calculated based on the IFT response to the interfacial area perturbation. Thus,
THDIA provided information about how sinusoidal the perturbation was, and
THDIFT describes how linear the response of a surfactant monolayer is to a sinusoidal perturbation.
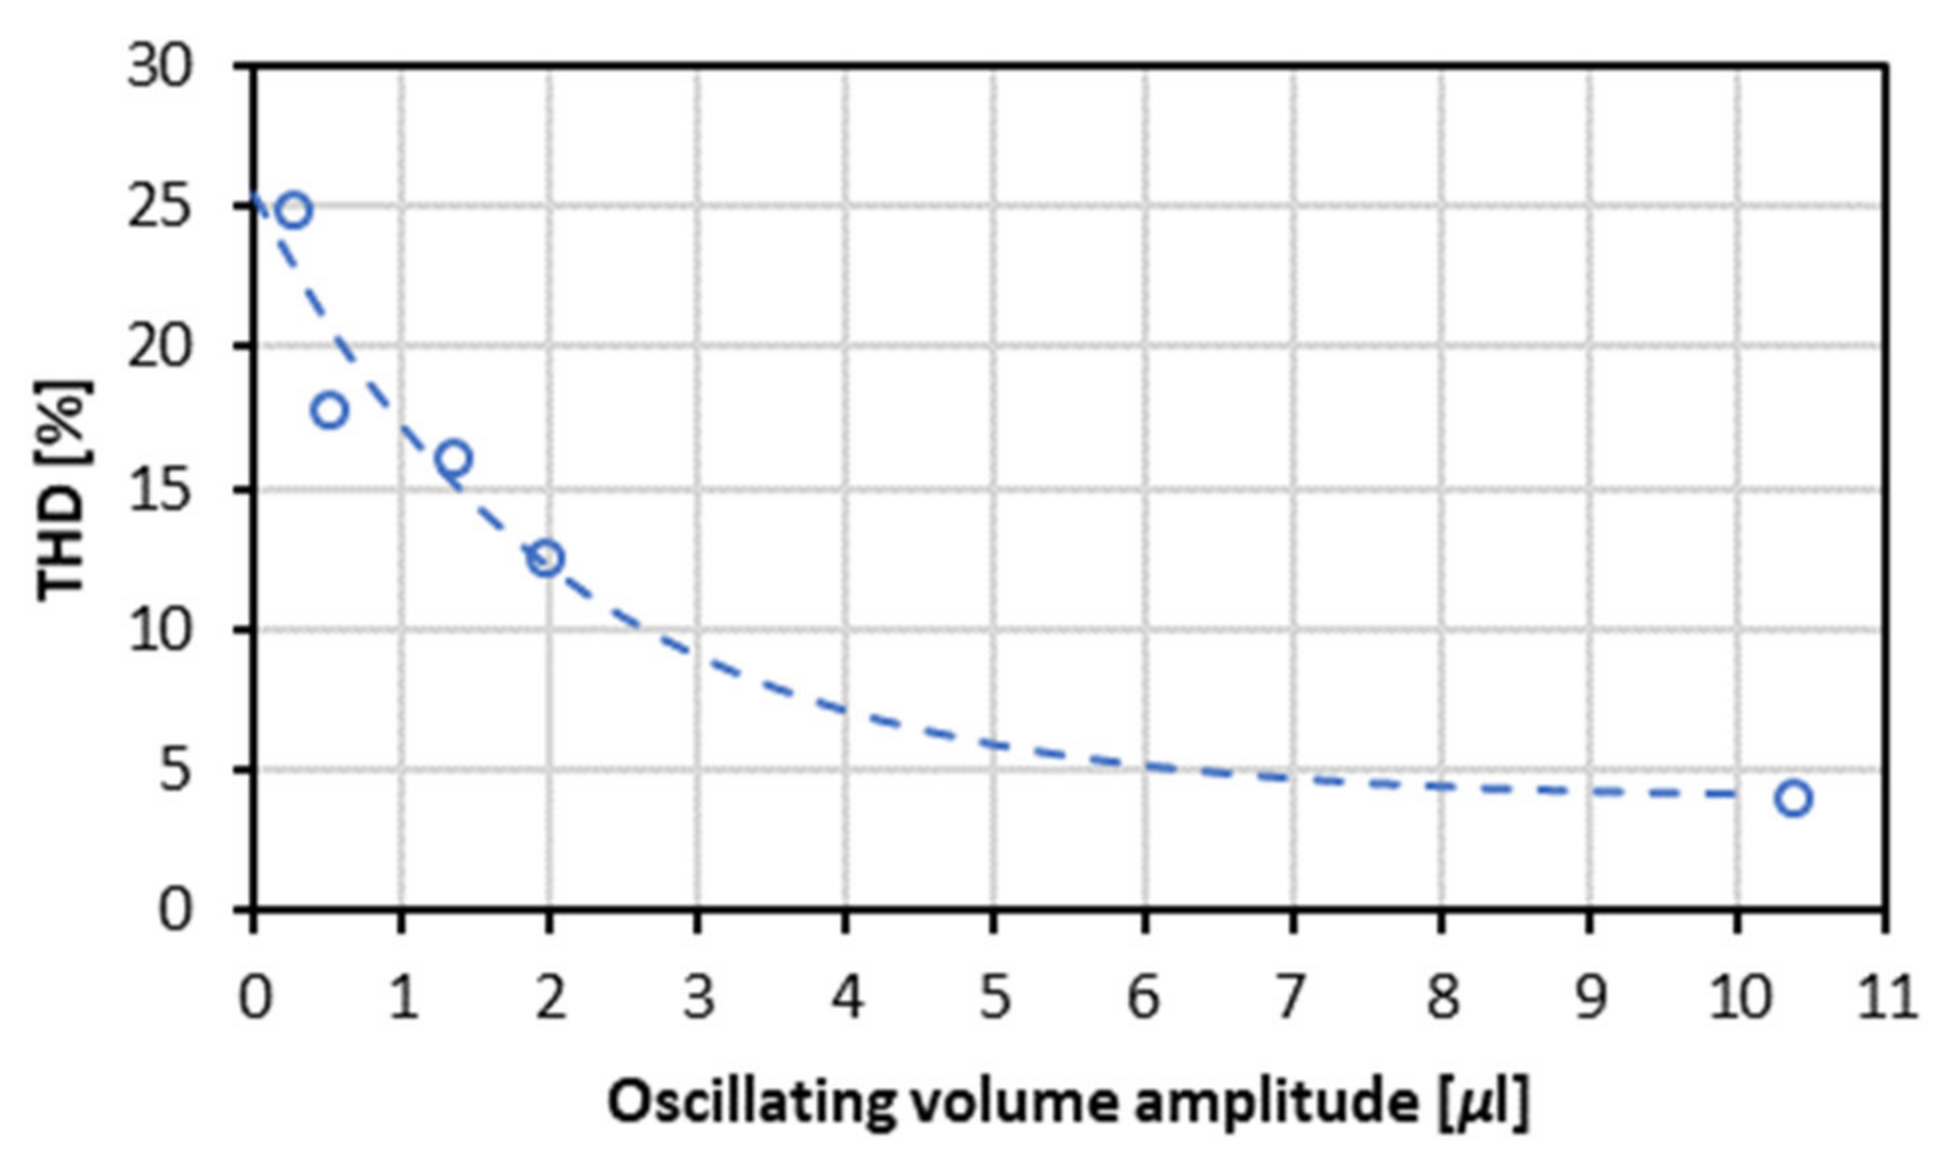
It can be observed from
Figure 8 how increasing oscillation amplitudes reduce the interfacial area-based harmonic distortion (
THDIA) of the fit. The relation of
THDIA to the volume amplitude can be fitted by an Equation of the form:
with the coefficients
A = 4.008,
B = 21.476 and
C = 0.482, corresponding to R
2 = 0.94 (
Figure 8). If an arbitrary limit value of
THDIA is set to 10%, the oscillations should, according to this estimate, be performed with volume amplitudes larger than approximately 2.6 µL.
Since these measurements involve a fixed pressure and temperature and a system with relatively low IFT, the maximum practical droplet size becomes limited.
Table 3 shows the experimental conditions for different measurements at an oscillating frequency of 0.5 Hz and the
THDIA obtained in each case. It is observed that for those conditions with larger density difference between phases, it was not possible to form large enough droplets to allow oscillation amplitude above the validity limit set above (2.6 µL). For these measurements,
THDIA values above 10% were obtained. The validity limit could be decreased to allow smaller volume oscillations by a re-design of the motor acting on the pistons. However, the prototype limited experiments to systems with oscillating volume amplitudes larger than 2.6 µL.
Based on the above investigation of the instrument’s limitations of oscillating amplitude, it was decided to perform measurements with the largest possible amplitudes. The maximum amplitude was determined by two constraints: (i) the drop should not detach from the needle tip and (ii) it should ensure good Laplace-fitting when the minimum volume was reached. This resulted in amplitudes ranging between 30% and 40% of the interfacial area. However, for such large amplitude perturbations (above 10% of the average size), the higher harmonics of the basic frequency of the oscillations start to play a role and a non-linear response is obtained [
39], as it was observed in the
THDIFT values shown in
Table 3. To enable measurements with lower amplitudes ensuring linear responses in the interfacial properties, the motor backlash in the present instrument must be reduced by an improved design of the piston movement mechanism.
5. Conclusions
In close collaboration with DataPhysics Instruments GmbH, a high-pressure high-temperature oscillating drop rheometer has been successfully designed, built and tested. The design of the mechanism for drop oscillation successfully kept the pressure constant during oscillating measurements and the mechanism itself was successfully tested at pressure as high as 1300 bar.
The pressure and temperature influence on the apparent elastic modulus (E′) and viscous modulus (E″) were studied for a system of CO2 and synthetic seawater with the presence of 100 ppm of a linear alkyl ethoxylate surfactant (Brij L23). The moduli showed strong and varying dependency on the pressure and temperature conditions. It is of particular interest that E′ at fixed temperatures of 40 and 80 °C was found to go through a maximum value for pressure between 100 and 300 bar, whereas indications are that E″ decreased uniformly with increasing pressure.
The tests demonstrated in particular two aspects offering room for improvement:
The accuracy of measurement at conditions of maximum temperature (80 °C) and minimum pressure (100 bar) was found to be inferior to that at other temperature and pressure conditions because of reduced visibility. Heat loss at the cell windows caused the windows to be slightly lower in temperature than other parts of the sample chamber. When the bulk phase is in gaseous state and contains water vapor (as in the tests reported here), water vapor can therefore condense on the windows and cause reduced visibility. Improved heat insulation of the windows was not found sufficient to prevent condensation of water vapor. This problem could be solved by implementing an auxiliary heating system for the cell windows.
The instrument did not allow measurements to be performed with small oscillation amplitudes. For volume amplitudes lower than approximately 2.6 µL, the measurements showed values of total harmonic distortion (THDIA) larger than 10%. An objective of a future work will be to reduce the THDIA by developing a better motor design with reduced backlash.
Author Contributions
Conceptualization, A.B. and E.L.; methodology, A.B.; writing—original draft preparation, A.B.; software, DataPhysics Instruments GmbH; writing—review and editing, A.B., T.H., B.B. and E.L.; supervision, T.H. All authors have read and agreed to the published version of the manuscript.
Funding
The present work was done as part of the project “Improved performance of CO2-EOR and underground storage by mobility control of CO2”, financed by the Research Council of Norway through the CLIMIT Programme (Grant number 267859).
Institutional Review Board Statement
Not applicable.
Informed Consent Statement
Not applicable.
Data Availability Statement
Not applicable.
Acknowledgments
We acknowledge the Research Council of Norway for funding this work. We are also grateful for the enormous help and advice obtained from the DataPhysics Instruments GmbH team.
Conflicts of Interest
The authors declare no conflict of interest.
References
- Lee, S.; Kam, S.I. Enhanced oil recovery by using CO2 foams: Fundamentals and field applications. In Enhanced Oil Recovery Field Case Studies; Sheng, J.J., Ed.; Elsevier: Amsterdam, The Netherlands, 2013; p. 712. [Google Scholar]
- Cavanagh, A.; Ringrose, P. Improving Oil Recovery and Enabling CCS: A Comparison of Offshore Gas-recycling in Europe to CCUS in North America. Energy Procedia 2014, 63, 7677–7684. [Google Scholar] [CrossRef] [Green Version]
- Campbell, B.T.; Orr, F.M., Jr. Flow Visualization for CO2/Crude-Oil Displacements (SPE-11958-PA). Soc. Pet. Eng. J. 1985, 25, 665–678. [Google Scholar] [CrossRef]
- Chakravarthy, D.; Muralidharan, V.; Putra, E.; Schechter, D.S. Application of X-Ray CT for Investigation of CO2 and WAG Injection in Fractured Reservoirs. In Proceedings of the Canadian International Petroleum Conference, Calgary, AB, Canada, 8–10 June 2004; p. 14. [Google Scholar]
- Masalmeh, S.K.; Hillgartner, H.; Al-Mjeni, R.A.-M.; Jing, X. Simultaneous Injection of Miscible Gas and Polymer (SIMGAP) to Improve Oil Recovery and Sweep Efficiency from Layered Carbonate Reservoirs (SPE-129645-MS). In Proceedings of the SPE EOR Conference at Oil & Gas West Asia, Muscat, Oman, 11 April 2010; p. 15. [Google Scholar]
- Enick, R.M.; Olsen, D.; Ammer, J.; Schuller, W. Mobility and Conformance Control for CO2 EOR via Thickeners, Foams, and Gels—A Literature Review (SPE-154122-MS). In Proceedings of the SPE Improved Oil Recovery Symposium, Tulsa, OK, USA, 14–18 April 2012; p. 12. [Google Scholar]
- Batôt, G.; Fleury, M.; Nabzar, L. Reducing CO2 Flow Using Foams. Energy Procedia 2017, 114, 4129–4139. [Google Scholar] [CrossRef]
- AlOtaibi, F.; Zhou, X.; Habah, A.; Kokal, S. EOR by CO2 Emulsions Better Sweep Efficiency and Improved Recovery (SPE-183014-MS). In Proceedings of the Abu Dhabi International Petroleum Exhibition & Conference, Abu Dhabi, United Arab Emirates, 7–10 November 2016. [Google Scholar]
- Aarra, M.G.; Skauge, A.; Solbakken, J.; Ormehaug, P.A. Properties of N2- and CO2-foams as a function of pressure. J. Pet. Sci. Eng. 2014, 116, 72–80. [Google Scholar] [CrossRef] [Green Version]
- Dicksen, T.; Hirasaki, G.J.; Miller, C.A. Conditions for Foam Generation in Homogeneous Porous Media (SPE-75176-MS). In Proceedings of the SPE/DOE Improved Oil Recovery Symposium, Tulsa, OK, USA, 13–17 April 2002. [Google Scholar]
- Kumar, S.; Mandal, A. Investigation on stabilization of CO2 foam by ionic and nonionic surfactants in presence of different additives for application in enhanced oil recovery. Appl. Surf. Sci. 2017, 420, 9–20. [Google Scholar] [CrossRef]
- Siddiqui, M.A.Q.; Gajbhiye, R.N. Stability and texture of CO2/N2 foam in sandstone. Colloids Surf. A Physicochem. Eng. Asp. 2017, 534, 26–37. [Google Scholar] [CrossRef] [Green Version]
- Ameri, A.; Ho, B.; Smout, M.; Doorn, M.V.; Boeije, C.S. Experimental Study of Switchable Nonionic to Cationic Surfactants for Acid Diversion in High-Temperature Matrix Stimulation (SPE-184533-MS). In Proceedings of the SPE International Conference on Oilfield Chemistry, Montgomery, TX, USA, 3–5 April 2017. [Google Scholar]
- Bernard, G.C.; Holm, L.W.; Harvey, C.P. Use of Surfactant to Reduce CO2 Mobility in Oil Displacement (SPE-8370-PA). Soc. Pet. Eng. J. 1980, 20, 281–292. [Google Scholar] [CrossRef]
- Boeije, C.S.; Bennetzen, M.V.; Rossen, W.R. A Methodology for Screening Surfactants for Foam Enhanced Oil Recovery in an Oil-Wet Reservoir (SPE 185182). SPE Reserv. Eval. Eng. 2017, 20, 795–808. [Google Scholar] [CrossRef]
- Chabert, M.; Nabzar, L.; Beunat, V.; Lacombe, E.; Cuenca, A. Impact of Surfactant Structure and Oil Saturation on the Behavior of Dense CO2 Foams in Porous Media (SPE-169116-MS). In Proceedings of the SPE Improved Oil Recovery Symposium, Tulsa, OK, USA, 12–16 April 2014. [Google Scholar]
- Sagir, M.; Tan, I.M.; Mushtaq, M.; Talebian, S.H. FAWAG Using CO2 Philic Surfactants for CO2 Mobility Control for Enhanced Oil Recovery Applications (SPE-172189-MS). In Proceedings of the SPE Saudi Arabia Section Annual technical Symposium and Exhibition, Al-Khobar, Saudi Arabia, 21–24 April 2014. [Google Scholar]
- De Vries, A.J. Foam stability: Part V. Mechanism of film rupture. Recl. Trav. Chim. des Pays-Bas 1958, 77, 441–461. [Google Scholar] [CrossRef]
- Loglio, G.; Pandolfini, P.; Miller, R.; Makievski, A.V.; Ravera, F.; Ferrari, M.; Liggieri, L. Drop and Bubble Shape Analysis as a Tool for Dilational Rheological Studies of Interfacial Layers. In Novel Methods to Study Interfacial Layers; Moebius, D., Miller, R., Eds.; Elsevier Science: Amsterdam, The Netherlands, 2001; pp. 439–483. [Google Scholar]
- Hoorfar, M.; Neumann, A.W. Recent progress in Axisymmetric Drop Shape Analysis (ADSA). Adv. Colloid Interface Sci. 2006, 121, 25–49. [Google Scholar] [CrossRef] [PubMed]
- Kovalchuck, V.I.; Krägel, J.; Aksenenko, E.V.; Loglio, G.; Liggieri, L. Oscillating Bubble and Drop Techniques. In Novel Methods to Study Interfacial Layers; Moebius, D., Miller, R., Eds.; Elsevier Science: Amsterdam, The Netherlands, 2001; pp. 485–516. [Google Scholar]
- Leser, M.E.; Acquistapace, S.; Cagna, A.; Makievksi, A.V.; Miller, R. Limits of Oscillation Frequencies in Drop and Bubble Shape Tensiometry. Colloids Surf. A Physicochem. Eng. Asp. 2005, 261, 25–28. [Google Scholar] [CrossRef]
- Reichert, M.D.; Alvarez, N.J.; Brooks, C.F.; Grillet, A.M.; Mondy, L.A.; Anna, S.L.; Walker, L.M. The importance of experimental design on measurement of dynamic interfacial tension and interfacial rheology in diffusion-limited surfactant systems. Colloids Surf. A Physicochem. Eng. Asp. 2015, 467, 135–142. [Google Scholar] [CrossRef] [Green Version]
- Ivanov, I.B.; Danov, K.D.; Ananthapadmanabhan, K.P.; Lips, A. Interfacial rheology of adsorbed layers with surface reaction: On the origin of the dilatational surface viscosity. Adv. Colloid Interface Sci. 2005, 114–115, 61–92. [Google Scholar] [CrossRef] [PubMed]
- Lucassen-Reynders, E.H. Interfacial Viscoelasticity in Emulsions and Foams. Food Struct. 1993, 2, 1–12. [Google Scholar]
- Liggieri, L.; Attolini, V.; Ferrari, M.; Ravera, F. Measurement of the Surface Dilational Viscoelasticity of Adsorbed Layers with a Capillary Pressure Tensiometer. J. Colloid Interface Sci. 2002, 255, 225–235. [Google Scholar] [CrossRef]
- Liggieri, L.; Ferrari, M.; Mondelli, D.; Ravera, F. Surface rheology as a tool for the investigation of processes internal to surfactant adsorption layers. Faraday Discuss. 2005, 129, 125–140. [Google Scholar] [CrossRef]
- Liao, Y.-C.; Basaran, O.A.; Franses, E.I. Hydrodynamic effects on the oscillations of supported bubbles: Implications for accurate measurements of surface properties. Colloids Surf. A Physicochem. Eng. Asp. 2004, 250, 367–384. [Google Scholar] [CrossRef]
- Freer, E.M.; Wong, H.; Radke, C.J. Oscillating drop/bubble tensiometry: Effect of viscous forces on the measurement of interfacial tension. J. Colloid Interface Sci. 2005, 282, 128–132. [Google Scholar] [CrossRef]
- Loglio, G.; Pandolfini, P.; Miller, R.; Makievski, A.V.; Krägel, J.; Ravera, F.; Noskov, B.A. Perturbation–response relationship in liquid interfacial systems: Non-linearity assessment by frequency–domain analysis. Colloids Surf. A Physicochem. Eng. Asp. 2005, 261, 57–63. [Google Scholar] [CrossRef]
- Loglio, G.; Pandolfini, P.; Miller, R.; Makievski, A.; Krägel, J.; Ravera, F. Oscillation of interfacial properties in liquid systems: Assessment of harmonic distortion. Phys. Chem. Chem. Phys. 2004, 6, 1375–1379. [Google Scholar] [CrossRef] [Green Version]
- Føyen, T.; Brattekås, B.; Fernø, M.A.; Barrabino, A.; Holt, T. Increased CO2 storage capacity using CO2-foam. Int. J. Greenh. Gas Control. 2020, 96, 103016. [Google Scholar] [CrossRef]
- Barrabino, A.; Holt, T.; Lindeberg, E. Partitioning of non-ionic surfactants between CO2 and brine. J. Pet. Sci. Eng. 2020, 190, 107106. [Google Scholar] [CrossRef]
- Føyen, T.; Alcorn, Z.P.; Fernø, M.A.; Barrabino, A.; Holt, T. CO2 mobility reduction using foam stabilized by CO2- and water-soluble surfactants. J. Pet. Sci. Eng. 2021, 196, 107651. [Google Scholar] [CrossRef]
- O’Neill, M.L.; Cao, Q.; Fang, M.; Johnston, K.P.; Wilkinson, S.P.; Smith, C.D.; Kerschner, J.L.; Jureller, S.H. Solubility of Homopolymers and Copolymers in Carbon Dioxide. Ind. Eng. Chem. Res. 1998, 37, 3067–3079. [Google Scholar] [CrossRef]
- Adkins, S.S.; Chen, X.; Nguyen, Q.P.; Sanders, A.W.; Johnston, K.P. Effect of branching on the interfacial properties of nonionic hydrocarbon surfactants at the air-water and carbon dioxide-water interfaces. J. Colloid Interface Sci. 2010, 346, 455–463. [Google Scholar] [CrossRef] [PubMed]
- Ren, G.; Zhang, H.; Nguyen, Q.P. Effect of Surfactant Partitioning Between CO2 and Water on CO2 Mobility Control During CO2 Flooding. Soc. Pet. Eng. 2011, 752–765. [Google Scholar] [CrossRef]
- Hansen, F.K. Surface Dilatational Elasticity of Poly(oxy ethylene)-Based Surfactants by Oscillation and Relaxation Measurements of Sessile Bubbles. Langmuir 2008, 24, 189–197. [Google Scholar] [CrossRef] [PubMed]
- Warszynski, P.; Wantke, K.D.; Fruhner, H. Surface elasticity of oscillating spherical interfaces. Colloids Surf. A Physicochem. Eng. Asp. 1998, 139, 137–153. [Google Scholar] [CrossRef]
| Publisher’s Note: MDPI stays neutral with regard to jurisdictional claims in published maps and institutional affiliations. |
© 2021 by the authors. Licensee MDPI, Basel, Switzerland. This article is an open access article distributed under the terms and conditions of the Creative Commons Attribution (CC BY) license (https://creativecommons.org/licenses/by/4.0/).


