
Particle Deposition to Silica Surfaces Functionalized with Cationic Polyelectrolytes


Department of Inorganic and Analytical Chemistry, University of Geneva, Sciences II, 30 Quai Ernest-Ansermet, 1205 Geneva, Switzerland
*
Author to whom correspondence should be addressed.
Colloids Interfaces 2021, 5(2), 26; https://0-doi-org.brum.beds.ac.uk/10.3390/colloids5020026
Submission received: 23 March 2021
/
Revised: 19 April 2021
/
Accepted: 20 April 2021
/
Published: 1 May 2021
Abstract
:Positively charged water-solid interfaces are prepared by adsorption of a cationic polyelectrolyte poly(diallyldimethylammonium chloride) (PDADMAC) from aqueous solutions to planar silica substrates. These substrates are characterized by atomic force microscopy (AFM), optical reflectivity, and streaming current measurements. By tuning the amount of adsorbed polyelectrolyte, the surface charge of the substrate can be systematically varied. These substrates are further used to study deposition of sulfate latex nanoparticles, which is also accomplished by optical reflectivity. This deposition process is found to be consistent with an extension of the random sequential adsorption (RSA) model in a semi-quantitative fashion. Such deposition studies were further used to ascertain that the substrates obtained by in situ and ex situ functionalization behave in an identical fashion.
1. Introduction
Polyelectrolytes are known to adsorb strongly and irreversibly from aqueous solutions to oppositely charged substrates [1,2,3,4]. Several systems of this kind are known, particularly those involving cationic polyelectrolytes and negatively charged substrates. Examples involve poly(ethylene imine) (PEI) [5], poly-L-lysine (PLL) [6,7,8], poly(allylamine hydrochloride) (PAH) [2,7], and poly(diallyldimethyl-ammonium chloride) (PDADMAC) [9] adsorbing to silica or mica. Such systems were mainly studied with optical reflectivity [6,9], quartz crystal microbalance [7], and streaming potential techniques [2,5]. Thereby, a saturated polyelectrolyte monolayer layer is formed with an adsorbed mass in the range of 0.05–0.5 mg/m2, thickness 0.5–2 nm, and water content 20–50%. The adsorption process is basically irreversible, meaning that once these films have formed, they remain very stable in polyelectrolyte-free electrolyte solutions. Another important feature of these films is that they induce a charge reversal (or overcharging) of the substrate, thus leading to positively charged surfaces in the case of cationic polyelectrolytes.
The stability of such polyelectrolyte layers motivated numerous researchers to exploit them as a simple and reproducible approach to functionalize surfaces, as the substrate can be simply incubated in an aqueous solution of the polyelectrolyte in question. The presence of the charge reversal further permits to generate positively charged substrates easily. The principal application of such charge-reversed substrate is the layer-by-layer (LbL) technique, whereby one adsorbs an additional layer of an oppositely charged polyelectrolyte, and then repeats this process with cationic and anionic polyelectrolytes numerous times [10,11,12]. In this fashion, substrates functionalized with well-defined polyelectrolyte multilayers can be obtained. Such multilayers were studied in substantial detail and they have numerous applications, including surface patterning, electro-optic materials, or sensors [11]. Another application of such substrates functionalized with polyelectrolytes was to study deposition of colloidal particles, for example, silver [13,14] or gold nanoparticles [15], or micron-sized latex particles [16,17,18].
While various types of polyelectrolytes were used to fabricate such functionalized surfaces, researchers have hardly addressed the question to which extent one could modify the properties of these films, which were prepared with one type of polyelectrolyte. While it has been shown that the adsorbed amount of polyelectrolytes can be tuned through the salt level or pH [6,9], we are only aware of a single study where this effect has been exploited to vary the properties of the functionalized surface [19]. In that study, however, only two salt levels have been used, and to which extent the surface properties can be systematically tuned has not been addressed.
The present article investigates the question how one can tune the properties of a surface that has been functionalized with an adsorbed polyelectrolyte layer. In particular, we focus on silica substrates functionalized with PDADMAC. These surfaces will be characterized with atomic force microscopy (AFM), optical reflectivity, and streaming potential techniques. We further study deposition of colloidal particles to such functionalized substrates. These deposition studies are used to demonstrate that substrates that were prepared in situ and ex situ have the same properties and that these substrates behave very similarly to simple water-solid interfaces.
2. Material and Methods
2.1. Materials
Poly(diallyldimethylammonium chloride) (PDADMAC) of molecular weight 400–500 kg/mol was purchased from Sigma-Aldrich (Steinman, Germany). A stock suspension of the polyelectrolyte was prepared in pure water and all necessary solutions were then obtained by dilution of the stock solution and adjusting the ionic strength and the pH and with respective solutions of analytical grade NaCl, NaOH, and HCl. The latter chemicals were purchased from Sigma-Aldrich, Acros Organics (Geel, Belgium), and Fisher Chemicals (Loughborough, UK), respectively.
Negatively charged sulfate latex nanoparticles were purchased from Invitrogen (Eugene, OR, USA). The manufacturer reports an average particle radius of 20 nm and a polydispersity of 15% as determined by transmission electron microscopy. The manufacturer further reports a particle density of 1.055 g/cm3 and a surface charge density of −6.0 mC/m2 obtained by conductometry. We have further characterized the nanoparticles by AFM imaging (Cypher, Oxford Instruments, Santa Barbara, CA, USA), dynamic light scattering (DLS), and electrophoresis (Zetasizer ZS, Malvern Instruments, Malvern, UK). Size distribution analysis of the nanoparticles by AFM yields an average radius of 21 nm and a polydispersity, expressed as the coefficient of variation, of 30%. DLS and electrophoresis measurements were carried out with suspensions at concentrations of 20–100 mg/L and were investigated in NaCl solutions of 1.0 mM adjusted to pH 4.0. The hydrodynamic particle radius was measured as 21 nm, which is in good agreement with our AFM measurements and the value reported by the manufacturer. However, the polydispersity determined by the AFM yields a somewhat larger value than the one reported by the manufacturer. Time-resolved DLS measurements revealed that at ionic strength below 50 mM, the particle suspensions remain perfectly stable for at least 3 h. For ionic strength in the range of 1–10 mM, electrophoresis measurements yield an electrophoretic mobility of −(3.7 ± 0.2) × 10–8 m2/V/s. The model of O’Brian and White [20] was used to convert the mobilities to electrokinetic potentials , which were around –70 ± 10 mV. Surface charge densities of −13 ± 3 mC/m2 were obtained with the Grahame equation for monovalent electrolytes [21]:
where is the Boltzmann constant, T the absolute temperature, the vacuum permittivity, the dielectric constant of water, the Avogadro’s constant, I the ionic strength, and e the elementary charge. The charge density obtained from electrophoresis is comparable to the one reported by the manufacturer, albeit being larger in magnitude somewhat. Prior to use, nanoparticle suspension was dialyzed with cellulose ester membrane (Repligen) against pure water until the conductivity of water dropped below 10 µS/cm. The concentration of dialyzed suspension was determined using static light scattering by comparing the scattering intensity of dialyzed samples with the scattering intensity of the original particle suspension of known concentration.
Silicon (Si) wafers, p-type and boron-doped, were purchased from Silchem (Freiberg, Germany). For the reflectivity measurements, they were cut into approximate squares of 10 × 10 mm and oxidized in a furnace at 1000 °C for 3 h to obtain a thermally grown silica (SiO2) layer on their surfaces. For the streaming potential measurements, they were cut by means of a laser to the size of 10 mm × 20 mm with a precision of 0.1 mm, and they were mostly used with the native silica layer. Some streaming potential measurements were also carried out with the oxidized wafers, and the results were found to be identical. The precise thickness of the silica layer of each substrate was determined by null ellipsometry (Multiskop, Optrel, Berlin, Germany) in air [22]. The ellipsometry data were analyzed with a slab model using the refractive indices for the appropriate light wavelength of 633 nm for silicon and silica of 3.85 + 0.02i and 1.457, respectively [23,24]. The measured thickness of the native silica layer was about 2–4 nm, while the one of the oxidized wafer was around 100 nm. Prior to measurements, the wafers were cleaned in a 1:1 mixture of H2SO4 (96%, Carlo Erba Reagents, Val de Reuil, France) and H2O2 (30%, Rectolab) for 20 min and then rinsed with pure water. Finally, the surface was dried in a flow of nitrogen followed by cleaning in air plasma for 30 min (PDC-32G, Harrick, Ithaca, NY, USA). All experiments were carried out at room temperature of 20 ± 3 °C and Milli-Q water (Millipore, Burlington, MA, USA) was used throughout.
2.2. Topographic Imaging
Sample topographies were recorded with an AFM (Cypher Asylum Research, Oxford Instruments) in amplitude modulation mode. Images were acquired in air with cantilevers with tetrahedral silicon tips (AC160TS-R3, Olympus, Japan). These cantilevers had spring constants of around 30 N/m and resonance frequencies of around 300 kHz. Cantilevers were excited at their resonance frequencies with free oscillation amplitudes (FOA) of around 12 nm. The set points were typically 75% of the FOA and the scan rate was 1 Hz.
2.3. Optical Reflectivity
Adsorption and deposition processes were monitored in situ using optical reflectometry in a stagnation point flow cell [25,26,27]. A home-built fixed-angle reflectometer was equipped with a polarized green diode laser working with a wavelength of 532 nm (World Star Tech TECGL-532 Series) and home-build flow through cell. The cell consisted of a capped equilateral quartz prism with a vertical borehole serving as the inlet and a spacer ensuring a well-defined horizontal gap between the substrate and the prism. The solution was pumped through the cell with a peristaltic pump. The detector consists of a beam splitter and two diodes acquiring the light intensities, which are proportional to the reflectance in the perpendicular and parallel direction, denoted as and . The reflectometry signal R is then calculated as
where C is an unknown instrumental constant that can be eliminated by normalizing the time-dependent signal to its initial value , namely
The dry mass of the deposited species, , can then be calculated from this quantity as
where B is the sensitivity constant that is obtained theoretically from a homogeneous slab model [25,26,27]. This model assumes that the silicon block is coated with a silica layer of known thickness. We use the refractive indices at the appropriate light wavelength of silicon and silica of 4.132 + 0.033i and 1.461, respectively [23,24]. Adsorption of the polyelectrolyte is modeled by adding an additional layer above the silica layer, whereby the corresponding refractive index calculated with the mixing law
where 1.335 is the refractive index of water, L is the thickness of the additional layer, and is the refractive index increment. For the polyelectrolyte layer, the refractive index increment is 0.230 mL/g and a layer thickness of 2 nm was used [7,9]. To model the deposition of nanoparticles, a further layer was added above the polyelectrolyte layer. The refractive index of that layer was also calculated with Equation (5), whereby the refractive index increment is 0.235 mL/g and a layer thickness of 42 nm was chosen. The latter value corresponds to the mean diameter of the nanoparticles. The refractive index increments were determined by an automatic refractometer (Abbemat WR/MW, Anton Paar GmbH, Graz, Austria). The sensitivity constants B entering Equation (4) were similar for the adsorbed polyelectrolyte as well as for the deposited nanoparticles, and they were around 0.035 ± 0.005 m2/mg. Moreover, these constants depend only weakly on the layer thickness chosen. More details concerning the experimental set-up and data analysis can be found elsewhere [9,28].
2.4. Electrokinetic Potential
The electrokinetic potential of ex situ PDADMAC-functionalized substrates was measured with the streaming potential and the streaming current technique with SurPASS (Anton Paar GmbH). The surfaces were immersed into PDADMAC solution of 5 mg/L concentration and fixed ionic strength and pH for 60 min. Afterward, both surfaces were rinsed with water for 5 min. Two PDADMAC-functionalized surfaces, which were prepared in an identical fashion, were mounted into the instrument on both sides of the flow cell for the measurement.
The streaming potential was measured as a function of the pressure difference , which causes the electrolyte solution to flow through the cell. The electrokinetic potential is then calculated from the Helmholtz–Smoluchowski relationship [29,30]
where is the dynamic viscosity of water, which is taken as 0.89 mPas, L the length of the rectangular channel, A is the perpendicular cross-sectional area of the channel, and is the electrical resistance of the cell. The latter parameter is obtained by a simultaneous measurement of the electrical current through the channel. The parameters L and A are obtained from the channel dimensions, which are 20 mm × 10 mm × 0.10 mm. The gap thickness is adjusted prior to each experiment. The measurement precision is improved by repeating the same experiment for various pressure differences.
Measuring the streaming current provides an alternative to the streaming potential technique. That technique measures the electric current I passing through the cell, and the electrokinetic potential can be obtained by means of the relation [29,30,31]
The advantage of the streaming current technique is that independent measurements of the cell resistance are not needed. Additionally, the streaming current technique allows minimizing errors related to the surface and ionic conductances [29,30,32]. In case of PDADMAC-functionalized surfaces, the streaming potential and streaming current techniques were used. We found that both techniques yield highly consistent results, except for ionic strengths lower than 3 mM. Even at these conditions, the difference in the resulting electrokinetic potentials was small, typically below 10%. Given the advantages of the streaming current technique, most measurements presented here were carried out with that technique.
3. Results and Discussion
Functionalization of silica substrates by simple physical adsorption of cationic polyelectrolyte poly(diallyl-dimethylammonium chloride) (PDADMAC) is studied with optical reflectivity, streaming potential measurements, and AFM imaging. This functionalization makes these substrates positively charged. Such functionalized substrates are prepared in two different ways, namely in situ in the reflectometer cell and ex situ by dip coating. Very similar substrates are obtained with these two techniques. We further studied deposition of polystyrene latex nanoparticles to these substrates with reflectometry and AFM imaging. We found that the deposited mass of the nanoparticles strongly depends on the ionic strength and the charge density of the substrate. These trends can be described with a sequential adsorption model that includes effects of electrostatics in a semi-quantitative fashion. Representative AFM images of the bare silica substrate, the functionalized substrate, and the functionalized substrate with deposited nanoparticles are shown in Figure 1.
3.1. Preparation and Characterization of the In Situ Functionalized Substrates
The functionalization of the silica substrate with PDADMAC is achieved in situ within the cell of the optical reflectometer. This technique permits to follow the functionalization in real time. Furthermore, the stability of the functionalized substrates can be easily tested.
The oxidized silicon wafer was mounted in the cell, and first rinsed with a NaCl electrolyte solution with adjusted pH. Subsequently, the PDADMAC solution of 5 mg/L in the same electrolyte was injected, typically during 5 min. Finally, the same PDADMAC-free electrolyte solution was injected again. Typical results of such experiments are shown in Figure 2. During the first injection, a baseline could be established. The adsorption process can be followed during the injection of the PDADMAC solution. After an initial rapid rise of the adsorbed amount, a plateau was observed. This plateau indicates the formation of a saturated PDADMAC film. The fact that the adsorbed amount remains essentially the same during the rinsing process with the PDADMAC-free electrolyte solution indicates that the adsorbed PDADMAC film is very stable, and does not desorb. The different traces shown in Figure 2 correspond to different ionic strengths adjusted with NaCl. One observes that the adsorbed amount of PDADMAC increases with increasing ionic strength. We have further tested the stability of these films in PDADMAC-free solutions of different ionic strengths. In all situations, basically no desorption could be observed, typically over a time scale of one hour.
Figure 3 shows the adsorbed amount of PDADMAC at saturation as a function of ionic strength for pH 4.0 and 10.0. One observes that the adsorbed amount increases with increasing ionic strength and pH. The present data on PDADMAC adsorption obtained with optical reflectivity are fully consistent with those presented earlier [9]. Results obtained on similar systems suggest that the adsorbed amount continues to increase up to the solubility limit of the salt used [7]. However, these high salt concentrations are not exploited here.
3.2. Preparation and Characterization of the Ex Situ Functionalized Substrates
The functionalization of the silica substrate with PDADMAC was also achieved ex situ by dip coating. Thereby, the oxidized silicon wafer was incubated in a PDADMAC solution of 5.0 mg/L in a NaCl electrolyte solution of given pH for 1 h, and subsequently thoroughly rinsed in the same PDADMAC-free electrolyte solution. Comparison with the reflectivity results that this incubation time is largely sufficient to obtain a fully saturated layer. These ex situ functionalized substrates were characterized with streaming potential and streaming current measurements in PDADMAC-free solutions of different ionic strength and pH. As already established by optical reflectivity, such PDADMAC films are found to be perfectly stable. No differences between the substrates prepared in situ and ex situ were found by AFM imaging. Further evidence that these two types of preparation methods leads to virtually identical substrates are presented in Section 3.3 and Section 3.4.
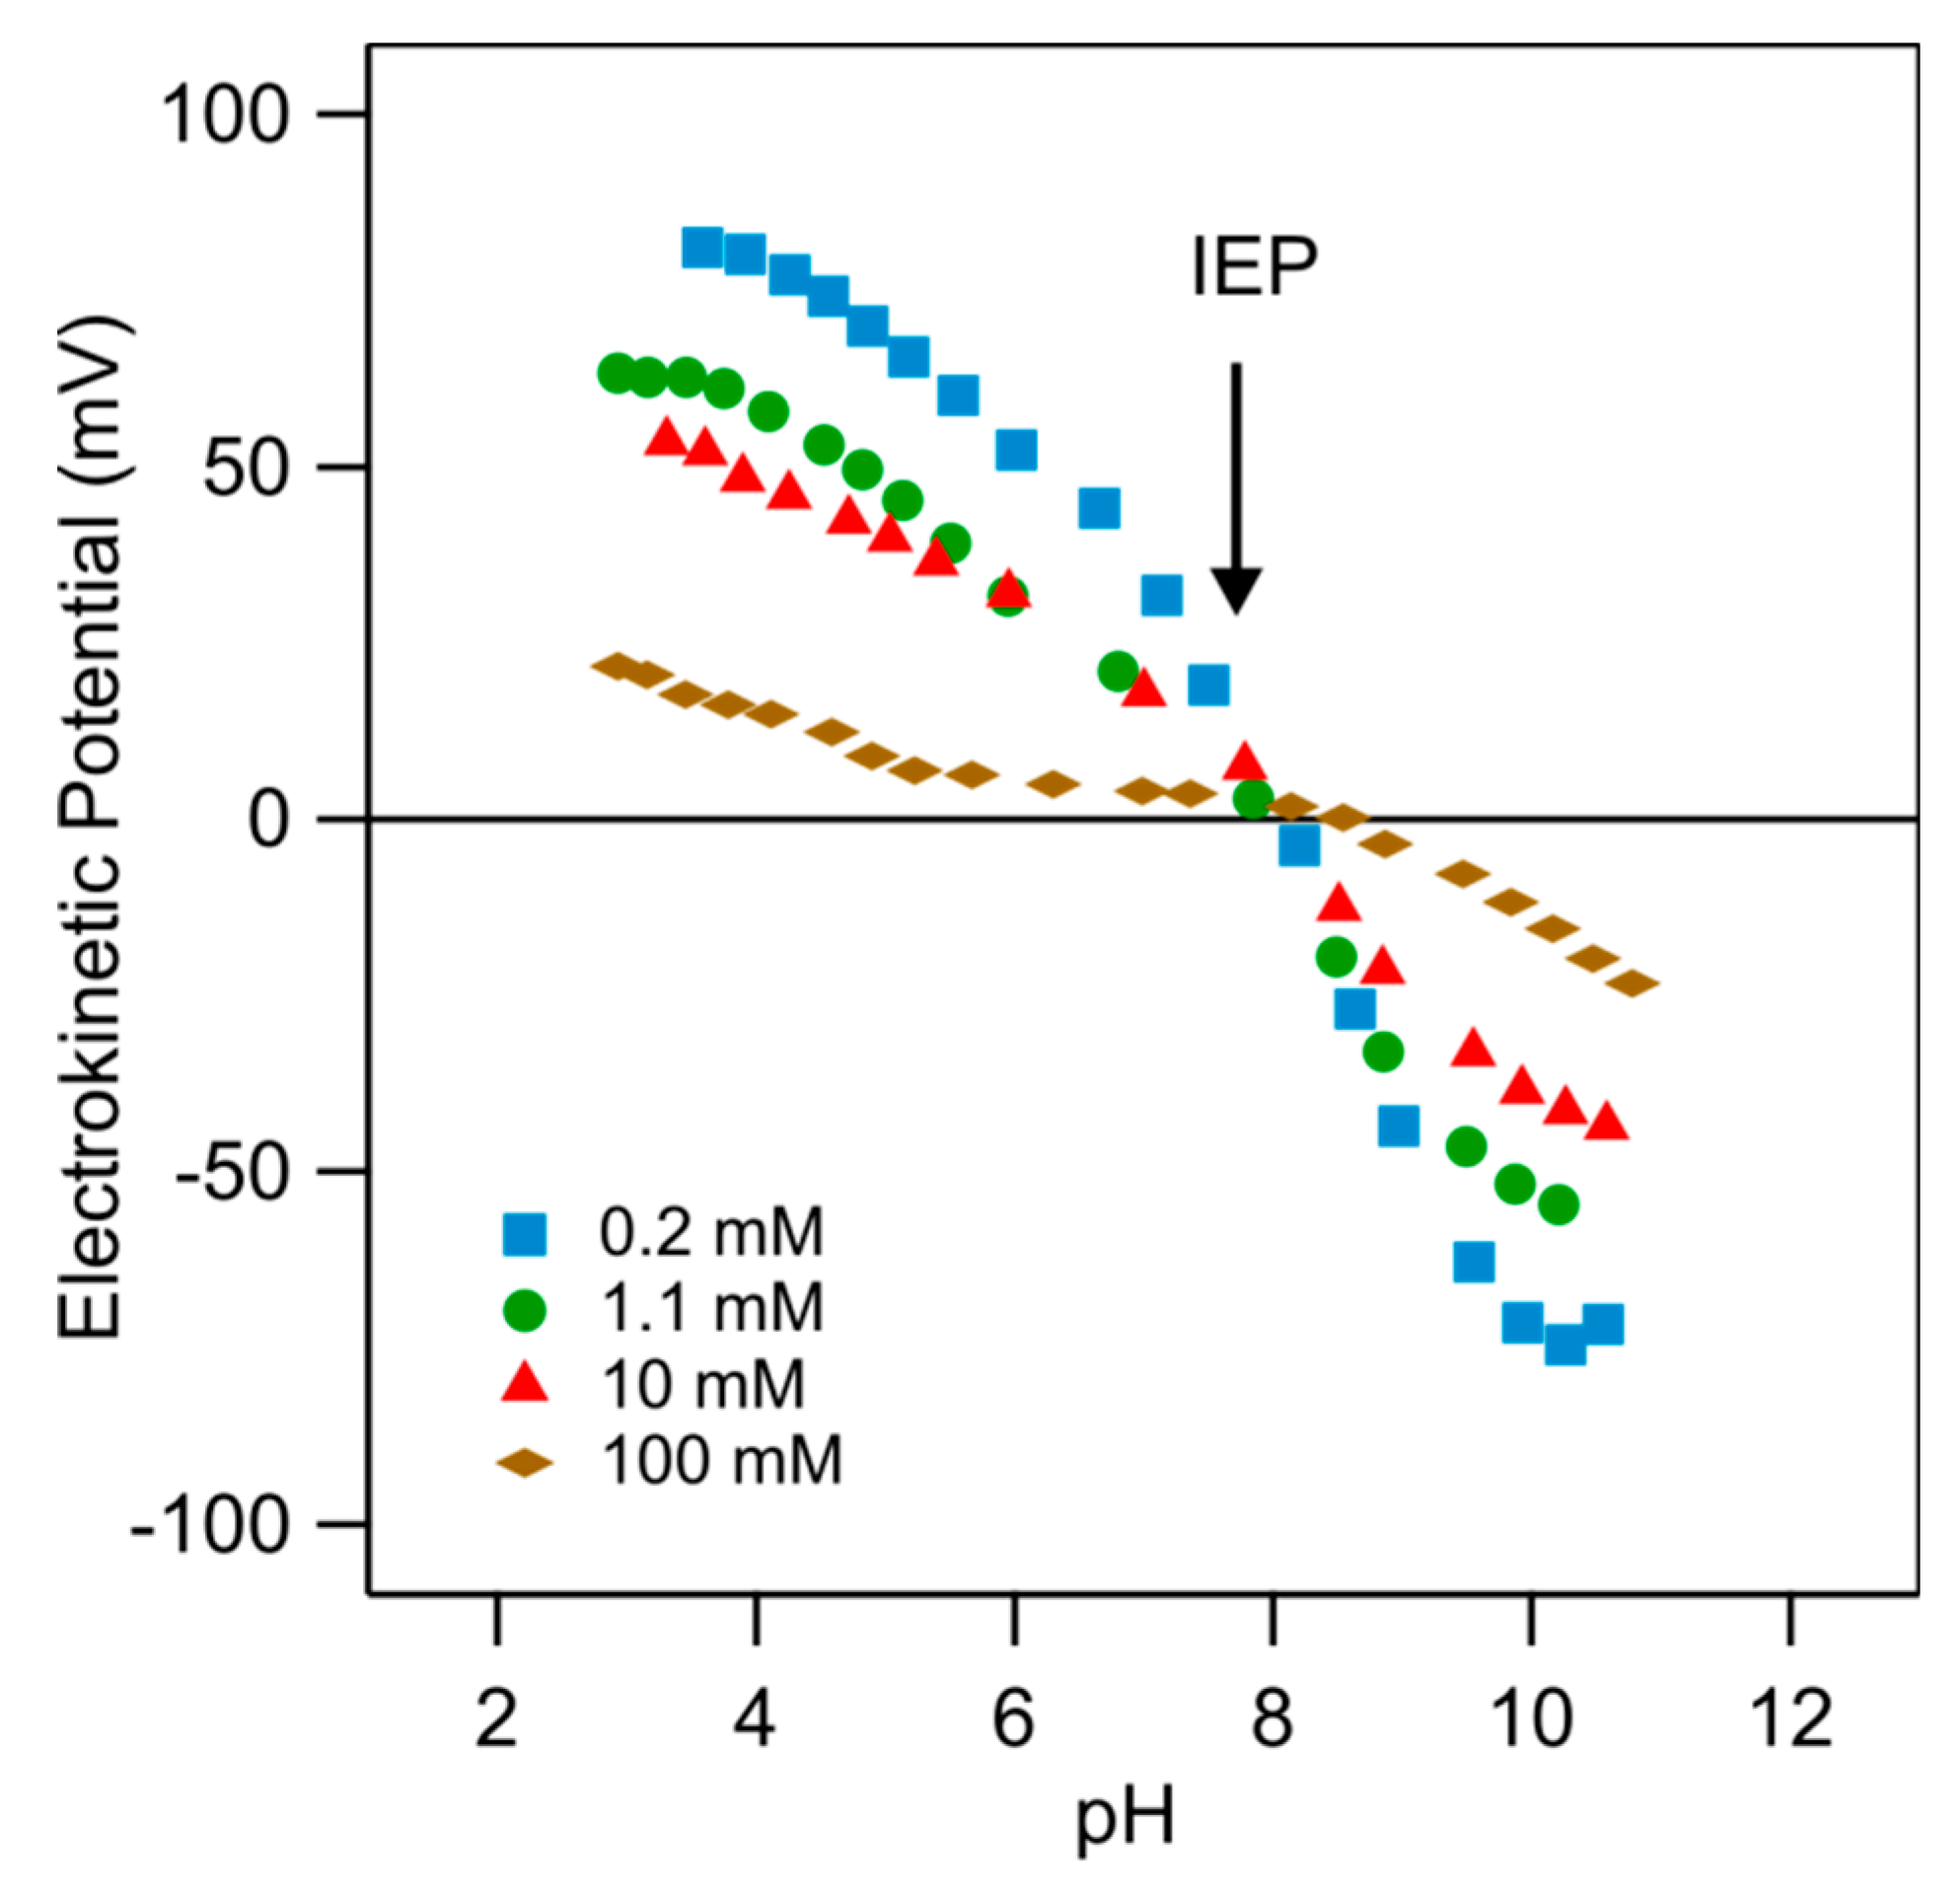
Typical results for the electrokinetic potential (ζ-potential) for an ex situ PDADMAC-functionalized substrate are shown in Figure 4. The substrate was functionalized during 1 h in a PDADMAC solution with a concentration 5 mg/L of an ionic strength of 10 mM and pH 4. Referring to data shown in Figure 3, one finds that the adsorbed amount of PDADMAC is 0.14 mg/m2. One finds that the electrokinetic potential decreases with increasing pH, whereby the substrate undergoes a charge reversal, and passes thorough an isoelectric point (IEP). With increasing ionic strength, the dependence of the electrokinetic potential on pH becomes stronger, but the position of the IEP remains unchanged. Considering all these measurements, we can locate the IEP at pH 7.8 ± 0.1. The presence of this characteristic crossing point is an indication that the charging behavior is dominated by the electrical double layer [21] and that the PDADMAC-functionalized substrate remains perfectly stable during the course of the experiments, which typically last about one hour. This finding is also consistent with reflectivity experiments, where no desorption could be observed over comparable time periods.
Similar behavior was observed for the electrokinetic potential obtained for colloidal particles, for example, titania or iron oxide [33,34]. The similarities between these data sets indicate that the present PDADMAC-functionalized substrate behaves as a simple water-oxide interface [2,35,36,37,38].
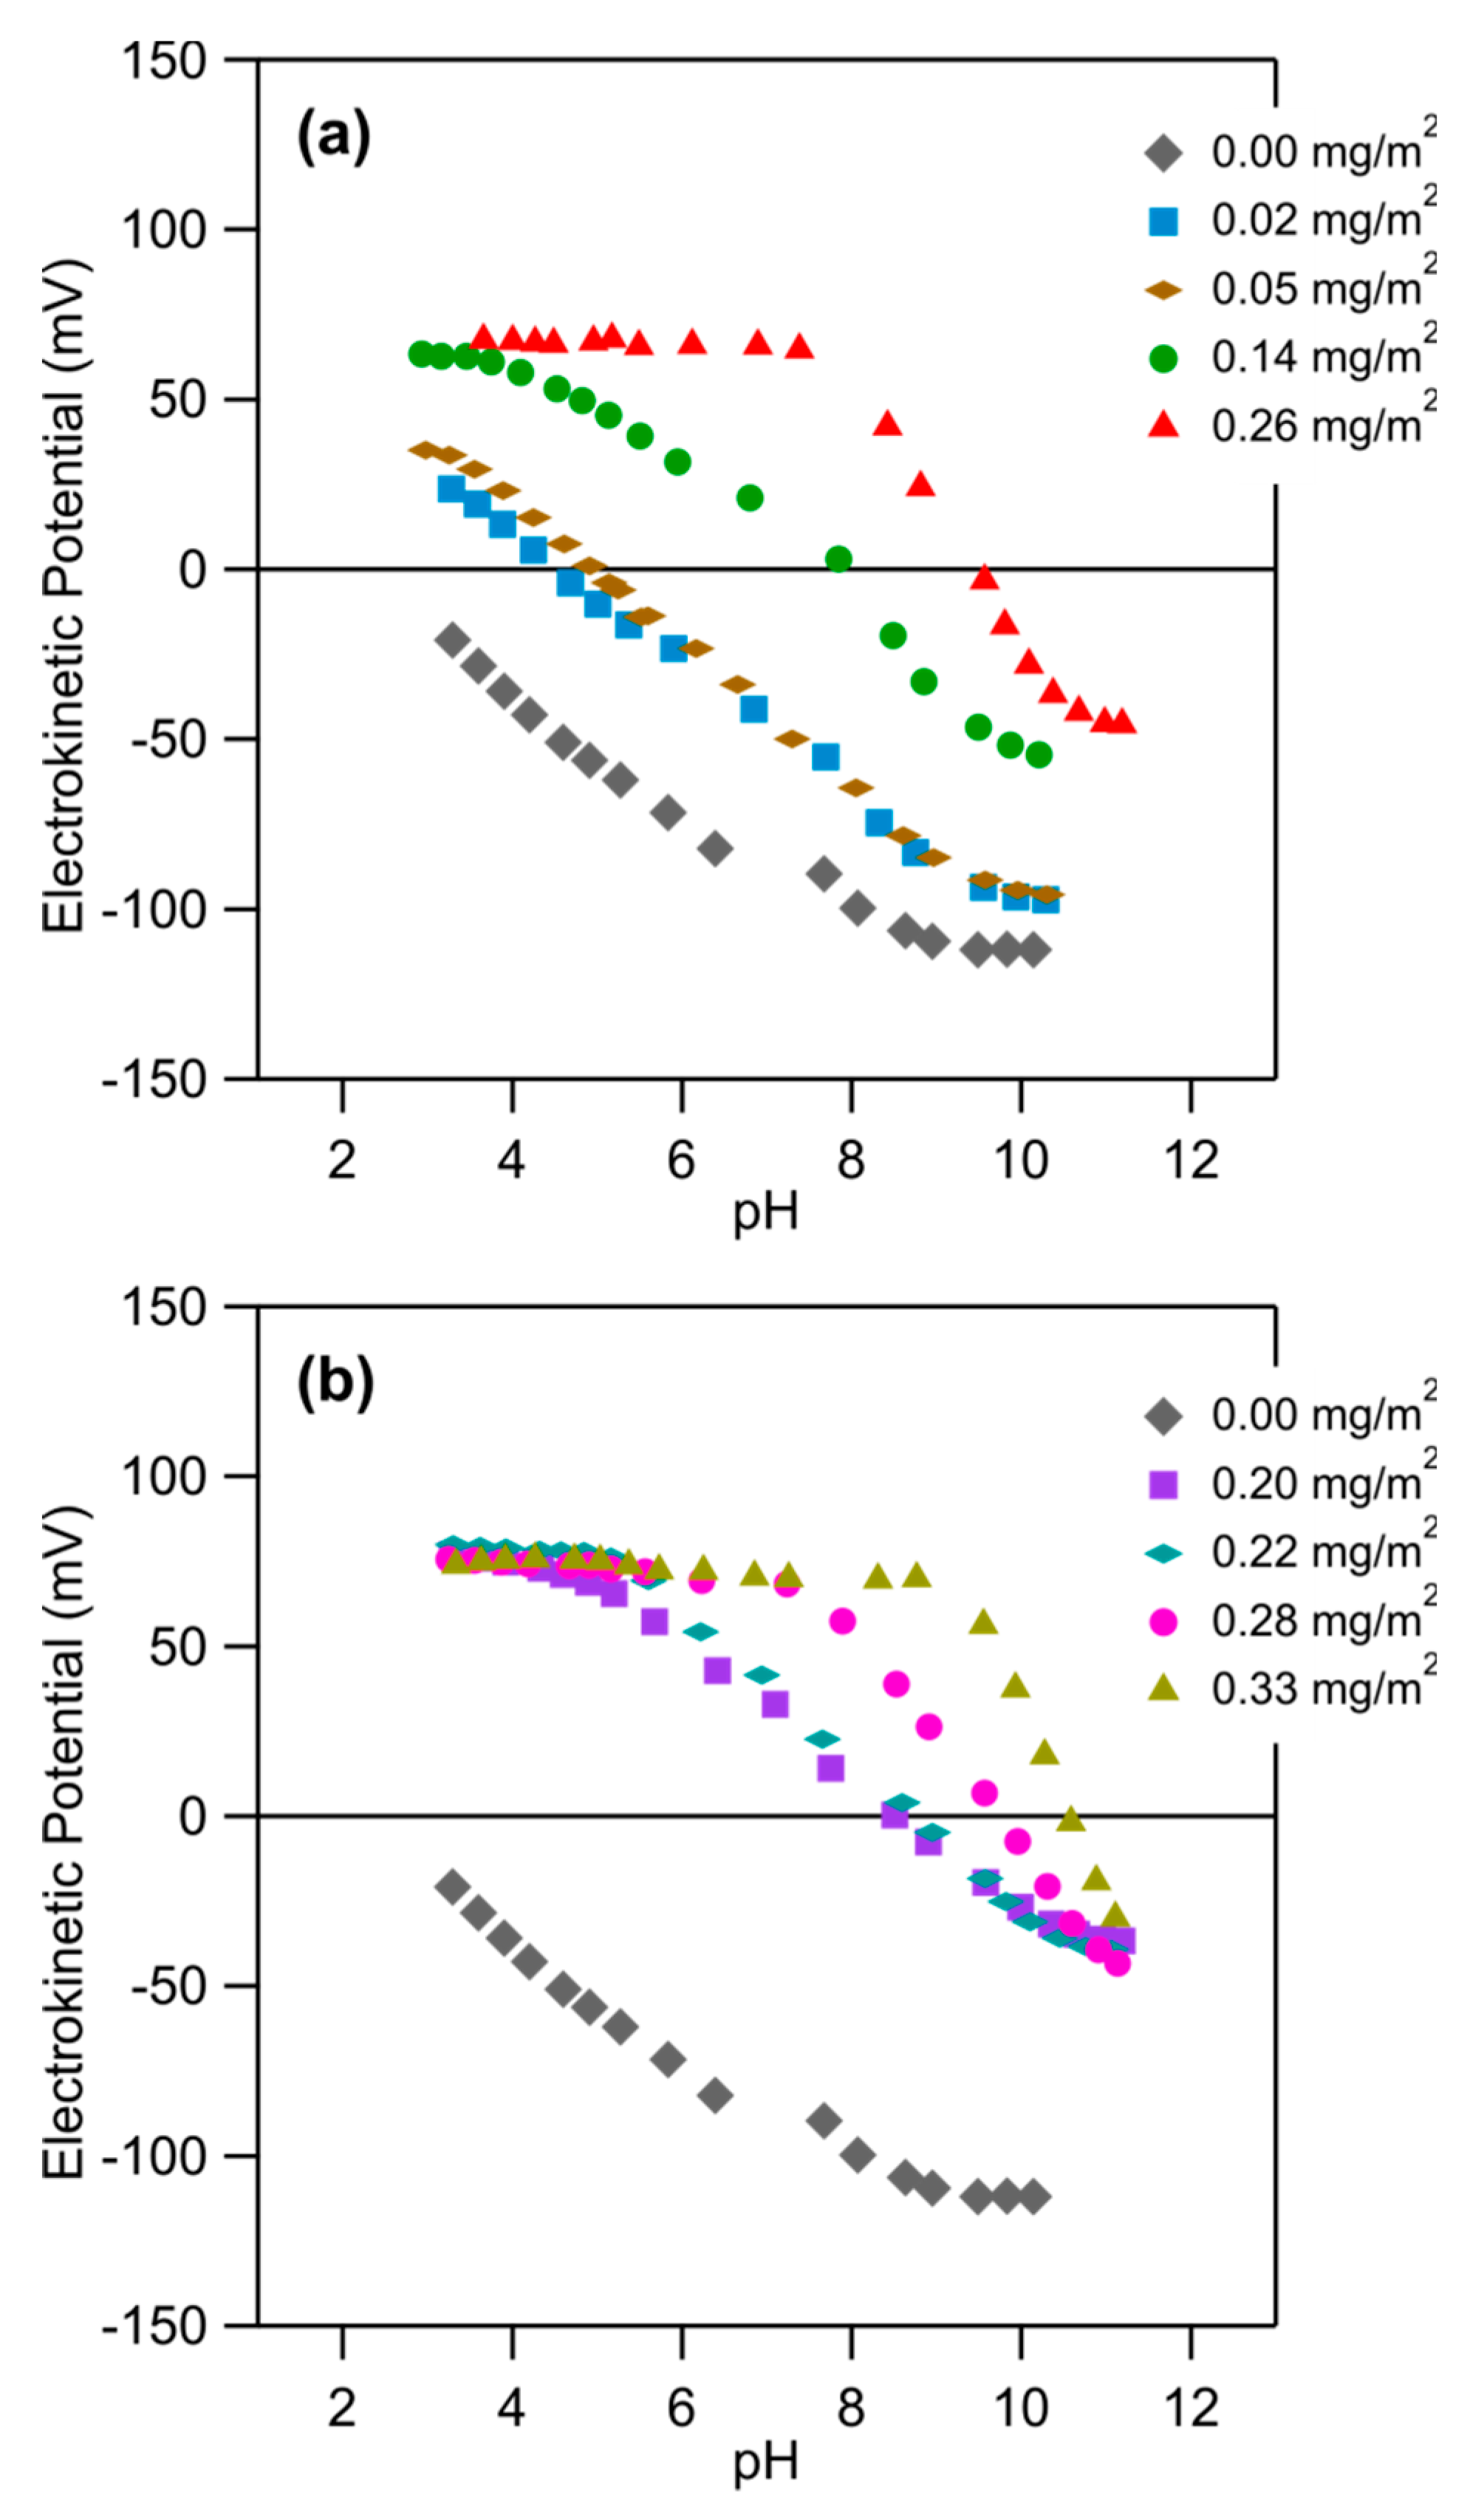
We have further studied the electrokinetic potential of different PDADMAC-functionalized substrates. The different substrates were prepared ex situ by varying the ionic strength of the PDADMAC solution, which was adjusted by adding NaCl. We further compared PDADMAC solutions of pH 4.0 and 10.0. The PDADMAC concentration was fixed to 5.0 mg/L. The electrokinetic potential of these different substrates was studied as a function of the solution pH at an ionic strength of 1.0 mM. The results are shown in Figure 5. One observes that the electrokinetic potential increases with increasing ionic strength of the PDADMAC solution. This feature can be understood by recalling that the adsorbed amount of PDADMAC increases with this parameter as well and therefore leads to higher charge density. When one compares the adsorption carried out at different pH values, one finds that at pH 10.0, the electrokinetic potential is somewhat higher than at pH 4.0 (see Figure 5a,b). This feature can be also understood since a larger amount of PDADMAC adsorbs at higher pH.
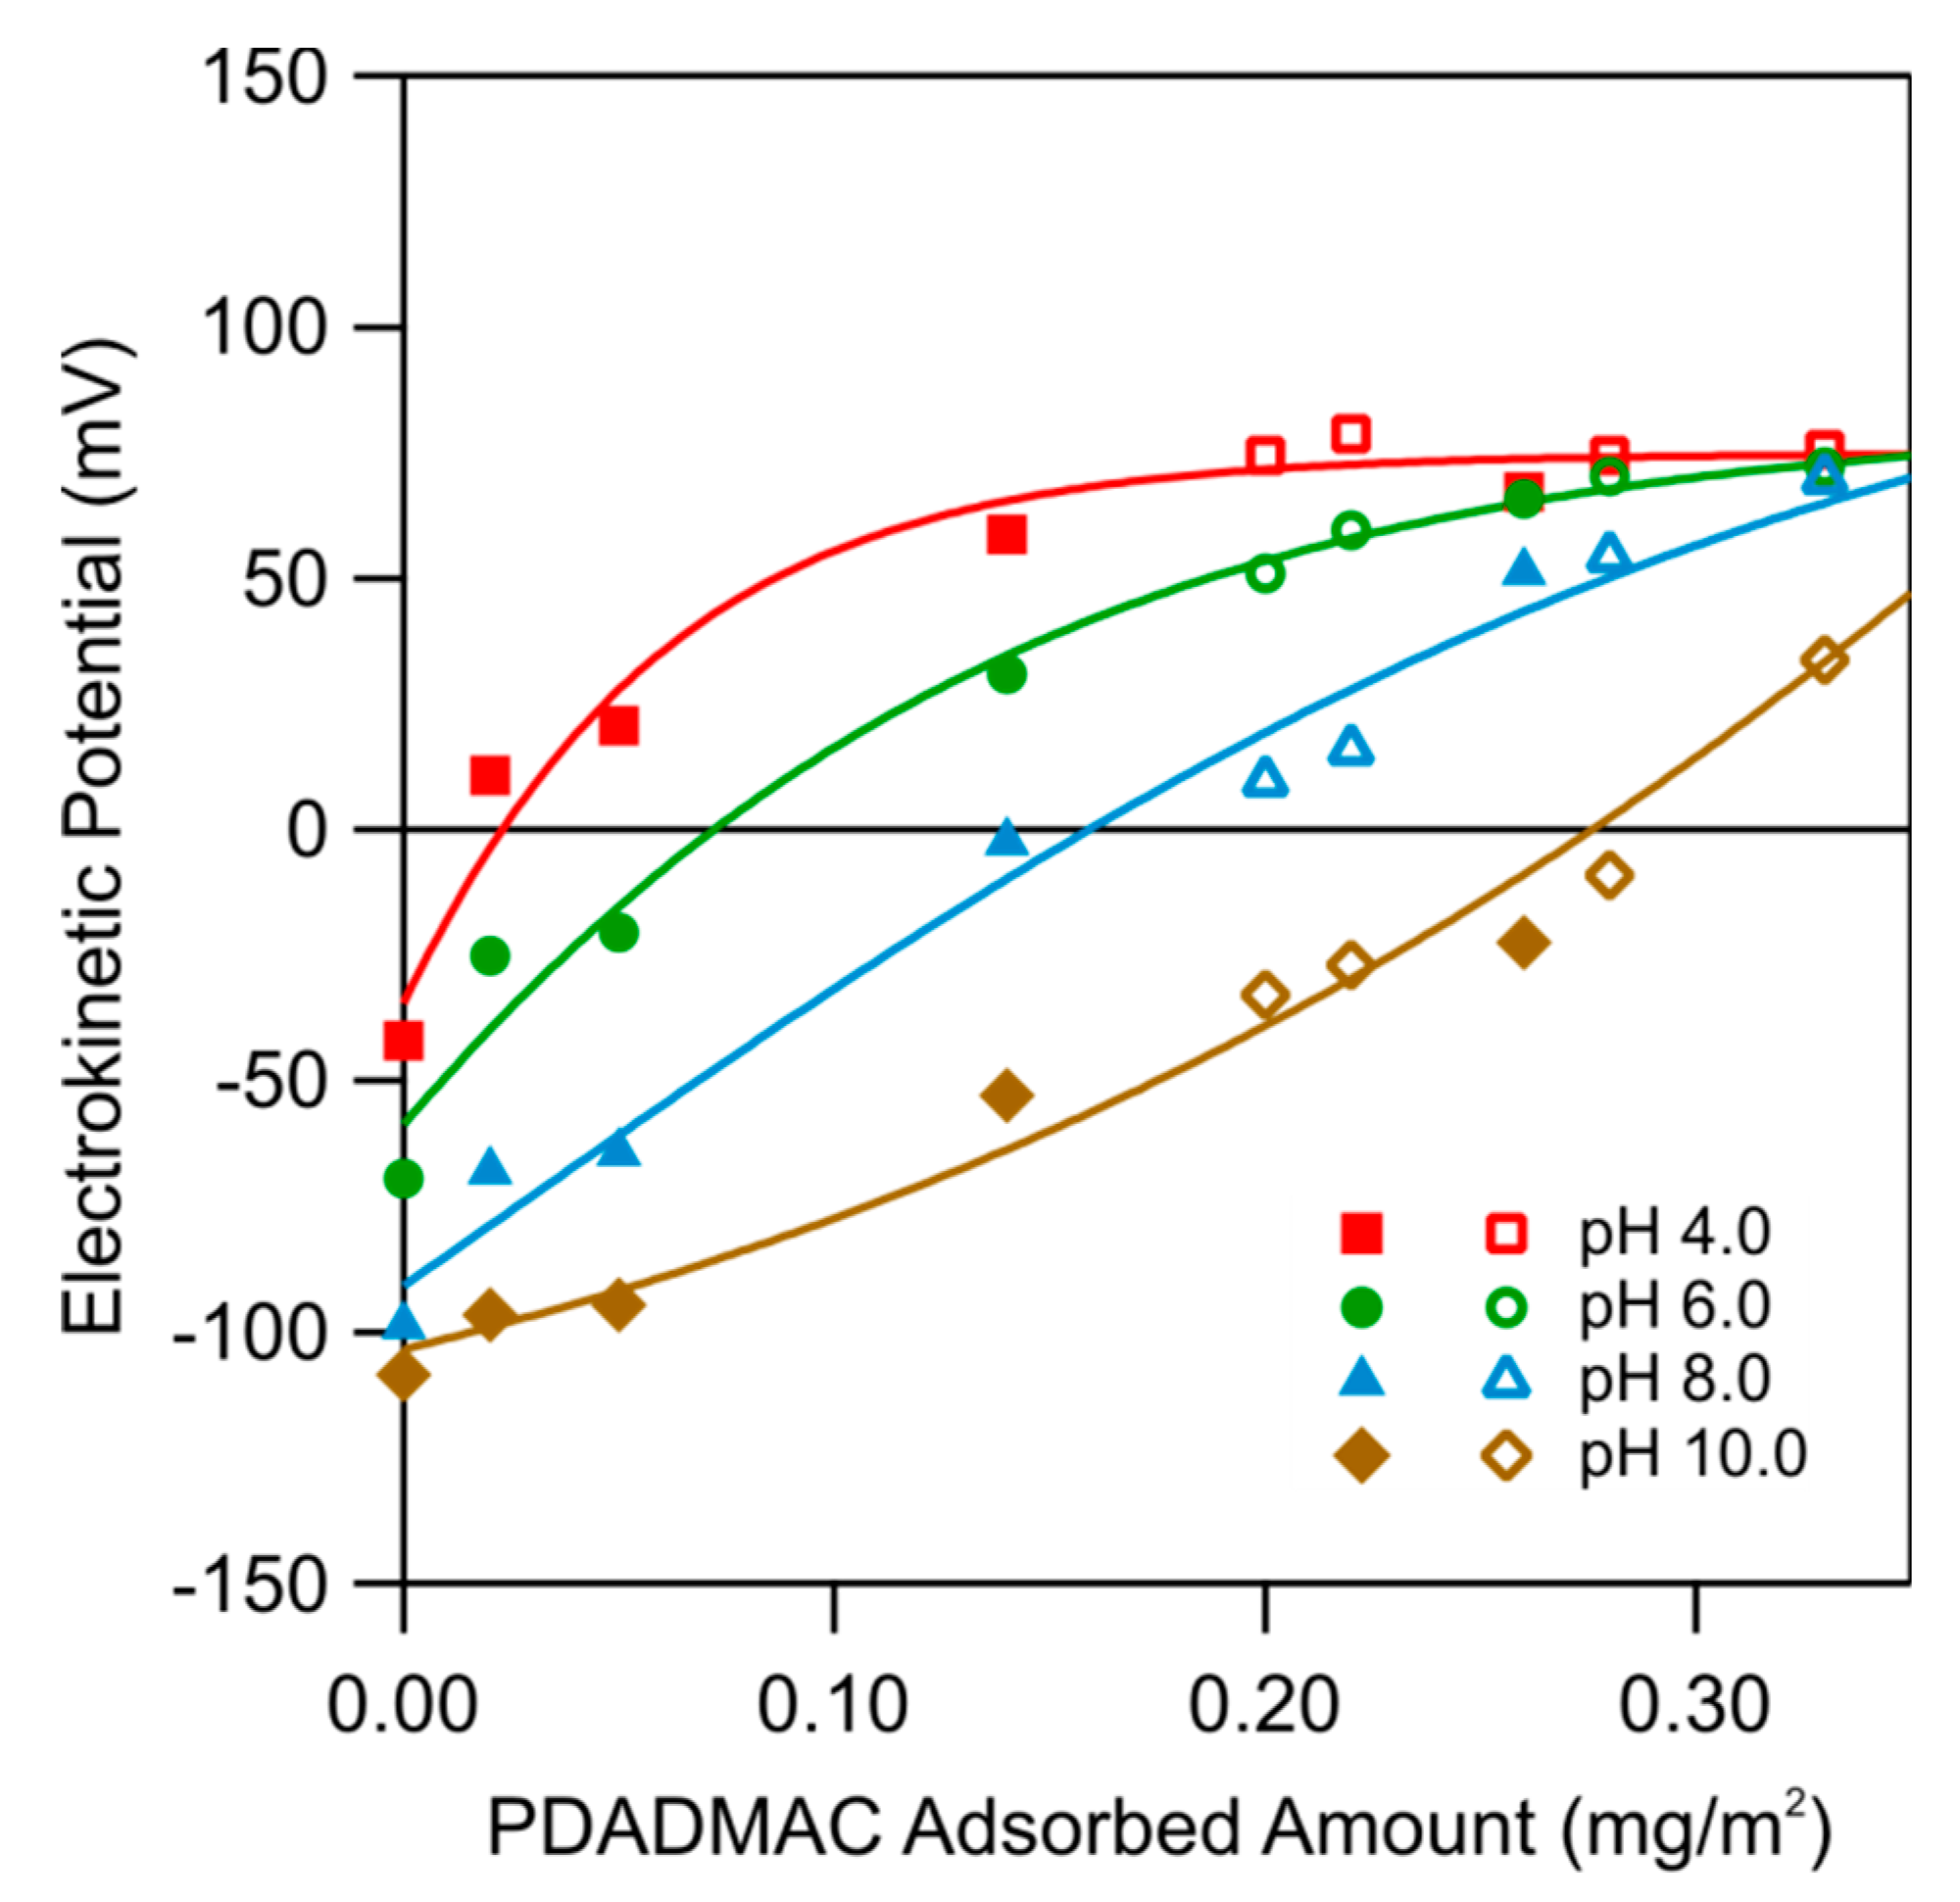
From the data shown in Figure 5, one can also extract the electrokinetic potential as a function of the adsorbed amount of PDADMAC for different pH values. The resulting plot is shown in Figure 6. One observes that the electrokinetic potential increases with an increasing adsorbed amount, and decreases with increasing pH. Figure 5 further shows that the pH of the PDADMAC solution, which was used during the adsorption process, does not influence the electrokinetic potentials. We thus conclude that the only relevant variable, which influences the properties of the adsorbed films, is the adsorbed amount of PDADMAC.
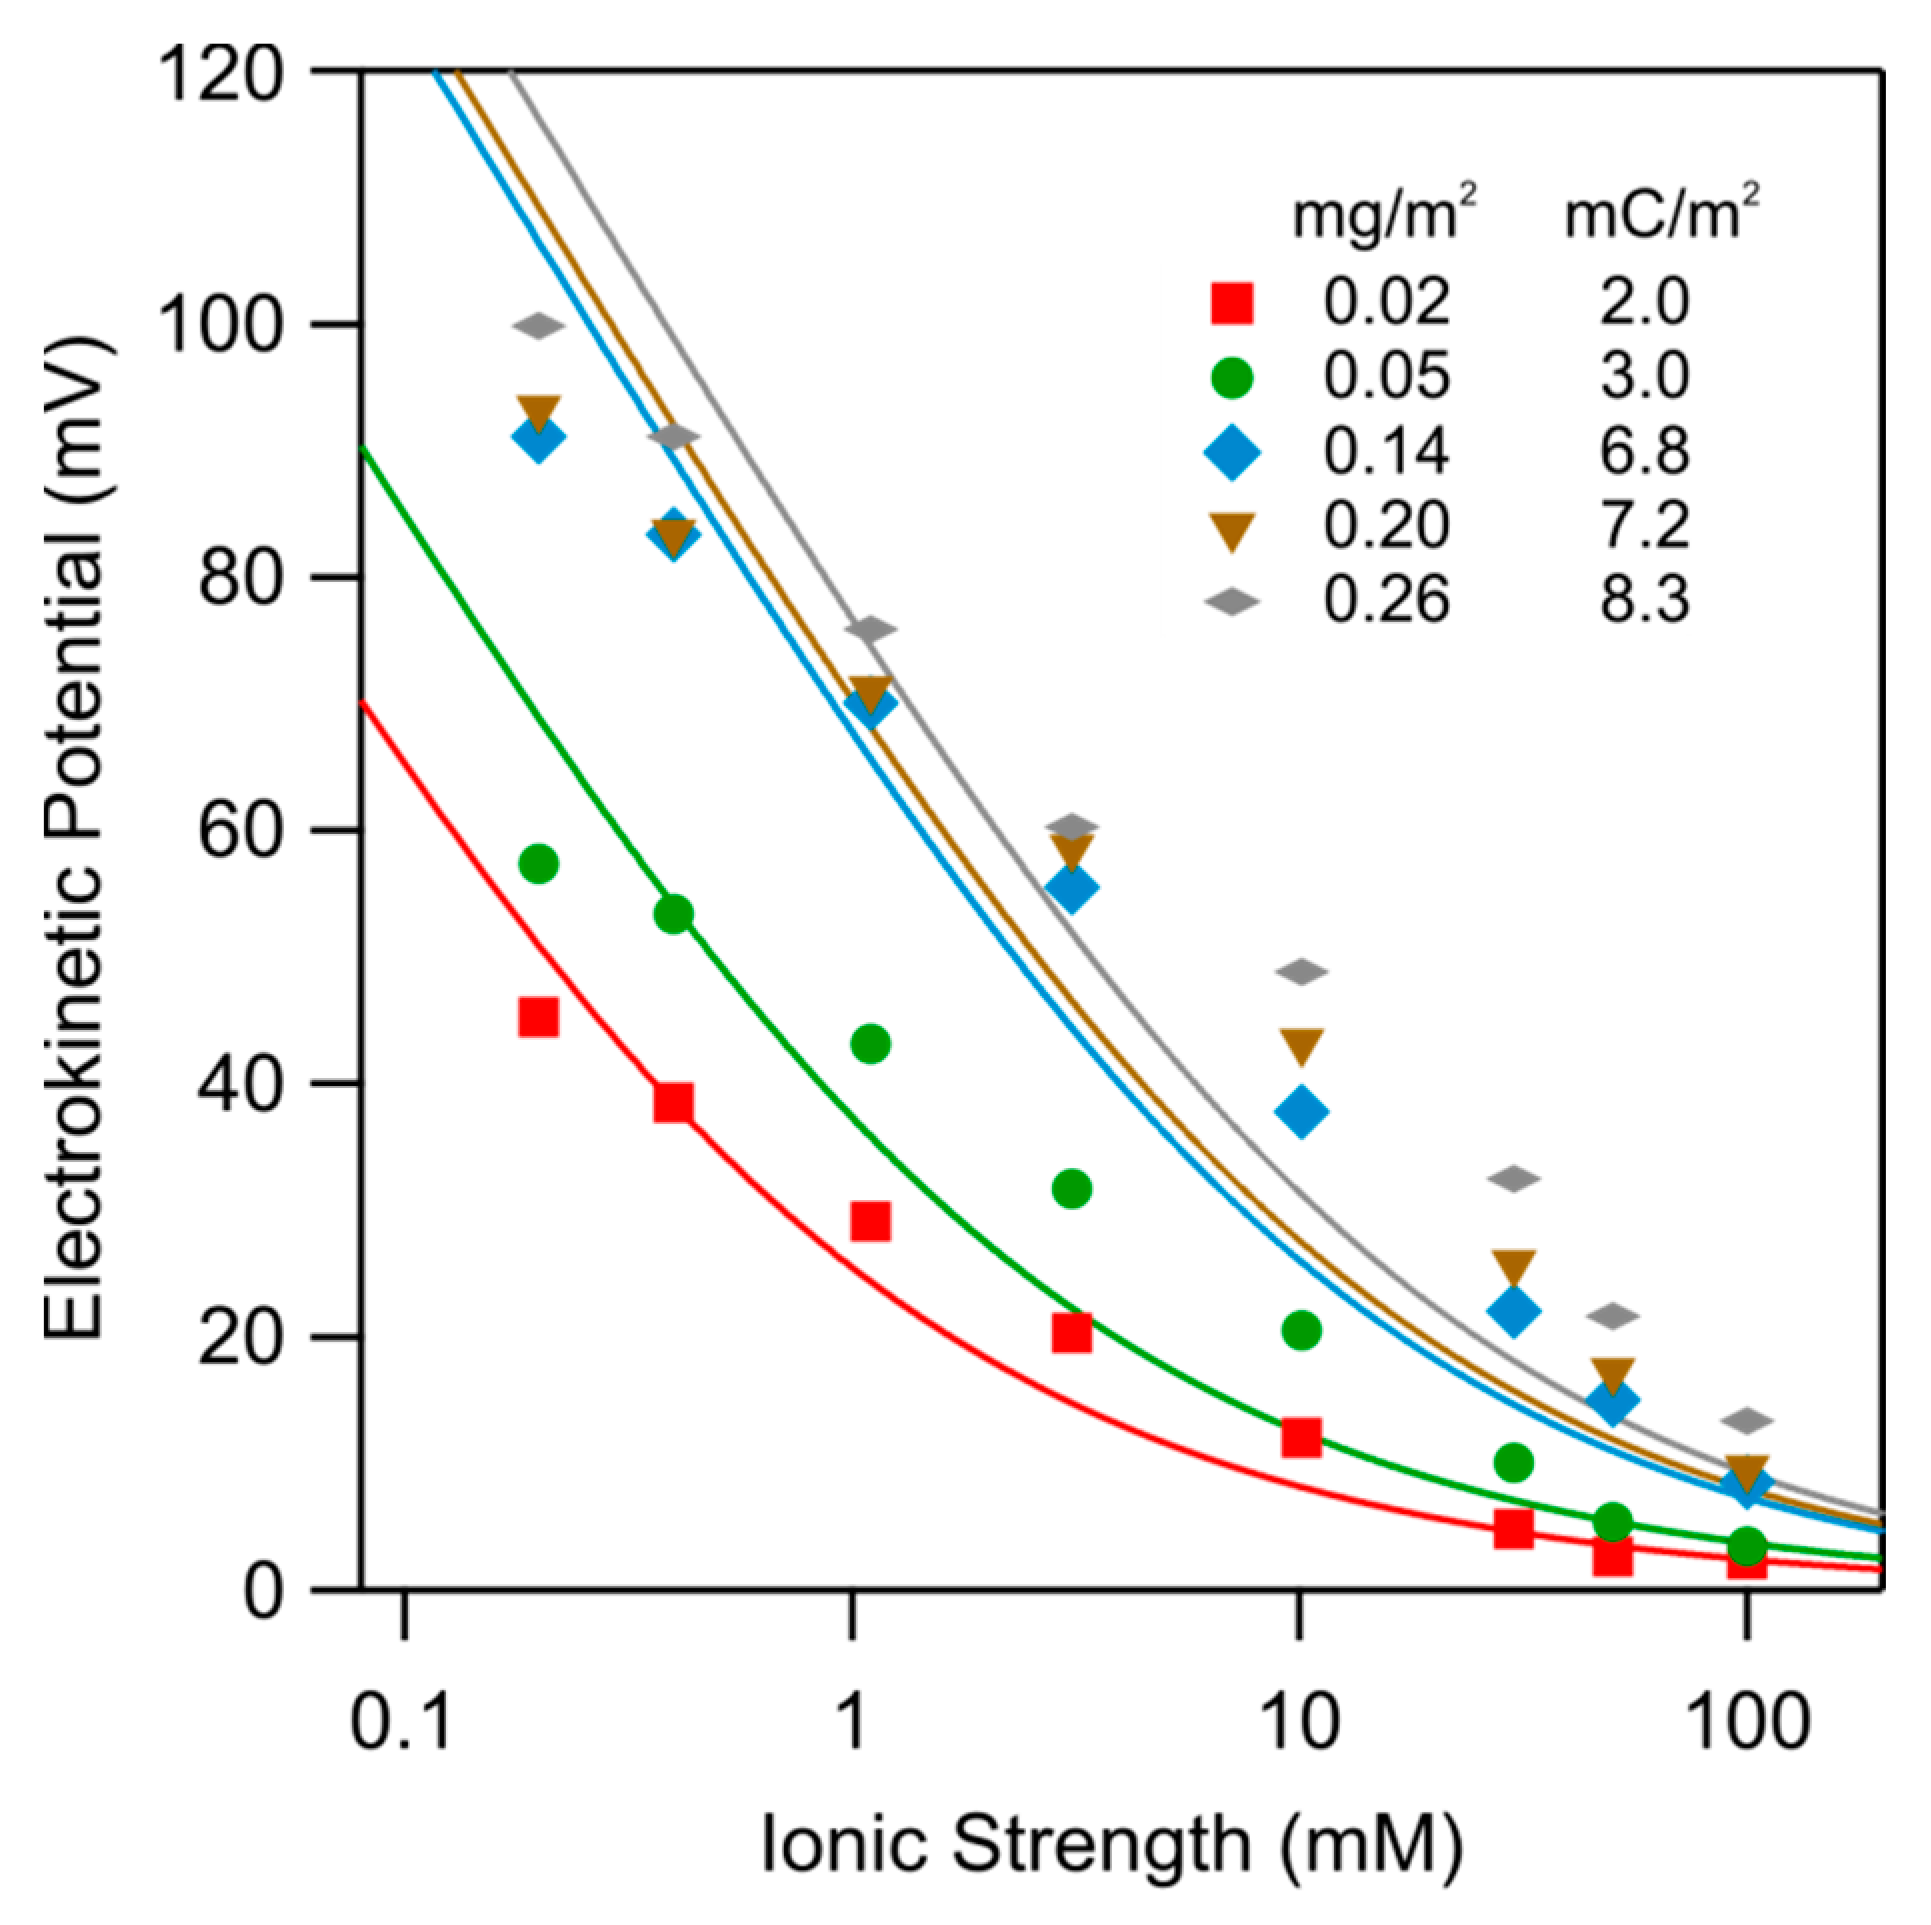
Figure 7 shows the dependence of the electrokinetic potential on the ionic strength for the functionalized substrates with different amounts of adsorbed PDADMAC at pH 4.0. One observes that the electrokinetic potential increases with decreasing ionic strength and with increasing adsorbed amount. These trends can be well explained with the Grahame Equation (1). The best fits are shown as solid lines, whereby the corresponding surface charge densities are given in the figure. As one expects, the charge density increases with increasing adsorbed amount. One observes that the data can be interpreted semi-quantitatively in this fashion, but some deviations remain.
3.3. Initial Deposition of Nanoparticles
The deposition of the nanoparticles was studied on the PDADMAC-functionalized silica surface with optical reflectivity. Most studies were carried out with the in situ functionalized substrates, meaning that the functionalized substrate was prepared in the reflectometer just prior to the deposition of the nanoparticles. For the studies with ex situ functionalized substrates, the functionalization was carried out by dip coating, and the functionalized substrate was mounted in the optical reflectivity cell in the wet state.
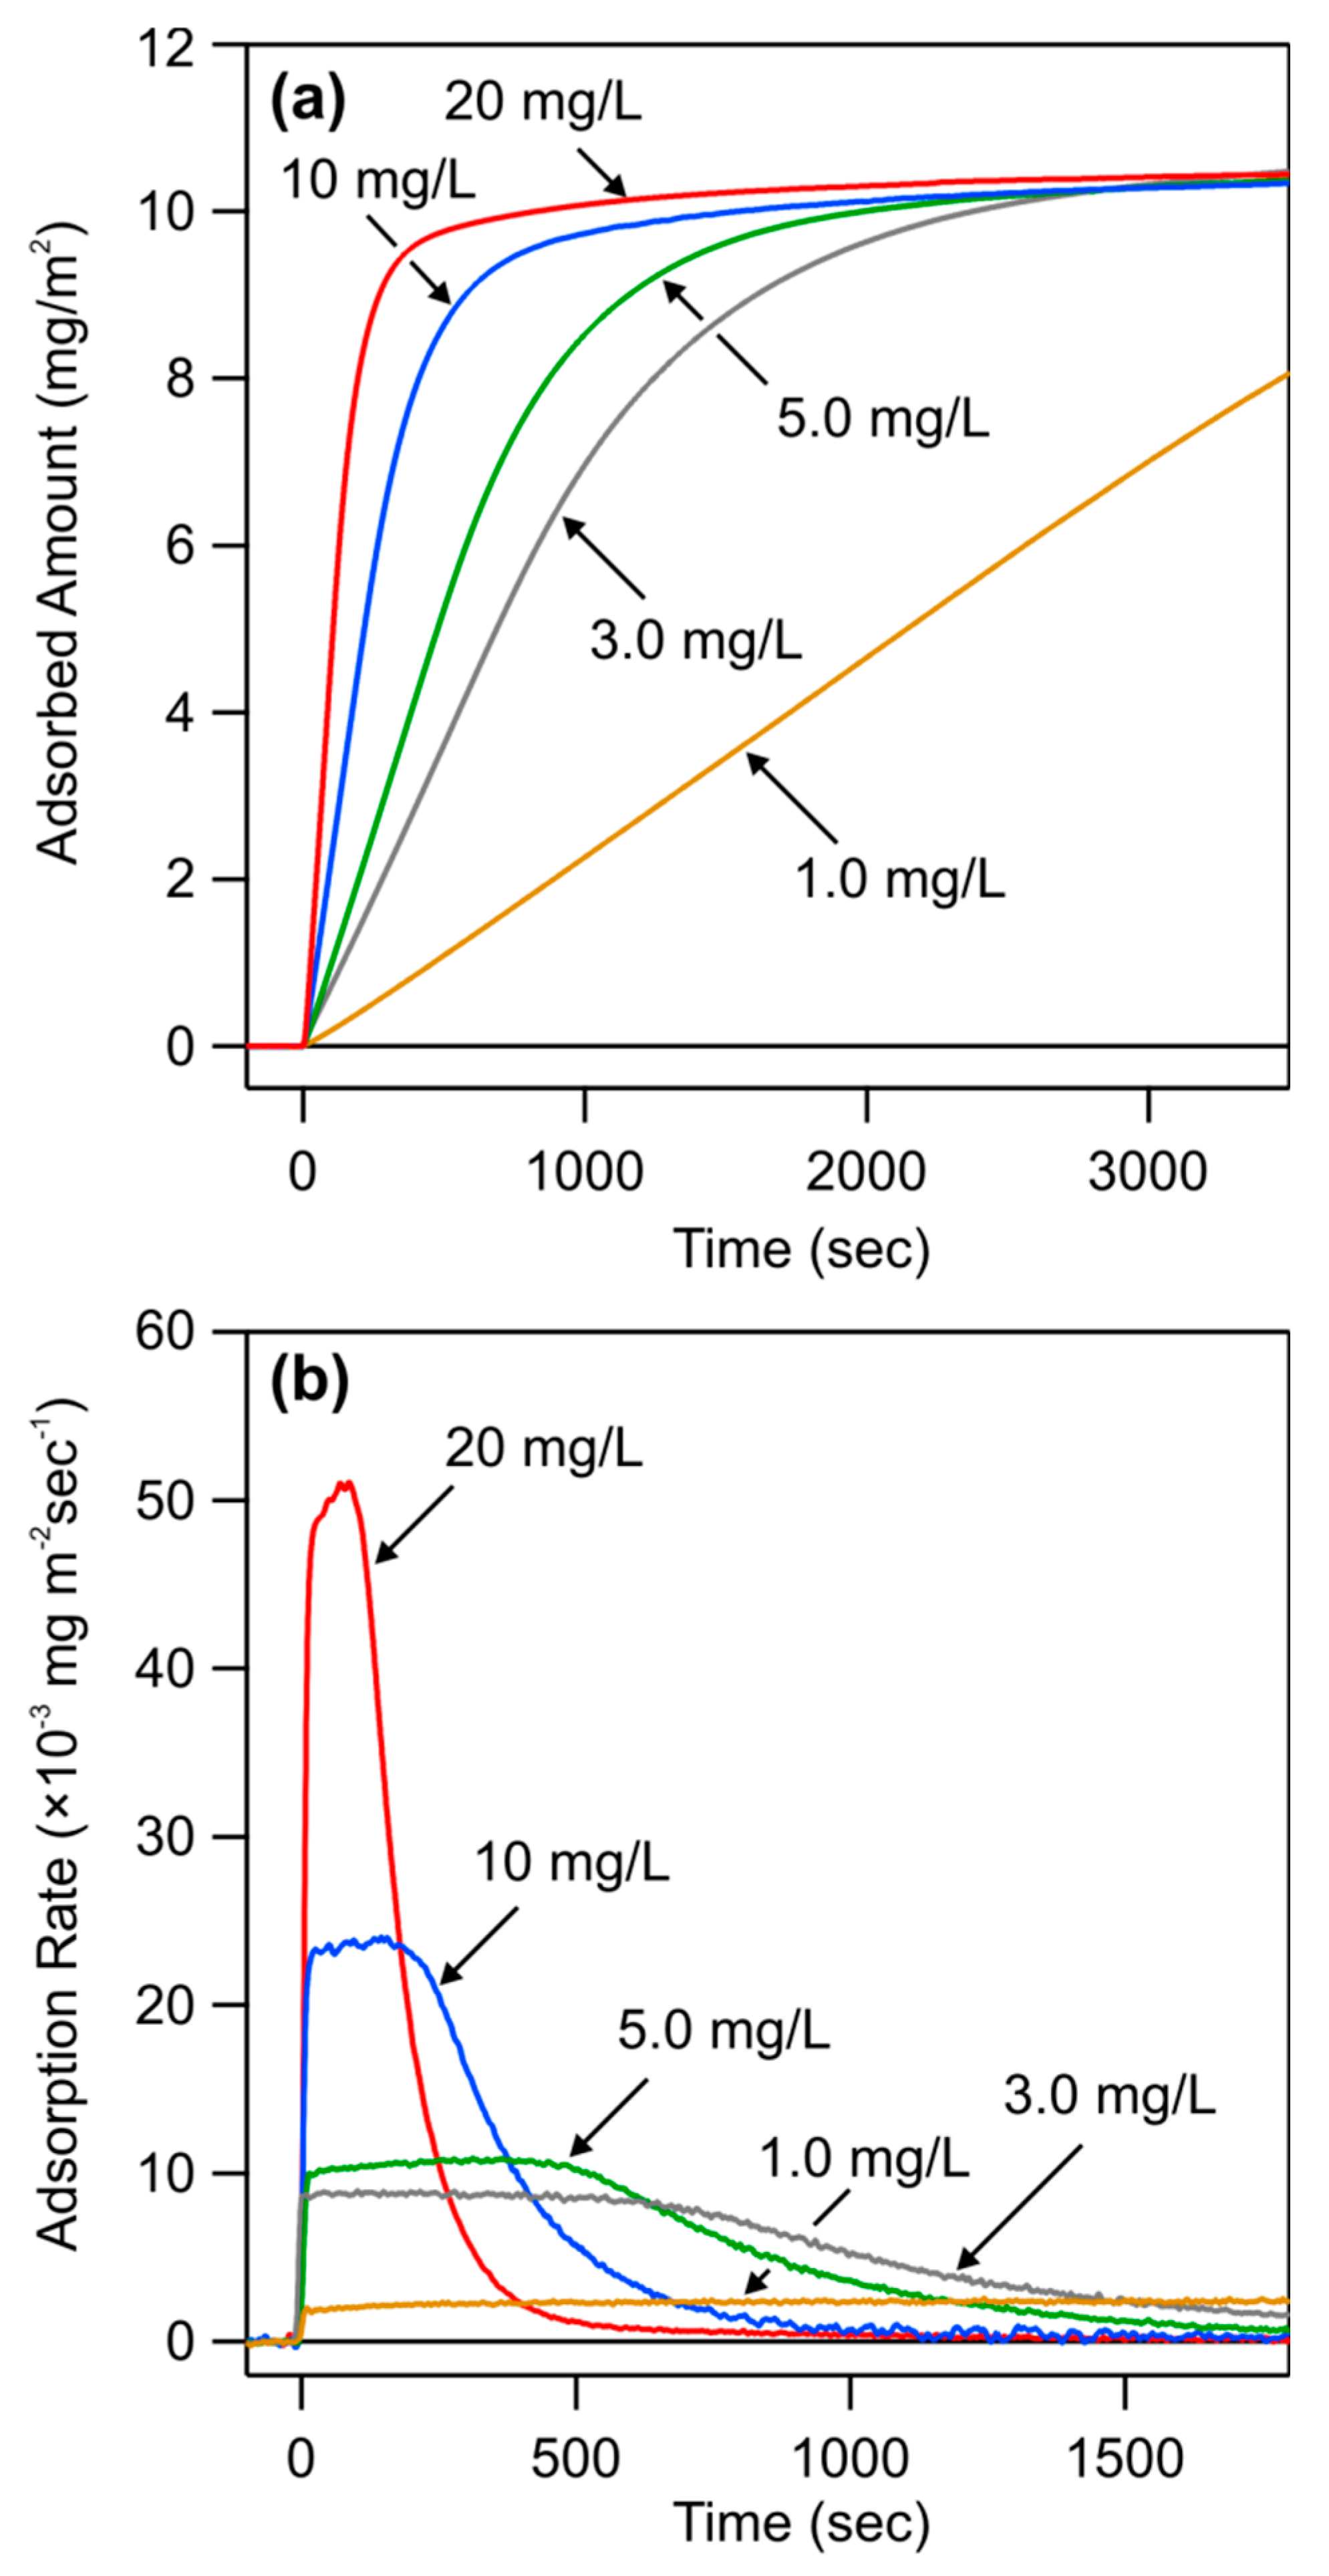
The substrate was first rinsed with an electrolyte solution of pH 4.0. Subsequently, the particle suspension in the same electrolyte solution was injected (). The outcome of such experiments is shown in Figure 8a. One first observes that the deposited amount increases linearly with time t. This increase is then followed by a saturation plateau. The different traces correspond to different particle concentrations. With increasing particle concentration, the saturation plateau is reached increasingly more rapidly. A representative AFM image of the deposited nanoparticles is shown in Figure 1c. From this image, one can appreciate the substantial polydispersity of the nanoparticles used. However, this polydispersity is unimportant for the results presented here. In this Section 3.3, the initial deposition rate will be analyzed, while Section 3.4 focuses on the saturation plateau.
To demonstrate that the initial increase is linear indeed, the time-derivative of the deposited amount was plotted in Figure 8b. When the deposited amount increases linearly, the derivative will show a plateau. Such plateaus can be clearly identified for lower particle concentrations, and from the respective values, the initial deposition rate can be determined accurately. At higher particle concentrations, this plateau no longer develops clearly. In that case, the necessary time to reach the adsorption plateau becomes comparable to the dead-time of the cell, whereby reliable values of initial adsorption rates cannot be determined.
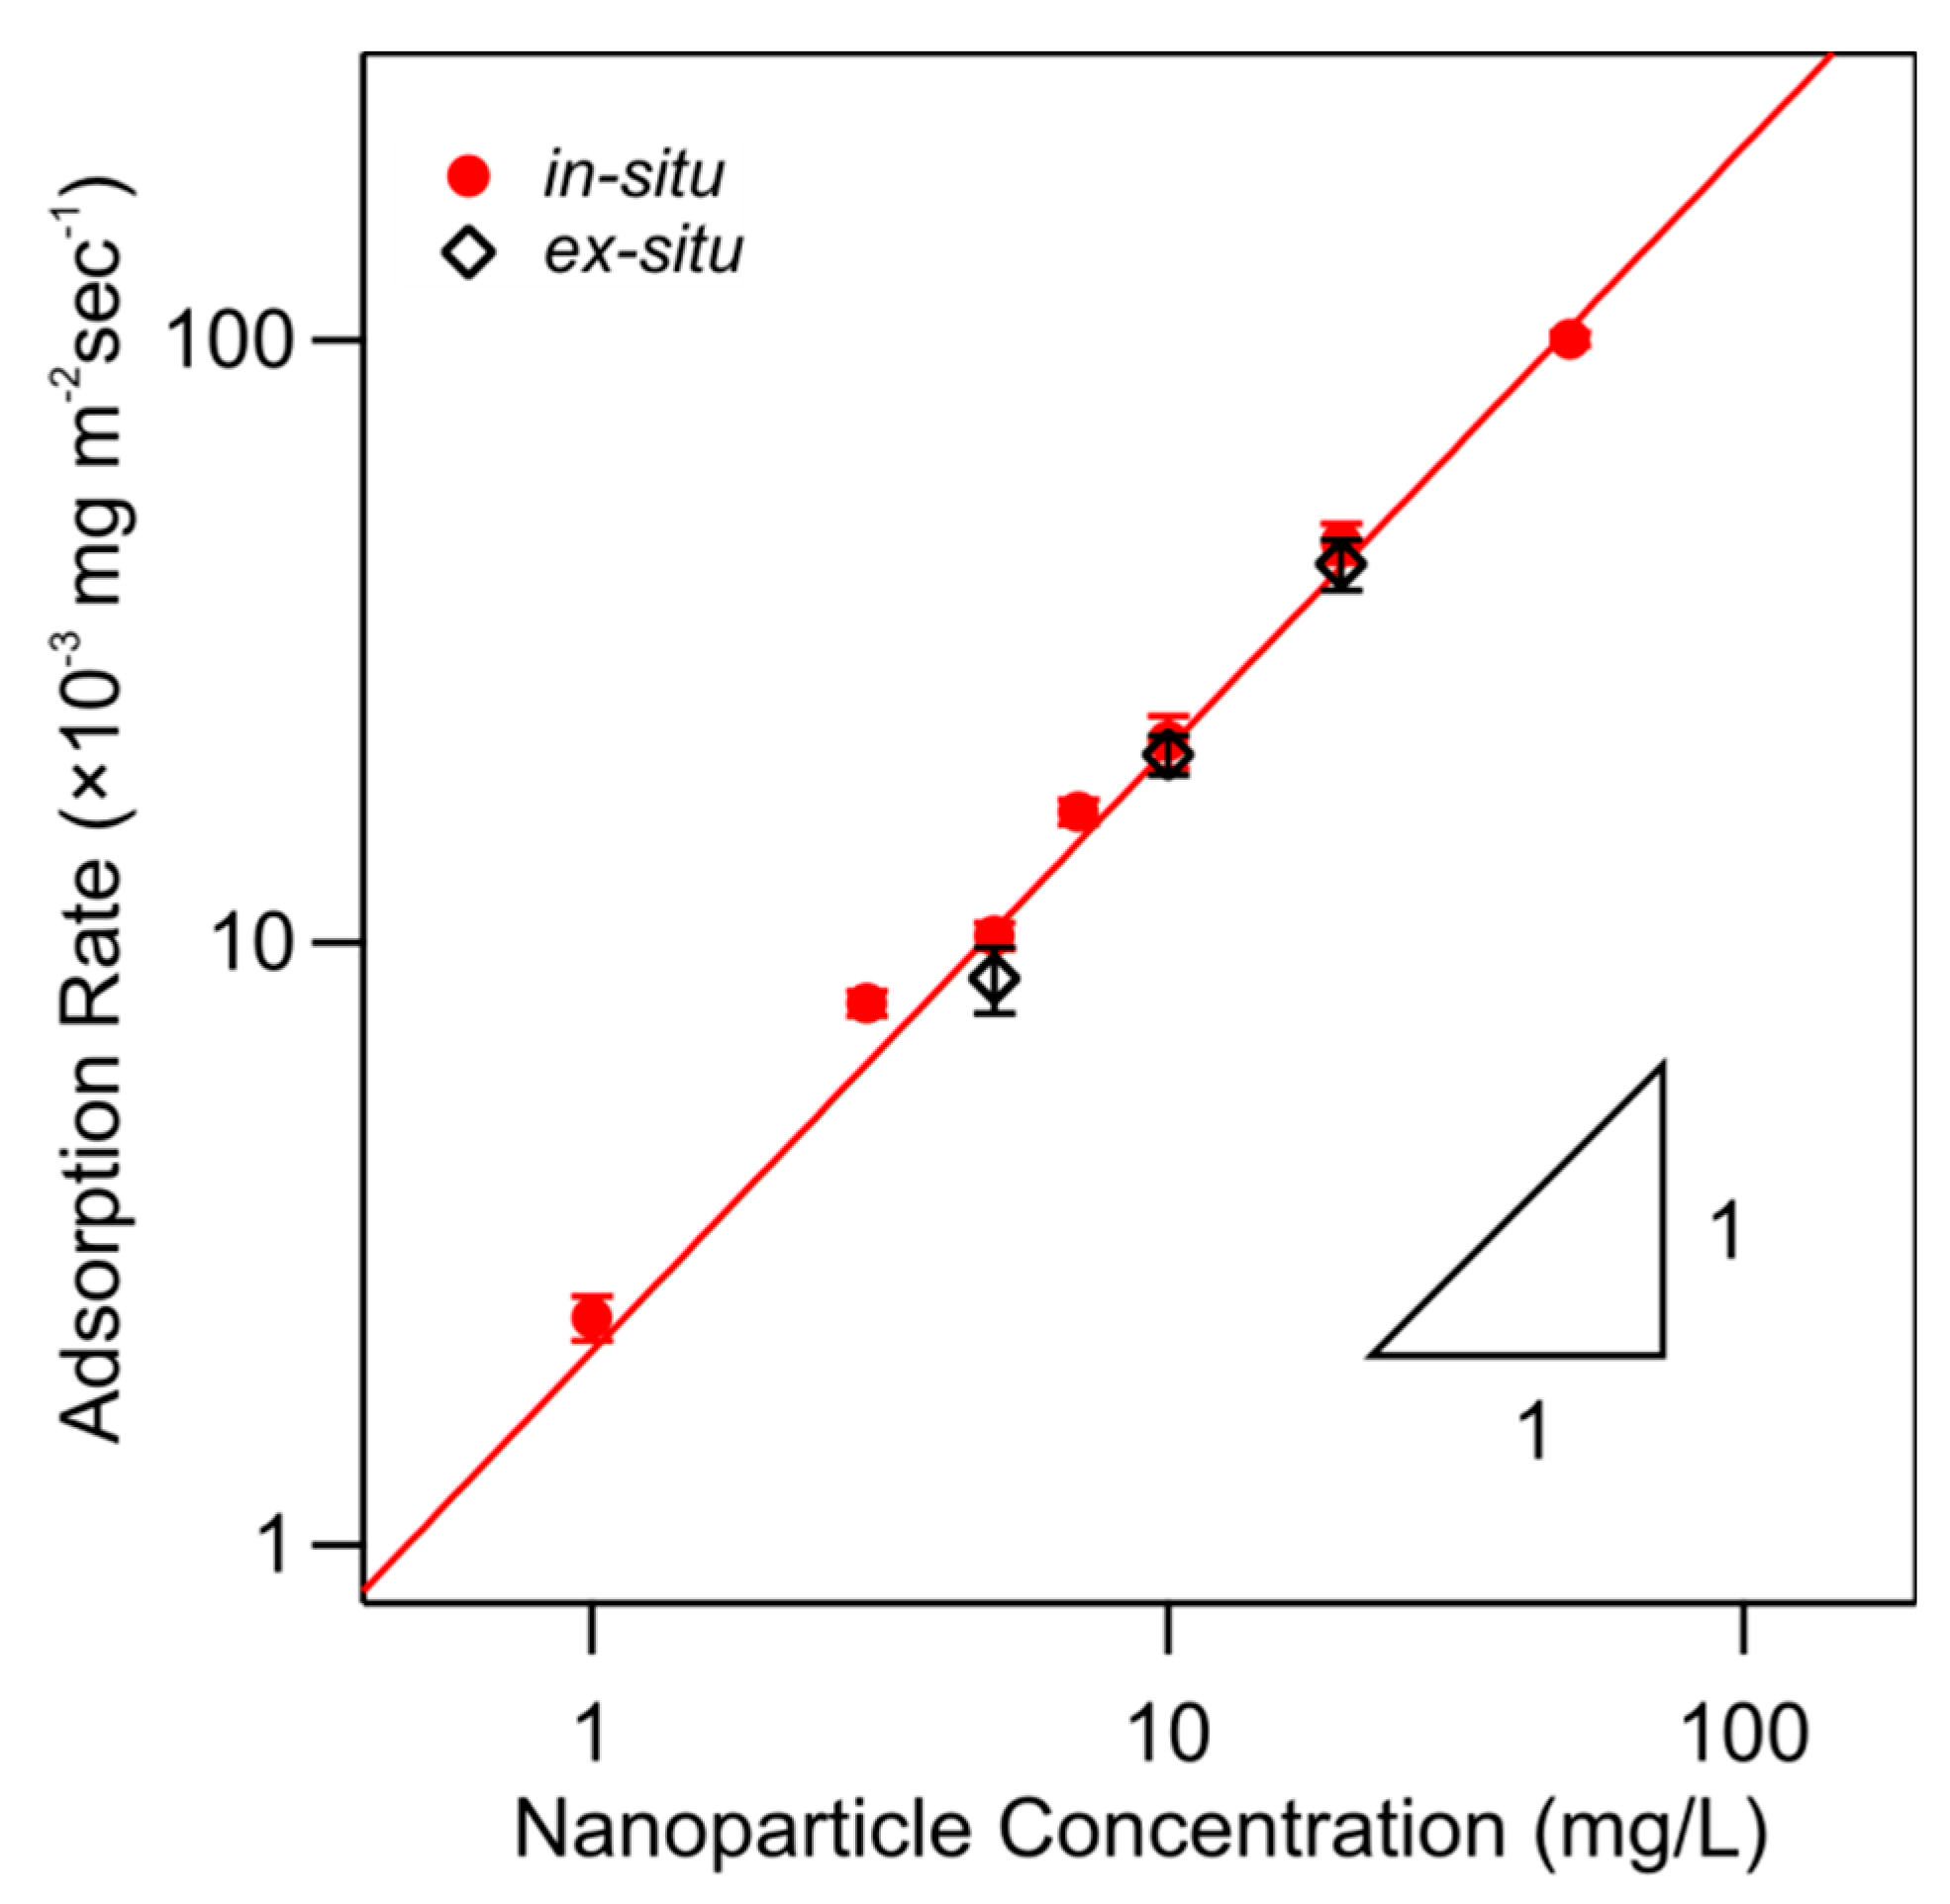
The initial deposition rate increases with increasing particle concentration. This dependence is shown in Figure 9. One observes that the initial deposition rate is simply proportional to the particle concentration, thus suggesting a first-order rate process [39,40,41]
where is the deposition rate coefficient and is the particle concentration. By fitting the experimental data as shown in Figure 9, one obtains the respective deposition rate coefficient (2.1 ± 0.1) × 10−6 m/s. Figure 9 further compares data obtained for in situ and ex situ PDADMAC-functionalized substrates, and one observes that they are identical within experimental error.
To obtain further insight into the values of such deposition rate coefficients, they can be compared with the theoretical value for perfect sink conditions in the stagnation point flow cell [39,41],
where 0.5 mm is the radius of the bore hole of the cell, 1.0 × 10⁻⁶ m2/s is the kinematic viscosity of water, D the diffusion coefficient of the nanoparticles, and the Reynolds number. The mean flow velocity u follows from the volumetric flow rate, which is given by and is 1.0 mL/min in the present experiments. The flow parameter is known for the impinging flow geometry [39,41]. In the present case, we have 12 and 1.7, and thus 6.8. The variable h = 0.85 mm denotes the thickness of the horizontal gap of the cell. The diffusion coefficient is measured by dynamic light scattering and is recalculated from the hydrodynamic radius reported in Section 2.1. For the conditions shown in Figure 9, the theoretical value of the deposition coefficient becomes 3.3 × 10⁻⁶ m/s. This value is indeed quite similar to one that was extracted from the experimental data.
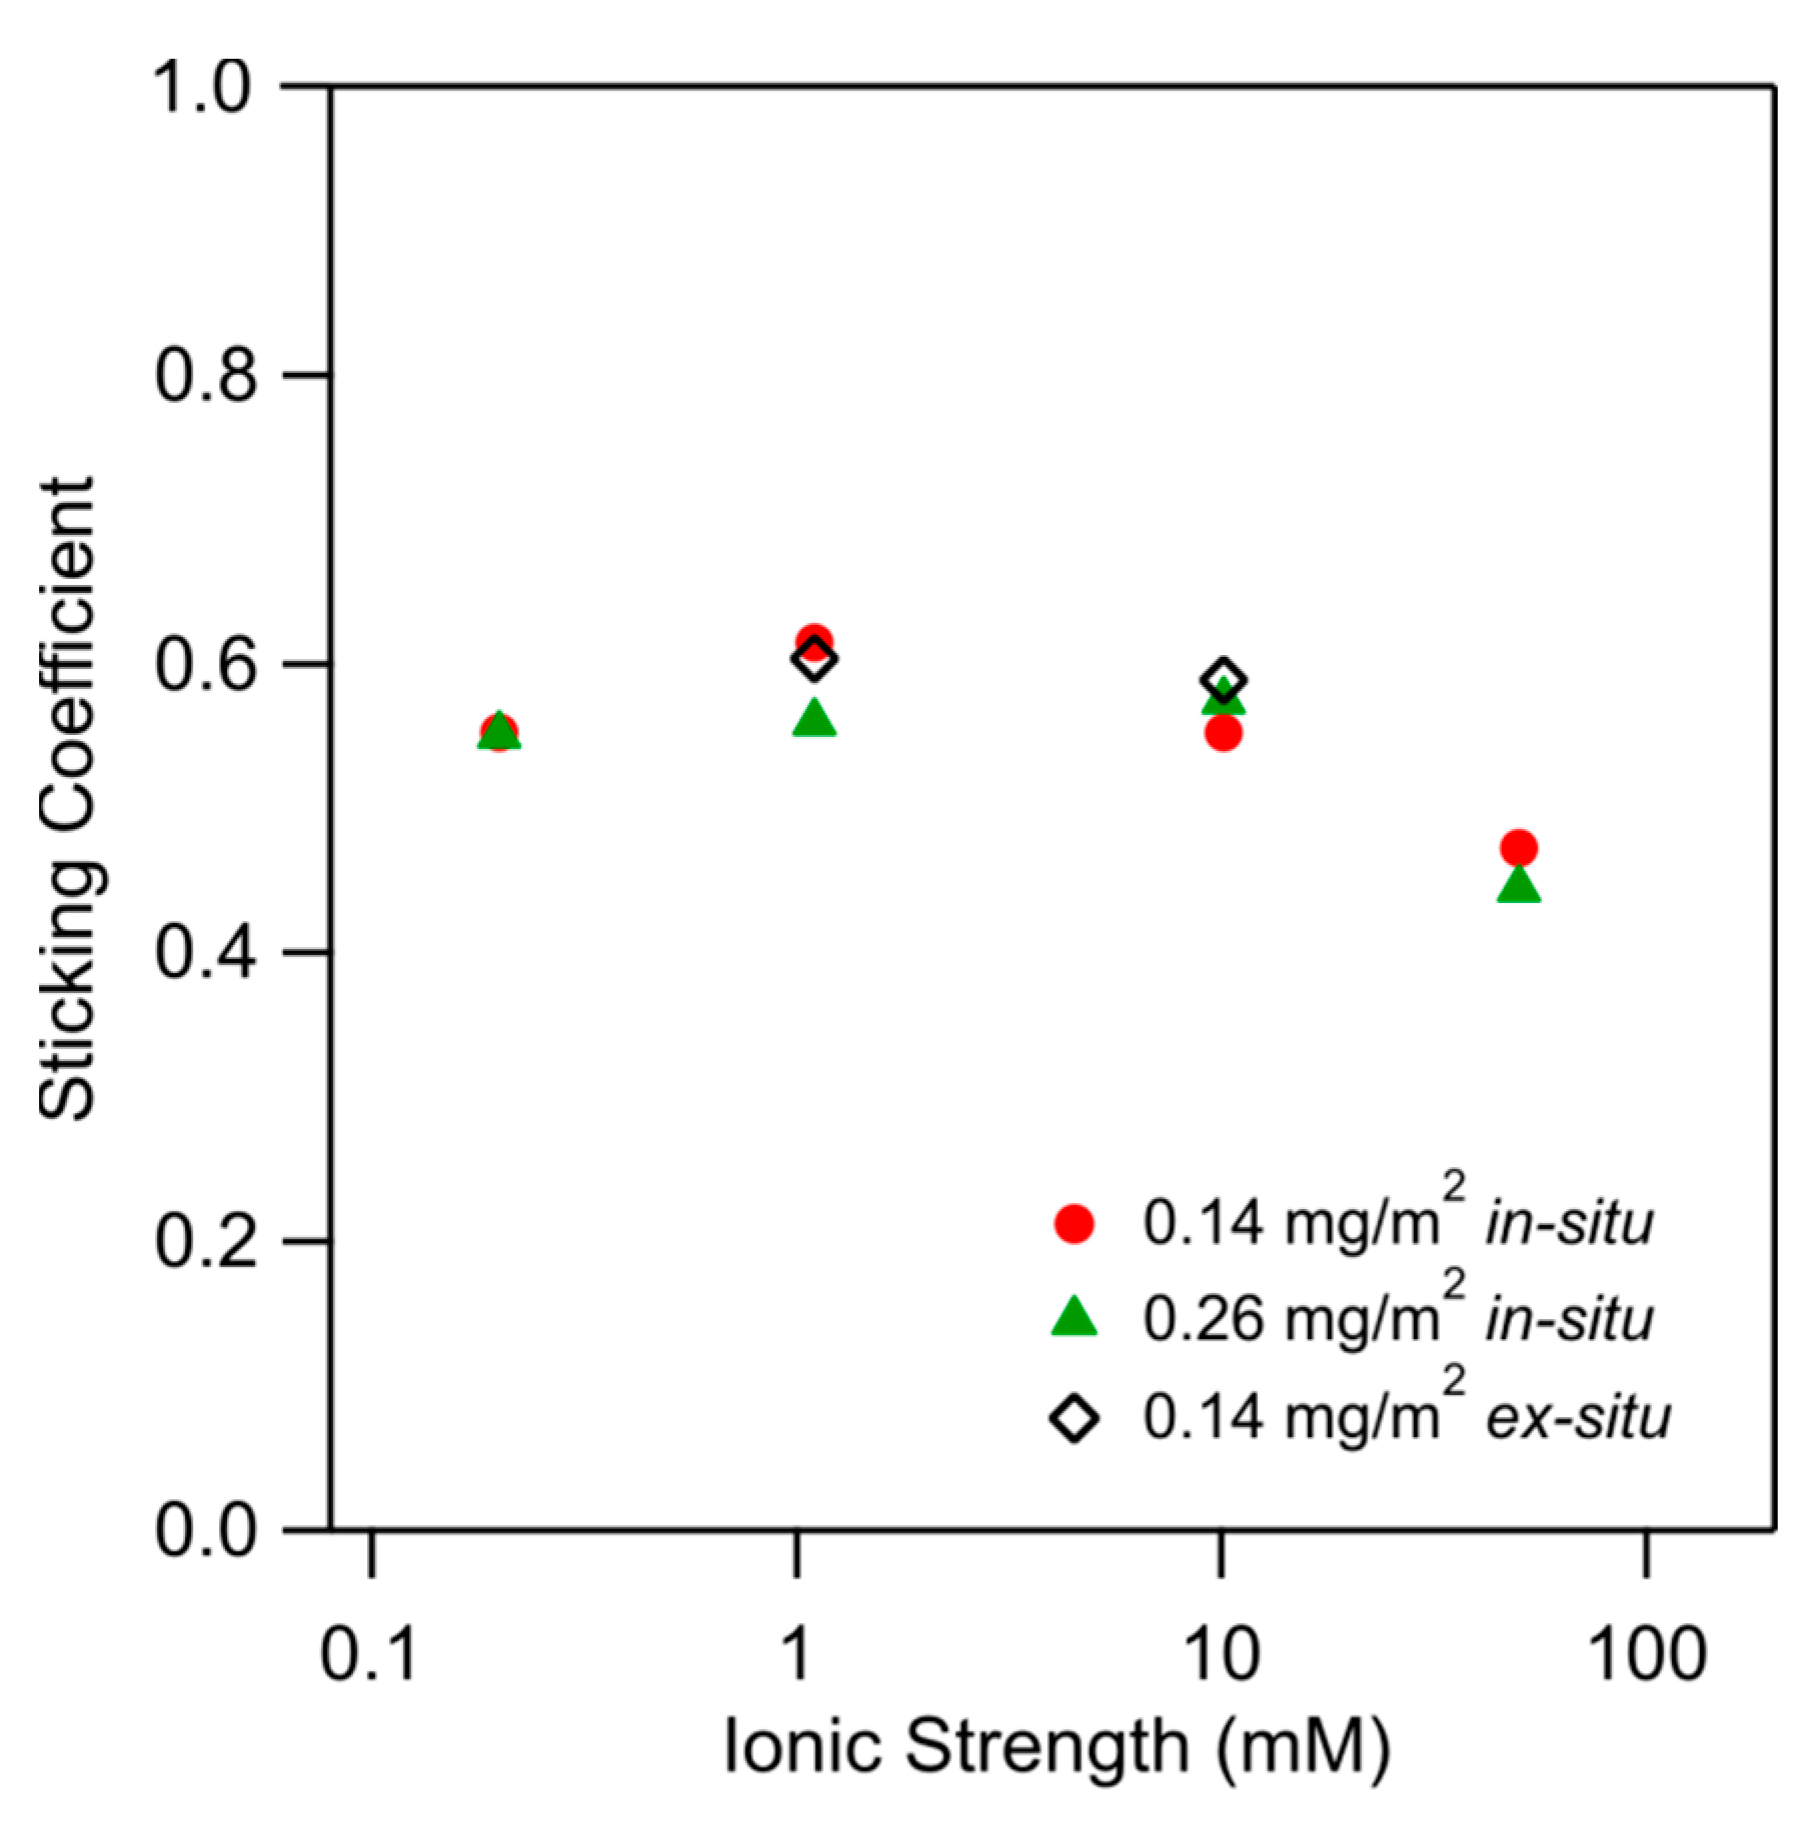
To facilitate this comparison, one may introduce the sticking coefficient defined as [9]
This coefficient is exactly unity, when the deposition process follows the perfect sink condition. This condition means that once a particle arrives in the close vicinity of the surface, it will stick rapidly and irreversibly. Since the deposition may not be immediate, this coefficient is normally below unity.
Figure 10 shows the sticking coefficient versus the ionic strength. The data include three different substrates, namely two different ones obtained by the in situ functionalization, and one obtained by the ex situ functionalization. These values are somewhat below unity, and they have an average of 0.6 ± 0.1. One observes no trends with the ionic strength and the type of substrates. Therefore, the initial deposition is rapid and follows close to perfect sink conditions throughout. The presently reported values are in good agreement with those for the deposition of silica nanoparticles on similarly functionalized substrates [26] and of positively charged nanoparticles to negatively charged substrates [41]. Figure 10 also shows data obtained with the in situ and ex situ PDADMAC-functionalized substrates. Again, one finds that these results are identical within experimental error.
3.4. Saturation Plateau of Nanoparticles
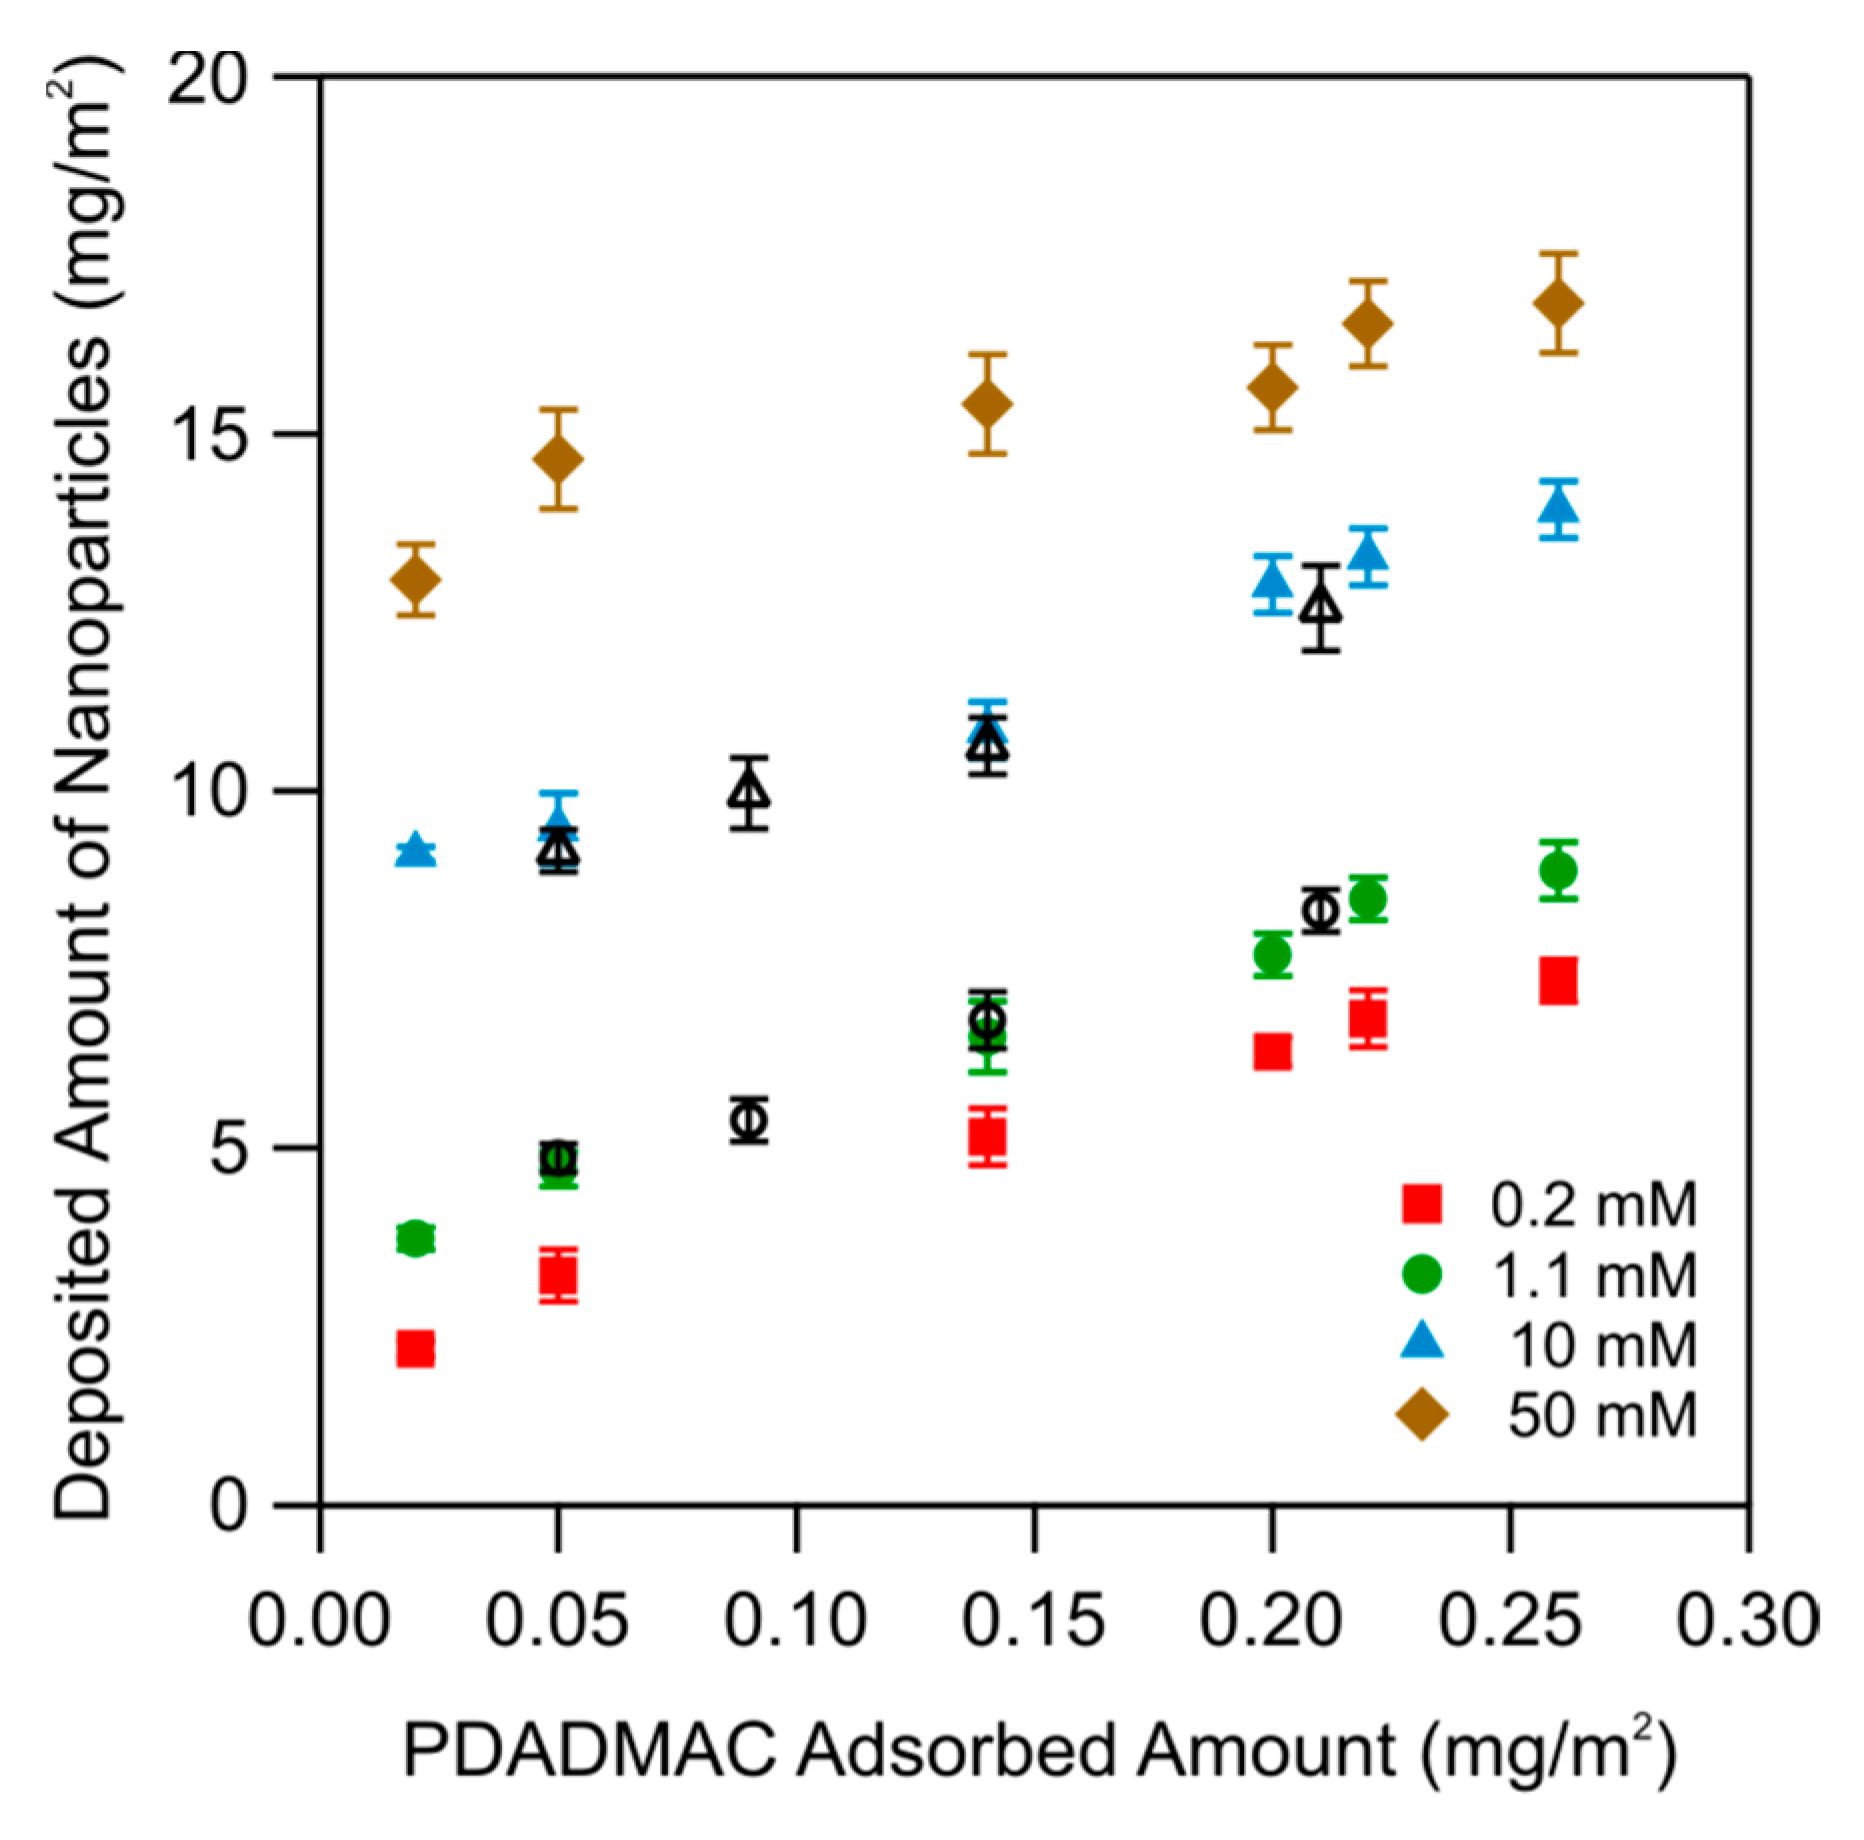
For longer deposition times, the deposited number of nanoparticles on the PDADMAC-functionalized substrates reaches a saturation plateau, see Figure 8a. The value of this maximal deposited amount is independent on the particle concentration, but depends strongly on the ionic strength of the nanoparticle suspension.
The dependence of the plateau value for the nanoparticles on the ionic strength is shown in Figure 11. The data are plotted versus the amount of PDADMAC used to functionalize substrates and for different ionic strengths. One observes that the deposited amount increases with the amount of PDADMAC and with increasing ionic strength. One further observes that the deposited mass is identical for the in situ and ex situ functionalized substrates.
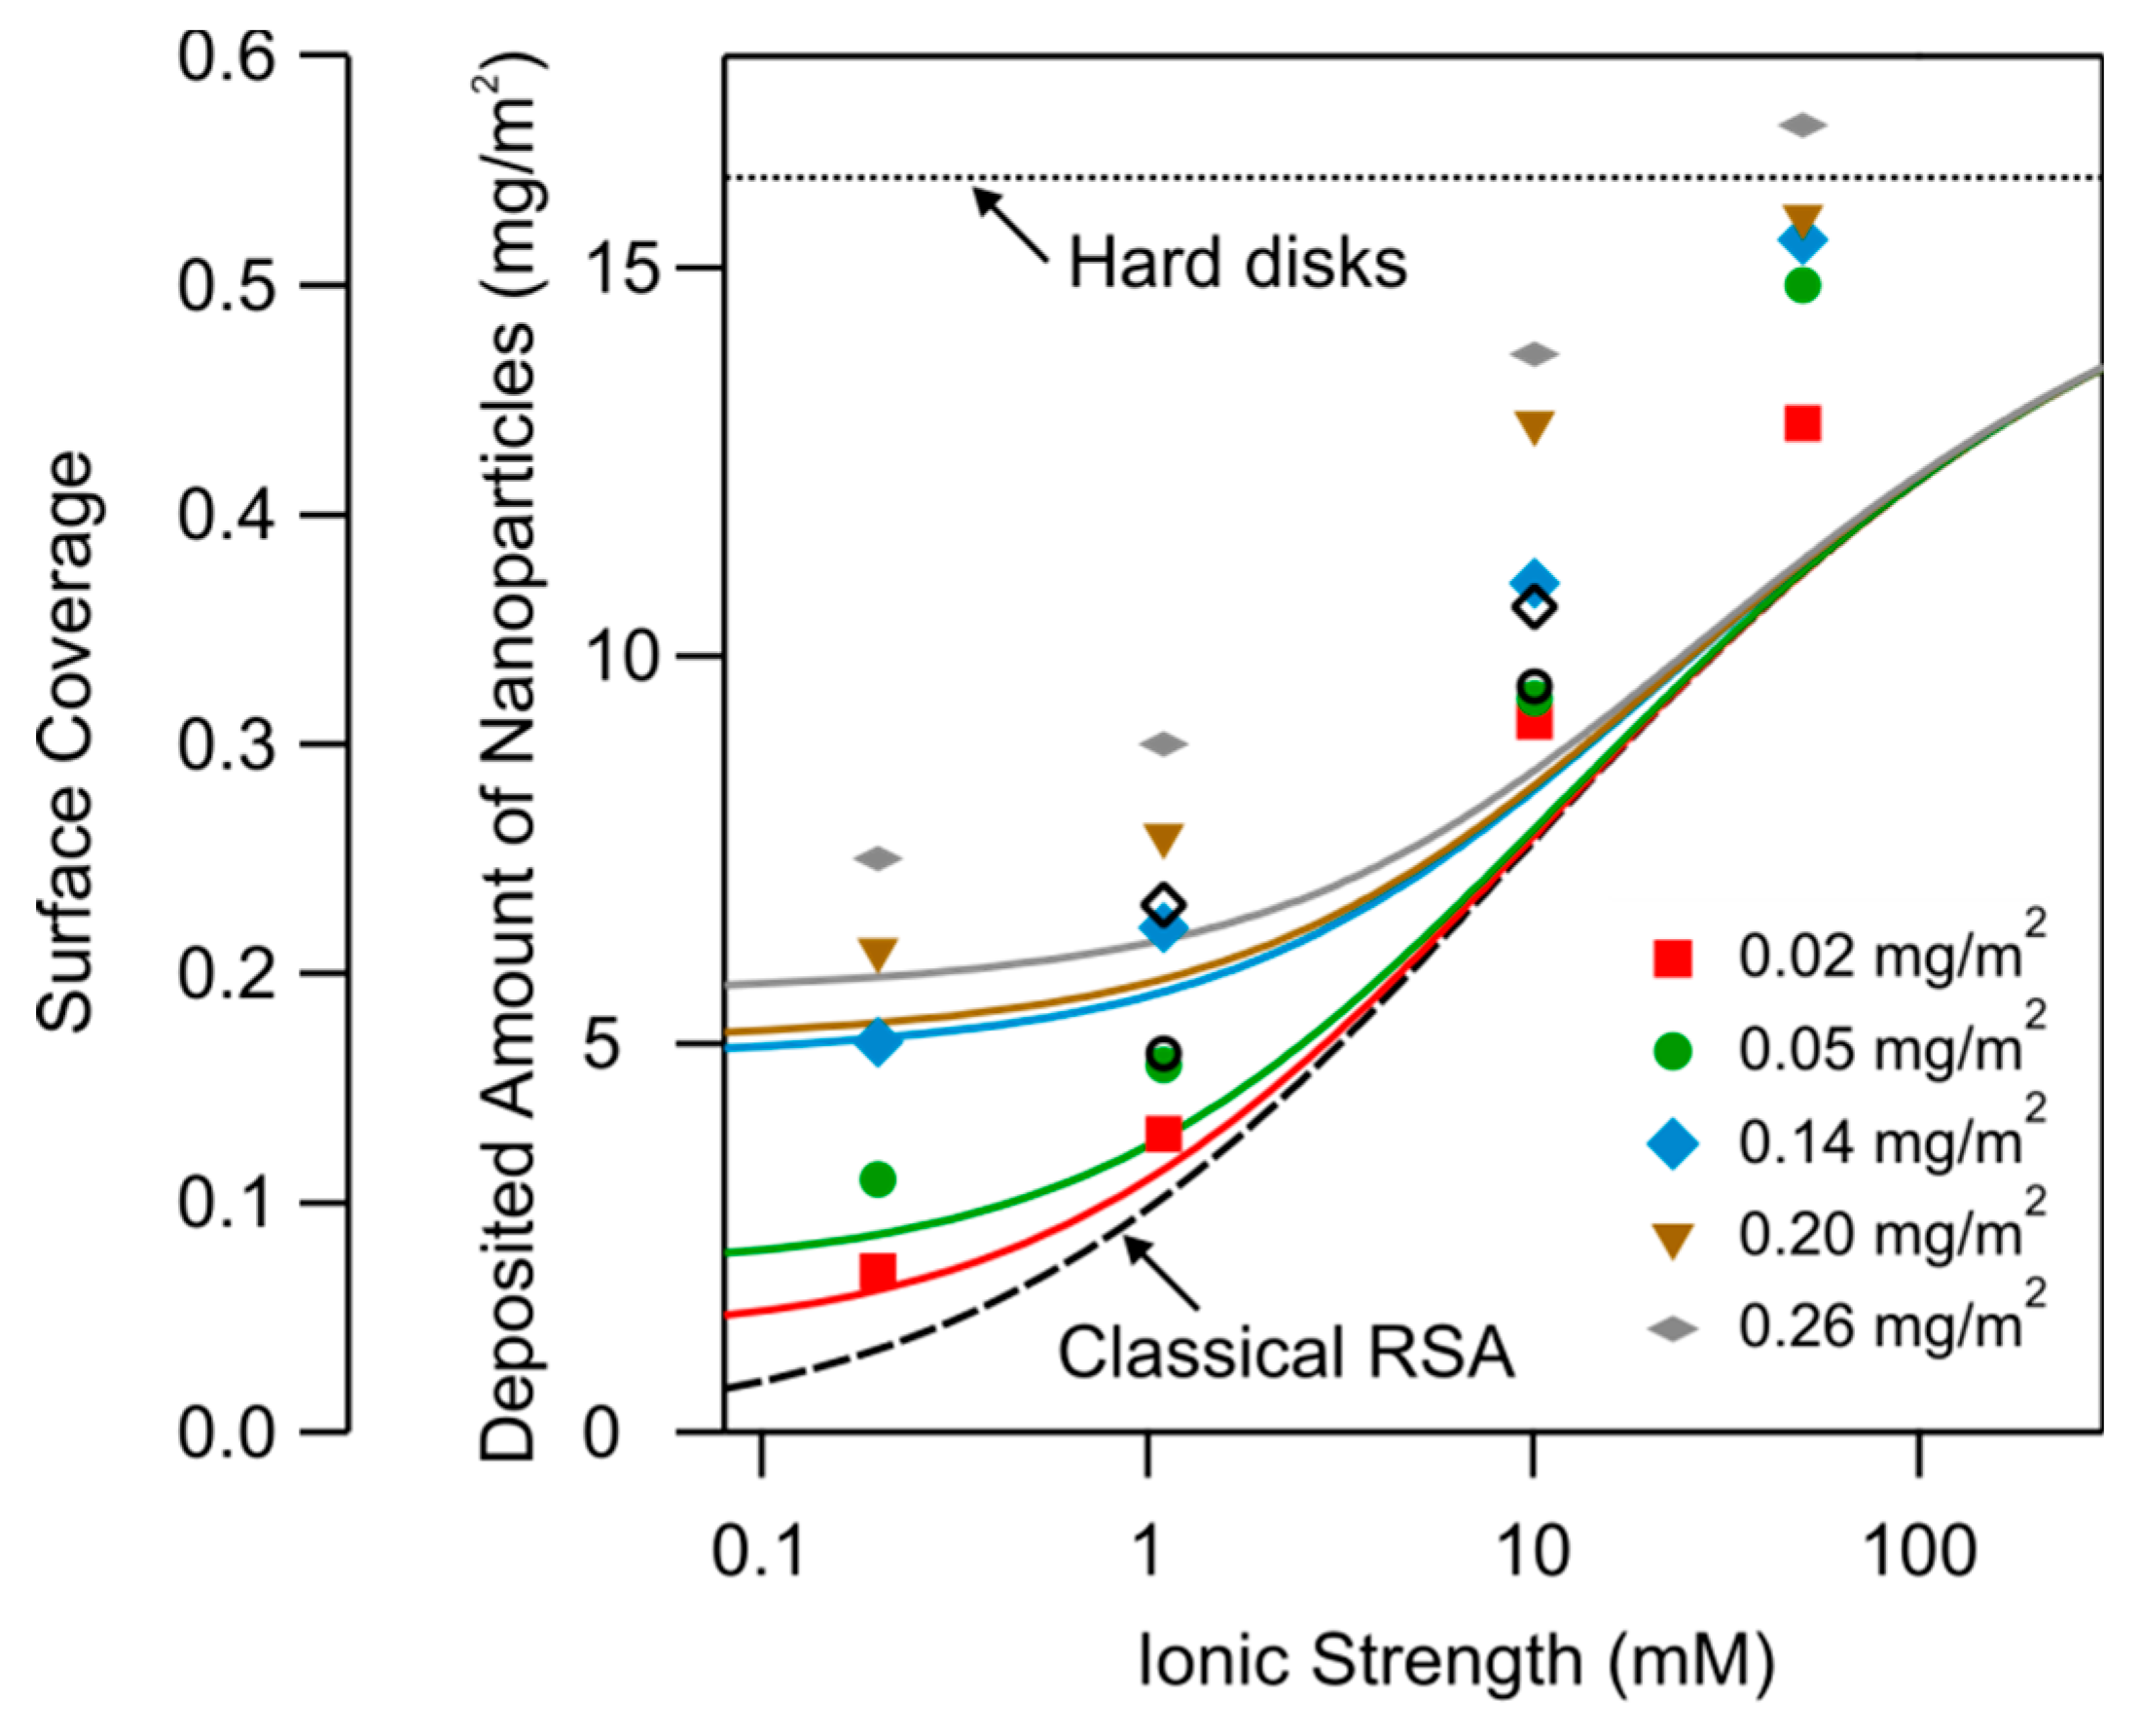
In order to interpret the data on the maximal deposited amount of the deposited nanoparticles, it is advantageous to represent them as a function of the ionic strength. This representation is shown in Figure 12. Again, one finds that the deposited mass for the substrates functionalized in situ and ex situ is identical. One observes that the deposited amount is small at low ionic strength, while it increases with increasing ionic strength. One further observes that the deposited amount increases within an increasing amount of adsorbed PDADMAC, which was used to functionalize the substrate.
The increase of the deposited amount with increasing ionic strength is caused by the screening of the electrostatic repulsion between the depositing particles. At high ionic strength, this interaction will be fully screened, and the particles will pack tightly on the surface as has been discussed in terms of the random sequential adsorption (RSA) model. At lower ionic strength, the thickness of the double-layer layer surrounding the charged particles will become appreciable, and will hinder the particles to approach closely. This effect leads to the decrease of the surface coverage with decreasing ionic strength.
This effect can be quantified in terms of the so-called classical RSA model [42,43,44]. This model considers the surface coverage of equivalent disks, which is related to the deposited amount by the relation
where a is the particle radius and ρ is the particle density. The RSA model assumes that the particle deposited to the surface in a random fashion, leading to the so-called jamming. The limiting coverage is 0.547 of this jammed state for hard-disks [42,45]. The fractional coverage is also indicated in Figure 12 as well as the value for hard-disks.
To include the effect of double-layer repulsion in an approximate fashion, one may still consider the particles as hard-spheres, but with a larger effective radius . This effective radius also includes the thickness of the double-layer. The resulting surface coverage then becomes [42,43,44]
To calculate the effective radius, one should know the interaction potential energy between two particles. The simplest possible approximation is the screened Coulomb potential, which reads [9,44]:
where r is the center-to-center distance between the particles, Z is their effective charge, and κ−1 is the Debye length given by
When the particles are highly charged, the effective charge saturates at a common value, which can be estimated from Poisson–Boltzmann (PB) theory [9,44]:
In the range of ionic strengths between 0.1 mM and 10 mM, Equation (15) predicts charges of the nanoparticles that are about 25% higher than the ones calculated from electrophoresis. The effective radius is then evaluated by comparing the potential energy with the thermal energy . Comparison with computer simulations has shown that the optimal value of the effective radius should be chosen as [42,46]
The prediction of this classical RSA model is shown Figure 12. Given the fact that this model contains no adjustable parameters, the agreement with the experimental data is actually quite good, especially for the substrates that were functionalized with the small amounts of PDADMAC.
The weakness of the classical RSA model discussed above is that the influence of the substrate has been neglected. One observes that the agreement with the classical RSA model is worst, when the surface has been functionalized with large amounts of PDAMAC, meaning that the surface is highly charged. One may therefore suspect that the charge density of the substrate plays an additional role. Indeed, a highly charged substrate will accumulate larger concentrations of counter-ions in its vicinity, and thus induce more effective screening. This effect can be quantified with the modified screened Coulomb potential [44]
where the parameter is given by [44,47]
The electrokinetic potential of the substrate has been measured at pH 4.0 for the different ionic strengths and the different amounts of PDADMAC that were used to functionalize the substrates, see Figure 7. The respective ionic strength dependence can be approximated with the Grahame relation, Equation (1). This relation is also used to evaluate Equation (18). Since this modification affects the interaction between the two particles by the presence of a third body, namely the substrate, we refer to this approach as the three-body RSA model. The predictions of this model are shown as full lines in Figure 12. Again, this model contains no adjustable parameters, and it is capable to predict the observed trends reasonably well. However, at higher coverage and especially at higher ionic strengths, the experimentally observed coverage exceeds the predicted ones substantially. We suspect that these deviations are caused by the polydispersity of particles used, since some smaller particles may deposit in between larger particles. Another reason for these deviations, especially at higher ionic strengths, might be that the particles start to form a multilayer.
All these experiments show that the substrates functionalized in situ and ex situ have the same particle deposition characteristics within experimental error. This observation confirms that these two types of substrates can be considered as identical.
4. Conclusions
The present study demonstrates that by adsorption of a cationic polyelectrolyte to a negatively charged substrate, one can easily obtain stable, positively charged substrates. By tuning the salt level during the adsorption process, one can systematically modify the adsorbed amount and thus the surface charge density. We demonstrate the feasibility of this approach by functionalizing silica with PDADMAC. Such substrates have been further used to study deposition negatively charged latex nanoparticles. The deposition process is initially rapid, and later leads to a saturated monolayer. The dependence of the resulting coverage with the ionic strength and the amount of adsorbed PDADMAC, which was used to functionalize the substrate, can be well rationalized with the three-body RSA model.
Such PDADMAC-functionalized substrates were prepared in two different ways, namely with an in situ and ex situ technique, and various measurements clearly indicate that these two substrates behave in an identical fashion. These substrates behave similarly to simple oxide surfaces, and therefore provide an interesting means to fabricate positively charged substrates of different charge densities in a reproducible fashion.
Author Contributions
Conceptualization, D.K. and M.B.; methodology, D.K. and P.M.; software, P.M.; validation, D.K. and P.M.; resources, M.B.; data curation, D.K. and P.M.; writing—original draft preparation, D.K., P.M., and M.B.; writing—review and editing, D.K., P.M., and M.B.; visualization, D.K., P.M., and M.B.; supervision, M.B.; funding acquisition, M.B. All authors have read and agreed to the published version of the manuscript.
Funding
This research was funded by the Swiss National Science Foundation through the project no. 178759 and the University of Geneva.
Data Availability Statement
Not applicable.
Conflicts of Interest
The authors declare no conflict of interest.
References
- Szilagyi, I.; Trefalt, G.; Tiraferri, A.; Borkovec, M. Polyelectrolyte adsorption, interparticle forces, and colloidal aggregation. Soft Matter 2014, 10, 2479–2502. [Google Scholar] [CrossRef] [PubMed] [Green Version]
- Morga, M.; Adamczyk, Z. Monolayers of cationic polyelectrolytes on mica: Electrokinetic studies. J. Colloid Interface Sci. 2013, 407, 196–204. [Google Scholar] [CrossRef] [PubMed]
- Shafir, A.; Andelman, D. Polyelectrolyte adsorption: Chemical and electrostatic interactions. Phys. Rev. E 2004, 70, 061804. [Google Scholar] [CrossRef] [PubMed] [Green Version]
- Dobrynin, A.V.; Rubinstein, M. Theory of polyelectrolytes in solutions and at surfaces. Prog. Polym. Sci. 2005, 30, 1049–1118. [Google Scholar] [CrossRef]
- Adamczyk, Z.; Michna, A.; Szaraniec, M.; Bratek, A.; Barbasz, J. Characterization of poly(ethylene imine) layers on mica by the streaming potential and particle deposition methods. J. Colloid Interface Sci. 2007, 313, 86–96. [Google Scholar] [CrossRef] [PubMed]
- Jiang, M.; Popa, I.; Maroni, P.; Borkovec, M. Adsorption of poly-L-lysine on silica probed by optical reflectometry. Colloids Surf. A 2010, 360, 20–25. [Google Scholar] [CrossRef]
- Porus, M.; Maroni, P.; Borkovec, M. Structure of adsorbed polyelectrolyte monolayers investigated by combining optical reflectometry and piezoelectric techniques. Langmuir 2012, 28, 5642–5651. [Google Scholar] [CrossRef] [PubMed]
- Kosior, D.; Morga, M.; Maroni, P.; Ciesla, M.; Adamczyk, Z. Formation of poly-L-lysine monolayers on silica: Modeling and experimental studies. J. Phys. Chem. C 2020, 124, 4571–4581. [Google Scholar] [CrossRef]
- Popa, I.; Cahill, B.P.; Maroni, P.; Papastavrou, G.; Borkovec, M. Thin adsorbed films of a strong cationic polyelectrolyte on silica substrates. J. Colloid Interface Sci. 2007, 309, 28–35. [Google Scholar] [CrossRef]
- Decher, G. Fuzzy nanoassemblies: Toward layered polymeric multicomposites. Science 1997, 277, 1232–1237. [Google Scholar] [CrossRef]
- Decher, G.; Schlenoff, J.B. Multilayer Thin Films; Wiley-VCH: Hoboken, NJ, USA, 2002. [Google Scholar]
- Van Tassel, P.R. Polyelectrolyte adsorption and layer-by-layer assembly: Electrochemical control. Curr. Opin. Colloid Interface Sci. 2012, 17, 106–113. [Google Scholar] [CrossRef]
- Kubiak, K.; Adamczyk, Z.; Ocwieja, M. Kinetics of silver nanoparticle deposition at PAH mono layers: Reference QCM results. Langmuir 2015, 31, 2988–2996. [Google Scholar] [CrossRef] [PubMed]
- Michna, A.; Adamczyk, Z.; Ocwieja, M.; Bielanska, E. Kinetics of silver nanoparticle deposition onto poly(ethylene imine) modified mica determined by AFM and SEM measurements. Colloid Surf. A 2011, 377, 261–268. [Google Scholar] [CrossRef]
- Mazurenka, M.; Hamilton, S.M.; Unwin, P.R.; Mackenzie, S.R. In-situ measurement of colloidal gold adsorption on functionalized silica surfaces. J. Phys. Chem. C 2008, 112, 6462–6468. [Google Scholar] [CrossRef]
- Santore, M.M.; Kozlova, N. Micrometer scale adhesion on nanometer-scale patchy surfaces: Adhesion rates, adhesion thresholds, and curvature-based selectivity. Langmuir 2007, 23, 4782–4791. [Google Scholar] [CrossRef] [PubMed]
- Adamczyk, Z.; Bratek, A.; Szelag, E.; Bastrzyk, A.; Michna, A.; Barbasz, J. Colloid particle deposition on heterogeneous surfaces produced by polyelectrolyte adsorption. Colloid Surf. A 2009, 343, 111–117. [Google Scholar] [CrossRef]
- Serizawa, T.; Takeshita, H.; Akashi, M. Electrostatic adsorption of polystyrene nanospheres onto the surface of an ultrathin polymer film prepared by using an alternate adsorption technique. Langmuir 1998, 14, 4088–4094. [Google Scholar] [CrossRef]
- Adamczyk, Z.; Zembala, A.; Michna, A. Polyelectrolyte adsorption layers studied by streaming potential and particle deposition. J. Colloid Interface Sci. 2006, 303, 353–364. [Google Scholar] [CrossRef]
- O’Brien, R.W.; White, L.R. Electrophoretic mobility of a spherical colloidal particle. J. Chem. Soc. Farad. Trans. II 1978, 74, 1607–1626. [Google Scholar] [CrossRef]
- Evans, D.F.; Wennerstrom, H. The Colloidal Domain; John Wiley: New York, NY, USA, 1999. [Google Scholar]
- Azzam, R.M.A.; Bashara, N.M. Ellipsometry and Polarized Light; North Holland: Amsterdam, The Netherlands, 1977. [Google Scholar]
- Schinke, C.; Peest, P.C.; Schmidt, J.; Brendel, R.; Bothe, K.; Vogt, M.R.; Kroger, I.; Winter, S.; Schirmacher, A.; Lim, S.; et al. Uncertainty analysis for the coefficient of band-to-band absorption of crystalline silicon. AIP Adv. 2015, 5, 067168. [Google Scholar] [CrossRef] [Green Version]
- Malitson, I.H. Interspecimen comparison of refractive index of fused silica. J. Optical Soc. Am. 1965, 55, 1205. [Google Scholar] [CrossRef]
- Dijt, J.C.; Cohen Stuart, M.A.; Fleer, G.J. Reflectometry as a tool for adsorption studies. Adv. Colloid Interface Sci. 1994, 50, 79–101. [Google Scholar] [CrossRef]
- Bohmer, M.R.; van der Zeeuw, E.A.; Koper, G.J.M. Kinetics of particle adsorption in stagnation point flow studied by optical reflectometry. J. Colloid Interface Sci. 1998, 197, 242–250. [Google Scholar] [CrossRef]
- Koper, G.J.M. Optical properties of colloidal films. Colloids Surf. A 2000, 165, 39–57. [Google Scholar] [CrossRef]
- Porus, M.; Maroni, P.; Borkovec, M. Highly-sensitive reflectometry setup capable of probing the electrical double layer on silica. Sens. Actuators B 2010, 151, 250–255. [Google Scholar] [CrossRef]
- Werner, C.; Korber, H.; Zimmermann, R.; Dukhin, S.; Jacobasch, H.J. Extended electrokinetic characterization of flat solid surfaces. J. Colloid Interface Sci. 1998, 208, 329–346. [Google Scholar] [CrossRef] [PubMed]
- Werner, C.; Zimmermann, R.; Kratzmüller, T. Streaming potential and streaming current measurements at planar solid/liquid interfaces for simultaneous determination of zeta potential and surface conductivity. Colloids Surf. A 2001, 192, 205–213. [Google Scholar] [CrossRef]
- Donath, E.; Voigt, A. Streaming current and streaming potential on structured surfaces. J. Colloid Interface Sci. 1986, 109, 122–139. [Google Scholar] [CrossRef]
- Roessler, S.; Zimmermann, R.; Scharnweber, D.; Werner, C.; Worch, H. Characterization of oxide layers on Ti6Al4V and titanium by streaming potential and streaming current measurements. Colloid Surf. B 2002, 26, 387–395. [Google Scholar] [CrossRef]
- Schudel, M.; Behrens, S.H.; Holthoff, H.; Kretzschmar, R.; Borkovec, M. Absolute aggregation rate constants of hematite particles in aqueous suspensions: A comparison of two different surface morphologies. J. Colloid Interface Sci. 1997, 196, 241–253. [Google Scholar] [CrossRef]
- Barringer, E.A.; Bowen, H.K. High-purity, monodisperse TiO2 powders by hydrolysis of titanium tetraethoxide 2. Aqueous interfacial electrochemistry and dispersion stability. Langmuir 1985, 1, 420–428. [Google Scholar] [CrossRef]
- Bauer, D.; Buchhammer, H.; Fuchs, A.; Jaeger, W.; Killmann, E.; Lunkwitz, K.; Rehmet, R.; Schwarz, S. Stability of colloidal silica, sikron and polystyrene latex influenced by the adsorption of polycations of different charge density. Colloids Surf. A 1999, 156, 291–305. [Google Scholar] [CrossRef]
- Elgersma, A.V.; Zsom, R.L.J.; Lyklema, J.; Norde, W. Kinetics of single and competitive protein adsorption studied by reflectometry and streaming potential measurements. Colloids Surf. 1992, 65, 17–28. [Google Scholar] [CrossRef]
- Freudenberg, U.; Zimmermann, R.; Schmidt, K.; Behrens, S.H.; Werner, C. Charging and swelling of cellulose films. J. Colloid Interface Sci. 2007, 309, 360–365. [Google Scholar] [CrossRef]
- Meszaros, R.; Thompson, L.; Bos, M.; de Groot, P. Adsorption and electrokinetic properties of polyethylenimine on silica surfaces. Langmuir 2002, 18, 6164–6169. [Google Scholar] [CrossRef]
- Dabros, T.; van de Ven, T.G.M. A direct method for studying particle deposition onto solid surfaces. Colloid Polym. Sci. 1983, 261, 694–707. [Google Scholar] [CrossRef]
- Dijt, J.C.; Cohen Stuart, M.A.; Hofman, J.E.; Fleer, G.J. Kinetics of polymer adsorption in stagnation point flow. Colloids Surf. 1990, 51, 141–158. [Google Scholar] [CrossRef]
- Kleimann, J.; Lecoultre, G.; Papastavrou, G.; Jeanneret, S.; Galletto, P.; Koper, G.J.M.; Borkovec, M. Deposition of nanosized latex particles onto silica and cellulose surfaces studied by optical reflectometry. J. Colloid Interface Sci. 2006, 303, 460–471. [Google Scholar] [CrossRef]
- Adamczyk, Z.; Warszynski, P. Role of electrostatic interactions in particle adsorption. Adv. Colloid Interface Sci. 1996, 63, 41–149. [Google Scholar] [CrossRef]
- Semmler, M.; Mann, E.K.; Ricka, J.; Borkovec, M. Diffusional deposition of charged latex particles on water-solid interfaces at low ionic strength. Langmuir 1998, 14, 5127–5132. [Google Scholar] [CrossRef]
- Cahill, B.P.; Papastavrou, G.; Koper, G.J.M.; Borkovec, M. Adsorption of poly(amido amine) (PAMAM) dendrimers on silica: Importance of electrostatic three-body attraction. Langmuir 2008, 24, 465–473. [Google Scholar] [CrossRef] [PubMed]
- Feder, J. Random sequential adsorption. J. Theor. Biol. 1980, 87, 237–254. [Google Scholar] [CrossRef]
- Schaaf, P.; Voegel, J.C.; Senger, B. From random sequential adsorption to ballistic deposition: A general view of irreversible deposition processes. J. Phys. Chem. B 2000, 104, 2204–2214. [Google Scholar] [CrossRef]
- Miklavic, S.J. Mean-field potential for heterogeneous electrical double layers with application to the surface pressure of charged monolayers. J. Colloid Interface Sci. 1995, 171, 446–455. [Google Scholar] [CrossRef]
Figure 1.
AFM topographical images and corresponding height profiles of the (a) bare silica substrate, (b) the PDADMAC-functionalized substrate, and (c) the functionalized substrate with deposited nanoparticles. The height profiles are indicated as horizontal lines in the images. The silica substrate was functionalized during 1 h in a PDADMAC solution with a concentration of 5.0 mg/L with pH 4.0 and an ionic strength of 10 mM, resulting in an adsorbed amount of 0.14 mg/m2. Sulfate latex nanoparticles were subsequently deposited during 30 min to this substrate from a suspension of 10 mg/L at pH 4.0 and an ionic strength of 1.1 mM. The ex situ method involving dip coating was used in both situations.

Figure 2.
Time-dependence of the adsorbed mass of PDADMAC on the silica surface determined by optical reflectivity measurements at a polyelectrolyte concentration of 5.0 mg/L and pH 4.0. The ionic strength was varied for the different runs as indicated. The dashed lines indicate where substrate was flushed with a NaCl solution, then with the same solution containing PDADMAC, and finally again with the NaCl solution. The structural formula of the monomeric unit of PDADMAC is shown as inset.

Figure 3.
Adsorbed mass of the saturated PDADMAC adsorbed layer on silica as a Figure 1a,b. For both cases, a root mean square (RMS) roughness of 0.19 ± 0.02 nm was found. This similarity can be understood since the polyelectrolyte adsorbs in a flat conformation, and explores the existing corrugations of the original substrate.

Figure 4.
Dependence of the electrokinetic potential of the ex situ PDADMAC-functionalized surfaces on pH for different ionic strengths. The substrate was functionalized during 1 h in a PDADMAC solution of 5.0 mg/L with pH 4.0 and an ionic strength of 10 mM, resulting in an adsorbed amount of PDADMAC of 0.14 mg/m2. The isoelectric point (IEP) is located at pH 7.8.

Figure 5.
Electrokinetic potential of the ex situ PDADMAC-functionalized silica surfaces versus pH at an ionic strength of 1.0 mM. The substrates were functionalized in PDADMAC solutions of 5.0 mg/L for different ionic strengths at (a) pH 4.0 and (b) pH 10.0. The resulting adsorbed amount of PDADMAC is indicated.

Figure 6.
Electrokinetic potential of PDADMAC-functionalized silica surfaces versus the adsorbed amount of PDADMAC. The electrokinetic potential was measured at an ionic strength of 1.0 mM. Full symbols correspond to adsorption conditions at pH 4.0, and the open symbols at pH 10.0. The solid lines serve only to guide the eye.

Figure 7.
Electrokinetic potential versus the ionic strength of functionalized silica surfaces at pH 4.0 for different adsorbed amount of PDADMAC as indicated. The solid lines are calculations based on the Grahame Equation (1), whereby the indicated surface charge densities were used.
Figure 7.
Electrokinetic potential versus the ionic strength of functionalized silica surfaces at pH 4.0 for different adsorbed amount of PDADMAC as indicated. The solid lines are calculations based on the Grahame Equation (1), whereby the indicated surface charge densities were used.

Figure 8.
Deposition process of nanoparticles on the PDADMAC-functionalized silica at pH 4.0 and an ionic strength of 10 mM for various concentrations of nanoparticles. (a) The deposited amount and (b) the time-derivative of the deposited amount are represented as a function of time.
Figure 8.
Deposition process of nanoparticles on the PDADMAC-functionalized silica at pH 4.0 and an ionic strength of 10 mM for various concentrations of nanoparticles. (a) The deposited amount and (b) the time-derivative of the deposited amount are represented as a function of time.

Figure 9.
Comparison of the initial nanoparticle deposition rate on PDADMAC-functionalized silica prepared by the in situ and ex situ techniques versus the nanoparticle concentration at pH 4.0 and an ionic strength of 10 mM. The solid line reflects first-order kinetics with respect to the solution concentration. Full and open symbols refer to in situ and ex situ functionalized substrates, respectively.

Figure 10.
Comparison of the sticking coefficient for nanoparticle deposition on PDADMAC-functionalized silica prepared by in situ and ex situ techniques versus the ionic strength. The adsorbed amount of PDADMAC is indicated. Full and open symbols refer to in situ and ex situ substrates, respectively.

Figure 11.
Comparison of the maximum deposited number of nanoparticles on PDADMAC-functionalized surfaces prepared by in situ and ex situ techniques versus the adsorbed amount of PDADMAC. The nanoparticles were deposited at pH 4.0 and the ionic strengths indicated. Full and open symbols refer to in situ and ex situ functionalized substrates, respectively.

Figure 12.
Maximum deposited number of nanoparticles on the PDADMAC-functionalized silica surface at pH 4.0 versus the ionic strength for different adsorbed amounts of PDADMAC. The solid lines represent calculations with the three-body RSA model. The dashed line indicates the result of the classical RSA model, while the dotted line indicates the jamming coverage for hard disks. The surface coverage is also indicated as the leftmost axis. Full and open symbols refer to in situ and ex situ functionalized substrates, respectively.

Publisher’s Note: MDPI stays neutral with regard to jurisdictional claims in published maps and institutional affiliations. |
© 2021 by the authors. Licensee MDPI, Basel, Switzerland. This article is an open access article distributed under the terms and conditions of the Creative Commons Attribution (CC BY) license (https://creativecommons.org/licenses/by/4.0/).
Share and Cite
MDPI and ACS Style
Kosior, D.; Maroni, P.; Borkovec, M. Particle Deposition to Silica Surfaces Functionalized with Cationic Polyelectrolytes. Colloids Interfaces 2021, 5, 26. https://0-doi-org.brum.beds.ac.uk/10.3390/colloids5020026
AMA Style
Kosior D, Maroni P, Borkovec M. Particle Deposition to Silica Surfaces Functionalized with Cationic Polyelectrolytes. Colloids and Interfaces. 2021; 5(2):26. https://0-doi-org.brum.beds.ac.uk/10.3390/colloids5020026
Chicago/Turabian StyleKosior, Dominik, Plinio Maroni, and Michal Borkovec. 2021. "Particle Deposition to Silica Surfaces Functionalized with Cationic Polyelectrolytes" Colloids and Interfaces 5, no. 2: 26. https://0-doi-org.brum.beds.ac.uk/10.3390/colloids5020026