Review

Water and Ion Dynamics in Confined Media: A Multi-Scale Study of the Clay/Water Interface

1
Interfaces, Confinement, Matériaux et Nanostructures (ICMN), UMR 7374, CNRS, Université d’Orléans, 1b Rue de la Férollerie, CS 40059, CEDEX 2, F-45071 Orléans, France
2
IC2MP, UMR 7285, CNRS, Université de Poitiers, 5 Rue Albert Turpain, Bât. B8, TSA 51106, CEDEX 9, F-86073 Poitiers, France
3
Institut Laue-Langevin, 71 Avenue des Martyrs, CS 20156, CEDEX 9, F-38042 Grenoble, France
4
Laboratoire PHENIX, UMR 8234, CNRS, Sorbonne Université, UPMC, 4 Place Jussieu, CEDEX 5, F-75252 Paris, France
5
Université Paris-Saclay, CEA, Service d’Etude du Comportement des Radionucléides, F-91191 Gif-sur-Yvette, France
*
Authors to whom correspondence should be addressed.
Colloids Interfaces 2021, 5(2), 34; https://0-doi-org.brum.beds.ac.uk/10.3390/colloids5020034
Submission received: 18 March 2021 / Revised: 7 June 2021 / Accepted: 9 June 2021 / Published: 15 June 2021
(This article belongs to the Special Issue Interfacial Dynamics)

Abstract

:
This review details a large panel of experimental studies (Inelastic Neutron Scattering, Quasi-Elastic Neutron Scattering, Nuclear Magnetic Resonance relaxometry, Pulsed-Gradient Spin-Echo attenuation, Nuclear Magnetic Resonance Imaging, macroscopic diffusion experiments) used recently to probe, over a large distribution of characteristic times (from pico-second up to days), the dynamical properties of water molecules and neutralizing cations diffusing within clay/water interfacial media. The purpose of this review is not to describe these various experimental methods in detail but, rather, to investigate the specific dynamical information obtained by each of them concerning these clay/water interfacial media. In addition, this review also illustrates the various numerical methods (quantum Density Functional Theory, classical Molecular Dynamics, Brownian Dynamics, macroscopic differential equations) used to interpret these various experimental data by analyzing the corresponding multi-scale dynamical processes. The purpose of this multi-scale study is to perform a bottom-up analysis of the dynamical properties of confined ions and water molecules, by using complementary experimental and numerical studies covering a broad range of diffusion times (between pico-seconds up to days) and corresponding diffusion lengths (between Angstroms and centimeters). In the context of such a bottom-up approach, the numerical modeling of the dynamical properties of the diffusing probes is based on experimental or numerical investigations performed on a smaller scale, thus avoiding the use of empirical or fitted parameters.

1. Introduction

Among colloids, clays are ubiquitous materials exhibiting a large variety of physico-chemical properties, such as adsorption of water and polar molecules [1,2,3], high specific surface area [3], electric surface charge [3], swelling [4], gelling [5], thixotropy, and surface acidity exploited in numerous industrial processes, including waste storing [6,7], cosmetic and paint industries, drilling, cracking, and heterogeneous catalysis [8]. Optimizing these various applications requires a detailed analysis of the impact of the clay composition on the dynamical processes implied in these applications. For that purpose, numerous dynamical studies have been performed to probe, over a broad dynamical range, the mobility of ions [9,10] and molecules [11,12,13] physisorbed at the clay/water interface. As illustrated in Figure 1, we selected to use a complementary set of experiments, including Inelastic Neutron Scattering (INS) [14,15,16,17,18,19], Quasi-Elastic Neutron Scattering (QENS) [12,20,21,22,23,24,25,26,27,28,29,30], Nuclear Magnetic Resonance (NMR) relaxometry [31,32,33,34,35,36,37,38,39,40,41,42,43,44,45,46,47,48,49], Pulsed-Gradient Spin-Echo (PGSE) attenuation [11,50,51,52], Magnetic Resonance Imaging (MRI) [51], and macroscopic diffusion experiments as Out-Diffusion (OD) [53,54] or Through-Diffusion (TD) [55] experiments, because they probe complementary time-scales (see Figure 1). These experiments allow investigating a broad dynamical range (from few pico-seconds to few days) and quantifying the impact of the clay/water interface on the dynamics of the interfacial molecular and ionic probes.
Furthermore, as illustrated in Figure 2, the use of swelling clays, such as Na+-saturated montmorillonite, allows probing a broad range of interlayer separations [4] varying between a limited number of hydration layers for layer-to-layer distances smaller than 20 Å, in the so-called crystalline swelling regime [2,56,57], and a large continuum of layer-to-layer distances (between 40 Å and 70 Å), in the so-called osmotic swelling regime. By contrast, Ca2+-saturated montmorillonite only exhibits crystalline swelling (see Figure 2) because inter-ionic correlation forces strongly reduce the swelling pressure of these charged interfaces [58,59]. For that reason, these dynamical experiments require the use of purified clay samples to avoid coexistence of swollen and unswollen phases within heterogeneous samples.
For that purpose, some of the dynamical studies presented here were performed with synthetic clays (laponite and saponite) in order to avoid impurities within the clay network. In the case of natural clays (kaolinite, beidellite, and vermiculite), the samples were purified according to standard procedures [60] and size separated by centrifugation. Under such conditions, clay/water interfaces are well characterized systems and ideal to investigate the influence of charged interfaces on the thermodynamical and dynamical properties of confined fluids.
Finally, numerical modeling is required to relate the organization of these clay/water interfaces and the dynamical information extracted from the various experimental data obtained by INS, QENS, PGSE, MRI, and macroscopic diffusion experiments (see Figure 1). In that context, an atomic description of the clay/water interface is required for modeling the structural and dynamical properties of these interfacial systems probed in the crystalline swelling regime. For that purpose, quantum calculations are used to directly determine the dynamical properties of confined ions and water molecules by using ab initio DFT quantum methods [61,62]. Quantum calculations are also useful to evaluate atomic properties of the clay network, such as atomic partial charges, by using semi-empirical [63] or ab initio [64] quantum calculations. These parameters are further exploited in classical statistical treatments of the clay/water interfaces by using classical Monte Carlo (MC) simulations and Molecular Dynamics (MD) to investigate the structural and dynamical properties of the confined ions and water molecules within the crystalline swelling regime [2,12,17,28,40,41,46,63,64,65,66]. By contrast, in the so-called osmotic regime, one may easily neglect the atomic structure of the clay network and the solvent molecules by using classical Brownian Dynamics (BD) in order to determine the effective mobility [67] of the neutralizing counterions in the presence of structureless charged surfaces [68]. In the same context, numerical integration of differential equations can also be used to study the mobility of diffusing probes at the macroscopic scale (Refs. [54,69], and references therein).
In the present review, these techniques are described following a path of increasing probed time-scales, together with the associated numerical methods, in order to highlight the methodology used to get information regarding the multi-scale properties of clay/water interfaces. The purpose of that study is to exploit such a multi-scale analysis of the dynamical properties of ions and water molecules diffusing within clay sediments in order to develop a bottom-up approach of such complex interfacial dynamical processes. In such analysis, we avoid to use fitted parameters derived from empirical models by performing realistic numerical modeling exploiting structural or dynamical properties, such as average residence time or local mobility, extracted from preliminary studies performed on a smaller scale.

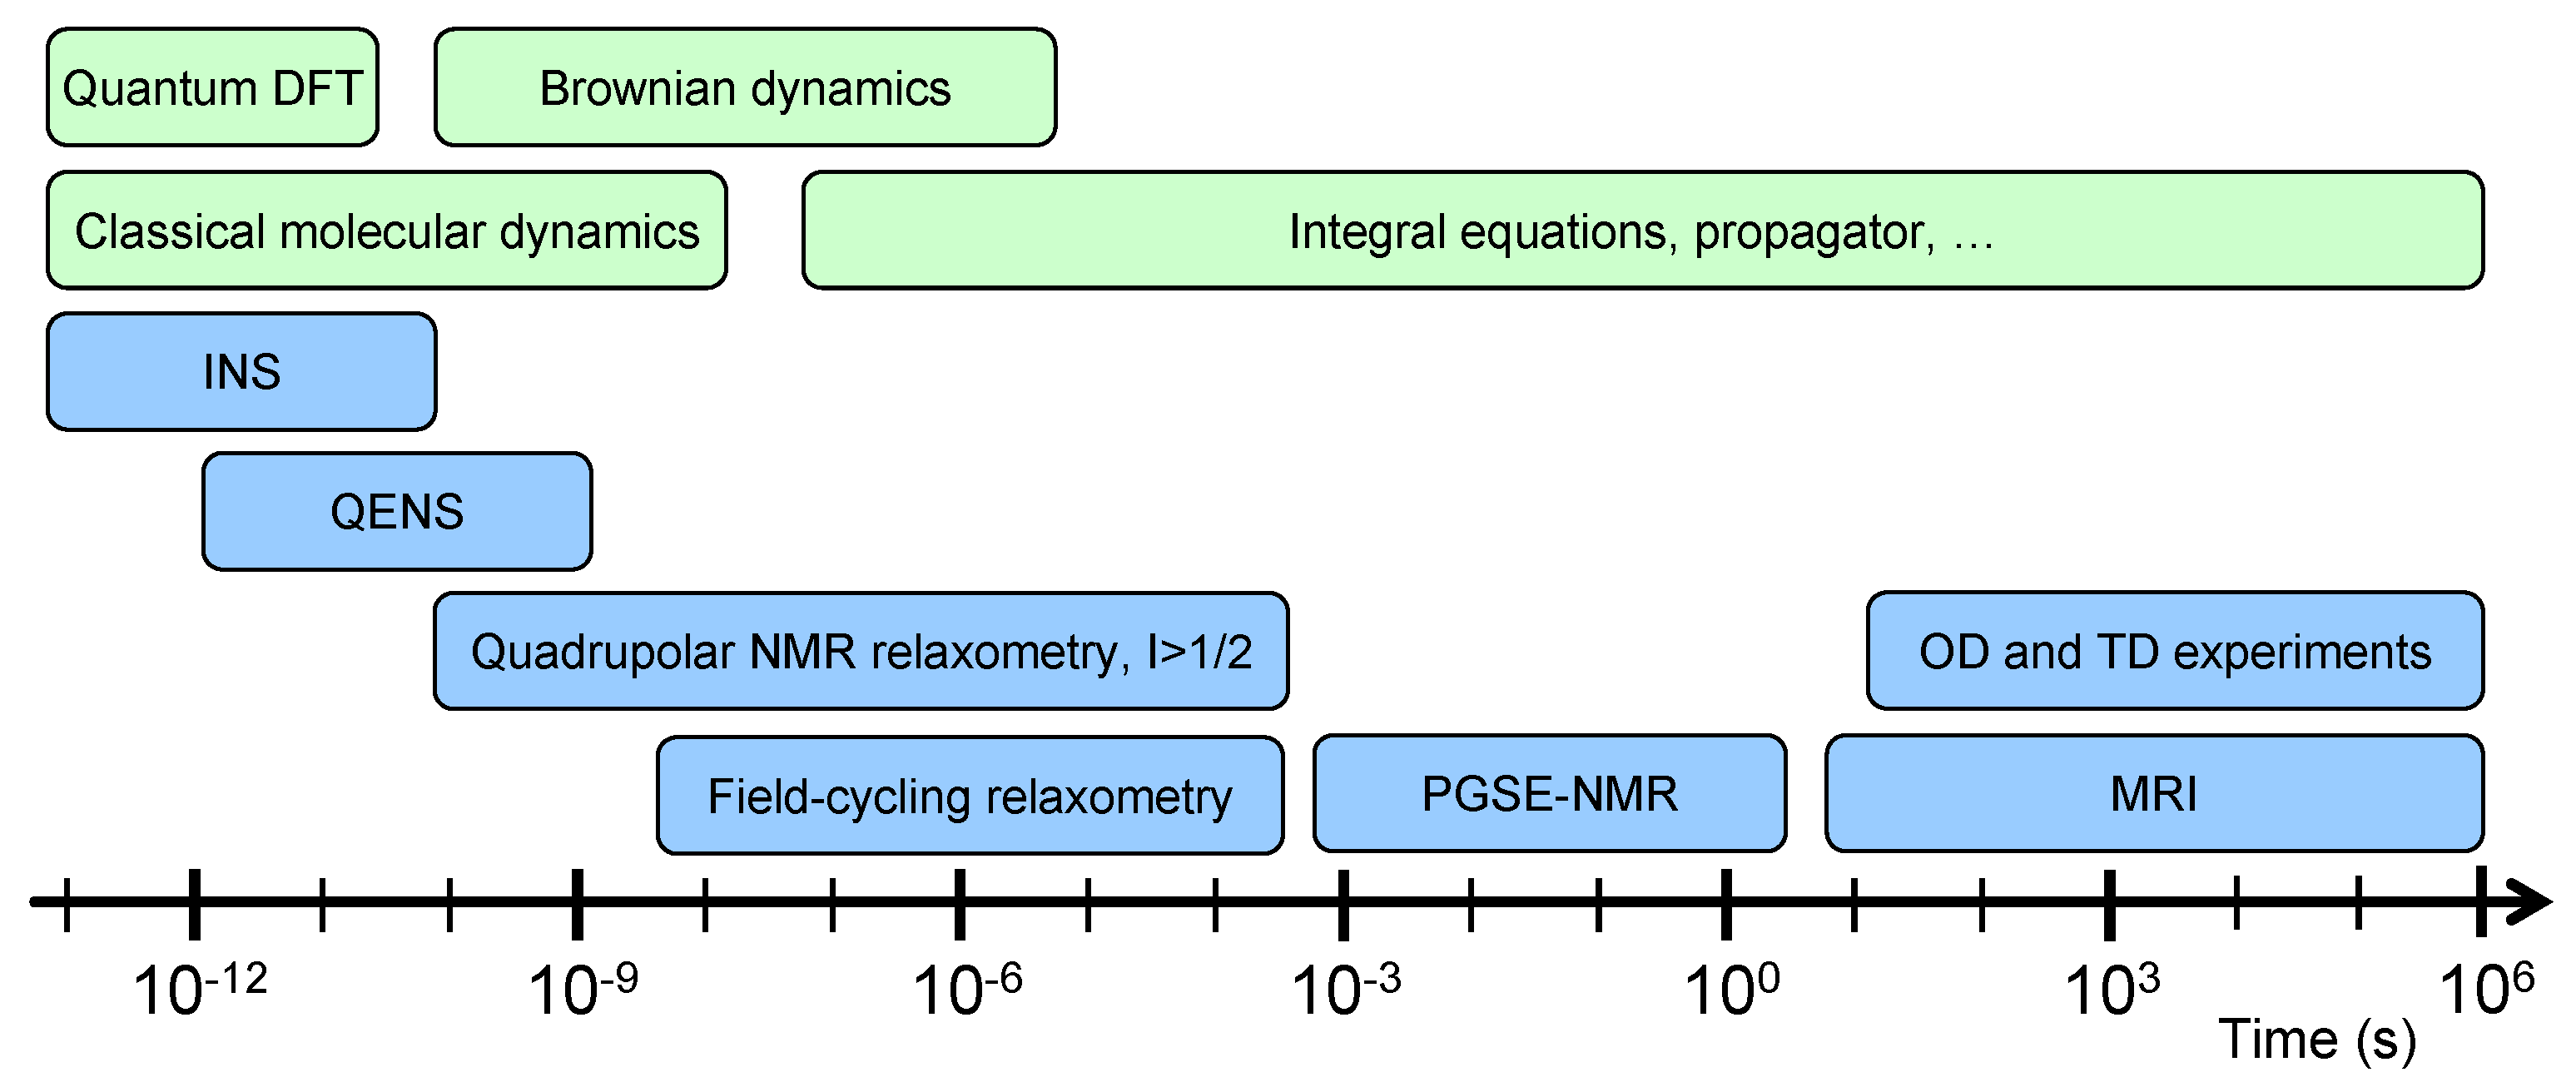
2. Multi-Scale Approaches for Studies of Water and Ions Dynamics in Clay Systems

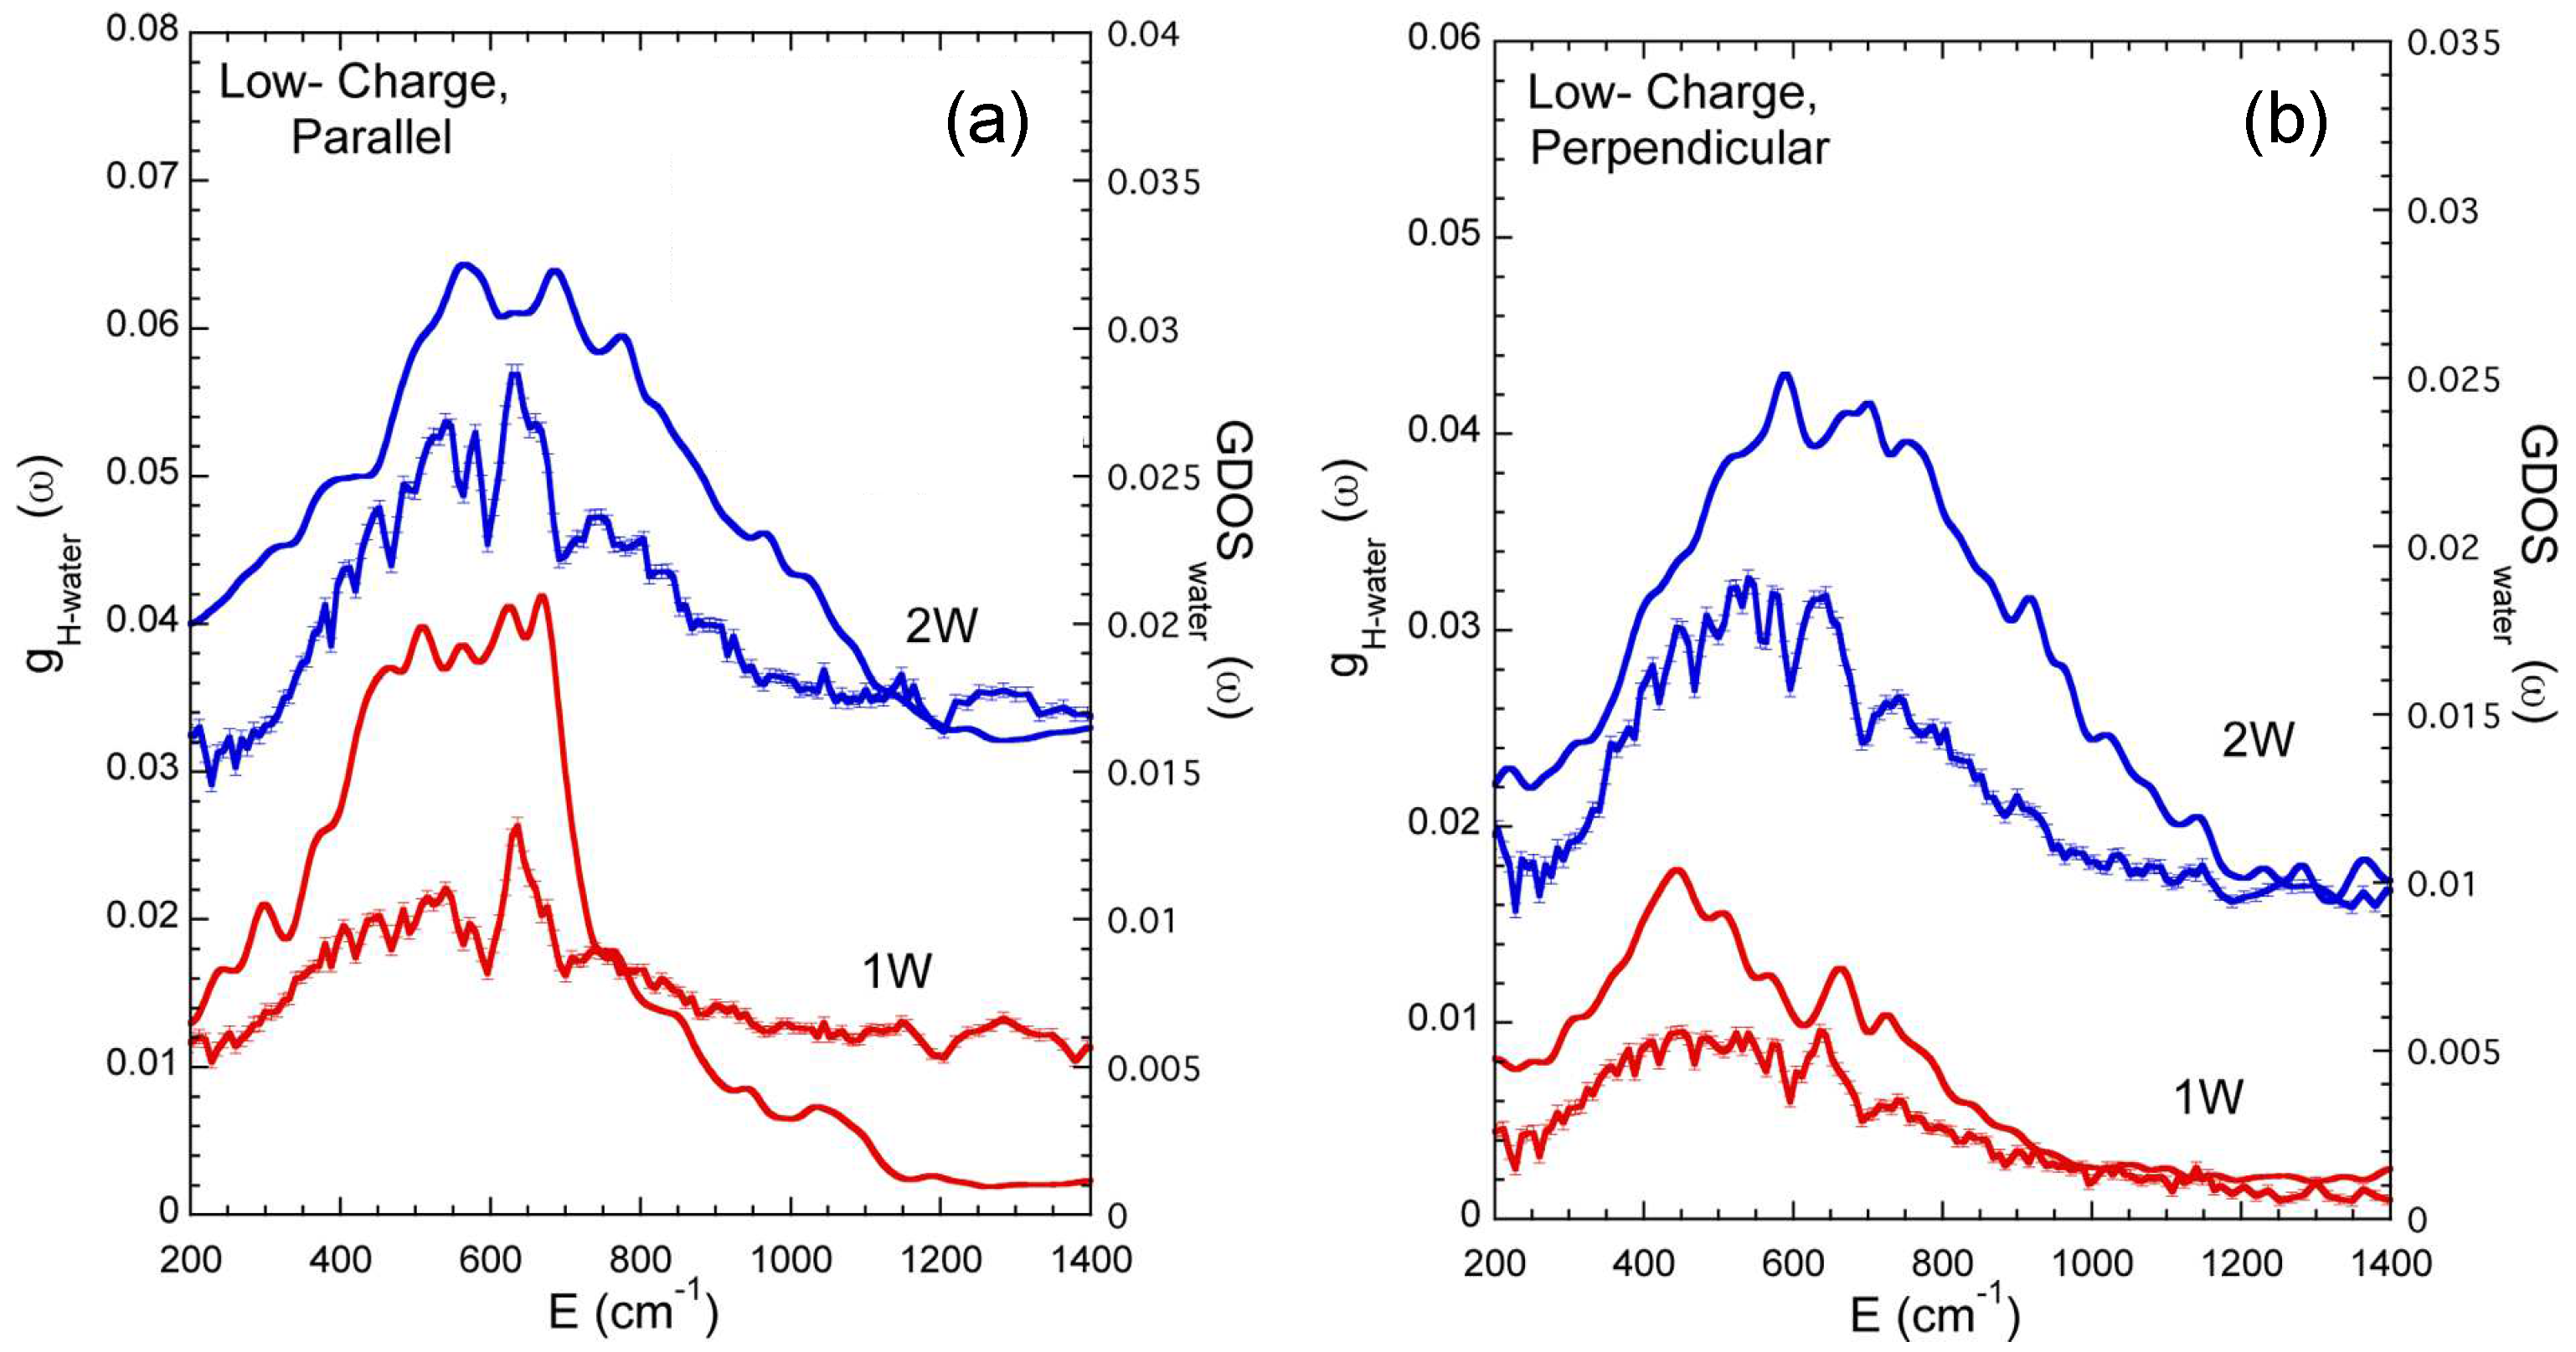
2.1. Inelastic Neutron Scattering

The intensity of the INS spectra is directly proportional to the so-called Generalized Density of States, labeled G D O S ( ω ) , that is the density of states of a system taking into account the scattering cross section of the various atoms:
G D O S ( ω )   =   j σ j M j g j ( ω ) ,
where M j and σ j are, respectively, the atomic mass and the cross section of the atom labeled j. An important point is that the scattering cross section of Hydrogen is almost 2 order of magnitude that of the other atoms of the clay (Si, Al, O), so the G D O S ( ω ) gives mainly information on the vibrational modes of the H atoms. For the hydrated systems, the simulated spectra were calculated with Density Functional Theory Molecular Dynamics simulations since the confined water molecules remain liquids and, thus, disordered compared to monocrystalline clay network. After solving classical Newton equations, the G D O S ( ω ) was approximated by evaluating the velocity auto-correlation function of the atoms:
g j ( ω )   =   1 2 π + e i ω t j v j ( 0 ) · v j ( t ) v j ( 0 ) · v j ( 0 ) d t ,
where v j ( t ) is the instantaneous velocity of atom j. Before comparing the predictions obtained from the ab initio MD simulations with experimental data, the contributions from the dry clay network is subtracted [18]. The resulting spectra are displayed in Figure 3 for two hydration states corresponding, respectively, to the formation of one and two hydration layers [70]. In both longitudinal and perpendicular directions, the agreements between predicted g H w a t e r ( ω ) and experimental spectra are semi-quantitative with a fair matching of the characteristic frequencies (see Figure 3), partially validating the use of the above-mentioned approximation in the treatment of such local motions of the confined water molecules.

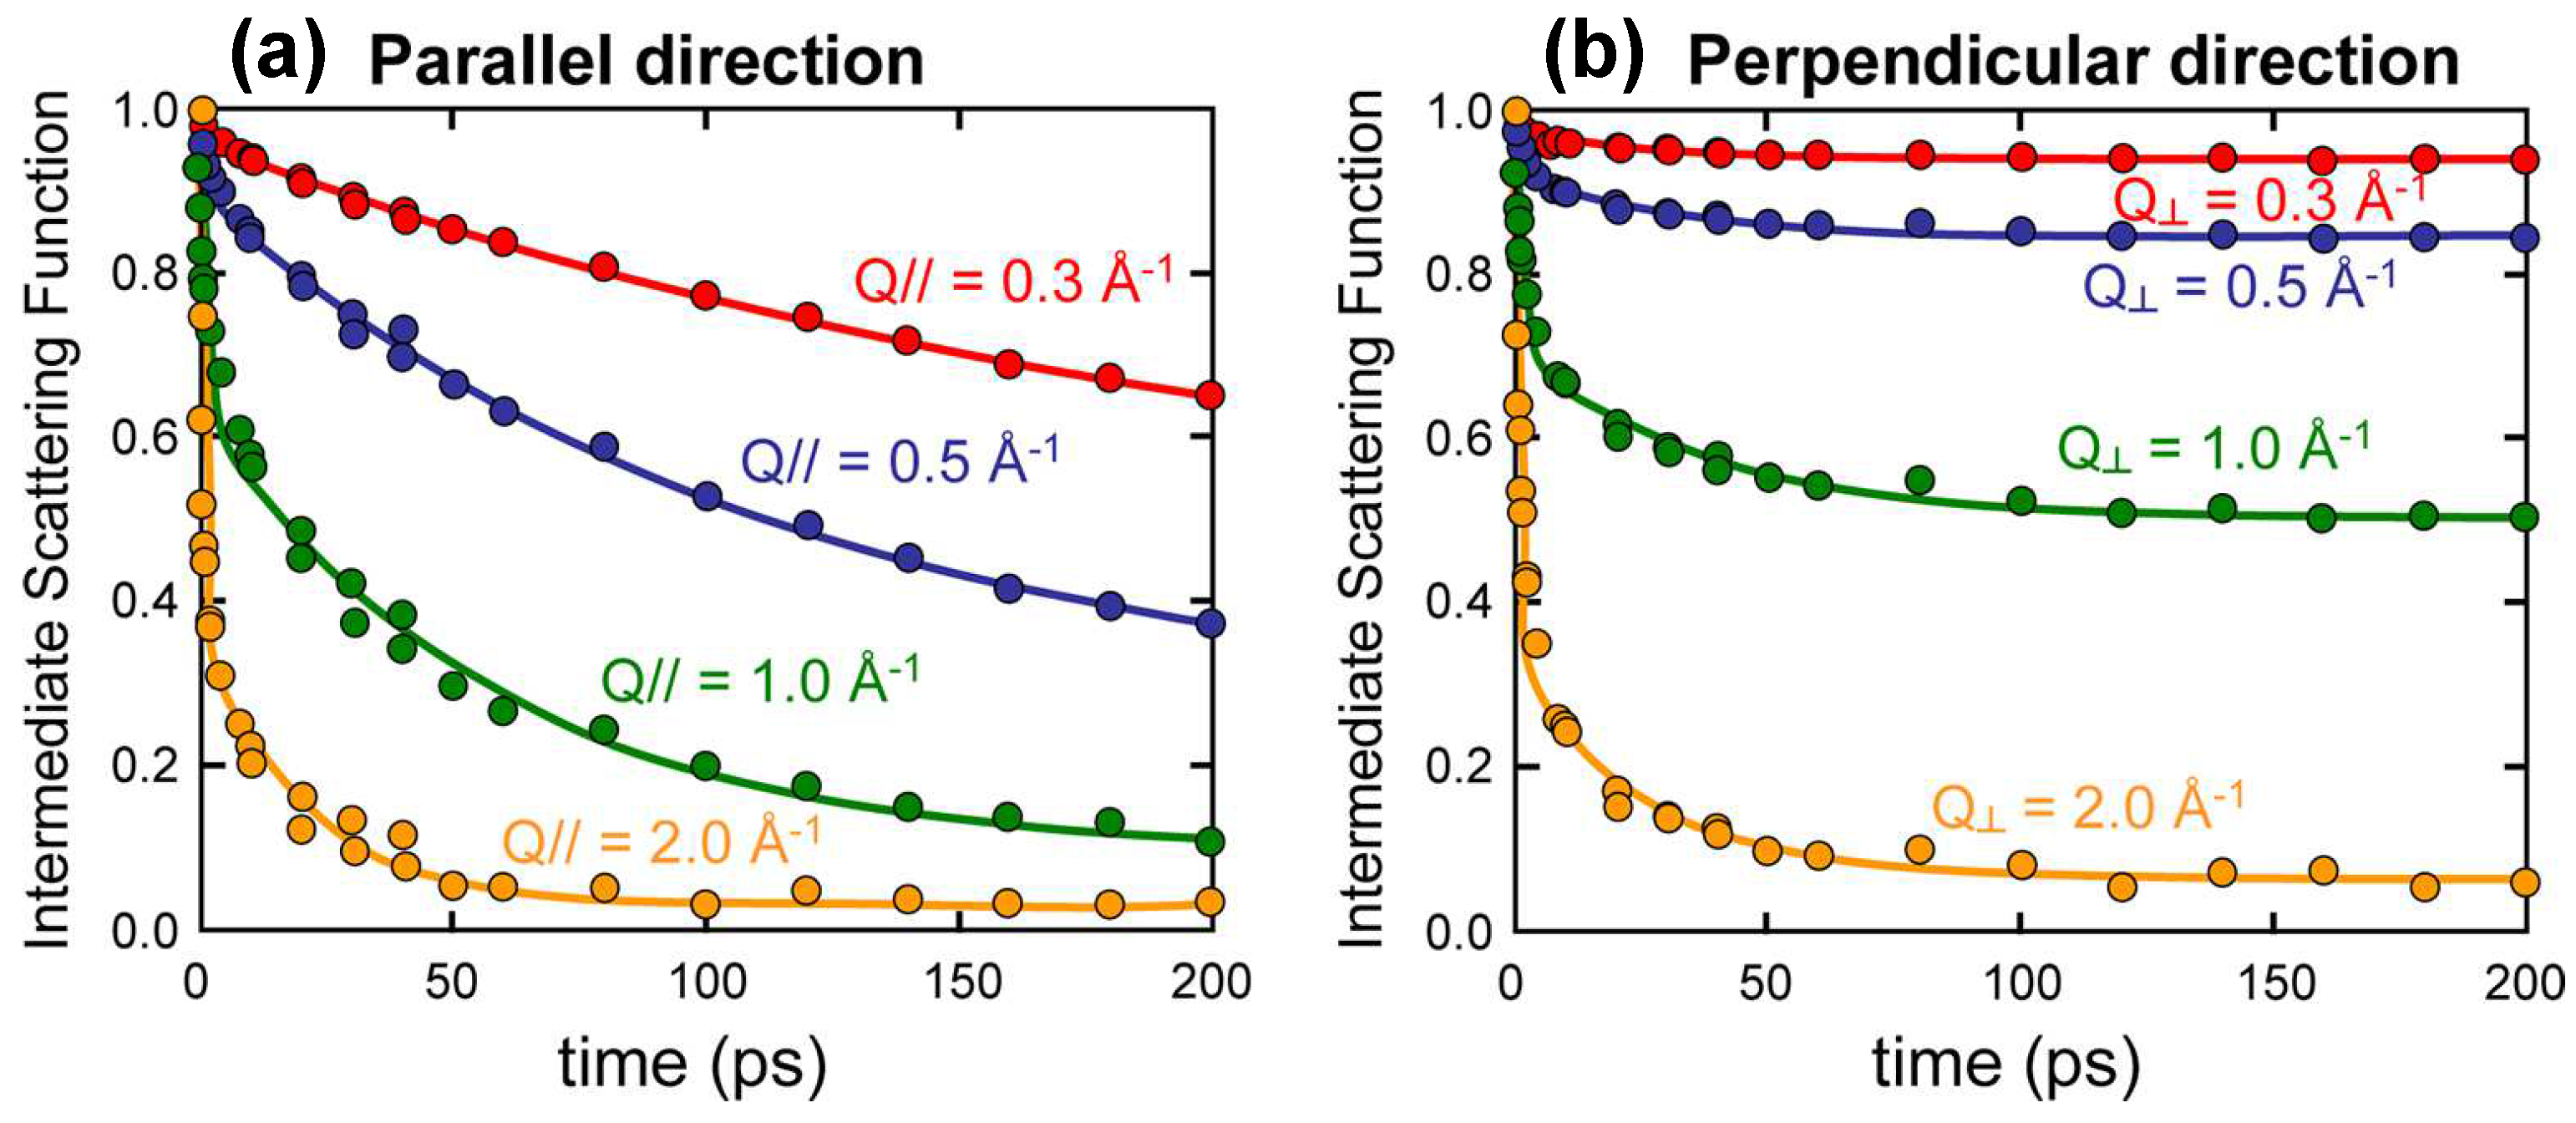
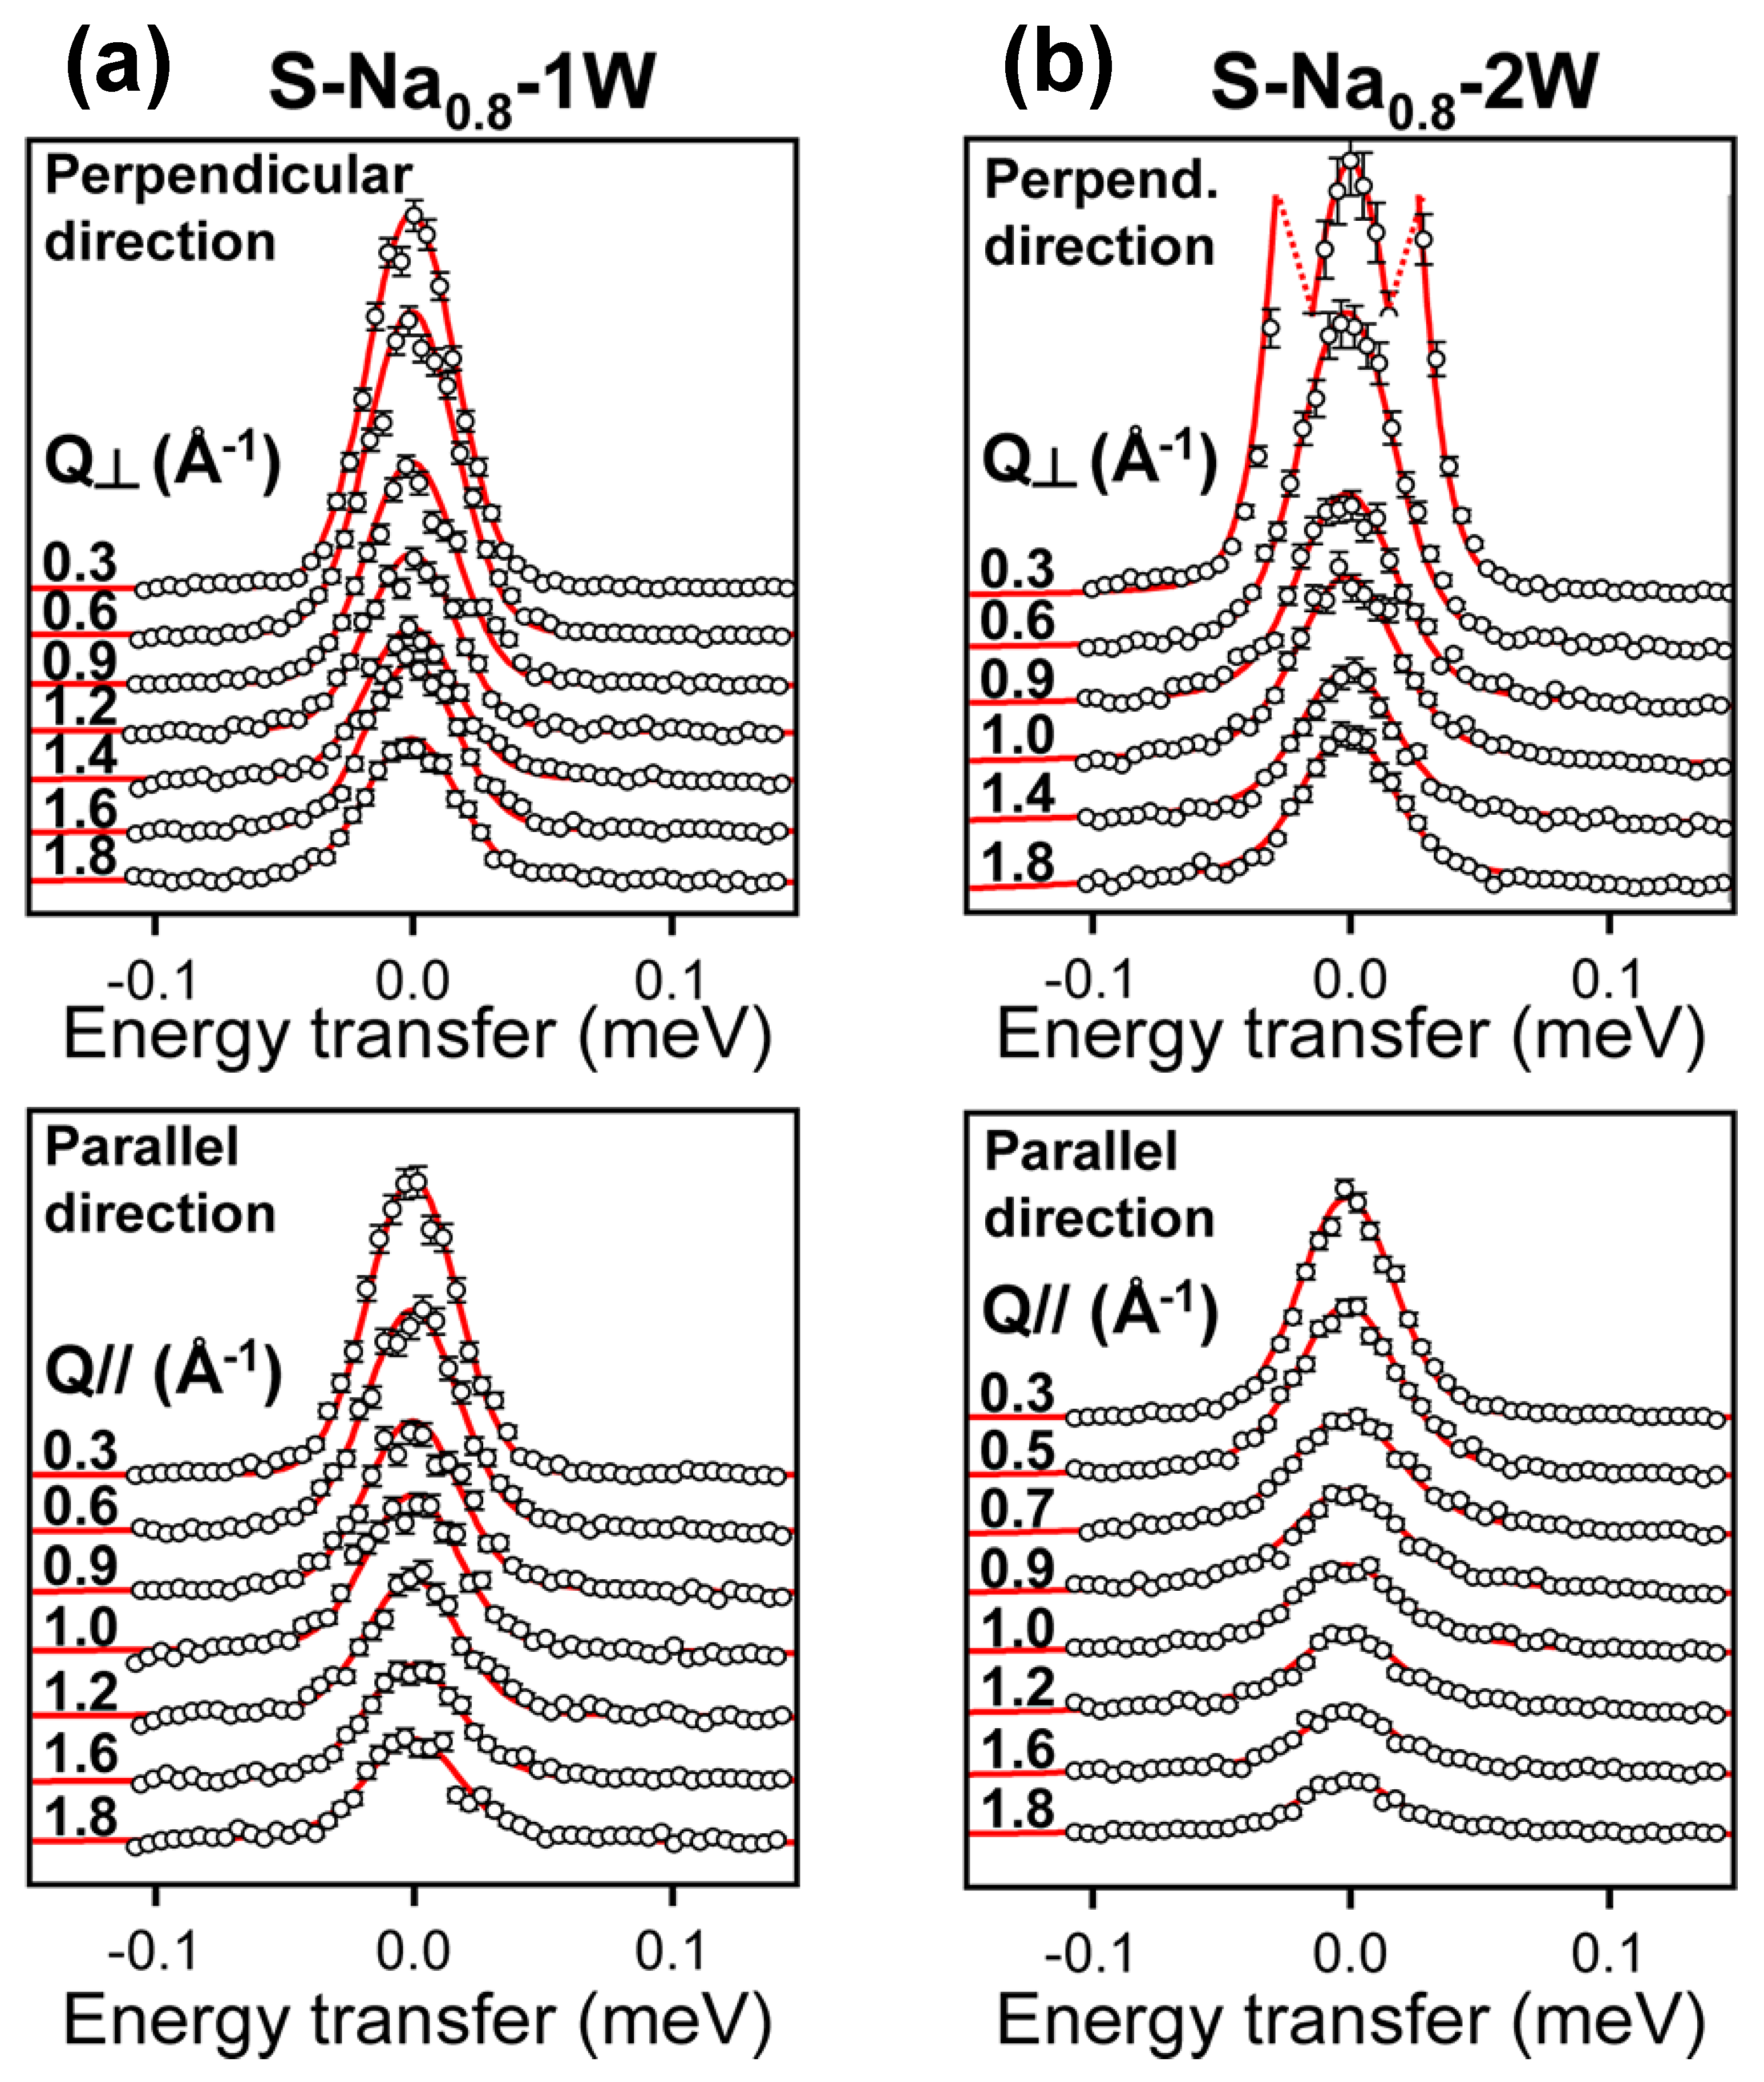
2.2. Quasi-Elastic Neutron Scattering

Quasi-Elastic Neutron Scattering (QENS) experiments are performed [12,28] to probe the diffusive motions of the confined water molecules and their orientational dependence regarding the clay surface. These measurements are performed with the same saponite synthetic clay at various hydration states and neutralized by sodium or calcium counterions. Since the dynamical range probed by these QENS measurement extend up to a few hundred pico-seconds (see Figure 1), the molecular modeling of the clay/water interface is performed by using the classical CLAYYFF force field [64], with a minor correction of its Lennard/Jones parameters introduced to improve the agreement between the structure of the clay/water interface obtained by X-Ray and neutron scattering experiments and simulated data [2,57,70]. Grand Canonical Monte Carlo (GCMC) simulations [71] are first performed to determine the number of confined water molecules as a function of the experimentally fixed water chemical potential [12,28] and the layer-to-layer distance previously determined by X-Ray Scattering (XRS) [70]. The mobility of the confined water molecules and neutralizing sodium or calcium counterions is then modeled by performing numerical simulations of Molecular Dynamics (MD) [72] (see Figure 4), starting from an equilibrium configuration previously determined by GCMC simulations.
The QENS spectra displayed in Figure 5 are directly evaluated from the Fourier Transform of the Intermediate Scattering Function (ISF):
F s ( Q α , t )   =   1 2 N w j = 1 N w n h = 1 2 exp i Q α · r i , n h ( 0 )     r i , n h ( t ) ,
convoluted by the spectral resolution of INS experimental set-up [28]. As displayed in Figure 5, an excellent agreement is obtained in all cases between the experimental spectra and the simulated numerical data. As a consequence, one may be quite confident in the validity of the water mobility determined by these numerical simulations on a time-scale slightly shorter than nano-second. The water self-diffusion coefficients displayed in Table 1 are obtained by integrating the velocity auto-correlation function [73] of the water molecules,
D α   =   lim τ + 0 τ v α ( 0 ) · v α ( τ ) d τ ,
allowing to determine the local water mobility in the direction parallel and perpendicular to the clay surface [74]. In Figure 5, the wave numbers q probed by these QENS experiments vary between 0.3 and 1.8 Å 1 , thus restricting the corresponding diffusion length between 21 and 3.5 Å. Furthermore, the same QENS measurements probe a limited dynamical range characterized by a spectral window of 0.25 meV with a resolution of 0.0025 meV (see Figure 5), corresponding to maximum diffusion times of 132 ps. By taking into account the order of magnitude of the apparent mobility of the confined water displayed in Table 1, this maximum diffusion period restricts the order of magnitude of the probed diffusion length to typically a few Angstroms. Furthermore, as displayed in Figure 4, the time-scale probed by the QENS measurements totally matches the dynamical range probed by MD numerical simulations. As a consequence, the agreement between these QENS experimental data and the numerical results obtained by MD simulations depends not only on the quality of the numerical model used in that study but also on the matching between the time-scales and diffusion-ranges probed by both experimental and numerical methods. As a consequence, the self-diffusion coefficients reported here in the direction perpendicular to the clay surface quantifies only the local mobility of the confined water molecules and does not correspond to macroscopic displacements totally impeached by the confining clay platelets (see Figure 6a). By contrast, the water mobility of the water molecules quantified by the same QENS measurements in the direction parallel to the clay surface can be used to determine the order of magnitude of the residence time of the same water molecules (labeled τ C in Figure 6a) confined in the interlamellar space between two clay platelets. As displayed in Table 1, confinement under low electrostatic coupling (i.e., for 0.8 electron per unit cell) simply reduces the water mobility by a factor ten by comparison with bulk water. By contrast, at higher electrostatic coupling (i.e., for 1.4 electron per unit cell), the water mobility may be reduced by two orders of magnitude. These numerical results illustrate how geometric and energetic constraints can significantly modify the dynamics of confined water molecules.

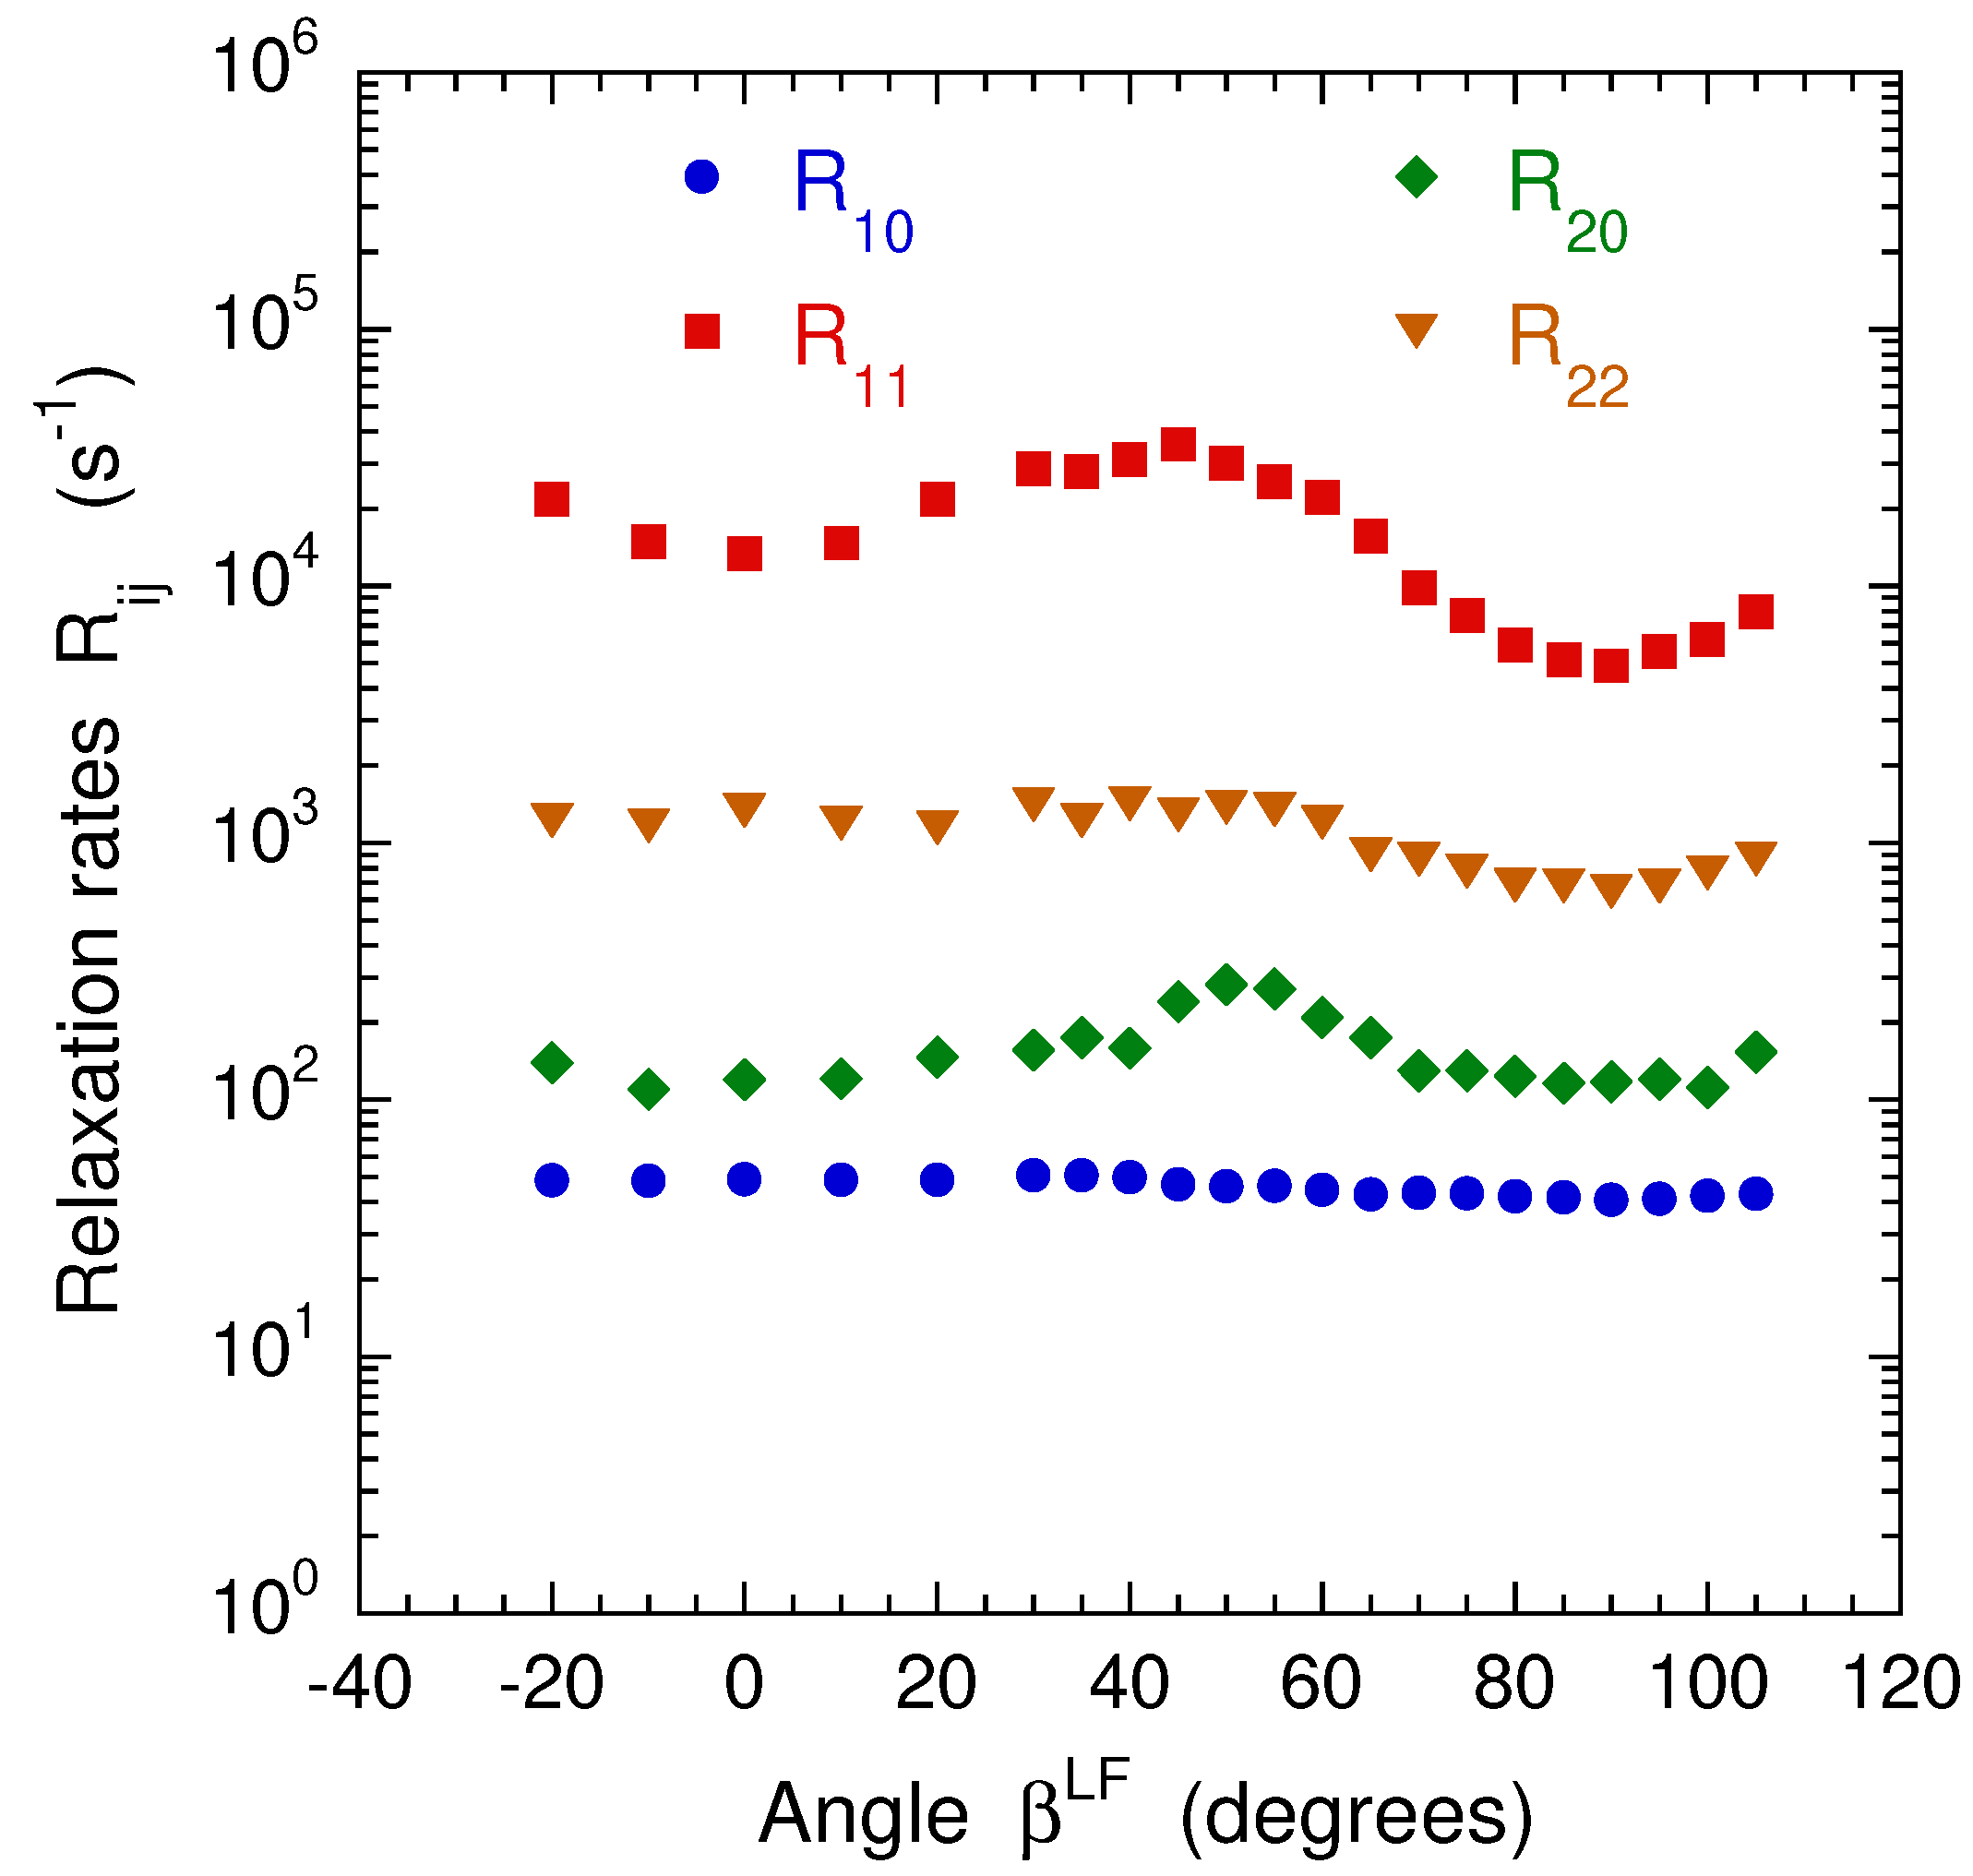
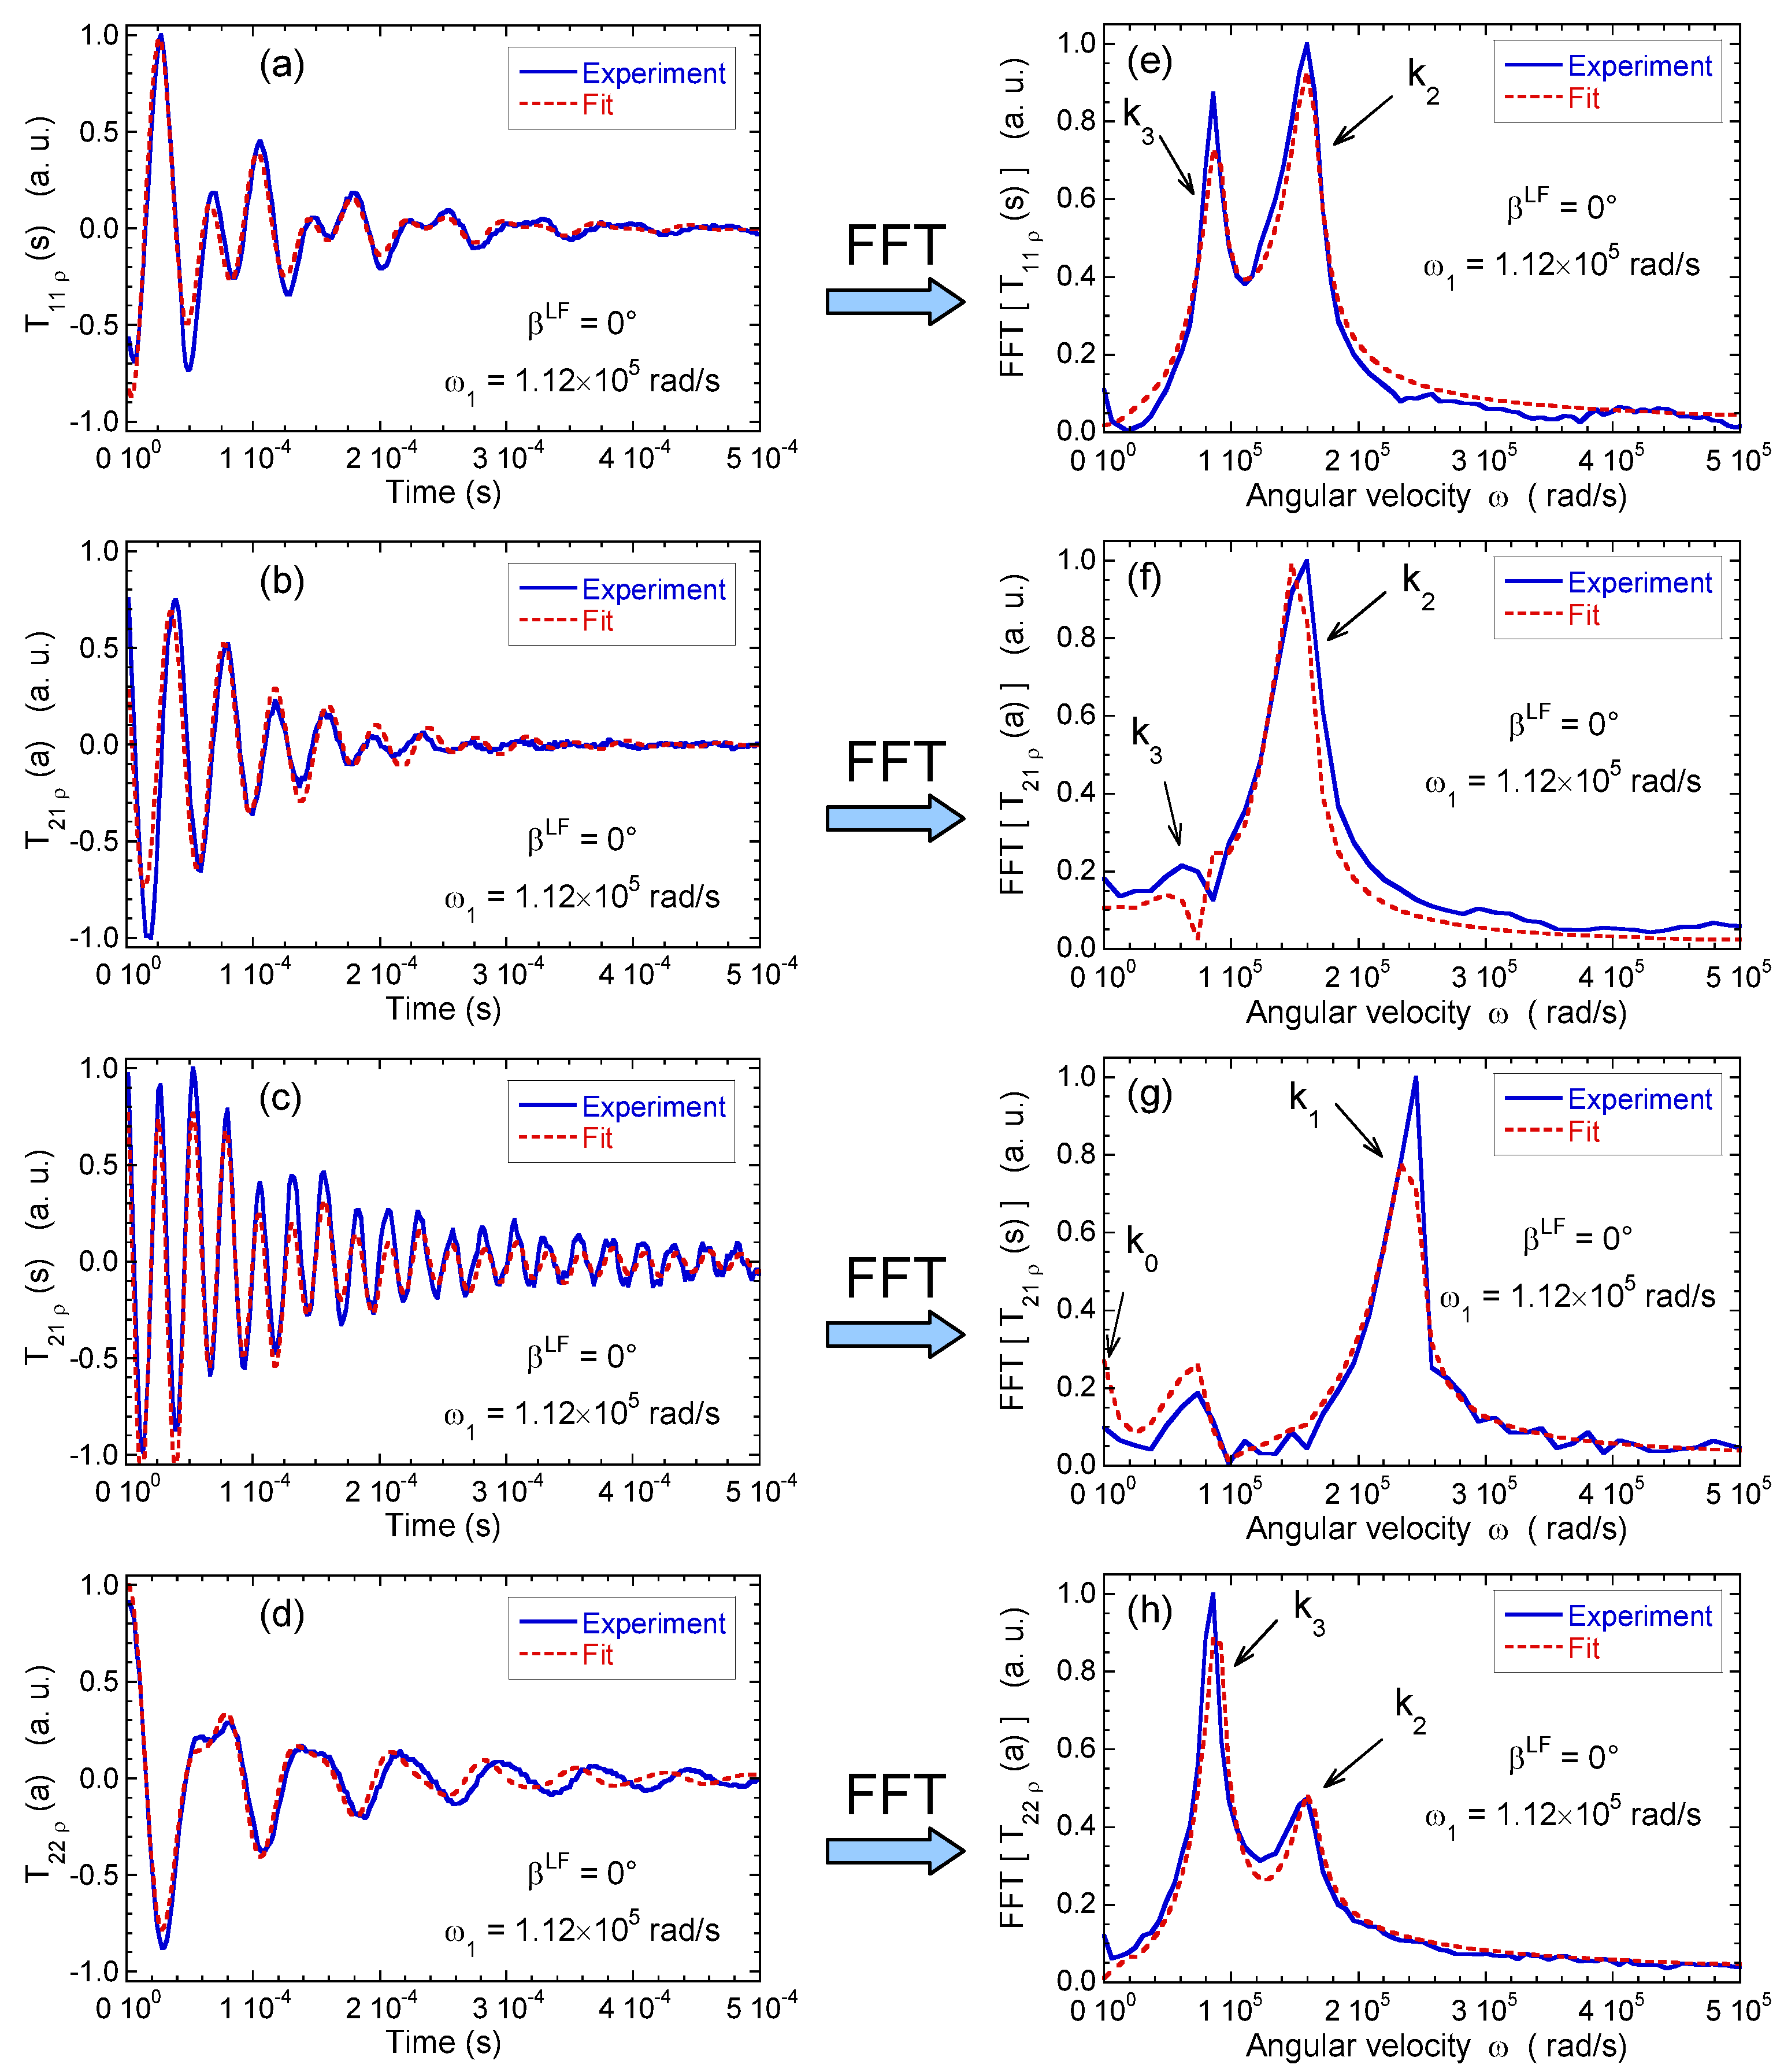
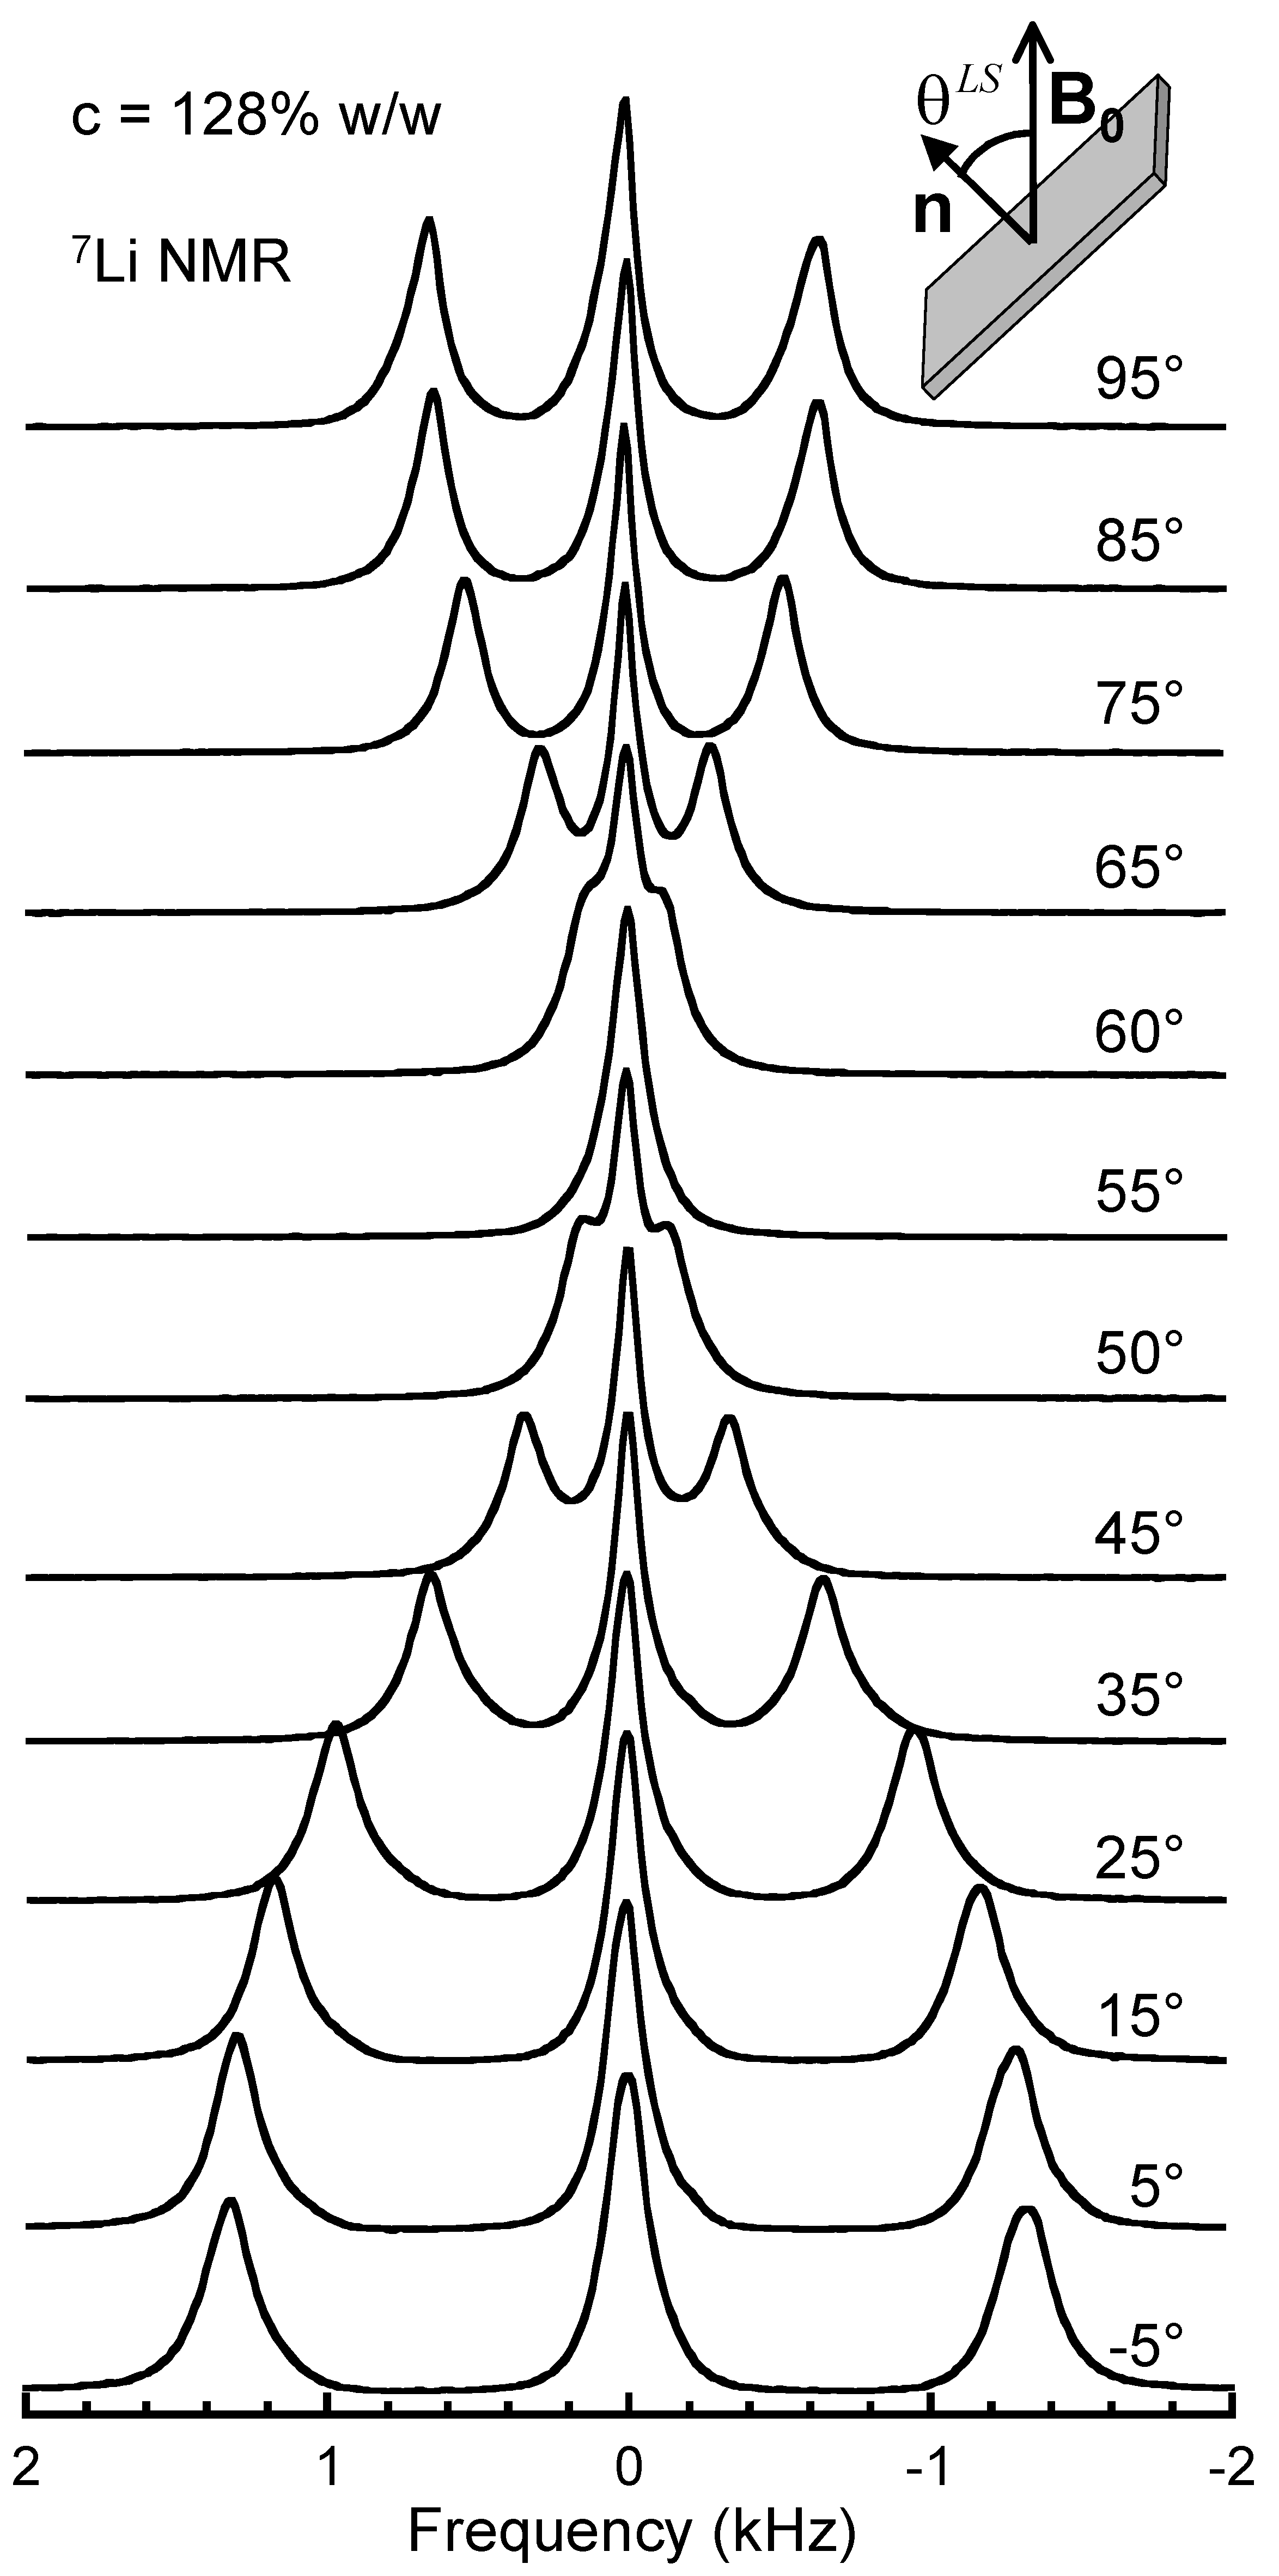
2.3. Nuclear Magnetic Resonance Relaxometry

In the last decade, Nuclear Magnetic Resonance (NMR) relaxometry appeared as a powerful tool [75,76] to investigate dynamics of fluids under confinement by measuring the frequency variation of the NMR relaxation rates. Usual NMR spectrometers allow to measure easily the relaxation of the nuclear magnetization in the direction parallel and perpendicular to the static magnetic field, leading, respectively, to the longitudinal and transverse relaxation rates. For bulk liquids, these two independent measurements lead to the same relaxation rates. By contrast, the transverse relaxation rates of confined fluids largely exceed their longitudinal counterpart due to their large frequency variations. The purpose of NMR relaxometry is to probe that frequency variation of the relaxation rates in order to extract dynamical information on the molecular motions (rotation and diffusion) inducing the fluctuations of the magnetic coupling monitoring the NMR relaxation processes. For I = 1/2 spin nuclei [35,75,76], field-cycling NMR spectrometers are perfectly appropriate to perform such investigations since the order of magnitude of the probed relaxation rates is generally compatible with the time required to switch the magnetic field of these spectrometers (typically, milli-seconds). As an example, field cycling NMR relaxometry measurements were only performed with dilute dispersions of synthetic clays [37]. By contrast, the same field cycling spectrometers become inefficient for quadrupolar nuclei (spin I > 1/2) because of the large enhancement of their relaxation rates under confinement. In that context, spin-locking relaxation measurement [77,78,79,80] is a powerful tool since it may be performed with usual spectrometer and is simply limited by the short dead time required to generate a sequence of NMR pulses (typically, micro-seconds).
Furthermore, a complete understanding of the NMR relaxation processes requires a quantum analysis of the spin. For I = 1/2 spin nuclei, this is easily performed by using the four Pauli matrices [75] to describe the three independent states of the magnetization (M x , M y and M z ) completed by the unit operator, in order to obtain a complete basis set. For quadrupolar nuclei (spin I > 1/2), this basis set becomes incomplete and new operators must be added [81] (five for I = 1 spin nuclei like 2H, twelve for I = 3/2 spin nuclei like 7Li or 23Na and up to sixty for I = 7/2 spin nuclei like 133Cs). These supplementary operators describe new quantum states, also called coherences, accessible to the nuclear magnetization by using specific pulse sequences [82,83,84]. By measuring the corresponding multi-quanta relaxation rates [85], it becomes possible to separately identify the contributions from the different relaxation mechanisms of confined quadrupolar nuclei [10,41,43,44,51,80,86]. Finally, by performing selective multi-quanta spin-locking relaxation measurements [85], one can extract dynamical information on confined fluids from the frequency variations of the relaxation rates of these additional coherences.
In the case of heavy water, the electrostatic field gradient felt by the deuterium atom is oriented along the O D director. As a consequence, the NMR relaxation rate of these deuterium atoms may be determined by the correlation time describing the reorientation of that O D director by reference with the static magnetic field. In bulk water, that correlation time is about 3.6 pico-seconds, leading to a NMR relaxation rate of 2.4 s 1 . By applying the same analysis to the NMR relaxation rate of confined water molecules, the measured relaxation rate (typically, 10 4 s 1 ; see Figure 7) requires reorientation correlation time of the O D director with an order of magnitude of 15 nano-seconds, i.e., three order of magnitude larger than the value measured by QENS (see Michot et al. [12]). That interpretation is, thus, invalid since it neglects the influence of confinement on the specific orientation of the confined water molecules (see Figure 6d), leading to the splitting of the deuterium resonance line (see Figure 6b,c). As a consequence, the decorrelation of the electric field gradient felt by the confined water molecules is incomplete until they remain confined inside the interlamellar space of the same clay sediment (see Figure 6a). By contrast, after desorption from one oriented micro-domain, the residual quadrupolar coupling vanishes and the long-time decrease of the correlation function monitoring the water quadrupolar coupling is then driven by the water residence time τ C , as displayed in Figure 6a.
In that context, a first set of 2H multi-quanta spin-locking relaxometry experiments were performed to determine the average residence time of water molecules confined within the interlamellar space of clay platelets forming aggregates (Figure 6a) of dense sediments of Na+-beidellite clay [80]. As illustrated in Figure 6b, the apparent splitting ν Q of the 2H resonance line varies as a function of the sediment orientation β L F into the static magnetic field, according to the expected relationship (Figure 6c):
ν Q ( β L F )   =   3 cos 2 β L F     1 2 ν Q ( 0 ) ,
where β L F is the angle between the direction of the static magnetic field and the normal n to the surface of the clay film. This residual splitting of the 2H NMR resonance line results from the specific orientation of the confined water molecules as illustrated by an equilibrium configuration of the confined ions and water molecules obtained by Grand Canonical Monte Carlo simulations (Figure 6d).
By measuring the specific relaxation rates of the so-called T 10 ( s ) , T 11 ( a , s ) , T 20 , and T 22 ( a , s ) coherences [82] of this I = 1 spin nucleus as a function of the sediment orientation into the static magnetic field (Figure 7), it becomes possible to quantify the relative contributions of the quadrupolar and heteronuclear dipolar NMR relaxation mechanisms [80]. Three specific angles (0°, 30°, and 90°) are then selected to determine the time evolution of four independent coherences (labeled T 11 ( s ) , T 21 ( a ) , T 21 ( s ) , and T 22 ( a ) [82,83,84] under spin-locking conditions by applying an irradiation field of calibrated irradiation power ω 1 . For I = 1/2 spin nuclei, such spin-locking relaxometry measurements probe only a single angular velocity ( 2 ω 1 ) for each irradiation power [77,78,79]. By contrast, in the presence of a residual quadrupolar coupling ( ω Q ), I = 1 spin nuclei probe three different angular velocities:
k 1   =   ω Q 2   +   4 ω 1 2 , k 2   =   ω Q   +   ω Q 2   +   4 ω 1 2 2 and k 3   =   ω Q   +   ω Q 2   +   4 ω 1 2 2 ,
for a single irradiation power ω 1 [82].
Some raw data are displayed in Figure 8 in addition to their Fourier transforms illustrating the specific angular velocities ( k 1 , k 2 , and k 3 ) probed by these spin-locking relaxometry measurements. As also illustrated by Equation (6), the three apparent velocities ( k 1 , k 2 and k 3 ) vary as a function of the sediment orientation which modulates the residual quadrupolar splitting ( ω Q ); see Equation (5). As a consequence, it becomes possible to investigate a broad dynamical range by using a limited number of irradiation powers ω 1 (see Figure 9). Figure 9 exhibits a transition between a plateau, at low angular velocities, and a power-law decrease, at high angular velocities [80]. By using the water self-diffusion coefficient of the confined water molecules previously determined by QENS measurements under equivalent conditions (see Section 2.2), numerical simulations of Brownian Dynamics are performed to determine the average residence time of water molecules confined within the interlamellar space between two beidellite platelets. That residence time fully corresponds [43] to the critical time τ C evaluated from the measured angular velocity ω C ( τ C   =   1 / ω C ; see Figure 9). This result illustrates how multi-quanta spin-locking NMR relaxometry of quadrupolar nuclei largely extends up to 10 4 s, the time-scale previously probed by QENS measurements.
The same spin-locking relaxometry measurements were performed by 7Li NMR spectroscopy to study the mobility of lithium counterions within aqueous dispersions of synthetic laponite clays [10]. Dense dispersions are prepared by uni-axial oedometric compression; more details are given in the Supplementary Materials. Above the Isotropic/Nematic phase transition [5], the 7Li NMR spectra exhibit a splitting of the resonance line (see Figure 10) that perfectly cancels at the so-called magic angle; see Equation (5). This behavior results from the occurrence of a single nematic phase, with a director parallel to the compression axis. Since 7Li is a I = 3/2 spin nucleus, six different angular velocities may now be probed by using 7Li NMR relaxometry with a single irradiation power ω 1 [84] (see Figure 11):
λ 1   =   ω Q 2   +   2 ω 1 ω Q   +   4 ω 1 2 λ 2   =   ω Q 2     2 ω 1 ω Q   +   4 ω 1 2 λ 3   =   ω 1   +   ω Q 2   +   4 ω 1 2   +   λ 1 λ 2 2 λ 4   =   ω 1   +   ω Q 2   +   4 ω 1 2     λ 1 λ 2 2 λ 5   =   ω 1     ω Q 2   +   4 ω 1 2   +   λ 1 λ 2 2 λ 6   =   ω 1     ω Q 2   +   4 ω 1 2     λ 1 λ 2 2 .
As illustrated in Figure 12, a broad range of angular velocities is then investigated by using a limited number of angular velocities. Figure 12 also exhibits the dispersion curve of the NMR relaxation rates. Here, we also detect a transition between a low-frequency plateau and a high-frequency continuous decrease.
Numerical simulations of Brownian Dynamics (BD) are then required to interpret these results. In order to reproduce ionic condensation on the clay surface, a mean force potential [73] is evaluated from preliminary Monte Carlo simulations of the distribution (see Figure 13) of thousands Lithium counterions neutralizing the negative charge of an isolated laponite platelet. By using the weak overlap approximation [68], BD simulations are further performed for modeling lithium diffusion within a collection of partially oriented laponite platelets. As illustrated in Figure 14, the decorrelation of the memory function, induced by the fluctuations of the quadrupolar relaxation mechanism [41], evolves according to a t 1 power law for diffusion time longer than 10 2 ns. This behavior results from the strong electrostatic coupling between the highly charged clay platelet and the lithium counterions trapped in the so-called condensation layer (see Figure 14). This phenomenon is responsible for the low frequency logarithmic decrease of the 7Li NMR relaxation rates displayed in Figure 12. As a consequence, two different confinements may be detected by NMR relaxometry within such solid/liquid interfacial systems, induced either by geometrical constraints, as in the case of water molecules adsorbed within the interlamellar space of dense sediments, or by energetic coupling, as in the case of ionic condensation within dilute clay dispersions.

2.4. Pulsed-Gradient Spin-Echo Attenuation

Attenuation of the NMR signal measured after an echo pulse-sequence encoded by using gradients of the static magnetic field leads to dynamical information on the mobility of the NMR probes in the direction parallel to the applied field gradient [87]. These attenuation measurements directly probe the Intermediate Scattering Function; see Equation (1) in the Supplementary Materials for wave-vectors q defined by the relationship:
q   =   γ δ G π ,
where γ is the gyromagnetic ratio of the NMR nucleus ( 2.6752   ×   10 8 rad/s for 1H and 1.037 ×   10 8 rad/s for 7Li), and δ is the duration of the applied field gradient and G its strength; see Figure S2 in the Supplementary Materials for more details.
Because of the maximum strength of the applied field gradient (typically, G m a x = 1.6 T/m) and its duration (typically, δ = 500 μ s), the maximum resolution defined as resolution m a x   =   1 / q m a x is not better than 15 μ m, thus corresponding to macroscopic mobility measurements. Since the magnetic field gradient may be applied along any direction within the sample, 1H PGSE NMR measurements were first performed to detect the Isotropic/Nematic phase transition of laponite aqueous dispersions [11,50,88] by measuring the anisotropy of the water self-diffusion tensor. These measurements were possible thanks to the great anisotropy of the laponite platelets (diameter∼300 Å, thickness∼10 Å). As illustrated in Figure 15, the Isotropic/Nematic transition of these laponite suspensions does not vary as a function of the neutralizing monovalent counterions and is well reproduced by numerical simulations of Brownian Dynamics mimicking water diffusion within a collection of partially oriented hard disks [50].
The same PGSE measurements were performed by 7Li NMR spectroscopy within aqueous dispersions of laponite platelets neutralized by lithium counterions. By contrast with the continuous decrease of the measured water mobility normalized by the bulk water mobility, Figure 16 exhibits a strong initial decrease of the lithium mobility by reference to its value measured within simple LiCl aqueous solutions. This phenomenon is the fingerprint of the ionic condensation of the lithium counterions at the surface of the highly charged laponite platelets. Numerical simulations of Brownian Dynamics may reproduce that phenomenon by including an effective mean force potential as described previously (see Figure 13). While these BD simulations agree perfectly with experimental data at low clay concentrations (see Figure 16), large differences appear at higher concentrations because of the limitation of the weak overlap approximation [68] implied in these BD simulations [50].
Because of the time scale required to build these magnetic field gradients (typically, 60 μ s), such PGSE measurements become inefficient to measure the mobility of water molecules or counterions confined within the interlamellar space of clay aggregates due to the corresponding enhancement of their transverse relaxation rates. A last illustration of the use of 1H PGSE concerns the analysis of anisotropy of water diffusion in compacted clay samples made of micrometer-sized kaolinite particles [51,52]; see the Supplementary Materials for more details. Since kaolinite is unswelling clay, these measurements are appropriate to detect the macroscopic mobility of the water molecules diffusing around the clay particles, leading to the so-called tortuosity factor [89,90]. In addition, this mobility is also strongly impacted by the preferential orientation of lamellar particles in the system (see Figures 18 and 19) [52]. These properties can be quantified based on X-Ray Scattering technique on bi-dimensional detector plate (2D-XRS) (see Figure 17) and the analysis of intensity distribution along the diffraction ring of the 001 reflection [52]. This measurement allows extracting the order parameter P 2 through the second order Legendre polynomial function [91], a parameter ranging from 0 for isotropic organization of particle to 1 if particles are perfectly oriented. The influence of preferred orientation for a constant porosity value can reveal a reduction of water mobility by a factor 2 when increasing anisotropy in particle orientation (see Figure 18). Such anisotropy in water mobility is well highlighted using 1H PGSE-NMR technique and can be quantitatively reproduced by DB simulations using virtual porous media mimicking the size, shape, and orientation of the particles in the porous media (see Figure 18). By accounting for the self-diffusion of water probes in the interparticle volume and elastic collisions with particle interfaces, the simulated data are found to well reproduce experimental measurements (see Figure 18 and Figure 19), thus allowing to decouple the contribution of porosity and particle orientation on the overall water diffusion process.

2.5. Magnetic Resonance Imaging

Magnetic Resonance Imaging (MRI) experiments were also performed by using 1H NMR spectroscopy to obtain long time-scale information on the macroscopic mobility of water molecules within clay porous media made of kaolinite particles [51]; see the Supplementary Materials for more details. The experimental conditions are selected to probe a total length of 25 mm. The porosity of the dry kaolinite sample ( ϕ d r y = 0.52) is evaluated by helium pycnometry [51]. The clay sample is initially saturated with bulk water, leading to a total length (noted L 1 ) of 12.3 mm (see Figure 20a). The MRI experiment starts just after the addition of a limited amount of heavy water (length L 2 = 7 mm) on the top of the hydrated clay sediment, leading to a total length (L = 19.3 mm) fitting the experimental window. As illustrated in Figure 20a, the 1H water concentration profiles exhibit some attenuation of the 1H NMR signal at the bottom of the clay sample because a significant section of the clay sample (5.3 mm) is located outside the optimal detection area of the detection coil. We also detect alterations of the water concentration profile near the clay/heavy water interfacial area, further limiting the useful length of the hydrated sample to 5 mm. By integrating the 1H NMR signal over the corresponding limited area (see Figure 21), we obtain information of the long time-scale, τ     ( 40   ±   2 )   ×   10 3 s, implied in this exchange between bulk and heavy water. Numerical simulation are performed [51] to fully validate that analysis (see Figure 20b and Figure 21) by using the porosity of the dry clay sample and the water mobility previously measured by 1H PGSE attenuation measurements (see Section 2.4 above). That result clearly illustrates how MRI experiments may be used as complementary tool to probe the mobility of confined molecules over a broad macroscopic time-scale (from minutes up to day).

2.6. Macroscopic Diffusion Experiments

Out-Diffusion experiments were performed to determine the time-scale characterizing the exchange between Ca2+, initially located in the interlayer of vermiculite disks and neutralizing its charge, and Na+ or Sr2+, present in aqueous solutions [53,54] (see Figure 22 and the Supplementary Materials for more details). Firstly, the resulting exchange rates between these counterions were well predicted by BD simulations using self-diffusion coefficients for interlayer and aqueous bulk cations, calculated from preliminary MD simulations and the geometry of both aqueous reservoir and vermiculite disks (see Figure 22a) in the case of the Ca2+/Na+ exchange [53]. The results of this study showed that the time-evolution of the concentration gradient of interlayer Ca2+ was the main driving force interpreting exchange rates measured at all aqueous reservoir salinity investigated, while limitation at the solid/liquid interface, due to diffusion in the aqueous reservoir, can acts as a limiting factor to interpret exchange rates measured at low salinity conditions. As displayed in Figure 22b, the same experimental data were also well reproduced by a classical finite-volume model based on continuous differential equations, constrained by a self-diffusion coefficient of the slowest interlayer cation. That approach uses also selectivity coefficients obtained independently in batch and describing the ionic exchange at thermodynamic equilibrium (see Ref. [54] for more details). Using the two numerical approaches (BD and classical finite-volume model based on continuous differential equations), data were always based on self-diffusion coefficients obtained from preliminary numerical simulations of Molecular Dynamics (MD) without the use of any fitted parameter [53,54]. As displayed in Figure 22, the agreement between experimental and numerical data validates the use of self-diffusion coefficients obtained from MD simulations to predict the dynamic of the exchange between interlayer cations and aqueous ones over several days (up to 20 days) and then the multi-scale approaches proposed.
As a second illustration of long-time diffusion process, Through-Diffusion experiments are commonly used to measure the flux of a tracer, traversing a compacted sample and to extract an effective diffusion coefficient. Such effective diffusion coefficient is directly linked to the pore diffusion parameter commonly derived from NMR measurements probing only the porosity accessible for the investigated probe. A large number of experiments were performed in literature to investigate the influence of porosity on the diffusion of water and ions in porous media made of clayey particles [69,92,93,94]. Water diffusion coefficients obtained using Through-Diffusion experiments and PGSE-NMR analyses performed with compacted kaolinite samples, characterized by the same porosity and preferential particle orientation, revealed similar results (see Figure 23), despite the different time scale probed by the two methods (i.e., ms for PGSE-NMR versus several days for Through-Diffusion [52]). This finding provides interesting information regarding representative time and length scales for the investigation of water dynamics in clay porous media. Moreover, this consistency allows taking advantage of both techniques for the study of clay/water interfaces. On the one hand PGSE-NMR cannot be used when sample contains paramagnetic elements, whereas Through-Diffusion is insensitive to the chemical composition of the sample. On the other hand, PGSE-NMR provides the full tensor of water dynamics whereas Through-Diffusion experiments requires to be repeated when changing the direction of diffusion probed. For the analysis of clay porous media with both interparticle and interlayer porosity (dual porosity media), Through-Diffusion was successfully applied on vermiculite to investigate the role played by the different types of porosities and preferential orientation of particle on water dynamics [55,94]. Among the large set of different numerical methods to interpret the experimental data [69,95,96], Asaad et al. [55] used BD simulations on representative virtual porous media to mimic the diffusion of water probes in both interparticle and interlayer volume, using self-diffusion coefficients extracted from MD simulations. The good agreement between experiments and simulations (see Figure 23) allowed highlighting the marginal role of interlayer volume on the flux of water tracer traversing samples, and the similar role of preferential orientation of particle when dealing with single or dual porosity media.

3. Conclusions

This review focuses on dynamical properties of the water molecules and neutralizing counterions confined within clay particles. By exploiting a large panel of complementary experimental studies, it becomes possible to investigate a large time scale varying between pico-second and days, implying local motions, as well as macroscopic displacements, within the clay aggregates. In addition to these experimental studies, we also performed multi-scale modeling of these clay/water interfacial systems in order to better extract dynamical information from the raw experimental data and further validate the conclusions of our analysis. This allowed deriving a complete bottom-up analysis of the dynamical properties of ions and water molecules confined within dense clay sediments. In that context, the interpretation of such complex dynamical phenomena is based on numerical modeling exploiting realistic models and dynamical information (residence time, local mobility) extracted from preliminary measurements performed on a smaller scale. Such complementary approaches should be useful for the analysis of other solid/liquid interfacial systems, such as cementeous and zeolitic materials, porous silicates, membranes and micelles, and aqueous dispersions of macromolecules and biopolymers.

Supplementary Materials

This Supplementary Material details the materials and the experimental methods presented in this review. The following are available at https://0-www-mdpi-com.brum.beds.ac.uk/article/10.3390/colloids5020034/s1. Figure S1: (a) X-ray diffraction measurements of the swelling of montmorillonite neutralized either by Na+ (blue) or by Ca2+ (red) counterions and dispersed respectively in NaCl or CaCl2 aqueous solutions. The data are issue from Ref. [1]. (b) Structures of kaolinite and swelling clays (montmorillonite, laponite, saponite, beidellite and vermiculite). Figure S2: Schematic view of the pulse sequence used to perform NMR Pulsed-Gradient Spin-Echo attenuation measurements in order to probe the influence of clay on the water and Li+ ions mobility. The red and blue arrows illustrate the time domains corresponding to the transverse (T2) and longitudinal (T1) attenuation of the intensity of the NMR signal (see text). Reprinted with permission from Ref. [2]. Copyright (2018) American Chemical Society. Figure S3: Schematic view of the pulse sequence used to perform Magnetic Resonance Imaging of the water concentration profiles within hydrated kaolinite sediments. Reprinted with permission from Ref. [2]. Copyright (2018) American Chemical Society.

Author Contributions

Conceptualization, P.P., A.D., E.F. and E.T.; investigation, P.P., A.A., T.D., B.D., A.D., E.F., F.H., M.J.-R., L.J.M., S.S. and E.T.; writing—original draft preparation, A.D.; writing—review and editing, P.P., A.D., E.F. and E.T.; visualization, P.P.; funding acquisition, A.D., E.F. and L.J.M. All authors have read and agreed to the published version of the manuscript.

Funding

The NMR spectrometers used in that study were purchased thanks to grants from Région Centre (France). This study was partially supported by grants from the CNRS Interdisciplinary Project “Nucléaire, Energie, Environnement, Déchets, Société (NEEDS)” through its “Milieux Poreux (MiPor)” Program, which provided financial support for the Projects MultiDyn, TransReac, and Darius.

Acknowledgments

The authors cordially thank A.M. Faugère for technical assistance with the NMR spectrometers and Badets for devising NMR specific probe (ICMN, Orléans, France).

Conflicts of Interest

The authors declare no conflict of interest.

Abbreviations

The following abbreviations are used in this manuscript:
BDBrownian Dynamics
DFTDensity Functional Theory
GCMCGrand Canonical Monte Carlo
GDOSGeneralized Density Of States
INSInelastic Neutron Scattering
MCMonte Carlo
MDMolecular Dynamics
MRIMagnetic Resonance Imaging
NMRNuclear Magnetic Resonance
ODOut-Diffusion
ODFOrientation Distribution Function
PGSEPulsed-Gradient Spin-Echo
QENSQuasi-Elastic Neutron Scattering
TDThrough-Diffusion
XRSX-Ray Scattering

References

  1. Li, H.; Teppen, B.J.; Johnston, C.T.; Boyd, S.A. Thermodynamics of nitroaromatic compound adsorption from water by smectite clay. Environ. Sci. Technol. 2004, 38, 5433–5442. [Google Scholar] [CrossRef] [PubMed]
  2. Ferrage, E.; Sakharov, B.A.; Michot, L.J.; Delville, A.; Bauer, A.; Lanson, B.; Grangeon, S.; Frapper, G.; Jiménez-Ruiz, M.; Cuello, G.J. Hydration properties and interlayer organization of water and ions in synthetic Na-smectite with tetrahedral layer charge. Part 2. Toward a precise coupling between molecular simulations and diffraction data. J. Phys. Chem. C 2011, 115, 1867–1881. [Google Scholar] [CrossRef]
  3. Fripiat, J.; Cases, J.; François, M.; Letellier, M. Thermodynamic and microdynamic behavior of water in clay suspensions and gels. J. Colloid Interface Sci. 1982, 89, 378–400. [Google Scholar] [CrossRef]
  4. Norrish, K. The swelling of montmorillonite. Discuss. Faraday Soc. 1954, 18, 120–134. [Google Scholar] [CrossRef]
  5. Mourchid, A.; Delville, A.; Lambard, J.; Lécolier, E.; Levitz, P. Phase diagram of colloidal dispersions of anisotropic charged particles: Equilibrium properties, structure, and rheology of Laponite suspensions. Langmuir 1995, 11, 1942–1950. [Google Scholar] [CrossRef]
  6. Pusch, R. Highly compacted sodium Bentonite for isolating rock-deposited radioactive waste products. Nucl. Technol. 1979, 45, 153–157. [Google Scholar] [CrossRef]
  7. Charlet, L.; Alt-Epping, P.; Wersin, P.; Gilbert, B. Diffusive transport and reaction in clay rocks: A storage (nuclear waste, CO2, H2), energy (shale gas) and water quality issue. Adv. Water Resour. 2017, 106, 39–59. [Google Scholar] [CrossRef] [Green Version]
  8. Buyukdagli, S.; Blossey, R. Dipolar correlations in structured solvents under nanoconfinement. J. Chem. Phys. 2014, 140, 234903. [Google Scholar] [CrossRef] [Green Version]
  9. Porion, P.; Faugère, A.M.; Lécolier, E.; Gherardi, B.; Delville, A. 23Na Nuclear quadrupolar relaxation as a probe of the microstructure and dynamics of aqueous clay dispersions: An application to Laponite gels. J. Phys. Chem. B 1998, 102, 3477–3485. [Google Scholar] [CrossRef]
  10. Porion, P.; Faugère, A.M.; Delville, A. 7Li NMR spectroscopy and multiquantum relaxation as a probe of the microstructure and dynamics of confined Li+ cations: An application to dense clay sediments. J. Phys. Chem. C 2008, 112, 9808–9821. [Google Scholar] [CrossRef]
  11. Porion, P.; Rodts, S.; Al-Mukhtar, M.; Faugère, A.M.; Delville, A. Anisotropy of the solvent self-diffusion tensor as a probe of nematic ordering within dispersion of nano-composite. Phys. Rev. Lett. 2001, 87, 208302. [Google Scholar] [CrossRef]
  12. Michot, L.J.; Delville, A.; Humbert, B.; Plazanet, M.; Levitz, P. Diffusion of water in a synthetic clay with tetrahedral charges by combined neutron time-of-flight measurements and molecular dynamics simulations. J. Phys. Chem. C 2007, 111, 9818–9831. [Google Scholar] [CrossRef]
  13. Porion, P.; Michot, L.J.; Faugère, A.M.; Delville, A. Influence of confinement on the long-range mobility of water molecules within clay aggregates: A 2H NMR analysis using spin-locking relaxation rates. J. Phys. Chem. C 2007, 111, 13117–13128. [Google Scholar] [CrossRef]
  14. Jiménez-Ruiz, M.; Ferrage, E.; Delville, A.; Michot, L.J. Anisotropy on the collective dynamics of water confined in swelling clay minerals. J. Phys. Chem. A 2012, 116, 2379–2387. [Google Scholar] [CrossRef] [PubMed]
  15. White, C.E.; Kearley, G.J.; Provis, J.L.; Riley, D.P. Structure of kaolinite and influence of stacking faults: Reconciling theory and experiment using inelastic neutron scattering analysis. J. Chem. Phys. 2013, 138, 194501. [Google Scholar] [CrossRef] [PubMed]
  16. Cygan, R.T.; Daemen, L.L.; Ilgen, A.G.; Krumhansl, J.L.; Nenoff, T.M. Inelastic neutron scattering and molecular simulation of the dynamics of interlayer water in smectite clay minerals. J. Phys. Chem. C 2015, 119, 28005–28019. [Google Scholar] [CrossRef]
  17. Michot, L.J.; Ferrage, E.; Delville, A.; Jiménez-Ruiz, M. Influence of layer charge, hydration state and cation nature on the collective dynamics of interlayer water in synthetic swelling clay minerals. Appl. Clay Sci. 2016, 119, 375–384. [Google Scholar] [CrossRef]
  18. Jiménez-Ruiz, M.; Ferrage, E.; Blanchard, M.; Fernandez-Castanon, J.; Delville, A.; Johnson, M.R.; Michot, L.J. Combination of inelastic neutron scattering experiments and ab initio quantum calculations for the study of the hydration properties of oriented saponites. J. Phys. Chem. C 2017, 121, 5029–5040. [Google Scholar] [CrossRef]
  19. Gates, W.P.; Seydel, T.; Bordallo, H.N. Layer charge effects on anisotropy of interlayer water and structural OH dynamics in clay minerals probed by high-resolution neutron spectroscopy. Appl. Clay Sci. 2021, 201, 105928. [Google Scholar] [CrossRef]
  20. Cebula, D.J.; Thomas, R.K.; White, J.W. Diffusion of water in Li-Montmorillonite studied by quasielastic neutron scattering. Clays Clay Miner. 1981, 29, 241–248. [Google Scholar] [CrossRef]
  21. Tuck, J.J.; Hall, P.L.; Hayes, M.H.B.; Ross, D.K.; Hayter, J.B. Quasi-elastic neutron-scattering studies of intercalated molecules in charge-deficient layer silicates. Part 2—High-resolution measurements of the diffusion of water in montmorillonite and vermiculite. J. Chem. Soc. Faraday Trans. 1 1985, 81, 833–846. [Google Scholar] [CrossRef]
  22. Poinsignon, C. Protonic conductivity and water dynamics in swelling clays. Solid State Ionics 1997, 97, 399–407. [Google Scholar] [CrossRef]
  23. Swenson, J.; Bergman, R.; Longeville, S. A neutron spin-echo study of confined water. J. Chem. Phys. 2001, 115, 11299–11305. [Google Scholar] [CrossRef]
  24. Mamontov, E. Comment on “Quasielastic neutron scattering of two-dimensional water in a vermiculite clay” [J. Chem. Phys. 113, 2873 (2000)] and “A neutron spin-echo study of confined water” [J. Chem. Phys. 115, 11299 (2001)]. J. Chem. Phys. 2004, 121, 9193–9194. [Google Scholar] [CrossRef]
  25. Malikova, N.; Cadéne, A.; Marry, V.; Dubois, E.; Turq, P.; Zanotti, J.M.; Longeville, S. Diffusion of water in clays—microscopic simulation and neutron scattering. Chem. Phys. 2005, 317, 226–235. [Google Scholar] [CrossRef]
  26. Malikova, N.; Cadène, A.; Marry, V.; Dubois, E.; Turq, P. Diffusion of water in clays on the microscopic scale: Modeling and experiment. J. Phys. Chem. B 2006, 110, 3206–3214. [Google Scholar] [CrossRef]
  27. Skipper, N.T.; Lock, P.A.; Titiloye, J.O.; Swenson, J.; Mirza, Z.A.; Howells, W.S.; Fernandez-Alonso, F. The structure and dynamics of 2-dimensional fluids in swelling clays. Chem. Geol. 2006, 230, 182–196. [Google Scholar] [CrossRef] [Green Version]
  28. Michot, L.J.; Ferrage, E.; Jiménez-Ruiz, M.; Boehm, M.; Delville, A. Anisotropic features of water and ion dynamics in synthetic Na- and Ca-smectites with tetrahedral layer charge. A combined Quasi-Elastic Neutron-Scattering and Molecular Dynamics simulations study. J. Phys. Chem. C 2012, 116, 16619–16633. [Google Scholar] [CrossRef]
  29. Marry, V.; Dubois, E.; Malikova, N.; Breu, J.; Haussler, W. Anisotropy of water dynamics in clays: Insights from molecular simulations for experimental QENS analysis. J. Phys. Chem. C 2013, 117, 15106–15115. [Google Scholar] [CrossRef]
  30. Berg, M.C.; Dalby, K.N.; Tsapatsaris, N.; Okhrimenko, D.V.; Sørensen, H.O.; Jha, D.; Embs, J.P.; Stipp, S.L.S.; Bordallo, H.N. Water mobility in chalk: A quasielastic neutron scattering study. J. Phys. Chem. C 2017, 121, 14088–14095. [Google Scholar] [CrossRef]
  31. Korb, J.; Xu, S.; Jonas, J. Confinement effects on dipolar relaxation by translational dynamics of liquids in porous silica glasses. J. Chem. Phys. 1993, 98, 2411–2422. [Google Scholar] [CrossRef]
  32. Koziol, P.; Nelson, S.; Jonas, J. Low-dimensional effects on frequency dependence of proton NMR relaxation in liquid cyclohexane confined to porous glasses. Chem. Phys. Lett. 1993, 201, 383–386. [Google Scholar] [CrossRef]
  33. Stapf, S.; Kimmich, R.; Seiter, R.O. Proton and deuteron field-cycling NMR relaxometry of liquids in porous glasses: Evidence for Lévy-walk statistics. Phys. Rev. Lett. 1995, 75, 2855–2858. [Google Scholar] [CrossRef]
  34. Levitz, P. From Knudsen diffusion to Levy walks. Europhys. Lett. 1997, 39, 593–598. [Google Scholar] [CrossRef]
  35. Korb, J.P.; Whaley-Hodges, M.; Bryant, R.G. Translational diffusion of liquids at surfaces of microporous materials: Theoretical analysis of field-cycling magnetic relaxation measurements. Phys. Rev. E 1997, 56, 1934–1945. [Google Scholar] [CrossRef]
  36. Zavada, T.; Kimmich, R. The anomalous adsorbate dynamics at surfaces in porous media studied by nuclear magnetic resonance methods. The orientational structure factor and Lévy walk. J. Chem. Phys. 1998, 109, 6929–6939. [Google Scholar] [CrossRef]
  37. Zavada, T.; Kimmich, R.; Grandjean, J.; Kobelkov, A. Field-cycling NMR relaxometry of water in synthetic saponites: Lévy walks on finite planar surfaces. J. Chem. Phys. 1999, 110, 6977–6981. [Google Scholar] [CrossRef]
  38. Levitz, P.; Korb, J.P.; Bryant, R.G. Molecular diffusion in disordered interfacial media as probed by pulsed field gradients and nuclear magnetic relaxation dispersion. J. Chim. Phys. 1999, 96, 1494–1505. [Google Scholar] [CrossRef]
  39. Kimmich, R.; Anoardo, E. Field-cycling NMR relaxometry. Prog. Nucl. Magn. Reson. Spectrosc. 2004, 44, 257–320. [Google Scholar] [CrossRef]
  40. Porion, P.; Michot, L.J.; Faugère, A.M.; Delville, A. Structural and dynamical properties of the water molecules confined in dense clay sediments: A study combining 2H NMR spectroscopy and multiscale numerical modeling. J. Phys. Chem. C 2007, 111, 5441–5453. [Google Scholar] [CrossRef]
  41. Porion, P.; Faugère, A.M.; Delville, A. Long-time scale ionic dynamics in dense clay sediments measured by the frequency variation of the 7Li multiple-quantum NMR relaxation rates in relation with a multiscale modeling. J. Phys. Chem. C 2009, 113, 10580–10597. [Google Scholar] [CrossRef]
  42. Korb, J.P. Nuclear magnetic relaxation of liquids in porous media. New J. Phys. 2011, 13, 035016. [Google Scholar] [CrossRef] [Green Version]
  43. Porion, P.; Michot, L.J.; Warmont, F.; Faugère, A.M.; Delville, A. Long-time dynamics of confined water molecules probed by 2H NMR multiquanta relaxometry: An application to dense clay sediments. J. Phys. Chem. C 2012, 116, 17682–17697. [Google Scholar] [CrossRef]
  44. Porion, P.; Warmont, F.; Faugère, A.M.; Rollet, A.L.; Dubois, E.; Marry, V.; Michot, L.J.; Delville, A. 133Cs Nuclear Magnetic Resonance relaxometry as a probe of the mobility of cesium cations confined within dense clay sediments. J. Phys. Chem. C 2015, 119, 15360–15372. [Google Scholar] [CrossRef]
  45. Zaburdaev, V.; Denisov, S.; Klafter, J. Lévy walks. Rev. Mod. Phys. 2015, 87, 483–530. [Google Scholar] [CrossRef] [Green Version]
  46. Porion, P.; Faugère, A.M.; Rollet, A.L.; Dubois, E.; Marry, V.; Michot, L.J.; Delville, A. Influence of strong confinement on the structure and dynamics of liquids: A study of the clay/water interface exploiting 2H NMR spectroscopy and spin-locking relaxometry. J. Phys. Chem. C 2018, 122, 16830–16841. [Google Scholar] [CrossRef]
  47. Bowers, G.M.; Loring, J.S.; Schaef, H.T.; Cunniff, S.S.; Walter, E.D.; Burton, S.D.; Larsen, R.K.; Miller, Q.R.S.; Bowden, M.E.; Ilton, E.S.; et al. Chemical trapping of CO2 by clay minerals at reservoir conditions: Two mechanisms observed by in situ high-pressure and -temperature experiments. ACS Earth Space Chem. 2019, 3, 1034–1046. [Google Scholar] [CrossRef]
  48. Bowers, G.M.; Loring, J.S.; Walter, E.D.; Burton, S.D.; Bowden, M.E.; Hoyt, D.W.; Arey, B.; Larsen, R.K.; Kirkpatrick, R.J. Influence of smectite structure and hydration on supercritical methane binding and dynamics in smectite pores. J. Phys. Chem. C 2019, 123, 29231–29244. [Google Scholar] [CrossRef]
  49. Nanda, R.; Bowers, G.M.; Loganathan, N.; Burton, S.D.; Kirkpatrick, R.J. Temperature dependent structure and dynamics in smectite interlayers: 23Na MAS NMR spectroscopy of Na-hectorite. RSC Adv. 2019, 9, 12755–12765. [Google Scholar] [CrossRef] [Green Version]
  50. Porion, P.; Faugère, A.M.; Delville, A. 1H and 7Li NMR pulsed gradient spin echo measurements and multiscale modeling of the water and ionic mobility within aqueous dispersions of charged anisotropic nanoparticles. J. Phys. Chem. C 2008, 112, 11893–11900. [Google Scholar] [CrossRef]
  51. Porion, P.; Ferrage, E.; Hubert, F.; Tertre, E.; Dabat, T.; Faugère, A.M.; Condé, F.; Warmont, F.; Delville, A. Water mobility within compacted clay samples: Multi-scale analysis exploiting 1H NMR Pulsed Gradient Spin Echo and Magnetic Resonance Imaging of water density profiles. ACS Omega 2018, 3, 7399–7406. [Google Scholar] [CrossRef] [Green Version]
  52. Dabat, T.; Porion, P.; Hubert, F.; Paineau, E.; Dazas, B.; Grégoire, B.; Tertre, E.; Delville, A.; Ferrage, E. Influence of preferred orientation of clay particles on the diffusion of water in kaolinite porous media at constant porosity. Appl. Clay Sci. 2020, 184, 105354. [Google Scholar] [CrossRef]
  53. Tertre, E.; Delville, A.; Prêt, D.; Hubert, F.; Ferrage, E. Cation diffusion in the interlayer space of swelling clay minerals—A combined macroscopic and microscopic study. Geochim. Cosmochim. Acta 2015, 149, 251–267. [Google Scholar] [CrossRef]
  54. Tertre, E.; Dazas, B.; Asaad, A.; Ferrage, E.; Grégoire, B.; Hubert, F.; Delville, A.; Delay, F. Connecting molecular simulations and laboratory experiments for the study of time-resolved cation-exchange process in the interlayer of swelling clay minerals. Appl. Clay Sci. 2021, 200, 105913. [Google Scholar] [CrossRef]
  55. Asaad, A.; Hubert, F.; Ferrage, E.; Dabat, T.; Paineau, E.; Porion, P.; Savoye, S.; Gregoire, B.; Dazas, B.; Delville, A.; et al. Role of interlayer porosity and particle organization in the diffusion of water in swelling clays. Appl. Clay Sci. 2021, 207, 106089. [Google Scholar] [CrossRef]
  56. Rinnert, E.; Carteret, C.; Humbert, B.; Fragneto-Cusani, G.; Ramsay, J.D.F.; Delville, A.; Robert, J.L.; Bihannic, I.; Pelletier, M.; Michot, L.J. Hydration of a synthetic clay with tetrahedral charges: A multidisciplinary experimental and numerical study. J. Phys. Chem. B 2005, 109, 23745–23759. [Google Scholar] [CrossRef]
  57. Dazas, B.; Ferrage, E.; Delville, A.; Lanson, B. Interlayer structure model of tri-hydrated low-charge smectite by X-ray diffraction and Monte Carlo modeling in the Grand Canonical ensemble. Am. Mineral. 2014, 99, 1724–1735. [Google Scholar] [CrossRef] [Green Version]
  58. Pellenq, R.J.M.; Caillol, J.M.; Delville, A. Electrostatic attraction between two charged surface: A (N,V,T) Monte Carlo simulation. J. Phys. Chem. B 1997, 101, 8584–8594. [Google Scholar] [CrossRef]
  59. Delville, A.; Gasmi, N.; Pellenq, R.J.M.; Caillol, J.M.; Van Damme, H. Correlations between the stability of charged interfaces and ionic exchange capacity: A Monte Carlo study. Langmuir 1998, 14, 5077–5082. [Google Scholar] [CrossRef]
  60. Michot, L.J.; Bihannic, I.; Porsch, K.; Maddi, S.; Baravian, C.; Mougel, J.; Levitz, P. Phase diagrams of Wyoming Na-montmorillonite clay. Influence of particle anisotropy. Langmuir 2004, 20, 10829–10837. [Google Scholar] [CrossRef] [PubMed]
  61. Boek, E.S.; Sprik, M. Ab Initio molecular dynamics study of the hydration of a sodium smectite clay. J. Phys. Chem. B 2003, 107, 3251–3256. [Google Scholar] [CrossRef]
  62. Suter, J.L.; Boek, E.S.; Sprik, M. Adsorption of a sodium ion on a smectite clay from constrained ab initio Molecular Dynamics simulations. J. Phys. Chem. C 2008, 112, 18832–18839. [Google Scholar] [CrossRef]
  63. Delville, A. Modeling the clay water interface. Langmuir 1991, 7, 547–555. [Google Scholar] [CrossRef]
  64. Cygan, R.T.; Liang, J.J.; Kalinichev, A.G. Molecular models of hydroxide, oxyhydroxide, and clay phases and the development of a general force field. J. Phys. Chem. B 2004, 108, 1255–1266. [Google Scholar] [CrossRef]
  65. Marry, V.; Dubois, E.; Malikova, N.; Durand-Vidal, S.; Longeville, S.; Breu, J. Water dynamics in Hectorite clays: Influence of temperature studied by coupling neutron spin echo and molecular dynamics. Environ. Sci. Technol. 2011, 45, 2850–2855. [Google Scholar] [CrossRef] [PubMed]
  66. Abramov, A.; Iglauer, S. Application of the CLAYFF and the DREIDING force fields for modeling of alkylated quartz surfaces. Langmuir 2019, 35, 5746–5752. [Google Scholar] [CrossRef]
  67. Van Gunsteren, W.F.; Berendsen, H.J.C.; Rullmann, J.A.C. Stochastic dynamics for molecules with constraints—Brownian dynamics of n-alkanes. Mol. Phys. 1981, 44, 69–95. [Google Scholar] [CrossRef]
  68. Israelachvili, J.N. Intermolecular and Surface Forces, 1st ed.; Academic Press: New York, NY, USA, 1985. [Google Scholar]
  69. Tournassat, C.; Steefel, C.I. Reactive transport modeling of coupled processes in nanoporous media. Rev. Mineral. Geochem. 2019, 85, 75–109. [Google Scholar] [CrossRef] [Green Version]
  70. Dazas, B.; Lanson, B.; Delville, A.; Robert, J.L.; Komarneni, S.; Michot, L.J.; Ferrage, E. Influence of tetrahedral layer charge on the organization of interlayer water and ions in synthetic Na-saturated smectites. J. Phys. Chem. C 2015, 119, 4158–4172. [Google Scholar] [CrossRef]
  71. Adams, D.J. Chemical potential of hard-sphere fluids by Monte Carlo methods. Mol. Phys. 1974, 28, 1241–1252. [Google Scholar] [CrossRef]
  72. Allen, M.P.; Tildesley, D.J. Computer Simulation of Liquids; Clarendon Press: Oxford, UK, 1994. [Google Scholar]
  73. Hansen, J.P.; McDonald, I.R. Theory of Simple Liquids, 2nd ed.; Academic Press: London, UK, 1990. [Google Scholar]
  74. Schoen, M.; Cushman, J.H.; Diestler, D.J.; Rhykerd, C.L., Jr. Fluids in micropores. II. Self-Diffusion in a simple classical fluid in a slit pore. J. Chem. Phys. 1988, 88, 1394–1406. [Google Scholar] [CrossRef]
  75. Kimmich, R. NMR: Tomography, Diffusometry, Relaxometry, 1st ed.; Springer: Berlin, Germany, 1997. [Google Scholar]
  76. Korb, J.P. Multiscale nuclear magnetic relaxation dispersion of complex liquids in bulk and confinement. Prog. Nucl. Magn. Reson. Spectrosc. 2018, 104, 12–55. [Google Scholar] [CrossRef]
  77. Delville, A.; Letellier, M. Structure and dynamics of simple liquids in heterogeneous condition: An NMR study of the clay-water interface. Langmuir 1995, 11, 1361–1367. [Google Scholar] [CrossRef]
  78. Korb, J.P.; Malier, L.; Cros, F.; Xu, S.; Jonas, J. Surface dynamics of liquids in nanopores. Phys. Rev. Lett. 1996, 77, 2312–2315. [Google Scholar] [CrossRef] [PubMed]
  79. Fleury, M.; Canet, D. Water orientation in smectites using NMR nutation experiments. J. Phys. Chem. C 2014, 118, 4733–4740. [Google Scholar] [CrossRef]
  80. Porion, P.; Faugère, A.M.; Delville, A. Structural and dynamical properties of water molecules confined within clay sediments probed by deuterium NMR spectroscopy, multiquanta relaxometry, and two-time stimulated echo attenuation. J. Phys. Chem. C 2014, 118, 20429–20444. [Google Scholar] [CrossRef]
  81. Bowden, G.J.; Hutchison, W.D.; Khachan, J. Tensor operator formalism for multiple-quantum NMR. 2. Spins-3/2, spin-2, and spin-5/2 and general I. J. Magn. Reson. 1986, 67, 415–437. [Google Scholar] [CrossRef]
  82. Van der Maarel, J.R.C. The relaxation dynamics of spin I=1 nuclei with a static quadrupolar coupling and a radio-frequency field. J. Chem. Phys. 1993, 99, 5646–5653. [Google Scholar] [CrossRef]
  83. Van der Maarel, J.R.C. Thermal relaxation and coherence dynamics of spin 3/2. I. Static and fluctuating quadrupolar interactions in the multipole basis. Concepts Magn. Reson. Part A 2003, 19, 97–116. [Google Scholar] [CrossRef]
  84. Van der Maarel, J.R.C. Thermal relaxation and coherence dynamics of spin 3/2. II. Strong radio-frequency field. Concepts Magn. Reson. Part A 2003, 19A, 117–133. [Google Scholar] [CrossRef]
  85. Porion, P.; Delville, A. Multi-Quanta spin-locking Nuclear Magnetic Resonance relaxation measurements: An analysis of the long-time dynamical properties of ions and water molecules confined within dense clay sediments. Magnetochemistry 2017, 3, 35. [Google Scholar] [CrossRef] [Green Version]
  86. Porion, P.; Faugère, A.M.; Delville, A. Multiscale water dynamics within dense clay sediments probed by 2H multiquanta NMR relaxometry and two-time stimulated echo NMR spectroscopy. J. Phys. Chem. C 2013, 117, 26119–26134. [Google Scholar] [CrossRef]
  87. Callaghan, P.T. Principles of Nuclear Magnetic Resonance Microscopy; Clarendon Press: Oxford, UK, 1991. [Google Scholar]
  88. Porion, P.; Al-Mukhtar, M.; Faugère, A.M.; Pellenq, R.J.M.; Meyer, S.; Delville, A. Water self-diffusion within nematic dispersion of nanocomposites: A multiscale analysis of 1H pulsed gradient spin-echo NMR measurements. J. Phys. Chem. B 2003, 107, 4012–4023. [Google Scholar] [CrossRef]
  89. Latour, L.L.; Mitra, P.P.; Kleinberg, R.L.; Sotak, C.H. Time-dependent diffusion coefficient of fluids in porous media as a probe of surface-to-volume ratio. J. Magn. Reson. Ser. A 1993, 101, 342–346. [Google Scholar] [CrossRef]
  90. Latour, L.L.; Kleinberg, R.L.; Mitra, P.P.; Sotak, C.H. Pore-size distributions and tortuosity in heterogeneous porous media. J. Magn. Reson. Ser. A 1995, 112, 83–91. [Google Scholar] [CrossRef]
  91. Dabat, T.; Hubert, F.; Paineau, E.; Launois, P.; Leforest, C.; Grégoire, B.; Dazas, B.; Tertre, E.; Delville, A.; Ferrage, E. A general orientation distribution function for clay-rich media. Nat. Commun. 2019, 10, 5456. [Google Scholar] [CrossRef]
  92. Bourg, I.C.; Bourg, A.C.; Sposito, G. Modeling diffusion and adsorption in compacted bentonite: A critical review. J. Contam. Hydrol. 2003, 61, 293–302. [Google Scholar] [CrossRef]
  93. Bourg, I.C.; Tournassat, C. Chapter 6—Self-Diffusion of Water and Ions in Clay Barriers. In Natural and Engineered Clay Barriers; Tournassat, C., Steefel, C.I., Bourg, I.C., Bergaya, F., Eds.; Elsevier: Amsterdam, The Netherlands, 2015; Volume 6: Developments in Clay Science, pp. 189–226. [Google Scholar] [CrossRef]
  94. Tertre, E.; Savoye, S.; Hubert, F.; Prêt, D.; Dabat, T.; Ferrage, E. Diffusion of water through the dual-porosity swelling clay mineral vermiculite. Environ. Sci. Technol. 2018, 52, 1899–1907. [Google Scholar] [CrossRef] [PubMed]
  95. Churakov, S.V.; Gimmi, T. Up-scaling of molecular diffusion coefficients in clays: A two-step approach. J. Phys. Chem. C 2011, 115, 6703–6714. [Google Scholar] [CrossRef]
  96. Tyagi, M.; Gimmi, T.; Churakov, S.V. Multi-scale micro-structure generation strategy for up-scaling transport in clays. Adv. Water Resour. 2013, 59, 181–195. [Google Scholar] [CrossRef]
Figure 1. Schematic view of the time-scales probed by the various experimental methods (blue) and the numerical modeling (green).
Colloids 05 00034 g001
Figure 2. (a) X-ray diffraction measurements of the swelling of montmorillonite neutralized either by Na+ (blue) or by Ca2+ (red) counterions and dispersed, respectively, in NaCl or CaCl 2 aqueous solutions. The data are issue from Ref. [4]; (b) Structures of kaolinite and swelling clays (montmorillonite, laponite, saponite, beidellite, and vermiculite).
Colloids 05 00034 g002
Figure 3. Comparison between the experimental G D O S w a t e r ( ω ) and simulated g H w a t e r ( ω ) , see Equation (2), for INS spectra of hydrated saponite sediments along the directions parallel (a) and perpendicular (b) to the clay layers (see text). Reprinted with permission from Ref. [18]. Copyright (2017) American Chemical Society.
Colloids 05 00034 g003
Figure 4. Time evolution of the Intermediate Scattering Function, in Equation (3), evaluated by numerical simulations of Molecular Dynamics for hydrated samples of saponite neutralized by Na+ counterions, along the directions parallel (a) and perpendicular (b) to the clay layers. Reprinted with permission from Ref. [28]. Copyright (2012) American Chemical Society.
Colloids 05 00034 g004
Figure 5. Direct comparison between experimental Quasi-Elastic Neutron Scattering spectra (open circles) and their numerical counterpart (red line) evaluated by MD simulations. Data were obtained for low-charge (0.8 e/uc) synthetic saponite in the direction parallel (bottom) or perpendicular (top) to the clay layer and for (a) mono-hydrated state and (b) bi-hydrated state. Reprinted with permission from Ref. [28]. Copyright (2012) American Chemical Society.
Colloids 05 00034 g005
Figure 6. (a) Schematic view of the multi-scale organization of the hydrated clay-sediment induced by the coexistence of various micro-domains resulting from the stacking of hydrated clay platelets; (b) variation of the 2H NMR spectra of the confined water molecules as a function of the sediment orientation in the static magnetic field; (c) variation of the residual quadrupolar splitting (see Equation (5)), extracted from the spectra displayed in Figure 6b; (d) snapshot illustrating one equilibrium configuration obtained by Grand Canonical Monte Carlo simulations of the water molecules and neutralizing Na+ counterions confined between fragments of saponite platelets. Reprinted with permission from Ref. [80]. Copyright (2014) American Chemical Society.
Colloids 05 00034 g006
Figure 7. Variation of the relaxation rate of the T 10 , T 11 ( a , s ) , T 20 , and T 22 ( a , s ) coherences, noted R 10 , R 11 ( a , s ) , R 20 , and R 22 ( a , s ) , respectively, as a function of the orientation β L F of the clay film into the static magnetic field. Reprinted with permission from Ref. [80]. Copyright (2014) American Chemical Society.
Colloids 05 00034 g007
Figure 8. Time evolution of (a) T 11 ( s ) ; (b) T 21 ( a ) ; (c) T 21 ( s ) and (d) T 22 ( a ) coherences measured under spin-locking conditions, noted T 11 ρ ( s ) , T 21 ρ ( a ) , T 21 ρ ( s ) and T 22 ρ ( a ) , respectively, and their Fourier transforms for (e) T 11 ( s ) ; (f) T 21 ( a ) ; (g) T 21 ( s ) and (h) T 22 ( a ) coherences (2H NMR). These Fourier transforms better illustrate the contribution from the characteristic angular velocities k i ; see Equation (6). Reprinted with permission from Ref. [80]. Copyright (2014) American Chemical Society.
Colloids 05 00034 g008
Figure 9. Dispersion curve determined from the variation of the quadrupolar and heteronuclear dipolar contributions to the relaxation of the T 11 ( s ) , T 21 ( a ) , T 21 ( s ) , and T 22 ( a ) , 2H coherences measured under spin-locking conditions. Reprinted with permission from Ref. [80]. Copyright (2014) American Chemical Society.
Colloids 05 00034 g009
Figure 10. Variation of the 7Li NMR spectra measured within laponite aqueous dispersion as a function of the orientation of the clay sample in the static magnetic field. Reprinted with permission from Ref. [10]. Copyright (2008) American Chemical Society.
Colloids 05 00034 g010
Figure 11. Fourier transform of the time evolution of the 7Li coherences, (a) T 11 ( a ) ; (b) T 11 ( s ) ; (c) T 33 ( s ) and (d) T 33 ( a ) , under spin-locking conditions, illustrating the whole set of characteristic angular velocities k i ; see Equation (7). Reprinted with permission from Ref. [41]. Copyright (2009) American Chemical Society.
Colloids 05 00034 g011
Figure 12. Illustration of the frequency domain probed by time evolution of the T 33 ( a , s ) coherences under spin-locking conditions, leading to the dispersion curve of the 7Li NMR relaxation rate. Reprinted with permission from Ref. [41]. Copyright (2009) American Chemical Society.
Colloids 05 00034 g012
Figure 13. Ionic concentration profiles evaluated by Monte Carlo numerical simulations illustrating Li+ ions condensation around an isolated laponite platelet. Reprinted with permission from Ref. [41]. Copyright (2009) American Chemical Society.
Colloids 05 00034 g013
Figure 14. Numerical modeling of the memory function quantifying the decorrelation of the quadrupolar coupling felt by Li+ counterions diffusing within a dense sediment resulting from the collection of partially oriented laponite platelets. Reprinted with permission from Ref. [41]. Copyright (2009) American Chemical Society.
Colloids 05 00034 g014
Figure 15. Influence of the clay concentration on the water self-diffusion tensor measured within laponite aqueous dispersion by using 1H NMR Pulsed-Gradient Spin-Echo attenuation. Reprinted with permission from Ref. [50]. Copyright (2008) American Chemical Society.
Colloids 05 00034 g015
Figure 16. Influence of the clay concentration on the lithium ions self-diffusion tensor measured within laponite aqueous dispersion by using 7Li NMR Pulsed-Gradient Spin-Echo attenuation. Reprinted with permission from Ref. [50]. Copyright (2008) American Chemical Society.
Colloids 05 00034 g016
Figure 17. Determination of the orientation distribution functions of kaolinite particles within centrifuged clay samples by using 2D X-Ray Scattering patterns analysis. The longitudinal direction corresponds to the compression axis of the clay sample. (a) Schematic view of the experimental setup; (b) experimental 2D-XRS patterns and (c) orientation distribution functions (ODF) from the angular scan of the 001 reflection extracted from the 2D-XRS patterns. Reprinted from Ref. [52]. Copyright (2020), with permission from Elsevier.
Colloids 05 00034 g017
Figure 18. Components of the water self-diffusion tensor measured by 1H NMR PGSE attenuation within compressed and centrifugated kaolinite clay samples. Numerical simulations of Brownian Dynamics are used to simulate the water self-diffusion tensor within virtual porous media, shown as inserts, mimicking these clay samples (see text). Reprinted from Ref. [52]. Copyright (2020), with permission from Elsevier.
Colloids 05 00034 g018
Figure 19. Influence of the preferred orientation of particles P 2 on the water self-diffusion tensor measured (red) and simulated (blue) within a collection of clay samples with the same porosity. The z-direction is perpendicular to the preferred alignment of clay platelets. Reprinted from Ref. [52]. Copyright (2020), with permission from Elsevier.
Colloids 05 00034 g019
Figure 20. Time evolution of the water concentration profiles within water saturated kaolinite sample after addition of external heavy water. The experimental profiles are obtained by using 1H Magnetic Resonance Imaging (a) and compared to numerical data obtained by Brownian Dynamics (b). Reprinted with permission from Ref. [51]. Copyright (2018) American Chemical Society.
Colloids 05 00034 g020
Figure 21. Direct comparison of the time evolutions of the measured and simulated numbers of confined water molecules. Experimental and numerical data are fitted by a biexponential law: f ( t )   =   m 1 exp ( t / m 2 )   +   ( 1     m 1     m 4 ) exp ( t / m 3 )   +   m 4 , where m i are constants. Reprinted with permission from Ref. [51]. Copyright (2018) American Chemical Society.
Colloids 05 00034 g021
Figure 22. Macroscopic diffusion measurements of the (a) Ca2+-for-Na+ and (b) Ca2+-for-Sr2+ exchange within single centimeter-sized vermiculite disks. The continuous lines are obtained by (a) BD simulations and (b) a finite-volume model, both taking into account interlayer self-diffusion coefficients obtained by MD simulations. The numerical value annotated next to each curve corresponds to the salinity of the aqueous reservoir. Reprinted from Refs. [53,54]. Copyright (2015 and 2021), with permission from Elsevier.
Colloids 05 00034 g022
Figure 23. Influence of the particle orientation and interlayer porosity on the apparent mobility of water molecules (i.e., effective diffusion coefficient) diffusing through clay porous media in the direction perpendicular to the preferred orientation of the clay particles. Data are normalized to the self-diffusion coefficient of water in bulk solution. The data obtained for kaolinite (single porosity of ∼0.26) by 1H NMR PGSE attenuation (empty yellow triangle) and TD experiments (full yellow triangle) are taken from Asaad et al. [55] and Tertre et al. [94], respectively. TD data obtained for vermiculite (dual porosity) for a similar interparticle porosity are shown as full red circles [55]. Experimental data are compared with results from BD simulations (empty squares) taking into account interlayer diffusion (orange symbols) or only the mobility in the interparticle volume (black symbols) [55]. Reprinted from Ref. [55]. Copyright (2021), with permission from Elsevier.
Colloids 05 00034 g023
Table 1. Water dynamical parameters, D / / and D , respectively, the self-diffusion coefficient defined in the direction parallel and perpendicular to the clay surface, deduced from MD simulations for all samples investigated at 300 K. The data are from Table 3 in the Ref. [28] with permission from Ref. [28]. Copyright (2012) American Chemical Society.
Sample D / / (10 10 m 2 · s 1 ) D (10 10 m 2 · s 1 )
Na+-saponite 0.8 e/uc-1W2.4 ± 0.20
Na+-saponite 0.8 e/uc-2W7.2 ± 0.503.0 ± 1.0
Na+-saponite 1.4 e/uc-1W0.6 ± 0.05
Na+-saponite 1.4 e/uc-2W3.1 ± 0.102.0 ± 0.5
Ca2+-saponite 0.8 e/uc-1W1.6 ± 0.20
Ca2+-saponite 0.8 e/uc-2W6.5 ± 0.303.0 ± 1.0
Ca2+-saponite 1.4 e/uc-1W0.3 ± 0.05
Ca2+-saponite 1.4 e/uc-2W2.4 ± 0.102.0 ± 0.5
Publisher’s Note: MDPI stays neutral with regard to jurisdictional claims in published maps and institutional affiliations.

