A Simple, Label-Free, and High-Throughput Method to Evaluate the Epigallocatechin-3-Gallate Impact in Plasma Molecular Profile

 , , , and
Abstract
:1. Introduction
2. Materials and Methods
2.1. Biological Assay
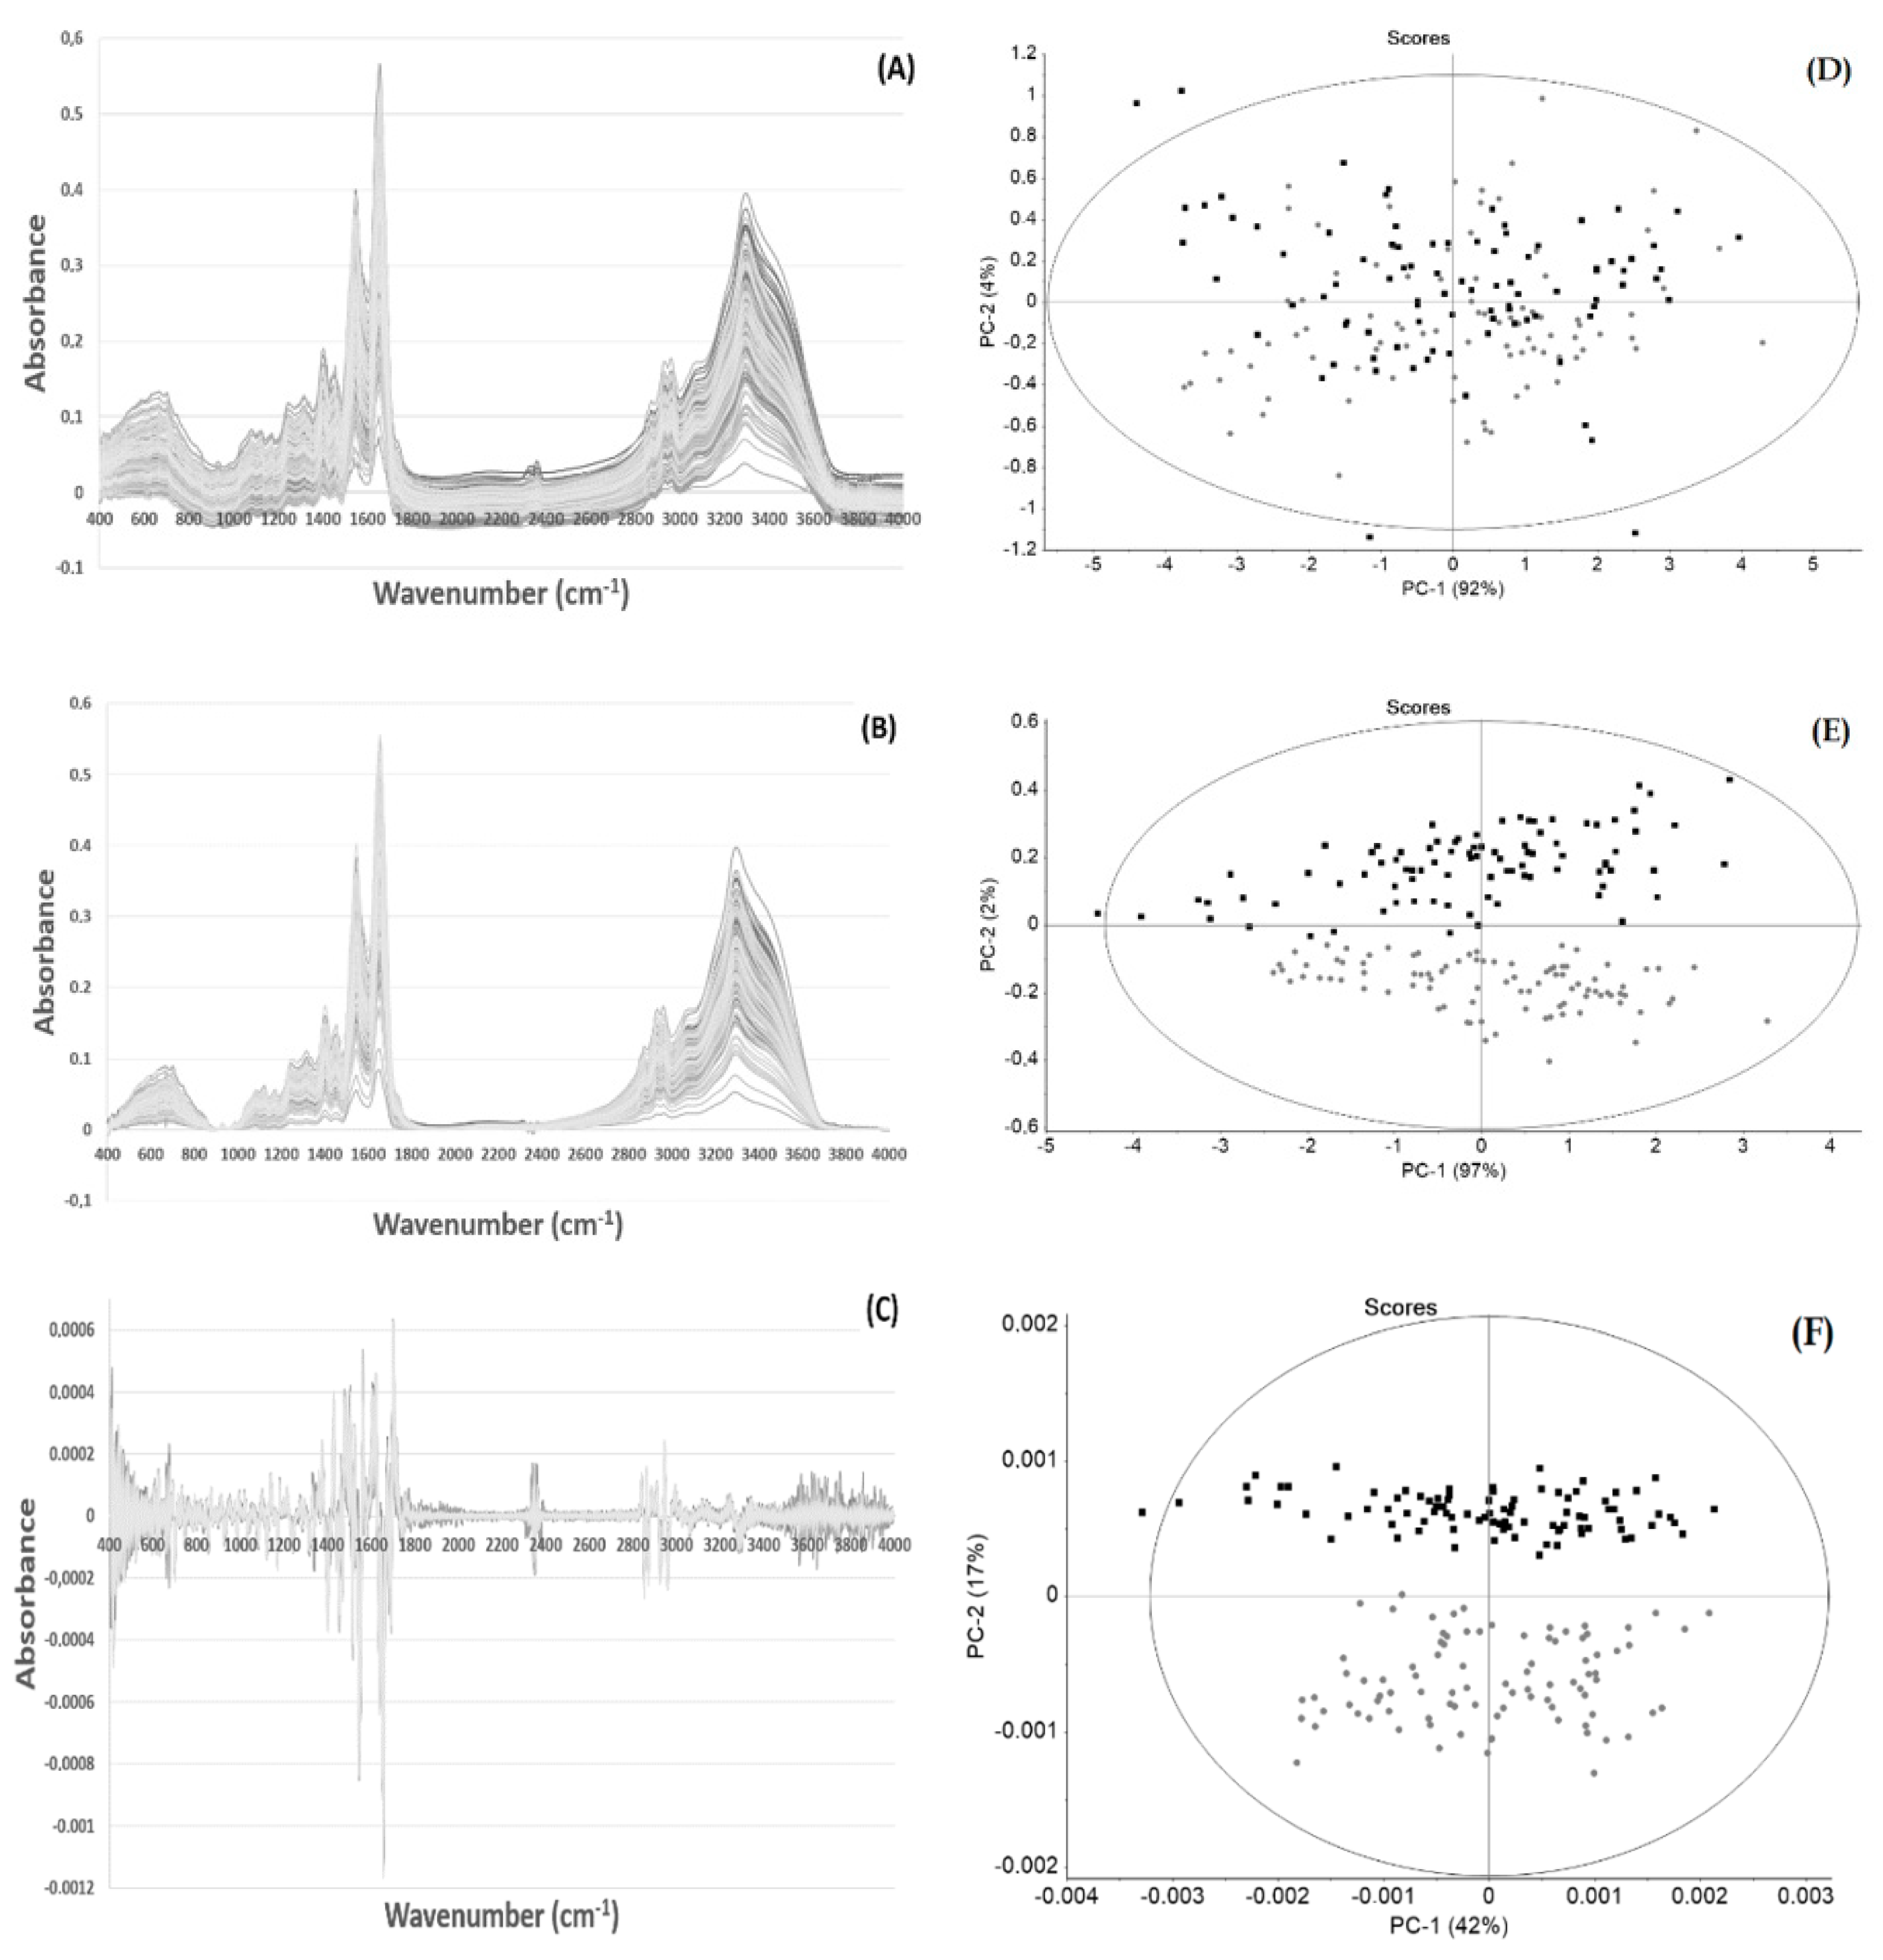
2.2. FTIR Spectra Acquisition
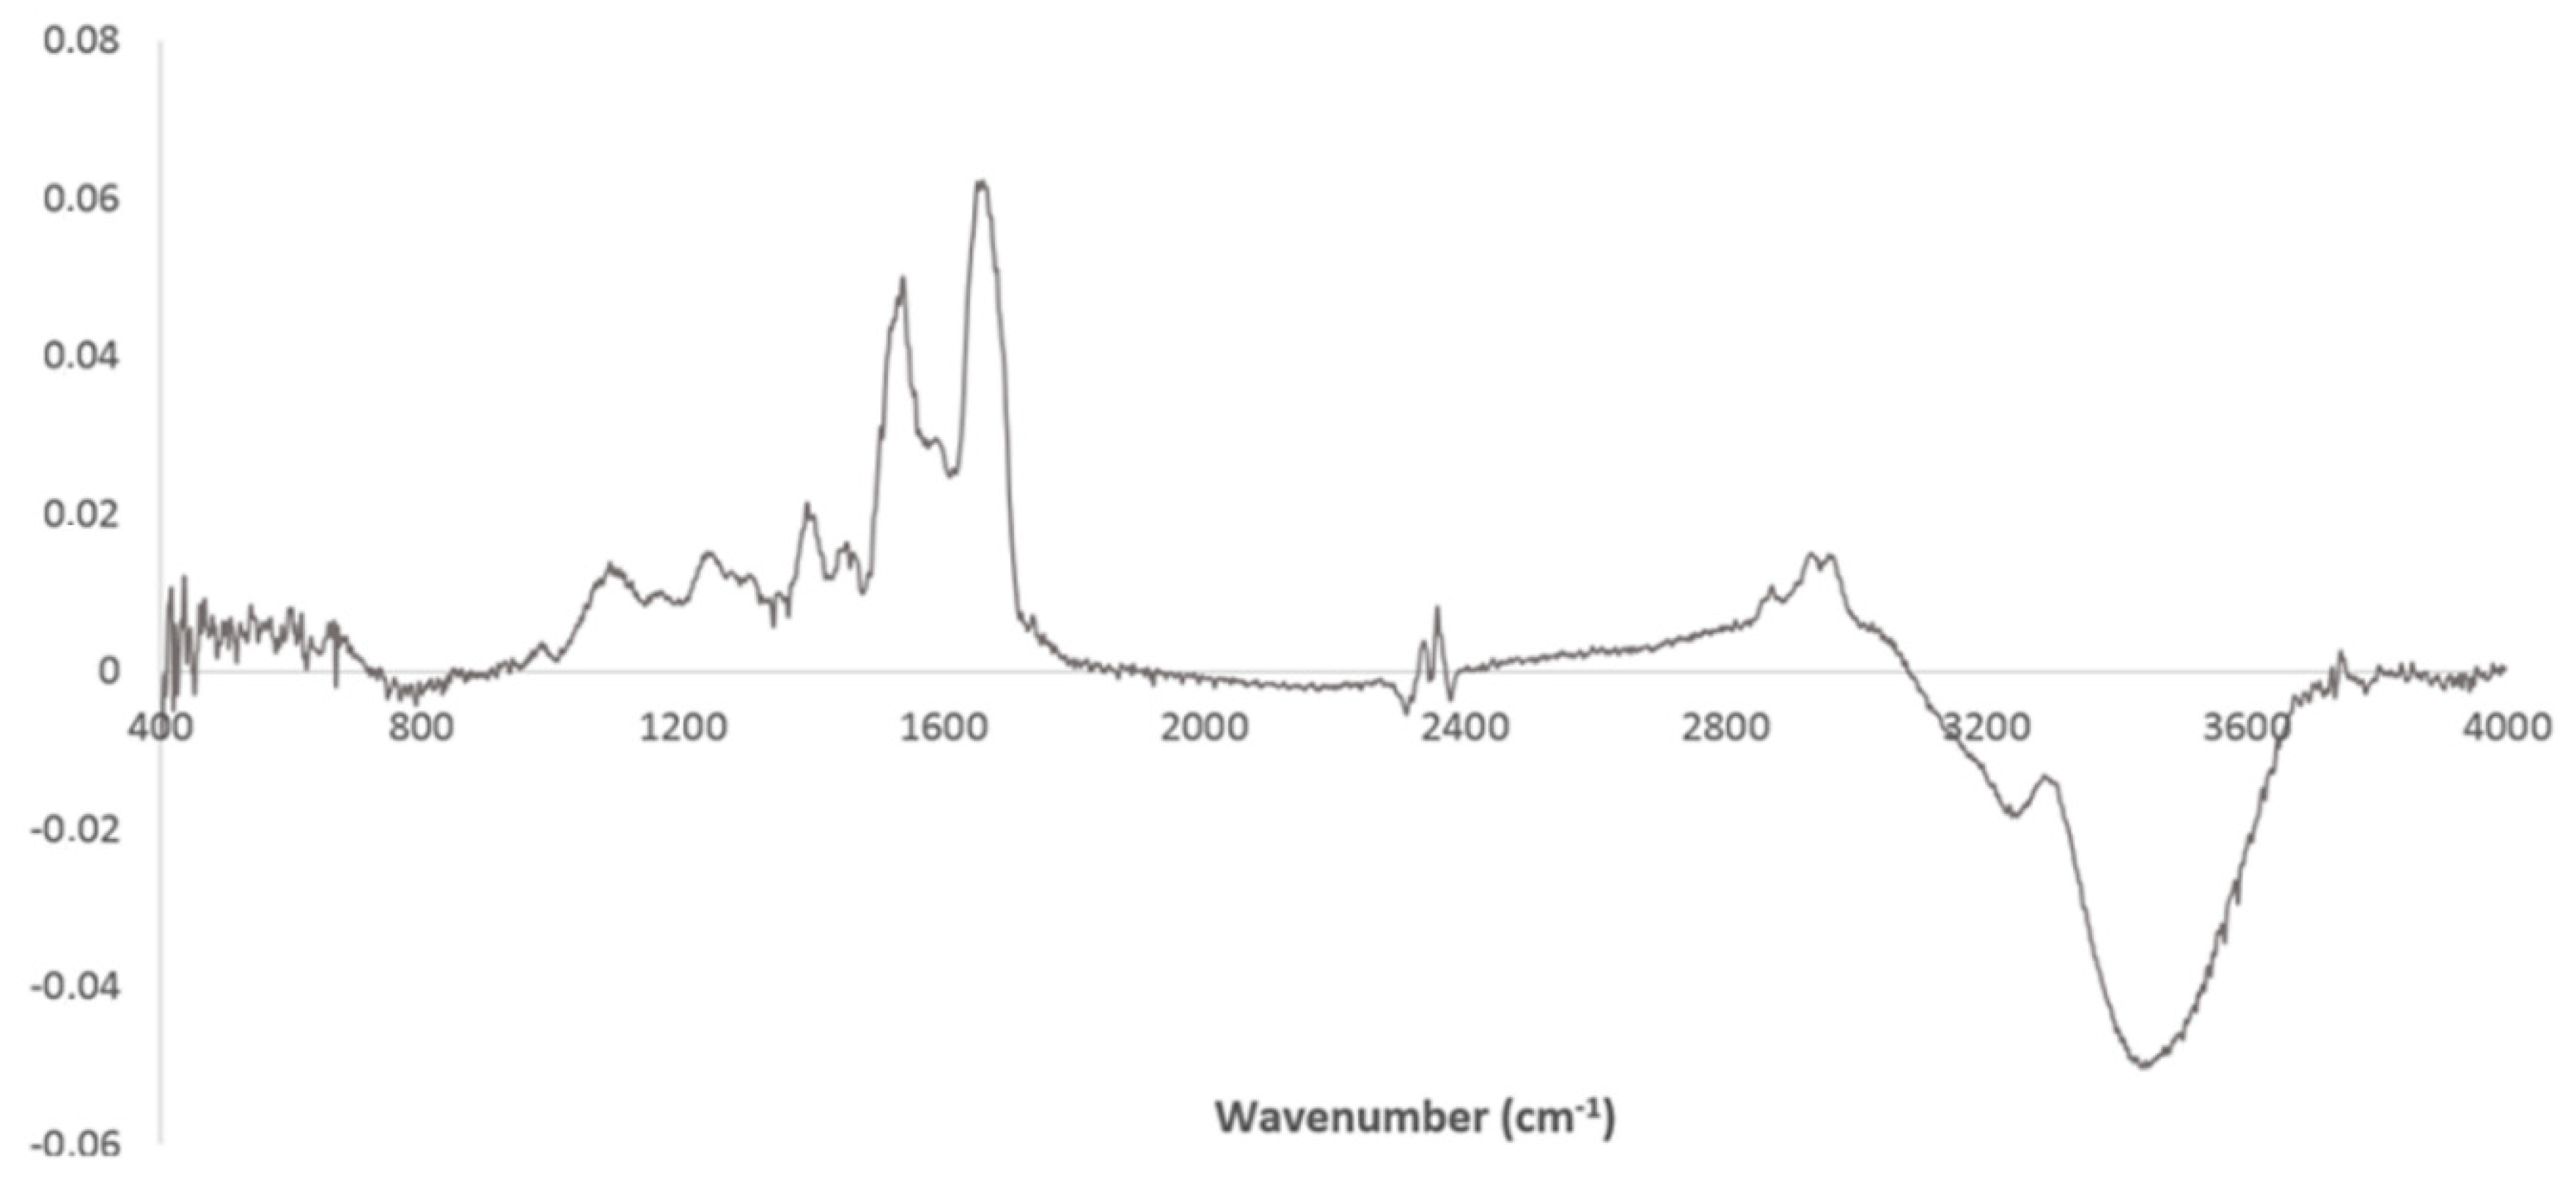
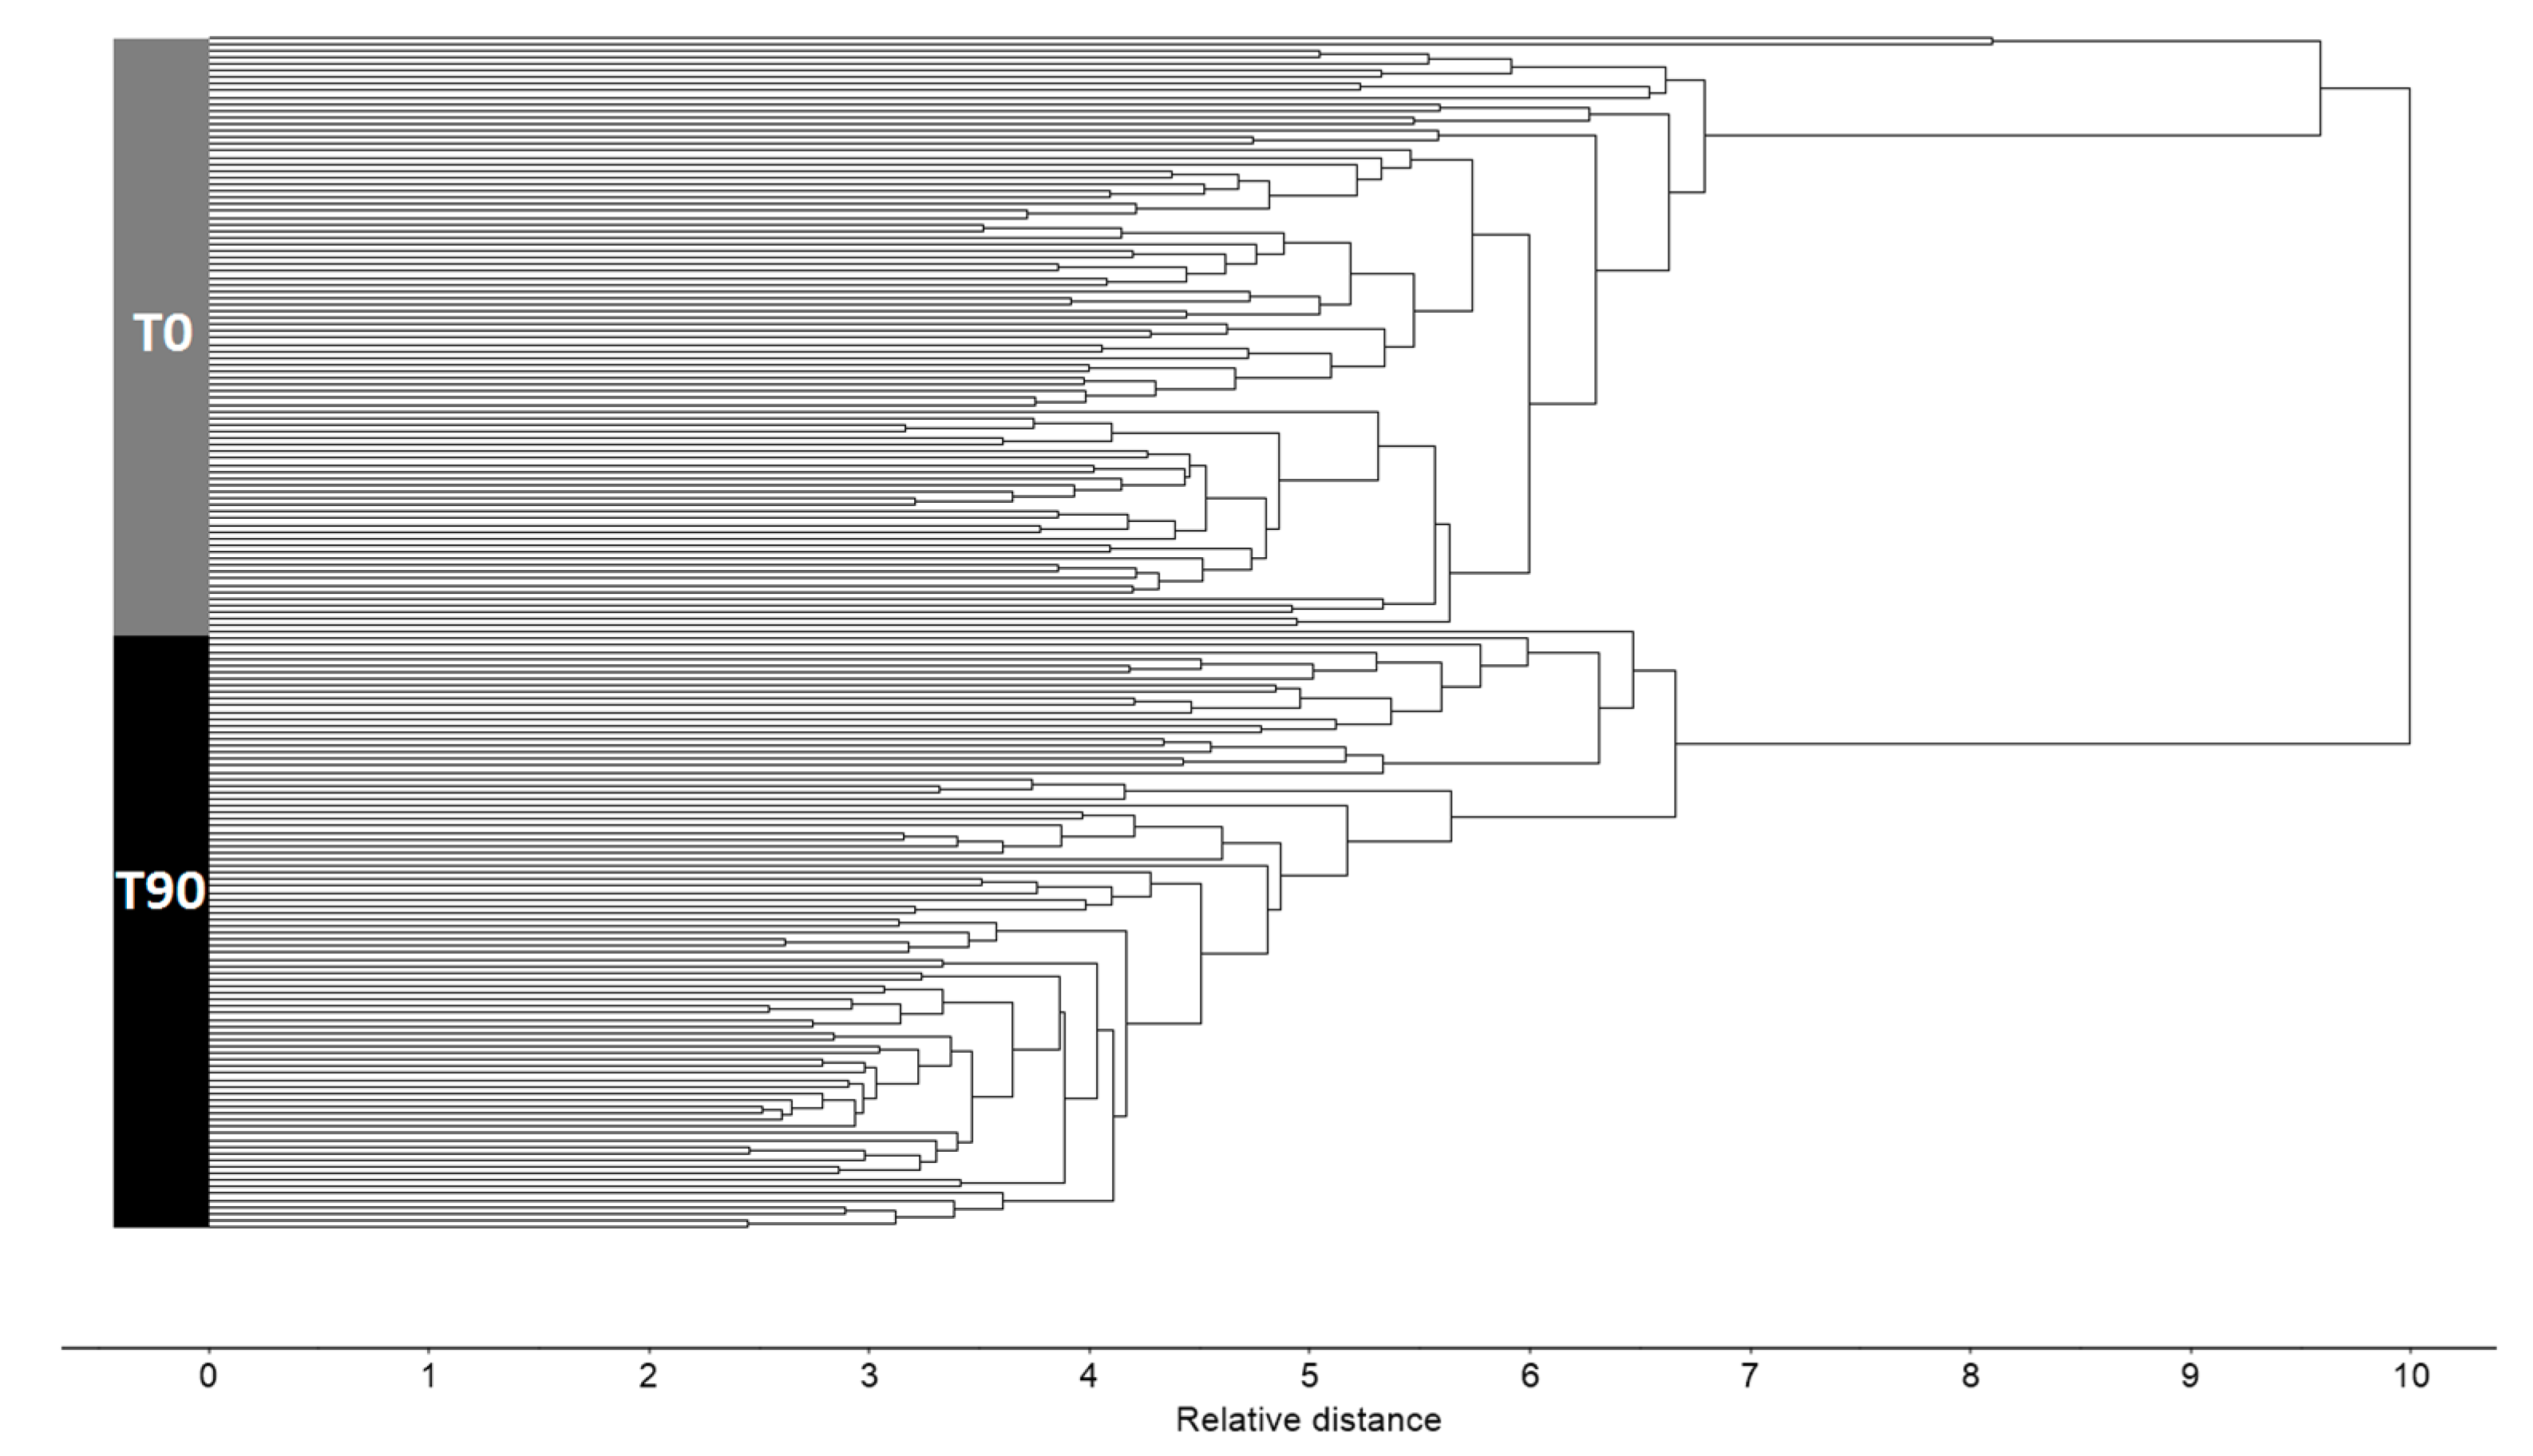
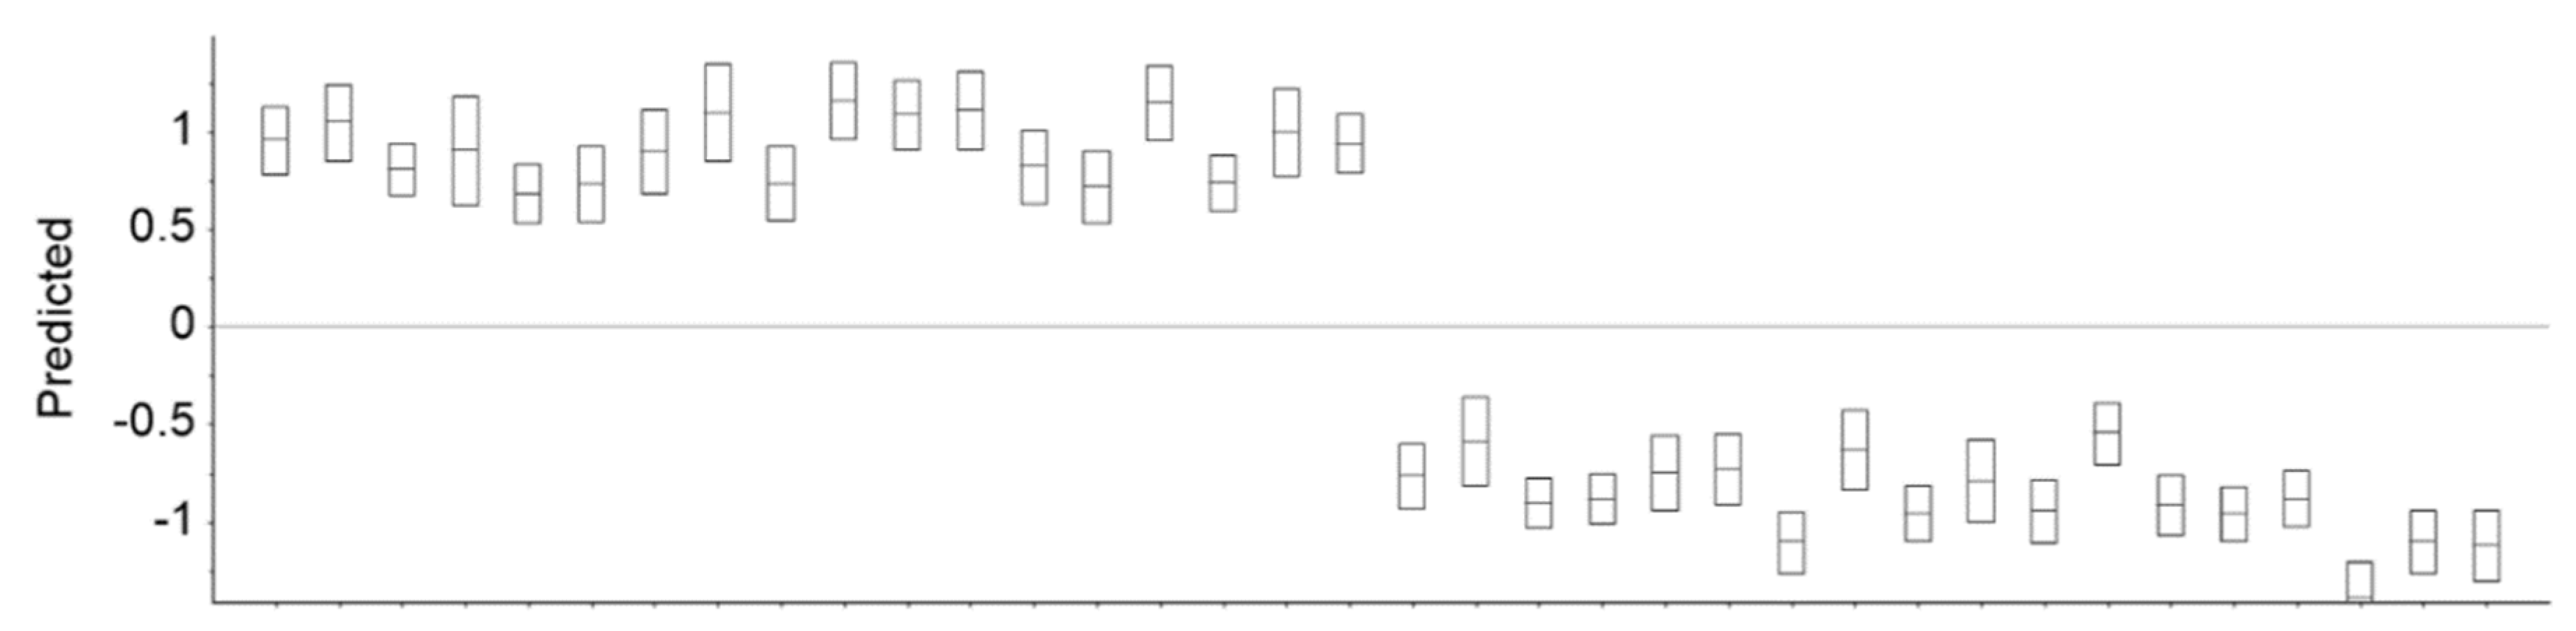
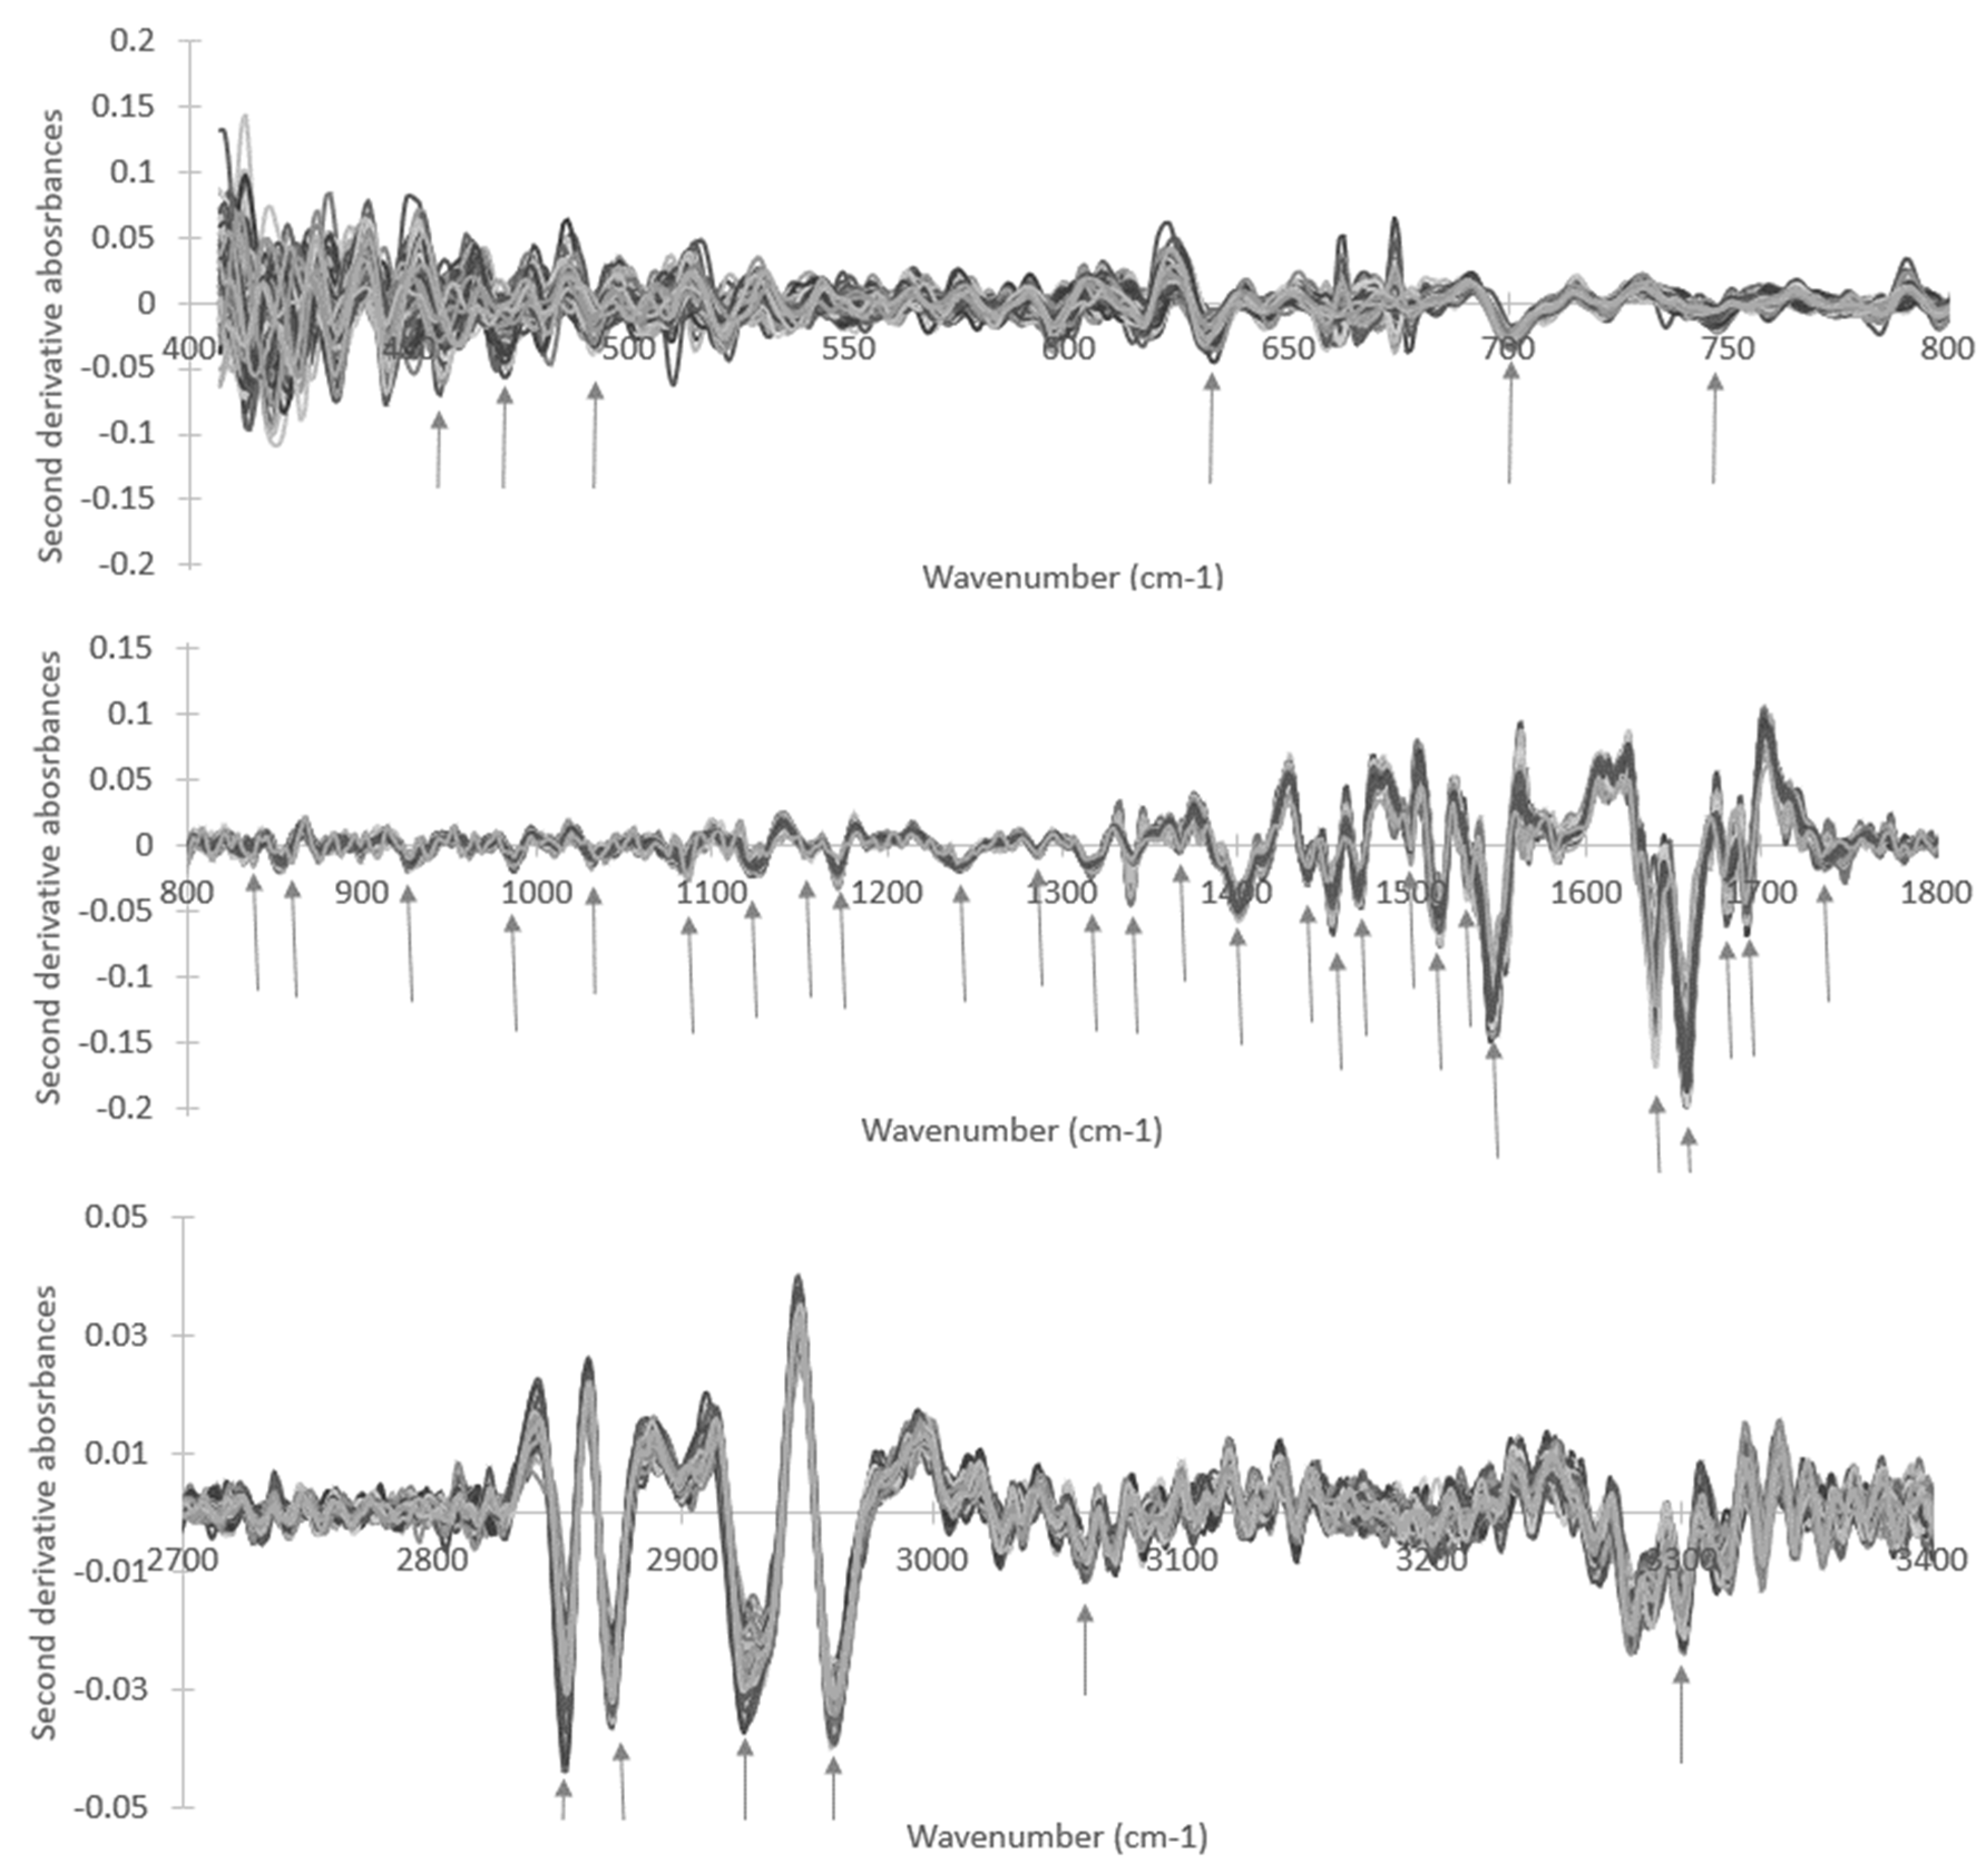
2.3. Spectra Pre-Processing and Processing
3. Results and Discussion
4. Conclusions
Author Contributions
Funding
Acknowledgments
Conflicts of Interest
References
- EuroMonitor. The Dynamics of Growth in Global Tea. Available online: https://www.euromonitor.com/the-dynamics-of-growth-in-global-tea/report (accessed on 13 November 2019).
- CCP. Committee on Commodity Problems-Current Market Situation and Medium Term Outlook for Tea to 2027; Committee on Commodity Problems: Hangzhou, China, 2018. [Google Scholar]
- Lee, K.W.; Lee, H.J.; Lee, C.Y. Antioxidant Activity of Black Tea vs. Green Tea. J. Nutr. 2002, 132, 785. [Google Scholar] [CrossRef] [PubMed] [Green Version]
- Chakrawarti, L.; Agrawal, R.; Dang, S.; Gupta, S.; Gabrani, R. Therapeutic Effects of EGCG: A Patent Review. Expert Opin. Ther. Pat. 2016, 26, 907–916. [Google Scholar] [CrossRef] [PubMed]
- Khan, N.; Mukhtar, H. Tea Polyphenols for Health Promotion. Life Sci. 2007, 81, 519–533. [Google Scholar] [CrossRef] [PubMed] [Green Version]
- Singh, S.; Li, S.S.-L. Epigenetic Effects of Environmental Chemicals Bisphenol A and Phthalates. Int. J. Mol. Sci. 2012, 13, 10143–10153. [Google Scholar] [CrossRef]
- Sevtap, A.; Dilek, T.; Nursen, B.; Arif Ahmet, B. Effect of Epigallocatechin Gallate on Oxidative DNA Damage in Human Lymphocytes. Turk. J. Pharm. Sci. 2015, 12, 19–28. [Google Scholar]
- Hu, J.; Webster, D.; Cao, J.; Shao, A. The Safety of Green Tea and Green Tea Extract Consumption in Adults–Results of a Systematic Review. Regul. Toxicol. Pharmacol. 2018, 95, 412–433. [Google Scholar] [CrossRef]
- Younes, M.; Aggett, P.; Aguilar, F.; Crebelli, R.; Dusemund, B.; Filipič, M.; Frutos, M.J.; Galtier, P.; Gott, D.; Gundert-Remy, U.; et al. Scientific Opinion on the Safety of Green Tea Catechins. EFSA J. 2018, 16. [Google Scholar] [CrossRef] [Green Version]
- Lambert, J.D. Does Tea Prevent Cancer? Evidence from Laboratory and Human Intervention Studies. Am. J. Clin. Nutr. 2013, 98, 1667S–1675S. [Google Scholar] [CrossRef] [Green Version]
- Amiot, M.J.; Riva, C.; Vinet, A. Effects of Dietary Polyphenols on Metabolic Syndrome Features in Humans: A Systematic Review. Obes. Rev. 2016, 17, 573–586. [Google Scholar] [CrossRef]
- Cao, S.-Y.; Zhao, C.-N.; Gan, R.-Y.; Xu, X.-Y.; Wei, X.-L.; Corke, H.; Atanasov, A.G.; Li, H.-B. Effects and Mechanisms of Tea and Its Bioactive Compounds for the Prevention and Treatment of Cardiovascular Diseases: An Updated Review. Antioxidants 2019, 8, 166. [Google Scholar] [CrossRef] [Green Version]
- Eng, Q.Y.; Thanikachalam, P.V.; Ramamurthy, S. Molecular Understanding of Epigallocatechin Gallate (EGCG) in Cardiovascular and Metabolic Diseases. J. Ethnopharmacol. 2018, 210, 296–310. [Google Scholar] [CrossRef] [PubMed]
- Inami, S.; Takano, M.; Yamamoto, M.; Murakami, D.; Tajika, K.; Yodogawa, K.; Yokoyama, S.; Ohno, N.; Ohba, T.; Sano, J.; et al. Tea Catechin Consumption Reduces Circulating Oxidized Low-Density Lipoprotein. Int. Heart J. 2007, 48, 725–732. [Google Scholar] [CrossRef] [PubMed] [Green Version]
- Schwartz, J.L.; Baker, V.; Larios, E.; Chung, F.-L. Molecular and Cellular Effects of Green Tea on Oral Cells of Smokers: A Pilot Study. Mol. Nutr. Food Res. 2005, 49, 43–51. [Google Scholar] [CrossRef] [PubMed]
- Hakim, I.; Harris, R.; Brown, S.; Wiseman, S.; Agarwal, S.; Talbot, W. Effect of Increased Tea Consumption on Oxidative DNA Damage among Smokers: A Randomized Controlled Study. In Proceedings of the Third International Scientific Symposium on Tea and Human Health: Role of Flavonoids in the Diet, Washington, DC, USA, 23 September 2002. [Google Scholar]
- Oberreuter, H.; Rau, J. Artificial Neural Network-Assisted Fourier Transform Infrared Spectroscopy for Differentiation of Salmonella Serogroups and Its Application on Epidemiological Tracing of Salmonella Bovismorbificans Outbreak Isolates from Fresh Sprouts. FEMS Microbiol. Lett. 2019, 366. [Google Scholar] [CrossRef] [Green Version]
- Vazquez-Zapien, G.J.; Mata-Miranda, M.M.; Sanchez-Monroy, V.; Delgado-Macuil, R.J.; Perez-Ishiwara, D.G.; Rojas-Lopez, M. FTIR Spectroscopic and Molecular Analysis during Differentiation of Pluripotent Stem Cells to Pancreatic Cells. Stem Cells Int. 2016, 2016, 1–10. [Google Scholar] [CrossRef] [Green Version]
- Bellisola, G.; Sorio, C. Infrared Spectroscopy and Microscopy in Cancer Research and Diagnosis. Am. J. Cancer Res. 2012, 2, 1–21. [Google Scholar]
- Gazi, E.; Baker, M.; Dwyer, J.; Lockyer, N.P.; Gardner, P.; Shanks, J.H.; Reeve, R.S.; Hart, C.A.; Clarke, N.W.; Brown, M.D. A Correlation of FTIR Spectra Derived from Prostate Cancer Biopsies with Gleason Grade and Tumour Stage. Eur. Urol. 2006, 50, 750–761. [Google Scholar] [CrossRef]
- Dunn, W.B.; Broadhurst, D.; Begley, P.; Zelena, E.; Francis-McIntyre, S.; Anderson, N.; Brown, M.; Knowles, J.D.; Halsall, A.; Haselden, J.N.; et al. Procedures for Large-Scale Metabolic Profiling of Serum and Plasma Using Gas Chromatography and Liquid Chromatography Coupled to Mass Spectrometry. Nat. Protoc. 2011, 6, 1060–1083. [Google Scholar] [CrossRef]
- Bunaciu, A.A.; Fleschin, Ş.; Hoang, V.D.; Aboul-Enein, H.Y. Vibrational Spectroscopy in Body Fluids Analysis. Crit. Rev. Anal. Chem. 2017, 47, 67–75. [Google Scholar] [CrossRef]
- De Bruyne, S.; Speeckaert, M.M.; Delanghe, J.R. Applications of Mid-Infrared Spectroscopy in the Clinical Laboratory Setting. Crit. Rev. Clin. Lab. Sci. 2018, 55, 1–20. [Google Scholar] [CrossRef]
- Baker, M.J.; Hussain, S.R.; Lovergne, L.; Untereiner, V.; Hughes, C.; Lukaszewski, R.A.; Thiéfin, G.; Sockalingum, G.D. Developing and Understanding Biofluid Vibrational Spectroscopy: A Critical Review. Chem. Soc. Rev. 2016, 45, 1803–1818. [Google Scholar] [CrossRef] [PubMed] [Green Version]
- Baker, M.J.; Trevisan, J.; Bassan, P.; Bhargava, R.; Butler, H.J.; Dorling, K.M.; Fielden, P.R.; Fogarty, S.W.; Fullwood, N.J.; Heys, K.A.; et al. Using Fourier Transform IR Spectroscopy to Analyze Biological Materials. Nat. Protoc. 2014, 9, 1771–1791. [Google Scholar] [CrossRef] [PubMed] [Green Version]
- Sales, K.C.; Rosa, F.; Cunha, B.R.; Sampaio, P.N.; Lopes, M.B.; Calado, C.R.C. Metabolic Profiling of Recombinant Escherichia Coli Cultivations Based on High-Throughput FT-MIR Spectroscopic Analysis. Biotechnol. Prog. 2017, 33, 285–298. [Google Scholar] [CrossRef] [PubMed]
- Sampaio, P.N.; Sales, K.C.; Rosa, F.O.; Lopes, M.B.; Calado, C.R. In Situ near Infrared Spectroscopy Monitoring of Cyprosin Production by Recombinant Saccharomyces Cerevisiae Strains. J. Biotechnol. 2014, 188, 148–157. [Google Scholar] [CrossRef] [PubMed]
- Marques, V.; Cunha, B.; Couto, A.; Sampaio, P.; Fonseca, L.P.; Aleixo, S.; Calado, C.R.C. Characterization of Gastric Cells Infection by Diverse Helicobacter Pylori Strains through Fourier-Transform Infrared Spectroscopy. Spectrochim. Acta Part A Mol. Biomol. Spectrosc. 2019, 210, 193–202. [Google Scholar] [CrossRef]
- Sampaio, P.N.; Sales, K.C.; Rosa, F.O.; Lopes, M.B.; Calado, C.R.C. High-Throughput FTIR-Based Bioprocess Analysis of Recombinant Cyprosin Production. J. Ind. Microbiol. Biotechnol. 2017, 44, 49–61. [Google Scholar] [CrossRef]
- Rosa, F.; Sales, K.C.; Cunha, B.R.; Couto, A.; Lopes, M.B.; Calado, C.R.C. A Comprehensive High-Throughput FTIR Spectroscopy-Based Method for Evaluating the Transfection Event: Estimating the Transfection Efficiency and Extracting Associated Metabolic Responses. Anal. Bioanal. Chem. 2015, 407, 8097–8108. [Google Scholar] [CrossRef]
- Scholz, T.; Lopes, V.V.; Calado, C.R.C. High-Throughput Analysis of the Plasmid Bioproduction Process in Escherichia Coli by FTIR Spectroscopy. Biotechnol. Bioeng. 2012, 109, 2279–2285. [Google Scholar] [CrossRef]
- Ribeiro da Cunha, B.; Fonseca, L.P.; Calado, C.R.C. A Phenotypic Screening Bioassay for Escherichia Coli Stress and Antibiotic Responses Based on Fourier-transform Infrared (FTIR) Spectroscopy and Multivariate Analysis. J. Appl. Microbiol. 2019, 127, 1776–1789. [Google Scholar] [CrossRef]
- Araujo, R.A.D.; Ramalhete, L.M.; Ribeiro, E.; Calado, C.R.C. Effect of Consumption of Green Tea Extracts on the Plasma Molecular Signature. In Proceedings of the 2019 IEEE 6th Portuguese Meeting on Bioengineering (ENBENG), Lisbon, Portugal, 22–23 February 2019; pp. 1–4. [Google Scholar] [CrossRef]
- Ann, B.; Zonder, J.A. The Clinical and Biologic Evaluation of Polyphenon E, an Extract of Green Tea Containing EGCG, in Plasma Cell Dyscrasias-Pilot Study. Available online: https://clinicaltrials.gov/ct2/show/NCT00942422 (accessed on 28 August 2019).
- Chow, H.H.S.; Cai, Y.; Hakim, I.A.; Crowell, J.A.; Shahi, F.; Brooks, C.A.; Dorr, R.T.; Hara, Y.; Alberts, D.S. Pharmacokinetics and Safety of Green Tea Polyphenols after Multiple-Dose Administration of Epigallocatechin Gallate and Polyphenon E in Healthy Individuals. Clin. Cancer Res. 2003, 9, 3312–3319. [Google Scholar]
- Corte, L.; Tiecco, M.; Roscini, L.; De Vincenzi, S.; Colabella, C.; Germani, R.; Tascini, C.; Cardinali, G. FTIR Metabolomic Fingerprint Reveals Different Modes of Action Exerted by Structural Variants of N-Alkyltropinium Bromide Surfactants on Escherichia Coli and Listeria Innocua Cells. PLoS ONE 2015, 10, e0115275. [Google Scholar] [CrossRef] [PubMed] [Green Version]
- Li, X.; Tang, S.; Wang, Q.-Q.; Leung, E.L.-H.; Jin, H.; Huang, Y.; Liu, J.; Geng, M.; Huang, M.; Yuan, S.; et al. Identification of Epigallocatechin-3- Gallate as an Inhibitor of Phosphoglycerate Mutase 1. Front. Pharmacol. 2017, 8. [Google Scholar] [CrossRef] [PubMed] [Green Version]
- Chen, C.; Liu, Q.; Liu, L.; Hu, Y.; Feng, Q. Potential Biological Effects of (-)-Epigallocatechin-3-Gallate on the Treatment of Nonalcoholic Fatty Liver Disease. Mol. Nutr. Food Res. 2018, 62, 1700483. [Google Scholar] [CrossRef] [PubMed] [Green Version]
- Kapoor, M.P.; Sugita, M.; Fukuzawa, Y.; Okubo, T. Physiological Effects of Epigallocatechin-3-Gallate (EGCG) on Energy Expenditure for Prospective Fat Oxidation in Humans: A Systematic Review and Meta-Analysis. J. Nutr. Biochem. 2017, 43, 1–10. [Google Scholar] [CrossRef]
- Liu, K.-Z.; Shaw, R.A.; Man, A.; Dembinski, T.C.; Mantsch, H.H. Reagent-Free, Simultaneous Determination of Serum Cholesterol in HDL and LDL by Infrared Spectroscopy. Clin. Chem. 2002, 48, 499–506. [Google Scholar] [CrossRef] [PubMed] [Green Version]


| Wavenumber (cm−1) | T0 | T90 | p-Value (T0 vs. T90) | ||
|---|---|---|---|---|---|
| Average | Standard Deviation | Average | Standard Deviation | ||
| 3331 | −1.30 × 10⁻³ | 2.03 × 10⁻³ | −3.87 × 10⁻³ | 2.05 × 10⁻³ | 1.89 × 10⁻¹³ |
| 2961 | −3.15 × 10⁻² | 2.49 × 10⁻³ | −3.26 × 10⁻² | 2.55 × 10⁻³ | 7.37 × 10⁻³ |
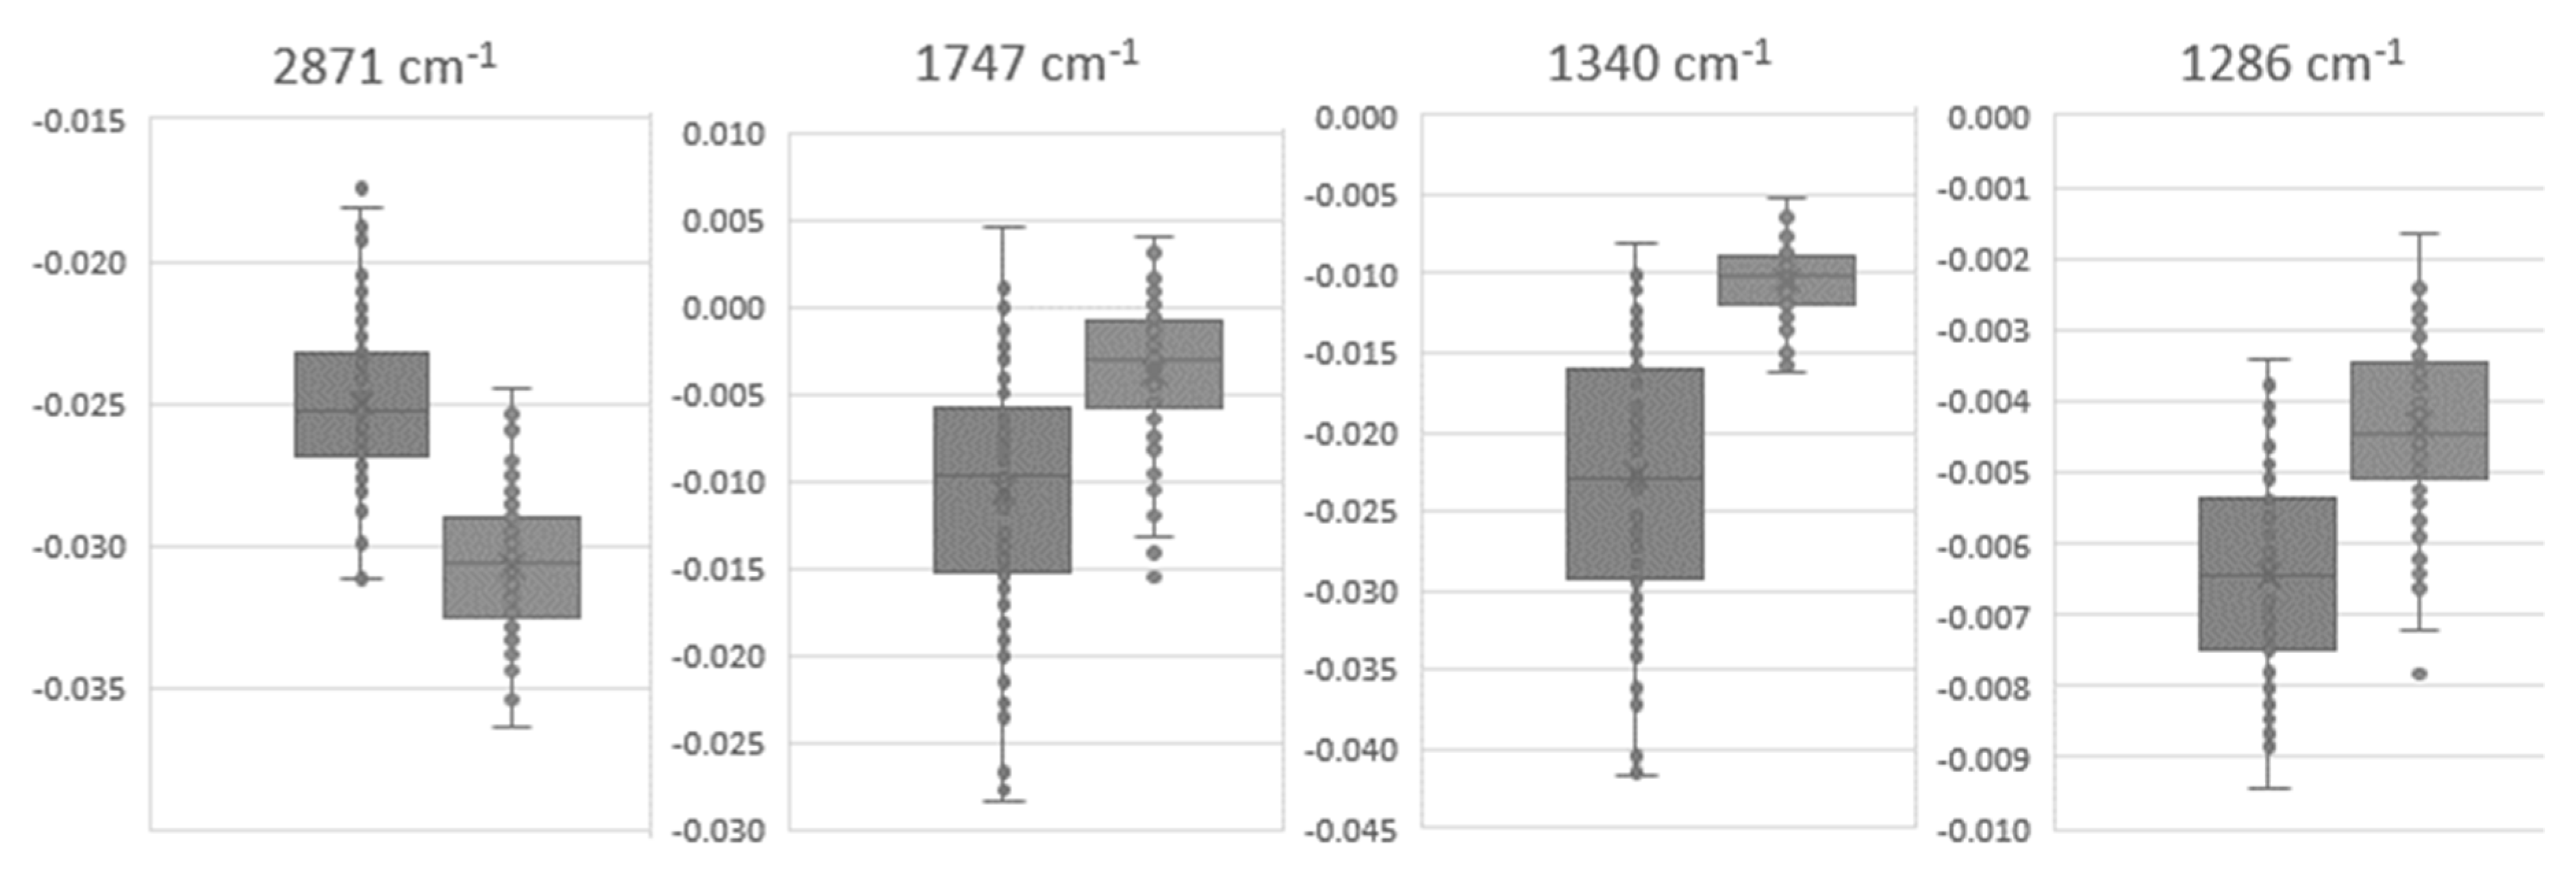
| 2872 | −2.50 × 10⁻² | 2.89 × 10⁻³ | −3.07 × 10⁻² | 2.31 × 10⁻³ | 6.85 × 10⁻²³ |
| 1747 | −1.06 × 10⁻² | 7.29 × 10⁻³ | −3.77 × 10⁻³ | 4.12 × 10⁻³ | 1.93 × 10⁻¹⁴ |
| 1691 | −3.53 × 10⁻² | 8.19 × 10⁻³ | −4.44 × 10⁻² | 8.63 × 10⁻³ | 9.60 × 10⁻¹² |
| 1658 | −1.70 × 10⁻¹ | 2.00 × 10⁻² | −1.59 × 10⁻¹ | 1.98 × 10⁻² | 2.38 × 10⁻⁴ |
| 1639 | −8.81 × 10⁻² | 1.99 × 10⁻² | −1.00 × 10⁻¹ | 2.87 × 10⁻² | 1.63 × 10⁻³ |
| 1545 | −1.27 × 10⁻¹ | 1.17 × 10⁻² | −1.17 × 10⁻¹ | 1.32 × 10⁻² | 7.05 × 10⁻⁷ |
| 1516 | −4.75 × 10⁻² | 7.44 × 10⁻³ | −5.75 × 10⁻² | 8.61 × 10⁻³ | 6.71 × 10⁻¹³ |
| 1470 | −3.55 × 10⁻² | 3.77 × 10⁻³ | −3.77 × 10⁻² | 4.42 × 10⁻³ | 1.59 × 10⁻³ |
| 1441 | −1.70 × 10⁻² | 4.83 × 10⁻³ | −2.19 × 10⁻² | 3.32 × 10⁻³ | 1.97 × 10⁻¹³ |
| 1401 | −4.47 × 10⁻² | 4.63 × 10⁻³ | −4.89 × 10⁻² | 2.88 × 10⁻³ | 2.77 × 10⁻¹¹ |
| 1340 | −2.28 × 10⁻² | 8.56 × 10⁻³ | −1.04 × 10⁻² | 2.18 × 10⁻³ | 6.02 × 10⁻²⁵ |
| 1317 | −1.95 × 10⁻² | 2.56 × 10⁻³ | −1.45 × 10⁻² | 1.48 × 10⁻³ | 3.61 × 10⁻²⁷ |
| 1286 | −6.46 × 10⁻³ | 1.44 × 10⁻³ | −4.32 × 10⁻³ | 1.15 × 10⁻³ | 1.10 × 10⁻¹⁵ |
| 1241 | −1.53 × 10⁻² | 1.47 × 10⁻³ | −1.64 × 10⁻² | 1.29 × 10⁻³ | 3.12 × 10⁻⁶ |
| 1173 | −2.37 × 10⁻² | 2.67 × 10⁻³ | −2.14 × 10⁻² | 3.79 × 10⁻³ | 2.38 × 10⁻⁵ |
| 1156 | −1.57 × 10⁻³ | 1.69 × 10⁻³ | −3.98 × 10⁻³ | 2.00 × 10⁻³ | 3.28 × 10⁻¹³ |
| 1122 | −1.35 × 10⁻² | 3.52 × 10⁻³ | −1.59 × 10⁻² | 2.80 × 10⁻³ | 1.86 × 10⁻⁶ |
| 1084 | −1.19 × 10⁻² | 2.39 × 10⁻³ | −1.35 × 10⁻² | 1.79 × 10⁻³ | 5.28 × 10⁻⁷ |
| 1032 | −1.10 × 10⁻² | 2.05 × 10⁻³ | −9.63 × 10⁻³ | 2.33 × 10⁻³ | 2.41 × 10⁻⁴ |
| 987 | −9.40 × 10⁻³ | 2.33 × 10⁻³ | −1.19 × 10⁻² | 2.76 × 10⁻³ | 2.46 × 10⁻²⁷ |
| 933 | −1.00 × 10⁻² | 1.74 × 10⁻³ | −4.49 × 10⁻³ | 2.69 × 10⁻³ | 2.46 × 10⁻²⁷ |
| 838 | −2.26 × 10⁻³ | 2.13 × 10⁻³ | −5.05 × 10⁻³ | 2.64 × 10⁻³ | 2.28 × 10⁻¹³ |
| 746 | −1.45 × 10⁻² | 2.10 × 10⁻³ | −9.17 × 10⁻³ | 2.90 × 10⁻³ | 6.37 × 10⁻²⁶ |
| 634 | −1.61 × 10⁻² | 4.79 × 10⁻³ | −1.85 × 10⁻² | 6.11 × 10⁻³ | 8.33 × 10⁻³ |
| 492 | −1.04 × 10⁻² | 8.28 × 10⁻³ | −1.47 × 10⁻² | 8.11 × 10⁻³ | 6.39 × 10⁻⁴ |
| 473 | −2.52 × 10⁻² | 1.02 × 10⁻² | −1.11 × 10⁻² | 1.01 × 10⁻² | 6.47 × 10⁻¹³ |
© 2020 by the authors. Licensee MDPI, Basel, Switzerland. This article is an open access article distributed under the terms and conditions of the Creative Commons Attribution (CC BY) license (http://creativecommons.org/licenses/by/4.0/).
Share and Cite
Araújo, R.; Ramalhete, L.; Da Paz, H.; Ribeiro, E.; Calado, C.R.C. A Simple, Label-Free, and High-Throughput Method to Evaluate the Epigallocatechin-3-Gallate Impact in Plasma Molecular Profile. High-Throughput 2020, 9, 9. https://0-doi-org.brum.beds.ac.uk/10.3390/ht9020009
Araújo R, Ramalhete L, Da Paz H, Ribeiro E, Calado CRC. A Simple, Label-Free, and High-Throughput Method to Evaluate the Epigallocatechin-3-Gallate Impact in Plasma Molecular Profile. High-Throughput. 2020; 9(2):9. https://0-doi-org.brum.beds.ac.uk/10.3390/ht9020009
Chicago/Turabian StyleAraújo, Rúben, Luís Ramalhete, Helder Da Paz, Edna Ribeiro, and Cecília R.C. Calado. 2020. "A Simple, Label-Free, and High-Throughput Method to Evaluate the Epigallocatechin-3-Gallate Impact in Plasma Molecular Profile" High-Throughput 9, no. 2: 9. https://0-doi-org.brum.beds.ac.uk/10.3390/ht9020009