
Episodic Sedimentary Evolution of an Alluvial Fan (Huangshui Catchment, NE Tibetan Plateau)
by
 , ,
, ,
Linman Gao
1, 
Xianyan Wang
1,*,
Shuangwen Yi
1,
Jef Vandenberghe
1,2,
Martin R. Gibling
3 and
Huayu Lu
1 1
School of Geography and Ocean Science, Nanjing University, Nanjing 210023, China
2
Institute of Earth Sciences, VU University Amsterdam, 1081HV Amsterdam, The Netherlands
3
Department of Earth Sciences, Dalhousie University, Halifax, NS B3H4R2, Canada
*
Author to whom correspondence should be addressed.
Quaternary 2018, 1(2), 16; https://0-doi-org.brum.beds.ac.uk/10.3390/quat1020016
Submission received: 5 July 2018
/
Revised: 23 August 2018
/
Accepted: 23 August 2018
/
Published: 3 September 2018
(This article belongs to the Special Issue Special External Effects on Fluvial System Evolution)
Abstract
:Alluvial-fan successions record changes in hydrological processes and environments that may reflect tectonic activity, climate conditions and changes, intrinsic geomorphic changes, or combinations of these factors. Here, we focus on the evolution of a stream-dominated fan in a tectonic depression of the Xining basin of China, laid down under a semi-arid climate in the northeastern Tibetan Plateau (NETP). The fan succession is composed of three facies associations, from bottom to top: (1) matrix to clast-supported, poorly sorted, planar cross-stratified to crudely stratified sheets of coarse-grained sediments; (2) horizontal laminated sand, laminated layers of reddish fine silt and yellow coarse silt with stacked mounds of sand; and (3) clay-rich deposits with incipient paleosols. The succession shows rapid sediment aggradation from high-energy to low-energy alluvial fans and finally to a floodplain. The dating results using optically stimulated luminescence (OSL) method show that a gravelly, high-energy fan was deposited during MIS 6, after which a low-energy fan, mainly composed of sand and silt, was deposited and finally covered by flood loam during the MIS 6–5 transition and the warmer last interglacial. Stacked sand mounds are interpreted from their sediment structure and grain-size distribution as shrub-coppice dunes in low-energy fan deposits. They may be considered as a response to the interaction of alluvial and aeolian processes in a semi-arid environment.
1. Introduction
Quaternary terrestrial sediments record information on climatic conditions and changes, environmental evolution, and tectonic events. Sediment composition and structures reflect changes in the sedimentary environment, which may be indicative of particular climatic conditions [1]. Paleoclimate changes in semi-arid regions in China have been studied extensively from aeolian loess [2,3,4,5,6,7,8], lacustrine [9,10,11,12,13], and fluvial (alluvial) sediments [14,15,16], but research based on alluvial fans is relatively scarce. Alluvial sediments are sensitive to changes in hydrological conditions, and interpretation of the sediments may provide valuable information on past climate [17]. The intricacy of fluvial response, including aggradation/incision rhythms and terrace formation, to late Quaternary climate change, has been studied for several decades [16,18,19,20,21]. In addition, the interactions between fluvial and aeolian processes and their response to climate change in semi-arid areas have also been reported elsewhere in China and around the world [22,23,24,25,26].
Alluvial sequences allow process inference, which then can be used to infer environments, at the depositional site, as well as environmental change and related controls in the catchment area [17]. In the past few decades, understanding of how tectonic activity and climate change influence alluvial deposits has progressed considerably [27,28,29]. Tectonically active zones may preserve sediment sequences by providing accumulation space, whereas climate influences sediment supply by affecting water and sediment discharge and vegetation cover [30]. Climatic factors and autogenic effects appear to exert an overwhelming control on Quaternary fan sequences and sedimentary styles [31,32,33,34], especially under arid or semiarid conditions [35].
As an important alluvial sediment record, a fan can be formed as a stream-dominated alluvial fan, as part of the main trunk valley, with braided channels created where the valley widens downstream, and as a gravity flow (debris) dominated fan at a tributary junction [1,36,37,38]. The majority of flow-dominated alluvial fans documented in modern and Quaternary settings are from perennial or semi-permanent channelized rivers, and most are located in humid areas, such as the Kosi fan in Nepal and India [37]. Such fluvially dominated mega-fans are special cases of alluvial fans with a lower slope, the presence of a floodplain, and the absence of sediment-gravity flows [39,40]. However, there has only been limited work on stream-dominated alluvial fans in semi-arid environments. In modern arid and semi-arid environments, fans are commonly characterized by debris flows. However, Jolley et al. [36] proposed that ephemeral river deposits are dominant in modern syn-tectonic fans, and they concluded that such fans were formed by highly concentrated, turbulent tractional flows.
The Xining basin, in the northeastern Tibetan Plateau (NETP), has been most intensively studied at a large scale [41,42,43,44], whereas the small depressions within the basin have been mainly studied at a reconnaissance scale [45,46]. Most studies have paid attention to the river terraces, for instance, along the Huangshui River, and the sedimentary process response to climate change and tectonic activity. However, the number of alluvial fans documented in this area is small, which may reflect, in part, their low preservation potential as geomorphologic features. The presence of a large sand pit with extensive outcrops in this study provided an excellent opportunity for investigating an alluvial-fan succession.
Local debris fan may dam the main channel of a river, resulting in dam-collapse and huge related floods; these have been widely studied in this area [47]. However, a stream-dominated fan in a large catchment has not been reported from this area. Thus, the first main goal of this study was to document and interpret the sedimentary lithofacies and investigate the stratigraphic evolution of a stream-dominated alluvial fan, with an estimated width of 1.7 km and length of 3.5 km, at the margin of a tectonic depression, the Ping’an depression, in a semi-arid environment. Secondly, we interpreted the relationships between sedimentary environments and climate and also the influence of vegetation and internal dynamics, drawing on detailed facies analysis, sedimentary structures, and sedimentological evidence for the former presence of vegetation. To further this goal, we analyzed the grain-size distributions of sediments to assess the relative contribution of fluvial and aeolian processes in a fan environment. Finally, we dated the sediments using optically stimulated luminescence (OSL) method, to establish the timing of deposition in relation to long-term climate evolution in the region, and tectonic events.
2. Geographical Setting
The study site is located in the Xining basin on the NETP, which has undergone coeval crustal shortening and left-lateral strike-slip faulting [48] and has experienced dramatic and pronounced cyclic climate changes. The Xining basin was bounded by two main thrusts, the North Middle Qilian Shan Fault (NMQF) in the north and the Laji Shan Fault (LSF) in the south [45,49] (Figure 1a). Tectonic fragmentation of the Xining basin has resulted in the formation of several gorges between subsiding sub-basins or depressions (e.g., the Ping’an depression) and up to 16 river terraces, recording deep incision into ~600 m of basin filling [45,49]. At the outlet of one gorge (Xiao gorge), a stream-dominated fan, correlated with a terrace, was formed (Figure 1c) (see Section 5. Discussion below).
The climate of the NETP is at the boundary of influence from the Asian summer monsoon (ASM) and the westerlies [50,51,52]. The integrated influence of these climate systems, combined with the high elevation, makes the area sensitive to climate changes. The study area, a depression in the Xining basin, is currently located at an elevation between ~2000 m and ~3000 m (Figure 1) and is characterized by a cold semi-arid climate with a strongly variable temperature and precipitation. The regional average annual temperature and precipitation are 6.4 °C and 319–532 mm, respectively, and the average annual evaporation can reach up to ~1800 mm. At present, precipitation occurs mainly in summer, probably caused by invasions of the Asian summer monsoon. In winter, the climate of this region is controlled by the winter monsoon, with strong winds and cold and dry conditions. This framework is also typical for the Quaternary climate situation in this area.
The studied sediment sequence is present in a sand pit, excavated in the fan at the western side of the Ping’an depression (Figure 1c), with a section oriented northwest to southeast, around 22 m high and with a lateral extent of 500 m. The top of the basal unit at the west end of the sand-pit is situated 26 m above the modern floodplain of the Huangshui River, which is a first-order tributary of the Yellow River (Figure 1c). The river flows roughly W-E through the Xining basin and has deeply incised the Precambrian to Mesozoic bedrock in the gorges and Cenozoic clastic sediments in the basin [45,46]. The sediment sequence is located directly at the east of the Xiao gorge and the west end of the Ping’an depression (36°33′27.7″ N, 101°55′53.38″ E) (Figure 1b).
3. Methods
3.1. Field Work
In order to study the vertical and lateral variations of the sediments, and distinguish the sedimentary environment, eight sediment sections were logged in detail (Figure 2) and described. The facies codes of Miall [54] were used (Table 1). To allow an interpretation of the process and environment, some particular sedimentary structures/architectures were quantified by measuring individual maximum thickness and width, in the field and from photographs. Photomosaics were used to correlate units across the outcrop face. In addition, 50 samples were taken from different sediment units for grain-size analysis and 13 samples for OSL dating (Table 2) to supplement the interpretation of the sediment processes and transport dynamics and changes of the sedimentary environment.
3.2. Grain-Size Measurements
The grain-size samples were prepared largely according to the methods described by Konert and Vandenberghe [55]. A few grams of sediment were pre-treated with 10% H2O2 and 10% HCl to remove organic matter and carbonate, respectively. With (NaPO3)6 as a dispersing agent, the pure siliciclastic sediments were then measured using a Malvern master-size laser particle analyzer (Malvern Panalytical, Almelo, The Netherlands). The grain-size distribution shows 100 size classes, ranging from 0.02 to 2000 μm. In addition to modal values, distribution curves and additional grain-size parameters, including the proportion of specific grain-size intervals (e.g., clay and sand content), were calculated.
3.3. Optically Stimulated Luminescence Dating
OSL samples from different sediment units (Table 2) were taken by hammering a steel tube 25 cm long with a diameter of 5 cm into the cleaned profile. Pure quartz (grain size 63~90 μm, except samples XX-A90 and XX-A220, which extracted from the 40~63 μm fraction) was extracted from the intermediate material of the tubes using standard methods (30% H2O2, 10% HCl, wet sieving, 40% HF), and was used for an equivalent dose (De) measurement. For extracting K-rich feldspar, pre-treated 63–90 μm grains (30% H2O2, 10% HCl, wet sieving) were first cleaned using 10% HF to remove coatings and the outer alpha irradiated skin and then washed with 10% HCl to remove fluoride. K-rich feldspars were floated off using heavy liquid of a 2.58 g/cm3 density.
All luminescence analyses used an automated Risø reader (DTU Nutech, Roskilde, Denmark) equipped with blue (470 nm; ~80 mW cm2) LEDs and an IR laser diode (870 nm, ~135 mW cm2). Quartz OSL signals were collected through a 7.5 mm Schott U-340 (UV) glass filter (emission 330 + 35 nm). K-feldspar pIRIR signals were collected through a combination of Corning 7–59 and Schott BG-39 glass filters (blue-violet part of the spectrum). Quartz equivalent doses (De) were measured using a standard single-aliquot regenerative-dose (SAR) protocol [56,57]. Preheating of natural and regenerative doses was for 10 s at 260 °C, and the response to the test dose was measured after a cut-heat to 220 °C. K-feldspar aliquots were measured using the post-IR IRSL (pIRIR290) protocol [58,59,60,61,62]. Samples were preheated at 320 °C for 60 s followed by IR diode stimulation at 200 °C for 200 s and the IRSL signal was then measured at 290 °C for 200 s. The response to the test dose was measured in the same manner and was followed by IR illumination at 325 °C for 200 s at the end of each SAR cycle, to reduce recuperation.
Sample material from both outer ends of the tube was used for water-content and radioactive element analysis. The material (about 20 g) was first dried and then ground to powder to determine concentrations of U, Th, and K using neutron activation analysis (NAA). The water content varied during the long-term burial period, so we assumed 50% of the saturated water content as the average value during historical time according to previous work [16,26], with an absolute uncertainty of 7% of this value to allow for possible fluctuations on the basis of the local climatic characteristics. Based on applying conversion factors from Guérin [63] and beta attenuation factors from Mejdahl [64], the external beta and gamma dose rate was calculated using the radionuclide concentration. For K-feldspar dose rates, a K concentration of 12.5 ± 0.5% and Rb concentration of 400 ± 100 ppm was assumed [65]. A small internal dose rate contribution from U and Th of 0.03 ± 0.015 Gyka−1 and 0.06 ± 0.03 Gyka−1 was also included for quartz and K-feldspar, respectively [66,67,68].
4. Results
4.1. Facies Analysis and Grain-Size Analysis
The Ping’an site is characterized by a complex spatial facies distribution (Figure 2). The strata are subdivided into six units (Figure 2) and grouped into three facies associations from bottom to top: a high-energy alluvial fan, low-energy alluvial fan, and floodplain. The unit boundaries are typically abrupt but conformable, and the upward succession of facies associations reflects the evolution of the depositional environment, without any marked breaks in deposition.
4.1.1. High-Energy Alluvial Fan (Facies Association 1)
Description
The facies association forms unit 1 (U1) in the lower part of the study site. The basal contact of U1 is not exposed, and the unit is presumably below the exposed base of sections I and IV. The exposed unit varies between 1 and 1.6 m in thickness, with a high thickness of 4 to 5.5 m in section VII. U1 changes in dip (the dip of the boundary of U1 and U2) eastward from 9° in section VII to 7° and 5° in sections II and III, respectively, and the unit thins eastward.
The unit is composed of poorly sorted gravel, deposited as horizontally stratified sheets (Gh), planar cross-beds (Gp) which show an ESE flow direction, and disorganized, clast-supported and matrix-supported beds of facies Gcm and Gmm (Table 1) (Figure 3). Clasts in the Gp facies are locally imbricated. The gravel clasts are mainly sub-rounded and rounded, but also sub-angular, set in a matrix of fine-to-coarse grained sand and silt. Locally, lenticular sandy bodies with trough and planar cross-beds (St, Sp) are preserved (Figure 3a). Overall, the particle size of the gravels varies greatly, with small pebbles between 0.5 and 1 cm and cobbles ranging from 10 to 20 cm. A few large blocks (up to ~70 cm diameter) occur at the base. This unit fines upward in section VII, with particle size ranging from 60–70 cm at the bottom to 10–20 cm at the top (Figure 3b). The gravel is mainly composed of vein quartz, sandstone, granodiorite, and quartzite, as well as lesser amounts of granite and platy green schist. Sample II-1 (Table 2) is mainly composed of fine-to-medium sand (modal value of 225 µm) with a small amount of fine silt (Figure 3d).
Interpretation
The disorganized and relatively rounded gravels, the sharp lateral changes of thickness (Figure 2), and the slope of unit 1 (5–9°) reflect deposition on a streamflow-dominated alluvial fan. The slope of U1 is relatively steep over a short distance but decreases eastward, which points to alluvial fan deposition with an eastward flow direction from the gorge to the depression. The flow direction is confirmed by the imbrication of gravels (e.g., Figure 3a) and also by the gravel composition, which reflects source areas in the upstream Huangshui catchment (including the nearby gorge), rather than local sources of Mesozoic to Cenozoic reddish sandstone that fill the Ping’an depression.
The sediments are interpreted as high-magnitude streamflow deposits on the basis of weakly developed imbrication, crude stratification, sub-rounded-rounded gravel shape, and the lack of basal inverse grading. The laterally extensive, sheet-like geometry of Gh beds within U1 is indicative of streamflow on low-relief longitudinal bars [70], and the planar cross-sets developed in Gp facies are interpreted as the foresets of low bars and dunes. The poorly sorted and disorganized gravels in facies Gmm and Gcm are indicative of rapid deposition from a highly concentrated sediment dispersion. High-energy streamflows can transport a mixture of gravel and sand in thin bedload sheets [35] and thick traction carpets [71]. Additionally, the interbedded sandy lenses could represent waning stages of the flows that laid down the gravel, or low-energy secondary overland flows across the gravel surface. The upward decrease in clast size indicates a declining energy towards the top of U1. The overall characteristics of this facies association are suggestive of a high-energy alluvial fan, which aggraded rapidly as a result of highly concentrated streamflows.
4.1.2. Low-Energy Alluvial Fan (Facies Association 2)
Description
The middle part of the succession includes four units of mica-rich sand and silt (U2–U5, from bottom to top (Figure 2)). The overall thickness of facies association 2 ranges from 8.75 m to 13.6 m, and the top and basal parts contain a <5 cm thick layer of granules and pebbles of a ~1–3 cm size.
Unit 2 (U2) is dominated by pale-brown, silty sand and sand, locally interbedded with reddish-brown silt. The facies are mainly horizontal lamination (Sh) with minor trough cross-stratification (St), ripple cross-lamination (Sr), and planar cross-bedding (Sp) (Figure 4). U2 extends laterally for more than 150 m, and is 0.4 m thick in section II, absent from section III, and 2.8 m thick in section IV. Calcareous cement and a few nodules are present. Coarse sand is locally interbedded with lenses of 1–2 cm-sized pebbles (section VII). The beds show distinct boundaries and include local scours into the underlying gravel beds of U1.
Units 3 (U3), 3.2–5.4 m thick, and 5 (U5), 2.1–3.5 m thick, are characterized by laterally extensive alternate beds of reddish-brown silt and pale yellow-to-orange, micaceous sand and silty sand. The silt predominates (Figure 5), especially in U5. The thickness of individual reddish silt beds varies from 3 to 20 cm, and they typically have abrupt bases and tops, but fine upward locally, with stacked layers occupying slight hollows in places. The beds become thinner upwards in U3 in section III (~15–20 cm to ~3–10 cm). The reddish silt layers are structureless (Fm) or weakly laminated (Fl), and some show ripple structures (Fl) and weak soil formation (Fr). Mottling in some silt layers may be due to iron and manganese coatings or organic matter. The pale sand layers comprise horizontal lamination (Sh), minor low-angle cross-bedding (Sl), ripple cross-lamination (Sr), and structureless sand (Sm).
A distinctive feature of the sand layers in U3 (and locally in U4 and U5) is the presence of more than 50 connected and disconnected low mounds that were observed laterally over tens of metres in the outcrop and vertically over 7 m (Figure 5, Figure 6 and Figure 7). The mounds have convex-up forms and contain form-concordant bedding that builds in height from a planar or gently inclined base; many contain ripple cross-lamination. The mounds are mainly symmetrical to slightly asymmetrical in cross-section, and although none were observed in three-dimensions, we infer from the similarity of cross-sectional form of many examples that the mounds are circular to slightly elongate in planform. In one case, a single mound divided into two and later recombined as the sand aggraded. The mounds are bordered by reddish clay layers that curve upward (upturned beds) and pinch out against the mounds. Successive clay layers extend progressively further across the mounds and eventually cover them. Most mounds are isolated (Figure 7a), but a few mounds at the same level are connected by thin sand layers (Figure 6). Root traces were observed in one mound (Figure 5).
For thirty-seven mounds that were low in the cliff and readily measured and photographed, the thickness ranges from 0.05 m to 1.14 m (mean 0.24 m), and the width ranges from 0.6 m to 5.14 m (mean 1.48 m), with a positive correlation of thickness and width (Figure 8). The aspect ratio (width/thickness) of the mounds averages 7.5, with most being between 5 and 10 (Figure 8).
At several levels, up to six mounds separated by thin clay layers are stacked near-vertically, to a maximum height of 2.3 m and width of 5.14 m, with a positive correlation between thickness and width (Figure 7 and Figure 8). The width/thickness ratio of the stacked mounds ranges from 0.9 to 2.9. One stack of mounds shows a slight lateral drift in the crest position of individual mounds through time.
Gravel lenses, 10 cm thick and 3 m wide, are commonly present on the eastern side of vertically stacked mounds in section V, lapping in places against them. Some mounds are interbedded with 5–10 cm-thick silt layers that include 1–5 cm pebbles (Figure 7b). In places, U3 contains a higher proportion of dispersed, trough cross-stratified gravel lenses and sand mounds 1.5 m wide and 15 cm thick (Figure 9a,b). Both U3 and U5 show a small amount of white calcareous cement and nodules in silty layers and granules in coarse sand layers (Figure 9c), root traces (Figure 5), and bioturbation and desiccation cracks (Figure 9d).
Unit 4 (U4) is 2.4 to 3.6 m thick and is composed of silty sand and sand with horizontal lamination (Sh), planar cross-bedding (Sp), and low-angle cross lamination (Sl) (Figure 10a,b). Laterally, sand layers thin eastwards, where more and thicker reddish-brown silt layers appear; these layers are absent to the west in section VII. A sand mound and root traces with weak pedogenesis are present in the upper part of U4 in section II (Figure 10b). U4 in sections IV and PA and east of section V is characterized by large sand mounds interbedded with reddish-brown silt layers (Figure 2). In contrast with other sections further east, U4 in section VII contains gravel layers with trough cross-bedding (Gt) and channel forms 1–1.5 m wide and 0.6 m thick that contain clast-supported gravel (Gcm) with clast sizes of 10–15 cm (Figure 10d). Large angular blocks (up to ~1 m) are present locally. The small channel fills become thinner and their elevation in the area of section VII becomes lower when moving eastward.
OSL- and Grain-Size Analyses
In total, 11 OSL samples and 45 grain-size samples were taken from facies association 2 (Table 2), with the positions of some samples shown in Figure 4e and Figure 11a–e.
U2: samples II-4 (from section II) and VII-1 (from section VII) are mainly coarse silt-to-fine sand with a modal value of 80 and 100 µm, respectively, and IV-1 is coarser with a modal size of 126 µm and is rather poorly sorted. Sample II-2 is very fine-to-medium sand (mode of 178 µm). Sample II-3 is poorly sorted silt with a modal value of 10 µm, mixed with a small amount of clay and sand. This silt is also present, although in very small amounts, in all other sediments of U2.
U3: all samples from sand mounds are closely similar (except IV-4), mainly consisting of well-sorted fine sand and coarse silt (major mode of 63–79 µm), minor fine silt (mode of 9–10 µm), and a very small amount of coarse sand (mode of 502 µm). Although sample IV-4 consists of very fine sand and coarse silt with a modal value of 71 µm, it also contains coarse to very coarse sand with a secondary modal value of 1262 µm, which may represent ferruginous or manganese concretions. The grain-size distribution of samples from silt layers is mostly bimodal, with main peaks of 32–45 µm and a secondary modal value of 7–8 µm. Sample III-1 is poorly sorted and only contains the very fine fraction with a modal value of 11µm. Compared with other samples in silt layers, samples IV-2 and VII-2 are relatively coarser grained, containing some sand. Samples I-2, I-3, I-5, and IV-3 from sand layers are very similar to samples taken from the sand mounds in this unit (very fine sand and coarse silt and minor amount of fine silt), but they are slightly finer grained with a modal value of 56–71 µm. Other samples from sections III and VII show grain-size distributions that are similar to equivalent ones in the other sections (Figure 11).
U4: samples I-10 and V-3 are mainly very fine sand and coarse silt with a modal value of 63 µm, mixed with a small amount of fine silt similar to many other samples. Samples II-9 and II-10 are fine-to-medium sand with a modal value of 200 µm, but II-9 shows a secondary modal value (1416 µm) in the very-coarse sand fraction.
U5: sample II-11 from silty laminated beds is almost identical to V-2 (in U3), presenting a bimodal distribution with a modal value of 45 and 8 µm. Sample VII-5, also from a silt bed, is similar to I-4 and VII-4 in U3, but shows a secondary modal value in the sand fraction (448 µm). Sample II-12 from a sand bed is mainly composed of very fine sand and coarse silt (major mode of 56 µm), but contains more fine silt and clay.
Interpretation
The horizontally laminated, trough and planar cross-bedded, and ripple cross-laminated facies (Sh, St, Sp, Sr) in U2 are interpreted as fluvial in origin. The abundance of horizontal lamination (Sh) indicates a common transition to an upper-flow regime. The local presence of cross-beds (St, Sp) may represent channel deposits of two- and three-dimensional dunes within low-energy channels, commonly as minor channels on gravel sheets at the top of unit 1 and within units 2–5 [72]. The ripple cross lamination (Sr), locally present at the bed tops, implies the gradual waning of flow, typically at the end of flood events [54,73].
The large differences in the grain-size of samples II-2, 3, and 4 (Figure 4d) in a 0.4 m thick sediment sequence in unit 2, show a variable transport energy. Sample II-2 (St) is coarser and contains more fine-to-medium sand than II-4, IV-1, and VII-1 (Sh), in line with the sedimentary structure, which represents a variable transport energy. Sample II-3 contains higher amounts of fine silt and clay, corresponding with the increase of carbonate cement in structureless silt that underwent weak pedogenesis. Planar to low-angle cross-bedded sand (Sl) points to sandy sheet flows. The presence of sand sheets a half meter to a few meters thick, showing little evidence of channelization and interbedded with silt with carbonate cement, is regarded as a clear indication of ephemeral, flash-flood sedimentation [54].
In U3 and U5, the alternate coarse- and fine-grained beds point to moderate- to low-energy fluvial transport. The interbedding of sand, thin silt layers, and gravel is considered the product of flood-wash over the surface of the alluvial fan or of fluctuations in flow strength during a single flow event [74]. The gravel stringers may represent diffuse channel lag sheets [75]. At some levels, the interspersed, incised gravel lenses in units U3, U4, and U5 are interpreted as shallow gravelly channels migrating on the surface of an alluvial-fan, and the eastward decrease in their scale and abundance in U4 indicates that wedges of coarser channelized sediment spread eastwards across the fan at this level, fining to silt away from the source. The presence of channel forms with bases scoured into sand sheets but coalescing above (Figure 10d), lenses of gravel, and some cross bedding is consistent with deposition from shallowly incised to poorly confined, braided-river channels on the fan surface, similar to those described by Nemec and Postma [75]. Sheets of gravel and sand lenses were the product of the lateral migration of the flow over the fan surface during a discharge event, or of the amalgamation of deposits laid down by several events. The bimodal grain-size distributions result from the mixture of clay with fine to coarse silt (I-9, II-11, III-3, V-2) and coarse silt to fine sand with very coarse sand (II-9, III-4, IV-4), resulting in poor sorting. These distributions reflect considerable hydrodynamic variation during deposition.
The beds of structureless and laminated silt (Fm, Fl) mark suspended-load deposition from low-velocity sheet flows. The presence of low-relief hollows filled with silt beds indicates that some flows covered a slightly irregular landscape, but there is little indication of strong scouring during these events. The abrupt silt beds, which locally fine upward, formed in single flow events, and their considerable thickness (typically 5–15 cm) suggests that large amounts of fine sediment were available during floods and that the successions aggraded rapidly. In places, reworking due to bioturbation and weak pedogenic processes contributed to the structureless nature and mottling of the Fm silt [74].
Sample VII-5, from fine laminated silt (U5), is similar to I-4, II-5, and VII-4 in U3, but the presence of coarse sand, analogous to samples I-2 and IV-3 in U3, indicates an occasional flood event. Samples II-6 (U3), III-2 (U2), and VII-1 (U2) are very-fine sand, which suggests streamflow or a low-energy sheet flow.
Considering the extent of horizontally laminated sand over tens of meters and the grain-size distributions of samples II-4, IV-1, and VII-1, we attribute the U2 sand sheets to moderate-energy, shallow sheet flows, capable of forming plane lamination in the upper flow regime. The predominant reddish mud layers represent lower energy flows from which fine suspended sediment settled out, and the occasional root traces and carbonate nodules indicate phases of stability and weak post-depositional pedogenic modification as temporary interruptions in deposition [76]. The observed poorly developed soil and desiccation cracks may also indicate the temporary sub-aerial exposure of shallow channels on the alluvial fan [77]. The small fine clay fraction (<1 µm) is probably due to soil formation in accordance with the presence of root traces and carbonate nodules. Sample II-3 from a silt bed with carbonate nodules contains a relatively high fraction of <1 µm clay, which supports this hypothesis.
The mounds have been previously attributed to several processes, including formation by termites [78]. However, the mounds in several units at Ping’an are interpreted as vegetation-induced sedimentary structures, formed as upturned beds with form-concordant stratification around in situ plants that decreased current velocity and promoted deposition [79]. Upright plants were not noted in association with the mounds, which may reflect decay of the vegetation and/or the presence of vegetation outside the plane of the cross-section. However, roots were observed in one instance (Figure 5). The positive correlation of mound width and thickness (Figure 8) indicates that the mounding process typically formed wider mounds as their height increased, as expected for the accumulation of soft sand. The mounds were fully developed as elevated bedforms prior to mud deposition, as indicated by the onlap of mud layers against the mounds. There is little indication of the erosion of sand where the mud drapes the mounds, suggesting that the clay settled from gently flowing or stagnant water. There is also little indication of deformation of the soft sand in the mounds, probably due to subsequent induration of the clay during sub-aerial exposure.
In general, the grain-size distributions of all samples from sand mounds (except IV-4) are almost identical, which implies a relatively similar transport energy. On the basis of the non-erosional bases of the stacked mounds and their closely similar grain-size distributions, we interpret the mounds as formed during aeolian deposition. The main modal value of 56~71 µm (see sediment type 1.a of Vandenberghe [80]) may point to saltation, which is analogous to the typical component of loess deposits overlying river terraces along the Huangshui River [51,81]. The secondary mode of 10 µm resembles that of an original fine-grained loess deposit (type 1c.2 of Vandenberghe [80]). The two fractions may occur in different relative percentages. Most sediments in the mounds (except IV-4) and some sediments in other sand layers (for example, I-2, 3, 5, 10, IV-3, V-3) show a small content of fine-silt components. Some samples (II-1, 9, III-4, IV-1, 4) contain a fraction of medium-coarse sand, interpreted as fluvial in origin.
Two other lines of evidence support an aeolian origin for the mounds. The planar bases of the mounds and the lack of scouring contrast with the abundance of scours around vegetation, which is typical of fluvial settings with high-velocity flow [79]. However, in other settings, scours are commonly associated with larger upright trunks, and smaller and less rigid plants would have been less likely to promote scour. The predominantly symmetric form in the cross-section implies mounding under gentle flow conditions, again in contrast to many fluvial examples elsewhere.
The presence in a few cases (Figure 6) of mounds of a similar height and quasi-regular spacing, connected by thin sand layers, might be interpreted as suites of mega-ripples. However, samples suggest a grain-size distribution compatible with an aeolian origin. Additionally, the examples lack unidirectional flow indicators such as planar cross-sets, and they are interpreted as mounds formed around closely spaced plants where enough sand was available to connect the mounds.
We interpret facies association 2 as the product of several processes. Higher energy flows laid down gravel and sand in shallowly incised and extensive braided-channel systems, especially in the western part of the outcrop belt. Associated sheet floods laid down thin sand and silt layers, which were locally affected by desiccation and incipient soil formation. The sand was redistributed by aeolian processes to form individual and stacked mounds around standing vegetation. In combination, these deposits represent an alluvial fan under moderate-energy, but predominantly low-energy, conditions [76].
4.1.3. Floodplain (Facies Association 3)
Description
The upper part of the succession in unit 6 (U6) is characterized by abundant layers of structureless sandy silt and silt (Fm) interbedded with thin reddish-brown fine laminated silt (Fl), forming a broadly fining-upward succession (Figure 12). Carbonate nodules occur locally within facies Fl. The thickness of each coarser-silt layer ranges from 1.7 m to 7 m and the thin finer-silt layers are up to 0.5 m thick. U6 is well exposed in section V, with a maximum thickness of 8.7 m.
Interpretation
Facies Fm reflects deposition from low-energy flows during waning-flow and channel abandonment on the alluvial fan [54,74]. The fine grain size and lack of distinct channel structures argue for floodplain deposits, which may have developed in an inactive part of the alluvial system that only received sediment during overbank floods. The structureless form and carbonate nodules suggest that the sediments were subject to weak pedogenic processes [72] on a floodplain that aggraded rapidly [82]. The grain-size distributions (Figure 11f) point to sediment that settled after the main flooding event or at the terminal calm period of the flooding event in pools on the floodplain. The fine silt may be interpreted as aeolian in origin but later reworked by the river and laid down in the standing water of pools on the floodplain [80,83]. The integration of all these characteristics points to floodplain processes in a low-energy fluvial system.
4.2. Dating Results
Table 3 shows all analytical data and quartz SAR-OSL ages and K-feldspar pIRIR290 ages. The dates using each mineral show a relatively close grouping, without an apparent upward age trend (Table 3, Figure 13c).
For quartz SAR-OSL ages, the samples (XX-II-1, XX-C600, and XX-C490) in unit 2 were dated to around 78 ka, 86 ka, and 81 ka, respectively (Table 3). Samples XX-C200, XX-II-2, and XX-V-1 in unit 3, were dated to around 83 ka, 74 ka, and 83 ka, respectively (Table 3). Samples XX-II-3 from planar cross-bedded sand in unit 4 and XX-B100 from a sand layer in unit 5 were dated to around 89 ka and 87 ka, respectively (Table 3). Samples XX-A90 and XX-A220 in unit 6 were dated to around 72 ka and 92 ka, respectively (Table 3). The quartz SAR-OSL ages may be underestimated because the credible upper limit of an equivalent dose is ~200 Gy [84,85,86]. All samples calculated from quartz-De values are more than 200 Gy (Table 3), and therefore, exercising prudence, these should be regarded as minimum ages. In summary, the quartz SAR-OSL ages demonstrate that these samples are older than 72 ka.
For K-feldspar pIRIR290 ages, the samples XX-II-1, XX-V-1, XX-II-2, XX-II-3, XX-A220, and XX-A90 were dated to 133 ± 7 ka, 133 ± 7 ka, 131 ± 7 ka, 134 ± 8 ka, 135 ± 10 ka, and 131 ± 7 ka, respectively (Table 3), which suggests rapid aggradation. Samples XX-I-1 and XX-V-2 from the sand mounds in unit 3 were dated to 143 ± 7 ka and 140 ± 8 ka, respectively, and sample XX-VI-1 from horizontal laminated sand in unit 2 was dated to 158 ± 10 ka (Table 3). It should be mentioned that, when a high-temperature post-IR IRSL (pIRIR) was carried out at 290 °C, less-fading or a non-fading signal may be supposed, and thus accurate fading corrections are not necessary, especially for older samples [58,62]. In summary, the K-feldspar pIRIR290 ages appear in the range of ~168 to ~124 ka.
In assessing dates that were derived using protocols for quartz and feldspar, we consider the feldspar pIRIR dates to be reliable, and they form the basis for later interpretation. The quartz SAR dates with De values in excess of 200 Gy provide minimum age for the samples, and they are helpful in constraining the age of the Ping’an sections.
5. Discussion
5.1. Origin of Stacked Sand Mounds, and the Interaction of Aeolian and Alluvial Process
Standing vegetation is able to slow sediment transport by hindering the flow in channels and overbank areas [87,88,89,90,91] and similarly decreasing the wind velocity. Downflow movement of sediment combined with in situ accumulation of organic material forms mounds around plants [79], and the local presence of root traces in the sections (Figure 5 and Figure 10b) supports a link to vegetation. The nature of the nucleating vegetation is unclear, but the plants were probably thin shrubs or clumps of grass and herbaceous vegetation, based on the lack of several features (scour hollows with centroclinal cross strata, decay-related hollows with downturned beds, and stump casts [79,92]), which are commonly associated with thicker and stronger plants. This interpretation of the kind of vegetation matches palynological results at nearby sites on a terrace that might correlate with the studied sand-pit, around 10 km to the south, which shows herbaceous plants dominated by Artemisia and Chenopodiaceae growing in valleys [93].
Grain-size analysis provides important evidence for discriminating between fluvial and aeolian processes as agents responsible for the formation of the mounds. The grain-size distributions of all samples from different mounds and from sediments at different locations in a single mound are very similar, containing significant amounts of well-sorted very fine sand and coarse silt with modal values of 63–71 µm (Figure 11a). The low modal values and narrow grain-size range support accumulation by aeolian processes. Supporting sedimentological evidence for an aeolian origin includes the planar base of the mounds (Figure 7) and their mainly symmetric form.
The identification of vegetation-induced structures in deposits that largely lack preserved vegetation has important implications for the depositional setting, as does the interpretation of aeolian activity in their formation. The stacking of sandy mounds onlapped by finer sediment suggests that accumulation of water-laid deposits alternated with periods of aeolian reworking. Raindrop imprints and desiccation cracks (Figure 9d,e) also indicate temporary subaerial exposure on the alluvial fan. Sufficient time was available between inundation events for vegetation to become established, and the abundance of mounds suggests that the fan was well vegetated at times, although the plants were probably modest in scale. Stacked mounds with more than 2 m of sediment in aggregate suggest a rapid aggradation of sediment during the life of a single plant or group of plants on the fan.
During dry periods or seasons, the wind reworked the exposed alluvial material transported onto the fan. Under the effect of plants, the wind slowed and the material was redeposited, forming mounds as shrub-coppice dunes. The mounds were dated at a roughly similar age of ~143–131 ka. The mounds thus developed from aeolian processes over a short period, alternating with alluvial deposition, at the transition from marine isotope stage (MIS) 6 to MIS 5.
Most mound sediments are composed of two major components, fine silt (mode at 7~10 µm) and very fine sand or coarse silt (mode at 56~71 µm). These may reflect two typical aeolian components [80] that were reworked but preserve their original grain-size [83]. The finest silt component in all samples can be viewed as dust transported in high-level suspension clouds, as in westerlies over a long distance [94,95,96]. The coarse component can be regarded as derived from low-level suspension during spring-summer dust storms from proximal sources, for instance, dry interfluves or river terraces [5,26,83,97]. Combining the evidence from sedimentary structures and grain size, the deposits record the interaction of aeolian and alluvial processes on the fan, with wind action reworking local alluvial sediment and additions from distantly derived suspension clouds.
5.2. Alluvial-Fan Process and Links to Autogenic Models and Exterior Controls (Climate and Tectonics)
The upward-fining succession at Ping’an (Figure 13b) from a high-energy (gravel sheet of unit 1) to a low-energy facies association (sands and muds of units 2–5, with minor gravel), capped by a floodplain facies association (unit 6 muds), is attributed to deposition on a stream-dominated alluvial fan. Eastward fining in parts of the succession, along with paleoflow information from imbrication and the orientation of channel bodies, indicates sediment transport from the exit point of the Xiao gorge into the Ping’an depression. The complex intercalation of gravel, sand, and mud bodies; the rapid lateral fining; and the steep upper contact of unit 1 accord well with deposition on an alluvial fan, rather than deposition on the alluvial plain of the Huangshui river. In view of the transport direction, the fan succession is interpreted as a deposit of the mainstem Huangshui river, rather than a tributary valley. The units are conformable, and the succession is most simply interpreted as the product of a single alluvial-fan lobe (Figure 13a).
Many features of the Ping’an succession may be explained by an autogenic model for fan evolution in a situation of rapid sediment supply and buildup. Channel patterns in alluvial settings are mainly dependent on water discharge, sediment load, and basin slope [54], and these parameters change intrinsically as fans develop.
The succession is interpreted here in accord with this model (Figure 13a). As lobe 1 began to develop, the relatively steep slope of the alluvial fan led to high competency and deposition from the upper flow regime, laying down clast-supported, planar cross-stratified, and crudely horizontally stratified gravel of unit 1 (facies association 1). As accumulation proceeded, the slope gradually decreased. As the lobe built up vertically and extended downflow through time, the river exhibited a lower energy and transported finer sediment in repeated flood pulses, with occasional gravel from flash flooding (facies association 2). Streamflow was poorly confined on the fan, causing a decrease in capacity and velocity, and lenticular gravels were deposited in minor, shallow channels of a braided style. Rapid aggradation of the sediment sequence in units 2 to 5, as shown by the mound accumulations and thick fine-grained flood beds, was temporarily interrupted by weak pedogenesis of the deposits. As the elevation of the lobe increased, only the highest magnitude floods would have deposited sediment on the top of the succession. River incision and diversion would have transferred deposition to a successor lobe 2 (Figure 13a), leaving lobe 1 inactive.
This simplified model is subject to several caveats. The abrupt change from unit 1 gravel to finer sediment implies a sudden change in transport conditions. River incision and lobe abandonment may have commenced after the deposition of unit 5 (facies association 2), and the floodplain succession of facies association 3 may reflect flooding that topped lobe 1 as lobe 2 or lobe 3 built in elevation. Scouring along some surfaces (e.g., unit 1/2 contact), upward fining in several units, and the pronounced lateral facies change in unit 4 indicate that accumulation involved a series of events, and it is possible that the succession includes deposits of several superimposed or overlapping fans. These influenced the supply of water and sediment to the fan and were superimposed on the progressive growth of the fan lobe. The topmost part of unit 6 has been eroded, and it is not known whether a more mature paleosol or other evidence of a hiatus was originally present.
The studied sediment sequence started with high-energy alluvial gravels of unit 1, the top of which, in the western part of the pit, is 26 m above the flood plain of the Huangshui River. This unit may relate to terraces at 26 m above the floodplain upstream, at the west end of the Xiao gorge in the Xining basin [45,48], and downstream of the pit in the Ping’an depression [99]. Before the studied fan sequence was deposited, several higher terraces formed in the Ping’an depression [99]. The presence of these terraces indicates that the Xiao gorge had been cut and depressions upstream and downstream of the gorge (Xining and Ping’an respectively, Figure 1a) had been connected by Huangshui River before the fan began to form. These lines of evidence suggest that the start of alluvial fan deposition was a response to the uplift of Xiao gorge as a result of reactivation of the fault at the boundary of the gorge (Figure 1b), rather than a response to the cutting of the gorge. However, the tectonic evidence needs further investigation.
Climate change is one of the major factors controlling depositional processes and played a prominent role in the formation of Quaternary alluvial fans [31,32,33,34], affecting the sediment supply and (or) flow energy. The paleoclimate during Ping’an fan deposition was relatively arid, as shown by several features: episodic deposition with periods of exposure and desiccation, frequent aeolian activity in the reworking of fluvial sediment, and the presence of modest vegetation, which nucleated aeolian sediments around plants that were probably shrubs and herbs. Although a few carbonate nodules are present, they do not form prominent petrocalcic horzions that might indicate more humid conditions.
The OSL ages provide some constraint on the timing of deposition, in relation to climatic rhythms. Based on the principles laid out above, the quartz OSL dates are underestimated, and the feldspar pIRIR290 dates are considered to provide a more reliable age. The dates are closely grouped without a clear upward stratigraphic trend (Figure 13c), and this may imply rapid deposition of the fan succession. As shown in Figure 13c, the feldspar dates with error ranges bracket Marine Isotope Stage (MIS) 6 and the transition to MIS 5. A reasonable interpretation of the dates is that the fan succession reflects rapid aggradation during the penultimate glacial (MIS 6) (units 1–5) and/or during the last interglacial (MIS 5), slowing down during stage 5 (unit 6). The fine-grained topmost floodplain beds may have been deposited at the beginning of the interglacial period (MIS 5). We speculate that during the next warm-cold transition (MIS 5 to 4), the temperature dropped and, with decreasing vegetation, lower evapotranspiration, and higher amounts of surface runoff [16,19], the river started to incise, and could no longer reach the fan surface. Thus, although some climatic response cannot be excluded, altogether, this succession is inferred to represent intrinsic fan evolution.
6. Conclusions
Based on sedimentary architecture, structures, and grain-size analysis, an alluvial-fan succession at Ping’an in the Xining basin shows the distinctive evolution of sediment processes and the environment. Three facies associations are recognized in upward succession: (1) a high-energy association with matrix- to clast-supported, disorganized, and organized gravel sheets, interpreted as highly concentrated streamflow deposits; (2) a low-energy association with laminated sand and interbedded laminated silt and sand, with vertically stacked sand mounds and dispersed gravel lenses, interpreted as braided-stream and sheet-flood deposits; and (3) a floodplain association composed of massive silt with incipient palaeosols, interpreted as the result of settling from floodwaters and weak pedogenesis. Vertically stacked mounds with form-concordant bedding are vegetation-induced sedimentary structures formed around in situ vegetation. Their grain-size distributions indicate that the mounds were the result of aeolian reworking of fluvial sediment.
Sediments were supplied from the west, from the Xiao gorge on the Huangshui River, forming a streamflow-dominated alluvial-fan system where the valley was locally enlarged. Based on sedimentary evidence and tightly grouped OSL ages, the Ping’an sediment sequence records rapid aggradation, with large volumes of fine detritus that were reworked by aeolian processes from fluvial sources. The succession yielded OSL dates of ~168–124 ka based on feldspar pIRIR290 protocol, and the site was located in the semi-arid NETP during the transition from MIS 6 to 5, from the penultimate glacial to the last interglacial.
Author Contributions
Conceptualization, X.W. and J.V.; Data curation, S.Y. and M.R.G.; Formal analysis, J.V.; Funding acquisition, X.W.; Investigation, L.G., X.W., J.V., and M.R.G.; Methodology, S.Y.; Resources, H.L.; Supervision, S.Y., J.V., M.R.G., and H.L.; Validation, J.V., M.R.G., and H.L.; Visualization, L.G., X.W., and M.R.G.; Writing—original draft, L.G. and X.W.; Writing—review & editing, X.W., J.V., and M.R.G.
Funding
This research is supported by the National Natural Science Foundation of China (41522101), the National Key Research and Development Program (2016YFA0600500), the Joint KNAW-China Exchange Program (530-5CDP07), and the Discovery Grant of the Natural Sciences and Engineering Research Council of Canada (No. 03877).
Acknowledgments
Authors are grateful to FLAG members for discussion during the field for the FLAG conference in 2017. Yang Yu, Quanxu Hu, Zhengchen Li, and Bingling Wang are thanked for their assistance during the fieldwork. MRG is grateful for funding from a Discovery Grant of the Natural Sciences and Engineering Research Council of Canada. The authors thank three anonymous reviewers and the editor (David R. Bridgland) for their constructive suggestions.
Conflicts of Interest
The authors declare no conflicts of interest.
References
- Mather, A.E.; Stokes, M.; Whitfield, E. River terraces and alluvial fans: The case for an integrated Quaternary fluvial archive. Quat. Sci. Rev. 2017, 166, 74–90. [Google Scholar] [CrossRef]
- An, Z.; Kukla, G.; Porter, S.C.; Xiao, J. Late Quaternary dust flow on the Chinese loess plateau. Catena 1991, 18, 125–132. [Google Scholar] [CrossRef]
- Ding, Z.; Liu, T.; Rutter, N.W.; Yu, Z.; Guo, Z.; Zhu, R. Ice-volume forcing of East Asian winter monsoon variations in the past 800,000 years. Quat. Res. 1995, 44, 149–159. [Google Scholar] [CrossRef]
- Long, H.; Shen, J.; Chen, J.; Tsukamoto, S.; Yang, L.; Cheng, H.; Frechen, M. Holocene moisture variations over the semiarid-arid central Asia revealed by a comprehensive sand-dune record from the central Tian Shan, NW China. Quat. Sci. Rev. 2017, 174, 13–32. [Google Scholar] [CrossRef]
- Prins, M.A.; Vriend, M.; Nugteren, G.; Vandenberghe, J.; Lu, H.; Zheng, H.; Jan Weltje, G. Late Quaternary aeolian dust input variability on the Chinese Loess Plateau: Inferences from unmixing of loess grain-size records. Quat. Sci. Rev. 2007, 26, 230–242. [Google Scholar] [CrossRef]
- Sun, Y.; Chen, J.; Clemens, S.C.; Liu, Q.; Ji, J.; Tada, R. East Asian monsoon variability over the last seven glacial cycles recorded by a loess sequence from the northwestern Chinese Loess Plateau. Geochem. Geophs. Geosyst. 2006, 7. [Google Scholar] [CrossRef] [Green Version]
- Wu, Y.; Qiu, S.; Fu, S.; Rao, Z.; Zhu, Z. Pleistocene climate change inferred from multi-proxy analyses of a loess-paleosol sequence in China. J. Asian Earth Sci. 2018, 154, 428–434. [Google Scholar] [CrossRef]
- Zhang, W.; Lu, H.; Li, C.; Dodson, J.; Meng, X. Pollen preservation and its potential influence on paleoenvironmental reconstruction in Chinese loess deposits. Rev. Palaeobot. Palynol. 2017, 240, 1–10. [Google Scholar] [CrossRef]
- Long, H.; Shen, J.; Wang, Y.; Gao, L.; Frechen, M. High resolution OSL dating of a late Quaternary sequence from Xingkai Lake (NE Asia): Chronological challenge of the “MIS3a Mega-paleolake” hypothesis in China. Earth Planet. Sci. Lett. 2015, 428, 281–292. [Google Scholar] [CrossRef]
- Xu, H.; Ai, L.; Tan, L.; An, Z. Stable isotopes in bulk carbonates and organic matter in recent sediments of Lake Qinghai and their climatic implications. Chem. Geol. 2006, 235, 262–275. [Google Scholar] [CrossRef]
- Xiao, J.; Chang, Z.; Si, B.; Qin, X.; Itoh, S.; Lomtatidze, Z. Partitioning of the grain-size components of Dali Lake core sediments: Evidence for lake-level changes during the Holocene. J. Paleolimnol. 2009, 42, 249–260. [Google Scholar] [CrossRef]
- Wang, R.; Zhang, Y.; Wünnemann, B.; Biskaborn, B.K.; Yin, H.; Xia, F.; Zhou, L.; Diekmann, B. Linkages between Quaternary climate change and sedimentary processes in Hala Lake, northern Tibetan Plateau, China. J. Asian Earth Sci. 2015, 107, 140–150. [Google Scholar] [CrossRef]
- Liu, X.; Vandenberghe, J.; An, Z.; Li, Y.; Jin, Z.; Dong, J.; Sun, Y. Grain size of Lake Qinghai sediments: Implications for riverine input and Holocene monsoon variability. Palaeogeogr. Palaeoclimatol. Palaeoecol. 2016, 449, 41–51. [Google Scholar] [CrossRef] [Green Version]
- Wang, X.; Vandenberghe, D.; Yi, S.; Vandenberghe, J.; Lu, H.; Balen, R.V. Late Quaternary paleoclimatic and geomorphological evolution at the interface between the Menyuan basin and the Qilian Mountains, northeastern Tibetan Plateau. Quat. Res. 2013, 80, 534–544. [Google Scholar] [CrossRef] [Green Version]
- Li, G.; Dong, G.; Wen, L.; Chen, F. Overbank flooding and human occupation of the Shalongka site in the Upper Yellow River Valley, northeast Tibet Plateau in relation to climate change since the last deglaciation. Quat. Res. 2014, 82, 354–365. [Google Scholar] [CrossRef]
- Wang, X.; Vandenberghe, J.; Yi, S.; Van Balen, R.; Lu, H. Climate-dependent fluvial architecture and processes on a suborbital timescale in areas of rapid tectonic uplift: An example from the NE Tibetan Plateau. Glob. Planet. Chang. 2015, 133, 318–329. [Google Scholar] [CrossRef]
- Harvey, A.M.; Mather, A.E.; Stokes, M. Alluvial fans: Geomorphology, sedimentology, dynamics—Introduction. A review of alluvial-fan research. In Alluvial Fans: Geomorphology, Sedimentology, Dynamics; Harvey, A.M., Mather, A.E., Stokes, M., Eds.; Geological Society: London, UK, 2005; pp. 1–7. ISBN 1-86239-189-0. [Google Scholar]
- Vandenberghe, J. Timescales, climate and river development. Quat. Sci. Rev. 1995, 14, 631–638. [Google Scholar] [CrossRef]
- Vandenberghe, J. Climate forcing of fluvial system development: An evolution of ideas. Quat. Sci. Rev. 2003, 22, 2053–2060. [Google Scholar] [CrossRef]
- Bridgland, D.R. The record from British Quaternary river systems within the context of global fluvial archives. J. Quat. Sci. 2010, 25, 433–446. [Google Scholar] [CrossRef]
- Vandenberghe, J. River terraces as a response to climatic forcing: Formation processes, sedimentary characteristics and sites for human occupation. Quat. Int. 2015, 370, 3–11. [Google Scholar] [CrossRef]
- Hollands, C.B.; Nanson, G.C.; Jones, B.G.; Bristow, C.S.; Price, D.M.; Pietsch, T.J. Aeolian–fluvial interaction: Evidence for Late Quaternary channel change and wind-rift linear dune formation in the northwestern Simpson Desert, Australia. Quat. Sci. Rev. 2006, 25, 142–162. [Google Scholar] [CrossRef]
- Belnap, J.; Munson, S.M.; Field, J.P. Aeolian and fluvial processes in dryland regions: The need for integrated studies. Ecohydrology 2011, 4, 615–622. [Google Scholar] [CrossRef]
- Williams, M. Interactions between fluvial and eolian geomorphic systems and processes: Examples from the Sahara and Australia. Catena 2015, 134, 4–13. [Google Scholar] [CrossRef]
- Han, G.; Zhang, G.; You, L.; Wang, Y.; Yang, L.; Yang, J.; Zhou, L.; Yuan, M.; Zou, X.; Cheng, H. Deflated rims along the Xiangshui River on the Xiliaohe Plain, Northeast China: A case of active fluvial–aeolian interactions. Geomorphology 2016, 257, 47–56. [Google Scholar] [CrossRef]
- Wang, X.; Ma, J.; Yi, S.; Vandenberghe, J.; Dai, Y.; Lu, H. Interaction of fluvial and aeolian sedimentation processes and response to climate change since the last glacial in a semi-arid environment along the Yellow River. Quat. Res. 2018. [Google Scholar] [CrossRef]
- Armitage, J.J.; Duller, R.A.; Whittaker, A.C.; Allen, P.A. Transformation of tectonic and climatic signals from source to sedimentary archive. Nat. Geosci. 2011, 4, 231–235. [Google Scholar] [CrossRef]
- Stokes, M.; Cunha, P.P.; Martins, A.A. Techniques for analysing Late Cenozoic river terrace sequences. Geomorphology 2012, 165–166, 1–6. [Google Scholar] [CrossRef]
- Allen, P.A.; Armitage, J.J.; Carter, A.; Duller, R.A.; Michael, N.A.; Sinclair, H.D.; Whitchurch, A.L.; Whittaker, A.C. The Qs problem: Sediment volumetric balance of proximal foreland basin systems. Sedimentology 2013, 60, 102–130. [Google Scholar] [CrossRef]
- Chen, L.; Steel, R.J.; Guo, F.; Olariu, C.; Gong, C. Alluvial fan facies of the Yongchong Basin: Implications for tectonic and paleoclimatic changes during Late Cretaceous in SE China. J. Asian Earth Sci. 2017, 134, 37–54. [Google Scholar] [CrossRef]
- Ritter, J.B.; Miller, J.R.; Enzel, Y.; Wells, S.G. Reconciling the Roles of Tectonism and Climate in Quaternary Alluvial Fan Evolution. Geology 1995, 23, 245–248. [Google Scholar] [CrossRef]
- Harvey, A.M.; Silva, P.G.; Mather, A.E.; Goy, J.L.; Stokes, M.; Zazo, C. The impact of Quaternary sea-level and climatic change on coastal alluvial fans in the Cabo de Gata ranges, southeast Spain. Geomorphology 1999, 28, 1–22. [Google Scholar] [CrossRef]
- Hartley, A.J.; Mather, A.E.; Jolley, E.J.; Turner, P. Climatic controls on alluvial-fan activity, Coastal Cordillera, northern Chile. In Alluvial Fans: Geomorphology, Sedimentology, Dynamics; Harvey, A.M., Mather, A.E., Stokes, M., Eds.; Geological Society: London, UK, 2005; pp. 95–116. ISBN 1-86239-189-0. [Google Scholar]
- Waters, J.V.; Jones, S.J.; Armstrong, H.A. Climatic controls on late Pleistocene alluvial fans, Cyprus. Geomorphology 2010, 115, 228–251. [Google Scholar] [CrossRef]
- Frostick, L.E.; Reid, I.A.N. Climatic versus tectonic controls of fan sequences: Lessons from the Dead Sea, Israel. J. Geol. Soc. 1989, 146, 527–538. [Google Scholar] [CrossRef]
- Jolley, E.J.; Turner, P.; Willams, G.D.; Hartley, A.J.; Flint, S. Sedimentological response of an alluvial system to Neogene thrust tectonics, Atacama Desert, northern Chile. J. Geol. Soc. 1990, 147, 769–784. [Google Scholar] [CrossRef]
- Sinha, R.; Ahmad, J.; Gaurav, K.; Morin, G. Shallow subsurface stratigraphy and alluvial architecture of the Kosi and Gandak megafans in the Himalayan foreland basin, India. Sediment. Geol. 2014, 301, 133–149. [Google Scholar] [CrossRef]
- Stokes, M.; Mather, A.E. Controls on modern tributary-junction alluvial fan occurrence and morphology: High Atlas Mountains, Morocco. Geomorphology 2015, 248, 344–362. [Google Scholar] [CrossRef]
- Horton, B.K.; Decelles, P.G. Modern and ancient fluvial megafans in the foreland basin system of the central Andes, southern Bolivia: Implications for drainage network evolution in fold-thrust belts. Basin Res. 2001, 13, 43–63. [Google Scholar] [CrossRef]
- Arzani, N. The fluvial megafan of Abarkoh Basin (Central Iran): An example of flash-flood sedimentation in arid lands. In Alluvial Fans: Geomorphology, Sedimentology, Dynamics; Harvey, A.M., Mather, A.E., Stokes, M., Eds.; Geological Society: London, UK, 2005; pp. 41–59. ISBN 1-86239-189-0. [Google Scholar]
- Hoorn, C.; Straathof, J.; Abels, H.A.; Xu, Y.; Utescher, T.; Dupont-Nivet, G. A late Eocene palynological record of climate change and Tibetan Plateau uplift Xining basin, China. Palaeogeogr. Palaeoclimatol. Palaeoecol. 2012, 344–345, 16–38. [Google Scholar] [CrossRef]
- Chi, Y.; Fang, X.; Song, C.; Miao, Y.; Teng, X.; Han, W.; Wu, F.; Yang, J. Cenozoic organic carbon isotope and pollen records from the Xining basin, NE Tibetan Plateau, and their palaeoenvironmental significance. Palaeogeogr. Palaeoclimatol. Palaeoecol. 2013, 386, 436–444. [Google Scholar] [CrossRef]
- Zhang, C.; Guo, Z. Clay mineral changes across the Eocene–Oligocene transition in the sedimentary sequence at Xining occurred prior to global cooling. Palaeogeogr. Palaeoclimatol. Palaeoecol. 2014, 411, 18–29. [Google Scholar] [CrossRef]
- Zan, J.; Fang, X.; Yan, M.; Zhang, W.; Lu, Y. Lithologic and rock magnetic evidence for the Mid-Miocene Climatic Optimum recorded in the sedimentary archive of the Xining basin, NE Tibetan Plateau. Palaeogeogr. Palaeoclimatol. Palaeoecol. 2015, 431, 6–14. [Google Scholar] [CrossRef]
- Vandenberghe, J.; Wang, X.; Lu, H. Differential impact of small-scaled tectonic movements on fluvial morphology and sedimentology the Huang Shui catchment, NE Tibet Plateau. Geomorphology 2011, 134, 171–185. [Google Scholar] [CrossRef]
- Wang, X.; Lu, H.; Vandenberghe, J.; Zheng, S.; Balen, R.V. Late Miocene uplift of the NE Tibetan Plateau inferred from basin filling, planation and fluvial terraces in the Huang Shui catchment. Glob. Planet. Chang. 2012, 88–89, 10–19. [Google Scholar] [CrossRef]
- Wu, Q.; Zhao, Z.; Liu, L.; Granger, D.E.; Wang, H.; Cohen, D.J.; Wu, X.; Ye, M.; Bar-Yosef, O.; Zhang, J.; et al. Outburst flood at 1920 BCE supports historicity of China’s Great Flood and the Xia dynasty. Science 2016, 353, 579–582. [Google Scholar] [CrossRef] [PubMed]
- Wang, X.; Vandenberghe, J.; Lu, H.; Balen, R.V. Climatic and tectonic controls on the fluvial morphology of the Northeastern Tibetan Plateau China. J. Geogr. Sci. 2017, 27, 1325–1340. [Google Scholar] [CrossRef]
- Lu, H.; Wang, X.; Sun, X.; Wang, X.; Yi, S.; Zhou, Y.; Liu, Q. Loess stratigraphy and palaeoclimate changes during Quaternary in northeastern Tibetan Plateau revealed by loess core. Quat. Res. 2007, 27, 230–241, (In Chinese with English Abstract). [Google Scholar]
- An, Z.; Colman, S.M.; Zhou, W.; Li, X.; Brown, E.T.; Jull, A.J.T.; Cai, Y.; Huang, Y.; Lu, X.; Chang, H.; et al. Interplay between the Westerlies and Asian monsoon recorded in Lake Qinghai sediments since 32 ka. Sci. Rep.UK 2012, 2, 619. [Google Scholar] [CrossRef] [PubMed] [Green Version]
- Vandenberghe, J.; Renssen, H.; Van Huissteden, K.; Nugteren, G.; Konert, M.; Lu, H.; Dodonov, A.; Buylaert, J. Penetration of Atlantic westerly winds into Central and East Asia. Quat. Sci. Rev. 2006, 25, 2380–2389. [Google Scholar] [CrossRef]
- Henderson, A.C.G.; Holmes, J.A.; Leng, M.J. Late Holocene isotope hydrology of Lake Qinghai, NE Tibetan Plateau: Effective moisture variability and atmospheric circulation changes. Quat. Sci. Rev. 2010, 29, 2215–2223. [Google Scholar] [CrossRef]
- Zhang, J.; Ma, Z.; Li, Z.; Li, W. Study on Deformational Characteristics of Northeastern Qinghai-Xizang (Tibetan) Plateau from Late Cenzoic Defomation in the Xining basin. Geol. Rev. 2009, 55, 457–472, (In Chinese with English Abstract). [Google Scholar]
- Miall, A.D. The Geology of Fluvial Deposits: Sedimentary Facies, Basin Analysis, and Petroleum Geology; Springer: Berlin/Heidelberg, Germany, 1996; ISBN 3-540-59186-9. [Google Scholar]
- Konert, M.; Vandenberghe, J. Comparison of laser grain size analysis with pipette and sieve analysis: A solution for the underestimation of the clay fraction. Sedimentology 1997, 44, 523–535. [Google Scholar] [CrossRef]
- Murray, A.S.; Wintle, A.G. Luminescence dating of quartz using an improved single-aliquot regenerative-dose protocol. Radiat. Meas. 2000, 32, 57–73. [Google Scholar] [CrossRef]
- Murray, A.S.; Wintle, A.G. The single aliquot regenerative dose protocol: Potential for improvements in reliability. Radiat. Meas. 2003, 37, 377–381. [Google Scholar] [CrossRef]
- Thiel, C.; Buylaert, J.; Murray, A.; Terhorst, B.; Hofer, I.; Tsukamoto, S.; Frechen, M. Luminescence dating of the Stratzing loess profile (Austria)–Testing the potential of an elevated temperature post-IR IRSL protocol. Quat. Int. 2011, 234, 23–31. [Google Scholar] [CrossRef]
- Wintle, A.G. Luminescence dating: Where it has been and where it is going. Boreas 2008, 37, 471–482. [Google Scholar] [CrossRef]
- Buylaert, J.P.; Jain, M.; Murray, A.S.; Thomsen, K.J.; Thiel, C.; Sohbati, R. A robust feldspar luminescence dating method for Middle and Late Pleistocene sediments. Boreas 2012, 41, 435–451. [Google Scholar] [CrossRef]
- Li, B.; Li, S. A reply to the comments by Thomsen et al. on “Luminescence dating of K-feldspar from sediments: A protocol without anomalous fading correction”. Quat. Geochronol. 2012, 8, 49–51. [Google Scholar] [CrossRef]
- Yi, S.; Buylaert, J.; Murray, A.S.; Lu, H.; Thiel, C.; Zeng, L. A detailed post-IR IRSL dating study of the Niuyangzigou loess site in northeastern China. Boreas 2016, 45, 644–657. [Google Scholar] [CrossRef] [Green Version]
- Guérin, G.; Mercier, N.; Adamiec, G. Dose-rate conversion factors: Update. Ancient TL 2011, 29, 5–8. [Google Scholar]
- Mejdahl, V. Thermoluminescence Dating: Beta-dose attenuation in quartz grains. Archoeometry 1979, 21, 61–79. [Google Scholar] [CrossRef]
- Huntley, D.J.; Baril, M.R. The K content of the K-feldspars being measured in optical dating or in thermoluminescence dating. Ancient TL 1997, 15, 11–13. [Google Scholar]
- Mejdahl, V. Internal radioactivity in quartz and feldspar grains. Ancient TL 1987, 5, 10–17. [Google Scholar]
- Zhao, H.; Li, S. Internal dose rate to K-feldspar grains from radioactive elements other than potassium. Radiat. Meas. 2005, 40, 84–93. [Google Scholar] [CrossRef]
- Vandenberghe, D.; De Corte, F.; Buylaert, J.P.; Kučera, J. On the internal radioactivity in quartz. Radiat. Meas. 2008, 43, 771–775. [Google Scholar] [CrossRef]
- Einsele, G. Sedimentary Basins: Evolution, Facies, and Sediment Budget; Springer: Berlin/Heidelberg, Germany, 2000; ISBN 3-540-66193-X. [Google Scholar]
- Brierley, G.J.; Liu, K.; Crook, K.A.W. Sedimentology of coarse-grained alluvial fans in the Markham Valley, Papua New Guinea. Sediment. Geol. 1993, 86, 297–324. [Google Scholar] [CrossRef]
- Todd, S.P. Stream-driven, high-density gravelly traction carpets: Possible deposits in the Trabeg. Sedimentology 1989, 36, 513–530. [Google Scholar] [CrossRef]
- Jo, H.R.; Rhee, C.W.; Chough, S.K. Distinctive characteristics of a streamflow-dominated alluvial fan deposit: Sanghori area, Kyongsang Basin Early Cretaceous, southeastern Korea. Sediment. Geol. 1997, 110, 51–79. [Google Scholar] [CrossRef]
- Smith, N.D.; Cross, T.A.; Dufficy, J.P.; Clough, S.R. Anatomy of an avulsion. Sedimentology 1989, 36, 1–23. [Google Scholar] [CrossRef]
- Uba, C.E.; Heubeck, C.; Hulka, C. Facies analysis and basin architecture of the Neogene Subandean synorogenic wedge, southern Bolivia. Sediment. Geol. 2005, 180, 91–123. [Google Scholar] [CrossRef]
- Nemec, W.; Postma, G. Quaternary Alluvial Fans in Southwestern Crete Sedimentation Processes and Geomorphic Evolution. In Alluvial Sedimentation; International Association of Sedimentologists: Gent, Belgium, 1993; Volume 17, pp. 235–276. [Google Scholar]
- Li, L.; Garzione, C.N.; Pullen, A.; Zhang, P.; Li, Y. Late Cretaceous–Cenozoic basin evolution and topographic growth of the Hoh Xil Basin, central Tibetan Plateau. GSA Bull. 2017, 130, 499–521. [Google Scholar] [CrossRef]
- Mccarthy, P.J.; Martini, I.P.; Leckie, D.A. Anatomy and evolution of a Lower Cretaceous alluvial plain: Sedimentology and palaeosols in the upper Blairmore Group, south-western Alberta, Canada. Sedimentology 1997, 44, 197–220. [Google Scholar] [CrossRef]
- Bennett, M.R.; Mather, A.E.; Glasser, N.F. Earth hummocks and boulder runs at Merrivale, Dartmoor. In Devon and East Cornwall: Field Guide; Charman, D.J., Newnham, R.W., Croot, D.W., Eds.; Quaternary Research Association: London, UK, 1996; pp. 81–96. ISBN 090778027X. [Google Scholar]
- Rygel, M.C.; Gibling, M.R.; Calder, J.H. Vegetation-induced sedimentary structures from fossil forests in the Pennsylvanian Joggins Formation, Nova Scotia. Sedimentology 2004, 51, 531–552. [Google Scholar] [CrossRef]
- Vandenberghe, J. Grain size of fine-grained windblown sediment: A powerful proxy for process identification. Earth-Sci. Rev. 2013, 121, 18–30. [Google Scholar] [CrossRef]
- Vriend, M.; Prins, M.A. Calibration of modelled mixing patterns in loess grain-size distributions: An example from the north-eastern margin of the Tibetan Plateau, China. Sedimentology 2005, 52, 1361–1374. [Google Scholar] [CrossRef]
- Bentham, P.A.; Talling, P.J.; Burbank, D.W. Braided stream and flood-plain deposition in a rapidly aggrading basin: The Escanilla formation, Spanish Pyrenees. Geol. Soc. Lond. Spec. Publ. 1993, 75, 177–194. [Google Scholar] [CrossRef]
- Vandenberghe, J.; Sun, Y.; Wang, X.; Abels, H.A.; Liu, X. Grain-size characterization of reworked fine-grained aeolian deposits. Earth-Sci. Rev. 2018, 177, 43–52. [Google Scholar] [CrossRef]
- Chapot, M.S.; Roberts, H.M.; Duller, G.A.T.; Lai, Z. A comparison of natural-and laboratory-generated dose response curves for quartz optically stimulated luminescence signals from Chinese Loess. Radiat. Meas. 2012, 47, 1045–1052. [Google Scholar] [CrossRef]
- Buylaert, J.P.; Vandenberghe, D.; Murray, A.S.; Huot, S.; Corte, F.D.; Haute, P.V.D. Luminescence dating of old >70 ka. Chinese loess: A comparison of single-aliquot OSL and IRSL techniques. Quat. Geochronol. 2007, 2, 9–14. [Google Scholar] [CrossRef]
- Buylaert, J.P.; Murray, A.S.; Vandenberghe, D.; Vriend, M.; Corte, F.D.; Haute, P.V.D. Optical dating of Chinese loess using sand-sized quartz: Establishing a time frame for Late Pleistocene climate changes in the western part of the Chinese Loess Plateau. Quat. Geochronol. 2008, 3, 99–113. [Google Scholar] [CrossRef]
- Li, R.W.; Shen, H.W. Effect of tall vegetations on flow and sediment. J. Hydraul. Eng. 1973, 99, 793–814. [Google Scholar]
- Petryk, S.; Bosmajian, G.I. Analysis of flow through vegetation. J. Hydraul. Div. 1975, 101, 871–884. [Google Scholar]
- Graeme, D.; Dunkerley, D.L. Hydraulic resistance by the river red gum, Eucalyptus camaldulensis, in ephemeral desert streams. Geogr. Res. 1993. [Google Scholar] [CrossRef]
- Zierholz, C.; Prosser, I.P.; Fogarty, P.J.; Rustomji, P. In-stream wetlands and their significance for channel filling and the catchment sediment budget, Jugiong Creek, New South Wales. Geomorphology 2001, 38, 221–235. [Google Scholar] [CrossRef]
- Jordanova, A.A.; James, C.S. Experimental study of bed load transport through emergent vegetation. J. Hydraul. Eng. 2003, 129, 474–478. [Google Scholar] [CrossRef]
- Rygel, M.C.; Calder, J.H.; Gibling, M.R.; Gingras, M.K.; Melrose, C.S.A. Tournaisian forested wetlands in the Horton Group of Atlantic Canada. Geol. Soc. Am. 2006, 103–126. [Google Scholar]
- Miao, Y.; Fang, X.; Dai, S.; Liu, W.; Yang, M.; Chen, C. Origin of the second terraces in the Huangshui drainage area, Qinghai, China, studied based on sporopollen records. Geol. Bull. China 2007, 12, 1697–1702. [Google Scholar]
- Pye, K.; Zhou, L. Late Pleistocene and Holocene aeolian dust deposition in north China and the northwest Pacific Ocean. Palaeogeogr. Palaeoclimatol. Palaeoecol. 1989, 73, 11–23. [Google Scholar] [CrossRef]
- Sun, D.; Bloemendal, J.; Rea, D.K.; Vandenberghe, J.; Jiang, F.; An, Z.; Su, R. Grain-size distribution function of polymodal sediments in hydraulic and aeolian environments, and numerical partitioning of the sedimentary components. Sediment. Geol. 2002, 152, 263–277. [Google Scholar] [CrossRef]
- Sun, D.; Su, R.; Bloemendal, J.; Lu, H. Grain-size and accumulation rate records from Late Cenozoic aeolian sequences in northern China: Implications for variations in the East Asian winter monsoon and westerly atmospheric circulation. Palaeogeogr. Palaeoclimatol. Palaeoecol. 2008, 264, 39–53. [Google Scholar] [CrossRef] [Green Version]
- Vriend, M.; Prins, M.A.; Buylaert, J.; Vandenberghe, J.; Lu, H. Contrasting dust supply patterns across the north-western Chinese Loess Plateau during the last glacial-interglacial cycle. Quat. Int. 2011, 240, 167–180. [Google Scholar] [CrossRef]
- Waelbroeck, C.; Labeyrie, L.; Michel, E.; Duplessy, J.C.; McManus, J.F.; Lambeck, K.; Balbon, E.; Labracherie, M. Sea-level and deep water temperature changes derived from benthic foraminifera isotopic records. Quat. Sci. Rev. 2002, 21, 295–305. [Google Scholar] [CrossRef]
- Wang, X.; Lu, H.; Vandenberghe, J.; Chen, Z.; Li, L. Distribution and Forming Model of Fluvial Terrace in the Huangshui Catchment and its Tectonic Indication. Acta Geol. Sin.-Engl. 2010, 84, 415–423. [Google Scholar] [CrossRef]
Figure 1.
(a) Overview of the study area derived from ASTER Global Digital Elevation Model (ASTER GDEM) data. The black lines show the faults (modified after the 1:500,000 geological map). (b) Detailed morphological features (gorges and depressions) of the study area and the location of the study section (red star). The Huangshui River flows through a series of gorges and depressions. The swath profile (AA’ in yellow rectangle) shows detailed elevation change of the study area and the Xiao gorge and Ping’an depression. The black lines show the faults (modified from [53]). (c) Geomorphological sketch map of the studied area, showing the terrace and fan (plain green: terrace; green hatched lines: fan; red: erosion of the terrace and the fan after deposition; purple: V-shaped incision of the Huangshui in the Xiao gorge).

Figure 2.
Stratigraphical sketch of the main sediment units observed at the Ping’an study site. Each column represents a sediment log through the sediment sequences. Section VII is to the west of the photo, 145 m from section I. Section PA is 30 m from section VI in the west. The numbered horizontal line segments below the photo represent the distance between the two sections.

Figure 3.
The basal stratigraphic unit (U1) consisting of high-energy alluvial environment facies: (a) clast-supported planar cross-bedded gravel (Gp) and a sand lens, and sampling point (II-1); the cross-bedded gravels are inclined to WNW, showing an ESE flow direction; (b) crudely stratified gravel sheet (Gh) of unit 1, and sampling points (III-1 to III-8); person (circled) for scale 155 cm; (c) clast-supported massive gravels (Gcm) and gravel sheet, forming crude fining-upward; person in white for scale 163 cm; (d) the grain-size distribution of sample II-1 taken from lenticular sand in section II.

Figure 4.
Sedimentary structures observed in unit 2 (U2): (a) horizontal laminated sand (Sh) interbedded with reddish-brown silt (Fm); length of the shovel is 58 cm; (b) minor ripple cross-laminated sand (Sr); pen length 14 cm; (c) planar cross-laminated sand (Sp) overlying trough cross-laminated sand (St); length of the shovel is 75 cm; (d) silt layer with carbonate cement; pen length 15 cm; (e) the grain-size distributions of samples (II-2 from the trough cross-stratified sand, II-4, IV-1, and VII-1 from the horizontal laminated sand, II-3 from a silt layer with carbonate cement) in U2 (see Figure 5, for the specific sampling points).

Figure 5.
Line drawing of U1 to U3 in section II, showing alternate reddish-brown silt with sand layers that include mounds with local root traces. The red dots represent sampling points and the red triangle represents an OSL sample point. The thickness of the mound at the upper right is 0.5 m.
Figure 5.
Line drawing of U1 to U3 in section II, showing alternate reddish-brown silt with sand layers that include mounds with local root traces. The red dots represent sampling points and the red triangle represents an OSL sample point. The thickness of the mound at the upper right is 0.5 m.

Figure 6.
Line drawing of connected sand mounds with planar bases and silt layers that pinch out in the horizontal laminated sand (Sh). Overlying beds are fine laminated silt (Fl) in U3. The red dots represent sampling points. The length of the spade is 58 cm for scale.
Figure 6.
Line drawing of connected sand mounds with planar bases and silt layers that pinch out in the horizontal laminated sand (Sh). Overlying beds are fine laminated silt (Fl) in U3. The red dots represent sampling points. The length of the spade is 58 cm for scale.
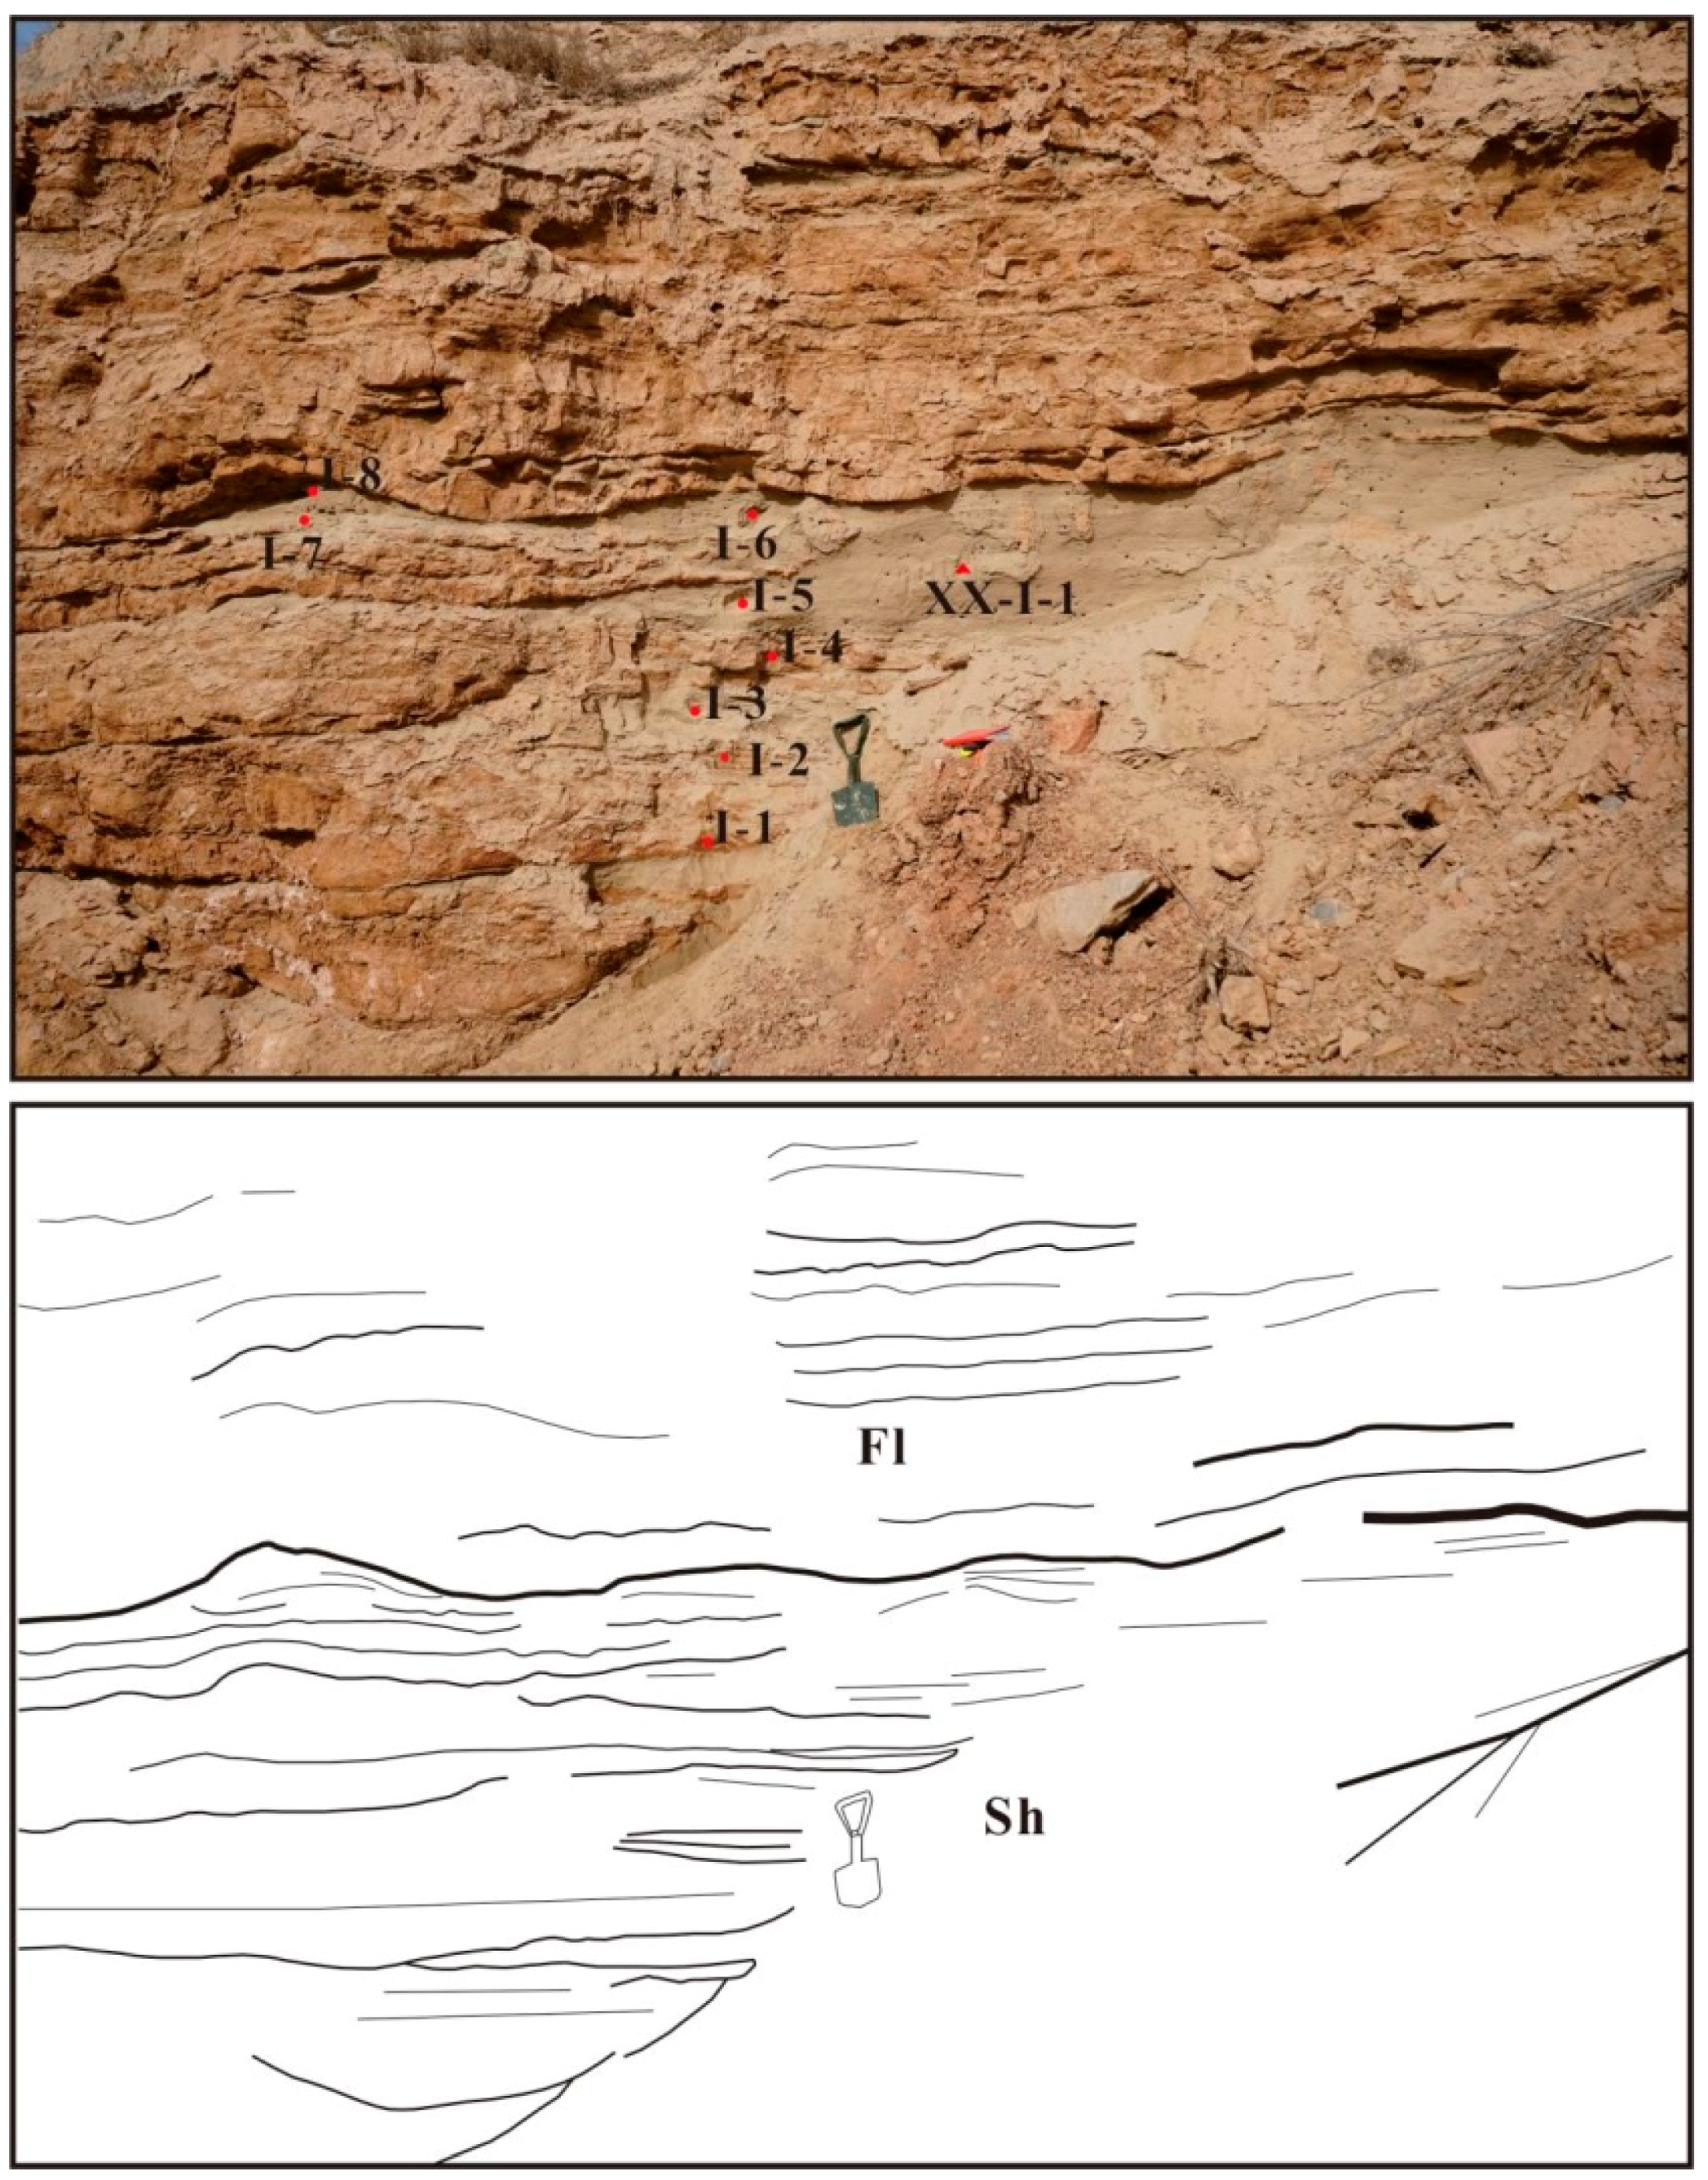
Figure 7.
Line drawing of vertically stacked sand mounds interbedded with silt and gravel in U3. The sand bodies are flanked by upturned beds of clay and contain for-concordant stratification. The length of the pen and the spade are 14 cm and 58 cm, respectively.
Figure 7.
Line drawing of vertically stacked sand mounds interbedded with silt and gravel in U3. The sand bodies are flanked by upturned beds of clay and contain for-concordant stratification. The length of the pen and the spade are 14 cm and 58 cm, respectively.

Figure 8.
Dimensions of sand mounds, measured from two-dimensional outcrops in the Ping’an pit. The individual mounds include those that are part of stacked mounds.
Figure 8.
Dimensions of sand mounds, measured from two-dimensional outcrops in the Ping’an pit. The individual mounds include those that are part of stacked mounds.
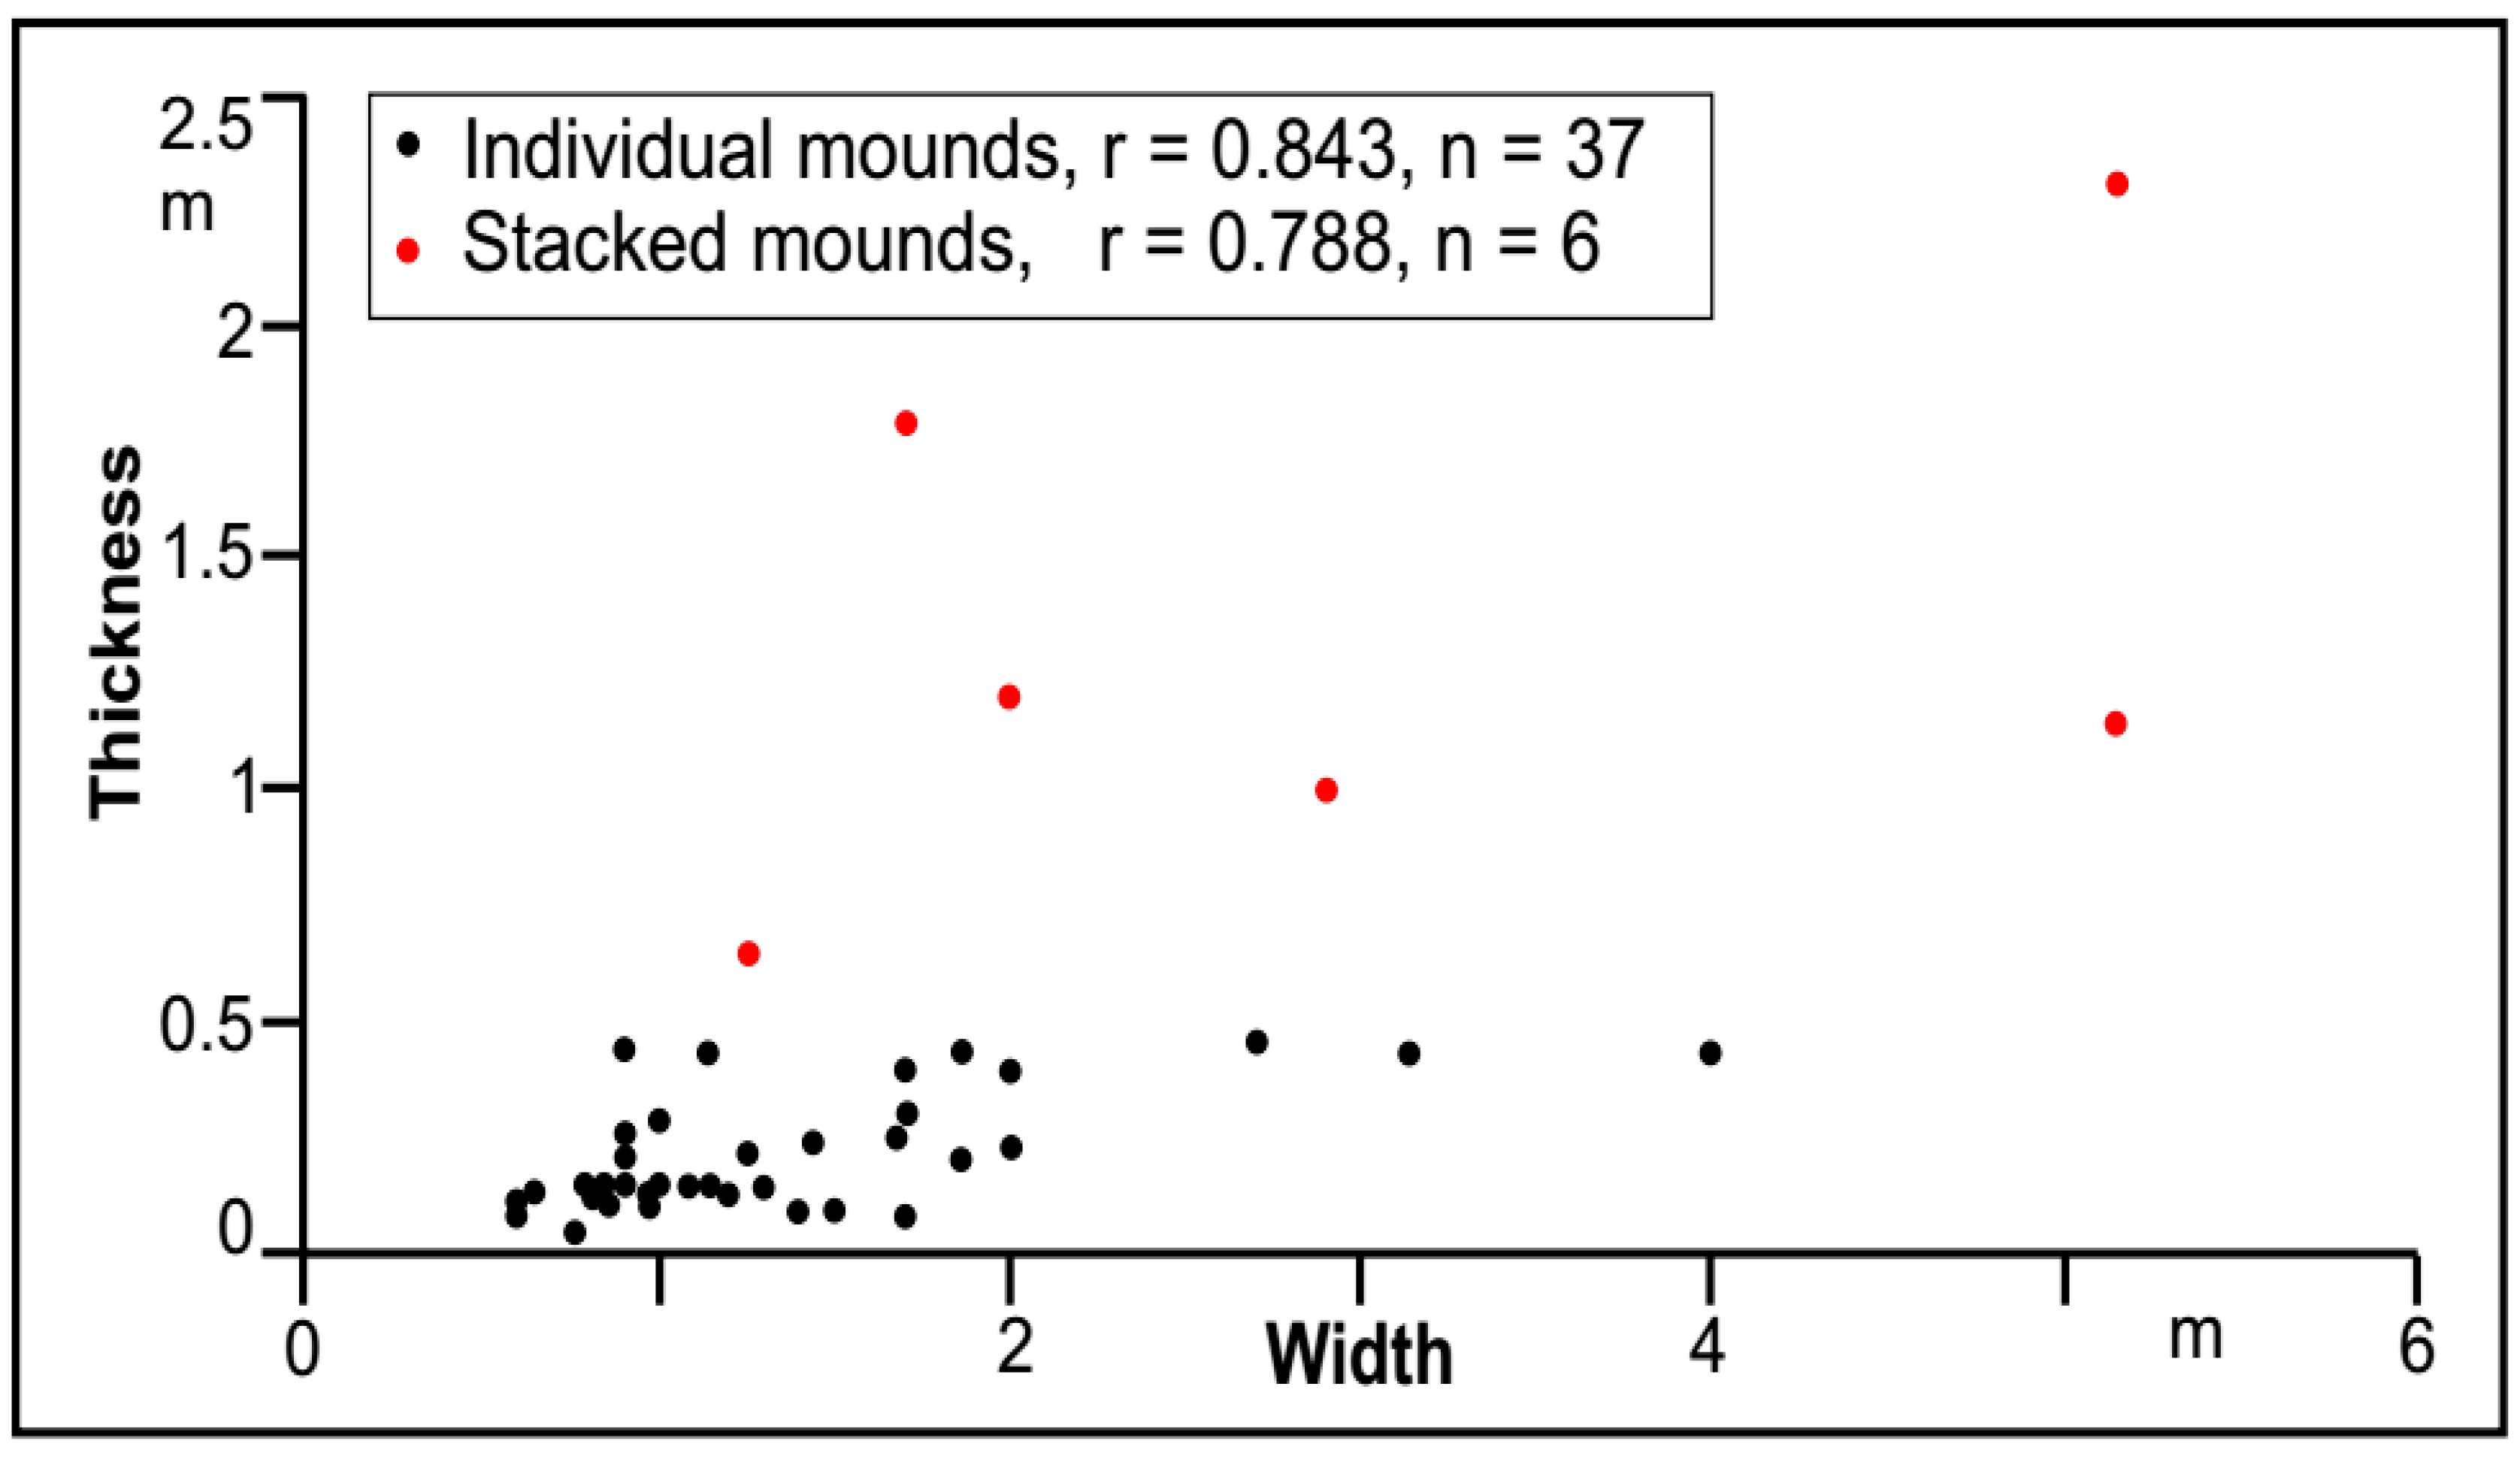
Figure 9.
The characteristics of U3 deposits: (a) gravel lenses as trough fills; pencil length 17 cm for scale; (b) sand lens; pencil length 17 cm for scale; (c) carbonate nodules in coarse sand layer in section VII; pen length 14 cm for scale; (d) desiccation cracks; pen length 15 cm for scale; (e) raindrop impressions; diameter of the lens cap is 5.2 cm for scale.
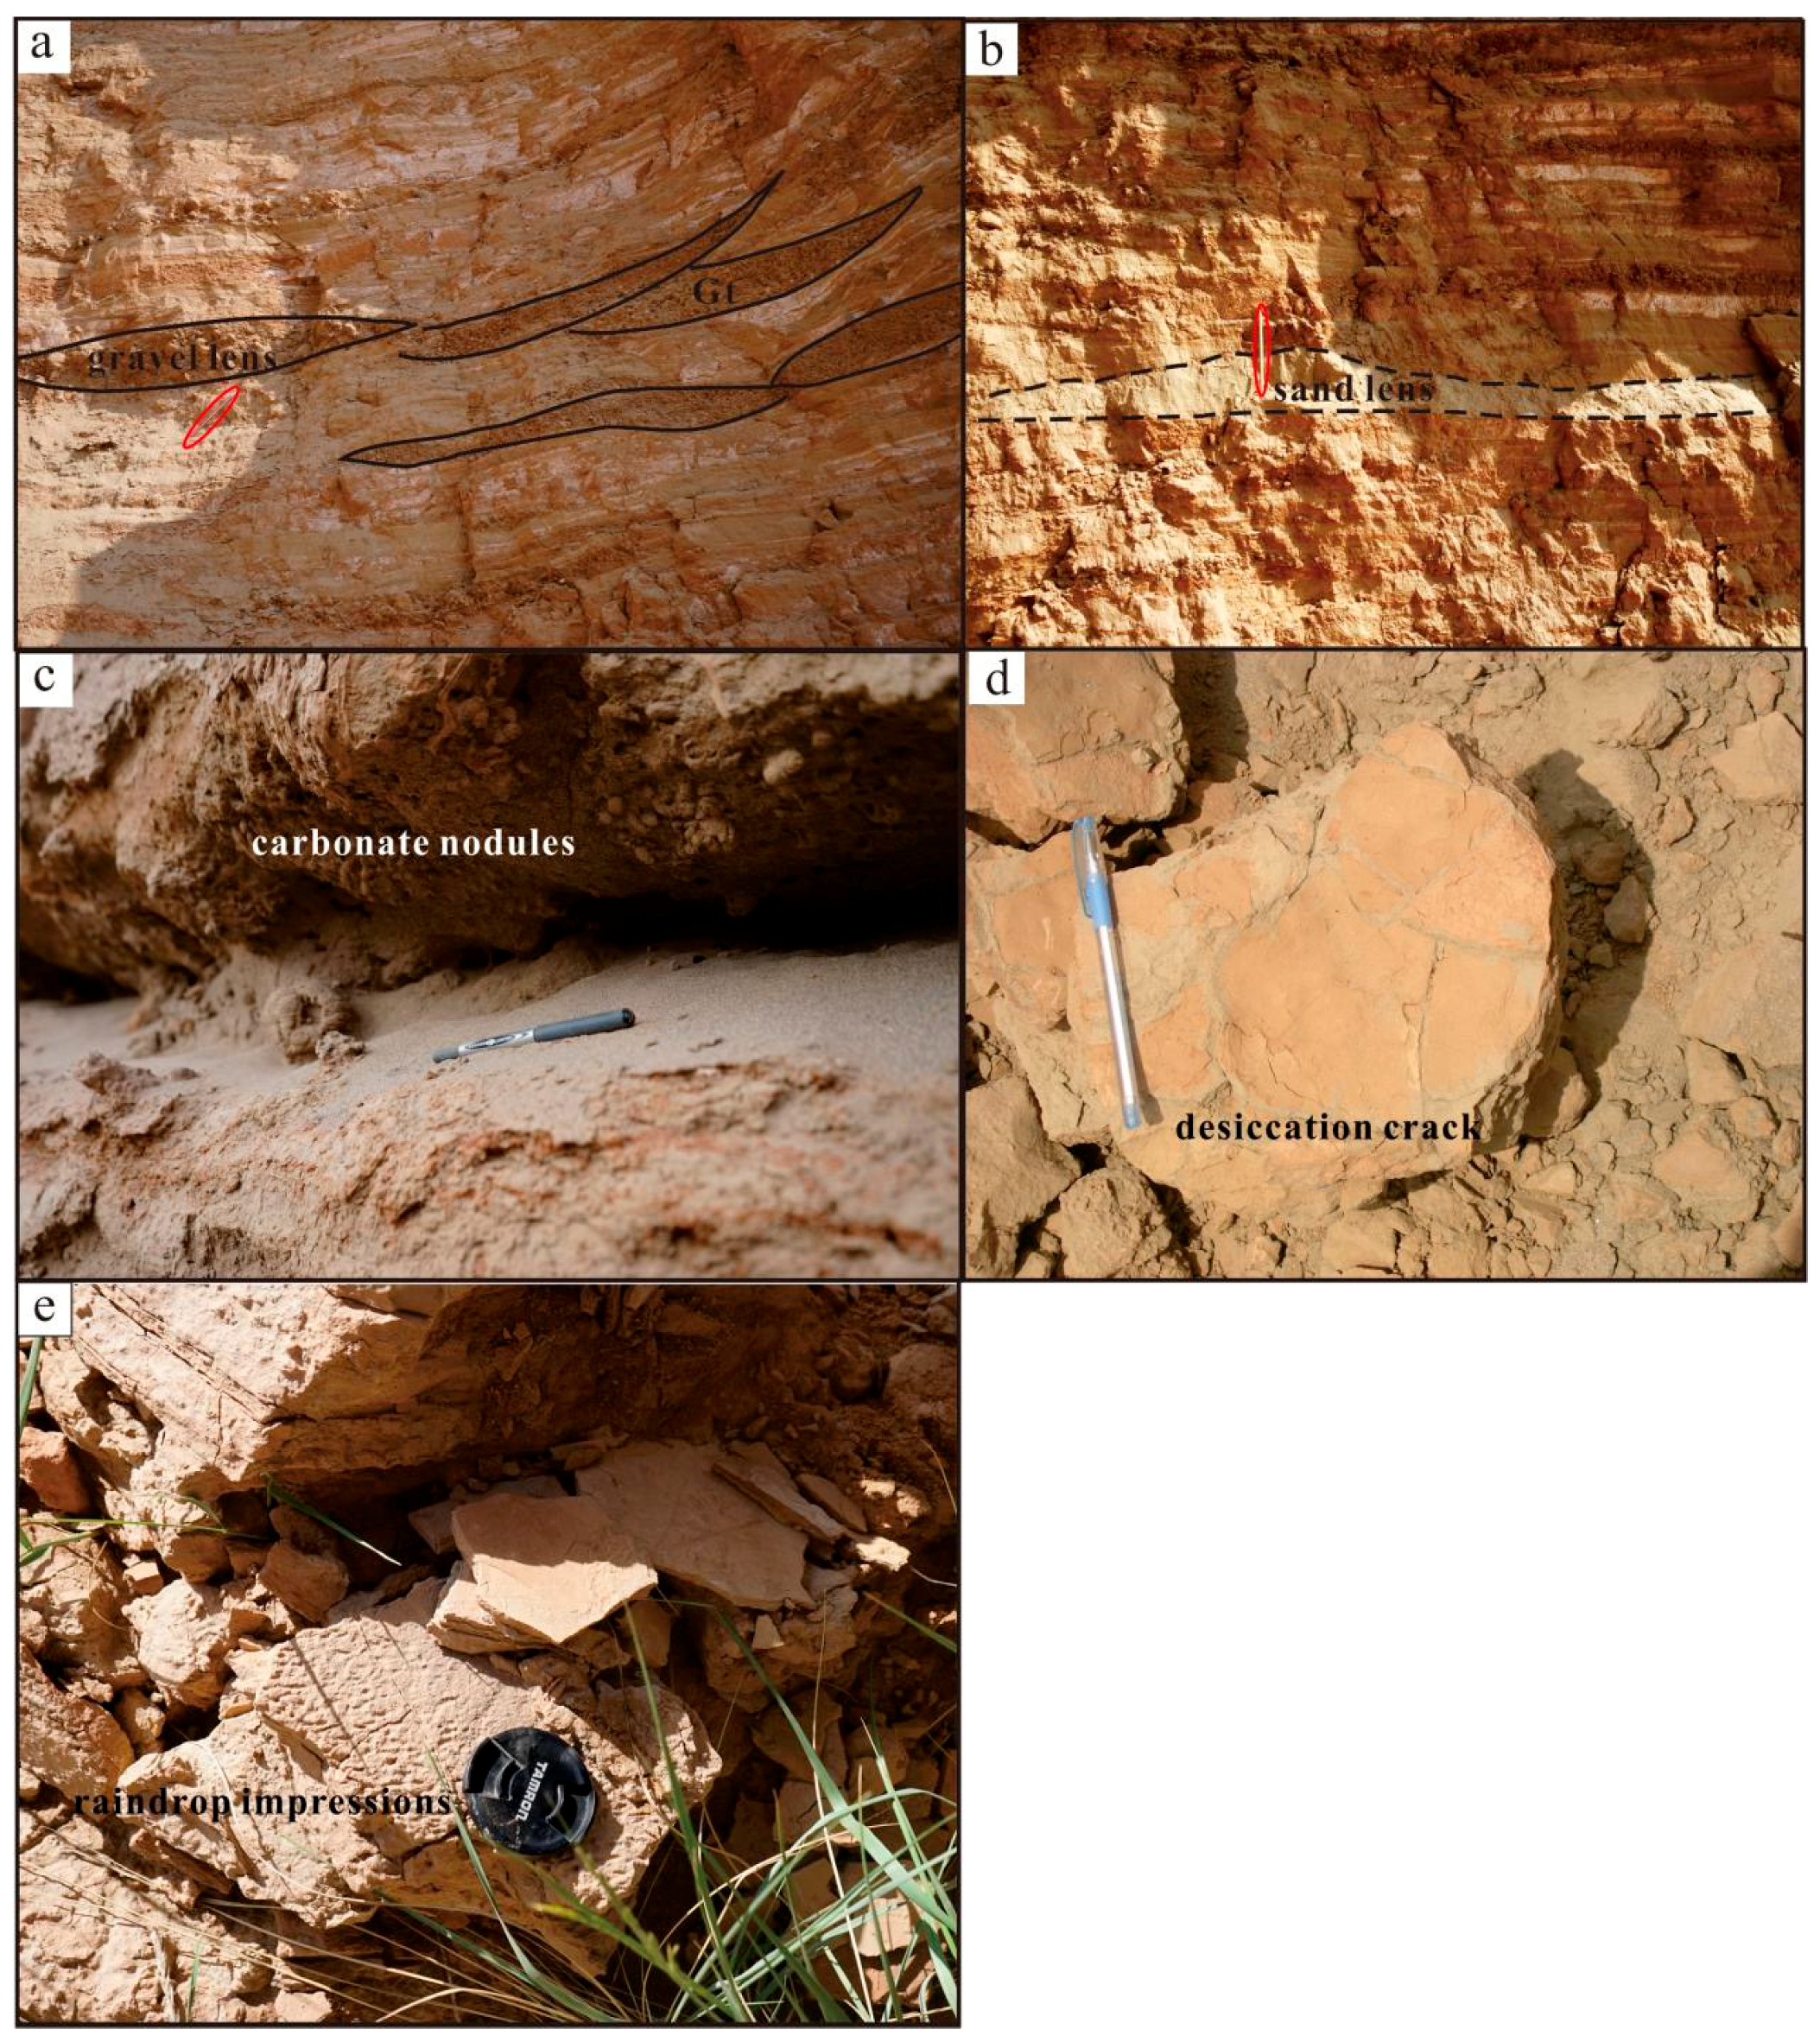
Figure 10.
Main sedimentary structure observed in unit 4: (a,b) low-angle to horizontal laminated sand (Sl, Sh) with local roots; pen length 14 cm; (c) sketch of section VII, where the red dots represent sampling points; the dotted lines separating three facies associations; (d) minor channels which face ESE, containing pebble lenses in section VII; the person is of the height 155 cm for scale.
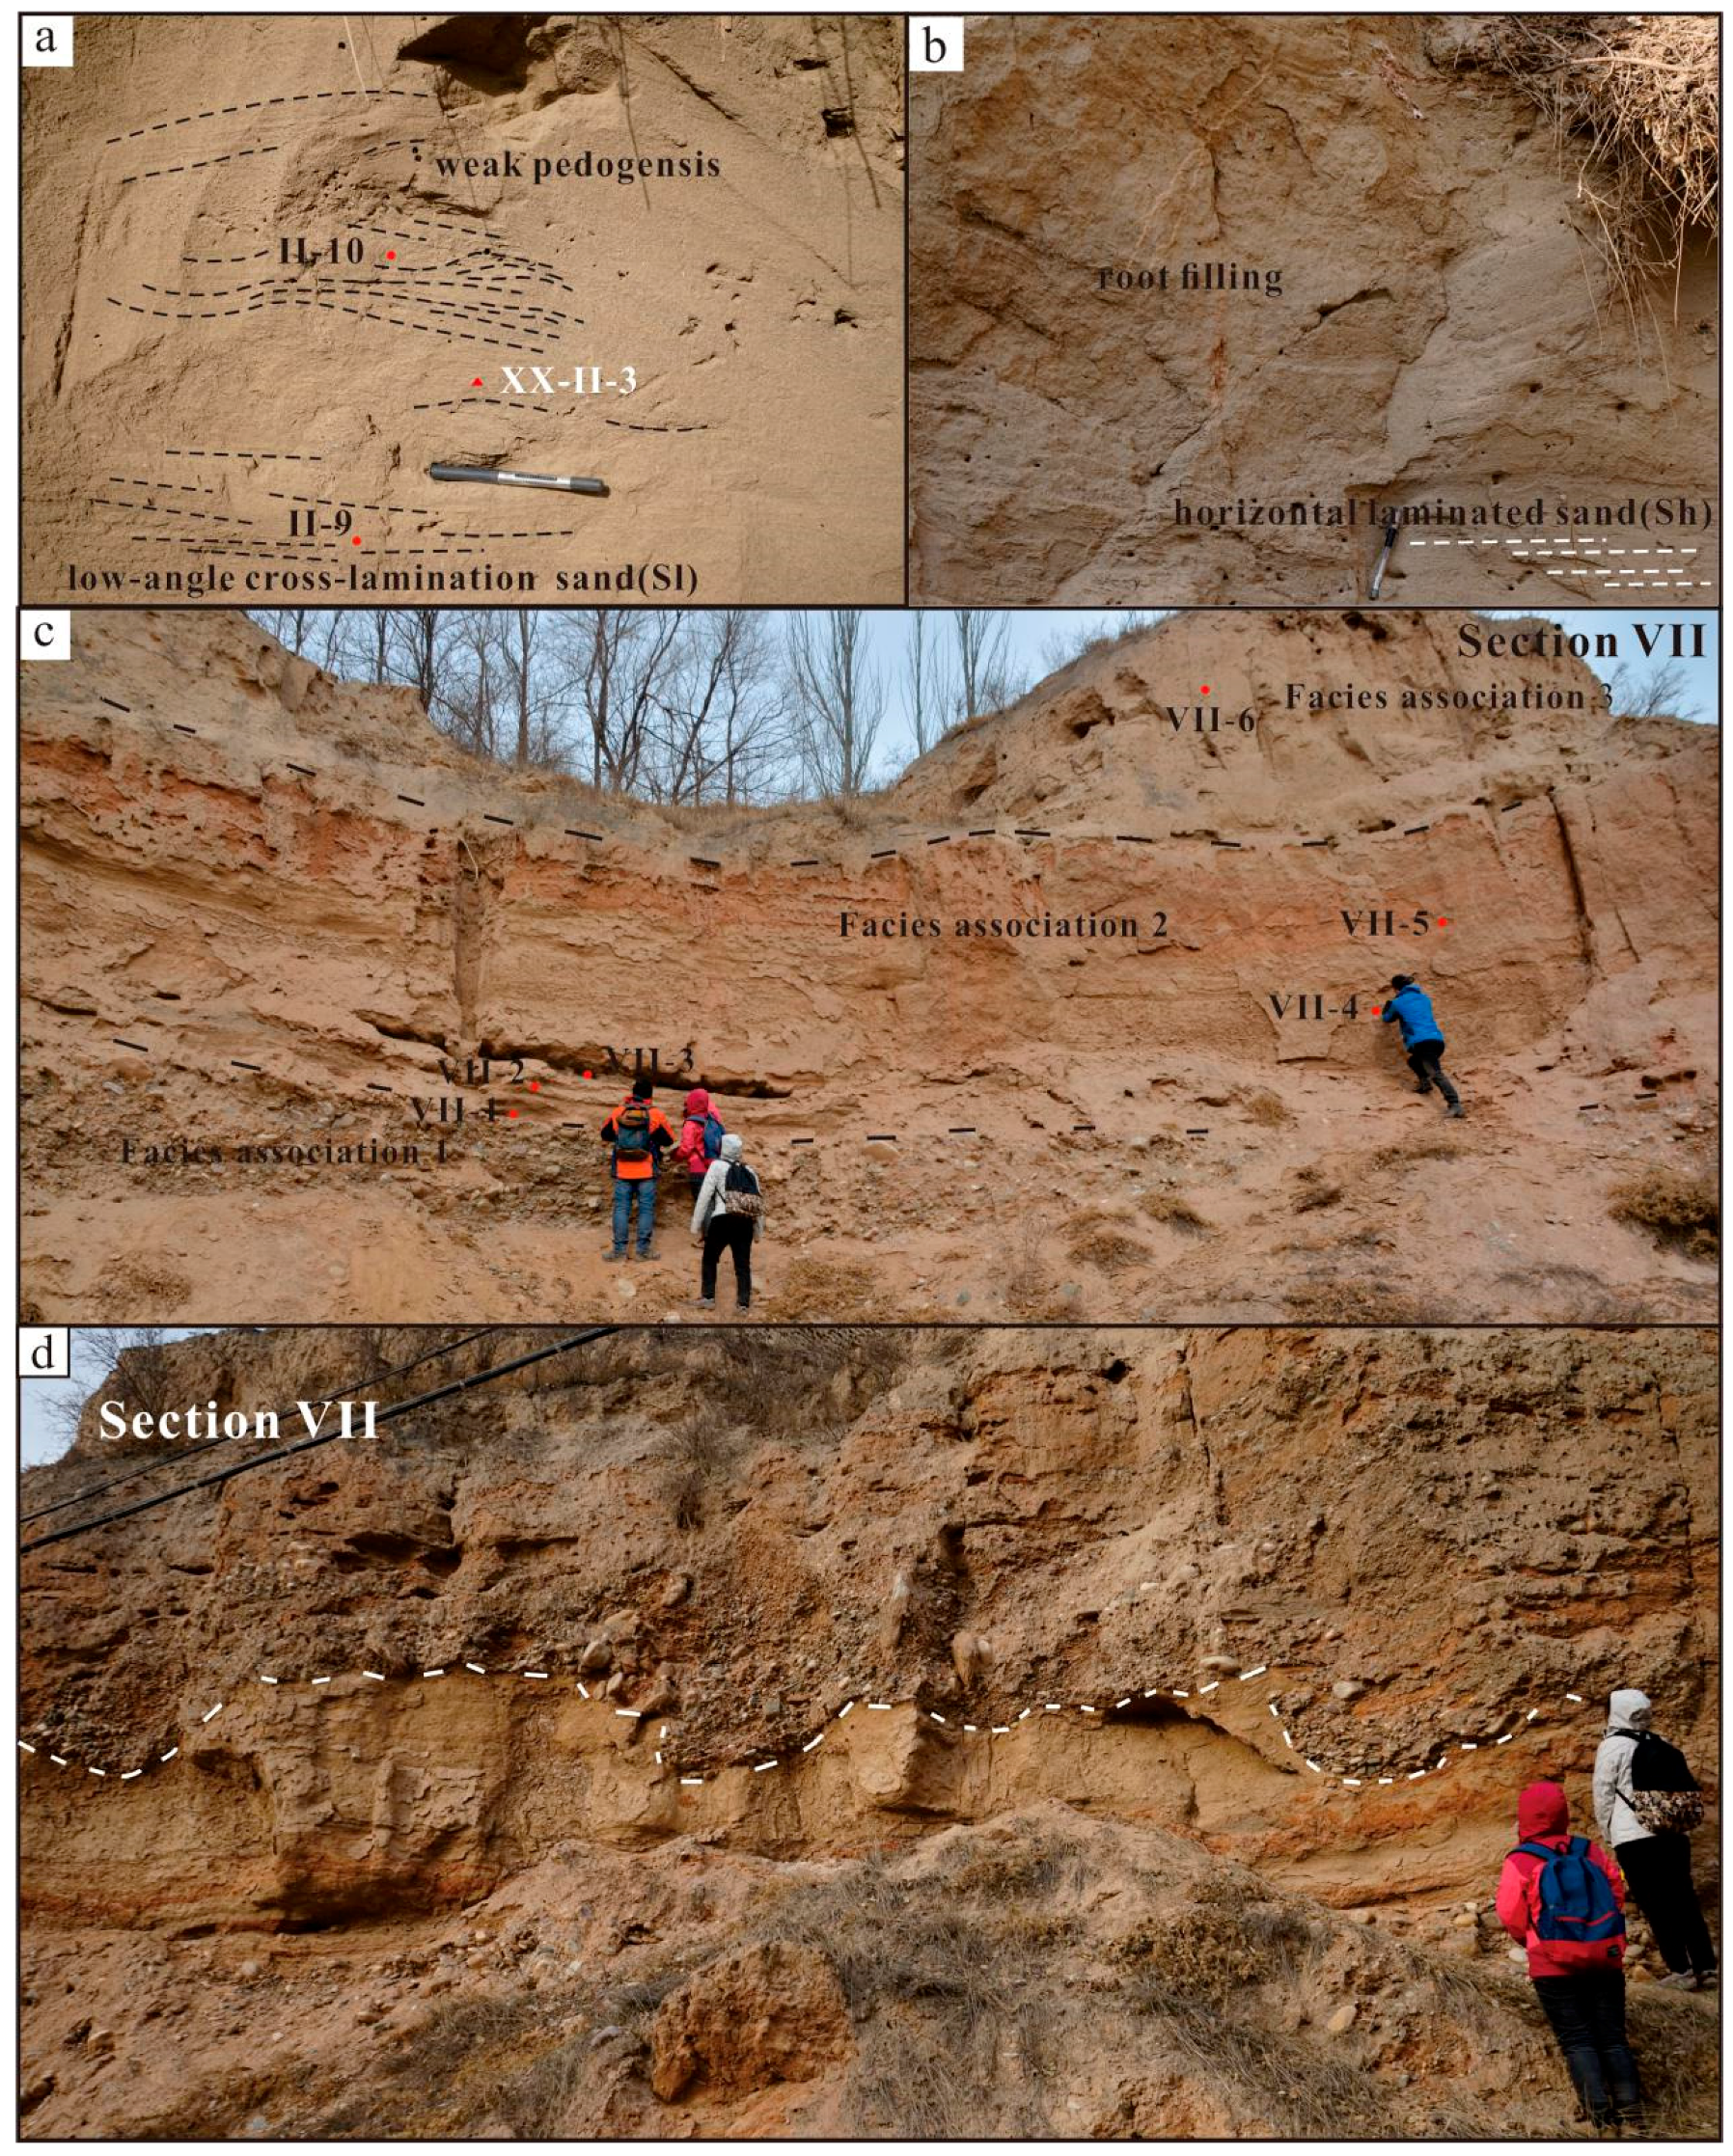
Figure 11.
The grain-size distribution of samples taken from U3–U6: samples from (a) the sand mounds, (b) sand layers, and (c) silt layers in U3; from (d) sand sediments in U4; from (e) U5 (II-11 and VII-5 from silt layers and II-12 from a sand layer, and (f) massive silt sediments in U6.
Figure 11.
The grain-size distribution of samples taken from U3–U6: samples from (a) the sand mounds, (b) sand layers, and (c) silt layers in U3; from (d) sand sediments in U4; from (e) U5 (II-11 and VII-5 from silt layers and II-12 from a sand layer, and (f) massive silt sediments in U6.
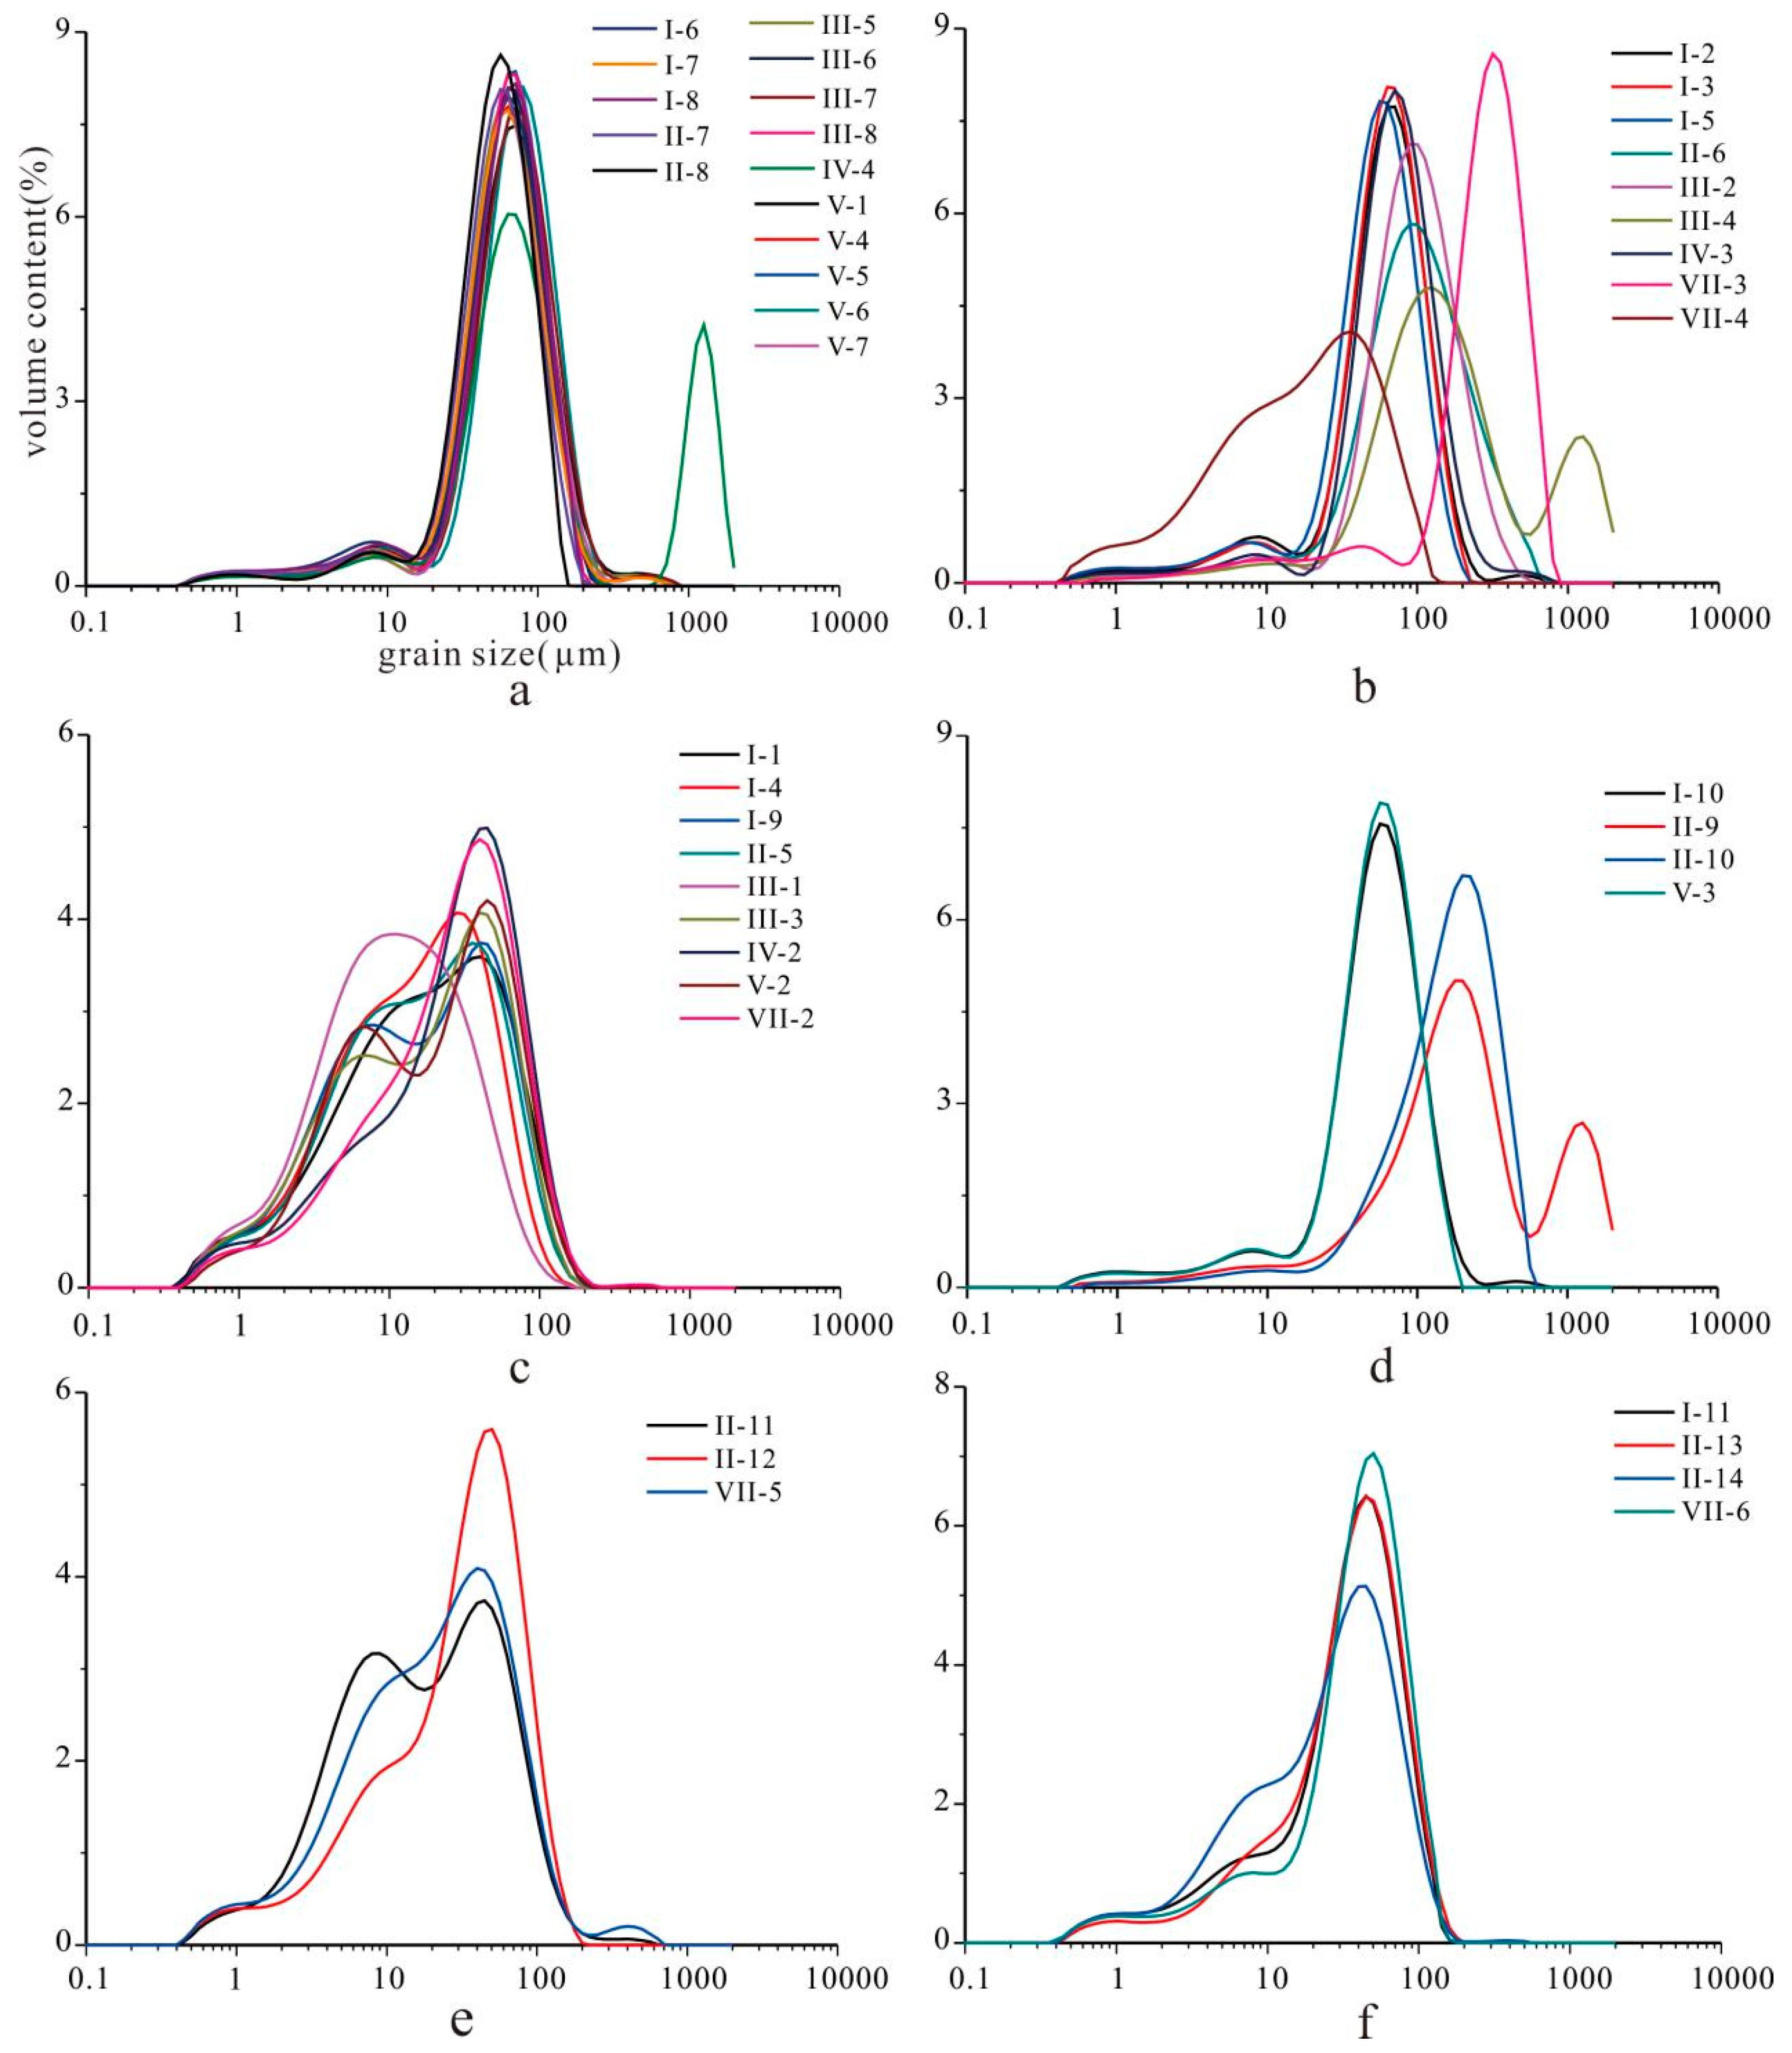
Figure 12.
Sedimentary features of U6 in section IV and V, showing detailed sampling points. The dashed lines are the boundaries of the sediment units.
Figure 12.
Sedimentary features of U6 in section IV and V, showing detailed sampling points. The dashed lines are the boundaries of the sediment units.
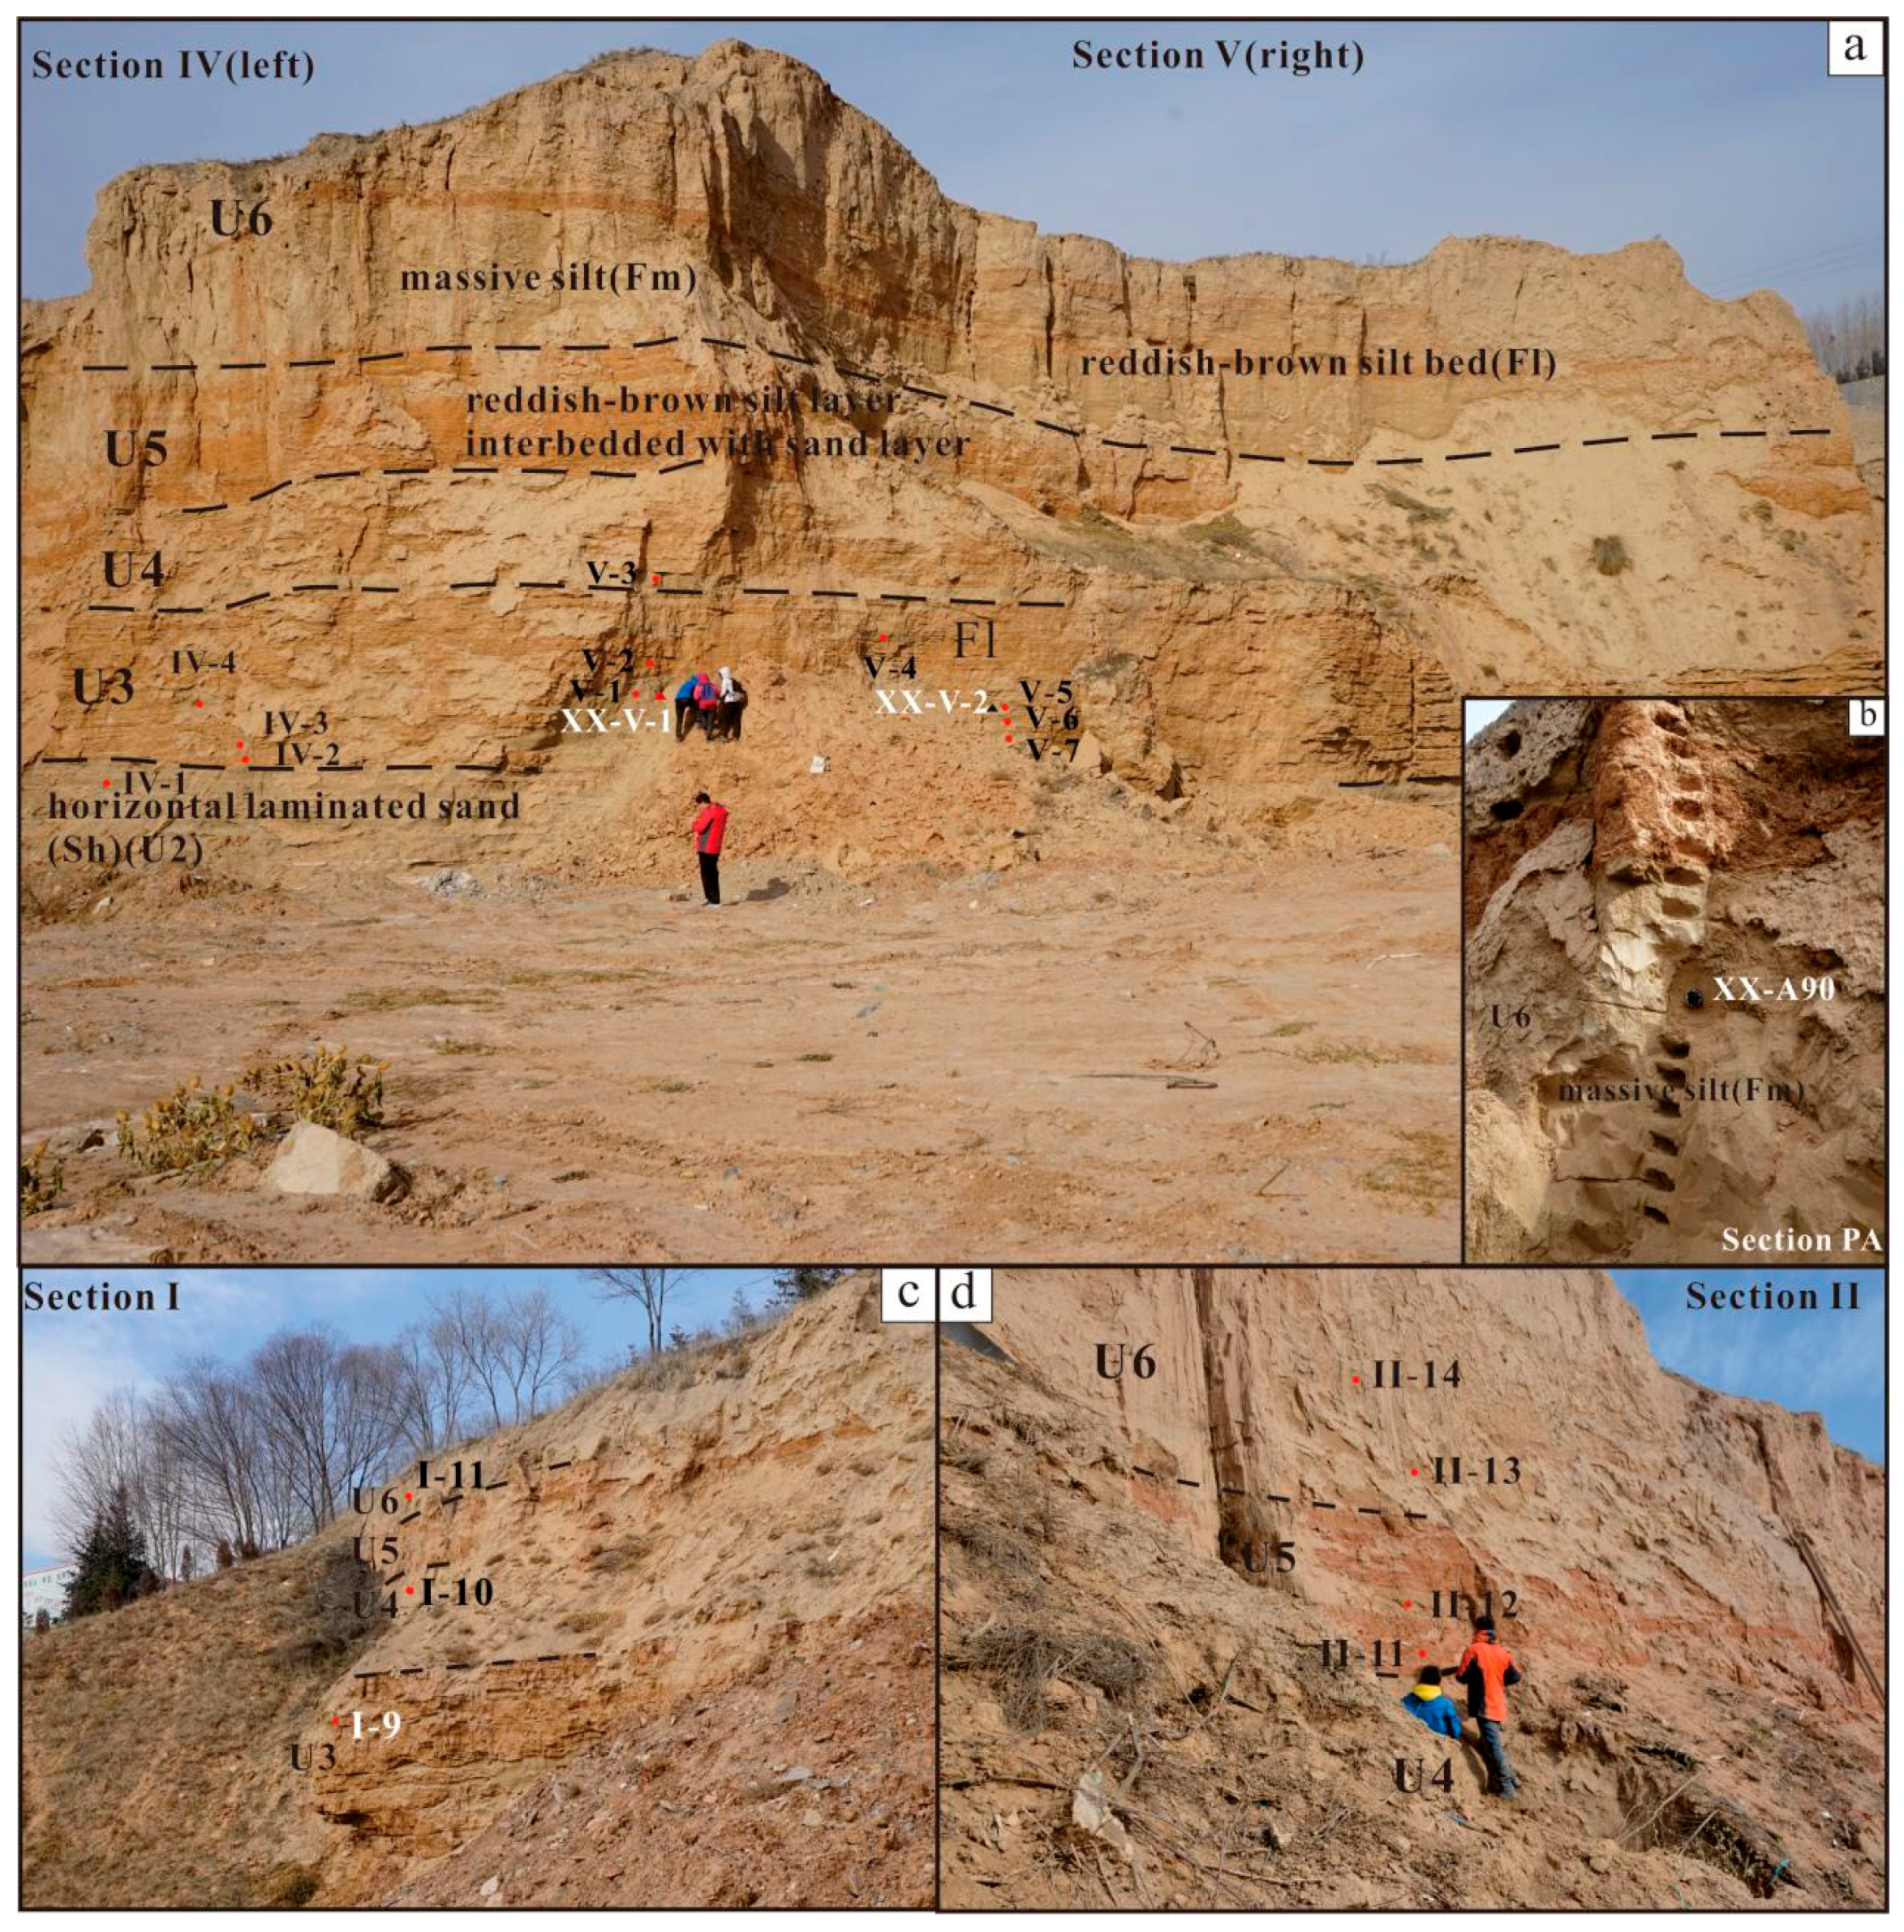
Figure 13.
Model for alluvial fan development at Ping’an: (a) framework of sediment supply from the Xiao gorge exit, rapid accumulation, and intrinsic fan evolution as a result of lobe elevation and switching; (b) summary of the fan succession; and (c) correlation of OSL dates with marine isotope stages [98].


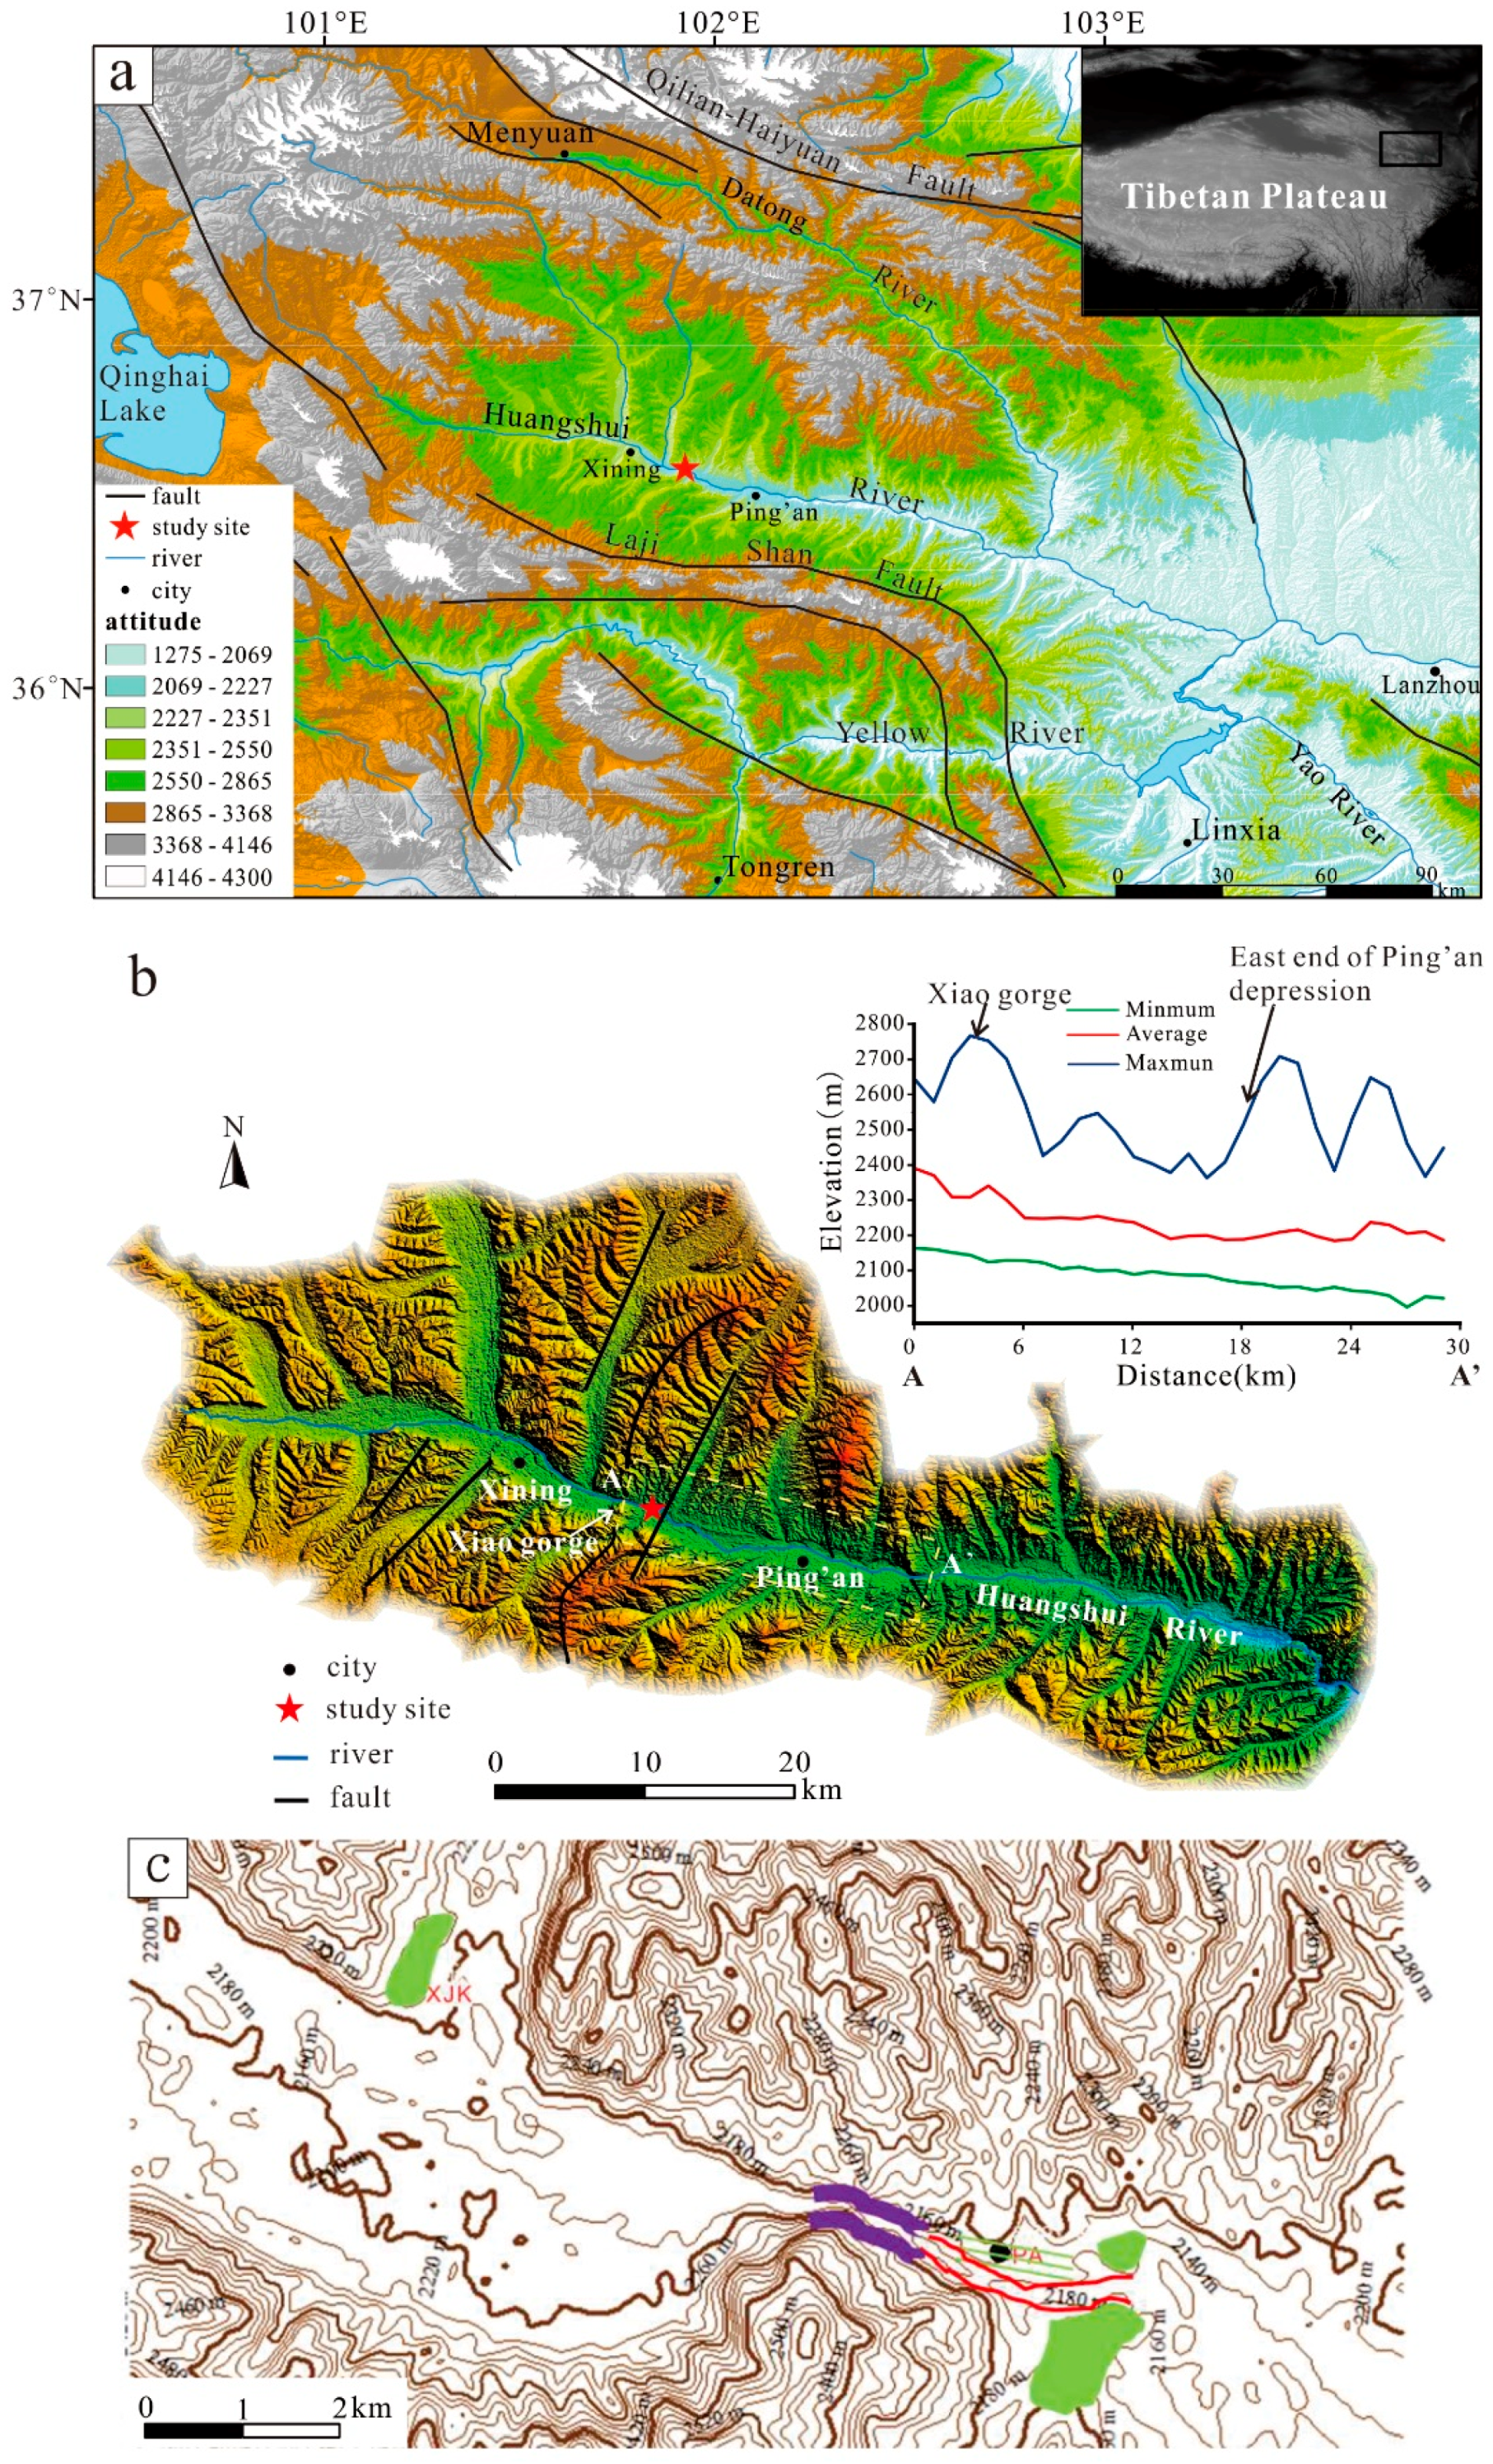
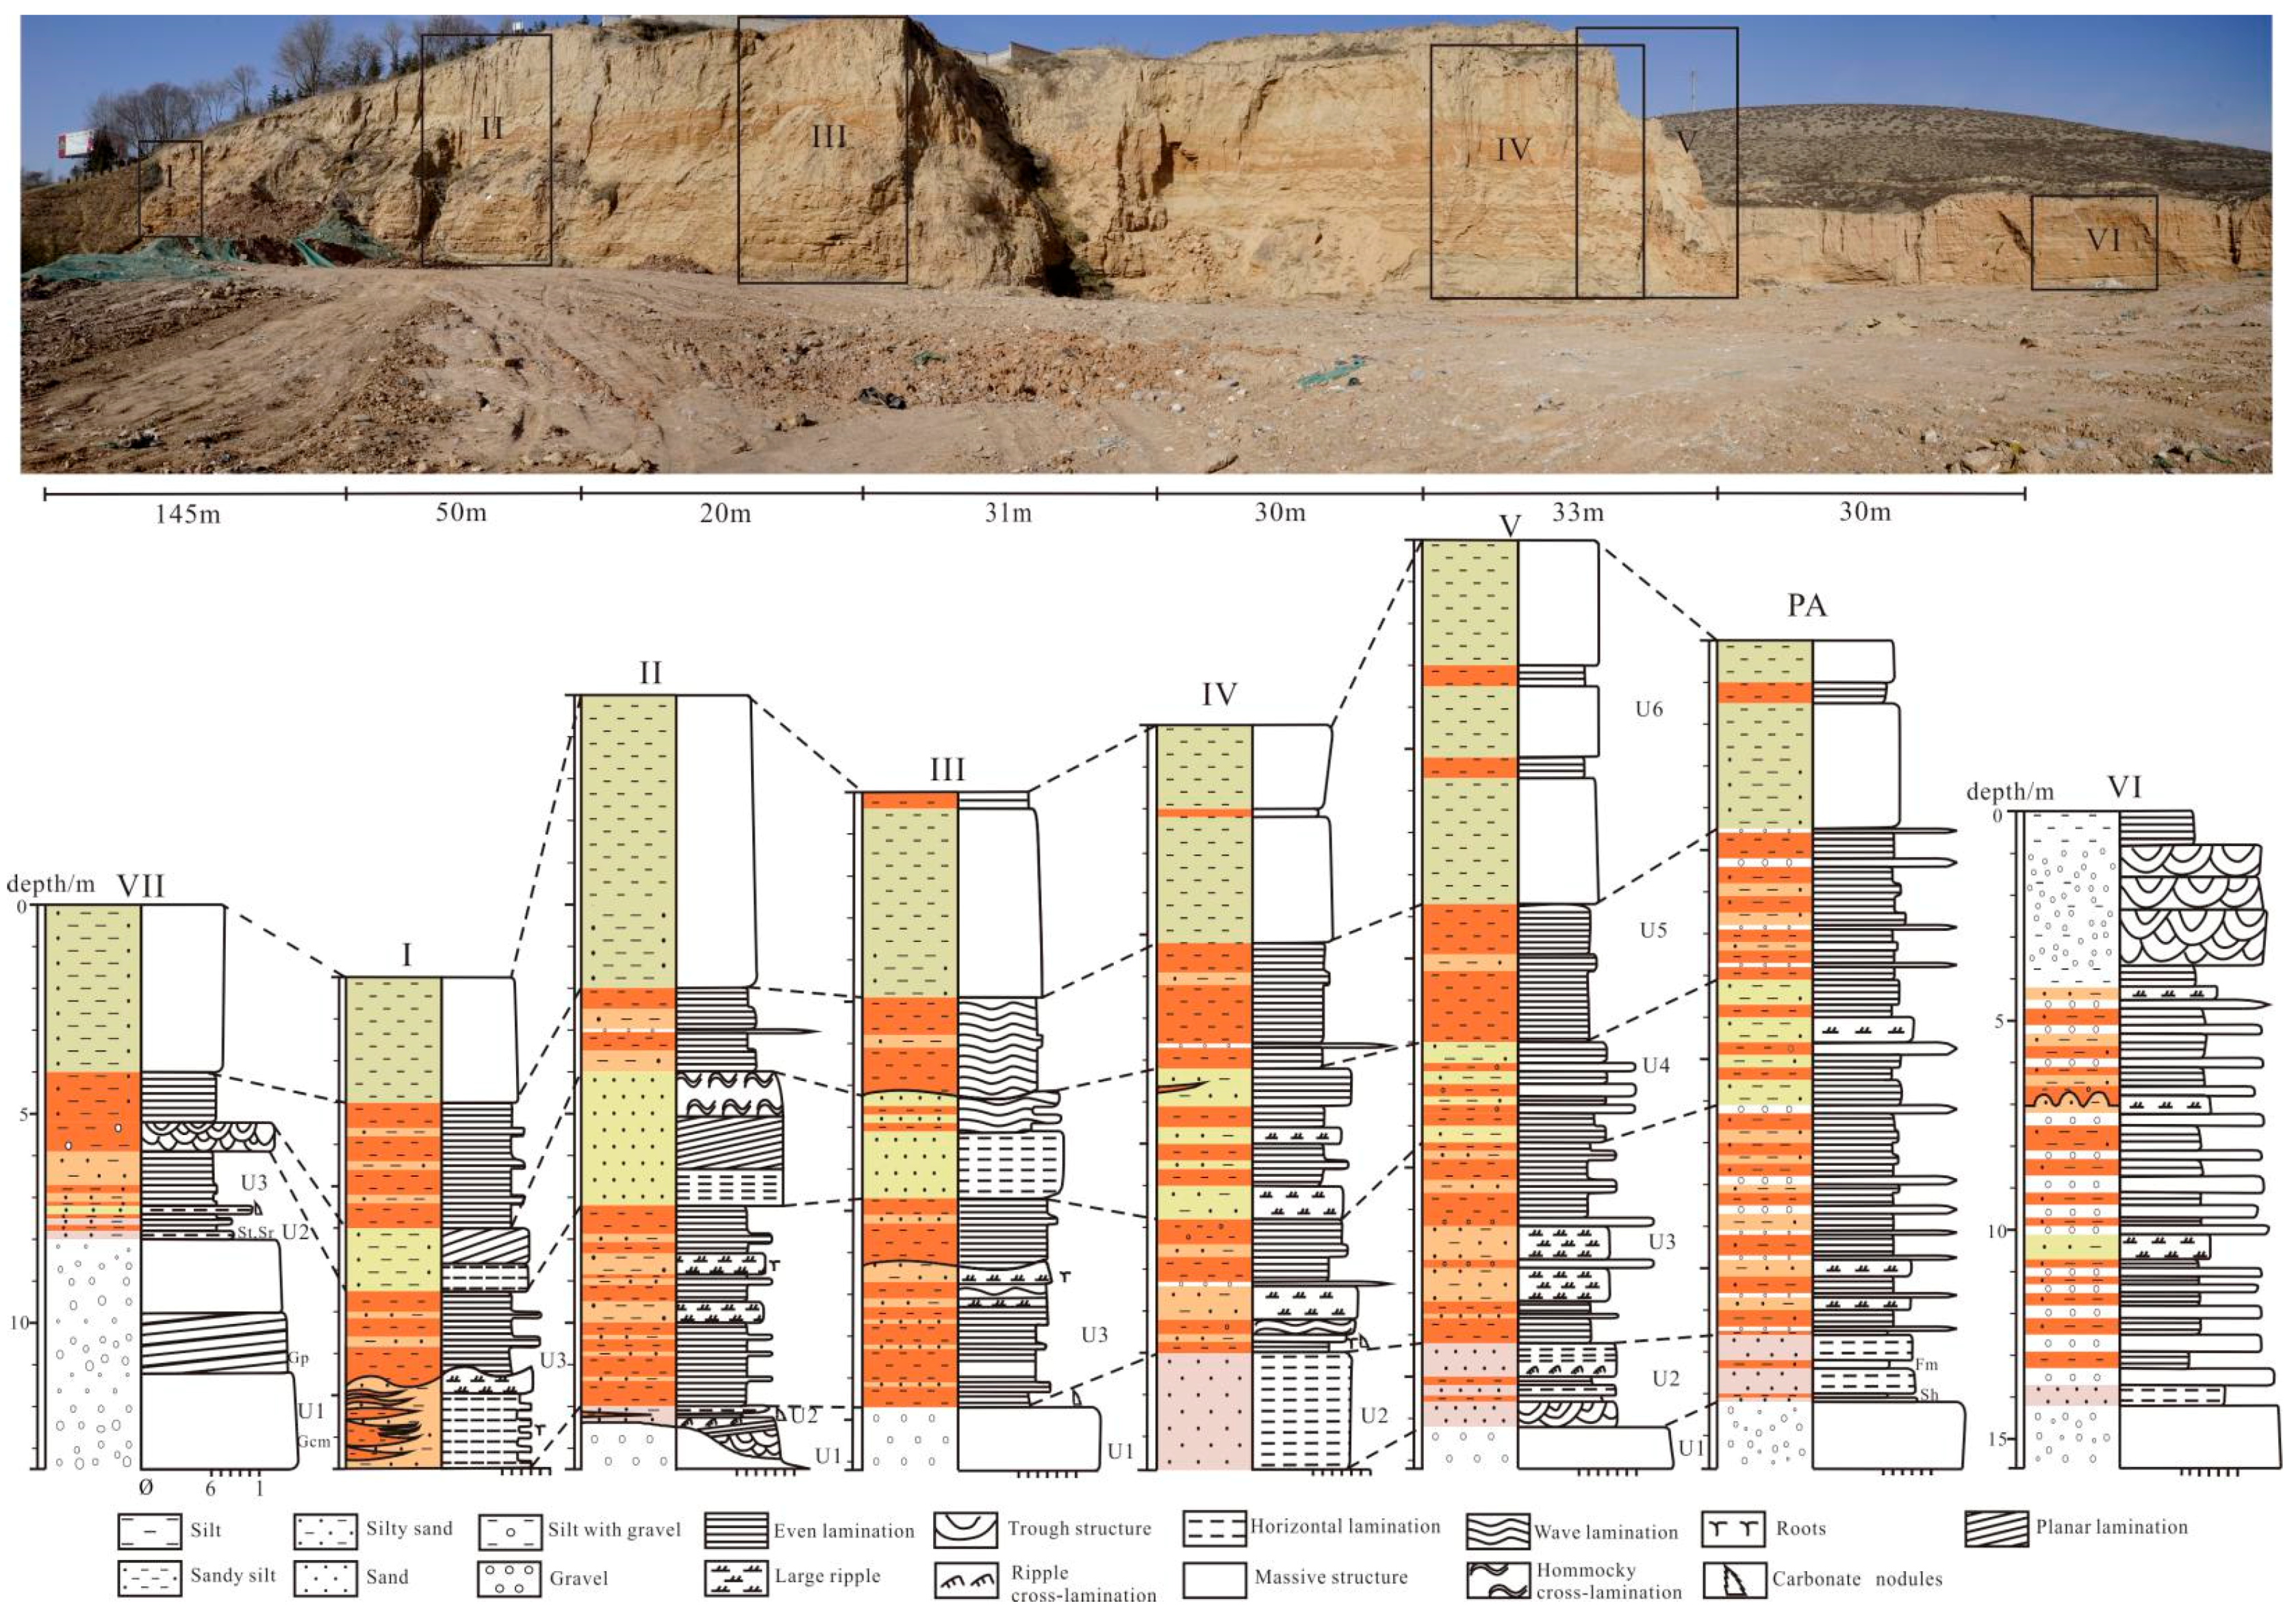
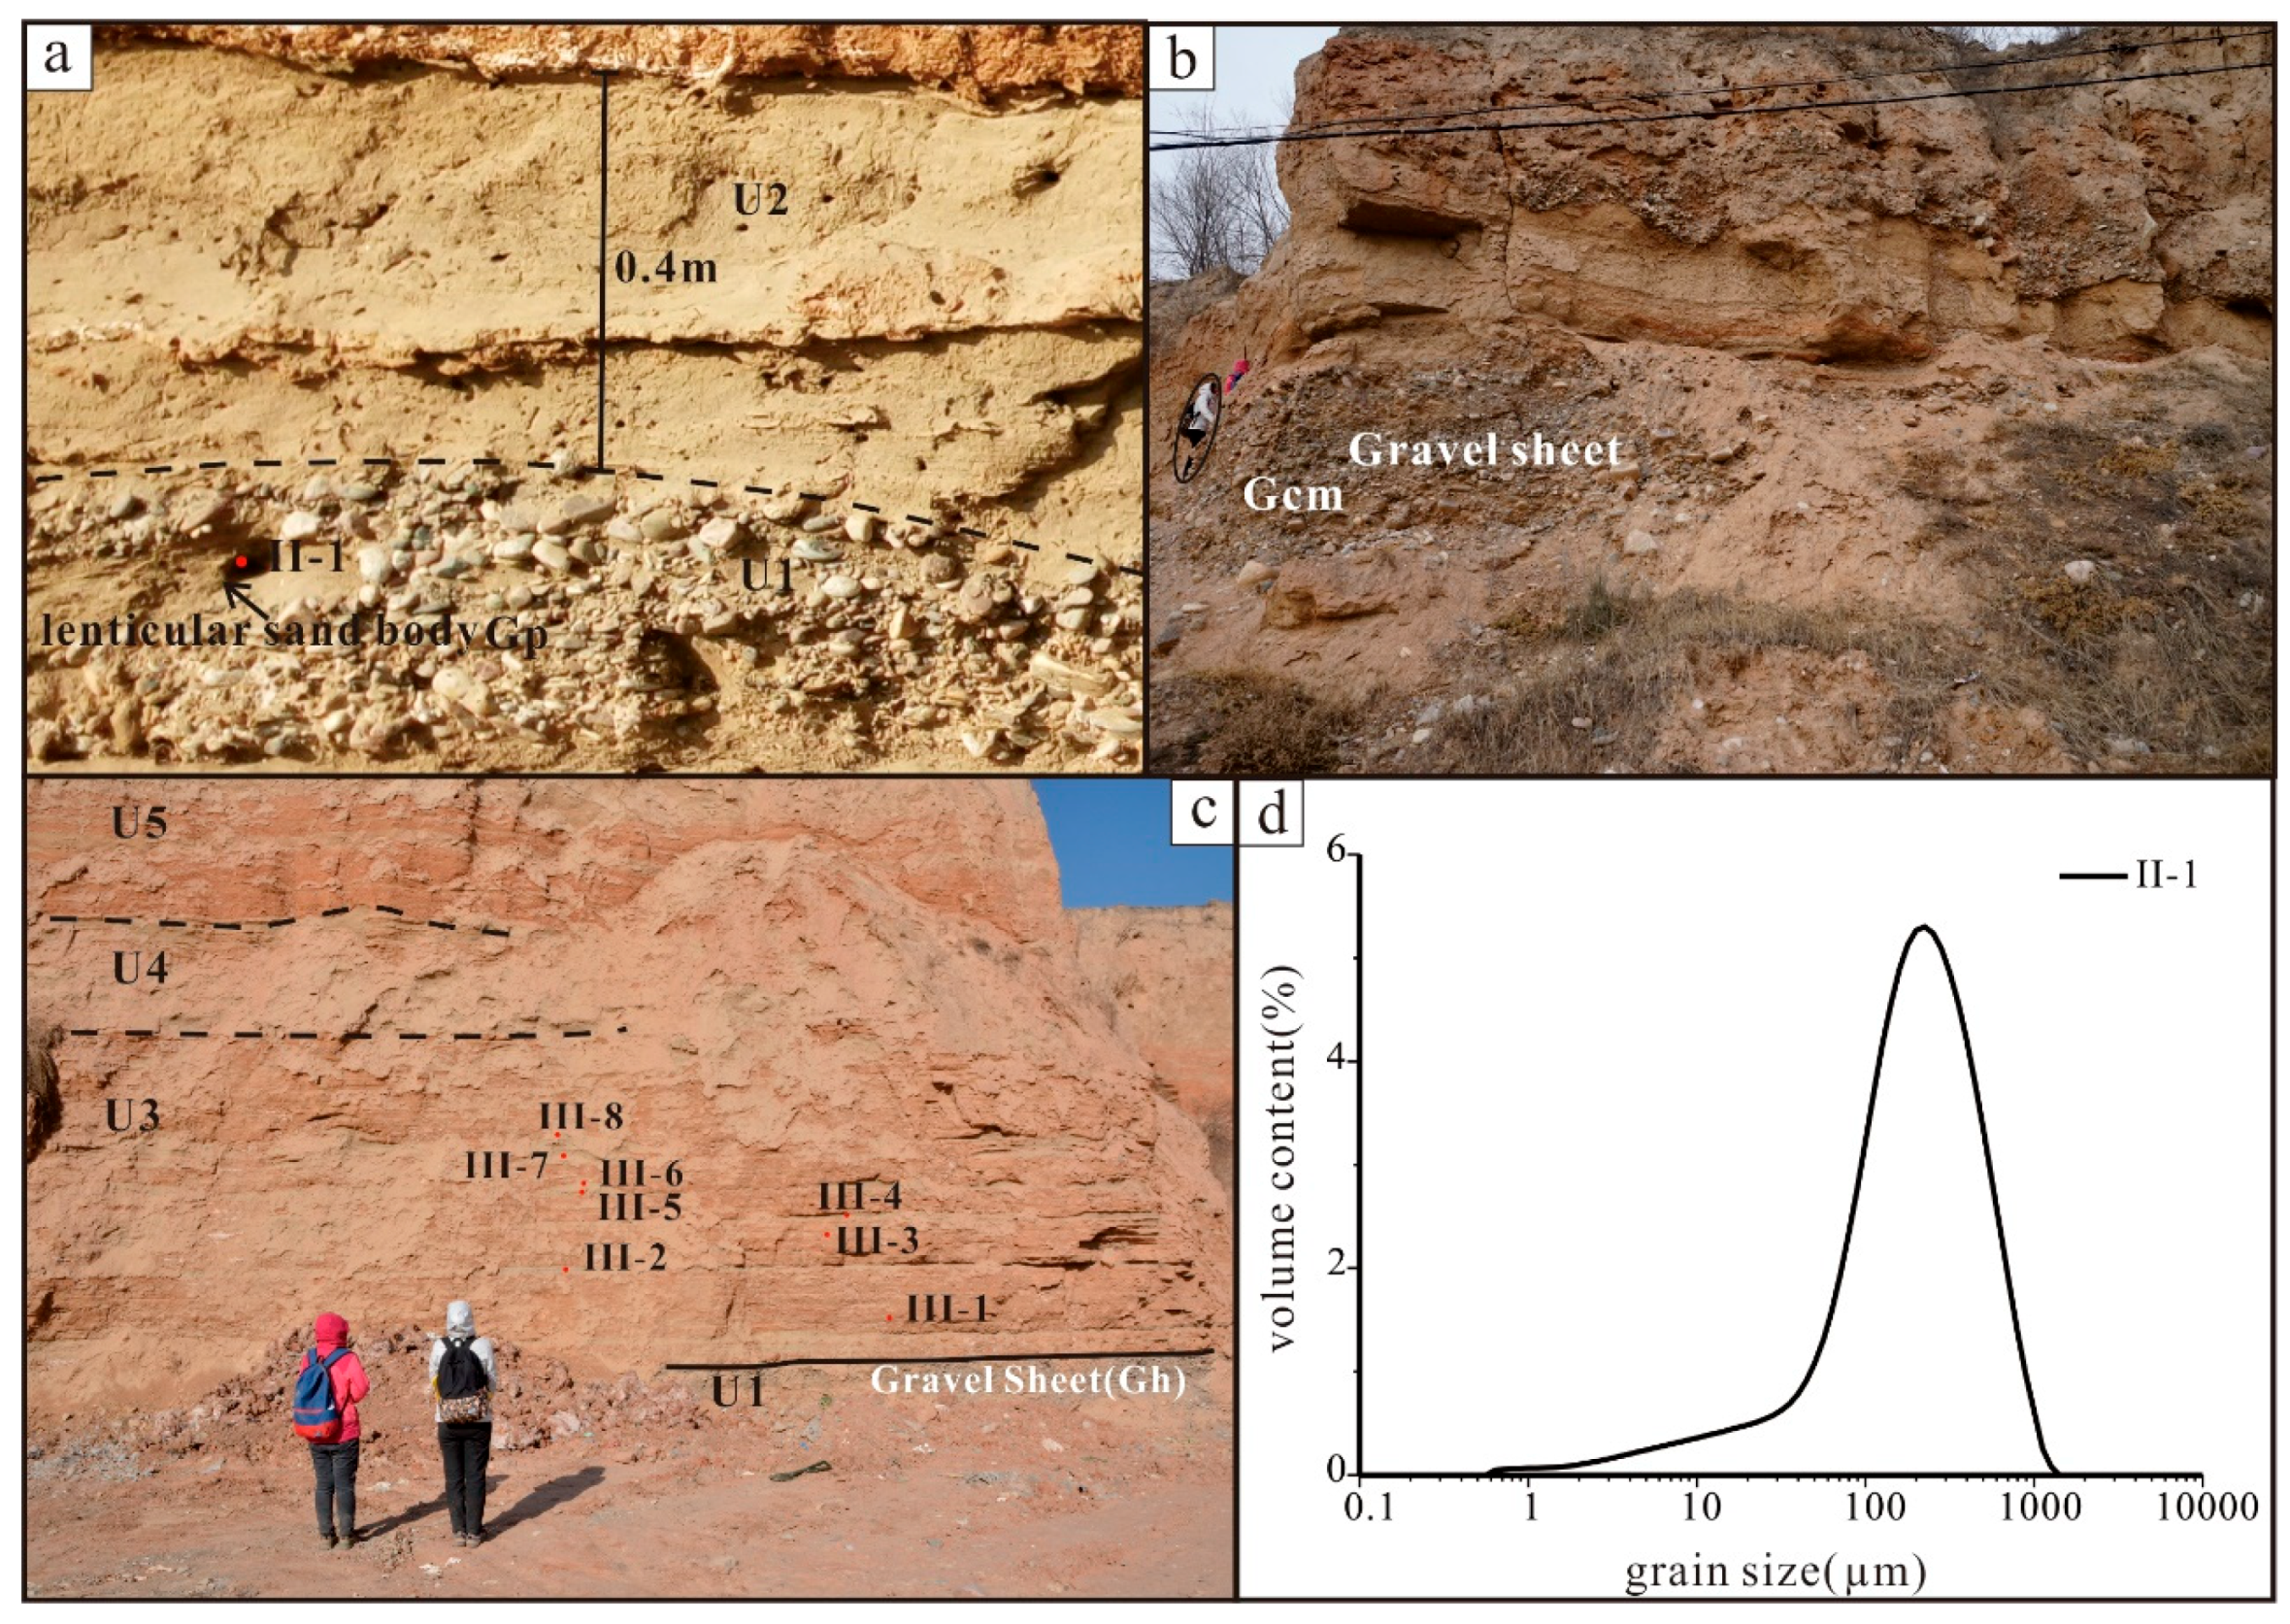
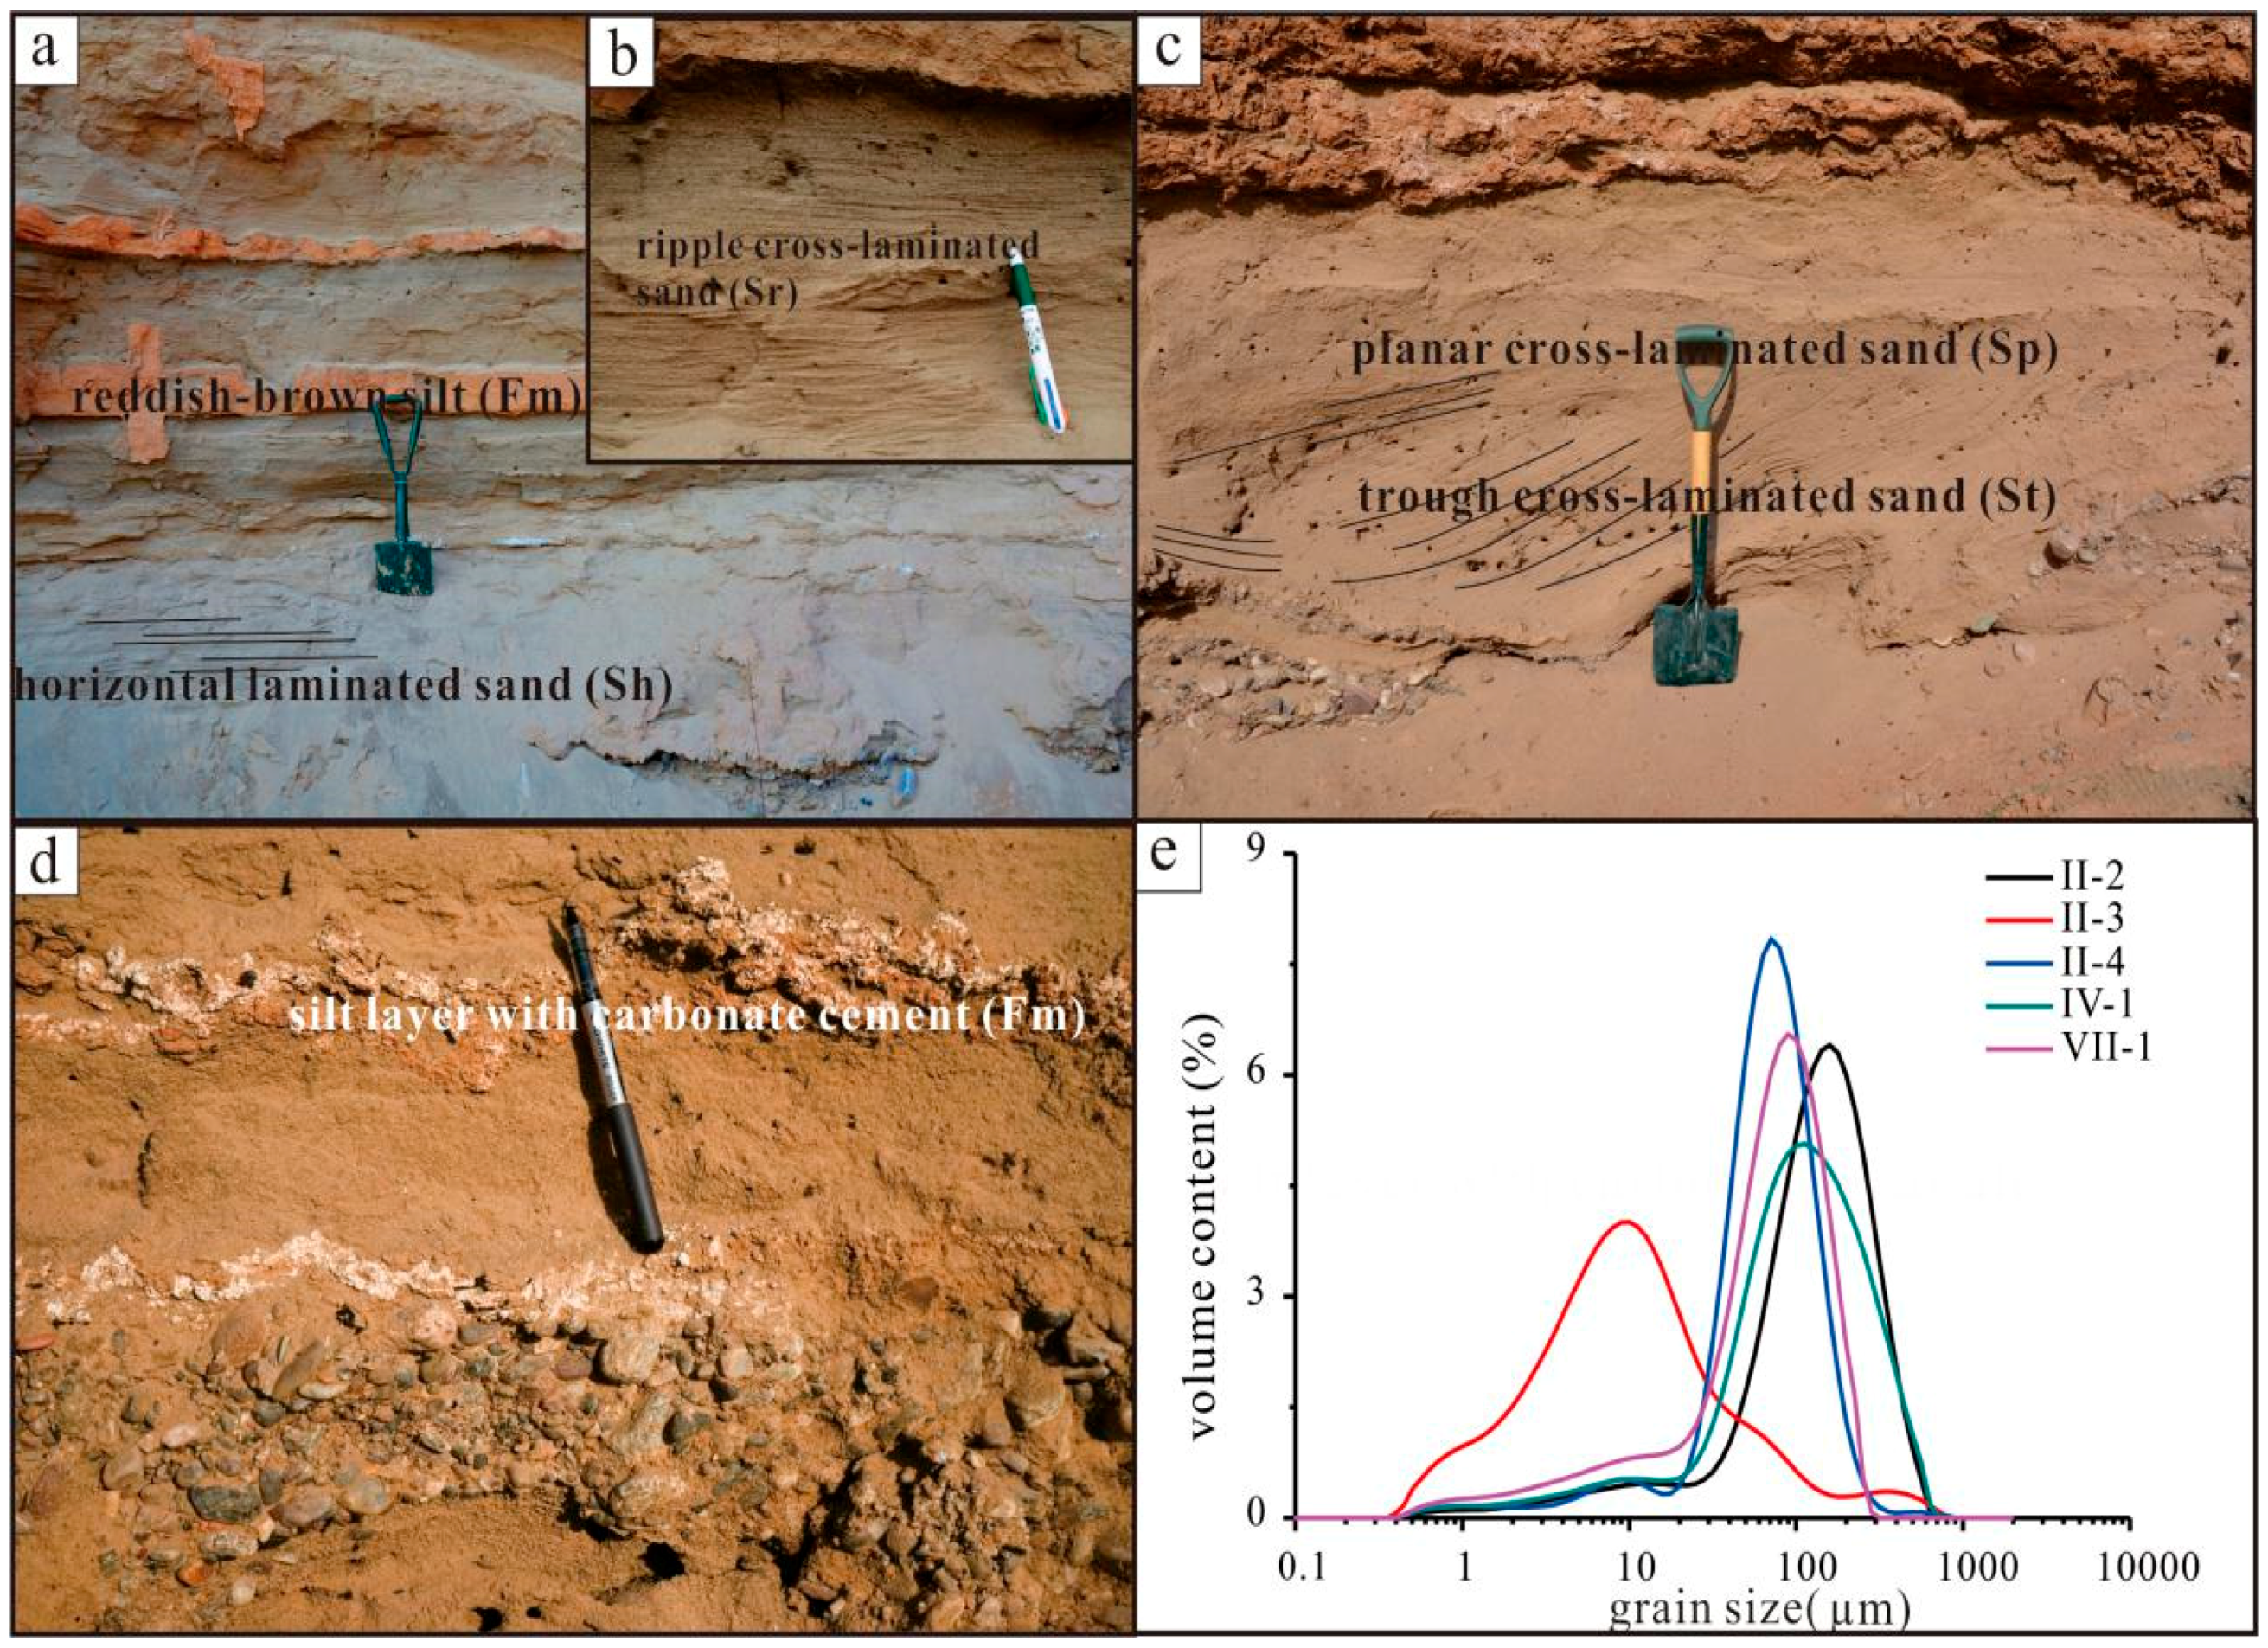
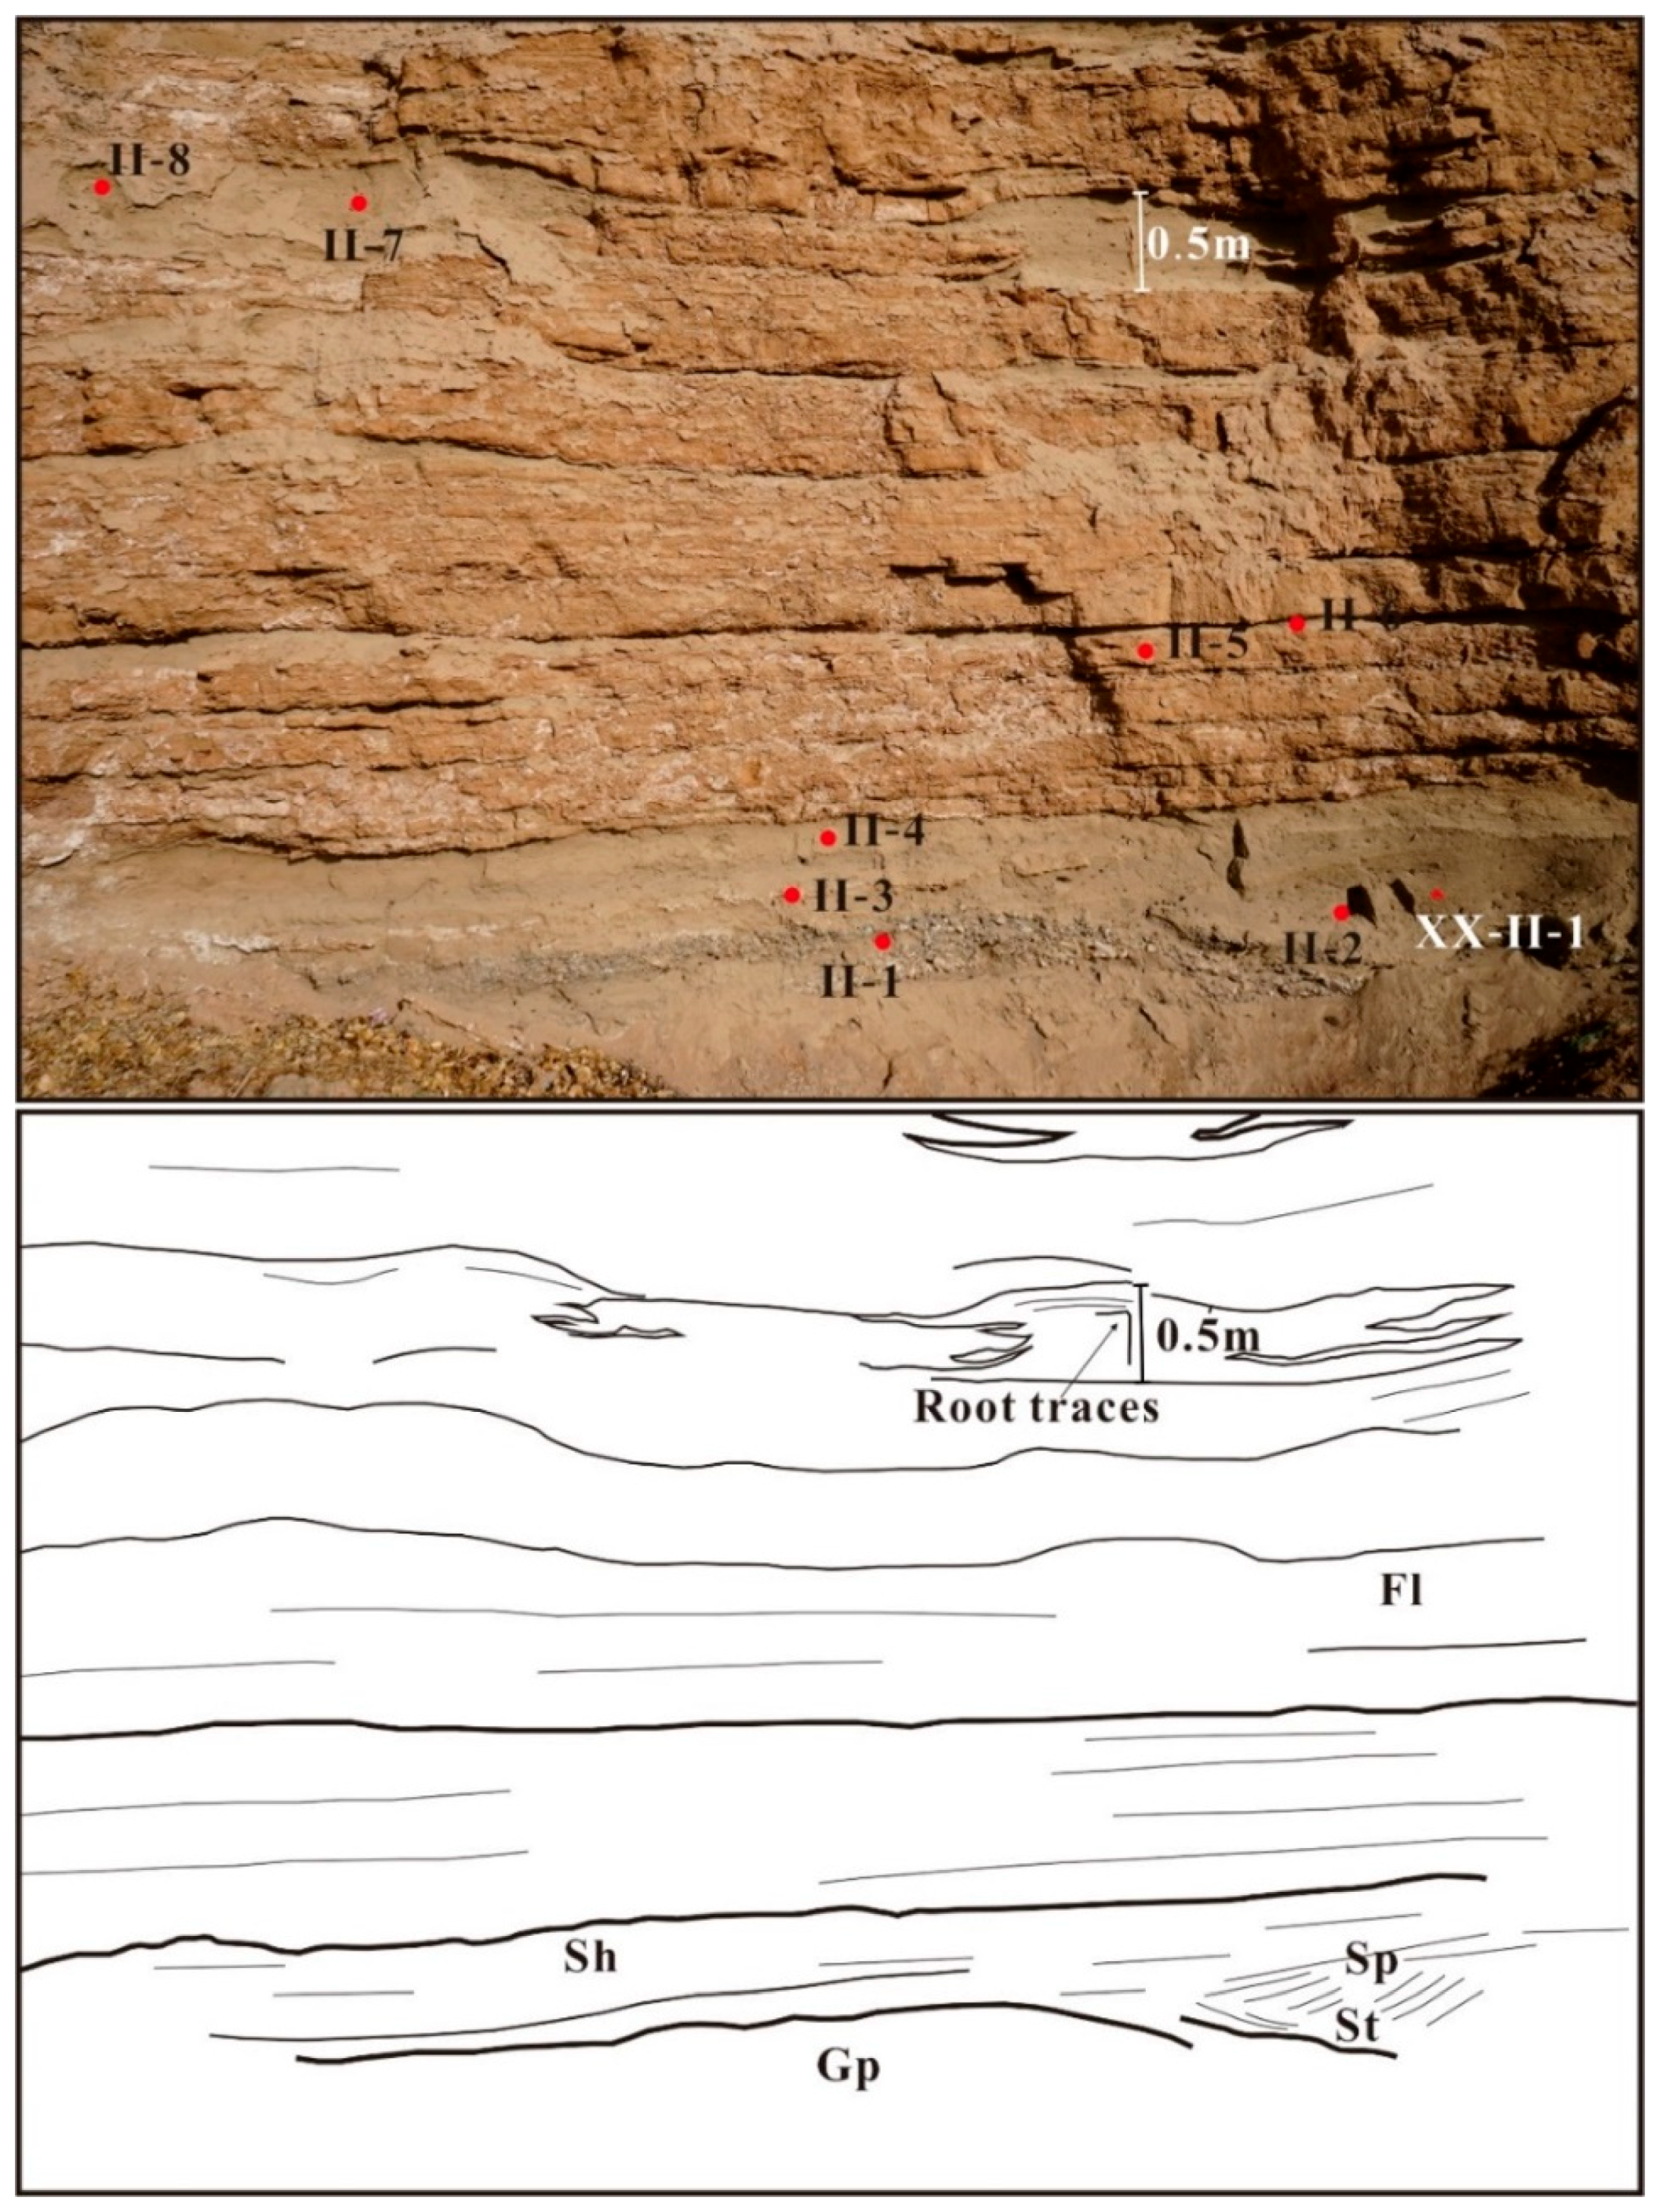
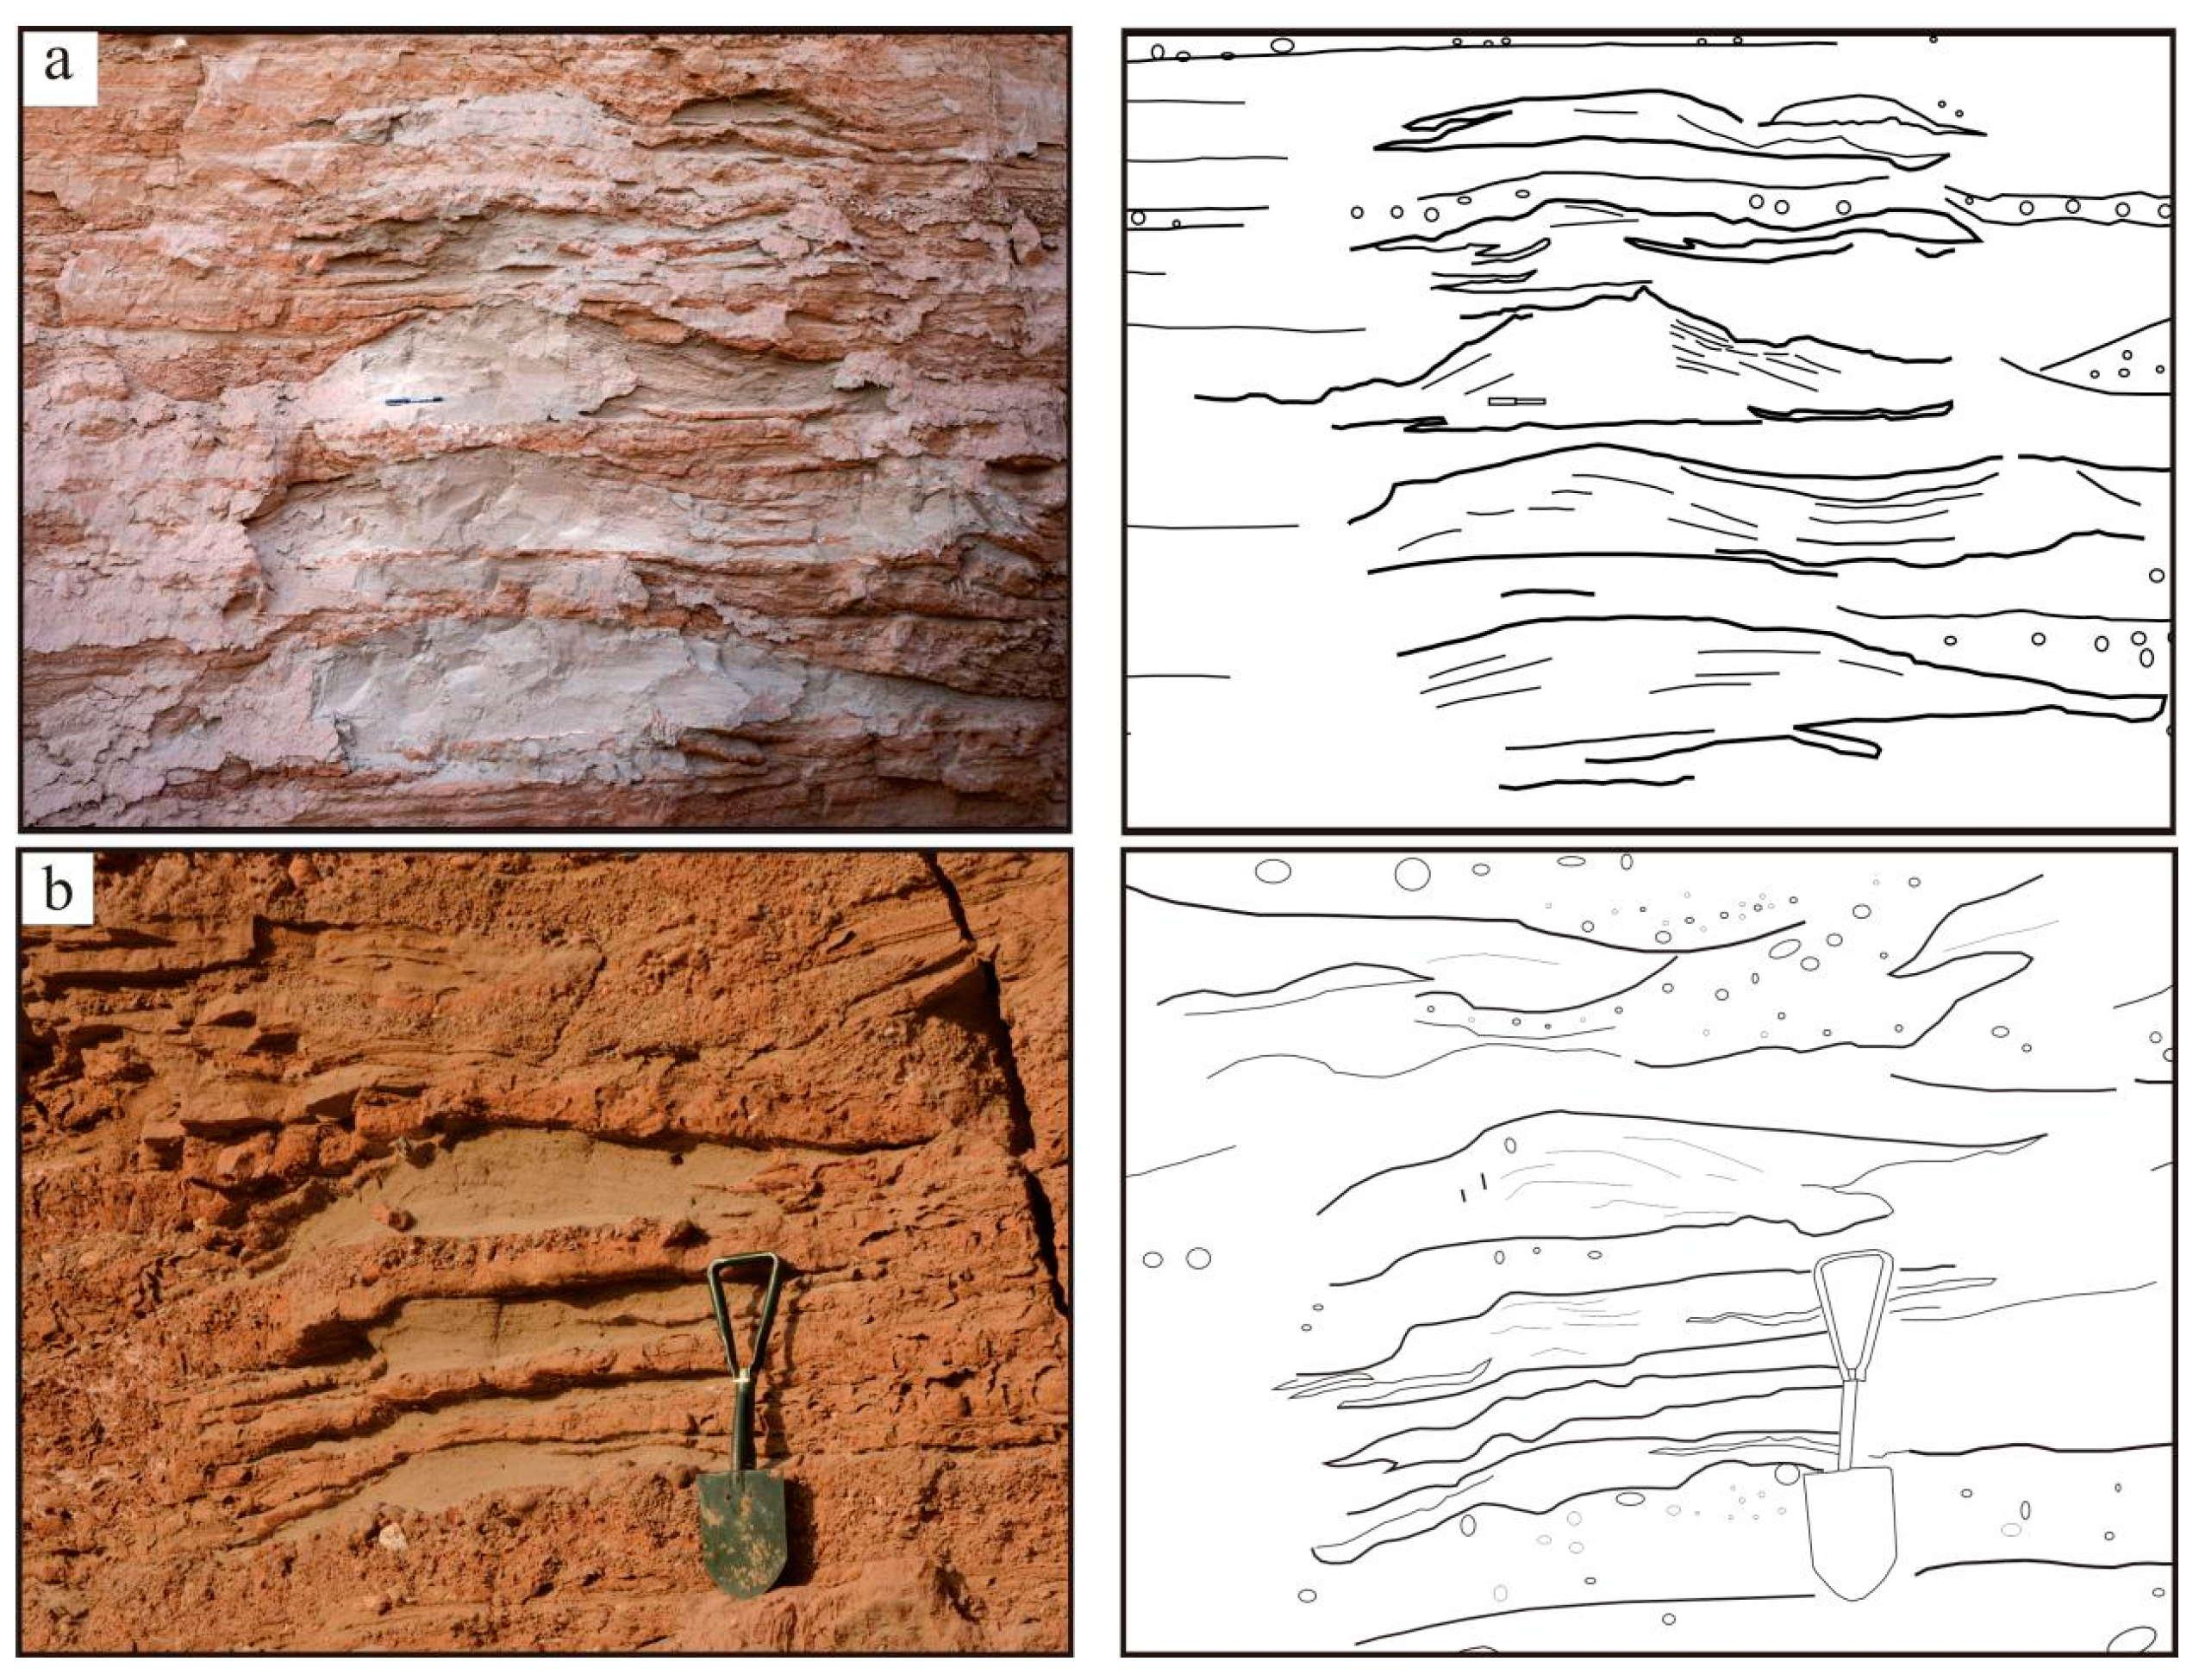
Table 1.
Description and interpretation of sedimentary facies of the Ping’an site (after Miall [54] and Einsele [69]).
| Facies Codes | Description | Interpretation |
|---|---|---|
| Gmm | Granules and pebbles, matrix-supported, granule-sand matrix, massive, poorly sorted, tabular-or lenticular-shaped, sub-rounded to rounded | Mass-flow deposition of hyper-concentrated or turbulent flow |
| Gcm | Granules and pebbles, clast-supported, massive, poorly sorted, sub-rounded to rounded | Rapid deposition by streamflow with concentrated clasts |
| Gh | Granules and pebbles, clast-supported, crudely horizontal beds, sub-rounded to rounded | Deposition of hyperconcentrated flow in unconfined sheet flood |
| Gp | Granules and pebbles, planar cross-beds, weak imbrication, tabular-shaped, sub-rounded to rounded | Transverse 2-D gravel bedforms |
| Gt | Granules and pebbles, trough cross-stratified, sub-angular to rounded, lenticular units | Minor channel fills with deposition from 3-D gravel dunes |
| Sh | Very fine to-coarse-grained sand, horizontal lamination | Deposition of planar bed flows in channels, or sheet flood, upper flow regime |
| Sp | Very fine-to-coarse-grained sand, planar cross-lamination | Migration of two-dimensional (2-D) dunes in channel |
| Sl | Very fine-to-very coarse-grained sand, low-angle (<15°) cross-lamination | Deposition of antidunes in upper flow regime |
| St | Very fine-to-coarse-grained sand, solitary or grouped trough cross-beds | Migration of sandy ripples/dunes in channels; or filling of scour hollows or channel pools |
| Sr | Very fine-to-coarse-grained sand with ripple cross-lamination, thinly bedded | Migration of ripples in shallow channels in lower flow regime; overland sheetflows |
| Sm | Very fine-to-coarse-grained sand, structureless | Rapid deposition of sand |
| Fl | Silt, fine lamination, very small ripple sets. Occasional lenses of granules and pebbles, calcareous cement and iron-manganese coating, mottled | Waning flood deposits or overbank, abandoned channel deposits |
| Fm | Silt, structureless, desiccation cracks. Occasionally calcareous cement and iron-manganese coating, bioturbation, mottled | Suspension deposits of waning flows in overbank or abandoned channel, weak pedogenesis |
| Fr | Silt, massive, roots, bioturbation | Root bed, weak pedogenesis |
Table 2.
Sediment types sampled for grain-size analysis and OSL dating (in bold and italics, respectively).
Table 2.
Sediment types sampled for grain-size analysis and OSL dating (in bold and italics, respectively).
| Sample | Sediment Type |
|---|---|
| Unit 1 | |
| II-1 | Lenticular sand body |
| Unit 2 | |
| XX-II-1 II-2 | Trough cross-stratified sand |
| II-3 | Silt layer |
| XX-C490, XX-C600, XX-VI-1 II-4; IV-1; VII-1 | Horizontally laminated sand |
| Unit 3 | |
| XX-I-1, XX-II-2, XX-V-1, XX-V-2 I-6, 7, 8; II-7, 8; III-5, 6, 7, 8; IV-4; V-4, 5, 6, 7 | Sand mounds |
| I-2, 4, 9; II-5; III-1, 3; IV-2; V-2; VII-2 | Silt layers |
| XX-C200 I-1, 3, 5; II-6; III-2, 4; IV-3; VII-3, 4 | Sand to silty sand layers |
| Unit 4 | |
| XX-II-3 | Planar cross-bedded sand |
| I-10; II-9, 10; V-3 | Sand layers |
| Unit 5 | |
| XX-B100 I-11; II-12 | Sandy silt layers |
| II-11; VII-5 | Silt layers |
| Unit 6 | |
| XX-A90, XX-A220 | Structureless silt |
| I-11; II-13, 14; VII-6 | Silt and sandy silt layers |
Table 3.
Summary of U, Th, and K concentrations, estimates of saturated water content (W.C.) with the absolutely uncertainty of 7%, calculated OSL and pIRIR dose rates and equivalent doses (De). (N) denotes the number of aliquots used for the De data. Q: quartz, FK: K-feldspar.
Table 3.
Summary of U, Th, and K concentrations, estimates of saturated water content (W.C.) with the absolutely uncertainty of 7%, calculated OSL and pIRIR dose rates and equivalent doses (De). (N) denotes the number of aliquots used for the De data. Q: quartz, FK: K-feldspar.
| Lab Code | Sample Code | Sediment Units | Depth (m) | U (ppm) | Th (ppm) | K (%) | W.C. (%) | Q-Dose Rate (Gy/ka) | FK-Dose Rate (Gy/ka) | Q-De (Gy) | FK-De (Gy) | Aliquots (N) | Q-Age (ka) | FK-Age (ka) |
|---|---|---|---|---|---|---|---|---|---|---|---|---|---|---|
| Nju-2579 | XX-A90 | U6 | 1.90 | 3.18 ± 0.04 | 11.70 ± 0.03 | 1.76 ± 0.03 | 16 | 3.15 ± 0.15 | 3.47 ± 0.15 | 226 ± 13 | 454 ± 9 | 6 1/6 2 | 72 ± 5 | 131 ± 7 |
| Nju-2580 | XX-A220 | U6 | 3.20 | 3.02 ± 0.04 | 11.40 ± 0.03 | 1.68 ± 0.03 | 20 | 2.91 ± 0.13 | 3.23 ± 0.14 | 267 ± 9 | 435 ± 25 | 9 1/6 2 | 92 ± 6 | 135 ± 10 |
| Nju-2582 | XX-B100 | U5 | 5.60 | 3.04 ± 0.04 | 11.30 ± 0.03 | 1.86 ± 0.03 | 20 | 2.97 ± 0.14 | 258 ± 11 | 8 1 | 87 ± 6 | |||
| Nju-2703 | XX-II-3 | U4 | 10.50 | 2.26 ± 0.04 | 9.06 ± 0.03 | 1.55 ± 0.03 | 17 | 2.46 ± 0.12 | 2.79 ± 0.12 | 218 ± 9 | 373 ± 11 | 14 1/7 2 | 89 ± 6 | 134 ± 8 |
| Nju-2700 | XX-I-1 | U3 | 7.45 | 2.80 ± 0.04 | 10.30 ± 0.03 | 1.66 ± 0.03 | 19 | 3.03 ± 0.13 | 433 ± 8 | 10 2 | 143 ± 7 | |||
| Nju-2583 | XX-C200 | U3 | 14.00 | 3.06 ± 0.04 | 11.70 ± 0.03 | 1.61 ± 0.03 | 17 | 2.78 ± 0.14 | 231 ± 8 | 16 1 | 83 ± 5 | |||
| Nju-2702 | XX-II-2 | U3 | 14.30 | 3.02 ± 0.04 | 11.00 ± 0.03 | 1.71 ± 0.03 | 21 | 2.72 ± 0.13 | 3.06 ± 0.13 | 203 ± 7 | 401 ± 8 | 16 1/4 2 | 74 ± 4 | 131 ± 7 |
| Nju-2704 | XX-V-1 | U3 | 15.60 | 3.08 ± 0.04 | 11.40 ± 0.03 | 1.65 ± 0.03 | 20 | 2.72 ± 0.13 | 3.06 ± 0.13 | 225 ± 12 | 406 ± 9 | 14 1/6 2 | 83 ± 6 | 133 ± 7 |
| Nju-2705 | XX-V-2 | U3 | 18.40 | 2.53 ± 0.04 | 10.20 ± 0.03 | 1.75 ± 0.03 | 20 | 2.97 ± 0.13 | 416 ± 13 | 6 2 | 140 ± 8 | |||
| Nju-2706 | XX-VI-1 | U2 | 14.00 | 2.41 ± 0.04 | 10.70 ± 0.03 | 1.50 ± 0.03 | 15 | 2.90 ± 0.13 | 458 ± 16 | 6 2 | 158 ± 10 | |||
| Nju-2585 | XX-C490 | U2 | 16.90 | 2.77 ± 0.04 | 10.70 ± 0.03 | 1.76 ± 0.03 | 15 | 2.86 ± 0.14 | 232 ± 12 | 16 1 | 81 ± 6 | |||
| Nju-2586 | XX-C600 | U2 | 18.00 | 2.15 ± 0.04 | 9.95 ± 0.03 | 1.55 ± 0.03 | 14 | 2.53 ± 0.13 | 218 ± 9 | 8 1 | 86 ± 6 | |||
| Nju-2701 | XX-II-1 | U2 | 18.00 | 2.16 ± 0.04 | 9.50 ± 0.03 | 1.67 ± 0.04 | 15 | 2.64 ± 0.13 | 2.97 ± 0.14 | 204 ± 11 | 395 ± 6 | 13 1/6 2 | 78 ± 6 | 133 ± 7 |
Note: 1 Number of aliquots used in quartz SAR protocol; 2 Number of aliquots used in pIRIR290 protocol.
© 2018 by the authors. Licensee MDPI, Basel, Switzerland. This article is an open access article distributed under the terms and conditions of the Creative Commons Attribution (CC BY) license (http://creativecommons.org/licenses/by/4.0/).
Share and Cite
MDPI and ACS Style
Gao, L.; Wang, X.; Yi, S.; Vandenberghe, J.; Gibling, M.R.; Lu, H. Episodic Sedimentary Evolution of an Alluvial Fan (Huangshui Catchment, NE Tibetan Plateau). Quaternary 2018, 1, 16. https://0-doi-org.brum.beds.ac.uk/10.3390/quat1020016
AMA Style
Gao L, Wang X, Yi S, Vandenberghe J, Gibling MR, Lu H. Episodic Sedimentary Evolution of an Alluvial Fan (Huangshui Catchment, NE Tibetan Plateau). Quaternary. 2018; 1(2):16. https://0-doi-org.brum.beds.ac.uk/10.3390/quat1020016
Chicago/Turabian StyleGao, Linman, Xianyan Wang, Shuangwen Yi, Jef Vandenberghe, Martin R. Gibling, and Huayu Lu. 2018. "Episodic Sedimentary Evolution of an Alluvial Fan (Huangshui Catchment, NE Tibetan Plateau)" Quaternary 1, no. 2: 16. https://0-doi-org.brum.beds.ac.uk/10.3390/quat1020016