Review

The Indian Summer Monsoon from a Speleothem δ18O Perspective—A Review

by
Nikita Kaushal
1,*,†,
Sebastian F. M. Breitenbach
2,
Franziska A. Lechleitner
1,
Ashish Sinha
3,
Vinod C. Tewari
4,
Syed Masood Ahmad
5,
Max Berkelhammer
6,
Shraddha Band
7,
Madhusudan Yadava
7,
Rengaswamy Ramesh
7 and
Gideon M. Henderson
1
1
Department of Earth Sciences, University of Oxford, Oxford OX1 3AN, UK
2
Institute for Geology, Mineralogy and Geophysics, Ruhr University Bochum, 44801 Bochum, Germany
3
Department of Earth Sciences, California State University, Dominguez Hills, Carson, CA 90747, USA
4
Department of Geology, Sikkim University, Sikkim 737102, India
5
Department of Geography, Faculty of Natural Sciences, Jamia Millia Islamia, New Delhi 110025, India
6
Department of Earth and Environmental Sciences, University of Illinois, Chicago, IL 60607, USA
7
Faculty of Geoscience, Physical Research Laboratory, Gujarat 380009, India
*
Author to whom correspondence should be addressed.
Now at: Asian School of the Environment, Nanyang Technological University, Singapore 639798, Singapore.
Submission received: 19 September 2018 / Revised: 30 November 2018 / Accepted: 30 November 2018 / Published: 7 December 2018
(This article belongs to the Special Issue Speleothem Records and Climate)

Abstract

:
As one of the most prominent seasonally recurring atmospheric circulation patterns, the Asian summer monsoon (ASM) plays a vital role for the life and livelihood of about one-third of the global population. Changes in the strength and seasonality of the ASM significantly affect the ASM region, yet the drivers of change and the varied regional responses of the ASM are not well understood. In the last two decades, there were a number of studies reconstructing the ASM using stalagmite-based proxies such as oxygen isotopes (δ18O). Such reconstructions allow examination of ASM drivers and responses, increasing monsoon predictability. In this review paper, we focus on stalagmite δ18O records from India at the proximal end of the ASM region. Indian stalagmite δ18O records show well-dated, high-amplitude changes in response to the dominant drivers of the ASM on orbital to multi-centennial timescales, and indicate the magnitude of monsoon variability in response to these drivers. We examine Indian stalagmite records collated in the Speleothem Isotope Synthesis and AnaLysis version 1 (SISAL_v1) database (http://researchdata.reading.ac.uk/139/) and support the database with a summary of record quality and regional climatic interpretations of the δ18O record during different climate states. We highlight current debates and suggest the most useful time periods (climatic events) and locations for further work using tools such as data-model comparisons, spectral analysis methods, multi-proxy investigations, and monitoring.

1. Introduction

The Indian summer monsoon (ISM) is part of the Asian summer monsoon (ASM) and provides ca. 70% of India’s annual precipitation. Monsoon variability results in frequent floods and droughts that significantly affect livelihood and agriculture. The latter depends on the regularity of the ISM’s rainfall, intensity, seasonality, and timing of onset and retreat [1]. Yet, this variability and changes in rainfall seasonality remain poorly understood [1,2]. Speleothems (mostly stalagmites) provide high-resolution, multi-proxy records (e.g., δ18O, δ13C, trace-element ratios, fluorescence, growth rates, and mineralogy) of ASM variability with increasingly tight age control (e.g., References [3,4]). Although there is a large body of studies from Eastern Asia [5,6,7,8], the Indian subcontinent remains much less well studied. The incongruent spatial coverage between the two regions is mainly due to the availability of karst regions with suitable sampling material. Since 2004, stalagmite-based records of ISM dynamics were published from 21 cave sites in India. The available stalagmite records show that the amplitude of monsoon variability, even within the last millennium, is higher than that captured by short instrumental records [9,10] and provides evidence of multi-year to multi-decadal droughts that line up reasonably well with historical and archaeological records of droughts, famines, and social disruptions [10,11,12]. Records further show that dynamics internal to the Earth’s climate system can cause changes of the same order of amplitude as orbital forcing [13]. While climate models do not generally capture internal monsoon dynamics, spectral analysis of reconstructed monsoon time series provides evidence of recurring low-frequency monsoonal variability with timescales that are inconsistent with known external forcing mechanisms. Phase studies indicate that the ISM is sensitive to global forcings and atmospheric dynamics, including insolation [13], El Niño–Southern Oscillation (ENSO), Pacific Decadal Oscillation (PDO) dynamics [14], and changes triggered in the North Atlantic realm [13,15,16,17]. While individual stalagmite records significantly increased our understanding of past monsoon variability, the drivers and pathways of ISM variability, regional responses to changes in the monsoon, and the interpretation of the δ18O proxy are still debated [2].
Stalagmite δ18O records from the ISM region reflect the sum of several processes at any given site, including changes in larger circulation patterns, rainfall seasonality, and temperature, in addition to changes in local precipitation amount [18,19]. Consequently, stalagmite δ18O provides a powerful tool for the reconstruction of past circulation changes in response to orbital and North Atlantic forcings; however, its meaning at the local scale must be established with great care. Reconstruction of past sub-continental climate variability is hampered by insufficient understanding of proxy-influencing factors, record quality, lack of adequate spatial and temporal coverage, and lack of synthesis of records that would enable pan-regional comparisons. This collation and synthesis of stalagmite δ18O records was made available by the Speleothem Isotope Synthesis and AnaLysis (SISAL) database.
The SISAL database was created by the SISAL Working Group supported by Past Global Changes (PAGES; http://pastglobalchanges.org/ini/wg/sisal). SISAL aims to compile and synthesize stalagmite δ18O and δ13C records to develop a global database which can be used to explore past climate changes and to enable climate model evaluation. The first version of the database, SISAL_v1, is available at [20]. Database structure and content were described in Atsawawaranunt et al. [21]. The following review is one of a series of regional review articles drawing on the SISAL database. The database contains δ18O and δ13C data of stalagmites along with relevant age and cave information. However, the control on δ13C in stalagmites from India is not well understood and is rarely interpreted [17]. Similarly, stalagmite trace-element ratios are emerging as a powerful set of proxies from stalagmites; however, trace-element ratios were not incorporated in SISAL_v1 and are only recently being explored in India. For these reasons, this review paper focuses entirely on δ18O records.
The following review complements the SISAL database by introducing the geography and modern climate of the ISM region (Section 2), describing the spatial and temporal distribution and quality of stalagmite δ18O records in the ISM region (Section 3), providing regional interpretations of the δ18O records (Section 4), and discussing specific climate events and underlying forcings in the ISM region (Section 5).

2. Study Region

The most distinctive physical features of India are the Himalayan mountain range to the north and the Indian Ocean to the south of peninsular India, with the Arabian Sea in the west, and the Bay of Bengal to the east (Figure 1). Both coasts of peninsular India are characterized by mountain ranges. The ~2500-m-high Western Ghats that run along the Arabian Sea coast form an orographic boundary for moisture carried from the Arabian Sea, while the Eastern Ghats are lower (~1500 m) and less continuous. The Vindhyan and Satpura mountain ranges and the Chota Nagpur Plateau to the North have elevations of 700 to 1500 m, and form a loose northern boundary to peninsular India.
Four climatological seasons are designated for the ISM region (the Indian Meteorological Department):
  • Winter lasting from December until March; snowfall is seen only in the high-altitude Himalayan region. Winter climate is characterized by dry conditions through most of the other regions, with influence of northeasterly cold-air masses originating on the Tibetan Plateau, the “Winter monsoon”. In northwest India, recycled moisture from the Atlantic, Mediterranean, and near East can be introduced by the westerlies (“Western Disturbances”) [22].
  • Summer or pre-monsoon season lasting from April to June; these are the hottest and driest months of the year with temperatures between 20 °C and 40 °C.
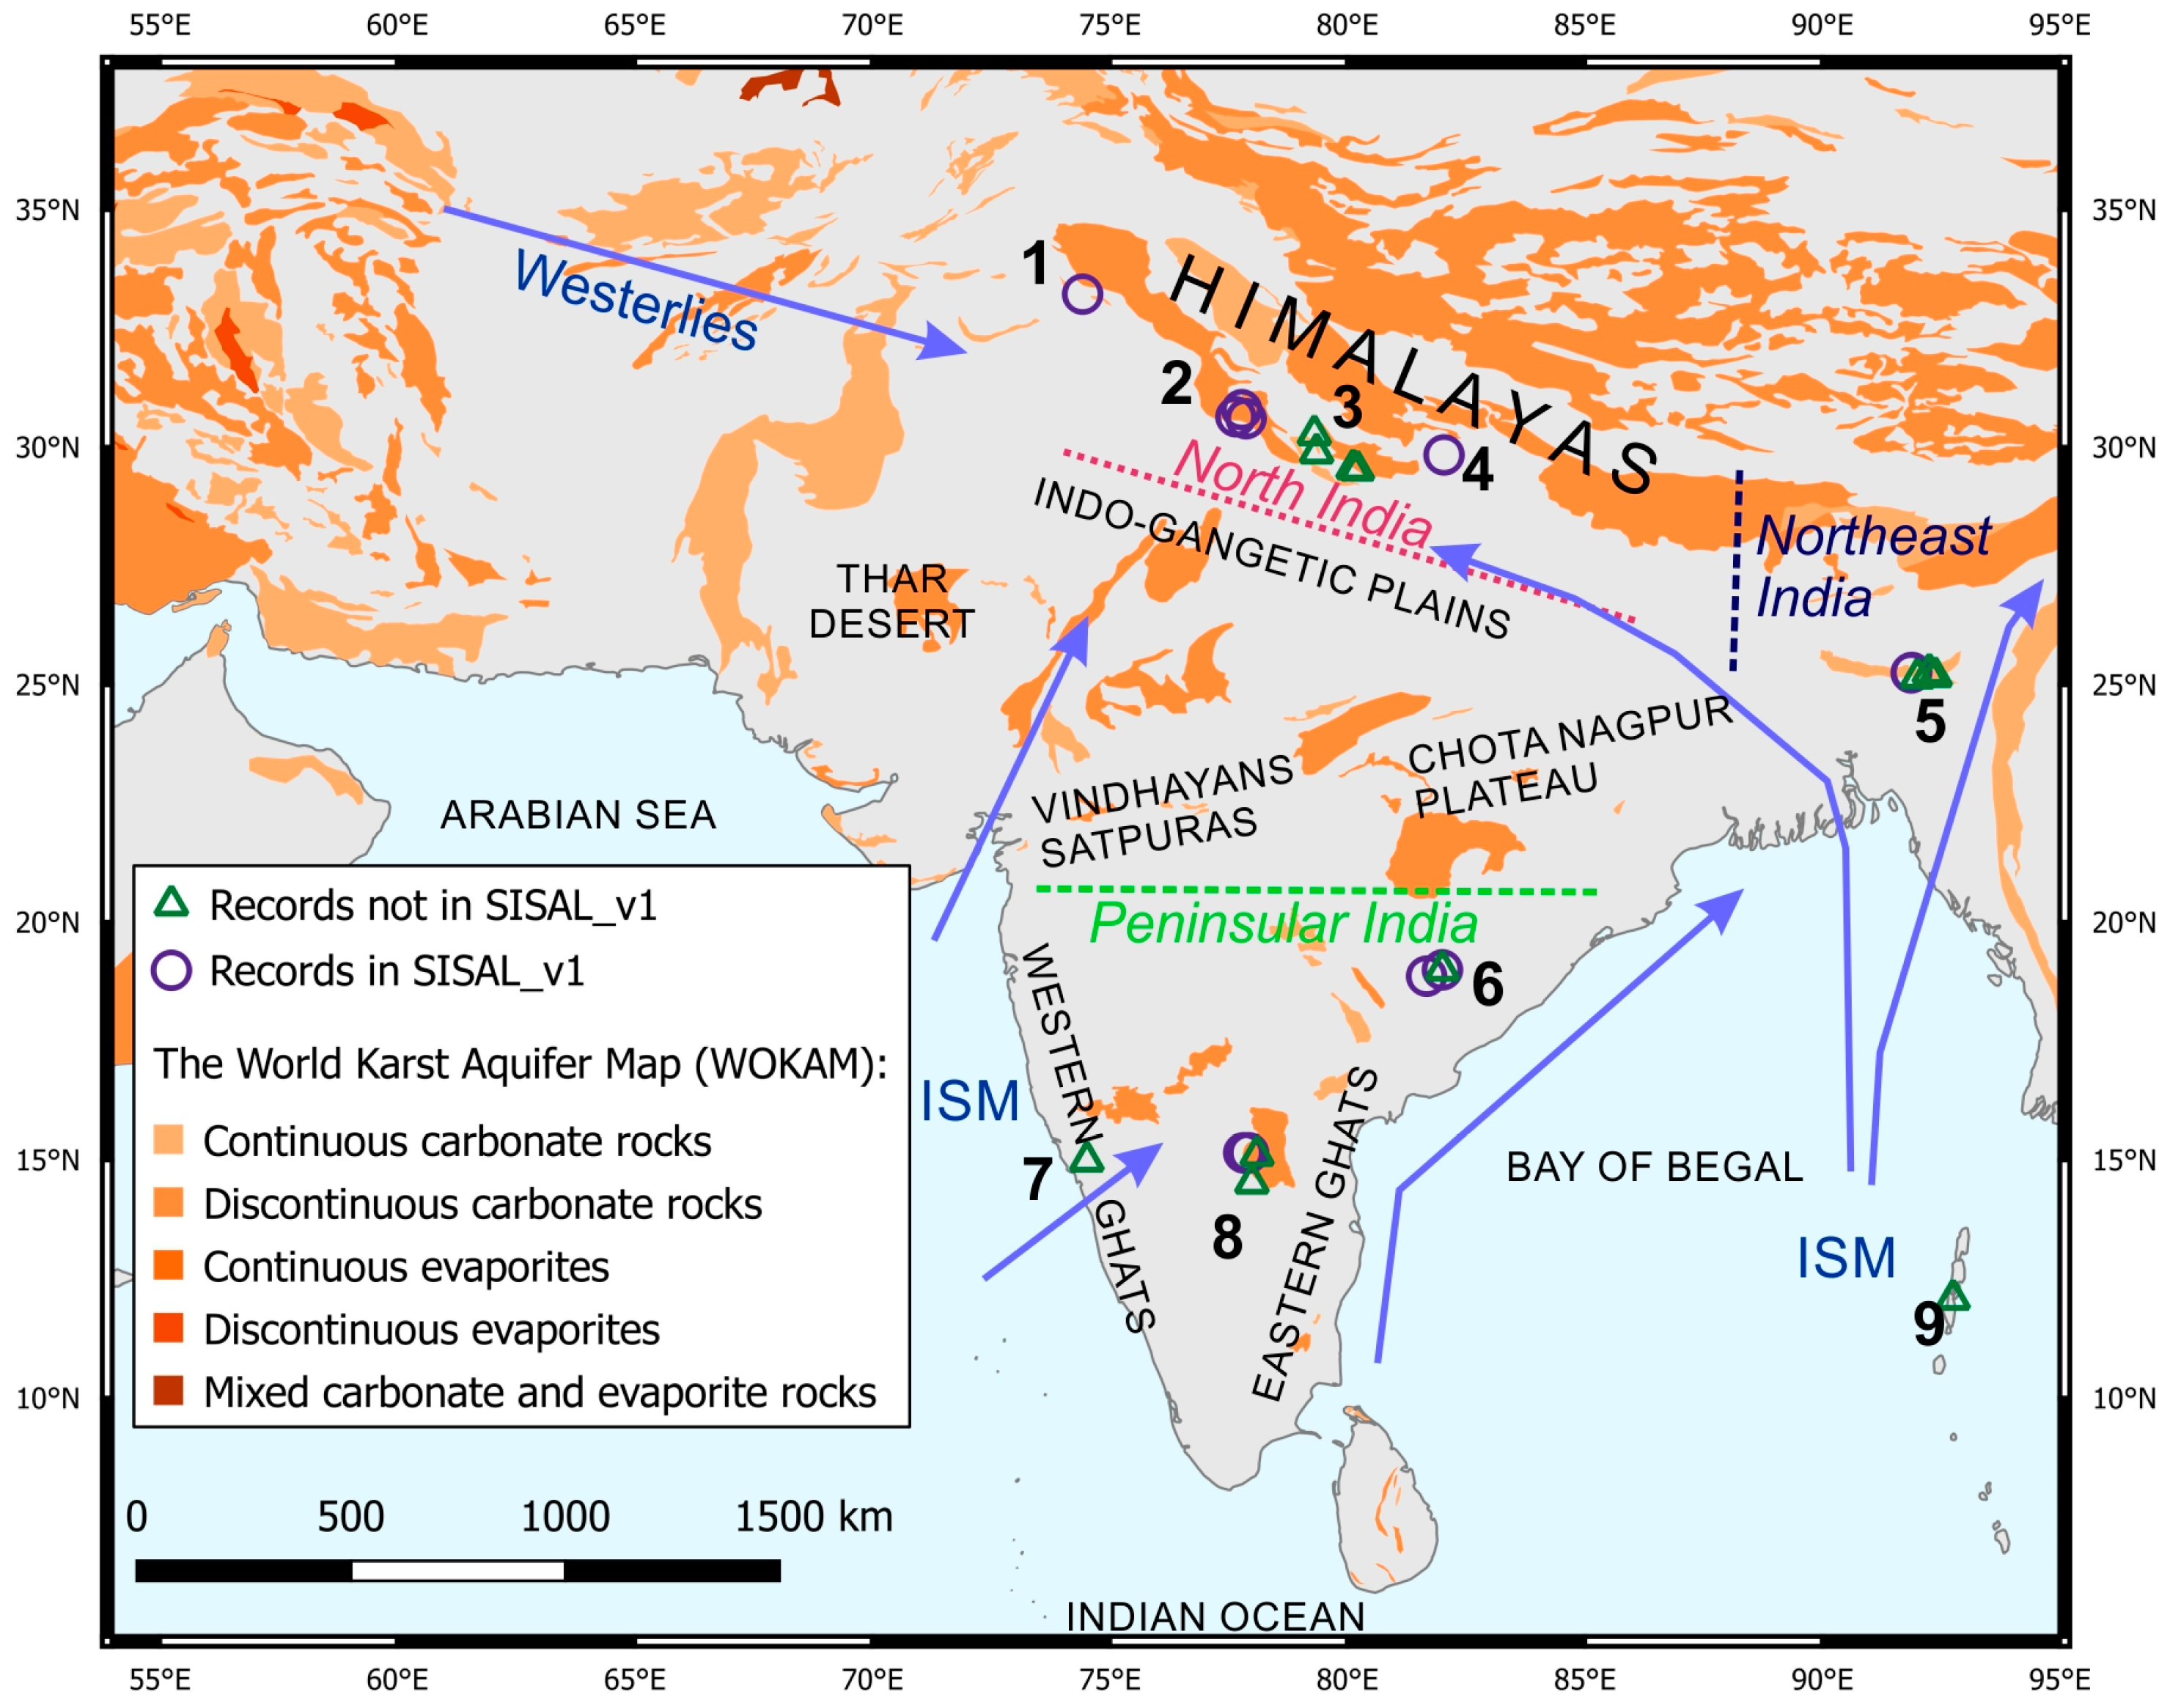
  • Summer monsoon (Indian summer monsoon—ISM) or rainy season lasts from July to September; the monsoon rainfall onset is as early as the first week of June in south peninsular India gradually extending across the rest of India by the first week of July. The summer monsoon season is dominated by the southwest monsoon that delivers ~70% of the total annual rainfall to India. The Meghalaya Plateau in northeast India receives exceptional amounts of precipitation at this time due to its position as the first orographic barrier for moist air masses from the Bay of Bengal [23], leading to its denomination as the “wettest place on Earth” [24].
  • The post-monsoon occurs during October and November; little rain falls at this time in peninsular India except in the southeast where most of the rain is brought by northeast winds that source moisture from the Bay of Bengal.
The seasonal reversal of meridional temperature and pressure gradients and associated circulation patterns which constitute the summer and winter monsoons is the most outstanding feature of Indian meteorology [25]. During the ISM period, convective rainfall dominates India’s weather. A pronounced temperature gradient between Central Asia and the Indian Ocean is accompanied by a northward shift of the Intertropical Convergence Zone (ITCZ), resulting in the southeast trade winds turning westerly due to Coriolis forces as they cross the equator. These winds carry copious amounts of water from the Indian Ocean to peninsular India [1]. This southwest monsoon can be depicted as two branches: the Arabian Sea branch and the Bay of Bengal branch (Figure 1). The Arabian Sea branch blows eastward across peninsular India and toward the Himalayas, and has a much stronger impact on peninsular India. The Bay of Bengal branch initially tracks the eastern coast and then swerves northwest at the Himalayan orographic barrier and proceeds over the Indo-Gangetic plain. Part of the Bay of Bengal branch is pushed northward along the deep meridionally oriented river valleys and onto the southern Tibetan Plateau [26]. During winter, the southward retreat of the ITCZ and parallel development of the Tibetan winter high-pressure cell results in a reversal of the wind patterns.
Two factors known to affect inter-annual ISM variability over the modern instrumental period are the El Niño–Southern Oscillation (ENSO) and Himalayan/Eurasian snow cover [1]. The Southern Oscillation is a pattern of zonal circulation in the tropics. The easterly trade winds transport cold upwelling water off the coast of Peru (Pacific Ocean) further westward. The surface water is warmed by the sun. Whichever part of the ocean is the warmest is where there is increased convection associated with the rising branch of the Walker circulation. Every 3–5 years on average, upwelling of cold waters is suppressed and El Niño conditions set in, while La Niña with a similar periodicity is characterized by warm water traveling further west than the neutral state [27], such that La Niña is associated with more convection and more rainfall in India. Satellite snow cover estimates indicate a negative relationship between snow cover (snow mass) and the ISM. Excessive snow during the preceding winter is unfavorable for the subsequent monsoon season because of delayed build-up of low-pressure cells over the continent in spring [28,29,30,31,32]. However, observations showed that the ENSO–ISM relationship [33,34,35] and the snow cover–ISM relationship [31] may be weakening in recent decades. The factors causing this weakening and the current dominant drivers of inter-annual variability are still debated.
A substantial component of ISM variability on the annual scale stems from intra-seasonal oscillations in monsoon precipitation termed active/break periods which exhibit a hierarchy of quasi periods (8–7 days, 10–20 days, and 30–60 days) [1,36]. During an “active” period, a positive rainfall anomaly is found over western and central India, and a negative rainfall anomaly is found over northeast and southeast India. During a “break” period, the signs are reversed [37,38]. Although questions remain regarding the mechanisms that drive inter-annual variability in the frequency of active/break cycles, their individual manifestations appear to be associated with the Madden–Julian Oscillation (MJO), which is the dominant driver of sub-seasonal climate variability in the pan-tropics [39]. Less is known about controls on decadal variability in the ISM. Studies suggest that solar irradiance [40] and Pacific Ocean sea surface temperature (SST) [40,41] influence ISM multi-decadal variability.

3. Distribution of Speleothem Isotopic Records in Space and Time

The spatial distribution of currently known stalagmite δ18O records in SISAL_v1, as well as from publications and conference abstracts (published before April 2018), from the ISM region is shown in Figure 1. Table 1 provides a comprehensive list of published records and indicates whether the records are available in SISAL_v1. Records where we were unable to get all the required information from the original authors could not be included in SISAL_v1. Mirroring the distribution of karst in India, most stalagmite records are from the northern and northeastern Himalayas. Few records were recovered from central and southern peninsular India, and there are no known records from the northwest and the Indo-Gangetic plains. The oldest and longest published stalagmite record is from Bittoo cave in northern India covering the last 240 ka [13]. Orbital-, millennial-, and Holocene-scale records are available from the ISM region; however, most of the records are discontinuous and cover relatively brief snapshots of time (Figure 2). Nevertheless, δ18O records covering time periods of climatic significance are available from north, northeastern, and peninsular India (Figure 3). Further information on the spatio-temporal distribution of stalagmites and details on the potential for further work from these caves are given in Section 3.1 and Section 3.2, while Section 3.3 provides information on the quality of the records.

3.1. Spatial Distribution of Caves and Potential for Paleoclimate Studies

Information on north and northeast Indian caves is provided by Gebauer [62,63,64,65,66,67,68,69,70] and Breitenbach and Gebauer [71] and a number of other publications [72,73,74,75,76,77]. In comparison to the Himalayan region, very limited information is available on the caves from peninsular India. Based on publications and field visits conducted by one or more authors of this paper, karst caves in peninsular India are mainly found in the Proterozoic Mahanadi, Kaladgi, and Cuddapah basins. Dandak, Jhumar, Gupteshwar, Kailash, and Kotumsar caves are a part of the Mahanadi basin. Additional information on caves from the Mahanadi basin can be found in References [78,79,80]. This region is worth exploring further; however, the current disturbed political conditions prevent this. Akalagavi cave formed in the limestone and dolomite formations of the Kaladgi basin on the west coast of India. Several other caves from the same karst region were explored. Akalagavi and one other cave are currently dripping; however, no further stalagmites (apart from Reference [50]) suitable for paleoclimate work were identified from this region. Belum, Valmiki, Munagamanu, and Nakarallu caves are located in the Cuddapah basin. Dar et al. [81] published a comprehensive review of the Cuddapah karst region from peninsular India. This region is worth exploring further for paleoclimate records. Several caves are protected as tourism and temple caves. Bora cave is a part of the Eastern Ghats Mobile Belt of Precambrian age. It is a large, open, airy cave and is unlikely to be suitable for paleoclimate work. No other caves are reported from this region. Baratang cave is located in limestone formations of Cenozoic age in the Andaman Island in the Bay of Bengal.

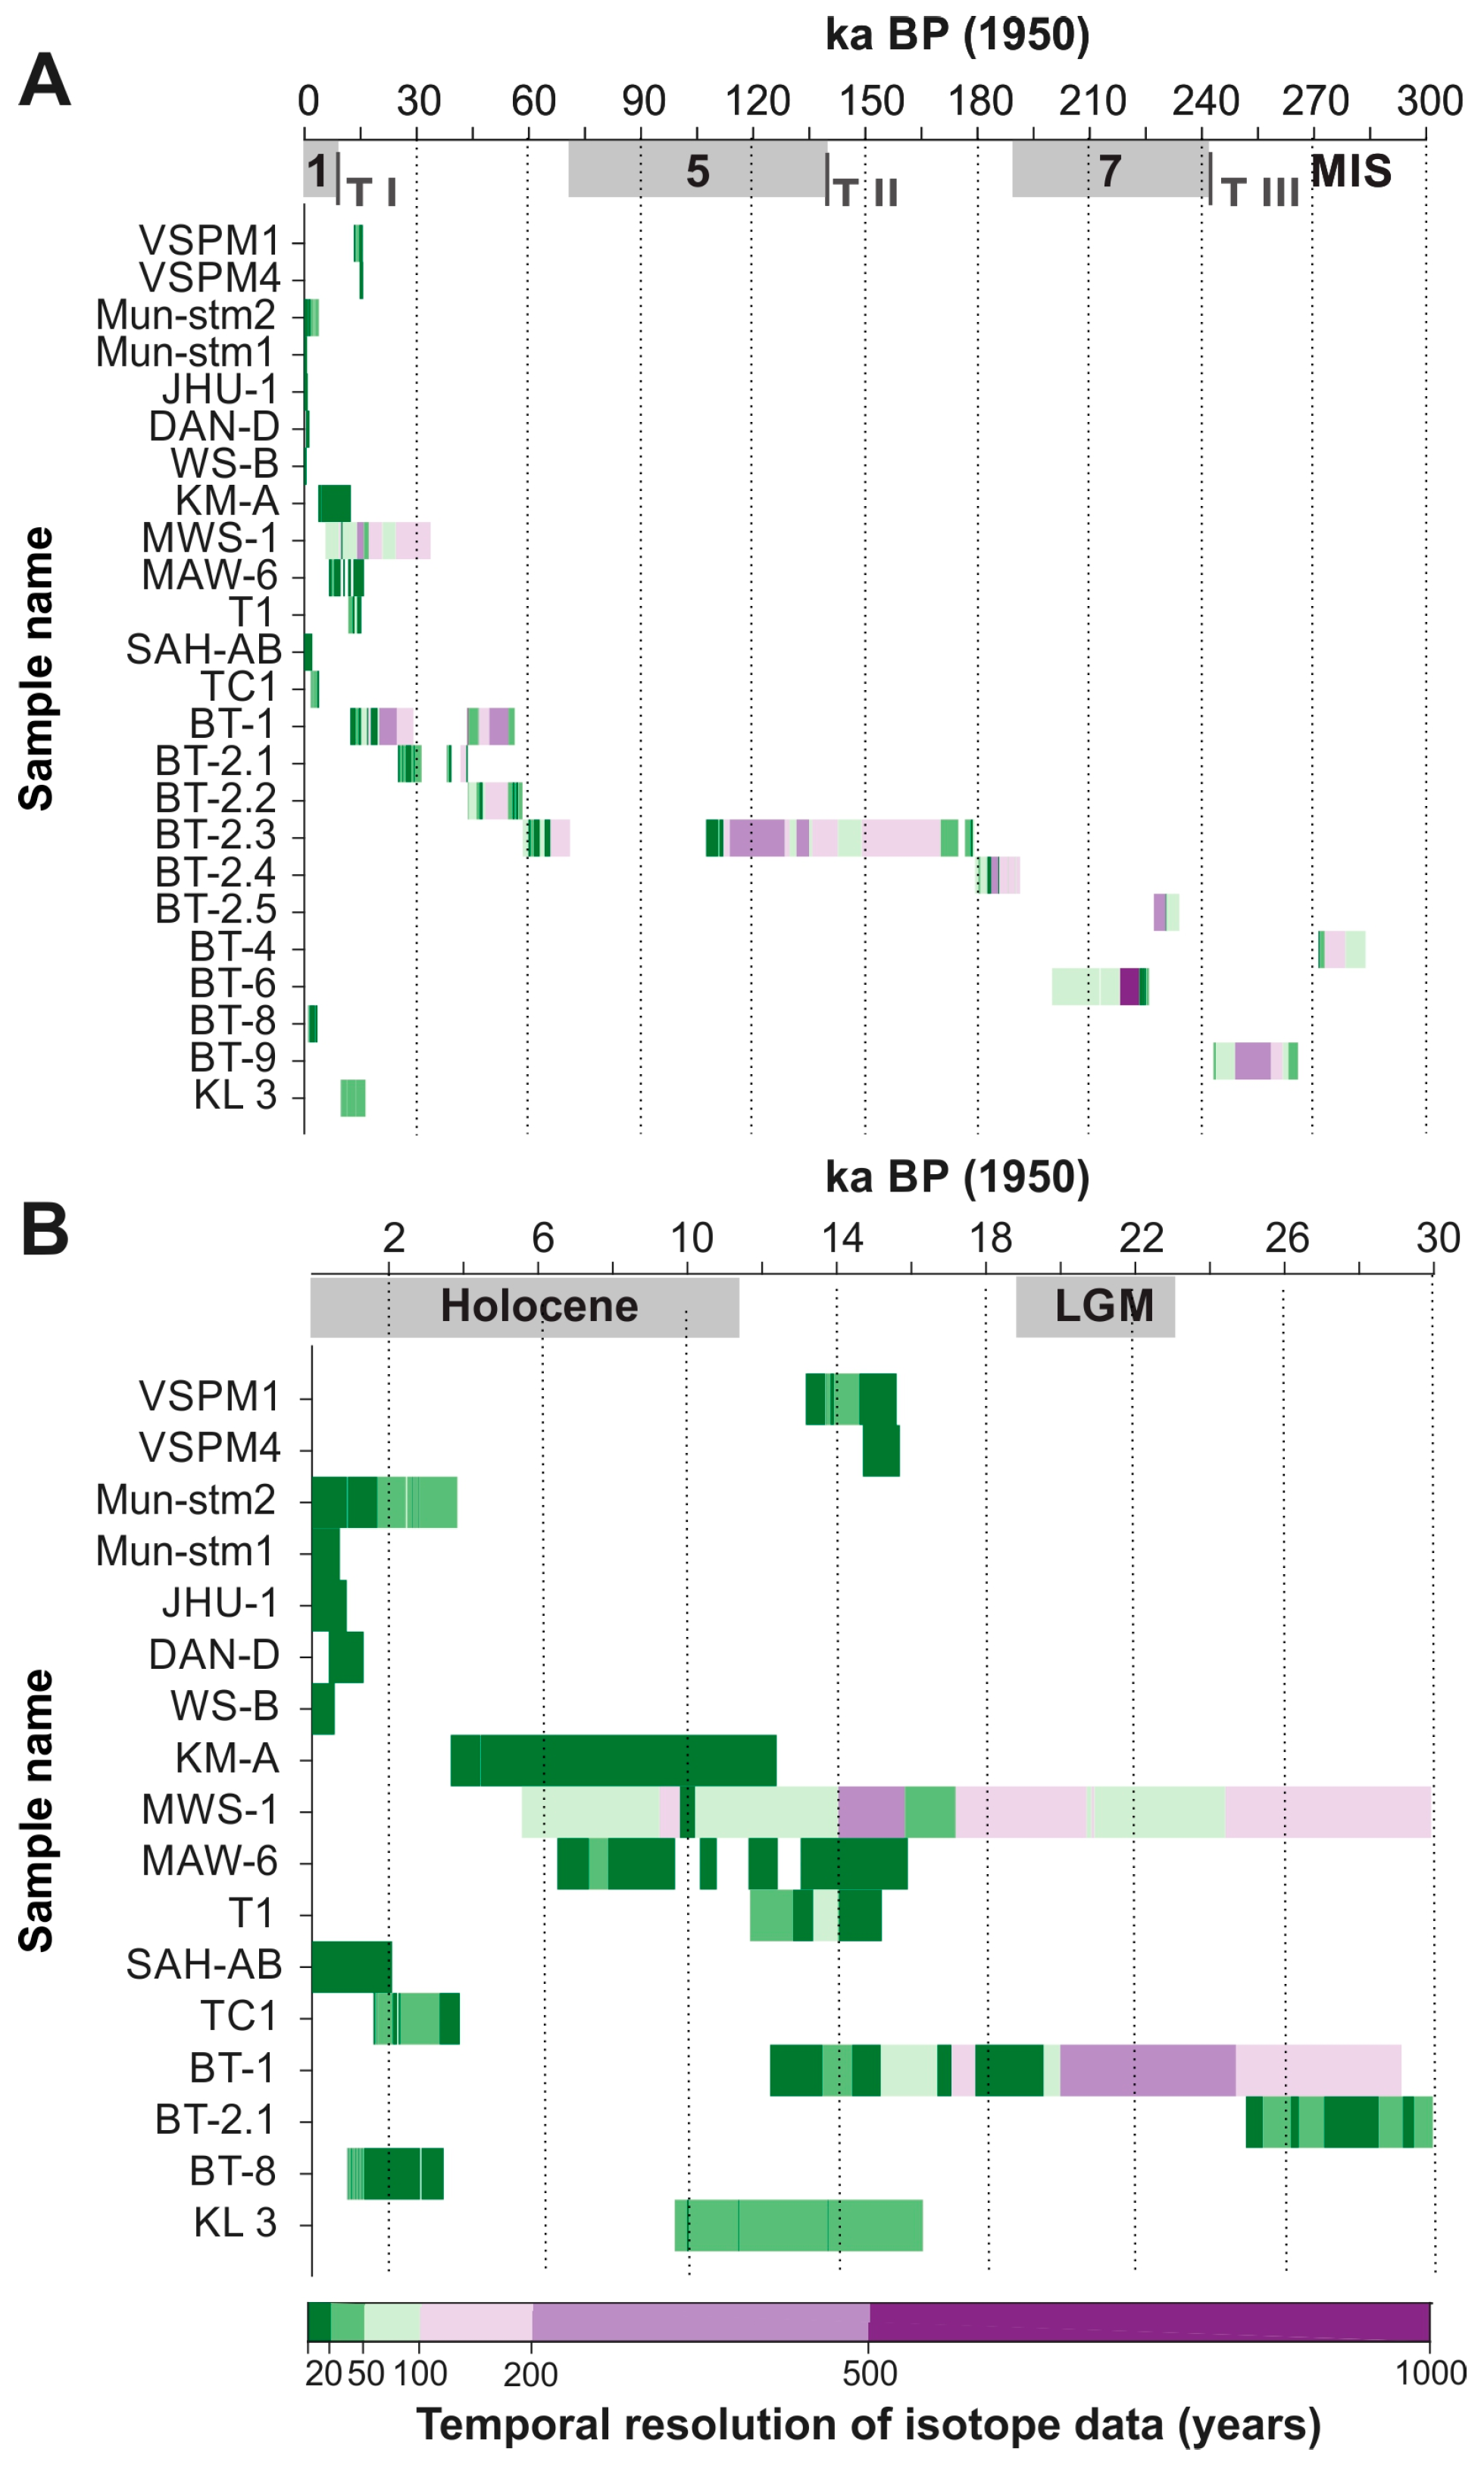
3.2. Temporal Distribution of Stalagmite Paleoclimate Records

Figure 2 shows the temporal distribution of stalagmite δ18O records from India in SISAL_v1. Table 1 provides information on records published from this region, including those records not currently in the SISAL database. Orbital-scale records are available from Bittoo cave [13] from north India and Belum cave [54] from peninsular India. Mawmluh cave [16,17,46] from the northeast currently covers the Last Glacial Maximum, and Heinrich stadials. Records from peninsular Valmiki cave covers the later phase of Heinrich event 1 [50] and the last deglaciation [49]. Bittoo [13], Kalakot [44], and Timta [15] caves from north India and Mawmluh [16,17,46] cave from northeast India cover the Bølling–Allerød (BA) and Younger Dryas (YD) periods. Sahiya [10,12] cave from north India, Mawmluh [45] and Umsynrang [61] caves from northeast India, and Kotumsar [57] cave from peninsular India cover significant periods of the Holocene. The other published records in Table 1 cover brief snapshots during the last 5000 years.

3.3. Quality of the Records

The interpretation of a δ18O time series strongly depends on the temporal resolution and chronological precision of the stalagmite record. Keeping this in mind, the quality of the records can be assessed based on a few objective parameters such as speleothem form, mineralogy, age control, sampling density (resolution), and cave monitoring, which aids in the interpretation of the δ18O signal. The SISAL database provides information on all these parameters and aids in the selection of appropriate stalagmite δ18O records to reconstruct ISM variability on different timescales. One further parameter, i.e., age uncertainty envelopes on records, needs to be discussed since statistical comparability between records is hampered by the lack of uncertainty information in publications and the lack of knowledge of the difference in uncertainty envelopes when using different age models. Only a few samples are dated from a stalagmite, and various age models are then employed to derive an age for each measured data point. Age modeling techniques (e.g., [82,83,84,85]) propose methods to calculate uncertainties between dated points allowing for continuous error propagation and the true uncertainty envelope of a time series to be established. This is yet to be done for the SISAL records; this paper on Indian stalagmites only considers individual age errors (uranium–thorium or radiocarbon ages) for the records.
The longest Indian record (ca. 240 ka) is from Bittoo cave, a composite record of ten stalagmites [13]. Replication of δ18O patterns by multiple stalagmites from the same cave greatly increases the confidence in the climatic signal. However, the record shows multiple hiatuses that limit the availability of δ18O values for certain climate states.
Global-scale climate events such as the Heinrich, BA, YD, 4.2 ka, and the Little Ice Age (LIA) events typically lasted for 50–1000 years. When detectable, the amplitude of δ18O excursions of these events is low (~0.5 to 2‰) compared to variability over orbital time scales. Identification of such events requires tight age control and high confidence in the climatic influence on the δ18O record. The Bittoo [13], Kalakot [44], Timta [15], and Mawmluh [16,17] cave records provide measurements of δ18O covering the BA and YD periods. The Bittoo and Timta cave stalagmites from north India provide better age control (Figure 6 in Section 5.2.) than the Kalakot record. The Bittoo and Mawmluh cave records also provide δ18O measurements of multiple Heinrich stadials. The Valmiki cave record [50] from peninsular India covers the later part of Heinrich I, but is not replicated by a second Valmiki cave record [49] and needs to be treated with caution (Figure S4 in Supplementary Materials). The Valmiki stalagmites are composed of aragonite rather than calcite. Under equilibrium conditions, aragonite should have δ18O values 0.8‰ more enriched than calcite at 25 °C [86]. This 0.8‰ offset in δ18O records between calcite and aragonite stalagmites has to be taken into account when comparing δ18O records over large spatial scales. Stalagmites composed entirely of aragonite have several benefits, such as a tendency to contain high uranium concentrations and high growth rates which provide high-resolution records with tight age control (see Reference [87]), and are being increasingly studied. However, at present, less is known about conditions governing δ18O in aragonitic stalagmites compared to calcitic stalagmites.
The Mawmluh cave δ18O records are supported by robust monitoring studies [23,88] that significantly increase confidence in the interpretation of the stalagmite δ18O records from this cave. However, there is lack of replication in the Mawmluh cave records [16,17,45] over short time periods and they must be treated with caution when examining millennial and shorter-time-scale events (Figure 6 in Section 5.2.). The Mawmluh cave record covering the 4.2 ka event, KM-A [45], provides sufficient age control with low errors of ±40 to 60 years. A new stalagmite δ18O record from Mawmluh cave covering the same time period [89] with even lower age errors of ±13 years shows a similar onset date for the 4.2 ka event as KM-A (4.071 to 4.049 ka BP), but with one-third the δ18O amplitude measured in the KM-A record and with different nominal termination patterns for the 4.2 ka event.
Figure 2B indicates that Sahiya [10], Wah Shikhar [11], Dandak [9], Jhumar [11], and Munagamanu [47] cave records provide δ18O data of all or part of the LIA beginning around 750 to 450 years BP (1200 to 1500 Common Era (CE)) [90,91]. The Sahiya cave record is characterized by tight age control (errors of ±40 years over the LIA period) and replicate δ18O records for significant time periods [10,12], making it a reliable climate record to examine the LIA for north India. The high-resolution Dandak and Jhumar cave records from peninsular India provide the most reliable record of the LIA for this region [9,11,43]. Although the chronology of the Jhumar cave record is not independently well constrained, its replication with the Dandak cave record from the same region provides confidence in its interpretation. With age errors of ±200 years, the Wah Shikhar cave record from the northeast provides limited age control for examining the LIA. The chronology of the Munagamanu cave record is fairly robust, but shows mixed calcite and aragonite mineralogy which hampers interpretation of the LIA δ18O record. Care needs to be taken with mixed calcite–aragonite samples, because the cause of variation in the δ18O record may be due to climatic/environmental factors, or changes in mineralogy, or a combination of both.
There are a few records from India that are not available in SISAL_v1 (Table 1). Of these, the Panigarh [59] and Sainji [60] stalagmites show mixed calcite–aragonite mineralogy, while Mawmluh [14], Akalagavi [51], Chulerasim [55], Umsynrang [61], and Dharamjali [56] stalagmites are composed of aragonite. A few records provide δ18O measurements for certain time intervals, but lack age control to examine events closely, such as the Tityana [48], Akalagavi [51], Belum [54], and Baratang [51] cave records.

4. Regional Patterns in Speleothem Oxygen Isotope Records and Their Climatic Interpretations

To assess how well δ18Ostalagmite reflects local rainfall changes at any given cave site, local calibration with measurements of rainfall, temperature, and δ18Orainfall, in addition to drip water δ18O, is required. However, such observations are limited in space and time. General circulation models (GCMs) can be used to aid the interpretation of δ18O records (e.g., [92,93,94]). Individual GCMs can produce different results because parameterization of tropical convection differs significantly among models; thus, multi-model analyses are more useful for such diagnoses [95]. Using this multi-model approach, Midhun and Ramesh (2016) analyzed output from Swing2, and found that simulations nudged with observed wind fields show better skill at reproducing the spatio-temporal pattern of rainfall amount and δ18Orainfall. They suggested that the improvements were due to the role of large-scale atmospheric dynamics on ISM rainfall and, hence, on δ18Orainfall. An increasing number of recent studies produce similar results suggesting that it is large-scale circulation rather than local rainfall amount that controls δ18Orainfall in the ISM region (e.g., References [96,97]). δ18Orainfall is further modified in its journey from the surface to the drip site in the cave and during precipitation of the stalagmite [88].
Paleoclimate data-model comparisons were used to investigate orbital–millennial time-scale controls on δ18Ostalagmite and, hence, on δ18Orainfall (e.g., [98,99]). These studies suggest that large-scale circulation coupled with a largely common moisture source direction and upstream rainout can explain the pattern of δ18O variability in proxy records across the ISM region from Oman and into China.
Limited local calibration efforts are described further in the subsections below from the three ISM regions, i.e., north, northeastern, and peninsular India. However, past climate states are likely to have varied and circulation patterns may have been different from today. Here, we address the current level of understanding and existing debates.

4.1. North India

Paired analysis of Global Network of Isotopes in Precipitation (GNIP) δ18Orainfall data collected at Delhi and low-level wind trajectory patterns show that δ18O variability in northern India is linked to periods of strong (weak) ISM circulation [10]. Strong (weak) ISM periods are characterized by an enhanced (reduced) flux of isotopically depleted Bay of Bengal moisture and reduced (enhanced) flux of isotopically enriched Arabian Sea moisture [10]. As stalagmites are ultimately fed by rainwater, δ18Ostalagmite reflects such changes in ISM circulation dynamics. This interpretation hinges on strong seasonality and the premise that effective precipitation is positive only during the ISM, but negative during the rest of the year [10]. However, seasonality changes in the past might have altered this climate state, thus complicating the interpretation of δ18Ostalagmite. For example, a negative δ18O excursion found in multiple stalagmites from north India is interpreted to be a result of stronger winter Western Disturbances and weaker ISM circulation during all or part of the LIA (e.g., References [55,56,60]). However, the influence of Western Disturbances on stalagmite δ18O records is debated (see Section 5). In most scenarios, it is thought that winter season infiltration is minimal and does not contribute significantly to the δ18O budget of infiltrating waters [10,88].
Phase correspondence of stalagmite δ18O records from this region with millennial events thought to have been triggered in the North Atlantic [12,15] and the bipolar seesaw pattern observed in ice core records [13] constitute strong evidence for an impact of hemispheric-scale circulation on stalagmite δ18O records. Rapid positive excursions in the Bittoo stalagmite δ18O record corresponding to events identified in the North Greenland Ice Core Project (NGRIP) ice core record ~55 ka, at a time when Antarctic ice cores showed low-amplitude warming suggests dominant Northern Hemisphere forcing at the millennial scale in this region [13]. Phase correspondence with Northern Hemisphere summer insolation (NHSI), with abrupt and high-amplitude (~4‰) negative δ18O excursions in the Bittoo cave stalagmite, suggests direct insolation forcing of the ISM [13]. Furthermore, the well-dated MIS 5 and MIS 3 portions of the Bittoo cave record show no visible phase difference with its counterparts in the East Asian monsoon (EAM) domain [8,100] indicating that speleothem δ18O variations are broadly in phase in the peripheral ISM and EAM domains.

4.2. Northeast India

Back trajectory analysis shows that the Bay of Bengal is the dominant source of moisture for northeast India [23]. Two years of observation reveal a trend toward lighter δ18O in the late ISM in connection with temporal variations in river runoff into the Bay of Bengal that may contribute up to 25% of observed changes in δ18O of precipitation in this region [23]; however, this requires further verification. Rainfall data [23] were used to validate a synthetic multi-decadal δ18O time series generated from an isotope-enabled general circulation model (GCM) (after Reference [101]) by Berkelhammer et al. [45]. The synthetic time series suggests that there is significant negative correlation between δ18O and rainfall amount only when the late ISM rainfall (October in addition to July, August, and September (JAS)) is included, suggesting that the amount effect is a result of a prolonged ISM rainfall season [45]. The studies suggest that more positive stalagmite δ18O values from the region may indicate early monsoon onset or early withdrawal, or both, in addition to changes in and at moisture source and transport pathways.
Instrumental data show that, in contrast to central peninsular India, rainfall amounts in northeast India are relatively unaffected by ENSO dynamics [23]. Despite this, El Niño years are marked by more positive δ18O values in a sub-annually resolved, 50-year-long aragonite stalagmite δ18O record from Mawmluh cave [14]. Back trajectory analysis [14] indicates that, during Central Pacific El Niño events, moisture transport distance to northeast India is reduced, resulting in more positive rainwater δ18O values; this response can be detected by the weak but significant positive correlation between this stalagmite δ18O and central Pacific SSTs. In addition, the δ18O record shows significant correlation with Pacific decadal variability.
Glycerol dialkyl glycerol tetraethers (GDGTs) [46], δ13C, and ice-volume-corrected δ18O [17] measured from stalagmites in this region give additional information on the controls on δ18O variation. The ice-volume-corrected δ18O suggests that ice volume and SST changes account for only one-fourth (~1‰) of the δ18O change from the glacial to deglacial, whereby the larger part is attributable to change in ISM strength [17]. Similarly, the temperature reconstruction given by the stalagmite GDGT record indicates little temperature change in this region during the YD event. This suggests that δ18O variation is not controlled by local temperature change, but by larger circulation changes triggered by a distal North Atlantic event [46]. The coupled analysis of δ18O and δ13C further indicates that the δ18O variation between the BA and into the YD may be more representative of reduced seasonality of rainfall and more proximal rainfall source during the YD associated with a weaker ISM [17].
On orbital time scales, the Umsynrang Holocene δ18O record shows an inverse relationship with insolation. The period of maximum rainfall and enhanced seasonality corresponds to the Holocene Thermal Maximum observed in Europe [61].

4.3. Peninsular India

Monsoon trajectory analysis [57] suggests that the Arabian Sea (and probably continental recycling) is the dominant source of moisture for the monsoon rainfall period (June, July, August, and September (JJAS)) while the Bay of Bengal, the Indian Ocean, and continental recycling are minor sources that play a role only during the remaining months. The Jhumar cave δ18O record overlaps with the instrumental period and shows a significant inverse relationship with a regional (18–27° N and 69–88° E) JJAS precipitation time series (1903–2005 CE, n = 70, R2 = −0.21) suggesting that δ18O variations from this location reflect rainfall amount [11]. Similarly, there is significant inverse relationship (R2 = −0.38) between decadally averaged Akalagavi stalagmite δ18O (measured at annual resolution) and the regionally averaged instrumental rainfall amount data (n = 89) [51]. These two studies suggest that at least some of the variance in stalagmite δ18O results from changes in the amount of regional and upstream rainfall. This interpretation was also used to explain past variation in stalagmite δ18O from this region on millennial and orbital time scales. For example, stalagmite δ18O records from this region suggest that the Medieval Warm Period (MWP) was a wet period, while the early LIA was characterized by multi-decadal droughts [9,11]. A comparison of Dandak cave from peninsular India with Wah Shikhar cave located in northeast India suggests that the period from 550 to 250 years BP was marked by higher-frequency and/or amplitude break events which cumulatively generated a negative precipitation anomaly over Central India [11]. It was subsequently found that the δ18O record from northeast India is controlled by multiple factors other than the amount effect [23,45]. The Kotumsar δ18O record similarly shows that there was a gradual decrease in the amount of rainfall from 8500 to 7300 years BP followed by an increasing trend from 7300 to 5600 years BP [57]. A very limited number of records cover ISM dynamics in peninsular India during brief time windows older than the Holocene [49,50,54]. An aragonite stalagmite record from Valmiki cave indicates wetter climate during Termination 1a (~14,800 years BP) [50] and during the later phase of Heinrich event 1 [50], pending replicate measurements and verification.

5. Discussion

The available stalagmite δ18O data in SISAL show that regional ISM responses differ in terms of sensitivity and timing. Better understanding of regional dynamics causing stalagmite δ18O variation allows examination of specific aspects of the monsoon such as rainfall amount, source and path changes, and changes in length of the season. Such regional paleoclimate records provide valuable information to test the ability of climate models to predict changes in the ISM in response to different forcing mechanisms and climate states. Based on the availability of stalagmite records from India, the following discussion sections examine regional ISM variability in response to volcanic/solar forcing during the LIA, North Atlantic, and orbital-insolation drivers.

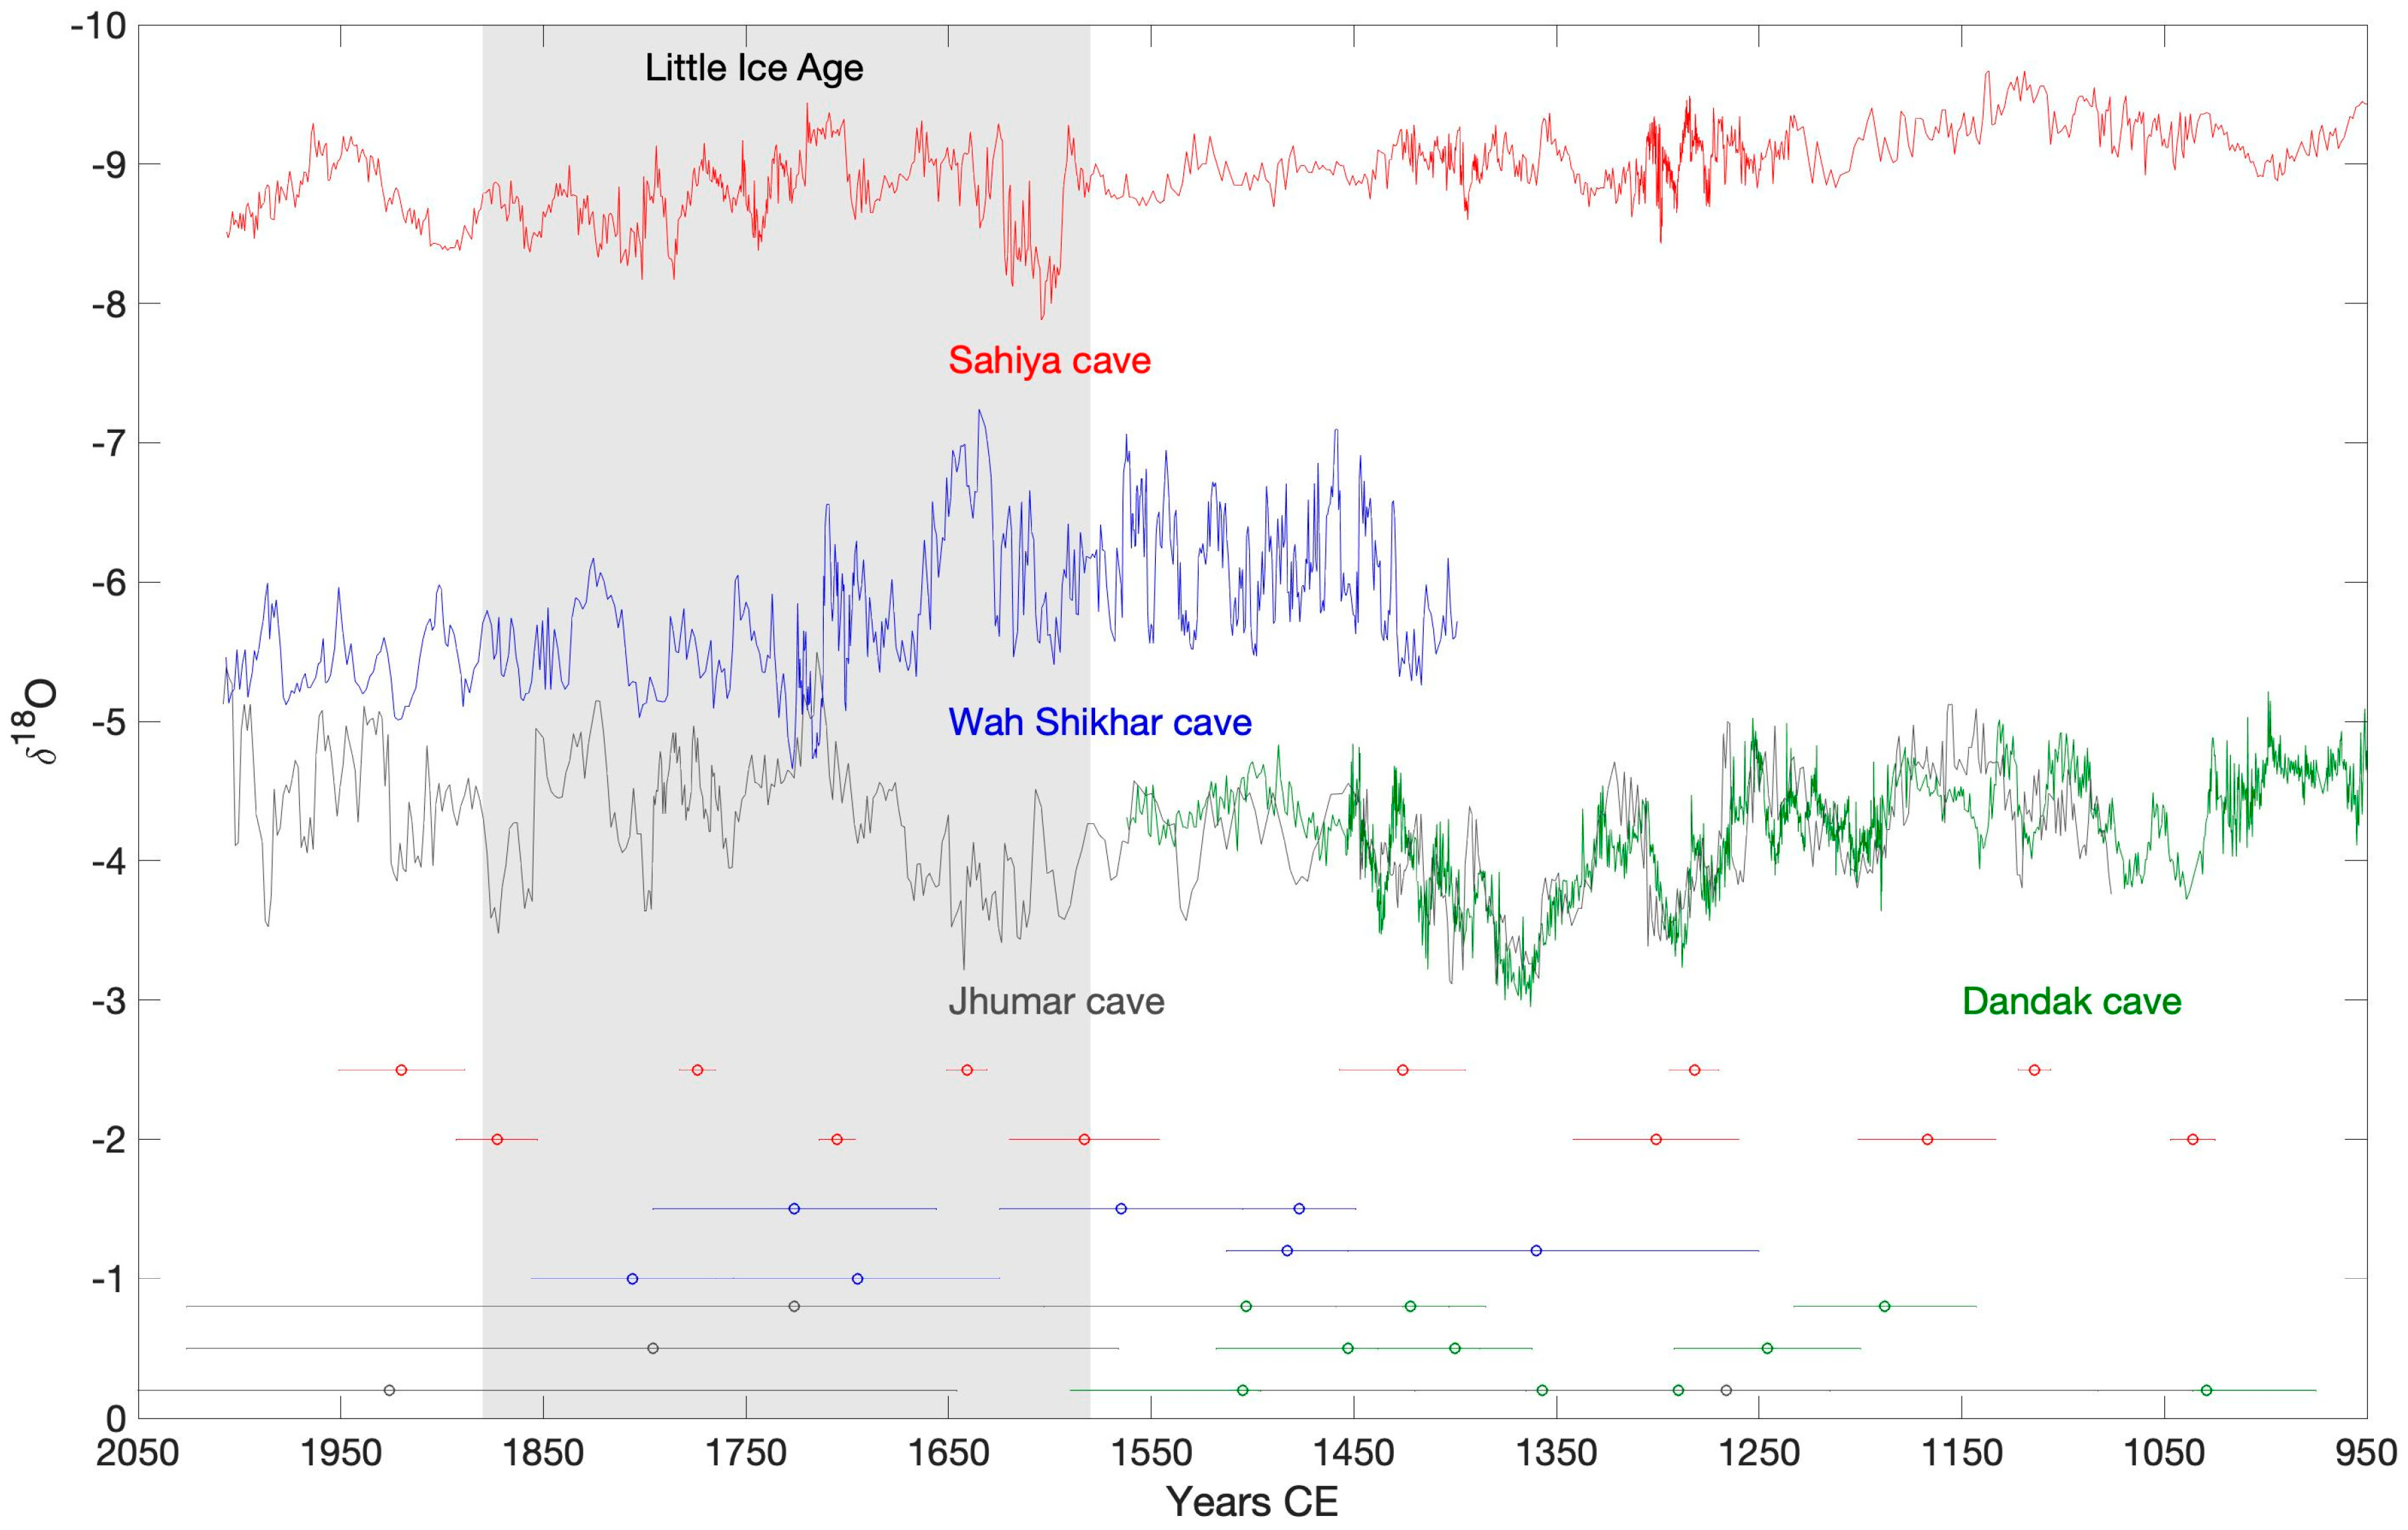
5.1. The Little Ice Age (LIA)

Temperature reconstructions across the globe generally indicate a cooling trend beginning around 750–450 BP (1200–1500 CE) (interspersed with periods of warmth) and continuing into the nineteenth century that is referred to as the Little Ice Age [90,91]. Solar and/or volcanic forcings coupled with ocean–atmosphere feedbacks were used to explain the LIA cooling trend (e.g., References [102,103]). Paleoclimate studies used stalagmite δ18O records to understand ISM variation during the LIA. Rehfeld et al. [104] used the Akalagavi [51] and Dandak [9] records to examine the relationship between ISM and EAM using complex networks. Chen et al. [105] used the Dandak [9] and Dharamjali [56] records along with a number of other proxy records across the ASM region to suggest a “wet-North and dry-South” pattern during the LIA. A similar conclusion was reached by Dixit and Tandon [106], who use several proxy records from the ISM region to discuss the hydroclimate of the Holocene. This section examines the LIA period using stalagmite δ18O records available in SISAL_v1.
The precise onset and culmination of the LIA is still debated [107]. Here, we will nominally use the regionally demarcated LIA period from 370–70 BP (1580–1880 CE) [91]. The Sahiya cave δ18O record [10] shows the best age control over this time period (Figure 4); however, the amplitude of δ18O variation is low (0.5‰). Z-scores calculated for the Sahiya cave δ18O record (Figure 5) indicate that there is a distinct positive δ18O anomaly over the LIA period in this record covering the last 2000 years. The Wah Shikhar and Jhumar cave records show higher-amplitude δ18O changes (1–2‰) over the LIA period, but with limited age control.
These records suggest regional differences in responses to circulation changes during the LIA (Figure 3 and Figure 4). While ISM rainfall in peninsular India was reduced, northeast India experienced an increase in monsoon season length and changes in moisture source and path (see Section 4). The Sahiya record from north India suggests that LIA dynamics did not produce significant changes in ISM rainfall δ18O. However, three lines of evidence suggest that further work is required in the north Indian region.
  • Other types of records from the north Indian region (such as lake core records) suggest changes in ISM rainfall amount in north India during the LIA (e.g., [106] and references therein).
  • If changes in circulation during the LIA are a result of active/break dynamics as suggested by Dixit and Tandon [106], the northeast and north Indian cave records should respond with δ18O excursions in the same direction as a result of stronger Bay of Bengal branch of precipitation.
  • If changes in circulation during the LIA are a result of a weaker ISM and stronger Western Disturbances as suggested by Kotlia et al. [60] and Sanwal et al. [56], then there needs to be unambiguous evidence of Western Disturbances influencing cave stalagmite δ18O records (either through seasonal drip water δ18O changes or cave ventilation changes) at present or in the past (e.g., through investigation in spatially separated stalagmite records and climate modeling).

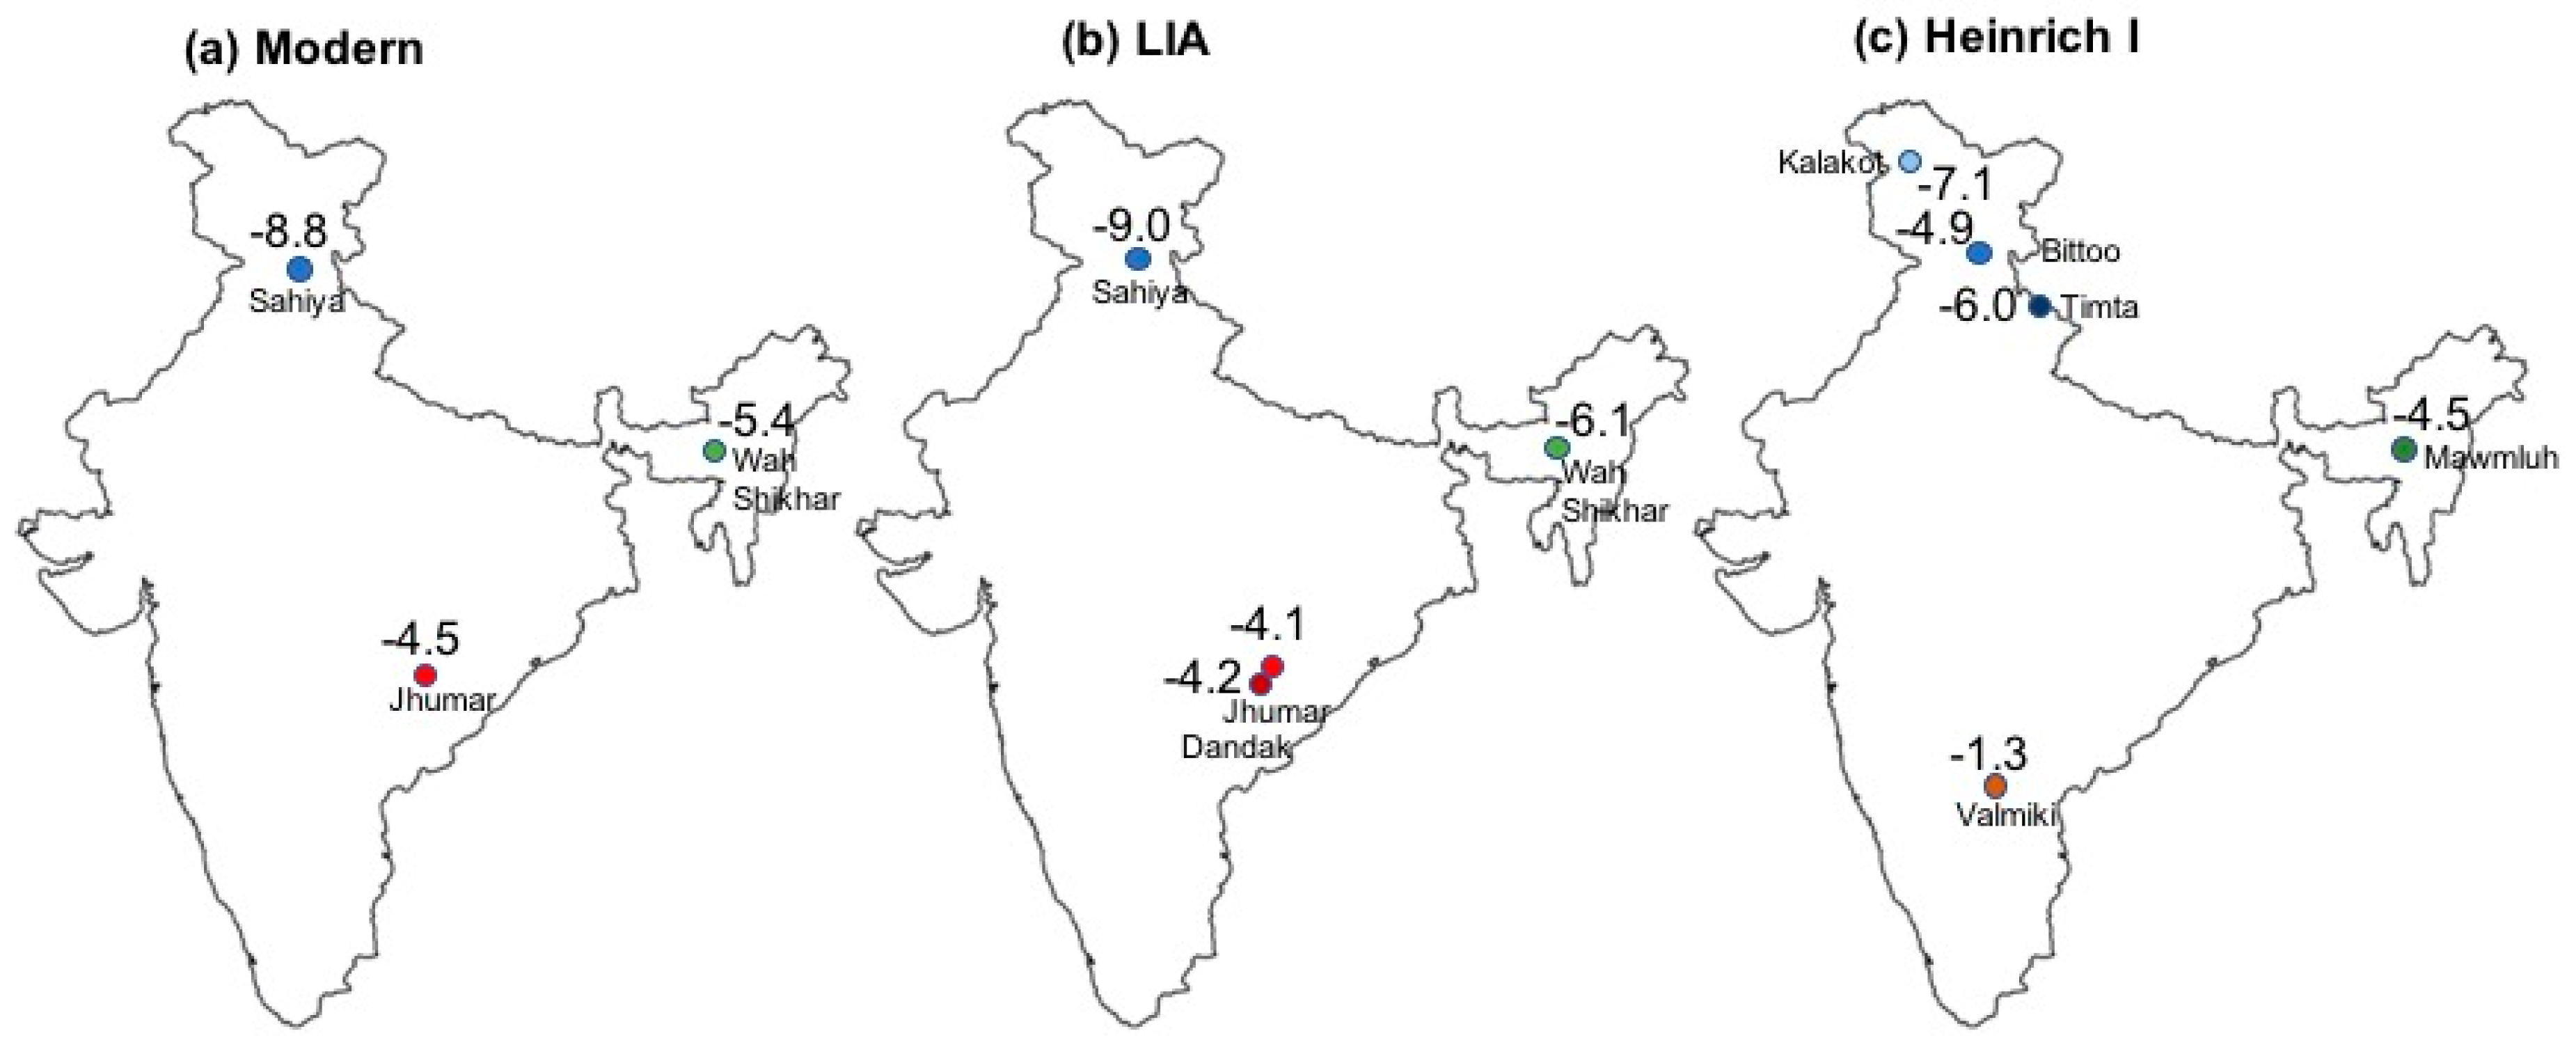
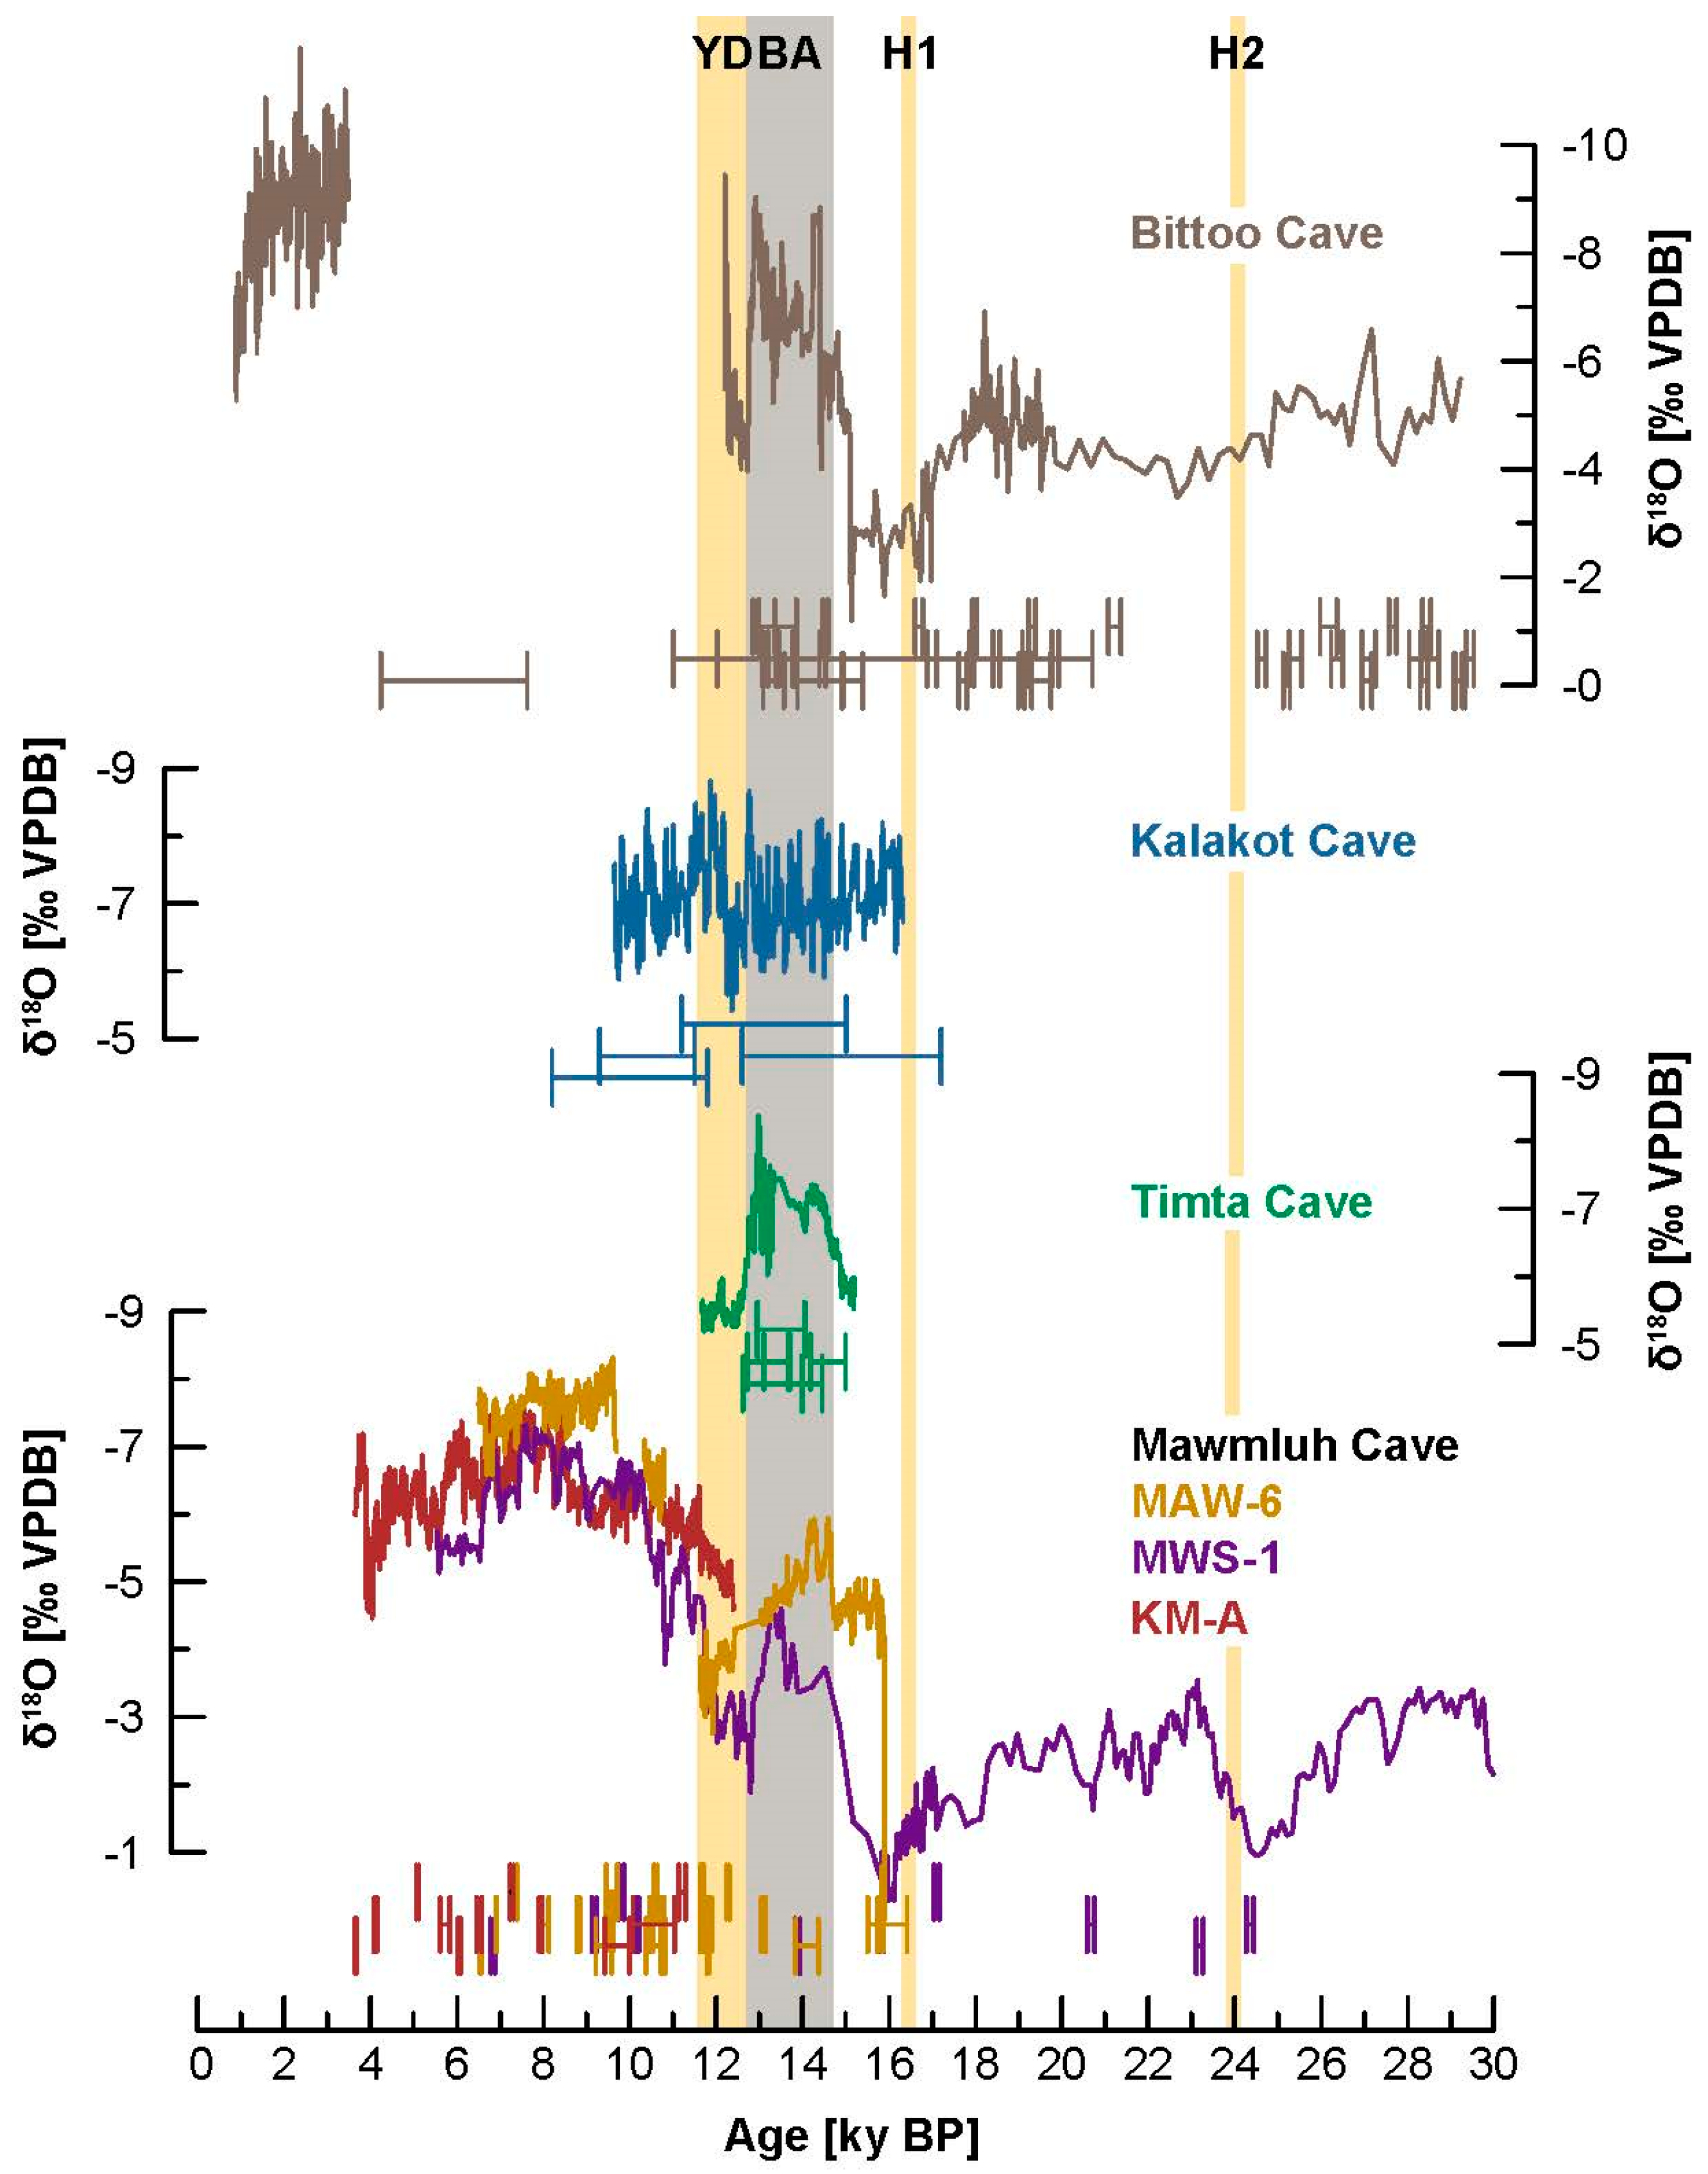
5.2. North Atlantic Forcing

Ice-rafted debris deposited during past glacial times in the North Atlantic region indicate the release of large pulses of fresh water affecting the thermohaline circulation and causing global climate fluctuations during so-called Heinrich stadials [108,109]. The YD stadial (12,679 years BP to ~11,550 a BP) occurred abruptly at the end of the BA interstadial and is thought to have been caused by a sudden decrease in the thermohaline circulation caused by fresh water from the North American region during the current interglacial [110,111,112,113]. Arabian Sea ocean sediment records of upwelling intensity [114,115,116] are consistent with reduction in ISM during these Heinrich stadials and the YD [117]. Pausata et al. used an isotope-enabled atmospheric GCM to show that a sudden increase in the sea ice extent in the North Atlantic region during a Heinrich stadial could lead to cooling of the Northern Hemisphere, reduced precipitation over the Indian basin, and weakening of the ISM. The precipitation was isotopically heavier over India at this time [99].
The Bittoo cave record [13] is characterized by more positive δ18O values during nearly all stadials compared to interstadials, consistent with the modeling results given by Pausata et al. [99]. Unlike the LIA, this pattern of more positive δ18O is replicated by other shorter records from north and northeast India [15,16,17,44] (Figure 3). The Bittoo and Mawmluh cave records suggest that Heinrich stadials are responsible for higher-amplitude changes in the ISM than the YD stadial in north and northeast India (Figure 6). However, the transition into and out of the Heinrich stadials is not as distinct as the transition into the YD at ~12.7 ka in the north Indian Bittoo [13], Timta [15], and Kalakot [44] records (Figure 6). The Kalakot cave record does not show the negative excursion for the BA seen in the other records. The magnitude of change in δ18O from the BA to the YD period is ~2‰ in this region. Though the northeast Indian cave records indicate the BA–YD excursions with tight age control, the δ18O records from Mawmluh cave do not replicate well with each other over the BA–YD transition. The magnitude of δ18O transition from BA to YD is lower than in the north Indian cave records at ~1‰.

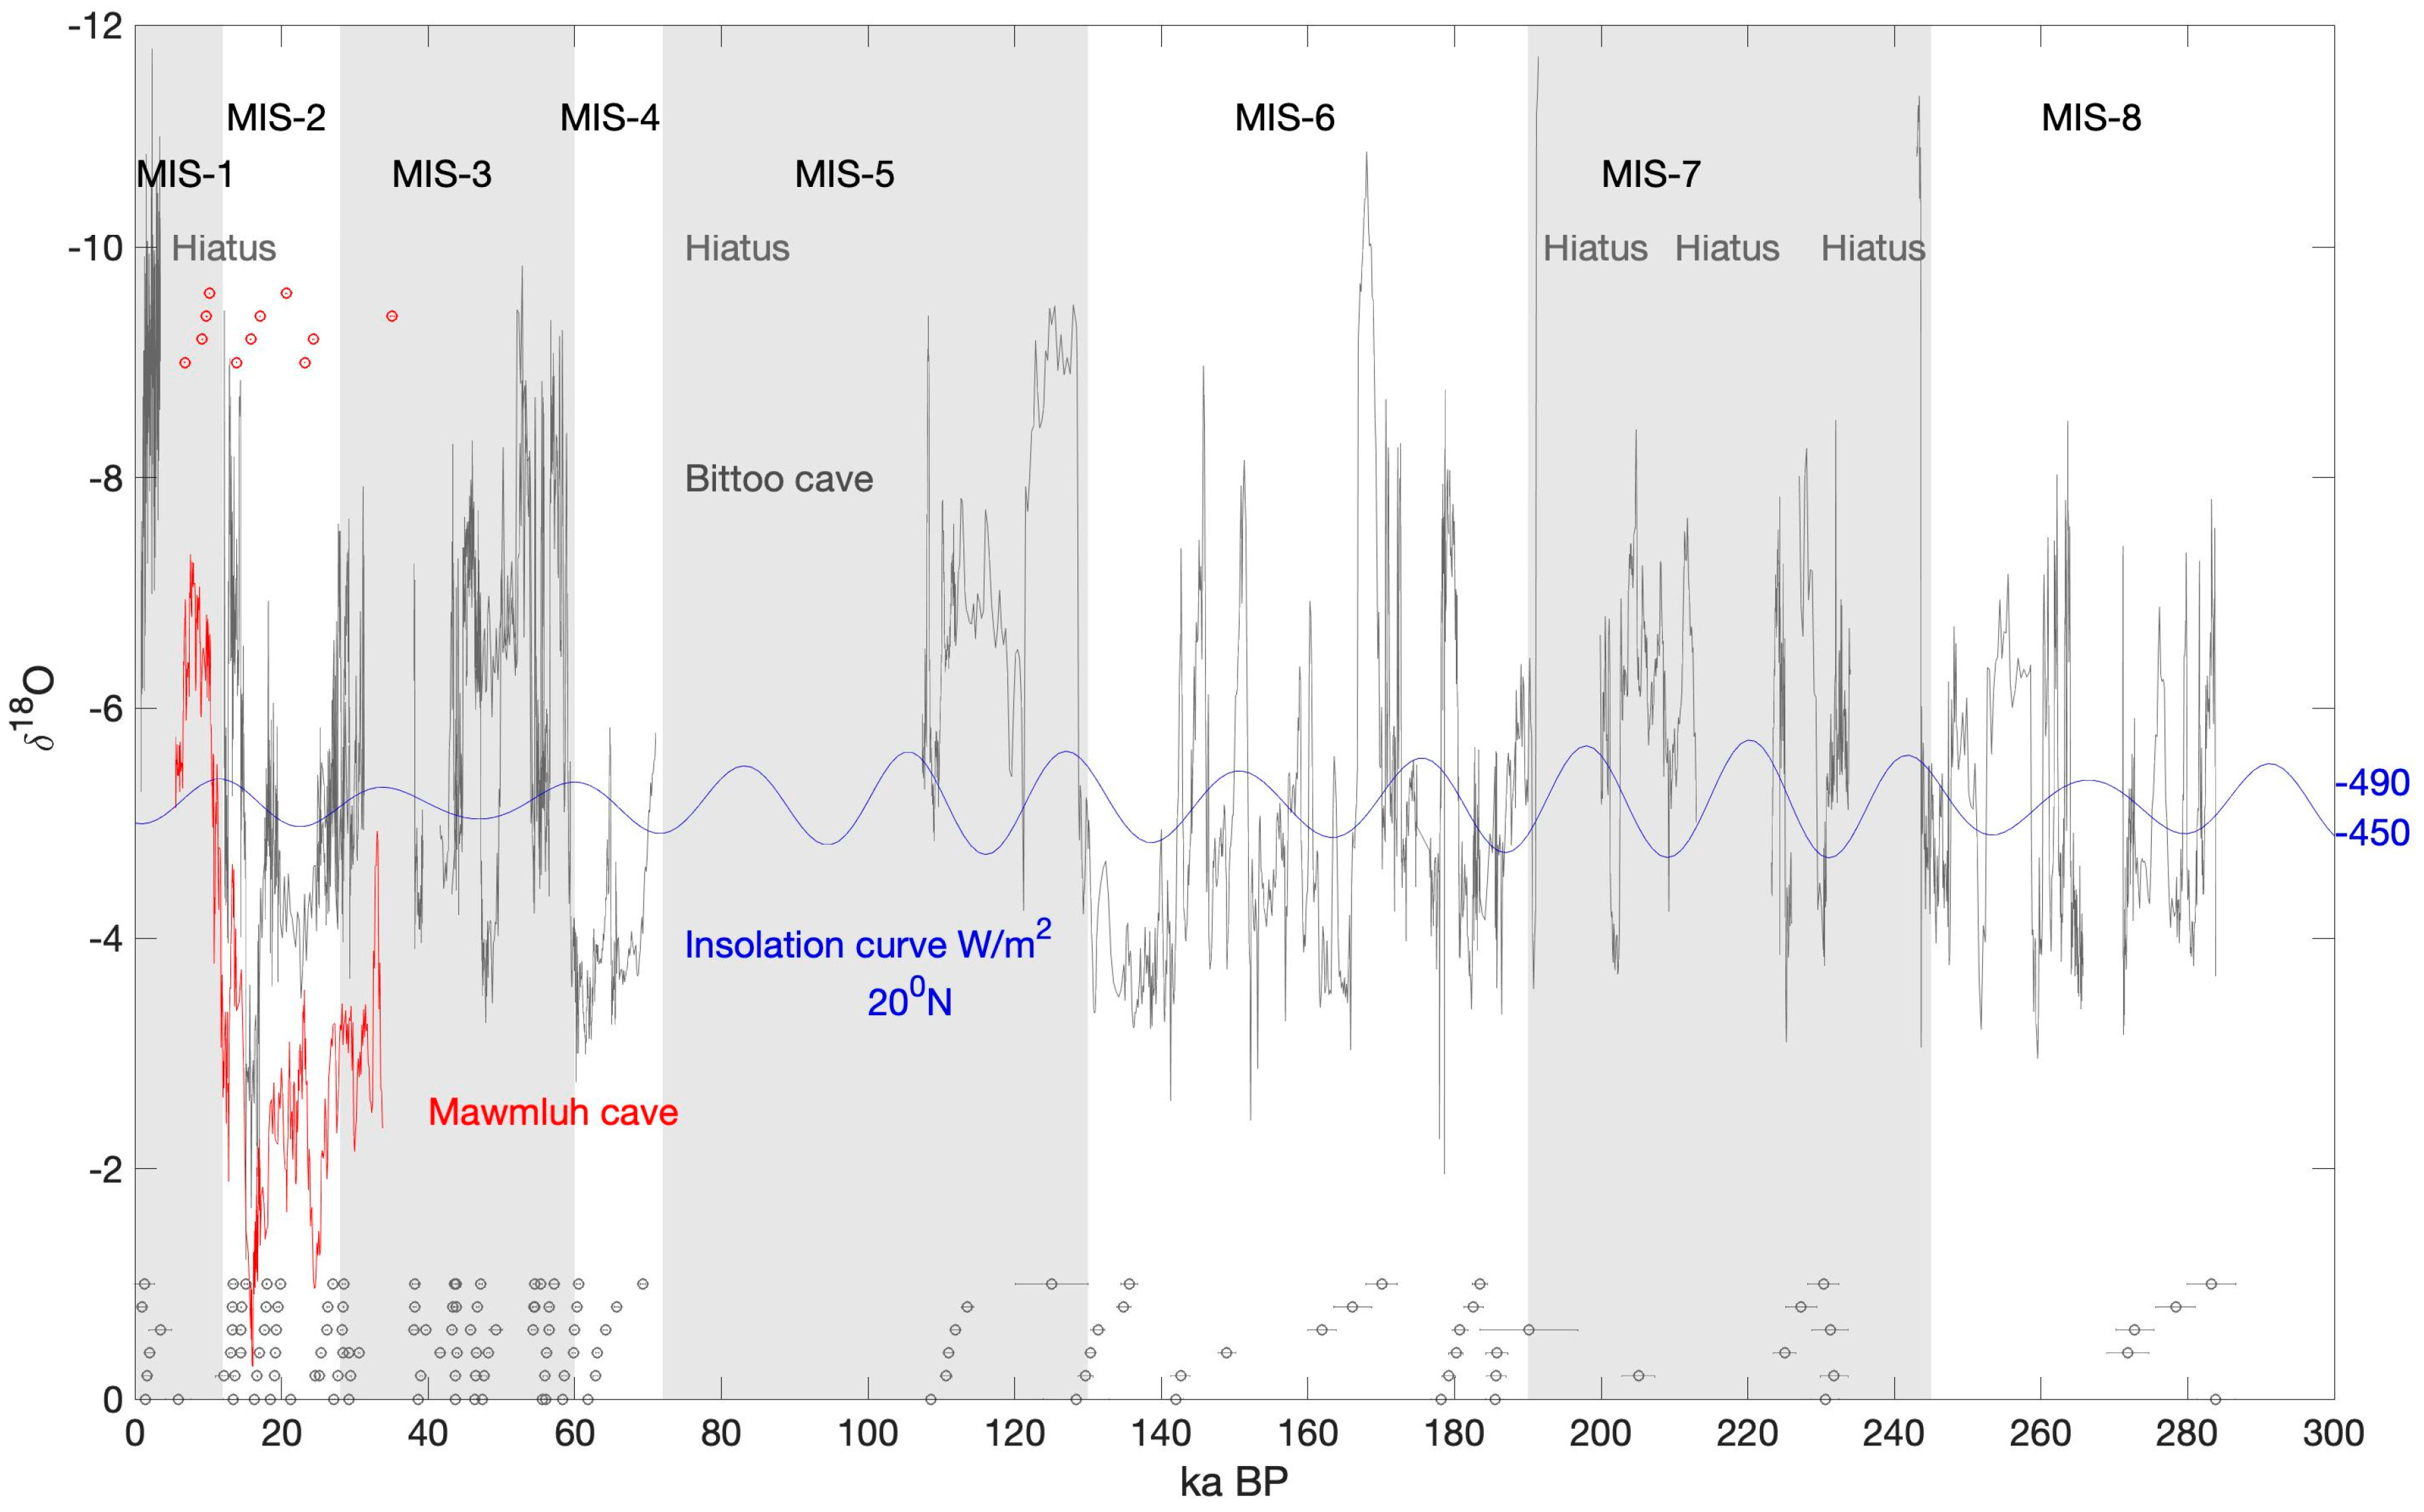
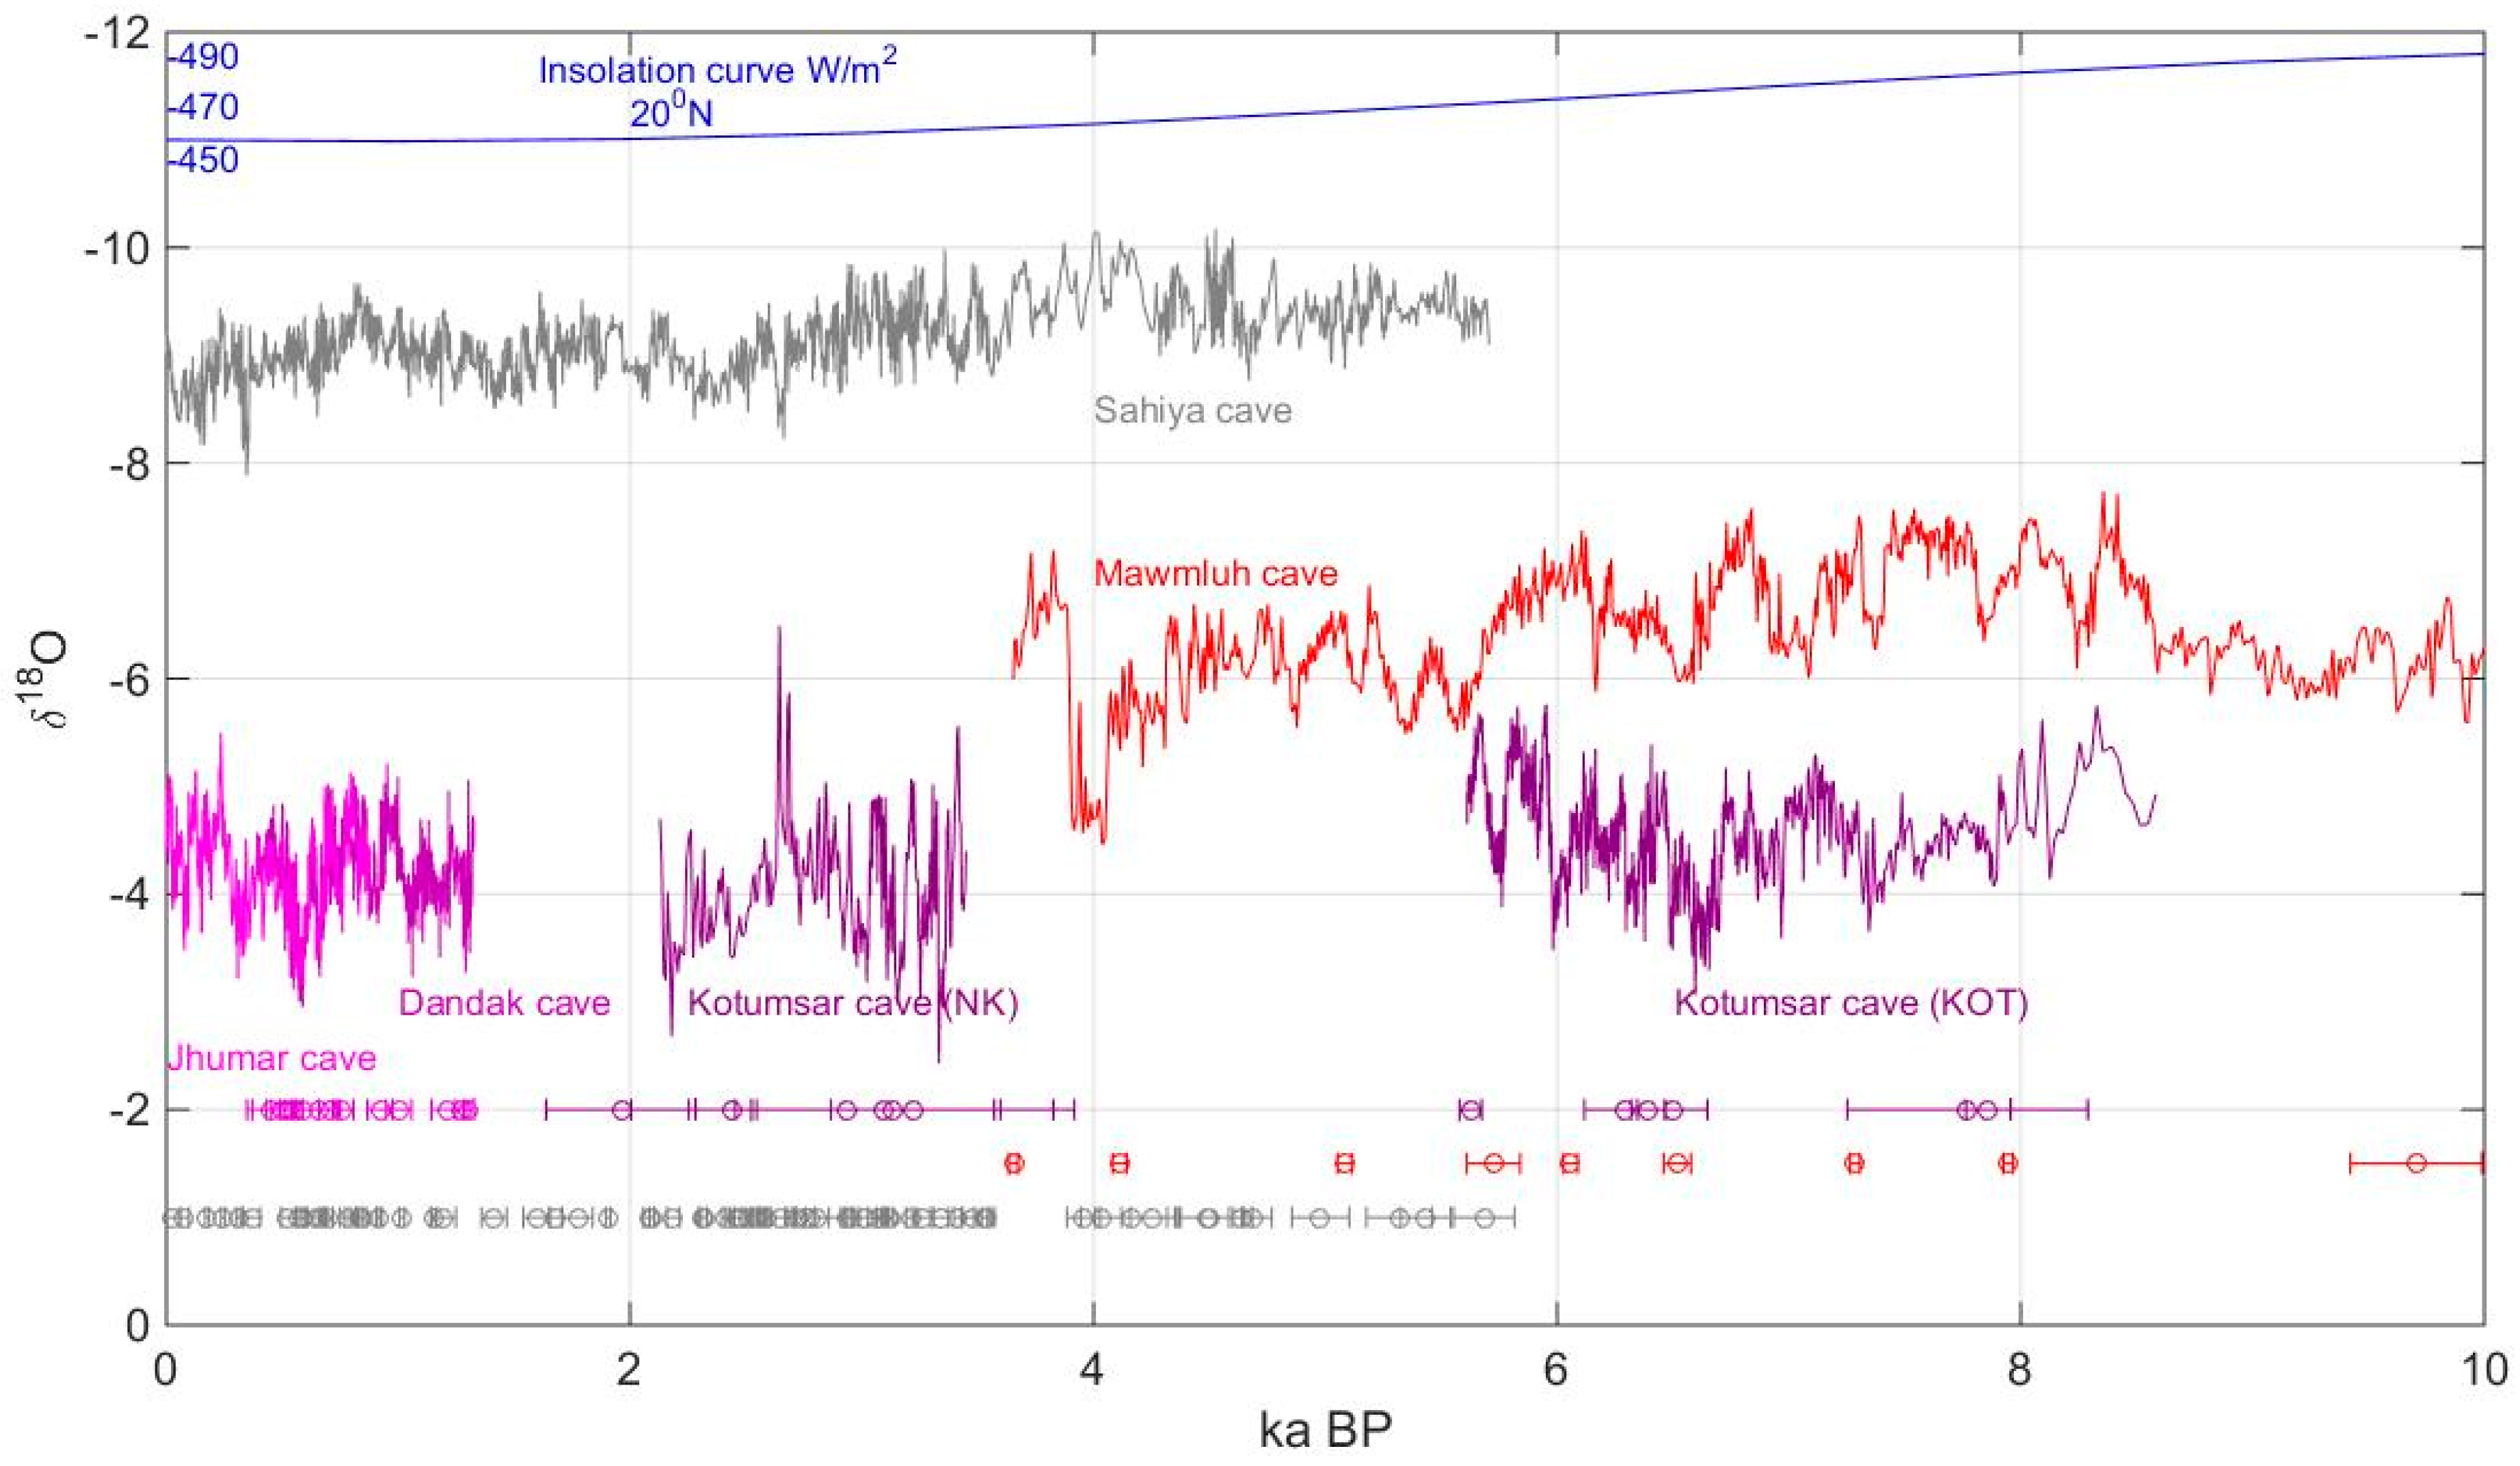
5.3. Orbital Forcing

Battisti et al. [19] used an isotope-enabled Atmospheric GCM to examine the differences between the high and low summer insolation phases (corresponding to 218 and 207 ka BP, respectively) with a 100-W/m2 difference between the two at 30° N for June–July–August. They showed δ18O difference between the high and low insolation phases of between 4 to 6‰ in north and northeast Indian region. The Bittoo cave record [13] shows a ~6‰ shift in δ18O between the low insolation phase of MIS 6 and the high insolation phase of MIS 5 (Figure 7). Similarly, the 30-ka-long Mawmluh [16] cave record shows a ~6‰ difference between the low insolation phase of MIS 2 and the high insolation phase of MIS 1. This suggests that models capture the large-amplitude changes in δ18O on orbital time scales seen in stalagmite δ18O records from north and northeast India. Furthermore, the Mawmluh cave record of ~30 ka shows no visual phase difference with the Bittoo cave record with similar magnitude of δ18O change, strongly suggesting that, on orbital time scales, ISM variation is in phase with solar insolation in north and northeast India. These results support the argument of direct insolation forcing of ISM change [13]. More enriched δ18O during glacial periods MIS 4 and MIS 2 in comparison to interglacial periods MIS 3 and MIS 1 suggests that ice volume changes influence the ISM, supporting a previous study from Xiabailong cave from the ISM region [120]. While the Bittoo and Mawmluh cave records provide much needed information regarding long-term ISM forcings, the hiatuses in the record prevent comprehensive analysis of the relative dominance of different forcing mechanisms.
The Umsynrang record [61] from northeast India is the only record that covers the entire Holocene from India (but is not in SISAL_v1). The record shows a peak at ~9 ka BP with progressive increase in δ18O of ~1‰ across the Holocene matching modeling studies by LeGrande and Schmidt [18] and Battisti et al. [19], which calculate a 1‰ increase in rainfall δ18O associated with a 27-W/m2 decrease in summer insolation over the Holocene. The records from Figure 8 cover parts of the Holocene. The Mawmluh cave record from northeast India similarly shows an increasing δ18O trend with decreasing insolation; however, it peaks at ~8.5 ka BP. The Sahiya δ18O cave record [12] from north India also follows the insolation curve during its 5000 years of growth. The peninsular Indian cave record is formed of two stalagmites from Kotumsar cave (KOT [57] and NK record given in the Supplementary Materials of this paper, Figures S1–S3 and Tables S1,S2) and the coupled Dandak [9] and Jhumar [11] cave records; however, the long-term trend seen in the other records is not as clear from this region.

6. Future Directions

Two decades of stalagmite δ18O-based reconstructions of the ISM from India showed that past variability of the ISM lies beyond the boundaries suggested by the short instrumental records. Solar insolation changes, dynamics in the North Atlantic region, and Pacific Ocean SSTs affect the ISM on different time scales. Models are able to replicate the large-amplitude δ18O changes seen in the limited stalagmite records over orbital time scales; however, further work is required to test models against the increasing number of millennial- and shorter-time-scale events now available from the ISM region. Systematic comparison of stalagmite records with models is an effective test of the ability of individual models to predict future changes in the ISM [2]. The significant advances made in this field indicate fruitful future directions of research, including the following:
  • The use of uranium–thorium dating methods coupled with the strong seasonality of the monsoon allow for high-resolution records with high dating precision. This allows for precise age control on the timing of events and, in turn, gives significant insight into the pathway of distal forcings on the ISM. However, this requires consistency in age model creation, which will be an important next step for the SISAL Working Group.
  • There is less information available on multi-decadal variability of the ISM and on the frequency of variability within different climate states. The age control provided by stalagmites coupled with high growth rates allows for the generation of more information on this variability through different methods of spectral analysis. This was explored only to a limited extent in the current records, only to conclude with a range of plausible mechanisms. Increased interaction between the paleoclimate and atmospheric sciences communities will be required to narrow down the plausible physical mechanisms and pathways of forcings.
  • Databases such as SISAL allow examination of regional patterns in records highlighting the sub-regional differences in responses of the ISM to forcings. At present, this is somewhat handicapped by the lack of long-term rainfall δ18O and cave monitoring studies. While δ18O gives information on large-scale circulation changes, other stalagmite-based records like trace-element ratios (such as Mg/Ca and U/Ca) can form powerful paleo-aridity indicators providing information on local changes in rainfall. This not only provides information on local climate change, but also on the sub-regional ISM response to distal forcings. Quantitative reconstruction of rainfall using δ18O was attempted [122], and this approach is worth testing over modern instrumental time scales. A recent study suggests that calcium isotope ratios can also be used for quantitative reconstruction of rainfall [123].
These steps should significantly improve the predictability of ISM variability, which is the ultimate aim of such paleoclimate investigations.

Supplementary Materials

The following are available online at https://0-www-mdpi-com.brum.beds.ac.uk/2571-550X/1/3/29/s1: Kotumsar NK record—Tables S1 and S2 give U-Th and stable isotope information respectively, Figures S1, S2 and S3 are of the stalagmite section, age-depth model and stable isotopes versus age respectively; Figure S4 gives comparison of Valmiki cave records (VSPM1 and VSPM4).

Author Contributions

The first draft of the paper was written by N.K., S.F.M.B. drafted the abstract and provided significant reviews and edits. F.A.L. produced Figure 6, edited Figure 2, provided information on northeast Indian caves and climate, and provided significant reviews and edits. Discussion with A.S. was useful in designing the structure of the paper. A.S. also produced Figure 5 and provided information on north Indian climate and caves. V.C.T. provided information on north and northeast Indian geology and caves. S.M.A. provided information on deglacial δ18O records from peninsular India. M.B. provided information on spectral analysis and reviews and edits. S.B. provided information on peninsular Indian caves. G.M.H. provided useful feedback on the final draft of the paper. S.B., M.Y. and R.R. provided U–Th and δ18O data of the published Kotumsar sample (KOT; Band et al., 2018). N.K., G.M.H., S.B., M.Y. and R.R. provided U–Th and δ18O data of the unpublished Kotumsar sample (NK).

Funding

This research received no external funding.

Acknowledgments

SISAL (Speleothem Isotope Synthesis and Analysis) is a Working Group of PAGES (Past Global Changes) program. We thank PAGES for their support for this activity. We would also like to thank WoKAM (World Karst Aquifer Map) for providing the base karst map for the region. We further acknowledge Sahar Amirnejad Mozhdehi and Laia Comas-Bru for creating the code and generating Figure 2. The authors would like to thank three anonymous reviewers in addition to Andy Baker and the Special Issue editors, Sandy Harrison and Laia Comas-Bru, for their valuable comments that significantly improved this manuscript. The authors were greatly saddened by the deaths of Rengaswamy Ramesh and Herbert Daniel Gebauer prior to this publication. Ramesh was instrumental in much of the paleoclimate work in India and will be greatly missed. Gebauer was an exemplary caver, collecting datasets and bibliographic information on karst and caves throughout Asia and identifying caves suitable for paleoclimate work that we continue to target today. N.K. would also like to thank the speleothem group at Physical Research Laboratory for their support and cooperation with stalagmite work in India. Finally, N.K. thanks the speleothem group at the University of Oxford for their expertise and five wonderful and fruitful years of speleothem research.

Conflicts of Interest

The authors declare no conflicts of interest.

References

  1. Webster, P.J.; Magaña, V.O.; Palmer, T.N.; Shukla, J.; Tomas, R.A.; Yanai, M.; Yasunari, T. Monsoons: Processes, predictability, and the prospects for prediction. J. Geophys. Res. Oceans 1998, 103, 14451–14510. [Google Scholar] [CrossRef] [Green Version]
  2. Mohtadi, M.; Prange, M.; Steinke, S. Palaeoclimatic insights into forcing and response of monsoon rainfall. Nature 2016, 533, 191–199. [Google Scholar] [CrossRef]
  3. Li, H.-C.; Ku, T.-L.; You, C.-F.; Cheng, H.; Edwards, R.L.; Ma, Z.-B.; Tsai, W.; Li, M.-D. 87Sr/86Sr and Sr/Ca in speleothems for paleoclimate reconstruction in Central China between 70 and 280 kyr ago. Geochim. Cosmochim. Acta 2005, 69, 3933–3947. [Google Scholar] [CrossRef]
  4. Johnson, K.R.; Hu, C.; Belshaw, N.S.; Henderson, G.M. Seasonal trace-element and stable-isotope variations in a Chinese speleothem: The potential for high-resolution paleomonsoon reconstruction. Earth Planet. Sci. Lett. EPSL 2006, 244, 394–407. [Google Scholar] [CrossRef] [Green Version]
  5. Cheng, H.; Sinha, A.; Wang, X.; Cruz, F.W.; Edwards, R.L. The Global Paleomonsoon as seen through speleothem records from Asia and the Americas. Clim. Dyn. 2012, 39, 1045–1062. [Google Scholar] [CrossRef]
  6. Wang, Y.J.; Cheng, H.; Edwards, R.L.; An, Z.S.; Wu, J.Y.; Shen, C.-C.; Dorale, J.A. A High-Resolution Absolute-Dated Late Pleistocene Monsoon Record from Hulu Cave, China. Science 2001, 294, 2345–2348. [Google Scholar] [CrossRef] [PubMed]
  7. Wang, Y.; Cheng, H.; Edwards, R.L.; He, Y.; Kong, X.; An, Z.; Wu, J.; Kelly, M.J.; Dykoski, C.A.; Li, X. The Holocene Asian Monsoon: Links to Solar Changes and North Atlantic Climate. Science 2005, 308, 854–857. [Google Scholar] [CrossRef]
  8. Wang, Y.; Cheng, H.; Edwards, R.L.; Kong, X.; Shao, X.; Chen, S.; Wu, J.; Jiang, X.; Wang, X.; An, Z. Millennial- and orbital-scale changes in the East Asian monsoon over the past 224,000 years. Nature 2008, 451, 1090–1093. [Google Scholar] [CrossRef] [Green Version]
  9. Sinha, A.; Cannariato, K.G.; Stott, L.D.; Cheng, H.; Edwards, R.L.; Yadava, M.G.; Ramesh, R.; Singh, I.B. A 900-year (600 to 1500 A.D.) record of the Indian summer monsoon precipitation from the core monsoon zone of India. Geophys. Res. Lett. GRL 2007, 34. [Google Scholar] [CrossRef] [Green Version]
  10. Sinha, A.; Kathayat, G.; Cheng, H.; Breitenbach, S.F.M.; Berkelhammer, M.; Mudelsee, M.; Biswas, J.; Edwards, R.L. Trends and oscillations in the Indian summer monsoon rainfall over the last two millennia. Nature Commun. 2015, 6. [Google Scholar] [CrossRef]
  11. Sinha, A.; Berkelhammer, M.; Stott, L.; Mudelsee, M.; Cheng, H.; Biswas, J. The leading mode of Indian Summer Monsoon precipitation variability during the last millennium. Geophys. Res. Lett. GRL 2011, 38. [Google Scholar] [CrossRef] [Green Version]
  12. Kathayat, G.; Cheng, H.; Sinha, A.; Yi, L.; Li, X.; Zhang, H.; Li, H.; Ning, Y.; Edwards, R.L. The Indian monsoon variability and civilization changes in the Indian subcontinent. Sci. Adv. 2017, 3, e1701296. [Google Scholar] [CrossRef] [PubMed]
  13. Kathayat, G.; Cheng, H.; Sinha, A.; Spötl, C.; Edwards, R.L.; Zhang, H.; Li, X.; Yi, L.; Ning, Y.; Cai, Y.; et al. Indian monsoon variability on millennial-orbital timescales. Sci. Rep. 2016, 6. [Google Scholar] [CrossRef] [PubMed]
  14. Myers, C.G.; Oster, J.L.; Sharp, W.D.; Bennartz, R.; Kelley, N.P.; Covey, A.K.; Breitenbach, S.F.M. Northeast Indian stalagmite records Pacific decadal climate change: Implications for moisture transport and drought in India. Geophys. Res. Lett. GRL 2015, 42, 4124–4132. [Google Scholar] [CrossRef] [Green Version]
  15. Sinha, A.; Cannariato, K.G.; Stott, L.D.; Li, H.-C.; You, C.-F.; Cheng, H.; Edwards, R.L.; Singh, I.B. Variability of Southwest Indian summer monsoon precipitation during the Bølling-Ållerød. Geology 2005, 33, 813–816. [Google Scholar] [CrossRef]
  16. Dutt, S.; Gupta, A.K.; Clemens, S.C.; Cheng, H.; Singh, R.K.; Kathayat, G.; Edwards, R.L. Abrupt changes in Indian summer monsoon strength during 33,800 to 5500 years B.P. Geophys. Res. Lett. GRL 2015, 42, 5526–5532. [Google Scholar] [CrossRef]
  17. Lechleitner, F.A.; Breitenbach, S.F.M.; Cheng, H.; Plessen, B.; Rehfeld, K.; Goswami, B.; Marwan, N.; Eroglu, D.; Adkins, J.; Haug, G. Climatic and in-cave influences on δ18O and δ13C in a stalagmite from northeastern India through the last deglaciation. Quat. Res. 2017, 88, 458–471. [Google Scholar] [CrossRef]
  18. LeGrande, A.N.; Schmidt, G.A. Sources of Holocene variability of oxygen isotopes in paleoclimate archives. Clim. Past 2009, 5, 441–455. [Google Scholar] [CrossRef] [Green Version]
  19. Battisti, D.S.; Ding, Q.; Roe, G.H. Coherent pan-Asian climatic and isotopic response to orbital forcing of tropical insolation. J. Geophys. Res. Atmos. 2014, 119, 11997–12020. [Google Scholar] [CrossRef]
  20. Atsawawaranunt, K.; Harrison, S.; Comas Bru, L. SISAL (Speleothem Isotopes Synthesis and AnaLysis Working Group) Database Version 1.0. 2018. Available online: http://researchdata.reading.ac.uk/139/ (accessed on 4 December 2018).
  21. Atsawawaranunt, K.; Comas-Bru, L.; Amirnezhad Mozhdehi, S.; Deininger, M.; Harrison, S.P.; Baker, A.; Boyd, M.; Kaushal, N.; Ahmad, S.M.; Ait Brahim, Y.; et al. The SISAL database: A global resource to document oxygen and carbon isotope records from speleothems. Earth Syst. Sci. Data 2018, 1–64. [Google Scholar] [CrossRef]
  22. Dimri, A.P.; Niyogi, D.; Barros, A.P.; Ridley, J.; Mohanty, U.C.; Yasunari, T.; Sikka, D.R. Western Disturbances: A review. Rev. Geophys. 2015, 53, 225–246. [Google Scholar] [CrossRef] [Green Version]
  23. Breitenbach, S.F.M.; Adkins, J.F.; Meyer, H.; Marwan, N.; Kumar, K.K.; Haug, G.H. Strong influence of water vapor source dynamics on stable isotopes in precipitation observed in Southern Meghalaya, NE India. Earth Planet. Sci. Lett. EPSL 2010, 292, 212–220. [Google Scholar] [CrossRef]
  24. Murata, F.; Hayashi, T.; Matsumoto, J.; Asada, H. Rainfall on the Meghalaya plateau in northeastern India—One of the rainiest places in the world. Nat. Hazards 2007, 42, 391–399. [Google Scholar] [CrossRef]
  25. Kumar, K.K.; Soman, M.K.; Kumar, K.R. Seasonal forecasting of Indian summer monsoon rainfall: A review. Weather 1995, 50, 449–467. [Google Scholar] [CrossRef]
  26. Bookhagen, B.; Thiede, R.C.; Strecker, M.R. Abnormal monsoon years and their control on erosion and sediment flux in the high, arid northwest Himalaya. Earth Planet. Sci. Lett. EPSL 2005, 231, 131–146. [Google Scholar] [CrossRef]
  27. Bjerknes, J. Atmospheric teleconnections from the equatorial pacific. Mon. Weather Rev. 1969, 97, 163–172. [Google Scholar] [CrossRef]
  28. Blanford, H.F., II. On the connexion of the Himalaya snowfall with dry winds and seasons of drought in India. Proc. R. Soc. Lond. 1884, 37, 3–22. [Google Scholar] [CrossRef]
  29. Hahn, D.G.; Shukla, J. An Apparent Relationship between Eurasian Snow Cover and Indian Monsoon Rainfall. J. Atmos. Sci. 1976, 33, 2461–2462. [Google Scholar] [CrossRef] [Green Version]
  30. Khandekar, M.L. Eurasian snow cover, Indian monsoon and El Niño/Southern Oscillation—A synthesis. Atmos.-Ocean 1991, 29, 636–647. [Google Scholar] [CrossRef]
  31. Kripalani, R.H.; Singh, S.V.; Vernekar, A.D.; Thapliyal, V. Empiriacal Study on Nimbus-7 Snow Mass and Indian Summer Monsoon Rainfall. Int. J. Climatol. 1996, 16, 23–34. [Google Scholar] [CrossRef]
  32. Bamzai, A.S.; Shukla, J. Relation between Eurasian Snow Cover, Snow Depth, and the Indian Summer Monsoon: An Observational Study. J. Clim. 1999, 12, 3117–3132. [Google Scholar] [CrossRef]
  33. Kumar, K.K. On the Weakening Relationship Between the Indian Monsoon and ENSO. Science 1999, 284, 2156–2159. [Google Scholar] [CrossRef] [PubMed]
  34. Ashok, K.; Guan, Z.; Yamagata, T. Impact of the Indian Ocean dipole on the relationship between the Indian monsoon rainfall and ENSO. Geophys. Res. Lett. GRL 2001, 28, 4499–4502. [Google Scholar] [CrossRef] [Green Version]
  35. Kripalani, R.; Kulkarni, A. Climate impact of El Nino/La Nina on the Indian monsoon: A new perspective. Weather 2012. [Google Scholar] [CrossRef]
  36. Goswami, B.N.; Mohan, R.S.A. Intraseasonal Oscillations and Interannual Variability of the Indian Summer Monsoon. J. Clim. 2001, 14, 1180–1198. [Google Scholar] [CrossRef] [Green Version]
  37. Guhathakurta, P.; Rajeevan, M. Trends in the rainfall pattern over India. Int. J. Climatol. 2008, 28, 1453–1469. [Google Scholar] [CrossRef] [Green Version]
  38. Rajeevan, M.; Gadgil, S.; Bhate, J. Active and break spells of the Indian summer monsoon. J. Earth Syst. Sci. 2010, 119, 229–247. [Google Scholar] [CrossRef] [Green Version]
  39. Annamalai, H.; Slingo, J.M. Active/break cycles: Diagnosis of the intraseasonal variability of the Asian Summer Monsoon. Clim. Dyn. 2001, 18, 85–102. [Google Scholar] [CrossRef]
  40. Mehta, V.M.; Lau, K.-M. Influence of solar irradiance on the Indian Monsoon-ENSO relationship at decadal-multidecadal time scales. Geophys. Res. Lett. GRL 1997, 24, 159–162. [Google Scholar] [CrossRef] [Green Version]
  41. Krishnan, R.; Sugi, M. Pacific decadal oscillation and variability of the Indian summer monsoon rainfall. Clim. Dyn. 2003, 21, 233–242. [Google Scholar] [CrossRef]
  42. Chen, Z.; Auler, A.S.; Bakalowicz, M.; Drew, D.; Griger, F.; Hartmann, J.; Jiang, G.; Moosdorf, N.; Richts, A.; Stevanovic, Z.; et al. The World Karst Aquifer Mapping project: Concept, mapping procedure and map of Europe. Hydrogeol. J. 2017, 25, 771–785. [Google Scholar] [CrossRef]
  43. Berkelhammer, M.; Sinha, A.; Mudelsee, M.; Cheng, H.; Edwards, R.L.; Cannariato, K. Persistent multidecadal power of the Indian Summer Monsoon. Earth Planet. Sci. Lett. EPSL 2010, 290, 166–172. [Google Scholar] [CrossRef]
  44. Singh Kotlia, B.; Singh, A.K. Stalagmite Inferred High Resolution Climatic Changes through Pleistocene-Holocene Transition in Northwest Indian Himalaya. J. Earth Sci. Clim. Chang. 2016, 07. [Google Scholar] [CrossRef]
  45. Berkelhammer, M.; Sinha, A.; Stott, L.; Cheng, H.; Pausata, F.S.R.; Yoshimura, K. An Abrupt Shift in the Indian Monsoon 4000 Years Ago. In Geophysical Monograph Series; Giosan, L., Fuller, D.Q., Nicoll, K., Flad, R.K., Clift, P.D., Eds.; American Geophysical Union: Washington, DC, USA, 2013; pp. 75–88. ISBN 978-1-118-70432-5. [Google Scholar]
  46. Huguet, C.; Routh, J.; Fietz, S.; Lone, M.A.; Kalpana, M.S.; Ghosh, P.; Mangini, A.; Kumar, V.; Rangarajan, R. Temperature and Monsoon Tango in a Tropical Stalagmite: Last Glacial-Interglacial Climate Dynamics. Sci. Rep. 2018, 8, 5386. [Google Scholar] [CrossRef] [PubMed]
  47. Genty, D. Munagamanu Cave Data: SISAL Database v1; University of Reading: Reading, UK, 2018. [Google Scholar]
  48. Joshi, L.M.; Kotlia, B.S.; Ahmad, S.M.; Wu, C.-C.; Sanwal, J.; Raza, W.; Singh, A.K.; Shen, C.-C.; Long, T.; Sharma, A.K. Reconstruction of Indian monsoon precipitation variability between 4.0 and 1.6 ka BP using speleothem δ18O records from the Central Lesser Himalaya, India. Arabian J. Geosci. 2017, 10, 356. [Google Scholar] [CrossRef]
  49. Raza, W.; Ahmad, S.M.; Lone, M.A.; Shen, C.-C.; Sarma, D.S.; Kumar, A. Indian summer monsoon variability in southern India during the last deglaciation: Evidence from a high resolution stalagmite δ18O record. Palaeogeogr. Palaeoclimatol. Palaeoecol. 2017, 485, 476–485. [Google Scholar] [CrossRef]
  50. Lone, M.A.; Ahmad, S.M.; Dung, N.C.; Shen, C.-C.; Raza, W.; Kumar, A. Speleothem based 1000-year high resolution record of Indian monsoon variability during the last deglaciation. Palaeogeogr. Palaeoclimatol. Palaeoecol. 2014, 395, 1–8. [Google Scholar] [CrossRef]
  51. Yadava, M.G.; Ramesh, R.; Pant, G.B. Past monsoon rainfall variations in peninsular India recorded in a 331-year-old speleothem. Holocene 2004, 14, 517–524. [Google Scholar] [CrossRef]
  52. Laskar, A.H.; Raghav, S.; Yadava, M.G.; Jani, R.A.; Narayana, A.C.; Ramesh, R. Potential of Stable Carbon and Oxygen Isotope Variations of Speleothems from Andaman Islands, India, for Paleomonsoon Reconstruction. J. Geol. Res. 2011. [Google Scholar] [CrossRef]
  53. Laskar, A.H.; Yadava, M.G.; Ramesh, R.; Polyak, V.J.; Asmerom, Y. A 4 kyr stalagmite oxygen isotopic record of the past Indian Summer Monsoon in the Andaman Islands. Geochem. Geophys. Geosys. 2013. [Google Scholar] [CrossRef]
  54. Allu, N.C.; Tiwari, M.; Yadava, M.G.; Dung, N.C.; Shen, C.-C.; Belgaonkar, S.P.; Ramesh, R.; Laskar, A.H. Stalagmite δ18O variations in southern India reveal divergent trends of Indian Summer Monsoon and East Asian Summer Monsoon during the last interglacial. Quat. Int. 2015, 371, 191–196. [Google Scholar] [CrossRef]
  55. Kotlia, B.S.; Singh, A.K.; Zhao, J.-X.; Duan, W.; Tan, M.; Sharma, A.K.; Raza, W. Stalagmite based high resolution precipitation variability for past four centuries in the Indian Central Himalaya: Chulerasim cave re-visited and data re-interpretation. Quat. Int. 2017, 444, 35–43. [Google Scholar] [CrossRef]
  56. Sanwal, J.; Kotlia, B.S.; Rajendran, C.; Ahmad, S.M.; Rajendran, K.; Sandiford, M. Climatic variability in Central Indian Himalaya during the last ∼1800 years: Evidence from a high resolution speleothem record. Quat. Int. 2013, 304, 183–192. [Google Scholar] [CrossRef]
  57. Band, S.; Yadava, M.G.; Lone, M.A.; Shen, C.-C.; Sree, K.; Ramesh, R. High-resolution mid-Holocene Indian Summer Monsoon recorded in a stalagmite from the Kotumsar Cave, Central India. Quat. Int. 2018, 479, 19–24. [Google Scholar] [CrossRef]
  58. Sinha, N.; Gandhi, N.; Chakraborty, S.; Krishnan, R.; Ramesh, R.; Yadava, M.; Datye, A. Past rainfall reconstruction using speleothem from Nakarallu cave, kadapa, Andhra Pradesh, India. In Proceedings of the EGU General Assembly, Vienna, Austria, 17–22 April 2016; Volume 18, p. EPSC2016-811. [Google Scholar]
  59. Liang, F.; Brook, G.A.; Kotlia, B.S.; Railsback, L.B.; Hardt, B.; Cheng, H.; Edwards, R.L.; Kandasamy, S. Panigarh cave stalagmite evidence of climate change in the Indian Central Himalaya since AD 1256: Monsoon breaks and winter southern jet depressions. Quat. Sci. Rev. 2015, 124, 145–161. [Google Scholar] [CrossRef]
  60. Kotlia, B.S.; Singh, A.K.; Joshi, L.M.; Dhaila, B.S. Precipitation variability in the Indian Central Himalaya during last ca. 4,000 years inferred from a speleothem record: Impact of Indian Summer Monsoon (ISM) and Westerlies. Quat. Int. 2015, 371, 244–253. [Google Scholar] [CrossRef]
  61. Breitenbach, S. Changes in Monsoonal Precipitation and Atmospheric Circulation During the Holocene Reconstructed from Stalagmites from Northeastern India. Ph.D. Thesis, University of Potsdam, Potsdam, Germany, 2010. [Google Scholar]
  62. Gebauer, H. Resources on the Speleology of Meghalaya State, India. Part 7: Khaddum (East Jaintia Hills District); Berliner Höhlenkundliche Berichte Series 67; Speläoclub Berlin: Berlin, Germany, 2017. [Google Scholar]
  63. Gebauer, H. Resources on the Speleology of Meghalaya State, India. Part 6: Lumshnong (East Jaintia Hills); Berliner Höhlenkundliche Berichte Series 60; Speläoclub Berlin: Berlin, Germany, 2015. [Google Scholar]
  64. Gebauer, H. Resources on the Speleology of Meghalaya State, India. Part 5: Syndai, Nongtalang and Lakadong; Berliner Höhlenkundliche Berichte Series 52; Speläoclub Berlin: Berlin, Germany, 2013. [Google Scholar]
  65. Gebauer, H. Resources on the Speleology of Meghalaya State, India. Part 4: East Khasi Hills. Section 1 + 2; Berliner Höhlenkundliche Berichte Series 47–48; Speläoclub Berlin: Berlin, Germany, 2012. [Google Scholar]
  66. Gebauer, H. Resources on the Speleology of Meghalaya State, India. Part 3: West Khasi Hills; Berliner Höhlenkundliche Berichte Series 42; Speläoclub Berlin: Berlin, Germany, 2011. [Google Scholar]
  67. Gebauer, H. Resources on the Speleology of Meghalaya State, India. Part 2: Garo Hills; Berliner Höhlenkundliche Berichte Series 35; Speläoclub Berlin: Berlin, Germany, 2009. [Google Scholar]
  68. Gebauer, H. Resources on the Speleology of Meghalaya State, India. Part 1: Overview; Berliner Höhlenkundliche Berichte Series 33; Speläoclub Berlin: Berlin, Germany, 2008. [Google Scholar]
  69. Gebauer, H. Resources on the Speleology of Himachal Pradesh (India); Berliner Höhlenkundliche Berichte Series 21; Speläoclub Berlin: Berlin, Germany, 2006. [Google Scholar]
  70. Gebauer, H. Resources on the Speleology of Jammu & Kashmir State, India; Berliner Höhlenkundliche Berichte Series 18; Speläoclub Berlin: Berlin, Germany, 2005. [Google Scholar]
  71. Breitenbach, S.; Gebauer, H. Resources on the Speleology of Uttarakhand State (formerly Uttaranchal), India; Berliner Höhlenkundliche Berichte Series 50; Speläoclub Berlin: Berlin, Germany, 2013. [Google Scholar]
  72. Tewari, V.C. Speleothems from Uttarakhand and Meghalaya indicating Holocene Monsoon and Climate. J. Ind. Geol. Cong. 2011, 3, 87–104. [Google Scholar]
  73. Tewari, V.C. Speleothems as Paleoclimate and Paleomonsoon Indicator: Evidences from NW Himalaya and the Shillong Plateau, NE India. In Proceedings of Selected Topics in Earth System Sciences; Indian Academy of Sciences: Bengaluru, India, 2013; pp. 31–39. [Google Scholar]
  74. Tewari, V. Himalayan Speleothems as Proxy for the Past Climatic Change and Paleomonsoon. In Frontiers of Earth Science; Scientific Publishers: Jodhpur, India, 2015; pp. 243–250. [Google Scholar]
  75. Baskar, S.; Baskar, R.; Tewari, V.C.; Thorseth, I.H.; Øvreås, L.; Lee, N.M.; Routh, J. Cave Geomicrobiology in India: Status and Prospects. In Stromatolites: Interaction of Microbes with Sediments; Cellular Origin, Life in Extreme Habitats and Astrobiology; Springer: Dordrecht, The Netherlands, 2011; pp. 541–569. ISBN 978-94-007-0396-4. [Google Scholar]
  76. Brooks, S.; Smart, C. Caving in the Abode of the Clouds. The Caves and Karst of Meghalaya, North East India; Bristol Exploration Club: Somerset, UK; Orpheus Caving Club: Derbyshire, UK, 1995. [Google Scholar]
  77. Harries, D.B.; Ware, F.J.; Fischer, C.W.; Biswas, J.; Kharpran-Daly, B.D. A Review of Biospeleology of Meghalaya, India. Natl. Speleol. Soc. Bull. 2008, 163–176. [Google Scholar]
  78. Yadava, M.G.; Ramesh, R. Monsoon reconstruction from radiocarbon dated tropical Indian speleothems. Holocene 2005, 15, 48–59. [Google Scholar] [CrossRef]
  79. Biswas, J. Kotumsar Cave biodiversity: A review of cavernicoles and their troglobiotic traits. Biodivers. Conserv. 2010, 19, 275. [Google Scholar] [CrossRef]
  80. Biswas, J.; Shrotriya, S. Dandak: A mammalian dominated cave ecosystem of India. Subterr. Biol. 2011, 8, 1–8. [Google Scholar] [CrossRef]
  81. Dar, F.A.; Perrin, J.; Riotte, J.; Gebauer, H.D.; Narayana, A.C.; Shakeel, A. Karstification in the Cuddapah Sedimentary Basin, Southern India: Implications for Groundwater Resources. Acta Carsol. 2011, 40. [Google Scholar] [CrossRef]
  82. Blaauw, M.; Christen, J.A.; Mauquoy, D.; van der Plicht, J.; Bennett, K.D. Testing the timing of radiocarbon-dated events between proxy archives. Holocene 2007, 17, 283–288. [Google Scholar] [CrossRef] [Green Version]
  83. Ramsey, C.B. Deposition models for chronological records. Quat. Sci. Rev. QSR 2008, 27, 42–60. [Google Scholar] [CrossRef] [Green Version]
  84. Scholz, D.; Hoffmann, D.L. StalAge—An algorithm designed for construction of speleothem age models. Quat. Geochron. 2011, 6, 369–382. [Google Scholar] [CrossRef]
  85. Breitenbach, S.F.M.; Rehfeld, K.; Goswami, B.; Baldini, J.U.L.; Ridley, H.E.; Kennett, D.J.; Prufer, K.M.; Aquino, V.V.; Asmerom, Y.; Polyak, V.J.; et al. Constructing Proxy Records from Age models (COPRA). Clim. Past 2012, 8, 1765–1779. [Google Scholar] [CrossRef]
  86. Kim, S.-T.; Mucci, A.; Taylor, B.E. Phosphoric acid fractionation factors for calcite and aragonite between 25 and 75 °C: Revisited. Chem. Geol. 2007, 246, 135–146. [Google Scholar] [CrossRef]
  87. Lachniet, M.S. Are aragonite stalagmites reliable paleoclimate proxies? Tests for oxygen isotope time-series replication and equilibrium. GSA Bull. 2015, 127, 1521–1533. [Google Scholar] [CrossRef]
  88. Breitenbach, S.F.M.; Lechleitner, F.A.; Meyer, H.; Diengdoh, G.; Mattey, D.; Marwan, N. Cave ventilation and rainfall signals in dripwater in a monsoonal setting – a monitoring study from NE India. Chem. Geol. 2015, 402, 111–124. [Google Scholar] [CrossRef] [Green Version]
  89. Kathayat, G.; Cheng, H.; Sinha, A.; Berkelhammer, M.; Zhang, H.; Duan, P.; Li, H.; Li, X.; Ning, Y.; Edwards, R.L. Evaluating the timing and structure of the 4.2 ka event in the Indian summer monsoon domain from an annually resolved speleothem record from Northeast India. Clim. Past 2018, 14, 1869–1879. [Google Scholar] [CrossRef]
  90. Lamb, H.H. The early medieval warm epoch and its sequel. Palaeogeogr. Palaeoclimatol. Palaeoecol. 1965, 1, 13–37. [Google Scholar] [CrossRef]
  91. Ahmed, M.; Anchukaitis, K.J.; Asrat, A.; Borgaonkar, H.P.; Braida, M.; Buckley, B.M.; Büntgen, U.; Chase, B.M.; Christie, D.A.; et al. Continental-scale temperature variability during the past two millennia. Nat. Geosci. 2013, 6, 339–346. [Google Scholar] [CrossRef] [Green Version]
  92. Hoffmann, G.; Heimann, M. Water isotope modeling in the Asian monsoon region. Quat. Int. 1997, 37, 115–128. [Google Scholar] [CrossRef]
  93. Vuille, M.; Werner, M.; Bradley, R.S.; Keimig, F. Stable isotopes in precipitation in the Asian monsoon region. J. Geophys. Res. Atmos. 2005, 110. [Google Scholar] [CrossRef] [Green Version]
  94. Ishizaki, Y.; Yoshimura, K.; Kanae, S.; Kimoto, M.; Kurita, N.; Oki, T. Interannual variability of H218O in precipitation over the Asian monsoon region. J. Geophys. Res. Atmos. 2012, 117. [Google Scholar] [CrossRef]
  95. Midhun, M.; Ramesh, R. Validation of δ18O as a proxy for past monsoon rain by multi-GCM simulations. Clim. Dyn. 2016, 46, 1371–1385. [Google Scholar] [CrossRef]
  96. Midhun, M.; Lekshmy, P.R.; Ramesh, R.; Yoshimura, K.; Sandeep, K.K.; Kumar, S.; Sinha, R.; Singh, A.; Srivastava, S. The Effect of Monsoon Circulation on the Stable Isotopic Composition of Rainfall. J. Geophys. Res. Atmos. 2018, 123, 5205–5221. [Google Scholar] [CrossRef]
  97. Cai, Z.; Tian, L.; Bowen, G.J. Spatial-seasonal patterns reveal large-scale atmospheric controls on Asian Monsoon precipitation water isotope ratios. Earth Planet. Sci. Lett. 2018, 503, 158–169. [Google Scholar] [CrossRef]
  98. Maher, B.A.; Thompson, R. Oxygen isotopes from Chinese caves: Records not of monsoon rainfall but of circulation regime. J. Quat. Sci. 2012, 27, 615–624. [Google Scholar] [CrossRef]
  99. Pausata, F.S.R.; Battisti, D.S.; Nisancioglu, K.H.; Bitz, C.M. Chinese stalagmite δ18O controlled by changes in the Indian monsoon during a simulated Heinrich event. Nat. Geosci. 2011, 4, 474–480. [Google Scholar] [CrossRef]
  100. Cheng, H.; Edwards, R.L.; Broecker, W.S.; Denton, G.H.; Kong, X.; Wang, Y.; Zhang, R.; Wang, X. Ice Age Terminations. Science 2009, 326, 248–252. [Google Scholar] [CrossRef] [PubMed]
  101. Yoshimura, K.; Kanamitsu, M.; Noone, D.; Oki, T. Historical isotope simulation using Reanalysis atmospheric data. J. Geophys. Res. Atmos. 2008, 113. [Google Scholar] [CrossRef]
  102. Atwood, A.R.; Wu, E.; Frierson, D.M.W.; Battisti, D.S.; Sachs, J.P. Quantifying Climate Forcings and Feedbacks over the Last Millennium in the CMIP5–PMIP3 Models. J. Clim. 2015, 29, 1161–1178. [Google Scholar] [CrossRef]
  103. Bond, G.; Kromer, B.; Beer, J.; Muscheler, R.; Evans, M.N.; Showers, W.; Hoffmann, S.; Lotti-Bond, R.; Hajdas, I.; Bonani, G. Persistent Solar Influence on North Atlantic Climate During the Holocene. Science 2001, 294, 2130–2136. [Google Scholar] [CrossRef] [PubMed]
  104. Rehfeld, K.; Marwan, N.; Breitenbach, S.F.M.; Kurths, J. Late Holocene Asian summer monsoon dynamics from small but complex networks of paleoclimate data. Clim. Dyn. 2013, 41, 3–19. [Google Scholar] [CrossRef]
  105. Chen, J.; Chen, F.; Feng, S.; Huang, W.; Liu, J.; Zhou, A. Hydroclimatic changes in China and surroundings during the Medieval Climate Anomaly and Little Ice Age: Spatial patterns and possible mechanisms. Quat. Sci. Rev. 2015, 107, 98–111. [Google Scholar] [CrossRef]
  106. Dixit, Y.; Tandon, S.K. Hydroclimatic variability on the Indian subcontinent in the past millennium: Review and assessment. Earth-Sci. Rev. 2016, 161, 1–15. [Google Scholar] [CrossRef]
  107. Jones, P.D.; Osborn, T.J.; Briffa, K.R. The Evolution of Climate Over the Last Millennium. Science 2001, 292, 662–667. [Google Scholar] [CrossRef] [PubMed]
  108. Heinrich, H. Origin and Consequences of Cyclic Ice Rafting in the Northeast Atlantic Ocean During the Past 130,000 Years. Quat. Res. 1988, 29, 142–152. [Google Scholar] [CrossRef]
  109. Hodell, D.A.; Curtis, J.H. Oxygen and carbon isotopes of detrital carbonate in North Atlantic Heinrich Events. Mar. Geol. 2008, 256, 30–35. [Google Scholar] [CrossRef]
  110. Broecker, W.S. Does the Trigger for Abrupt Climate Change Reside in the Ocean or in the Atmosphere? Science 2003, 300, 1519–1522. [Google Scholar] [CrossRef] [PubMed]
  111. McManus, J.F.; Francois, R.; Gherardi, J.-M.; Keigwin, L.D.; Brown-Leger, S. Collapse and rapid resumption of Atlantic meridional circulation linked to deglacial climate changes. Nature 2004, 428, 834–837. [Google Scholar] [CrossRef] [PubMed]
  112. Brauer, A.; Haug, G.H.; Dulski, P.; Sigman, D.M.; Negendank, J.F.W. An abrupt wind shift in western Europe at the onset of the Younger Dryas cold period. Nat. Geosci. 2008, 1, 520–523. [Google Scholar] [CrossRef]
  113. Teller, J.T.; Leverington, D.W.; Mann, J.D. Freshwater outbursts to the oceans from glacial Lake Agassiz and their role in climate change during the last deglaciation. Quat. Sci. Rev. QSR 2002, 21, 879–887. [Google Scholar] [CrossRef]
  114. Schulz, H.; von Rad, U.; Erlenkeuser, H. Correlation between Arabian Sea and Greenland climate oscillations of the past 110,000 years. Nature 1998, 393, 54–57. [Google Scholar] [CrossRef]
  115. Altabet, M.A.; Higginson, M.J.; Murray, D.W. The effect of millennial-scale changes in Arabian Sea denitrification on atmospheric CO2. Nature 2002, 415, 159–162. [Google Scholar] [CrossRef] [PubMed]
  116. Ivanochko, T.S. Sub-Orbital Scale variations in the Intensity of the Arabian Sea Monsoon. Ph.D. Thesis, University of Edinburgh, Edinburgh, Scotland, 2005. [Google Scholar]
  117. McGee, D.; Moreno-Chamarro, E.; Green, B.; Marshall, J.; Galbraith, E.; Bradtmiller, L. Hemispherically asymmetric trade wind changes as signatures of past ITCZ shifts. Quat. Sci. Rev. QSR 2018, 180, 214–228. [Google Scholar] [CrossRef]
  118. Hemming, S.R. Heinrich events: Massive late Pleistocene detritus layers of the North Atlantic and their global climate imprint. Rev. Geophys. 2004, 42. [Google Scholar] [CrossRef] [Green Version]
  119. Stuiver, M.; Grootes, P.M.; Braziunas, T.F. The GISP2 δ18O Climate Record of the Past 16,500 Years and the Role of the Sun, Ocean, and Volcanoes. Quat. Res. 1995, 44, 341–354. [Google Scholar] [CrossRef]
  120. Cai, Y.; Fung, I.Y.; Edwards, R.L.; An, Z.; Cheng, H.; Lee, J.-E.; Tan, L.; Shen, C.-C.; Wang, X.; Day, J.A.; et al. Variability of stalagmite-inferred Indian monsoon precipitation over the past 252,000 y. Proc. Natl. Acad. Sci. 2015, 201424035. [Google Scholar] [CrossRef]
  121. Laskar, J.; Robutel, P.; Joutel, F.; Gastineau, M.; Correia, A.C.M.; Levrard, B. A long-term numerical solution for the insolation quantities of the Earth. Astronomy Astrophys. 2004, 428, 261–285. [Google Scholar] [CrossRef] [Green Version]
  122. Hu, C.; Henderson, G.M.; Huang, J.; Xie, S.; Sun, Y.; Johnson, K.R. Quantification of Holocene Asian monsoon rainfall from spatially separated cave records. Earth Planet. Sci. Lett. 2008, 266, 221–232. [Google Scholar] [CrossRef] [Green Version]
  123. Owen, R.A.; Day, C.C.; Hu, C.-Y.; Liu, Y.-H.; Pointing, M.D.; Blättler, C.L.; Henderson, G.M. Calcium isotopes in caves as a proxy for aridity: Modern calibration and application to the 8.2 kyr event. Earth Planet. Sci. Lett. 2016, 443, 129–138. [Google Scholar] [CrossRef]
Figure 1. Study area with carbonate rock distribution as given by the World Karst Aquifer Map (WoKAM [42]) (see map legend), generalized wind directions (Indian summer monsoon (ISM) and westerlies marked by blue arrows), geographical features, regions (north, northeastern, and peninsular India) and cave locations (1: Kalakot; 2: Bittoo, Sahiya, Tityana; 3: Chulerasim, Dharamjali, Panigarh, Sainji; 4: Timta; 5: Mawmluh, Rupasor, Syndai, Umsynrang, Wah Shikhar; 6: Dandak, Jhumar, Kotumsar; 7: Akalagavi; 8: Belum, Munagamanu, Nakarallu, Valmiki; 9: Baratang).
Quaternary 01 00029 g001
Figure 2. Temporal distribution of stalagmite δ18O records from India in the Speleothem Isotope Synthesis and AnaLysis database version 1 (SISAL_v1). Age in ka before present (BP) is given on the x-axis. The two figures cover (A) 300 to 0 ka BP, and (B) 30 to 0 ka BP. The color bar indicates the temporal resolution of isotopic data (years). The y-axis gives the record’s identifier (ID; entity_name) in the database. VSPM1 and VSPM4, Valmiki cave; Mum-stm2 and Munstm-1, Munagamanu cave; JHU-1, Jhumar cave; DAN-D, Dandak cave; WS-B, Wah Shikhar cave; KM-A, MWS-1, and MAW-6, Mawmluh cave; T1, Timta cave; SAH-AB, Sahiya cave; TC1, Tityana cave; BT-1 to BT-9, Bittoo cave; KL3, Kalakot cave. Further details can be found in Table 1.
Quaternary 01 00029 g002
Figure 3. Spatial distribution of stalagmite δ18O records from India in SISAL_v1 during three time slices: (a) Modern from 0 to −55 years BP, (b) Little Ice Age (LIA) from 551 to 387 years BP, and (c) Heinrich I (H1) from 15,215 to 14,697 years BP. The choice of age ranges for the various time slices reflect availability of records (see Figure 2). Modern: Sahiya (n = 64), Wah Shikhar (n = 45), Jhumar (n = 40). LIA: Sahiya (n = 134), Wah Shikhar (n = 245), Jhumar (n = 103), Dandak (n = 321). H1: Kalakot (n = 18), Bittoo (n = 28), Timta (n = 44), Mawmluh (n = 43), Valmiki (n = 135). The standard deviation on all records was 0.5‰ or less except for the Bittoo cave record for Heinrich I with a standard deviation of 1.3‰. The Valmiki cave stalagmites are composed of aragonite and may require a correction of ~0.8‰ to be compared with the other records from calcite stalagmites (see Section 3.3).
Quaternary 01 00029 g003
Figure 4. SISAL_v1 ISM stalagmite δ18O records covering the Little Ice Age (LIA). Age in years Common Era (CE) is given on the x-axis. The y-axis gives the δ18O in ‰VPDB. The LIA period is nominally demarcated as 1580 to 1880 CE. Sahiya [10], Wah Shikhar [11], Jhumar [11], and Dandak [9] cave records are shown along with their U–Th age errors.
Quaternary 01 00029 g004
Figure 5. Z-scores of the Sahiya cave δ18O record [10]. Age in years CE is given on the x-axis. The y-axis gives the δ18O in ‰VPDB. The LIA period is nominally demarcated from 1580 to 1880 CE [91].
Quaternary 01 00029 g005
Figure 6. SISAL_v1 ISM stalagmite δ18O records covering millennial events over the last deglaciation. The Younger Dryas (YD) and Heinrich events 1 and 2 [118] are indicated by yellow bars. Bölling–Allerød (BA) is indicated by a grey bar. The BA–YD transition is marked at 12.8 ka BP in the figure (GISP2 [119]). Bittoo [13], Kalakot [44], Timta [15], and Mawmluh [16,17] records are shown along with their U–Th age errors.
Quaternary 01 00029 g006
Figure 7. ISM stalagmite δ18O records on orbital time scale. Bittoo [13] and Mawmluh [16] cave records are shown along with their U–Th age errors. Hiatuses in the Bittoo cave record are marked. Marine isotope stages (MIS) are demarcated by grey and white bars. The insolation curve in W/m2 at 20° N is shown in blue [121].
Quaternary 01 00029 g007
Figure 8. ISM stalagmite δ18O records on Holocene time scale. Sahiya [10,12], Mawmluh [45], Kotumsar (KOT [57], NK (Supplementary Materials)), Dandak [9], and Jhumar [11] cave records are shown along with their U–Th age errors. The insolation curve in W/m2 at 20° N is shown in blue [121].
Quaternary 01 00029 g008
Table 1. List of stalagmite δ18O records from the Indian summer monsoon (ISM) region. Superscripts (a, b, c) in entity_name column refer to the mineralogy of the stalagmite where a = calcite, b = aragonite, and c = mixed calcite and aragonite; a.s.l.—above sea level; BP—before present; EGU—European Geosciences Union.
Site_NameSite_IDLatitude ° NLongitude ° EElevation m a.s.l.Entity_NameEntity_IDMin. Year BPMax. Year BPReference
Bittoo cave130.7977.783000BT-1 a112,20956,236Kathayat et al., 2016 [13]
BT-2.1 a224,95743,676Kathayat et al., 2016 [13]
BT-2.2 a343,67558,310Kathayat et al., 2016 [13]
BT-2.3 a458,310179,204Kathayat et al., 2016 [13]
BT-2.4 a5179,280191,449Kathayat et al., 2016 [13]
BT-2.5 a6227,021234,000Kathayat et al., 2016 [13]
BT-4 a7271,150283,817Kathayat et al., 2016 [13]
BT-6 a8199,872225,988Kathayat et al., 2016 [13]
BT-8 a98743477Kathayat et al., 2016 [13]
BT-9 a10243,063265,735Kathayat et al., 2016 [13]
Dandak cave13019.0082.00400DAN-D a278387.91325.25Berkelhammer et al., 2010 [43]
Sinha et al., 2007 [9]
Jhumar cave15318.8781.67600JHU-1 a328−58873.78Sinha et al., 2011 [11]
Kalakot cave4333.2274.43826KL 3 a119964516,322Kotlia et al., 2016 [44]
Mawmluh cave1225.2691.881160KM-A a61365312,395Berkelhammer et al., 2013 [45]
MWS-1 a62553233,788Dutt et al., 2015 [16]
MAW-6 a63651015,907Lechleitner et al., 2017 [17]
c −62−16.4Myers et al., 2015 [14]
a 660022,700Huguet et al., 2018 [46]
Munagamanu cave15715.1577.92475Mun-stm2 c348−59.063852.2Genty et al., unpublished [20]
Mun-stm1 c349−54.71694.88Genty et al., unpublished [47]
Sahiya cave5430.6077.871190SAH-AB a132−59.063852.2Sinha et al., 2015 [10]
a 20805684Kathayat et al., 2017 [12]
Timta cave6129.8482.031900T1 a14511,66415,215Sinha et al., 2005 [15]
Tityana cave12630.6477.651470TC1 a26215803907Joshi et al., 2017 [48]
Valmiki cave2815.1577.82420VSPM1 b9913,16115,607Raza et al., 2017 [49]
VSPM4 b10014,69715,696Lone et al., 2014 [50]
Wah Shikhar cave6425.2591.871290WS-B a148−56.65551Sinha et al., 2011 [11]
Akalagavi cave 14.9874.52521b −47284Yadava et al., 2004 [51]
Baratang cave 12.0892.7520a ~0~3300Laskar et al., 2011 [52]
a ~0~800Laskar et al., 2013 [53]
a ~800~3700Laskar et al., 2013 [53]
Belum cave 15.178.1367a ~99,000~108,000Allu et al., 2014 [54]
Chulerasim cave 29.8979.351254b 0328Kotlia et al., 2016 [55]
Dharamjali cave 29.5280.212200b −601780Sanwal et al., 2013 [56]
Kotumsar cave 19.0082.0032a ~5600~8400Band et al., 2018 [57]
a 19643218Kaushal et al., unpublished(Supplementary Materials)
Nakarallu cave 14.5277.99280c ~1700~3300Sinha et al., 2017 (EGU Abstract) [58]
Panigarh cave 29.5580.121520c −55694Liang et al., 2015 [59]
Sainji cave 30.2779.301478c 200~4000Kotlia et al., 2014 [60]
Umsynrang cave 25.1892.37875b ~0~11,000Breitenbach, 2009, PhD thesis [61]

