Review

Speleothems from the Middle East: An Example of Water Limited Environments in the SISAL Database

1
Geological Survey of Israel, 30 Malchei Israel Street, Jerusalem 95501, Israel
2
Institute of Earth Sciences, Hebrew University of Jerusalem, Edmond Y. Safra Givat Ram Campus, Jerusalem 91904, Israel
3
Department of Environmental Chemistry, Spanish Council for Scientific Research (CSIC), Institute of Environmental Assessment and Water Research (IDAEA), 08034 Barcelona, Spain
4
Laboratorio de Evolución Humana, Universidad de Burgos, 09001 Burgos, Spain
5
Department of Archaeology and Centre for Past Climate Change, University of Reading, Reading RG6 6UR, UK
6
High-Precision Mass Spectrometry and Environment Change Laboratory (HISPEC), Department of Geosciences, National Taiwan University, Taipei 10617, Taiwan
7
Research Center for Future Earth, National Taiwan University, Taipei 10617, Taiwan
8
Institute of Geosciences, Johannes Gutenberg University Mainz, J.-J.-Becher-Weg 21, 55128 Mainz, Germany
*
Author to whom correspondence should be addressed.
Submission received: 30 January 2019 / Revised: 3 April 2019 / Accepted: 4 April 2019 / Published: 22 April 2019
(This article belongs to the Special Issue Speleothem Records and Climate)

Abstract

:
The Middle East (ME) spans the transition between a temperate Mediterranean climate in the Levant to hyper-arid sub-tropical deserts in the southern part of the Arabian Peninsula (AP), with the complex alpine topography in the northeast feeding the Euphrates and Tigris rivers which support life in the Southeastern Fertile Crescent (FC). Climate projections predict severe drying in several parts of the ME in response to global warming, making it important to understand the controls of hydro-climate perturbations in the region. Here we discuss 23 ME speleothem stable oxygen isotope (δ18Occ) records from 16 sites from the SISAL_v1 database (Speleothem Isotope Synthesis and Analysis database), which provide a record of past hydro-climatic variability. Sub-millennial changes in ME δ18Occ values primarily indicate changes in past precipitation amounts the result of the main synoptic pattern in the region, specifically Mediterranean cyclones. This pattern is superimposed on change in vapor source δ18O composition. The coherency (or lack thereof) between regional records is reviewed from Pleistocene to present, covering the Last Glacial Maximum (~22 ka), prominent events during deglaciation, and the transition into the Holocene. The available δ18Occ time-series are investigated by binning and normalizing at 25-year and 200-year time windows over the Holocene. Important climatic oscillations in the Holocene are discussed, such as the 8.2 ka, 4.2 ka and 0.7 ka (the Little Ice Age) Before Present events. Common trends in the normalized anomalies are tested against different climate archives. Finally, recommendations for future speleothem-based research in the region are given along with comments on the utility and completeness of the SISAL database.

1. Introduction

The climate conditions across the Middle East (ME) are markedly heterogeneous for its relatively small geographical extension, encompassing the Eastern coasts of the Mediterranean (hereafter, the Levant) and the Fertile Crescent (FC) (often considered in tandem,) as well as parts of the Arabian Peninsula (AP) and North-East Africa [1,2]. The region spans the transition between a temperate Mediterranean climate in the Levant to hyper-arid sub-tropical deserts in the south, with complex alpine topography in the northeast feeding the Euphrates and Tigris rivers which support life in the Southeastern FC (Figure 1). Climate projections predict severe drying in major parts of the ME in response to global climate change, with a considerable impact for societies [3,4,5]. Climate reconstructions and archaeological information, suggest that changes in the regional hydroclimate was a primary driver in human expansion out of Africa [6], the Neolithic revolution, and the development of the first complex societies [7]. The ME has plentiful archeological records of human settlement throughout much of the Quaternary, and well into the Holocene [8,9,10,11,12,13,14]. Initially, the predominantly semi to hyper-arid climate of the region served as a bottle-neck for early hominin dispersion out of Africa, allowing migrations onto the Levant and the AP pathways only during wetter periods that were identified using speleothem growth (wet)/non-growth (dry) patterns in desert and water-limited settings [15,16,17,18]. These events are also recognized using other methods and different climate archives [10,19,20]. Since the Last Glacial Maximum from c. 25 to 20 ka BP (Before Present, calibrated in the SISAL database to the year 1950 of the Common Era, hereafter CE) and the following transition into the Holocene interglacial, there has been considerable evidence that variations in climate served as a driver in Homo Sapiens’ cultural evolution. The most notable is the “Neolithic Revolution”, where it has been suggested that post-glacial hunter-gatherers were able to cultivate a number of food plants due to the trend towards warmer and possibly wetter climate [21], whereas succeeding abrupt cooling events may have forced proto-agrarian societies to turn to the cultivation of wild cereals and fruit [21,22,23]. Wheat was cultivated in the FC around 9500 years BP, suggesting that the ME was the first region to cultivate plants and support sedentary human communities [24,25]. The ME localities, specifically the FC, were also the earliest locations where sophisticated civilizations, city-states and complex empire systems appeared during the mid- to late-Holocene [26,27]. It has been argued that the expansion and subsequent collapse of these civilizations was partly driven by rapid climate change events [14,28,29,30,31,32] superimposed on more gradual millennial climatic shifts. Furthermore, recent studies have suggested an association between a contemporary increase in the frequency and intensity of droughts in recent decades, to geopolitical unrest in the region, e.g., the Syrian Civil War [29,33,34]. These correlations highlight the importance of understanding both past and future climate perturbations in the ME. This can be achieved by use of large spatio-temporal networks/datasets of terrestrial hydro-climate archives. Regional-scale coherency would greatly improve our understanding of past variations in the spatio-temporal precipitation pattern of the ME, thereby resolving some of the contradictions between different records in the region [1,35].
The first version of the Speleothem Isotope Synthesis and Analysis database (SISAL_v1) [36,37], contains 376 isotope entity records derived from speleothems (secondary cave deposits) worldwide. Speleothems are commonly used as archives of past terrestrial climatic variability. This is because speleothems can be accurately dated and preserve multiple climate-sensitive proxies, which can be sampled at high spatial and temporal resolution. In temperate regions speleothem time-series are often continuous even under dry conditions [38,39]. By contrast, in semi-arid environments where the effective infiltration (i.e., precipitation minus evaporation or evapotranspiration) is negative throughout most of the year, the site specific hydrology and reservoir properties are emphasized in the palaeo-record and decadal, annual and often seasonal hiatuses (or seasonal biases) can be found [31,40,41]. Similarly, arid to hyper-arid environments particularly highlight growth/non-growth events. This gives speleothem records a distinct advantage over alternative palaeoclimate proxies (e.g., lake cores, tree-rings, corals), specifically for inter-comparison of the different climate settings found in the ME.
In this work we review 17 speleothem isotope records (hereafter entities) that are in SISAL_v1 for the ME, which includes sites in Lebanon, Israel, the West Bank, Oman, Yemen, and Southwest Turkey (entities from the AP and Egypt are also reviewed by Braun et al. [43]). An additional six sites from Eastern Europe and Northern Turkey (see Kern et al. [44]) are included here as these sites are along the dominant Eastern Mediterranean (EM) Sea storm tracks, the major climate patterns controlling precipitation in the region (Figure 1 and Figure 2; Table 1). The aim of this work is to highlight the applicability of speleothems from the ME currently logged in the SISAL_v1 database to resolve regional-scale consistencies and inconsistencies and to test for spatial coherency between speleothems and additional climate recorders (i.e., Arctic ice sheets and Mediterranean surface temperatures). The available speleothem stable oxygen isotope ratio (hereafter δ18Occ) Holocene time-series are investigated via binning and normalizing (providing median, the 25th and 75th quantiles of the data) at 25-year and 200-year time windows, as used previously in the context of the PAGES 2k databases [45]. This method is used to better understand how different Holocene climatic events are differentiated regionally with the context of a normalized ME composite time-series from multiple records analysis (hereafter, ME composite), i.e., Sapropel 1, the 8.2 ka and the 4.2 ka event or the Little Ice Age at 0.7 ka BP. Finally, we highlight sites and entities that are not logged in SISAL_v1 and identify potential regions for the generation of new speleothem proxy time-series, suggestions regarding future speleothem-based research using the SISAL database are given accordingly.

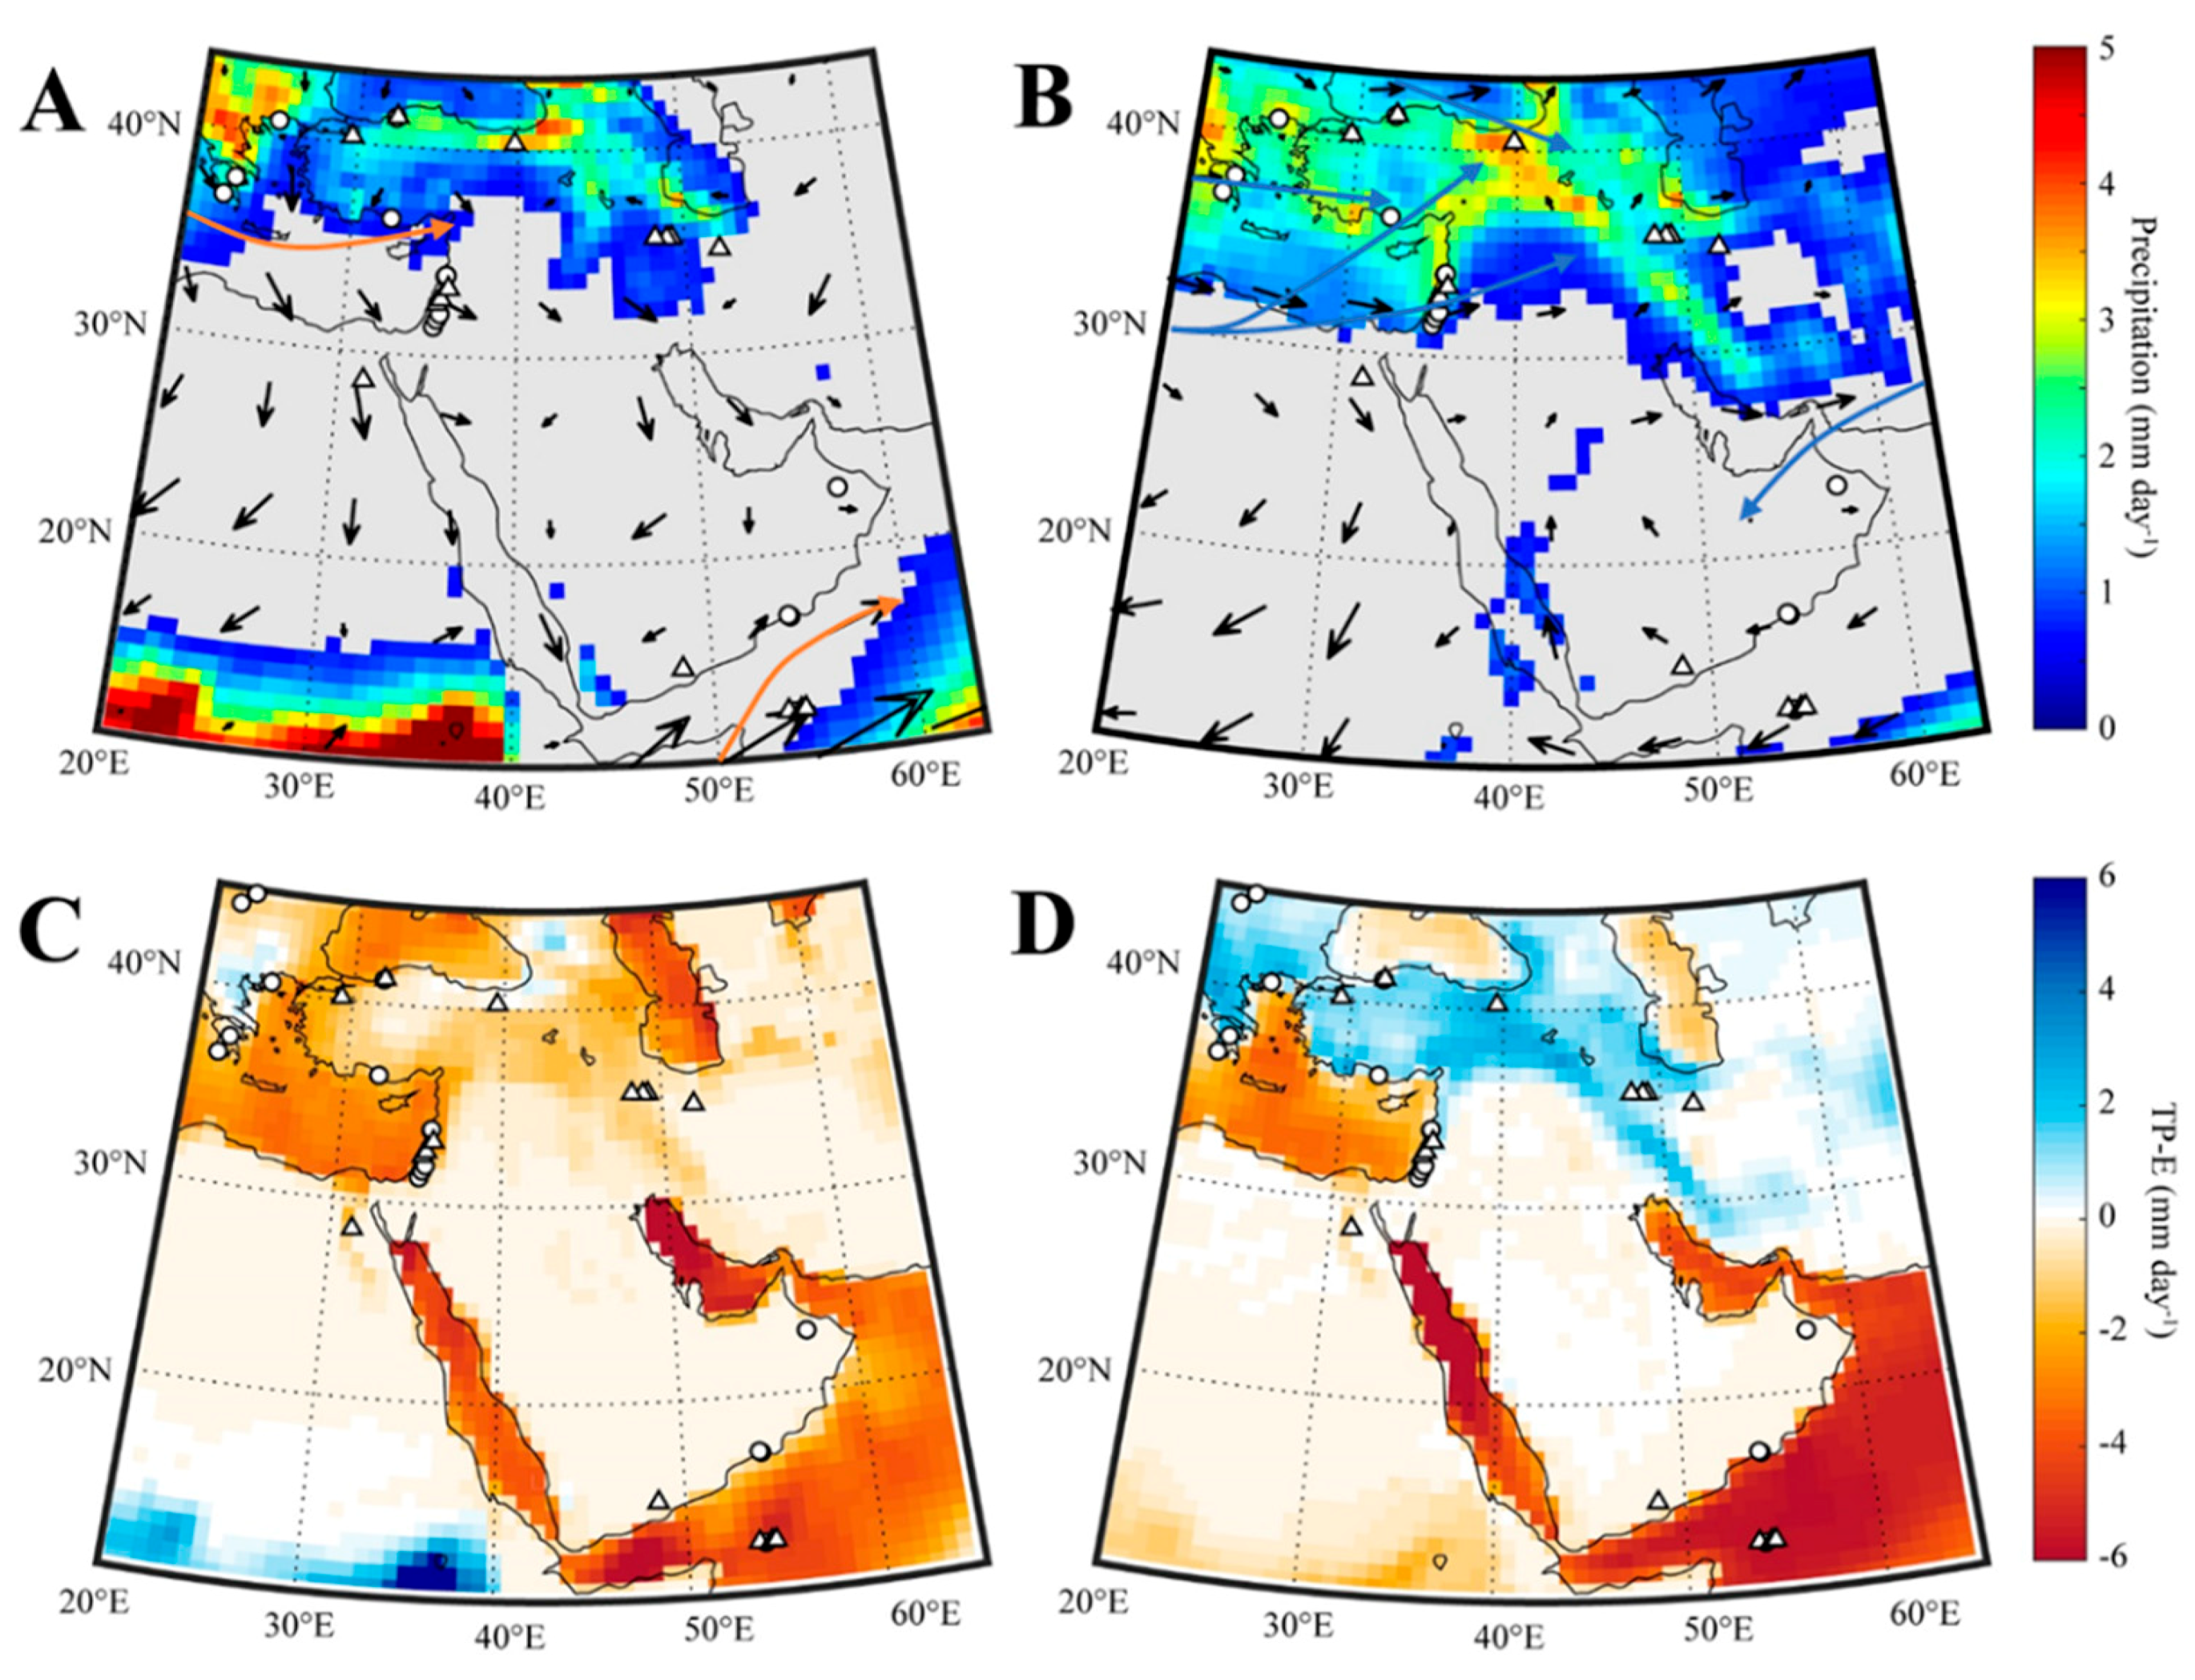
2. Climate of the Middle East

The Middle East (ME) is located within the subtropical high-pressure belt between the Northern Hemisphere tropical (Hadley cell) and the mid-latitude atmospheric circulation, which is generally associated with dry climates (i.e., the global desert belt). However, while most of the region is indeed semi to hyper arid, the modern climate of the Levant is less arid and much milder than would be expected from its location. This is mainly due to Mediterranean cyclones delivering precipitation to the Levant, Fertile Crescent (FC), and on rare instances the Arabian Peninsula (AP), the genesis of which is triggered by the interplay between the Mediterranean lows and the major North Atlantic synoptic systems [84]. Furthermore, the Mediterranean Sea is characterized by an eastward gradient of increasing salinity and sea surface temperatures (SST). This SST gradient and the cooler (compared to the Mediterranean SSTs) surrounding land are key drivers for the Mediterranean cyclogenesis [85].
The EM coastal areas receive most precipitation during Northern Hemisphere winter months, on average about 95% of rainfall occurs between October and May [86]. Mean annual precipitation (climatological mean, last 30 years) in the Levant displays a steep gradient, from hyper-arid in the south with less than 100 mm/y (e.g., Egypt, Southern Negev), through semi-arid with 500–600 mm/y (e.g., Soreq, Jerusalem) to humid in the north with >1000 mm (Lebanon and Southeast Turkey) (Figure 2A,B). Precipitation in the Levant is mainly sourced from eastward moving storm tracks generated inside the Mediterranean region, Cyprus low systems, when cold and dry air from continental Euro-Asia interfaces with the relatively warm Mediterranean Sea (Figure 2A compared to Figure 2B) [87,88]. A smaller fraction of cyclones enter on a southeastern trajectory from the Atlantic crossing the Southern EM Sea (Figure 2B), but rarely reach all the way to the Levant and FC [89]. Greece and Turkey (>38° N) also receive cyclones originating to the northwest over Central Europe, the Black Sea and in the Gulf of Genoa [84,90]. The semi-arid to hyper-arid FC currently receives most of its moisture during winter (98% of the precipitation occurs between October-May; [29]) from Mediterranean storm tracks [91]; while summer precipitation from tropical systems is virtually absent (Figure 2B).
The modern AP receives rainfall from the Mediterranean frontal systems (Dec-Mar), and rarely from the Indian summer monsoon (Figure 2A). In the Late Pleistocene, however, groundwater evidence suggests that the precipitation was sourced mainly from the Indian Ocean [92]. The modern climate at the Southern AP is largely dependent on the annual migration of the Inter-tropical Convergence Zone (ITCZ), which reaches its northern-most position in August. During this period, the Somali Jet brings large quantities of precipitation to the southernmost parts of the AP [93]. This is particularly important in the southwest where rainfall can occur all year round due to the orographic features of the region and moisture advected from the Red Sea [94,95]. The dominance of the Indian Ocean source in late Pleistocene suggests a northwards migration of the ITCZ.
The ME water-balance (Figure 2C,D) plays an important role in the development of cave records in the region. This becomes immediately visible when comparing the Mediterranean seasonality for summer (dry) and winter (wet), highlighting that even in regions that receive summer rainfall (Figure 2A), there will be little to no summer recharge under modern climate conditions (Figure 2C). The importance of the sub-regions reviewed in this work is emphasized when inspecting the patterns of winter potential recharge throughout the ME. The Levant, specifically the EM coastal region, is clearly on the desert-Mediterranean climate seamline with positive TP-E in the northernmost parts and negative TP-E in the south. The Israeli and Lebanese caves are situated in such a way where even a slight migration of the storm tracks shifts the water-balance from positive to negative and vice-versa. This sensitivity has been used to describe the Negev humid periods, however, Negev entities are not yet logged in the SISAL_v1 database) [73], climate controlled vegetation changes in the Levant [28] and changes in the dominant storm tracks [83]. The FC caves may track a similar transition between Mediterranean and monsoonal sources using Katleh Khor, Qal’e Kord and Gejkar caves, which appear to experience a positive winter water-balance compared to Gol-e Zard Cave, located further east and experiencing more water-limited conditions. The predominantly year-round negative water-balance in the AP stresses the importance of local physiographic settings and individual storms.
Due to the high SST and low atmospheric moisture above the Mediterranean Sea, the ratio of oxygen to deuterium isotopes in precipitation yields a unique regional water line, the Mediterranean Meteoric Water Line (MMWL, δD = 8 × δ18O + ~22 [‰VSMOW], [97]). The majority of Levant precipitation indicates a local vapor source, [86,97,98,99]. Atlantic storms traversing the Mediterranean Sea are overprinted with the MMWL signal, obscuring the original vapor source. There is no clear indication that alternative trajectories for the Levant, such as tropical plumes or Red Sea troughs (see Armon et al. [100]) maintain their source vapor, even though these storms travel very short distances over the EM [98]. Considering that the vadose aquifer mixes the rainwater of different storms, identifying shifts in trajectories of Mediterranean storms using water stable isotopes would be nearly impossible. However, using other tracers such as dust deposition rates its composition and Sr isotopes in speleothem may prove valuable [101,102,103]). Another important consideration is the effect of the aforementioned strong evaporative climate. In a long-term rainfall sampling campaign at the Soreq Cave site mean rainfall δ18O-δD relationship seemed to fall on the MMWL (slope ~8, deuterium excess of ~20–30‰) [41,86], however, when events of <20 mm (and higher than 10 °C surface temperature) are examined separately their slope and deuterium excess suggested to be the result of evaporative processes underneath the cloud. Whether the signature of the isotopically light events is transferred to the karst reservoir is still unclear, but a 2013 re-analysis of δ18O time-series of Soreq Cave drip water suggests evaporation effect to be minimal [41].
In contrast, precipitation at the southern tip of the AP and the southernmost parts of the Levant is associated with the annual migration of the ITCZ and precipitation derived from tropical cyclones (Figure 2). These are isotopically enriched compared to the δ18O of the Atlantic/Mediterranean systems and fall closer to the Global Meteoric Water Line (δD = 8 × δ18O + 10, [104]). If, however, changes in atmospheric ITCZ and associated precipitation occurred simultaneously in the Levant/FC and the AP, the variation recorded in δ18Occ time-series should be synchronized (see Section 4.1 for details).

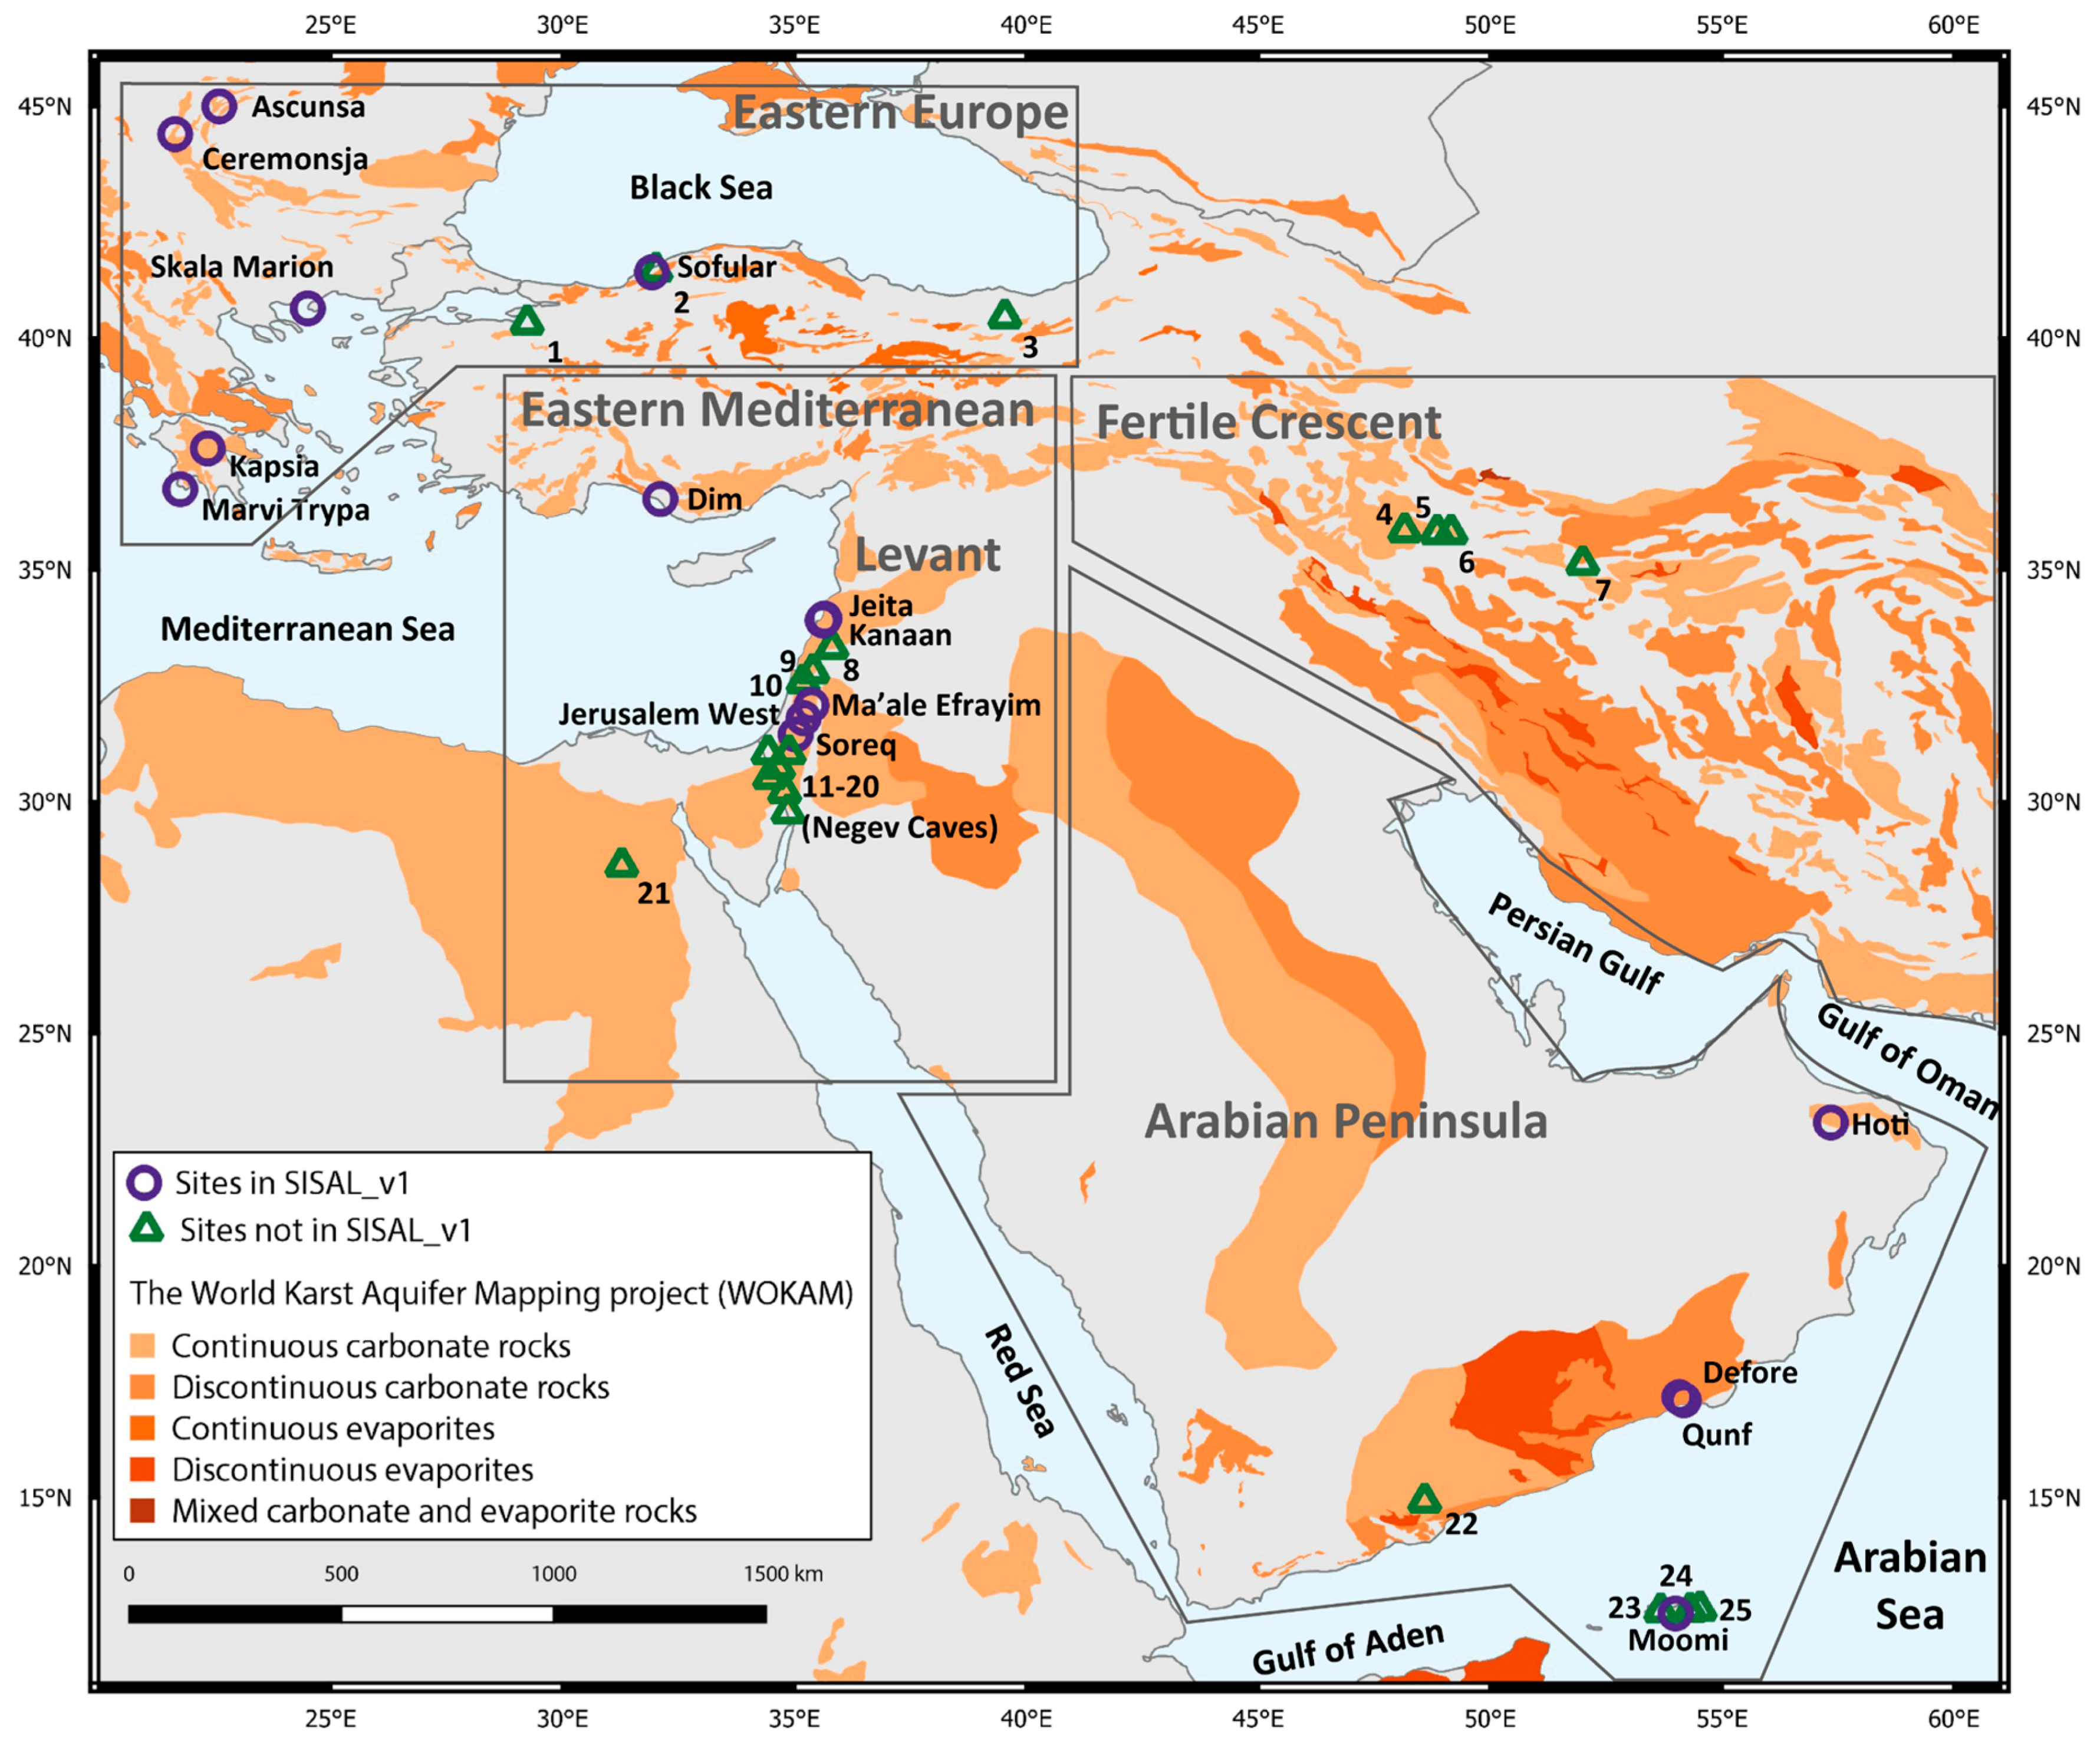
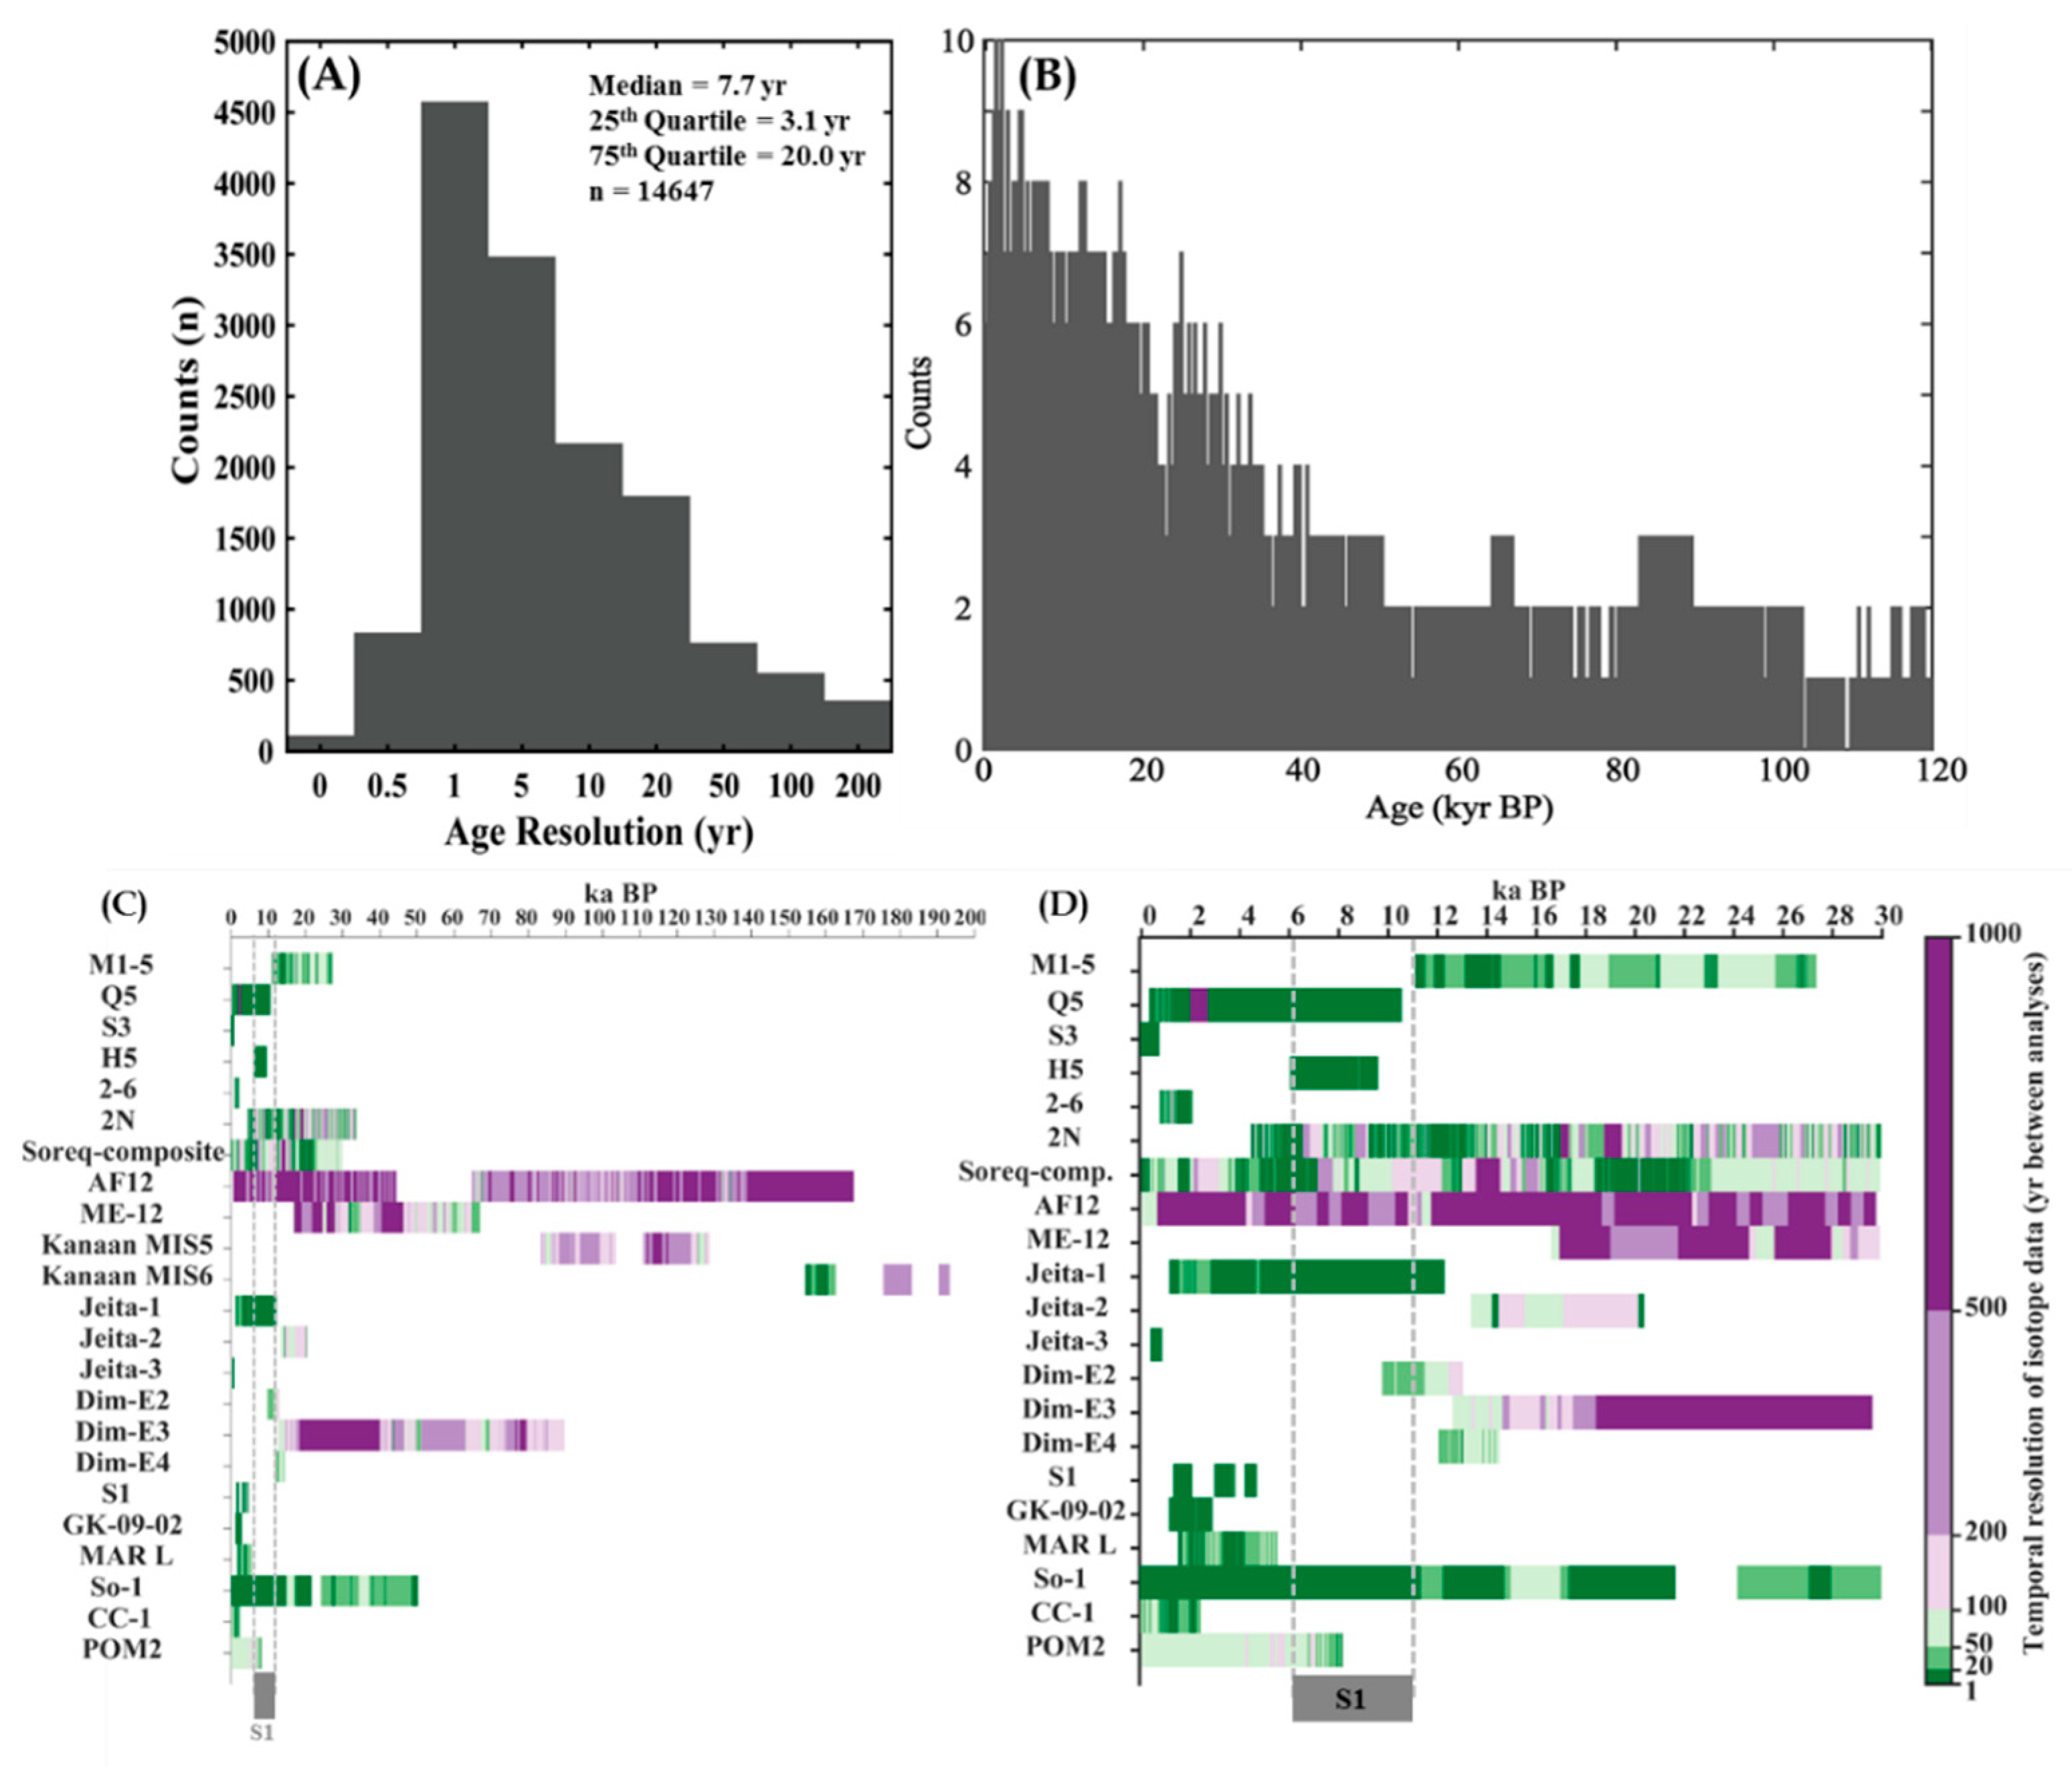
3. Spatial/Temporal Setting of Middle East Speleothems

We define the ME roughly from 10° N to 45° N and from 20° E to 65° E. This includes the Eastern parts of Europe that are relevant for understanding of the ME climate, as described in Section 2. We use records from 16 caves and 23 individual speleothems from SISAL_v1 (Table 1), of which 10 sites and 17 entities are from the ME and highlighted in Figure 1. There are additional entities that are not in the SISAL_v1 database (Table 1), including sites in Turkey, Israel, Egypt, Yemen, Iran and Iraq [37]. All δ18Occ values are reported in ‰ (per mille) and reported in the Vienna Pee Dee Belemnite (VPDB) standard.
The geographic coverage of the sites is uneven, with the majority of sites and entities from the EM, and a smaller proportion from the AP and FC. The geographical distribution of SISAL_v1 sites in the ME region is centered on areas of continuous carbonate rocks (Figure 1). However, other factors also have an influence. First, much of the region is arid to hyper arid (Figure 2), which inhibits the formation of speleothems, or limits formation to pluvial periods only [6,105]. Second, the recent unstable geopolitical situation in parts of the ME has allowed for limited scientific exploration.
The time intervals covered by the SISAL_v1 entities in the ME range from 0.056 ka BP (Sofular Cave, Turkey) to 193 ka BP (Kanaan Cave, Lebanon). The temporal distribution of samples is skewed towards the Holocene, with an almost linear increase in δ18O data in SISAL_v1 from ~40 ka BP to the present (Figure 3B). Only six entities extend to and beyond the last interglacial (south to north): Jerusalem West Cave AF-12, Ma’ale Efrayim ME-12, Kanaan Cave MIS5 and MIS6, Dim Cave Dim-E3 and Sofular SO-1 (Figure 3C). The remaining 17 entities are largely confined to the interval between the Last Glacial Maximum (LGM, ~22 ka BP) and present day (Table 1). The skewed distribution may be the result of publication bias, as most studies have focused on the link between climate and human civilizations [14,106], coupled with the fact that younger speleothems are more naturally abundant as older samples are either covered by the younger deposits, or destroyed by dissolution, alteration, earthquakes etc. [107]. Large parts of the Late Pleistocene have generally been obtained specifically in sites where long-term continuous research has been carried out over multiple overlapping entities (e.g., Israel, Lebanon and Oman).
The median temporal resolution of all ME samples is close to decadal with a 7.7-year temporal gap between data points (Figure 3A), the distribution of temporal gaps for all existing entities varies between sub-annual to >500 year gaps, as indicated by the dark purple gaps in Figure 3C,D. Caution is needed when analyzing close to millennial gaps, as they may be the result of prolonged growth hiatuses or problematic sampling methodology. Temporal resolution for all entities is given in Figure 3C,D (up to 1000-year gaps), showing that most entities maintain a relatively constant growth-rate, with the exception of entities from Levant sites (i.e., Soreq, Ma’ale Efrayim, Kanaan Jeita and Dim caves). This highlights the hydrological sensitivity of the Levant records to changes in storm tracks, rainfall amount and evapotranspiration [29,40,48].
Following the analysis of spatial distribution of the SISAL_v1 entities (Figure 1), as well as the temporal distribution and resolution (Figure 3), we will focus our discussion on the last 30 kyr of available SISAL_v1 data, and the regional ME composite for the last 12 kyr, from the Younger Dryas (YD) to present day. The temporal potential of climatological analysis is, in most entities, limited to decadal perturbations. However, the additional entities reported in Table 1 should allow for regional compilations and coherence tests to extend beyond the late-Pleistocene and Holocene to the last interglacial and beyond. Moreover, the regional dataset analyzed here is mainly affected by the Mediterranean storm tracks, with little information on the Indian Summer Monsoon (ISM) (see Kaushal et al. [110]). Questions concerning the intrusion of the Siberian High and migration of the ISM would be easier to tackle with the inclusion of the FC entities and the Negev caves (Table 1). The inclusion of these sites could be used to construct a regional-comparison traverse between Eastern Europe and the Balkans, EM, FC and AP. For this reason, we limit this review to the last glacial period and Holocene, and in Section 5 we provide suggestions to achieve a complete regional coherence analysis for the Late Pleistocene.

4. SISAL_v1 Entities: Site-Specific Trends and Regional Interpretations

While variations of speleothem δ18O values are a response to changes in climate parameters (rainfall amount and seasonal distribution, temperature, evaporation etc.), the absolute value of precipitation δ18O values (δ18Op) can vary between different sites, even if they respond to similar regional climate trends. As a result, even if near-equilibrium deposition is assumed, the absolute value of δ18Occ from different sites may not be identical. Hence, we focus on trends and excursions (i.e., on the variability) rather than absolute δ18Occ values of the time-series plotted in Figure 4 (LGM to present) and Figure 5 (last 12 kyrs), these are then expended on using a normalized ME composite described in Section 4.3 and plotted in Figure 6.

4.1. Controls on Speleothem δ18O

For the Levant, Southwest and Northwest Turkey, as well as parts of Eastern Europe, two main processes were suggested to dictate the composition of δ18Op–the source and “amount” effect [53,111,112].
The potential vapor sources available for Middle East (ME) precipitation are the Mediterranean and the Indian Ocean (including the Arabian and Red Seas). Another source for the entities included from Turkey, Greece and Eastern Europe is the Black Sea (see Section 2). The modern Levant rainfall is limited to winter cold fronts with strong wet-winter/dry-summer seasonality. These fronts quickly inherit the isotopic signature of the Eastern Mediterranean (EM). This is commonly referred to as the source effect, where δ18Op and (and the resulting δ18O recorded in speleothems) is strongly influenced by the marine reservoir that contributes its vapor to rain formation. This effect is dominant over millennial time-scales, specifically glacial-interglacial cycles, where the isotopically light (low δ18O) polar ice-sheet meltwater deplete the overall composition of oceanic surface water and the resulting cloud forming vapor [111]. Specifically for the EM there is also a precessional time-scale effect where the isotopically light Nile flux (during Sapropels, African Humid Periods) results in lighter surface water [113]. δ18Occ palaeo-data from Soreq, Pequiin and Jeita that show a visual first order millennial control on δ18Occ, predominantly reflect the change in composition of the vapor source, i.e., the EM Sea. Often, the glacial-interglacial transitions in speleothem records follow the depletion of sea surface δ18O as resolved from planktonic foraminifera [53,112]. A similar, but isotopically opposite, millennial trend is also observed in Sofular Cave, where the vapor source is the Black Sea [62,63] (for additional discussion see Kern et al. [44]).
The “amount” effect is considered the dominant driver of short-term δ18Op variations in the Levant and was empirically evaluated using modern measurements in numerous locations on the EM coastline [98,114]. Rainfall amount and isotopic compositions from the Israeli coastal plains and mountains display strong negative empirical correlations between rainfall amount, site altitude, and distance from the sea (all result in more negative values). The three are the underlying parameters controlling the rainout-distillation process (Rayleigh distillation) of the cloud [86,114]. There is no similar correlation for desert sites possibly due to desert rainfall being strongly affected by evaporation at the base of the cloud [98]. This observation was made using data from the EM coastline sites, where long-term rainfall sampling programs (amount and δ18Op) and modern cave water monitoring have been established. Regarding the sites in the SISAL_v1 database, only three of the seven Levant sites reviewed here had a long-term monitoring program (Kanaan, Soreq and Ma’ale Efraim). Three other sites (Mitzpe Shlagim, Pequiin and Dim) have had cave water sampled sporadically, when access to those sites was granted.
To evaluate the controlling mechanisms on decadal to seasonal δ18O variability in Levant records, we refer to the extensive monitoring dataset from Soreq Cave collected between 1989 and 2016. The monitoring included the logging of rainfall amount, analysis of its isotopic composition, as well as sampling of local ground water and host rock and measurements of cave pCO2, relative humidity and temperature of the cave air, seasonal cave drip and pool water sampling in multiple locations and the collection of modern speleothems and calcites [40,41,86,114,115,116,117]. The modern data from Soreq Cave reveals that on an annual time-scale, the rainfall amount is linearly correlated with more negative annual δ18Op (weighted average), and that this trend is then transferred into the cave. High mean annual rainfall amount results in more negative δ18Op values of the water in the vadose zone for that year, while prolonged droughts shifts the baseline seepage water to more positive δ18Op values [41]. The decadal to seasonal variations were validated in a modern stalagmite sample [40] and also observed in Soreq Cave fossil speleothem records, with seasonal to centennial resolution [14,28,31]. A similar control of the “amount” effect was also suggested in Western Mediterranean caves [118,119,120,121].
As a result of the modern strong seasonality pattern of the Levant region, the δ18O of cave water represents mostly winter rainfall. For seasonal studies, this simplifies the evaluation of the δ18Occ records by removing the by omitting the summer’s contribution to annual δ18Op variability (i.e., rainfall source seasonality [122,123]) and potentially avoiding δ18O enrichment following evaporation in the epikarst and karst reservoirs (as it is often reported as negligible in winter storms [86,98,114]). Consequently, the resulting speleothem record is strongly biased towards negative winter δ18Op. The implementation of the modern observation on paleorecords relies on the hypothesis which a suggests that the physiography of the Levant enforces the wet-winters/dry-summers seasonality of the region throughout the Pleistocene [124]. However, we note recent contrasting evidence by speleothem palaeoclimate studies resolved in seasonal resolution and other studies utilizing isotopically enabled climate models, which suggest the possibility of significant summer rainfall and positive summer effective infiltration for the Levant during the interglacials and interstadials [14,31,125].
In the Northern AP, Hoti cave records are mainly confined to the interglacial, with modern rainfall derived from similar Mediterranean cyclones (Figure 2A,B). Regional δ18Op however is much higher than in the EM coastline caves, ranging between 0 and −2‰. The current hypothesis to explain why the Hoti records have significantly lower δ18Occ values is that speleothem growth occurs under the highly pluvial conditions brought by the ISM, as the most recent period of deposition in the cave, the early to mid -Holocene is regarded as a period of increased monsoonal activity [52]. The Southern AP sites (Defore, Moomi, Qunf), record the intensity and duration of the ISM as well as the location of the ITCZ [49], as suggested by the modern synoptic systems and rainfall regime, and corroborated by examination of multiple δ18Occ records. These variations have been linked to solar output [48] and orbital forcing [75], and are synchronous global millennial scale events as recorded in the Greenland ice cores, EM Sea planktonic records and regional terrestrial records (i.e., the Dead Sea level curve [126]).
Unlike the Levant and AP records, the FC rainfall patterns vary from annual rainfall to distinct wet-dry seasonality, depending on the topography and proximity to the vapor sources [127]. Positive effective infiltration is limited to the autumn and winter months. δ18Op values vary between −10‰ (winter) and −2‰ (summer), with heavier events as being high as +5‰ in spring and summer [81,127]. Records from Qal’e Kord Cave are similar to Soreq Cave and link to changes in monsoonal precipitation in China. This suggests a teleconnection between Eastern Europe and Asia as a result of the meridional migration of the Westerly Jet. The main vapor source for the Levant sites and the FC sites the same (the Mediterranean Sea), however, the average δ18Occ values from the previous interglacial and glacial in Qal’e Kord Cave are ~2‰ lighter than coeval Soreq Cave records. This is ascribed mainly to the Rayleigh distillation of atmospheric vapor as it moves east over the land mass [81].

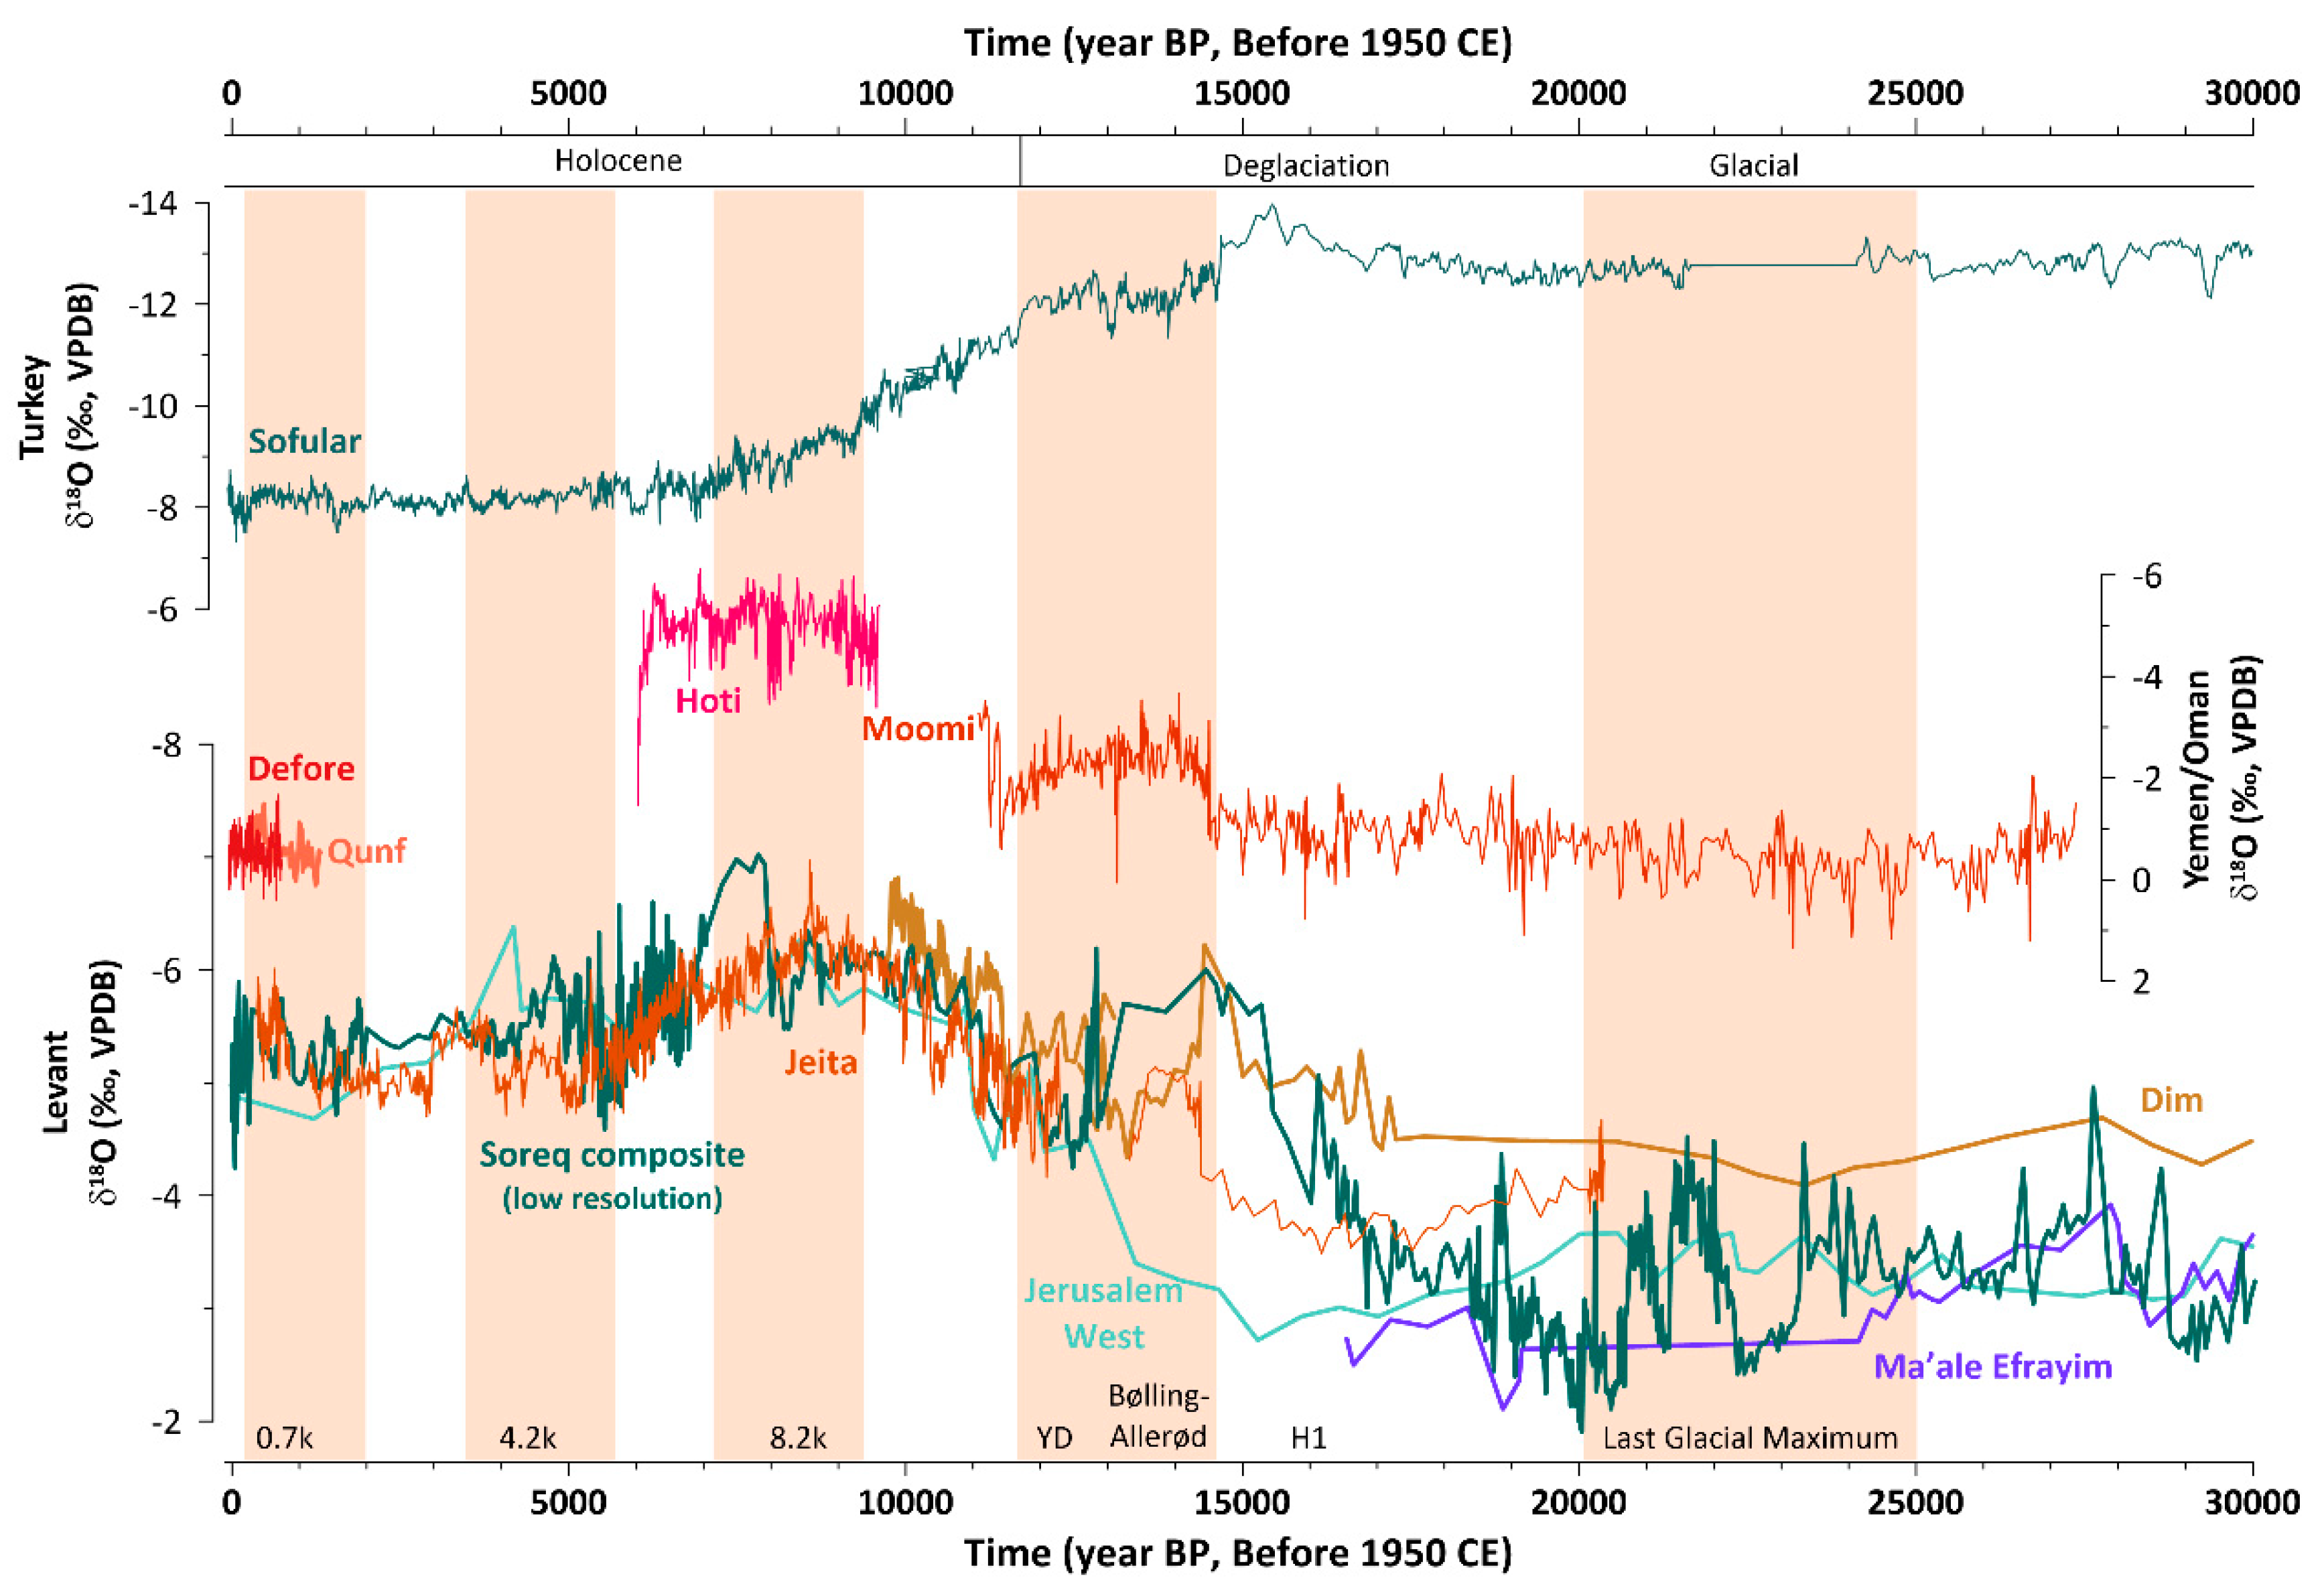
4.2. The Last Glacial Maximum, Deglaciation and the Transition into the Holocene (30 kyr BP to 12 kyr)

Levant records for the glacial-interglacial transition of the Late Pleistocene (deglaciation) follow the Mediterranean planktonic curves, indicating that these speleothem δ18O records primarily reflect sea surface δ18O changes [55,70,111,112]. The glacial period is characterized by a mean δ18Occ that is several permille more positive as a result of the enriched δ18O composition of the vapor source, i.e., the Mediterranean Sea (source effect), variations of the vapor source of ~1‰–1.5‰ are observed in the Holocene as well, but as shown by Almogi-Labin et al. [112] “…source effect is not directly recorded in δ18Osea–δ18Oland values, which would remained constant if the source effect were the only control of rainwater δ18O. The influences of rainfall, the amount, sea–land distance and elevation changes are thus superimposed on sea surface water δ18O change”. This shift is most pronounced in the Soreq Cave, where a sharp decrease in δ18Occ is visible starting at the Last Glacial Maximum (LGM) from −3.0‰ towards Holocene values of −5.5‰ (Figure 4). This depletion trend stabilizes at ~15 kyr BP (circa the Bølling-Allerød warm event), followed by a pronounced response to the Younger Dryas (YD), which is the sharpest response observed to event in the SISAL_v1 records from the region, with an enrichment of >1.5‰, but still 1–1.5‰ lower than LGM values (Figure 4).
The Jeita, Ma’ale Efrayim and Jerusalem West entities all have lower temporal resolution during the LGM and deglaciation, which makes the identification of major climatic events difficult (Figure 4). On centennial and longer time-scale, we observe a gradual transition in the δ18Occ values, from −2.5‰ after the LGM (~17.5 ka BP) to between ~−5 and −7‰ in the Holocene in Dim, Jeita and West Jerusalem caves (Figure 4). The expected “back to glacial” excursion of the YD, described for the Soreq composite record (~ +1.5‰), is harder to identify in the neighboring Levant (Figure 4). The identical trends observed across Levant records suggest that they respond to the same drivers, specifically, changing storm tracks, encroaching coastlines and changes in EM Sea surface isotopic composition [53,54,83,98]. This can be seen in Jeita Cave, which displays a visual correlation with the EM marine foraminifera δ18O and in the trend of the ME composite (Figure 4 vs. Figure 6D,E). However, during prominent climatic events (LGM, H1) Jeita-2 δ18Occ time-series shows opposite trends to the marine records [128,129]. These excursions towards lighter δ18Occ are often in tandem with lower δ13Ccc and Sr/Ca values and are suggested to reflect increased infiltration (i.e., high TP or higher TP-E). Evidence of changes in palaeo-infiltration highlight the inconsistencies found between the climate as inferred from the marine vs. terrestrial records, and also emphasizes that the source effect is not the only parameter influencing variations in δ18Occ.
Sofular Cave entity SO-1, however, is the only time-series which does not agree with this glacial to interglacial regional trend, towards more positive values in the transition to the Holocene (Figure 4). The distinct imprint of Greenland interstadials on the MIS2 50-kyr record suggests that SO-1 captures decadal to centennial-scale events. This means that on glacial time-scales SO-1 reflects Black Sea surface water composition rather than Mediterranean source [61]. Additional discussion on Sofular Cave, including the Holocene cycle documented in the speleothem δ13C time-series, can be found in the review of Eastern European records in SISAL_v1 [44].
The majority of entities from the AP grew only during interglacial periods. The only entity growing from the LGM to the Holocene is M1-5 from Moomi Cave (Socotra Island) spanning from 27 ka to 11 ka BP (Figure 3). The North-Easterly autumn rains sourced from the ITCZ are the main source of infiltrating water for Moomi Cave. Most of the Moomi δ18Occ record is strongly correlated with the Greenland ice cores, suggesting a possible Atlantic driver of these monsoonal shifts [59]. The LGM is dated in the record as occurring circa 23–22 ka BP, which is interpreted as an arid period with pronounced decrease in precipitation over the Island. After the LGM there is an increase in rainfall, as deduced from a trend towards more negative δ18Occ values, that is similar but more gradual than the trend seen in the Soreq Cave composite (Figure 4). The post-LGM warming and wetting trend is interrupted by the warm/dry H1 event (~16.4 ka BP), followed by the wet Bølling-Allerød event (14.5 ka BP) and then the dry YD (12.9–11.7 ka BP [130]) (Figure 4). The entity terminates soon after the commencement of the Holocene (dated to 11.4 ka BP), when a sharp decrease in δ18Occ, interpreted as an increase in monsoonal rainfall is observed. The Levant records (Soreq, Jerusalem West and Ma’ale Efrayim) do not show a concomitant abrupt change of ~30 years transition from YD to the Holocene.

4.3. Holocene Climatic Events and Spatial Heterogeneity across the Middle East

When interpreting the post-YD, early Holocene time-series, we note that although there is still an effect of changes in source δ18O (seen in the planktonic curves of the EM Sea, Figure 6E), this is not as significant as during deglaciation. Thus, in this work we follow the conviction which determines that the dominant driver of δ18Op variations is likely the “amount” effect [53,112]. The Holocene is characterized by a general trend towards increasing aridity in the ME region [46,49,51,57,61,66,70,132]. The wettest period in the EM, and the Levant in particular, occurred from ~10.8 to ~6.1 ka BP, coeval to the formation of Mediterranean Sapropel 1 and the African Humid Period (AHP) [68,133,134]. The entities from Jeita Cave (Figure 5A) show increasing precipitation during the early Holocene (from 12 to 10 ka BP) and wet conditions between ~10 to ~7 ka BP with peak precipitation amounts at ~8.5 ka BP. Between 7.5 and 6.5 ka BP, the δ18Occ time-series from Jeita Cave indicates progressively decreasing precipitation amounts until 5 ka BP. Late Holocene δ18Occ values in these entities reveal a generally dry period that is interrupted by shorter and longer wet-periods, e.g., from 4.0 to 3.0 ka BP, when precipitation amounts were increased. The hydroclimate changes recorded by the speleothems at Jeita Cave are in general agreement with other speleothem δ18Occ time-series from the region, such as the speleothem records from Soreq Cave (Israel) [64] and Dim Cave (Turkey) [50] (Figure 5A). All these records indicate that the most arid conditions in the Holocene occurred after ~3.2 ka BP [54,58].
The only other record from the Levant that spans the entire Holocene is SO-1 from Sofular Cave (Figure 5A). This record shows increasing δ18Occ values during the early- and mid-Holocene, until ~6 ka BP. However, compared to other records from the EM, long-term δ18Occ trends in SO-1 are not related to variations in precipitation amounts, but instead reflect changes in the mean δ18O value of the Black Sea, which is the main moisture source for this site, rather than the EM Sea [61,62]. Therefore, while periodic coupling of the Mediterranean and Black Sea system can be observed in the regional records, it is difficult to directly link long-term δ18Occ changes in SO-1 to δ18Occ variations from EM speleothems [62]. Only one speleothem record from Eastern Europe, Ascunsa Cave (Romania), shows similar long-term trends similar to SO-1 (Figure 5A), likely reflecting also δ18O changes of the Black Sea [46].
For the last 2 kyr, entities from Sofular Cave, Kapsia Cave, Mavri Trypa Cave, Soreq Cave, Jeita Cave, Qunf Cave and Defore Cave are available (Figure 6). From these records, only SO-1 (Sofular Cave) covers the entire period at 1 to 50-year resolution. The seasonally resolved Soreq entity 2–6, which was generated using Secondary Ion Mass Spectrometry (SIMS) [14,71], has more negative δ18Occ values compared to the δ18Occ of the Soreq composite record and the SIMS time-series variability is much higher. This is possibly related to the SIMS-sampling methodology, which targets multiple analyses in a single ~50–100 µm thick annual band, which emphasizes the bias toward the negative winter values (~ −2.15‰ offset) [14]. The Soreq 2–6 δ18Occ indicates a steep drying trend from 2.0 to 1.8 ka BP that is not observed in the other δ18Occ time-series from the EM (Figure 5B), probably due to the relatively low temporal resolution of the other records, which are able to resolve only pronounced changes in δ18Occ. Lechleitner et al. [135], find the opposite trend in their stacked records of Western Europe speleothem records. The finer climate variations during the Medieval Climate Anomaly (MCA) and the Late Antique Little Ice Age (LALIA) [131] are only identifiable in Soreq 2–6. The Little Ice Age (LIA) is recorded by the EM coastline entities (mainly Jeita Cave) and the record from Defore Cave (Figure 5B) with a positive excursion, that is again opposite to the observation from the Western European stack [135].
The comparison between the AP and the Levant over the past 2000 years is limited by the overlap of the entities that are available. The transition from the LALIA to the MCA is characterized by variable δ18Occ values in Soreq 2–6. At the beginning of the LALIA δ18Occ values are the most negative measured in Soreq 2–6, indicating a generally wet conditions in the Southern Levant (consistent with the Soreq composite record). By contrast, δ18Occ values are more positive at the end of the LALIA, indicating dryer conditions in the transition period from the LALIA to the MCA. At the MCA, precipitation amounts increased again in the EM. This is indicated by the negative trend in δ18Occ values in Soreq 2–6 [14,53,136]. During the MCA, δ18Occ changes in the Qunf record and in Soreq 2–6 are anti-correlated, suggesting opposite precipitation variations at the southern tip of the AP and in the EM, to be considered further when additional high-resolution entities become available.
Analyses of regional composites have yielded useful results in the study of the Holocene [32,35] and the past 2000 years [45,137,138], because they mitigate the effect of age uncertainties and focus on detectable climate variability. Here we construct a composite of Holocene ME speleothem records (Figure 6E) and compare them with reconstructions of solar and volcanic activity, respectively (Figure 6A), the sum of glacier advances as well as cold and dry periods [32] (Figure 6B). The ME composite was produced as follows: first, data from each of the reconstructions were averaged into bins (at 25-year and 200-year intervals); second, each binned series was normalized. The normalized anomalies are visualized as boxes that are connected with a 3-point running average of 25-year bin means (Figure 6D). The same process is applied to Greenland ice cores [139] (Figure 6C). EM planktonic δ18Occ profiles are also shown in order to highlight the source vapor isotopic variability, if recorded [64,109,140] (Figure 6E).
Rapid, prominent events observed in both continental and marine palaeo-archives during glacial periods are also evident during the Holocene, although less pronounced. This persistent rapid variability is suggested to be in response to an internal rhythmic throbbing of the climatic system at centennial scales [141]. In the scope of this review, three reference Holocene events are reviewed: ca. 8200 years BP (referred to here as the 8.2 ka event), ca. 4200 years BP (4.2 ka event) and ca. 700 years BP (0.7 ka or LIA). These events are concomitant with major glacier advances in the Northern Hemisphere [32,142] (Figure 6B).
The base of the Holocene is defined in the North Greenland Ice Core Project’s NGRIP2 ice core, at 11,650 years BP [143]. The Early Holocene goes from the base to the 8.2 ka event [144], coeval with a final drainage of northern ice-dammed lakes causing a freshwater outburst into the North Atlantic [145] and the formation of Sapropel 1 in the Mediterranean [109,146]. The tail-end of Sapropel 1 in the EM (roughly 8.2 ka BP until a little after 7 ka BP) is seen in the normalized ME composite as trending toward more positive δ18Occ values, the result of superposition of a general drying trend [109] and the enrichment trend of sea surface water δ18O (Figure 6E). The normalized ME speleothem composite during this period displays the highest variability (i.e., the difference 25–75% percentiles) observed for the entire 12 kyr time-series (Figure 6D). This high variability indicates disagreement between the time-series of the various entities, hence increased regional heterogeneity. Sapropels are recorded in marine sediments due to a change either in the flux of organic matter to the sea floor from productivity changes or in preservation by low oxygen levels in bottom-waters [147,148]. Factors such as monsoon intensification, increased runoff from North Africa into the Mediterranean Sea and preconditioning due to meltwater events/sea-level rise are potential factors leading to sapropels [109,146]. In addition, the particular geomorphology and hydrology of the Mediterranean basin favours their deposition [147].
The 8.2k event marks the mid-point of Sapropel 1–a generally humid period in the ME–and is indicated by a rapid positive anomaly in most ME entities (interpreted as cold/dry) (Figure 6C–E). The 25-year bin line of the normalized ME composite analysis does not indicate a pronounced 8.2 ka event, while the 200-year bin box highlight it as an interruption of this generally humid period, with distinct heterogeneity in the records (Figure 6D). In the marine sediment δ18O record (Figure 6E), the 8.2 ka event is not as dominant as in other marine proxies [146], but Sapropel 1 appears as a negative ‘hump’ in the δ18O time-series, where peak negative values are in agreement with the 8.2 ka event as well as cold reversal consistent in the North Atlantic context (Figure 6B,C) [32,149,150]. The 8.2 ka event is recorded in multiple records as a pronounced cold temperatures lasting ca. 160 years (Greenland, Figure 6C), together with a decreased snow-accumulation rate [151]. The 8.2 ka event is preceded by a remarkable minimum in solar activity [152] and an increase in the magnitude and frequency of volcanic eruptions [139] (Figure 6A). The Dead Sea level was sustained at low during the 8.2 ka event, which would suggest anomalously low rainfall intensities [153]. Thus, the 8.2 ka event is placed within a distinct cooling of the Aegean-Levantine regions from 8.6 to 8.0 ka BP, when African monsoon indicators suggest a change from an increased moisture availability to a decline towards a modern-type aridity reached at around 6 to 5.5 ka BP (Rohling et al. [142] and references therein) with a discontinuously wet and vegetated Sahara [154,155,156]. In the Levant, this behaviour of the ITCZ (African and Indian monsoon driver) could explain why the 8.2 ka event results in differentiated records across the ME region. In the Levant, the 8.2 ka event is suggested to be coeval with Neolithic revolution traits (e.g., the transition from the Pre-Pottery to the Pottery period) [157].
The 4.2 ka event is one of several decadal to centennial scale, regional to global, Rapid Climate Change (RCC) events that characterize the mid to late -Holocene [30,158]. The 4.2 ka marks the transition into the late-Holocene and is generally considered as a cold drought event, between ~4.2 and ~3.8 ka. The drought event lead to considerable environmental stress, most notably in Mediterranean and Levant societies, with cultural changes and settlement abandonment are seen from the Near East to Northern Mesopotamia as part of the end-phases of the Bronze age [28,159,160,161]. Although the 4.2 ka is a widely studied event, identifiable in multiple records and proxies, there is still considerable debate regarding the timing, nature and drivers of the event (or 4.2 to ~3.8 cycle) [28,158]. Thus, the SISAL entities timing if the event is also not as straight forward and ubiquitous. Comparing the δ18Occ time-series of Soreq Cave to that of Jeita Cave, there is a close to centennial offset between the positive δ18Occ excursion found in the Soreq composite (~4.2 ka), and the positive shift in Jeita Cave δ18Occ (Figure 5A). The Soreq δ18Occ excursion is superimposed on a prolonged drying trend starting circa 4.8 ka, when in contrast during the Soreq 4.2 ka itself, Jeita Cave expressed a rapid negative δ18Occ excursion, commonly regarded as a wet condition (which Cheng et al., interpret to last until 2.9 ka [53]). The offset between the caves could also be a naturally occurring time transgressive phenomena, similar termination of the African Humid Period which progressed from north to south, following a gradual reduction in monsoon rainfall [162,163]. Inconsistencies between the Jeita and Soreq records have been suggested to be consistent with the progressive southward decrease in the regional humidity [53]. With the offset in mind, both caves appear to produce a close to W-shape event, with cold-warm/dry-wet episodes lasting decades to centuries, rather than a major single event (Figure 5A). This is in agreement with observation from Skala Marion Cave [164] and highlighted in regional multi-record compilations, such as a Dead Sea level drop lasting close to five centuries [153,158,165]. In this regard, the ME composite suggests that circa 3.8 ka marks the culmination of the observed gradual increase in aridity starting after the termination of Sapropel 1 (Figure 6D). The period between ~4.8 and ~4.0 ka has minor spatial heterogeneity which can be indicative of a less regionally unique event, weaker than the previous one circa 5.6 ka. However, as there is a gap in SISAL_v1 AP records for the duration of the event/cycle and the available records have much lower resolution for this specific time period [28], we would recommend additional records to be included in the ME composite before any significant conclusions be drawn for this climate period.
The Little Ice Age (LIA) is the most recent climate anomaly of the Late Holocene and had strong impacts on European societies [166,167]. Greenland ice cores show the coldest individual bins of the past 2000 years during this period and a similar pattern is observed for EM marine profiles (Figure 6C–E). Over the past 2 kyrs, the ME composite (Figure 6D) shows a high variability (i.e., the difference 25–75% percentiles), as regional heterogeneity intensifies around what seem to be the coldest periods in the North Atlantic since the early Holocene [32]. Unlike the previous cold events reviewed (8.2 ka and 4.2 ka), the LIA shows a tendency towards more moisture availability, consistent with higher lake-levels at the Dead Sea [153]. Forcing simulations suggest that this pattern is consistent with a global cooling trend arising from an increased frequency of volcanic activity and/or land use change [137] (Figure 6B). Studies in the North Atlantic show year-to-year variability during the Little Ice Age: severe droughts, floods, intense storm activity during late summer-early autumn, cold/heat waves that showed significant spatio-temporal variation and exceptional wintertime conditions, with sea ice expansion and reduced northward heat transport by the subpolar gyre [168,169,170]. In the Levant, the onset of the Little Ice Age coincides with the end of the Crusades and reinforcement of the Mamluk sultanate and Ottoman empire, between the 14th and early 20th centuries [161], similar to the rise and subsequent fall of the Roman rule over the Levant during the “Roman Humid Period” [14].

5. Conclusions and Future of SISAL Project in the Middle East

5.1. Emphasis for Future Speleothem Research in the Middle East

The main goal for future speleothem research in the Middle East (ME) would be to increase spatial coverage in the region (Figure 1, Table 1), specifically in the Fertile Crescent (FC), Arabian Peninsula (AP) and Saharan belt (Egypt, Negev) sub-regions where current site density is considerably lower than the Levant. Efforts in these environments are specifically important as the spatial distribution of carbonate bedrock is not continuous so without regional continuity, improved entity density would improve regional analysis coherency.
Additionally, emphasis should be placed on including additional entities to increase the temporal coverage and generate longer time-series from the region as most of the records cover only the last 40–30 kyr (Figure 3B). This should be done in tandem with application of high temporal-resolution analysis methodologies (conventional and novel) to increase the resolution of the available geological paleorecords (see Figure 3C) and allow detection of changes in seasonality [14,31] and decadal scale variations [28,48]. This will enable future studies to conduct more accurate coherence regional investigations to reveal coherent and robust climate variations over longer time periods, including glacial-interglacial cycles in the Pleistocene.
Achieving these goals will allow SISAL based studies could better constrain teleconnections amongst the hydroclimate of remote regions such as Northern Africa, the Levant and the FC, which should all be influenced by Mediterranean cyclones and ITCZ migration, as the spatial scale of the ITCZ migration and the overall effect it might have had on rainfall amount in the Southern AP is still debated [173] and a regional compilation incorporating crucial missing records to the SISAL database will enable us to shed light on this topic. Furthermore, considering the location of the Levant at the border between the tropical Hadley cell and the mid-latitude Ferrel cell, hydroclimate change in this region is supposed to be very sensitive to shifts in the Hadley-Ferrel-cell border, which should be ultimately imprinted in the speleothem palaeoclimate record. Hence, future speleothem-based reconstructions and synthesis of past hydroclimate changes from North Africa, the Levant and the FC will allow testing of theoretical concepts on how the Hadley-Ferrel-cell border shifts in response to changes in insolation [174].
The ability to simulate the rhythm of climate variability and specific events (such as sapropels, the 8.2 ka or 4.2 ka events and the LIA) depends on the availability of high-quality databases, with high enough temporal resolution to make relevant inferences from a human perspective. In this regard, completion of the above-mentioned information will help in answering challenging questions and in understanding future changes to water limited environments.
Though this work does not review the carbon isotope climate proxy (δ13C), it should be noted that the δ18O record is often ‘noisy’ in fast growing speleothems which provide high-resolution Holocene records, as it reflects seasonal and annual variations in δ18O, while the δ13C record is less sensitive to such short time-scale variations and reflects variations in the soil CO2 composition, which can be used to identify and characterize Holocene centennial and millennial climate variability [28].

5.2. The Importance of Fertile Crescent Speleothem Data

The publication of more speleothem-based proxy records from the FC is a priority in palaeoclimate research for several reasons. First, additional FC entities would make it easier to establish the role of the Siberian High and Indian Summer Monsoon in the regional palaeo-hydrology. Whereas there is no influence from the ISM on precipitation in the modern-day FC, it has been theorized that in the early Holocene (and before) the picture was more complicated–the FC received rainfall more evenly from two sources instead of the simple single-sourced nature of precipitation today [175], SISAL records could help researching this question.
Second, the late Holocene δ18Occ records from the FC reflect winter-spring precipitation, the main hydrological season, while records such as lake sediments, pollen and tree-rings often reflect annual precipitation, summer precipitation or temperature changes. They can also suffer from other inadequacies such as lacking the required temporal resolution, not covering the researched period, or suffering from considerable chronological uncertainties [175]. These problems are especially limiting when using palaeoclimate proxies in archaeological discussions, as tying climatic events to specific human developments requires maximum chronological precision and precipitation during the growing period (spring) will be most important for human flourishing. Seeing the FC as one of the most important regions worldwide for human development, producing highly-resolved and accurately-dated speleothem records is of vital concern. Here we identified five sites in the FC, from Turkey, Iran and Iraq. The entities from these publications have already contributed to the understanding of the prevailing continental climatic conditions over the Holocene and as far back as 500 ka BP. Increasing the number of datasets available in SISAL would provide an important tool for answering the questions raised in this section.

5.3. SISAL Outlook for the Middle East

As Table 1 suggests, there is an excellent opportunity to include more records from the ME in the SISAL database. This would allow the application of statistical analyses, e.g., standardization techniques to synthesize common trends in the stable isotope time-series [137] or coherence analysis using Monte Carlo Principal Component Analyses (MC-PCA) [35]. Such analyses will enable better constraints on the relationships between different archives such as between the speleothem hydroclimate records and reconstructed SSTs. It would also allow the identification of common modes of hydroclimate variability and better insights into the climate dynamics/mechanisms and its forcing. Coherence analyses could also be extended to incorporate Western Mediterranean as well as European stable isotope time-series, and validate the teleconnection between hydroclimate changes that also depend on mid-latitude cyclones [176,177,178].

Author Contributions

Y.B. designed the concept of this study and led the synthesis and writing of this manuscript with support of all co-authors; Y.B., B.M., J.F.L., M.D. extracted, collated and evaluated the data and performed statistical analyses; Y.B., B.M., E.I., M.A.L., M.D. worked on the design and visualization of the figures; Y.B., B.M., M.J.J., M.D. worked on editing the text and all authors reviewed the manuscript.

Funding

Y.B. acknowledges support of FFB grant #3-323/4532211. B.M. acknowledges support from the CSIC Ramón y Cajal postdoctoral programme RYC-2013-14073. M.A.L. acknowledges support from the Ministry of Science and Technology (MOST), Taiwan (107-2119-M-002-051). M.D. acknowledges funding by the German Research Foundation (DFG) grant DE 2398/3-1.

Acknowledgments

The SISAL is a working group of the Past Global Changes (PAGES) programme and we thank PAGES for their support of this activity. We thank Laia Comas-Bru for assistance in Figure 1, sharing and producing Figure 3. The authors thank the members of the World Karst Aquifer Mapping project for providing the carbonate aquifer maps used by in for Figure 1. We are grateful to Sandy Harrison and Laia Comas Bru for their editorial handling of the manuscript and endless patience. We also wish to thank Andrea Columbu and three anonymous reviewers for their support and suggestions. The authors offer the secret speleo handshake to Andy Baker donated of his time to review this work and share his insight on water-limited environments. Assistant Editor Mark Guo for his time and kind help in publishing this manuscript. Y.B. wishes to thank Kerstin Braun and Zoltán Kern for coordination in preparation of the African and Eastern European review papers included in this special issue [43,44], and Miryam Bar-Matthews for her support in the SISAL Middle East team efforts to advance the input of regional datasets into SISAL.

Conflicts of Interest

The authors declare no conflict of interest. The funders had no role in the design of the study; in the collection, analyses, or interpretation of data; in the writing of the manuscript, or in the decision to publish the results.

References

  1. Katrantsiotis, C.; Kylander, M.E.; Smittenberg, R.; Yamoah, K.K.A.; Hättestrand, M.; Avramidis, P.; Strandberg, N.A.; Norström, E. Eastern Mediterranean hydroclimate reconstruction over the last 3600 years based on sedimentary n-alkanes, their carbon and hydrogen isotope composition and XRF data from the Gialova Lagoon, SW Greece. Quat. Sci. Rev. 2018, 194, 77–93. [Google Scholar] [CrossRef]
  2. Lionello, P.; Abrantes, F.; Congedi, L.; Dulac, F.; Gacic, M.; Gomis, D.; Goodess, C.; Hoff, H.; Kutiel, H.; Luterbacher, J.; et al. Introduction: Mediterranean Climate – Background Information. In The Climate of the Mediterranean Region: From The Past to the Future; Lionello, P., Ed.; Elsevier: London, UK, 2012. [Google Scholar]
  3. Giorgi, F. Climate change hot-spots. Geophys. Res. Lett. 2006, 33, 1–4. [Google Scholar] [CrossRef]
  4. Giorgi, F.; Lionello, P. Climate change projections for the Mediterranean region. Glob. Planet. Chang. 2008, 63, 90–104. [Google Scholar] [CrossRef]
  5. Lionello, P.; Scarascia, L. The relation between climate change in the Mediterranean region and global warming. Reg. Environ. Chang. 2018, 18, 1481–1493. [Google Scholar] [CrossRef]
  6. Vaks, A.; Bar-Matthews, M.; Ayalon, A.; Matthews, A.; Halicz, L.; Frumkin, A. Desert speleothems reveal climatic window for African exodus of early modern humans. Geology 2007, 35, 831. [Google Scholar] [CrossRef]
  7. Rosen, A.M. Civilizing Climate: Social Responses to Climate Change in the Ancient Near East; Altamira Press: Plymouth, UK, 2007; ISBN 978-07591-0494-5. [Google Scholar]
  8. Berger, J.F.; Lespez, L.; Kuzucuoğlu, C.; Glais, A.; Hourani, F.; Barra, A.; Guilaine, J. Interactions between climate change and human activities during the Early to Mid Holocene in the East Mediterranean basins. Clim. Past 2016, 12, 1847–1877. [Google Scholar]
  9. Schilman, B.; Bar-Matthews, M.; Almogi-Labin, A.; Luz, B. Global climate instability reflected by Eastern Mediterranean marine records during the late Holocene. Palaeogeogr. Palaeoclimatol. Palaeoecol. 2001, 176, 157–176. [Google Scholar] [CrossRef]
  10. Langgut, D.; Almogi-Labin, A.; Bar-Matthews, M.; Pickarski, N.; Weinstein-Evron, M. Evidence for a humid interval at ∼56–44 ka in the Levant and its potential link to modern humans dispersal out of Africa. J. Hum. Evol. 2018, 124, 75–90. [Google Scholar] [CrossRef]
  11. Brierley, C.M.; Manning, K.; Maslin, M. Pastoralism may have delayed the end of the green Sahara. Nat. Commun. 2018, 9, 4018. [Google Scholar] [CrossRef] [PubMed]
  12. Weiss, H.; Bradley, R.S. What drives societal collapse? Science 2001, 291, 609–610. [Google Scholar] [CrossRef]
  13. Bar-Matthews, M.; Ayalon, A. Climatic Conditions in the Eastern Mediterranean During the Last Glacial (60–10 ky) and Their Relations to the Upper Palaeolithic in the Levant as inferred from Oxygen and Carbon Isotope Systematics of Cave Deposits. In More Than Meets the Eye: Studies on Upper Palaeolithic Diversity in the Near East; Goring-Morris, N.A., Belfer-Cohen, A., Eds.; Oxbow: Oxford, UK, 2003; pp. 13–18. [Google Scholar]
  14. Orland, I.J.; Bar-Matthews, M.; Kita, N.T.; Ayalon, A.; Matthews, A.; Valley, J.W. Climate deterioration in the Eastern Mediterranean as revealed by ion microprobe analysis of a speleothem that grew from 2.2 to 0.9 ka in Soreq Cave, Israel. Quat. Res. 2009, 71, 27–35. [Google Scholar] [CrossRef]
  15. Rosenberg, T.M.; Preusser, F.; Fleitmann, D.; Schwalb, A.; Penkman, K.E.H.; Schmid, T.W.; Al-Shanti, M.A.; Kadi, K.; Matter, A. Humid periods in southern Arabia: Windows of opportunity for modern human dispersal. Geology 2011, 39, 1115–1118. [Google Scholar] [CrossRef]
  16. Fleitmann, D.; Burns, S.J.; Pekala, M.; Mangini, A.; Al-Subbary, A.A.; Al-Aowah, M.; Kramers, J.; Matter, A. Holocene and Pleistocene pluvial periods in Yemen, southern Arabia. Quat. Sci. Rev. 2011, 30, 783–787. [Google Scholar] [CrossRef]
  17. Vaks, A.; Woodhead, J.D.; Bar-Matthews, M.; Ayalon, A.; Cliff, R.A.; Zilberman, T.; Matthews, A.; Frumkin, A. Pliocene–Pleistocene climate of the northern margin of Saharan–Arabian Desert recorded in speleothems from the Negev Desert, Israel. Earth Planet. Sci. Lett. 2013, 368, 88–100. [Google Scholar] [CrossRef]
  18. Vaks, A.; Bar-Matthews, M.; Ayalon, A.; Schilman, B.; Gilmour, M.A.; Hawkesworth, C.J.; Frumkin, A.; Kaufman, A.; Matthews, A. Paleoclimate reconstruction based on the timing of speleothem growth and oxygen and carbon isotope composition in a cave located in the rain shadow in Israel. Quat. Res. 2003, 59, 182–193. [Google Scholar] [CrossRef]
  19. Rosenberg, T.M.; Preusser, F.; Risberg, J.; Plikk, A.; Kadi, K.A.; Matter, A.; Fleitmann, D. Middle and Late Pleistocene humid periods recorded in palaeolake deposits of the Nafud desert, Saudi Arabia. Quat. Sci. Rev. 2013, 70, 109–123. [Google Scholar] [CrossRef]
  20. Drake, N.A.; Breeze, P.; Parker, A. Palaeoclimate in the Saharan and Arabian Deserts during the Middle Palaeolithic and the potential for hominin dispersals. Quat. Int. 2013, 300, 48–61. [Google Scholar] [CrossRef]
  21. Weisdorf, J.L. From Foraging To Farming: Explaining The Neolithic Revolution. J. Econ. Surv. 2005, 19, 561–586. [Google Scholar] [CrossRef]
  22. Lev-Yadun, S.; Gopher, A.; Abbo, S. The Cradle of Agriculture. Science 2000, 288, 1602 LP-1603. [Google Scholar] [CrossRef] [PubMed]
  23. Kislev, M.E.; Hartmann, A.; Bar-Yosef, O. Early domesticated fig in the Jordan Valley. Science 2006, 312, 1372–1374. [Google Scholar] [CrossRef] [PubMed]
  24. Tanno, K.I.; Willcox, G. How fast was wild wheat domesticated? Science 2006, 311, 1886. [Google Scholar] [CrossRef] [PubMed]
  25. Zohary, D.; Hopf, M. Domestication of Pulses in the Old World: Legumes were companions of wheat and barley when agriculture began in the Near East. Science 1973, 182, 887–894. [Google Scholar] [CrossRef] [PubMed]
  26. Liverani, M. The Ancient Near East: History, Society and Economy; Routledge: New York, NY, USA, 2014. [Google Scholar]
  27. Mellaart, J. The Neolithic of the Near East; Scribner’s: New York, NY, USA, 1975; ISBN 0-684-14484-0. [Google Scholar]
  28. Bar-Matthews, M.; Ayalon, A. Mid-Holocene climate variations revealed by high-resolution speleothem records from Soreq Cave, Israel and their correlation with cultural changes. Holocene 2011, 21, 163–171. [Google Scholar] [CrossRef]
  29. Flohr, P.; Fleitmann, D.; Zorita, E.; Sadekov, A.; Cheng, H.; Bosomworth, M.; Edwards, R.L.; Matthews, W.; Matthews, R. Late Holocene droughts in the Fertile Crescent recorded in a speleothem from northern Iraq. Geophys. Res. Lett. 2017, 44, 1528–1536. [Google Scholar] [CrossRef]
  30. Mayewski, P.A.; Rohling, E.J.; Curt Stager, J.; Karlén, W.; Maasch, K.A.; David Meeker, L.; Meyerson, E.A.; Gasse, F.; Van Kreveld, S.; Holmgren, K.; et al. Holocene climate variability. Quat. Res. 2004, 62, 243–255. [Google Scholar] [CrossRef]
  31. Orland, I.J.; Bar-Matthews, M.; Ayalon, A.; Matthews, A.; Kozdon, R.; Ushikubo, T.; Valley, J.W. Seasonal resolution of Eastern Mediterranean climate change since 34ka from a Soreq Cave speleothem. Geochim. Cosmochim. Acta 2012, 89, 240–255. [Google Scholar] [CrossRef]
  32. Wanner, H.; Solomina, O.; Grosjean, M.; Ritz, S.P.; Jetel, M. Structure and origin of Holocene cold events. Quat. Sci. Rev. 2011, 30, 3109–3123. [Google Scholar] [CrossRef]
  33. Kelley, C.P.; Mohtadi, S.; Cane, M.A.; Seager, R.; Kushnir, Y. Climate change in the Fertile Crescent and implications of the recent Syrian drought. Proc. Natl. Acad. Sci. USA 2015, 112, 3241–3246. [Google Scholar] [CrossRef]
  34. Trigo, R.M.; Gouveia, C.M.; Barriopedro, D. The intense 2007-2009 drought in the Fertile Crescent: Impacts and associated atmospheric circulation. Agric. For. Meteorol. 2010, 150, 1245–1257. [Google Scholar] [CrossRef]
  35. Deininger, M.; McDermott, F.; Mudelsee, M.; Werner, M.; Frank, N.; Mangini, A. Coherency of late Holocene European speleothem δ18O records linked to North Atlantic Ocean circulation. Clim. Dyn. 2017, 49, 595–618. [Google Scholar] [CrossRef]
  36. Atsawawaranunt, K.; Comas-Bru, L.; Amirnezhad Mozhdehi, S.; Deininger, M.; Harrison, S.P.; Baker, A.; Boyd, M.; Kaushal, N.; Masood Ahmad, S.; Ait Brahim, Y.; et al. The SISAL database: A global resource to document oxygen and carbon isotope records from speleothems. Earth Syst. Sci. Data 2018, 10, 1687–1713. [Google Scholar] [CrossRef]
  37. Comas-Bru, L.; Harrison, S.P. SISAL: Bringing Added Value to Speleothem Research. Quaternary 2019, 2, 7. [Google Scholar] [CrossRef]
  38. Baker, A.; Smith, C.L.; Jex, C.N.; Fairchild, I.J.; Genty, D.; Fuller, L. Annually Laminated Speleothems: A Review. Int. J. Speleol. 2008, 37, 193–206. [Google Scholar] [CrossRef]
  39. Fairchild, I.J.; Baker, A. Speleothem Science: From Process to Past Environments; John Wiley & Sons: New York, NY, USA, 2012; Volume 3, ISBN 9781444361094. [Google Scholar]
  40. Orland, I.J.; Burstyn, Y.; Bar-Matthews, M.; Kozdon, R.; Ayalon, A.; Matthews, A.; Valley, J.W. Seasonal climate signals (1990–2008) in a modern Soreq Cave stalagmite as revealed by high-resolution geochemical analysis. Chem. Geol. 2014, 363, 322–333. [Google Scholar] [CrossRef]
  41. Burstyn, Y. Multi-decade to Seasonal Climate Change Recorded by Stable Isotope and Trace Element Variability in Modern Cave-waters and Calcite of Soreq Cave, Israel; Geological Survey of Israel: Jerusalem, Israel, 2013. [Google Scholar]
  42. Chen, Z.; Auler, A.S.; Bakalowicz, M.; Drew, D.; Griger, F.; Hartmann, J.; Jiang, G.; Moosdorf, N.; Richts, A.; Stevanovic, Z.; et al. The World Karst Aquifer Mapping project: concept, mapping procedure and map of Europe. Hydrogeol. J. 2017, 25, 771–785. [Google Scholar] [CrossRef]
  43. Braun, K.; Nehme, C.; Pickering, R.; Rogerson, M.; Scroxton, N. A Window into Africa’s Past Hydroclimates: The SISAL_v1 Database Contribution. Quaternary 2019, 2, 4. [Google Scholar] [CrossRef]
  44. Kern, Z.; Demény, A.; Hatvani, I.G. Speleothem stable isotope records from Eastern Europe & Turkey. Preprints 2018, 2018120038. [Google Scholar] [CrossRef]
  45. Emile-Geay, J.; McKay, N.P.; Kaufman, D.S.; von Gunten, L.; Wang, J.; Anchukaitis, K.J.; Abram, N.J.; Addison, J.A.; Curran, M.A.J.; Evans, M.N.; et al. A global multiproxy database for temperature reconstructions of the Common Era. Sci. Data 2017, 4, 170088. [Google Scholar] [CrossRef]
  46. Drǎguşin, V.; Staubwasser, M.; Hoffmann, D.L.; Ersek, V.; Onac, B.P.; Veres, D. Constraining Holocene hydrological changes in the Carpathian-Balkan region using speleothem δ18O and pollen-based temperature reconstructions. Clim. Past 2014, 10, 1363–1380. [Google Scholar] [CrossRef]
  47. Kacanski, A.; Carmi, I.; Shemesh, A.; Kronfeld, J.; Yam, R.; Flexer, A. Late Holocene Climatic Change in the Balkans: Speleothem Isotopic Data from Serbia. Radiocarbon 2001, 43, 647–658. [Google Scholar] [CrossRef]
  48. Burns, S.J.; Fleitmann, D.; Mudelsee, M.; Neff, U.; Matter, A.; Mangini, A. A 780-year annually resolved record of Indian Ocean monsoon precipitation from a speleothem from south Oman. J. Geophys. Res. 2002, 107, ACL-9. [Google Scholar] [CrossRef]
  49. Fleitmann, D.; Burns, S.J.; Mangini, A.; Mudelsee, M.; Kramers, J.; Villa, I.; Neff, U.; Al-Subbary, A.A.; Buettner, A.; Hippler, D.; et al. Holocene ITCZ and Indian monsoon dynamics recorded in stalagmites from Oman and Yemen (Socotra). Quat. Sci. Rev. 2007, 26, 170–188. [Google Scholar] [CrossRef]
  50. Ünal-Imer, E.; Shulmeister, J.; Zhao, J.X.; Tonguç Uysal, I.; Feng, Y.-X.; Duc Nguyen, A.; Yüce, G. An 80 kyr-long continuous speleothem record from Dim Cave, SW Turkey with paleoclimatic implications for the Eastern Mediterranean. Sci. Rep. 2015, 5, 1–9. [Google Scholar]
  51. Neff, U.; Burns, S.J.; Mangini, A.; Mudelsee, M.; Fleitmann, D.; Matter, A. Strong coherence between solar variability and the monsoon in Oman between 9 and 6 kyr ago. Nature 2001, 411, 290–293. [Google Scholar] [CrossRef]
  52. Burns, S.J.; Fleitmann, D.; Matter, A.; Neff, U.; Mangini, A. Speleothem evidence from Oman for continental pluvial events during interglacial periods. Geology 2001, 29, 623–626. [Google Scholar] [CrossRef]
  53. Cheng, H.; Sinha, A.; Verheyden, S.; Nader, F.H.; Li, X.L.; Zhang, P.-Z.; Yin, J.J.; Yi, L.; Peng, Y.B.; Rao, Z.G.; et al. The climate variability in northern Levant over the past 20,000 years. Geophys. Res. Lett. 2015, 42, 8641–8650. [Google Scholar] [CrossRef]
  54. Verheyden, S.; Nader, F.H.; Cheng, H.; Edwards, R.L.; Swennen, R. Paleoclimate reconstruction in the Levant region from the geochemistry of a Holocene stalagmite from the Jeita cave, Lebanon. Quat. Res. 2008, 70, 368–381. [Google Scholar] [CrossRef]
  55. Frumkin, A.; Ford, D.C.; Schwarcz, H.P. Continental Oxygen Isotopic Record of the Last 170,000 Years in Jerusalem. Quat. Res. 1999, 51, 317–327. [Google Scholar] [CrossRef]
  56. Nehme, C.; Verheyden, S.; Noble, S.R.; Farrant, A.R.; Sahy, D.; Hellstrom, J.C.; Delannoy, J.J.; Claeys, P. Reconstruction of MIS 5 climate in the central Levant using a stalagmite from Kanaan Cave, Lebanon. Clim. Past 2015, 11, 1785–1799. [Google Scholar] [CrossRef]
  57. Finné, M.; Bar-Matthews, M.; Holmgren, K.; Sundqvist, H.S.; Liakopoulos, I.; Zhang, Q. Speleothem evidence for late Holocene climate variability and floods in Southern Greece. Quat. Res. 2014, 81, 213–227. [Google Scholar] [CrossRef]
  58. Finné, M.; Holmgren, K.; Shen, C.C.; Hu, H.M.; Boyd, M.; Stocker, S. Late bronze age climate change and the destruction of the mycenaean palace of nestor at pylos. PLoS ONE 2017, 12, 1–18. [Google Scholar]
  59. Shakun, J.D.; Burns, S.J.; Fleitmann, D.; Kramers, J.; Matter, A.; Al-Subary, A.A. A high-resolution, absolute-dated deglacial speleothem record of Indian Ocean climate from Socotra Island, Yemen. Earth Planet. Sci. Lett. 2007, 259, 442–456. [Google Scholar] [CrossRef]
  60. Psomiadis, D.; Dotsika, E.; Albanakis, K.; Ghaleb, B.; Hillaire-Marcel, C. Speleothem record of climatic changes in the northern Aegean region (Greece) from the Bronze Age to the collapse of the Roman Empire. Palaeogeogr. Palaeoclimatol. Palaeoecol. 2018, 489, 272–283. [Google Scholar] [CrossRef]
  61. Fleitmann, D.; Cheng, H.; Badertscher, S.; Edwards, R.L.; Mudelsee, M.; Göktürk, O.M.; Fankhauser, A.; Pickering, R.; Raible, C.C.; Matter, A.; et al. Timing and climatic impact of Greenland interstadials recorded in stalagmites from northern Turkey. Geophys. Res. Lett. 2009, 36, 1–5. [Google Scholar] [CrossRef]
  62. Göktürk, O.M.; Fleitmann, D.; Badertscher, S.; Cheng, H.; Edwards, R.L.; Leuenberger, M.; Fankhauser, A.; Tüysüz, O.; Kramers, J. Climate on the southern Black Sea coast during the Holocene: Implications from the Sofular Cave record. Quat. Sci. Rev. 2011, 30, 2433–2445. [Google Scholar] [CrossRef]
  63. Badertscher, S.; Fleitmann, D.; Cheng, H.; Edwards, R.L.; Göktürk, O.M.; Zumbühl, A.; Leuenberger, M.; Tüysüz, O. Pleistocene water intrusions from the Mediterranean and Caspian seas into the Black Sea. Nat. Geosci. 2011, 4, 236–239. [Google Scholar] [CrossRef]
  64. Grant, K.M.; Rohling, E.J.; Bar-Matthews, M.; Ayalon, A.; Medina-Elizalde, M.; Ramsey, C.B.; Satow, C.; Roberts, A.P. Rapid coupling between ice volume and polar temperature over the past 50,000 years. Nature 2012, 491, 744–747. [Google Scholar] [CrossRef]
  65. Bar-Matthews, M.; Ayalon, A.; Kaufman, A. Late Quaternary Paleoclimate in the Eastern Mediterranean Region from Stable Isotope Analysis of Speleothems at Soreq Cave, Israel. Quat. Res. 1997, 47, 155–168. [Google Scholar] [CrossRef]
  66. Bar-Matthews, M.; Ayalon, A.; Kaufman, A. Middle to Late Holocene (6500 Years Period) Paleoclimate in The Eastern Mediterranean Region From Stable Isotopic Composition Of Speleothems From Soreq Cave, Israel. Isot. Tech. Study Environ. Chang. 1998, 673–682. [Google Scholar]
  67. Bar-Matthews, M.; Ayalon, A.; Kaufman, A.; Wasserburg, G.J. The Eastern Mediterranean paleoclimate as a reflection of regional events: Soreq cave, Israel. Earth Planet. Sci. Lett. 1999, 166, 85–95. [Google Scholar] [CrossRef]
  68. Bar-Matthews, M.; Ayalon, A.; Kaufman, A. Timing and hydrological conditions of Sapropel events in the Eastern Mediterranean, as evident from speleothems, Soreq cave, Israel. Chem. Geol. 2000, 169, 145–156. [Google Scholar] [CrossRef]
  69. Ayalon, A.; Bar-Matthews, M.; Kaufman, A. Climatic conditions during marine oxygen isotope stage 6 in the eastern Mediterranean region from the isotopic composition of speleothems of Soreq Cave, Israel. Geology 2002, 30, 303–306. [Google Scholar] [CrossRef]
  70. Schilman, B.; Ayalon, A.; Bar-Matthews, M.; Kagan, E.J.; Almogi-Labin, A. Sea-land paleoclimate correlation in the Eastern Mediterranean region during the late Holocene. Israel J. Earth Sci. 2002, 51, 181–190. [Google Scholar] [CrossRef]
  71. Kolodny, Y.; Bar-Matthews, M.; Ayalon, A.; McKeegan, K.D. A high spatial resolution d18O profile of a speleothem using an ion-microprobe. Chem. Geol. 2003, 197, 21–28. [Google Scholar] [CrossRef]
  72. Bar-Matthews, M.; Ayalon, A.; Gilmour, M.A.; Matthews, A.; Hawkesworth, C.J. Sea–land oxygen isotopic relationships from planktonic foraminifera and speleothems in the Eastern Mediterranean region and their implication for paleorainfall during interglacial intervals. Geochim. Cosmochim. Acta 2003, 67, 3181–3199. [Google Scholar] [CrossRef]
  73. Vaks, A.; Bar-Matthews, M.; Matthews, A.; Ayalon, A.; Frumkin, A. Middle-Late Quaternary paleoclimate of northern margins of the Saharan-Arabian Desert: reconstruction from speleothems of Negev Desert, Israel. Quat. Sci. Rev. 2010, 29, 2647–2662. [Google Scholar] [CrossRef]
  74. Jex, C.N.; Baker, A.; Fairchild, I.J.; Eastwood, W.J.; Leng, M.J.; Sloane, H.J.; Thomas, L.; Bekaroğlu, E. Calibration of speleothem δ18O with instrumental climate records from Turkey. Glob. Planet. Chang. 2010, 71, 207–217. [Google Scholar] [CrossRef]
  75. Van Rampelbergh, M.; Fleitmann, D.; Verheyden, S.; Cheng, H.; Edwards, R.L.; De Geest, P.; De Vleeschouwer, D.; Burns, S.J.; Matter, A.; Claeys, P.; et al. Mid- to late Holocene Indian Ocean Monsoon variability recorded in four speleothems from Socotra Island, Yemen. Quat. Sci. Rev. 2013, 65, 129–142. [Google Scholar] [CrossRef]
  76. Carolin, S.A.; Walker, R.T.; Henderson, G.M.; Maxfield, L.; Ersek, V.; Sloan, A.; Talebian, M.; Fattahi, M.; Nezamdoust, J. Decadal-scale Climate Variability on the Central Iranian Plateau Spanning the So-called 4.2 ka BP Drought Event. In Proceedings of the 2015 AGU Fall Meeting, San Francisco, CA, USA, 14–18 December 2015; American Geophysical Union: Washington, DC, USA, 2015. [Google Scholar]
  77. Rowe, P.J.; Mason, J.E.; Andrews, J.E.; Marca, A.D.; Thomas, L.; Van Calsteren, P.; Jex, C.N.; Vonhof, H.B.; Al-Omari, S. Speleothem isotopic evidence of winter rainfall variability in northeast Turkey between 77 and 6 ka. Quat. Sci. Rev. 2012, 45, 60–72. [Google Scholar] [CrossRef]
  78. Mehterian, S.; Pourmand, A.; Sharifi, A.; Lahijani, H.A.K.; Naderi, M.; Swart, P.K. Reconstruction of Pleistocene Paleo-Hydrology and Climate Variations in Western Asia as Recorded in Speleothems from West-Central Iran. In Proceedings of the 2014 AGU Fall Meeting Abstracts Fall Meeting, San Francisco, CA, USA, 15–19 December 2014; American Geophysical Union: Washington, DC, USA, 2014. [Google Scholar]
  79. Vaks, A.; Bar-Matthews, M.; Ayalon, A.; Matthews, A.; Frumkin, A.; Dayan, U.; Halicz, L.; Almogi-Labin, A.; Schilman, B. Paleoclimate and location of the border between Mediterranean climate region and the Saharo–Arabian Desert as revealed by speleothems from the northern Negev Desert, Israel. Earth Planet. Sci. Lett. 2006, 249, 384–399. [Google Scholar] [CrossRef]
  80. Ayalon, A.; Bar-Matthews, M.; Frumkin, A.; Matthews, A. Last Glacial warm events on Mount Hermon: the southern extension of the Alpine karst range of the east Mediterranean. Quat. Sci. Rev. 2013, 59, 43–56. [Google Scholar] [CrossRef]
  81. Mehterian, S.; Pourmand, A.; Sharifi, A.; Lahijani, H.A.K.; Naderi, M.; Swart, P.K. Speleothem records of glacial/interglacial climate from Iran forewarn of future Water Availability in the interior of the Middle East. Quat. Sci. Rev. 2017, 164, 187–198. [Google Scholar] [CrossRef]
  82. Rifai, R.I. Reconstruction of the Middle Pleistocene climate of south Mediterranean using the Wadi Sannur speleothem, eastern Desert, Egypt. Carbonates Evaporites 2007, 22, 73–85. [Google Scholar] [CrossRef]
  83. Keinan, J. Paleo-Environment of the Northern Jordan Rift Region Based on Speleothems from Zalmon Cave. Master’s Thesis, Hebrew University of Jerusalem, Jerusalem, Israel, 2016. [Google Scholar]
  84. Trigo, I.F.; Bigg, G.R.; Davies, T.D. Climatology of Cyclogenesis Mechanisms in the Mediterranean. Mon. Weather Rev. 2002, 130, 549–569. [Google Scholar] [CrossRef]
  85. Brayshaw, D.J.; Hoskins, B.; Black, E. Some physical drivers of changes in the winter storm tracks over the North Atlantic and Mediterranean during the Holocene. Philos. Trans. R. Soc. A Math. Phys. Eng. Sci. 2010, 368, 5185–5223. [Google Scholar] [CrossRef]
  86. Ayalon, A.; Bar-Matthews, M.; Sass, E. Rainfall-recharge relationships within a karstic terrain in the Eastern Mediterranean semi-arid region, Israel: δ180 and δD characteristics. J. Hydrol. 1998, 207, 18–31. [Google Scholar] [CrossRef]
  87. Gat, J.R.; Klein, B.; Kushnir, Y.; Roether, W.; Wernli, H.; Yam, R.; Shemesh, A. Isotope composition of air moisture over the Mediterranean Sea: An index of the air-sea interaction pattern. Tellus, Ser. B Chem. Phys. Meteorol. 2003, 55, 953–965. [Google Scholar] [CrossRef]
  88. Alpert, P.; Neeman, B.U.; Shay-El, Y. Climatological analysis of Mediterranean cyclones using ECMWF data. Tellus A Dyn. Meteorol. Oceanogr. 1990, 42, 65–77. [Google Scholar] [CrossRef]
  89. Lionello, P.; Trigo, I.F.; Gil, V.; Liberato, M.L.R.; Nissen, K.M.; Pinto, J.G.; Raible, C.C.; Reale, M.; Tanzarella, A.; Trigo, R.M.; et al. Objective climatology of cyclones in the Mediterranean region: A consensus view among methods with different system identification and tracking criteria. Tellus Ser. A Dyn. Meteorol. Oceanogr. 2016, 68, 29391. [Google Scholar] [CrossRef]
  90. Karaca, M.; Deniz, A.; Tayanç, M. Cyclone track variability over Turkey in association with regional climate. Int. J. Climatol. 2000, 20, 1225–1236. [Google Scholar] [CrossRef]
  91. Ulbrich, U.; Lionello, P.; Beluŝić, D.; Jacobeit, J.; Knippertz, P.; Kuglitsch, F.G.; Leckebusch, G.C.; Luterbacher, J.; Maugeri, M.; Maheras, P.; et al. Climate of the Mediterranean: Synoptic Patterns, Temperature, Precipitation, Winds, and Their Extremes. In The Climate of the Mediterranean Region: From The Past to the Future; Lionello, P., Ed.; Elsevier: Amsterdam, The Netherlands, 2012; pp. 301–346. [Google Scholar]
  92. Weyhenmeyer, C.E.; Burns, S.J.; Waber, H.N.; Aeschbach-Hertig, W.; Kipfer, R.; Loosli, H.H.; Matter, A. Cool glacial temperatures and changes in moisture source recorded in Oman groundwaters. Science 2000, 287, 842–845. [Google Scholar] [CrossRef] [PubMed]
  93. Findlater, J. Interhemispheric transport of air in the lower troposphere over the western Indian Ocean. J. R. Met. Soc 1969, 95, 400–403. [Google Scholar] [CrossRef]
  94. Almazroui, M.; Nazrul Islam, M.; Athar, H.; Jones, P.D.; Rahman, M.A. Recent climate change in the Arabian Peninsula: Annual rainfall and temperature analysis of Saudi Arabia for 1978–2009. Int. J. Climatol. 2012, 32, 953–966. [Google Scholar] [CrossRef]
  95. Almazroui, M. The Relationship between Atmospheric Circulation Patterns and Surface Climatic Elements in Saudi Arabia. Ph.D. Thesis, University of East Anglia, Norwich, UK, 2006. [Google Scholar]
  96. Berrisford, P.; Dee, D.; Poli, P.; Brudgge, R.; Fielding, K.; Fuentes, M.; Kallberg, P.; Kobayashi, S.; Uppala, S.; Simmons, A. The ERA-Interim archive Version 2.0; ECMWF: Reading, UK, 2011; p. 23. [Google Scholar]
  97. Gat, J.R.; Carmi, I. Effect of Climate Changes on the Precipitation Patterns and Isotopic Composition of Water in a Climate Transition Zone: Case of the Eastern Mediterranean Sea Area; IAHSPubl. no. 168; IAHS: Vancouver, BC, Canada, 1987; pp. 513–524. [Google Scholar]
  98. Goldsmith, Y.; Polissar, P.J.; Ayalon, A.; Bar-Matthews, M.; de Menocal, P.B.; Broecker, W.S. The modern and Last Glacial Maximum hydrological cycles of the Eastern Mediterranean and the Levant from a water isotope perspective. Earth Planet. Sci. Lett. 2017, 457, 302–312. [Google Scholar] [CrossRef]
  99. Gat, J.R.; Dansgaard, W. Stable isotope survey of the fresh water occurrences in Israel and the Northern Jordan Rift Valley. J. Hydrol. 1972, 16, 177–211. [Google Scholar] [CrossRef]
  100. Armon, M.; Dente, E.; Smith, J.A.; Enzel, Y.; Morin, E. Synoptic-Scale Control over Modern Rainfall and Flood Patterns in the Levant Drylands with Implications for Past Climates. J. Hydrometeorol. 2018, 19, 1077–1096. [Google Scholar] [CrossRef]
  101. Haliva-Cohen, A.; Stein, M.; Goldstein, S.L.; Sandler, A.; Starinsky, A. Sources and transport routes of fine detritus material to the Late Quaternary Dead Sea basin. Quat. Sci. Rev. 2012, 50, 55–70. [Google Scholar] [CrossRef]
  102. Ben-Israel, M.; Enzel, Y.; Amit, R.; Erel, Y. Provenance of the Various Grain-Size Fractions in the Negev Loess and Potential changes in Major dust Sources to the Eastern Mediterranean. Quat. Res. 2015, 83, 105–115. [Google Scholar] [CrossRef]
  103. Ayalon, A.; Bar-Matthews, M.; Kaufman, A. Petrography, strontium, barium and uranium concentrations, and strontium and uranium isotope ratios in speleothems as palaeoclimatic proxies: Soreq Cave, Israel. Holocene 1999, 9, 715–722. [Google Scholar] [CrossRef]
  104. Craig, H. Isotopic Variations in Meteoric Waters. Science 1961, 133, 1702–1703. [Google Scholar] [CrossRef]
  105. Bar-Matthews, M.; Ayalon, A.; Vaks, A.; Frumkin, A. Climate and Environment Reconstruction Based on Speleothems from the Levant. In Quaternary of the Levant, Environments, Climate Change, and Humans; Bar-Yosef, O., Enzel, Y., Eds.; Cambridge University Press: Cambridge, UK, 2017; pp. 151–164. ISBN 9781316106754. [Google Scholar]
  106. Bar-Yosef, O. On the Nature of Transitions: the Middle to Upper Palaeolithic and the Neolithic Revolution. Camb. Archaeol. J. 1998, 8, 63–141. [Google Scholar] [CrossRef]
  107. Scroxton, N.; Gagan, M.K.; Dunbar, G.B.; Ayliffe, L.K.; Hantoro, W.S.; Shen, C.-C.; Hellstrom, J.C.; Zhao, J.; Cheng, H.; Edwards, R.L.; et al. Natural attrition and growth frequency variations of stalagmites in southwest Sulawesi over the past 530,000 years. Palaeogeogr. Palaeoclimatol. Palaeoecol. 2016, 441, 823–833. [Google Scholar] [CrossRef]
  108. Deininger, M.; Ward, B.M.; Novello, V.F.; Cruz, F.W. Late Quaternary Variations in the South American Monsoon System as Inferred by Speleothems—New Perspectives using the SISAL Database. Quaternary 2019, 2, 6. [Google Scholar] [CrossRef]
  109. Rohling, E.J.; Marino, G.; Grant, K.M. Mediterranean climate and oceanography, and the periodic development of anoxic events (sapropels). Earth-Sci. Rev. 2015, 143, 62–97. [Google Scholar] [CrossRef]
  110. Breitenbach, S.F.M.; Lechleitner, F.A.; Sinha, A.; Hills, D.; Ahmad, S.M. The Indian Summer Monsoon from a Speleothem d18O Perspective—A Review. Quaternary 2018, 1, 29. [Google Scholar]
  111. Kolodny, Y.; Stein, M.; Machlus, M. Sea-rain-lake relation in the Last Glacial East Mediterranean revealed by δ18O-δ13C in Lake Lisan aragonites. Geochim. Cosmochim. Acta 2005, 69, 4045–4060. [Google Scholar] [CrossRef]
  112. Almogi-Labin, A.; Bar-Matthews, M.; Shriki, D.; Kolosovsky, E.; Paterne, M.; Schilman, B.; Ayalon, A.; Aizenshtat, Z.; Matthews, A. Climatic variability during the last ~90 ka of the southern and northern Levantine Basin as evident from marine records and speleothems. Quat. Sci. Rev. 2009, 28, 2882–2896. [Google Scholar] [CrossRef]
  113. Wang, P.; Tian, J.; Lourens, L.J. Obscuring of long eccentricity cyclicity in Pleistocene oceanic carbon isotope records. Earth Planet. Sci. Lett. 2010, 290, 319–330. [Google Scholar] [CrossRef]
  114. Ayalon, A.; Bar-Matthews, M.; Schilman, B. Rainfall Isotopic Characteristics At Various Sites In Israel And The Relationships With Unsaturated Zone Water; 04; The Geological Survey of Israel: Jerusalem, Israel, 2004; Volume GSI/16/04. [Google Scholar]
  115. Kaufman, A.; Bar-Matthews, M.; Ayalon, A.; Carmi, I. The vadose flow above Soreq Cave, Israel: A tritium study of the cave waters. J. Hydrol. 2003, 273, 155–163. [Google Scholar] [CrossRef]
  116. Bar-Matthews, M.; Ayalon, A.; Matthews, A.; Sass, E.; Halicz, L. Carbon and oxygen isotope study of the active water-carbonate system in a karstic Mediterranean cave: Implications for paleoclimate research in semiarid regions. Geochim. Cosmochim. Acta 1996, 60, 337–347. [Google Scholar] [CrossRef]
  117. Affek, H.P.; Matthews, A.; Ayalon, A.; Bar-Matthews, M.; Burstyn, Y.; Zaarur, S.; Zilberman, T. Accounting for kinetic isotope effects in Soreq Cave (Israel) speleothems. Geochim. Cosmochim. Acta 2014, 143, 303–318. [Google Scholar] [CrossRef]
  118. Regattieri, E.; Zanchetta, G.; Drysdale, R.N.; Isola, I.; Hellstrom, J.C.; Roncioni, A. A continuous stable isotope record from the penultimate glacial maximum to the Last Interglacial (159-121ka) from Tana Che Urla Cave (Apuan Alps, central Italy). Quat. Res. 2014, 82, 450–461. [Google Scholar] [CrossRef]
  119. Drysdale, R.N.; Hellstrom, J.C.; Zanchetta, G.; Fallick, A.E.; Sánchez Goñi, M.F.; Couchoud, I.; McDonald, J.; Maas, R.; Lohmann, G.; Isola, I. Evidence for obliquity forcing of glacial Termination II. Science 2009, 325, 1527–1531. [Google Scholar] [CrossRef] [PubMed]
  120. Zanchetta, G.; Drysdale, R.N.; Hellstrom, J.C.; Fallick, A.E.; Isola, I.; Gagan, M.K.; Pareschi, M.T. Enhanced rainfall in the Western Mediterranean during deposition of sapropel S1: stalagmite evidence from Corchia cave (Central Italy). Quat. Sci. Rev. 2007, 26, 279–286. [Google Scholar] [CrossRef]
  121. Columbu, A.; Sauro, F.; Lundberg, J.; Drysdale, R.N.; De Waele, J. Palaeoenvironmental changes recorded by speleothems of the southern Alps (Piani Eterni, Belluno, Italy) during four interglacial to glacial climate transitions. Quat. Sci. Rev. 2018, 197, 319–335. [Google Scholar] [CrossRef]
  122. Braun, K.; Bar-Matthews, M.; Ayalon, A.; Zilberman, T.; Matthews, A. Rainfall isotopic variability at the intersection between winter and summer rainfall regimes in coastal South Africa (Mossel Bay, Western Cape Province). S. Afr. J. Geol. 2017, 120, 323–340. [Google Scholar] [CrossRef]
  123. Braun, K.; Bar-Matthews, M.; Matthews, A.; Ayalon, A.; Cowling, R.M.; Karkanas, P.; Fisher, E.C.; Dyez, K.; Zilberman, T.; Marean, C.W. Late Pleistocene records of speleothem stable isotopic compositions from Pinnacle Point on the South African south coast. Quat. Res. 2019, 91, 265–288. [Google Scholar] [CrossRef]
  124. Enzel, Y.; Amit, R.; Dayan, U.; Crouvi, O.; Kahana, R.; Ziv, B.; Sharon, D. The climatic and physiographic controls of the eastern Mediterranean over the late Pleistocene climates in the southern Levant and its neighboring deserts. Glob. Planet. Chang. 2008, 60, 165–192. [Google Scholar] [CrossRef]
  125. Orland, I.J.; He, F.; Bar-Matthews, M.; Chen, F.; Ayalon, A. Valley Resolving paleorainfall proxies in the Eastern Mediterranean with seasonal-resolution model and proxy analyses. In Proceedings of the AGU Fall Meeting 2018, Washington, DC, USA, 10–14 December 2018; p. PP12B-04. [Google Scholar]
  126. Torfstein, A.; Goldstein, S.L.; Kushnir, Y.; Enzel, Y.; Haug, G.; Stein, M. Dead Sea drawdown and monsoonal impacts in the Levant during the last interglacial. Earth Planet. Sci. Lett. 2015, 412, 235–244. [Google Scholar] [CrossRef]
  127. Wickens, L.B. Geochemistry and Petrography of Speleothems From Turkey and Iran: Palaeoclimate and Diagenesis. Ph.D. Thesis, University of East Anglia, Norwich, UK, 2013. [Google Scholar]
  128. Cheng, H.; Sinha, A.; Wang, X.; Cruz, F.W.; Edwards, R.L. The Global Paleomonsoon as seen through speleothem records from Asia and the Americas. Clim. Dyn. 2012, 39, 1045–1062. [Google Scholar] [CrossRef]
  129. Ziegler, M.; Tuenter, E.; Lourens, L.J. The precession phase of the boreal summer monsoon as viewed from the eastern Mediterranean (ODP Site 968). Quat. Sci. Rev. 2010, 29, 1481–1490. [Google Scholar] [CrossRef]
  130. Broecker, W.S.; Denton, G.H.; Edwards, R.L.; Cheng, H.; Alley, R.B.; Putnam, A.E. Putting the Younger Dryas cold event into context. Quat. Sci. Rev. 2010, 29, 1078–1081. [Google Scholar] [CrossRef]
  131. Büntgen, U.; Myglan, V.S.; Ljungqvist, F.C.; McCormick, M.; Di Cosmo, N.; Sigl, M.; Jungclaus, J.; Wagner, S.; Krusic, P.J.; Esper, J.; et al. Cooling and societal change during the Late Antique Little Ice Age from 536 to around 660 AD. Nat. Geosci. 2016, 9, 231–236. [Google Scholar] [CrossRef]
  132. Wanner, H.; Beer, J.; Bütikofer, J.; Crowley, T.J.; Cubasch, U.; Flückiger, J.; Goosse, H.; Grosjean, M.; Joos, F.; Kaplan, J.O.; et al. Mid- to Late Holocene climate change: an overview. Quat. Sci. Rev. 2008, 27, 1791–1828. [Google Scholar] [CrossRef]
  133. Box, M.R.; Krom, M.D.; Cliff, R.A.; Bar-Matthews, M.; Almogi-Labin, A.; Ayalon, A.; Paterne, M. Response of the Nile and its catchment to millennial-scale climatic change since the LGM from Sr isotopes and major elements of East Mediterranean sediments. Quat. Sci. Rev. 2011, 30, 431–442. [Google Scholar] [CrossRef]
  134. Siani, G.; Magny, M.; Paterne, M.; Debret, M.; Fontugne, M.R. Paleohydrology reconstruction and Holocene climate variability in the South Adriatic Sea. Clim. Past 2013, 9, 499–515. [Google Scholar] [CrossRef]
  135. Lechleitner, F.A.; Amirnezhad-Mozhdehi, S.; Columbu, A.; Comas-Bru, L.; Labuhn, I.; Pérez-Mejías, C.; Rehfeld, K.; Lechleitner, F.A.; Amirnezhad-Mozhdehi, S.; Columbu, A.; et al. The Potential of Speleothems from Western Europe as Recorders of Regional Climate: A Critical Assessment of the SISAL Database. Quaternary 2018, 1, 30. [Google Scholar] [CrossRef]
  136. Nicholson, S.E.; Nash, D.J.; Chase, B.M.; Grab, S.W.; Shanahan, T.M.; Verschuren, D.; Asrat, A.; Lézine, A.M.; Umer, M. Temperature variability over Africa during the last 2000 years. Holocene 2013, 23, 1085–1094. [Google Scholar] [CrossRef]
  137. McGregor, H.V.; Evans, M.N.; Goosse, H.; Leduc, G.; Martrat, B.; Addison, J.A.; Mortyn, P.G.; Oppo, D.W.; Seidenkrantz, M.S.; Sicre, M.A.; et al. Robust global ocean cooling trend for the pre-industrial Common Era. Nat. Geosci. 2015, 8, 671–677. [Google Scholar] [CrossRef]
  138. Abram, N.J.; McGregor, H.V.; Tierney, J.E.; Evans, M.N.; McKay, N.P.; Kaufman, D.S.; the PAGES 2k Consortium; Thirumalai, K.; Martrat, B.; Goosse, H.; et al. Early onset of industrial-era warming across the oceans and continents. Nature 2016, 536, 411–418. [Google Scholar] [CrossRef] [PubMed]
  139. Zielinski, G.A.; Mayewski, P.A.; Meeker, L.D.; Grönvold, K.; Germani, M.S.; Whitlow, S.; Twickler, M.S.; Taylor, K. Volcanic aerosol records and tephrochronology of the Summit, Greenland, ice cores. J. Geophys. Res. Ocean. 1997, 102, 26625–26640. [Google Scholar] [CrossRef]
  140. Fontugne, M.R.; Calvert, S.E. Late Pleistocene Variability of the Carbon Isotopic Composition of Organic Matter in the Eastern Mediterranean: Monitor of Changes in Carbon Sources and Atmospheric CO2 Concentrations. Paleoceanography 1992, 7, 1–20. [Google Scholar] [CrossRef]
  141. Bond, G.; Kromer, B.; Beer, J.; Muscheler, R.; Evans, M.N.; Showers, W.; Hoffmann, S.; Lotti-Bond, R.; Hajdas, I.; Bonani, G. Persistent solar influence on North Atlantic climate during the Holocene. Science 2001, 294, 2130–2136. [Google Scholar] [CrossRef]
  142. Rohling, E.J.; Marino, G.; Grant, K.M.; Mayewski, P.A.; Weninger, B. A model for archaeologically relevant Holocene climate impacts in the Aegean-Levantine region (easternmost Mediterranean). Quat. Sci. Rev. 2019, 208, 38–53. [Google Scholar] [CrossRef]
  143. Walker, M.J.C.; Johnsen, S.; Rasmussen, S.O.; Popp, T.; Steffensen, J.P.; Gibbard, P.; Hoek, W.; Lowe, J.; Andrews, J.; Björck, S.; et al. Formal definition and dating of the GSSP (Global Stratotype Section and Point) for the base of the Holocene using the Greenland NGRIP ice core, and selected auxiliary records. J. Quat. Sci. 2009, 24, 3–17. [Google Scholar] [CrossRef]
  144. Head, M.J.; Gibbard, P.L. Formal subdivision of the Quaternary System/Period: Past, present, and future. Quat. Int. 2015, 383, 4–35. [Google Scholar] [CrossRef]
  145. Kleiven, H.K.F.; Kissel, C.; Laj, C.; Ninnemann, U.S.; Richter, T.O.; Cortijo, E. Reduced North Atlantic deep water coeval with the glacial Lake Agassiz freshwater outburst. Science 2008, 319, 60–64. [Google Scholar] [CrossRef]
  146. Grant, K.M.; Grimm, R.; Mikolajewicz, U.; Marino, G.; Ziegler, M.; Rohling, E.J. The timing of Mediterranean sapropel deposition relative to insolation, sea-level and African monsoon changes. Quat. Sci. Rev. 2016, 140, 125–141. [Google Scholar] [CrossRef]
  147. Rohling, E.J. Review and new aspects concerning the formation of eastern Mediterranean sapropels. Mar. Geol. 1994, 122, 1–28. [Google Scholar] [CrossRef]
  148. de Lange, G.J.; Thomson, J.; Reitz, A.; Slomp, C.P.; Speranza Principato, M.; Erba, E.; Corselli, C. Synchronous basin-wide formation and redox-controlled preservation of a Mediterranean sapropel. Nat. Geosci. 2008, 1, 606–610. [Google Scholar] [CrossRef]
  149. Martrat, B.; Jimenez-Amat, P.; Zahn, R.; Grimalt, J.O. Similarities and dissimilarities between the last two deglaciations and interglaciations in the North Atlantic region. Quat. Sci. Rev. 2014, 99, 122–134. [Google Scholar] [CrossRef]
  150. Jalali, B.; Sicre, M.-A.; Bassetti, M.-A.; Kallel, N. Holocene climate variability in the North-Western Mediterranean Sea (Gulf of Lions). Clim. Past 2016, 12, 91–101. [Google Scholar] [CrossRef]
  151. Thomas, E.R.; Wolff, E.W.; Mulvaney, R.; Steffensen, J.P.; Johnsen, S.J.; Arrowsmith, C.; White, J.W.C.; Vaughn, B.; Popp, T. The 8.2 ka event from Greenland ice cores. Quat. Sci. Rev. 2007, 26, 70–81. [Google Scholar] [CrossRef]
  152. Wu, C.J.; Usoskin, I.G.; Krivova, N.; Kovaltsov, G.A.; Baroni, M.; Bard, E.; Solanki, S.K. Solar activity over nine millennia: A consistent multi-proxy reconstruction. Astron. Astrophys. 2018, 615, A93. [Google Scholar] [CrossRef]
  153. Torfstein, A.; Goldstein, S.L.; Stein, M.; Enzel, Y. Impacts of abrupt climate changes in the Levant from Last Glacial Dead Sea levels. Quat. Sci. Rev. 2013, 69, 1–7. [Google Scholar] [CrossRef]
  154. de Menocal, P.B.; Ortiz, J.; Guilderson, T.; Adkins, J.; Sarnthein, M.; Baker, L.; Yarusinsky, M. Abrupt onset and termination of the African Humid Period: rapid climate responses to gradual insolation forcing. Quat. Sci. Rev. 2002, 19, 347–361. [Google Scholar] [CrossRef]
  155. de Menocal, P.B. Palaeoclimate: End of the African Humid Period. Nat. Geosci. 2015, 8, 86–87. [Google Scholar] [CrossRef]
  156. Quade, J.; Dente, E.; Armon, M.; Ben Dor, Y.; Morin, E.; Adam, O.; Enzel, Y. Megalakes in the Sahara? A Review. Quat. Res. 2018, 90, 253–275. [Google Scholar] [CrossRef]
  157. Kuper, R.; Kröpalin, S. Climate-controlled holocene occupation in the Sahara: Motor of Africa’s evolution. Science 2006, 313, 803–807. [Google Scholar] [CrossRef]
  158. Bini, M.; Zanchetta, G.; Persoiu, A.; Cartier, R.; Català, A.; Cacho, I.; Dean, J.R.; Di Rita, F.; Drysdale, R.N.; Finnè, M.; et al. The 4.2 ka BP Event in the Mediterranean Region: an overview. Clim. Past Discuss. 2018, 15, 555–577. [Google Scholar] [CrossRef]
  159. Zanchetta, G.; Regattieri, E.; Isola, I.; Drysdale, R.N.; Bini, M.; Baneschi, I.; Hellstrom, J.C. The so-called “4.2 event” in the central mediterranean and its climatic teleconnections. Alp. Mediterr. Quat. 2016, 29, 5–17. [Google Scholar]
  160. Carolin, S.A.; Walker, R.T.; Day, C.C.; Ersek, V.; Sloan, R.A.; Dee, M.W.; Talebian, M.; Henderson, G.M. Precise timing of abrupt increase in dust activity in the Middle East coincident with 4.2 ka social change. Proc. Natl. Acad. Sci. USA 2019, 116, 67–72. [Google Scholar] [CrossRef]
  161. Issar, A.S.; Zohar, M. Climate Change—Environment and History of the Near East; Springer: Berlin/Heidelberg, Germany, 2007; ISBN 9783540698517. [Google Scholar]
  162. Renssen, H.; Brovkin, V.; Fichefet, T.; Goosse, H. Simulation of the Holocene climate evolution in Northern Africa: The termination of the African Humid Period. Quat. Int. 2006, 150, 95–102. [Google Scholar] [CrossRef]
  163. Shanahan, T.M.; McKay, N.P.; Hughen, K.A.; Overpeck, J.T.; Otto-Bliesner, B.; Heil, C.W.; King, J.; Scholz, C.A.; Peck, J. The time-transgressive termination of the African Humid Period. Nat. Geosci. 2015, 8, 140–144. [Google Scholar] [CrossRef]
  164. Magny, M.; Vannière, B.; Zanchetta, G.; Fouache, E.; Touchais, G.; Petrika, L.; Coussot, C.; Walter-Simonnet, A.V.; Arnaud, F. Possible complexity of the climatic event around 4300-3800 cal. BP in the central and western Mediterranean. Holocene 2009, 19, 823–833. [Google Scholar] [CrossRef]
  165. Kaniewski, D.; Marriner, N.; Cheddadi, R.; Guiot, J.; Van Campo, E. The 4.2 ka BP event in the Levant. Clim. Past 2018, 14, 1529–1542. [Google Scholar] [CrossRef]
  166. Hughes, P. 1816 the Year without a Summer. Weatherwise 2010, 32, 108–111. [Google Scholar] [CrossRef]
  167. Zhang, D.D.; Lee, H.F.; Wang, C.; Li, B.; Pei, Q.; Zhang, J.; An, Y. The causality analysis of climate change and large-scale human crisis. Proc. Natl. Acad. Sci. USA 2011, 108, 17296–17301. [Google Scholar] [CrossRef]
  168. Alonso-Garcia, M.; Kleiven, H.K.F.; McManus, J.F.; Moffa-Sanchez, P.; Broecker, W.S.; Flower, B.P. Freshening of the Labrador Sea as a trigger for Little Ice Age development. Clim. Past 2017, 13, 317–331. [Google Scholar] [CrossRef]
  169. Moreno-Chamarro, E.; Zanchettin, D.; Lohmann, K.; Luterbacher, J.; Jungclaus, J.H. Winter amplification of the European Little Ice Age cooling by the subpolar gyre. Sci. Rep. 2017, 7, 9981. [Google Scholar] [CrossRef]
  170. Dezileau, L.; Sabatier, P.; Blanchemanche, P.; Joly, B.; Swingedouw, D.; Cassou, C.; Castaings, J.; Martinez, P.; Von Grafenstein, U. Intense storm activity during the Little Ice Age on the French Mediterranean coast. Palaeogeogr. Palaeoclimatol. Palaeoecol. 2011, 299, 289–297. [Google Scholar] [CrossRef]
  171. Gao, C.; Robock, A.; Ammann, C. Volcanic forcing of climate over the past 1500 years: An improved ice core-based index for climate models. J. Geophys. Res. 2008, 113, D23111. [Google Scholar] [CrossRef]
  172. Steffensen, J.P.; Dahl-Jensen, D.; Vinther, B.M.; Svensson, A.M.; Clausen, H.B.; Buchardt, S.L.; Rasmussen, S.O.; Andersen, K.K.; Lipenkov, V.; Blunier, T.; et al. Holocene thinning of the Greenland ice sheet. Nature 2009, 461, 385–388. [Google Scholar]
  173. Enzel, Y.; Kushnir, Y.; Quade, J. The middle Holocene climatic records from Arabia: Reassessing lacustrine environments, shift of ITCZ in Arabian Sea, and impacts of the southwest Indian and African monsoons. Glob. Planet. Chang. 2015, 129, 69–91. [Google Scholar] [CrossRef]
  174. Levine, X.J.; Schneider, T.; Levine, X.J.; Schneider, T. Baroclinic Eddies and the Extent of the Hadley Circulation: An Idealized GCM Study. J. Atmos. Sci. 2015, 72, 2744–2761. [Google Scholar] [CrossRef]
  175. Marsh, A.; Fleitmann, D.; Al-Manmi, D.A.M.; Altaweel, M.; Wengrow, D.; Carter, R. Mid- to late-Holocene archaeology, environment and climate in the northeast Kurdistan region of Iraq. Holocene 2018, 28, 955–967. [Google Scholar] [CrossRef]
  176. Wassenburg, J.A.; Dietrich, S.; Fietzke, J.; Fohlmeister, J.; Jochum, K.P.; Scholz, D.; Richter, D.K.; Sabaoui, A.; Spötl, C.; Lohmann, G.; et al. Reorganization of the North Atlantic Oscillation during early Holocene deglaciation. Nat. Geosci. 2016, 9, 602–605. [Google Scholar] [CrossRef]
  177. Deininger, M.; Werner, M.; McDermott, F. North Atlantic Oscillation controls on oxygen and hydrogen isotope gradients in winter precipitation across Europe; Implications for palaeoclimate studies. Clim. Past 2016, 12, 2127–2143. [Google Scholar] [CrossRef]
  178. Hurrell, J.W. Decadal Trends in the North Atlantic Oscillation: Regional Temperatures and Precipitation. Science 1995, 269, 676–679. [Google Scholar] [CrossRef] [PubMed]
Figure 1. Location of the Middle East (ME) speleothem records that are included in SISAL_v1 (purple circles) and other identified records, not yet included in the database (green triangles). The base map shows the distribution of carbonate and evaporite rocks in the ME, as provided by the World Karst Aquifer Mapping project (WOKAM), adapted with permission from [42]. Cave sites with entities not included in the SISAL database are numbered (Table 1): (1) Karaca (2) Ovacik (3) Akçakale (4) Katleh Khor (5) Qal’e Kord (6) Gejkar (7) Gol-e Zard (8) Mitzpe Shlagim (9) Peqiin (10) Zalmon (11) Ashalim (12) Even Sid (13) Hol-Zakh (14) Izzim (15) Ma’ale Ha-Mishar (16) Ma’ale Dargot (17) Makhtesh ha-Qatan (18) Shizfon mini-caves (19) Tzavoa (20) Wadi Lotz (21) Wadi Sannur (22) Mukalla (23) Dimarshim (24) Casecas (25) Hoq.
Quaternary 02 00016 g001
Figure 2. Maps showing seasonal precipitation amounts and water balance in the study region. Panel (A) and (B) illustrate seasonal precipitation amounts from June to September (JJAS) and from December to March (DJFM), respectively. Grey areas indicate regions where the daily precipitation amount is smaller than 0.5 mm. These panels also show the seasonal 850 hPa wind fields in the EM, AP and FC. Common storm trajectories are superimposed on the image and shown by the black arrows. Panels (C) and (D) show the seasonal water-balance: Total Precipitation (TP) minus Evaporation (E), for the periods JJAS (C) and DJFM (D), to best estimate the potential recharge (or “effective infiltration”). All data was retrieved from the ERA-Interim reanalysis dataset (1979 to 2015 CE) [96]. Following Figure 1, circles show the locations of speleothem records that are included in SISAL_v1, while triangles mark identified sites not included in SISAL_v1.
Quaternary 02 00016 g002
Figure 3. (A) Histogram showing the distribution of temporal difference between two consecutive data points for all ME SISAL_v1 entities, in bins of smaller than 0.5 years, between 0.5 and 1.0 years, between 1 and 5 years, between 5 and 10 years, between 10 and 20 years, between 20 and 50 years, between 50 and 100 years, between 100 and 200 years and over 200 years. (B) Histogram of speleothem records during the last 120 kyr subdivided in 250-year bins, available speleothem isotope time-series were counted if at least one δ18O value was within a bin [108]. (C) Temporal coverage and temporal difference of studied entities covering the pre-Holocene time periods (up to 200 ka BP) and (D) entities from the last 30 ka BP. Sapropel 1 period is bracketed by the dashed lines in (C,D) [109].
Quaternary 02 00016 g003
Figure 4. Time-series of δ18Occ of speleothem records from the AP (Yemen/Oman), Levant including Turkeys’ Mediterranean coast, i.e., Dim Cave) and Northern Turkey (Sofular). The climatic events highlighted on the plot are based on the interpretations from references [30,131].
Quaternary 02 00016 g004
Figure 5. (A) Time-series of δ18Occ of speleothem records for the last 12 kyr. speleothem records are the same than in Figure 4, which are on the modern dominant storm trace to the ME region shown in Figure 2. (B) Temporal variability of entities in panel A for the last 2 kyr. The seasonally-resolved entity 2–6 (Soreq Cave) is added for discussion [14]. The climatic events highlighted on the plot are based on the interpretations from references [30,131].
Quaternary 02 00016 g005
Figure 6. Holocene overview of the δ18Occ of ME speleothem records in comparison with additional terrestrial and marine palaeo-archives. (A) Reconstructed sunspot number along with its 68% confidence interval [152] and volcanic aerosol based on empirical orthogonal function analysis performed in ice cores from Greenland [139,171]. (B) Sum of ice glacier advances, cold and dry periods [32]. (C) Composite δ18O data from Greenland ice-cores [172]. (D) Composite of the SISAL δ18Occ from ME and Eastern Europe speleothems reviewed in this study. The composites in (C,D) are shown as normalized anomalies (standard units) with a box width: 200-year intervals; central mark: median; edges of the box: 25th & 75th percentiles; whiskers: extreme values (~99% of data); plusses: outliers (~1% of data); boxes connected with a 3-point running average of 25-year bin means. (E) Eastern Mediterranean planktonic δ18O profiles of site LC21 [64,109] (light brown line: Globigerinoides ruber, black line: Neogloboquadrina pachyderma) and site MD84-641 [140] covering the Holocene. The shaded areas highlight important early, middle and late Holocene climate events discussed in the text (8.2, 4.2 and 0.7 ka, respectively).
Quaternary 02 00016 g006
Table 1. List of all speleothem records which include SISAL metadata: site (or cave) name and id number, latitude, longitude, entity (or speleothem) name and id number. Additional information includes; location of site (country or region), site height Above Mean Sea Level (AMSL) in meters, minimum and maximum ages given in years BP (1950), and published references. The top table are records available in SISAL_v1 (with annotations of some entities in those sites as yet to be added to SISAL_v1). The bottom table lists additional sites and speleothems not included in in SISAL_v1. A minimum age of “~present” is designated where a younger than 1950 CE sample is presented without an exact minimum age for the age model or a removal date. When ages beyond U/Th dating method are reported, the table notes these as >U/Th.
Site_nameSite _idLocationLatitude
ºN
Longitude
ºE
Elevation
(m AMSL)
Entity _nameEntity _idMin. Age
(yrs BP)
Max. Age
(yrs BP)
Ref.
Ascunsa72Romania45.0022.601050POM-2161−328169[46]
Ceremosjna76Serbia44.4021.65530CC-1165−482426[47]
Defore170Oman17.1754.08150S3366−46731[48]
S4 909510,693[49]
Dim79Turkey36.5332.11232Dim-E2168973813,094[50]
Dim-E316912,57589,714
Dim-E417012,02014,555
Hoti152Oman23.0857.35800H532760269607[49,51]
H1
H2
H3
H4
H10
H11
H12

H13

H14
flowstone
78,000
~present
~present
117,000
6200
6200
164
117,000
180,000
300,000
6200
117,000
82,000
5000
5000
130,000
10,500
10,500
6277
130,000
210,000
325,000
10,500
130,000
[49,52]
Jeita11Lebanon33.9535.65100Jeita-158113712,288[53,54]
Jeita-25913,33020,367
Jeita-360372847
JeG-
Stm-1
110011,900[54]
Jerusalem West68Israel31.8035.20700AF-12152−16168,714[55]
Kanaan19Lebanon33.9135.6198Kanaan_
MIS5
8183,125128,847[56]
Kanaan_
MIS6
82154,455193,498
Kapsia44Greece37.6222.35700GK-09-0212011152904[57]
Ma’ale Efrayim110West Bank32.0835.37250ME-1221816,54866,948[18]
36 samples
Mavri Trypa156Greece36.7421.7670S134712964687[58]
Moomi138Yemen12.5054.00400M1-529311,08627,370[59]
M1-2 40,00053,000[59]
Qunf159Oman17.1054.18650Q535130810,558[49]
Skala Marion56Greece40.6424.5141MAR_L13614815534[60]
Sofular141Turkey41.4231.93700SO-1305−5650,275[61]
SO-2
SO-4
SO-6SO-10
SO-14BSO-17A
−60
1080
93,572
~present
475,910
86,190
59,510
307,030
133,200
2200
670,000
122,930
[62,63]
Soreq160Israel31.4535.03400Soreq composite354~present30,031[64]
2N353444033,804[31]
2–63527432086[14]
Numerous samples ~present250,000[13,28,65,66,67,68,69,70,71,72]
Sites identified but currently not in SISAL_v1 (see Figure 1)
Cave NameFigure 1 idCountryLatitude
(N)
Longitude
(E)
Elevation
(masl)
Identified speleothemsMin. AgeMax. AgeRef.
Ashalim11Israel30.9434.74400 116,700>U/Th[73]
Akcakale3Turkey40.4539.54 2p−55189[74]
Casecas24Yemen12.5654.31 STM512856[75]
Dimarshim23Yemen12.5553.68 D1~present4530[49]
Even Sid12Israel30.6434.81800 87,700>U/Th[73]
Gejkar6Iraq35.8049.16 Gej-1−632380[29]
Gol-e Zard7Iran35.1352.002530-37005100[76]
Hol-Zakh13Israel31.1635.20150 111,700349,100[73]
Hoq25Yemen12.5954.53 Hq1
STM1
STM6
−50
−53
−56
6900
5600
4500
[75]
Izzim14Israel31.1435.06500 372,600500,100[73]
Karaca1Turkey40.3229.24 K1600077,300[77]
Kataleh Khor4Iran35.8448.16 (2 samples)214,000500,000[78]
Ma’ale ha-Meyshar15Israel30.4934.93450 110,600>U/Th[73]
Ma’ale Dragot16Israel31.435.00300MD (6 samples)<500426,440[79]
Makhtesh ha-Qatan17Israel30.9535.22−20 140,000>U/Th[73]
Mitzpe Shlagim8Israel/Syria33.3235.812224MS-1
MS-2
MS-3
4300
8800
8500
88,000
89,000
49,100
[80]
Mukalla Cave22Yemen14.9248.591500Y99
Y97-4
Y97-5
119,141
5630
8790
358,887
185,600
233,300
[16]
Ovacik2Turkey41.4632.02 O-144729796[61]
Peqiin9Israel32.5835.19650PEK-5
PEK-6
PEK-9
PEK-10
5620
24,710
47,810
55,630
6780
223,700
283,650
288,160
[72]
Qal’e Kord5Iran35.8048.86 QK 8
QK 14
78,104
6581
99,182
127,012
[78,81]
Shizafon mini-caves18Israel30.0435.00400 333,400>U/Th[73]
Tzavoa19Israel31.2035.20550TZ (15 samples)14,400204,760[79]
Wadi Lotz20Israel30.4734.58900LOTS-3->U/Th[73]
Wadi Sannur21Egypt28.6231.28 WSS 1 to 6136,460188,120[82]
Zalmon10Israel32.8035.40 ZAL-1 to ZAL-7 and ZAL-115100165,000[83]

