Speleothem Records from the Eastern Part of Europe and Turkey—Discussion on Stable Oxygen and Carbon Isotopes


1
Institute for Geological and Geochemical Research, Research Centre for Astronomy and Earth Sciences, Hungarian Academy of Sciences, H-1112 Budapest, Hungary
2
Emil Racoviță Institute of Speleology, Romanian Academy, Clinicilor 5, 400006 Cluj Napoca, Romania
3
Stable Isotope Laboratory, University of Suceava, Universității 13, 720229 Suceava, Romania
*
Author to whom correspondence should be addressed.
Quaternary 2019, 2(3), 31; https://0-doi-org.brum.beds.ac.uk/10.3390/quat2030031
Submission received: 30 November 2018
/
Revised: 3 September 2019
/
Accepted: 6 September 2019
/
Published: 18 September 2019
(This article belongs to the Special Issue Speleothem Records and Climate)
Abstract
:The region comprising of East Central Europe, South East Europe and Turkey contributed to the SISAL (Speleothem Isotopes Synthesis and AnaLysis) global database with stable carbon and oxygen isotope time-series from 18 speleothems from 14 caves. The currently available oldest record from the studied region is the ABA-2 flowstone record (Abaliget Cave; Hungary) reaching back to MIS 6. The temporal distribution of the compiled 18 records from the region points out a ~20 kyr-long period, centering around 100 ka BP, lacking speleothem stable isotope data. The regional subset of SISAL_v1 records displays a continuous coverage for the past ~90 kyr for both δ13C and δ18O, with a mean temporal resolution of ~12 yr for the Holocene, and >50 yr for the pre-Holocene period. The highest temporal resolution both for the Holocene and the pre-Holocene was achieved in the So-1 record (Sofular Cave; Turkey). The relationship between modern day precipitation δ18O (amount weighted annual and winter season mean values; 1961–2017) and climatological parameters was evaluated. The strong positive correlation found in East Central Europe reinforces the link between modern day precipitation δ18O, temperature and large-scale circulation (North Atlantic Oscillation) expected to be preserved in the speleothem δ18O record; while a negative relationship was documented between precipitation amount and oxygen isotope compositions in South East Europe. Variations of δ13C values are primarily interpreted as reflecting dry/wet periods across the region. Elevation gradients from three non-overlapping periods of the last ~5 kyr indicated elevation gradients around −0.26‰ per 100 m−1 for calcite δ18O.
1. Introduction
Southeastern Europe is the cradle of karst research [1,2,3]. The Kras Plateau in Slovenia gave its name to the entire discipline, and the very first karst research [4] and speleological [5] institutes were established in this region. Extended karstic terrains are found in various climatic zones, across the studied region, ranging from the extreme humid coastal areas of the Dinaric Karst (annual precipitation >4000 mm) to arid central Anatolia (annual precipitation <300 mm). Turkey and the southeastern part of Europe have a very diverse karst landscape, and a wide range of geochronological and geochemical investigations targeted the cave deposits in this region to infer information on past environments.
Radiometric dating of submerged speleothems from the Dalmatian coast helped constrain periods of sea-level low- [6,7,8] and high-stands [9] during the Quaternary. Trace element variability in speleothems from the region provided a basis for paleohydroclimate implications [10,11,12], and supported the identification of historical flood events [13]. The Middle Bronze Age Minoan eruption of Santorini was associated with a sudden rise in rare earth elements in the Trió flowstone record [14] and the geochemical imprint (e.g., peaks in Br, Mo, S) in the So-1 record from Sofular Cave [15]. Changes in U concentration and δ234U variability associated with increased detrital material (e.g., Al, Si, Th) in the younger part of the Trió flowstone were used to detect pollution from historical mining activity [16].
Stable isotope investigations of calcareous speleothems began relatively late in this region, at the very end of the 20th century [17,18]. The first studies aimed to infer changes in paleoenvironmental conditions based on stable isotope composition of Late Pleistocene speleothems were carried out in Wierna Cave, southern Poland [17]. Nevertheless, this aim was first achieved in Lithophagus Cave, Romania [19].
Paleoclimatic interpretations of stable carbon- and oxygen isotope compositions of speleothem carbonate (δ13Cspel and δ18Ospel) require knowledge and quantitative estimation of the processes that affect the stable isotopic compositions of oxygen and carbon during the hydrologic cycle and calcite precipitation. We refer the reader to the introductory paper of this Special Issue [20] for an overview of these controlling mechanisms. In addition to δ13Cspel and δ18Ospel (the most frequently investigated and most abundant geochemical parameters in speleothems studies in the region), stable isotope ratios in certain non-calcareous cave deposits, such as cave ice [21] and guano deposits [22,23,24] have also been explored for their paleoclimatological potential.
Microscopic droplets from dripping water are enclosed in the precipitating carbonate during the speleothem formation in the form of fluid inclusions. Since H and O isotope compositions of the water are not fractionated during entrapment, initially both are considered to reflect the composition of dripwater directly [25,26]. However post-deposition recrystallization and calcite-water isotope exchange have been proved to compromise fluid inclusion δ18O [27], leaving hydrogen isotope composition to be the reliable paleoclimate proxy. Although it has been long recognized that stable isotope analysis of inclusion-hosted water has a great potential in speleothem-based paleoclimate reconstructions [28], the relatively large sample amount required for classical dual inlet mass spectrometry and the sophisticated technique for O isotope measurement precluded wide application of combined of H and O isotope analyses of inclusion-hosted water (further details in Demény et al. [28]). Fluid inclusion stable isotope data are also available in the region provided excess information for paleoclimatological studies; see Section 6.
This paper uses the first global compilation of speleothem isotope records (SISAL_v1 database [29,30]) produced by the Speleothem Isotopes Synthesis and Analysis PAGES working group to describe and evaluate the spatiotemporal coverage of the speleothem derived stable isotope records for the last 160,000 yrs from the Eastern part of Europe and Turkey. We highlight areas and periods that are lacking data and how this could be mitigated. Special attention is given to the Holocene, for which we evaluate the available δ18Ospel records and compare them with stable hydrogen isotope compositions (δ2H) of speleothem fluid inclusions in the region. The spatial distribution in the relatively well represented 5-1 ka BP (Before Present, with the present referring to 1950 of the Common Era) period, provided the opportunity to explore the spatial pattern of δ18Ospel data.
2. Study Region and Local Climate
The studied region, covering 3.03 × 10⁶ km2, encompasses East Central Europe, South East Europe and Turkey and is hereafter referred to as the Eastern part of Europe and Turkey. The other parts of continental Europe not considered here are included in a companion paper of this Special Issue [31].
Generally, the studied region is characterized by wet continental climate, with increasing continentality eastwards (for details see Supplement Section 1 and Figure S1). Warm temperate/continental climate with warm summers and without a dry season prevails over the elevated terrains of the Balkan Peninsula stretching northward to the Baltic Coast. Areas with hot summers occur in the central part of the Balkan Peninsula and the south-eastern part of the Eastern European Plains (Figure S1). Boreal climate with warm summers without a dry season prevails over large part of the mountainous area (Carpathians, Dinarides, and Thracian Massive) and the northeastern parts of the Eastern European Plains up to the Gulf of Finland. Cool summers and cold winters are restricted to the highest regions of the Carpathian Range (Figure S1) [32]. The southern regions, from the Dalmatian Coast through the Peloponnesus, the plains north and west of the Black Sea and large part of Anatolia are characterized by dry, hot and warm summers. Details on the climate of the region [32] are found in the Supplement.
Warm season cyclones reach the northern part of the studied region originating from the Mediterranean and Black seas, as well as from the North Atlantic, while cold season cyclones originate almost exclusively from the North Atlantic [33]. In fall, frequent Mediterranean cyclones penetrate northeastwards, reaching the Carpathians and beyond. Mediterranean moisture is the dominant source for precipitation in the Balkan Peninsula [34,35]. SE Europe is the only region on the continent where the contribution of Mediterranean sourced moisture exceeds ~20% all year-round [36]. The Black Sea acts as an important moisture source for the surrounding coastal region (as far as the eastern Carpathians [37]) and for northern Turkey [38,39].
The high elevation mountain areas show the largest karstic groundwater recharge volumes (up to 700–800 mm y−1). However, the recharge rates are higher in the Mediterranean region (from ~20% to ~60% of total precipitation with a mean of ~40%) than in the high range mountains (from ~5% to ~65% of total precipitation). The recharge rate of the humid hills and plains varies between ~5% and ~60% with a mean of ~30%, being slightly lower than in the Mediterranean medium range mountains and high range mountains [40]. Overall, in the studied region, the maximum recharge rates can be observed in the Dinaric karst and western Anatolia, whereas the eastern Balkan Peninsula and central-east Anatolia has the driest karstic areas [40].
3. “Eastern Europe and Turkey” Records in SISAL_v1
At the time of the publication of this review, 43 speleothem stable isotope records from 29 caves have been identified in the Eastern part of Europe and Turkey, out of which 18 individual records from 14 caves are included in SISAL_v1 database [29,30] (Figure 1, Table 1).
3.1. Spatial Distribution of Speleothem Records
The Dinaric Karst is represented by only a 54-yr-long modern speleothem record from Postojna Cave [18] and a ca. 1700-yr long one from the Modrič Cave [41] in SISAL_v1 (Figure 1; Table 1), despite the area’s richness in caves. There are three records from two caves located in the Peloponnesus (Mavry Trypa Cave [42]; Kapsia Cave [13]) and another one from the Aegean Thasos Island (Skala Marion Cave [43]). Additional records come from the northern (Sofular Cave [38] and southern margins of Anatolia (Dim Cave [44]). The Carpathian karst regions is relatively better represented with records from Ceremosnja- [45], Ascunsă- [46], and Urşilor caves [47] and two records from Baradla Cave [48]. Three other speleothems are from the relatively small karstic area in the southern Transdanubia, the Mecsek Hills, two from the Abaliget- [49] and one from the Trió Cave [11,14].
Spatial coverage of records in the 41–44° N latitudinal belt (Figure 1) could be improved with recently published studies from Macedonia [51], Croatia [52] and Bosnia [53] (Table 1). Recently published records from Demänovska Valley [54], Cloşani [10], Tăuşoare-, and Ascunsă caves [55] are also expected to expand the data coverage for the Carpathian region.
Only a few speleothem stable isotope records from the extended karst regions in the northern part of the studied are have been published (e.g., [17,56]. An explanation for this is that the permafrost conditions prevailed around [57] and beneath [58] the former Fennoscandian Ice Sheet, thereby preventing speleothem growth [17] because there was no water movement in the frozen ground. This hypothesis is indirectly supported by a recent study showing flowstone deposition in the Kraków-Częstochowa Upland at 975–470 ka BP [59]), predating the major glaciations in the region. The thawing of this frozen ground could be a prolonged process after deglaciation [60], maintaining unfavorable conditions for speleothem formation. The current karstwater table is near the surface in the Baltic region, creating phreatic conditions (i.e., completely submerged, or partly flooded) already in near surface cavities and subaerial speleothem formation has not been observed in known karst caves [61]. Speleothems were presumably formed in the Baltic region during the pre-Pleistocene [62], but the former vadose zone was denudated by extensive Pleistocene glaciation [63].
Additional identified records (e.g., from the Romanian Carpathians [64,65] the Low Tatras [66] or the Pontides [67,68,69]; Table 1) would help improving the spatiotemporal coverage of the region. A couple of records were not included to the SISAL database yet, either due to difficulties in obtaining data or due to the lack of essential metadata.
3.2. Temporal Distribution of Speleothem Records
The oldest record in the region is the ABA_2 speleothem, collected from Abaliget Cave (Figure 2; Table 1), which spans the period 160.6 to 140.2 ka BP. The period from ~161 to ~109 ka BP is represented by only four records with two overlapping segments. The first overlap occurs between the two Abaliget records from ~143.5 to ~140 ka BP, whereas the second overlap is seen between the Baradla records and the ABA_1 speleothem from 129 to ~123 ka BP. The two Baradla records stopped growing at ~109 ka BP, which is then followed by a ca. 20 kyr-long gap up to ~89.7 ka BP (Figure 2). From ~90 ka BP onwards, there is continuous coverage of both δ18O and δ13C in the region, although the available number of isotopic records for the period 90–10 ka BP is low. The Dim-E3 record spans from ~89.7 to ~12.6 ka BP overlapping with the So-1 record after ~50.3 ka BP (Table 1). These two speleothems are the only records from the region until 10.5 ka BP, when the Leany record starts (Figure 2). The Holocene is the best represented period in the region (Figure 2, Figure 3 and Figure 4), with the interval from ~2.05 to ~1.42 ka BP being covered by 7 records (PU-2, GK-09-02, MAR_L, POM2, CC-1, So-1 and S1). The speleothems Urşilor- and, Mavri Trypa caves’ did not grow between ~3 and ~2.2 ka BP. Their restart in growth falls close to the start of the deposition of CC-1 from cave Ceremosnja at ~2.4 ka BP. The previous observation of no-growth before cca. 2.3 ka in multiple speleothems (Figure 4) might indicate a dry period in South East Europe, although the speleothems from caves Skala Marion, Kapsia and Ascunsă indicate otherwise.
The lack of data around 100 ka BP (from ~109 ka BP to ~89.7 ka BP in Figure 2) has been pointed out in a previous study [75], although radiometric ages from the Carpathian karstic region have been reported for a couple of speleothems during this period (e.g., [76,77]). Moreover, a recent compilation of radiometric ages from more than 90 speleothems and flowstones from the Croatian karst show an even temporal distribution back to the onset of MIS 5 [7], suggesting a good opportunity to develop speleothem stable isotope records for this period. In addition, there is a good chance to further extend the regional dataset beyond MIS 6, as records predating the ones in SISAL_v1 have already been identified from Turkish [69], Macedonian [51], Croatian [78] and Hungarian [79] localities. Moreover, calcareous cave deposits exceeding the current limit of applicability of U-Th dating method (~600 kyr) and for which U-Pb dating methods [80,81] could be applied, have been found in the region [59].
The average length of the records is ~13.8 kyr and the median is 4.9 kyr, including hiatuses. The shortest growth period was 54 yrs (POS-STM-4) and the longest ~77 kyr (Dim-E3). The temporal resolution of the SISAL stable isotope records ranges from sub-decadal (So-1, [38], S1 [42]; Trió, [11] to >1000 yr (Dim-E3, [44]). The average temporal resolution of the records is ~12 yr for the Holocene, while it is generally >50 yr for the pre-Holocene period (Figure 4). The studies following the pioneering record of PU-2 in 2002 [47] achieved characteristically finer temporal resolution (Figure 4), illustrating that both the sampling [84] and dating methods have highly improved over the past decades [85].
4. Environmental Controls on δ13C and δ18O Values in the Eastern Part of Europe and Turkey
4.1. Availability of Cave Monitoring Data
Monitoring of climatic variables and stable isotope compositions of dripwater has been performed for at least one season in seven caves out of 14. In comparison to the whole SISAL_v1 database [30], the proportion of the monitored caves in the region is higher, ~38% vs. ~50%, respectively.
Monitoring of key in-cave variables (e.g., cave temperature, ventilation regime) influencing dripwater hydrology and carbonate saturation conditions provides the basis for a process-based understanding of modern environmental controls on stable isotope composition of speleothem and their growth conditions (e.g., [86,87,88]. In the lack of site-specific information (e.g., infiltration processes, calcite precipitation conditions), most of the paleoclimatic inferences of the early studies, e.g., [17,45], were not able to provide more than simplistic explanations. However, recently this knowledge-gap began to be filled as monitoring studies became abundant in the region [10,86,89,90,91,92,93,94]. This predicts that much more experimental experience is being made available to help the interpretation of the speleothem recorded geochemical signatures over the region in the forthcoming studies.
For example, detailed monitoring enabled a recent study comparing modeled and measured dripwater δ18O values in Postojna Cave [95]. Monthly precipitation amount, δ18O data and monthly evapotranspiration were the input parameters, while mixing and delay processes taking place during infiltration were statistically simulated in the model. Authors found an excellent agreement between the measured δ18Ospel data and the ones calculated using the modeled dripwater δ18O between 1984 and 2002. This argues that the effects and processes governing the δ18Ospel variations are well understood, thus the δ18Ospel signal in that particular system can reliably be interpreted.
4.2. Environmental Controls on Speleothem δ18O
The δ18O values in the surface waters of the Mediterranean Sea are higher than in the Black Sea, and much higher than in the Atlantic Ocean [96]. Together with the distinct evaporative conditions in the Mediterranean, this feature imprints the resultant atmospheric moisture with a source-specific isotopic signature, e.g., [97]. A key driver of changes in moisture transport trajectory in Europe during boreal winter (where most precipitation occurs) is the sea-level pressure (SLP) difference between the Arctic and the subtropical North Atlantic, the North Atlantic Oscillation (NAO; [98]). When the SLP difference is large (positive NAO mode), the main storm-track shifts to the north, transporting moisture and heat to western and northern Europe. When the SLP difference is weak (negative NAO mode), the North Atlantic jet is weakened and shifted to the south, bringing less heat, allowing an excess of Siberian cold air intrusions to the European continent, and bringing more moisture to southern Europe and its surroundings [99], including practically the entire study area. Besides the primary marine sources, recycled moisture from the Eurasian landmass at the eastern part of the region also becomes significant driver in continental areas [37,100,101]. Further, given the moisture transport trajectories from the ocean, weather systems travel a greater distance over land and are therefore affected by the processes of rainout, re-evaporation and moisture mixing in a positive NAO-mode. If precipitation is delivered from a more-distant moisture source (see above), then a larger fraction of the original moisture content is removed via subsequent precipitation events resulting in the continuous and progressive depletion of heavy isotopes in the remaining vapor, and lower δ18O (and also δ2H) in the fallen precipitation [102]. The source specific isotopic signature, modified by the previously mentioned driving processes imprinted into meteoric waters, is then transferred to cave dripwaters, providing the opportunity to use the water stable isotopes of speleothem archives (δ18Ospel, δ2H of speleothem hosted fluid inclusions) as tracers for the intermittent moisture sources in different paleoclimatic conditions, assuming that the speleothem growth rate and the temporal persistence of atmospheric patterns bringing moisture from a given source renders it possible.
A recent global analysis on the oxygen isotope composition of cave drip water showed a pronounced seasonal bias toward the precipitation δ18O (δ18Oprec) of recharge periods in European caves located in a relatively warm and dry climate [103]. Based on the experience gathered from case studies of the study region, the stable isotope compositions of dripwater reflect the amount-weighted annual mean δ18O (and δ2H) of local precipitation, or display a winter dominance, depending on the site-specific infiltration conditions [90,92]. The results of a large-scale simulation model of karstic groundwater recharge over Europe and the Mediterranean have also pointed out that winter half year is the main period of effective infiltration in the study region [40]. Hence the effective δ18O/T slope relevant for the infiltrated water may be expected to fall between the annual and cold seasons’ modern day δ18O/T slopes.
To conduct an analysis of modern day δ18O/T slopes in the region, monthly δ18Oprec values were collected from the Global Network of Isotopes in Precipitation (GNIP [104]) stations of the study region along with monthly gridded precipitation amount, surface air temperature (E-OBS [105]) from the nearest grid cell to the GNIP stations. The time series of the Hurrell PC-Based NAO Index [106] were also gathered for the analysis. Amount-weighted annual and winter (October to March) mean δ18O values were computed. Only years for which GNIP δ18Oprec data is available for enough months to represent >80% of the total annual precipitation and that had at least six years of evaluable data were used. The GNIP data provide a non-continuous coverage of 1961–2017; with an average of 23 and 24 years available for the annual and winter seasons respectively. Arithmetic means of air temperature (°C), total amount of precipitation (mm) and NAO index were also computed for the same intervals. However, for the NAO index only the winter seasonal average was computed and used, because the annual aggregation of the NAO index may mask other atmospheric patterns [107]. The linear regression of the amount weighted δ18Oprec data and meteorological parameters defined their long-term slopes/gradients. Spearman correlation coefficients (rs) between δ18Oprec data and the NAO index was used to evaluate the strength of the relationships.
As a result, a regional pattern may be observed from the modern day δ18O/T slopes (so-called “temperature effect”), making it possible to distinguish between the warm Mediterranean coastal sites and the continental ones. A progressive increase in the δ18O/T slope was detected as moving inland from the Mediterranean to Central Europe (Figure 5a). The temperature effect for annual precipitation ranges from −0.11‰ per °C for Mediterranean sites, and up to 0.75‰ per °C for continental locations (Figure 5a). For the winter half of the year, the values range between −0.04 and 0.83 ‰ per °C, with the steepest gradients again found at the inland sites (Figure 5a). As for the δ18O/precipitation, the relationship is mostly negative, and just occasionally significant in the Aegean region (p < 0.1), and at Zagreb in winter (p < 0.05) (Figure 5b).
According to additional observations, at lower latitudes (<45° N) the δ18Oprec variability negatively correlates with the winter NAO index, though to a rather insignificant degree, except for Ankara (rs = −0.43 p = 0.06; Figure 5c). On the contrary, north of the Adriatic Sea (>45° N), the rank correlation relationship between δ18O and the NAO index is quite strong, and its significance increases towards the central parts of the continent in winter (Figure 5c).
The observed modern day δ18O/T slope is well above the temperature dependence of water-calcite isotopic equilibrium fractionation (−0.24‰ per °C [108]) at the continental locations of the Eastern part of Europe, while a different –insignificant- relation is observed at the coastal sites (Figure 5a). This δ18O/T difference implies that the oxygen isotope composition of speleothems from continental locations from the Eastern part of Europe may well reflect temperature variations, provided that the δ18Oprec signal is transferred to the speleothem carbonate. As a supportive example, an excellent agreement has been found between speleothem δ18Ospel of a modern stalagmite from Postojna Cave (Slovenia) and the regional record of O isotope composition of precipitation between 1984 and 2002 [95].
On the other hand, the lack of significant δ18O/T relationship, together with the occasionally negative correlation with the amount of precipitation in the southern part of the study region (Figure 5a,b) is in line with speleothem-based paleoclimate studies from the same area, which have found that δ18Ospel strongly reflects fluctuations in precipitation amount [13,42,43]. Moreover, the correspondence between the interannual variability of total amount of October–January precipitation and δ18Ospel from the Akcacale Cave (not yet in the database; Table 1) was sufficiently strong to allow the first quantitative reconstruction of amounts of precipitation in late fall and early winter [67,109].
A previous study assessed the spatial variability in European winter δ18Oprec–NAO relationship using GNIP data available at that time [110]. No significant relationship was found for most of the stations analyzed in Eastern part of Europe and Turkey, and this study suggested a weak positive correlation (rs) across this region [110]. However, the current re-evaluation, using an updated GNIP dataset has pointed out a significant and stronger relationship (rs difference > 0.35) between winter δ18Oprec and NAO (avg. n = 24) across East Central Europe. A more recent research also documented positive correlations (δ18Oprec and winter NAO) for Central Europe (GNIP sites west of 17° E and north of 45° N) [111], which are in agreement with the ones obtained from GNIP stations located in the western part of our study area (station codes D, E, F, H in Figure 5c). This provides a new insight into winter δ18Oprec and NAO relationship in Europe.
Besides this continental sub-domain with significant positive correlation, the insignificant δ18Oprec–NAO relationship is more restricted to the southernmost coastal areas (Figure 5c) than previously supposed. This spatial pattern revealed by the present analysis implies that the core region of the positive δ18Oprec–NAO correlation mostly located in Central Europe [110] also extends eastwards. The significant negative correlation of δ18Oprec–NAO in winter season found in Central Anatolia (station code A in Figure 5c) is an additional identified feature compared to the previous results [110].
This positive correlation in and around the Pannonian Basin, however, contradicts expectations. On the basis of the region’s moisture source dynamics, in the case of a negative NAO mode, more Mediterranean 18O-enriched (i.e., higher δ18O) moisture (see Gat et al. [97]) is to be expected at the inland locations, travelling via a shorter transport route that results in less negative δ18Oprec. On the other hand, a positive NAO mode would deliver a dominantly 18O-depleted (i.e., lower δ18O) Atlantic moisture to the continental locations along a relatively longer route that results in more negative δ18Oprec. Since the observed relationship is contrary to the expected, other factors must be considered. A positive NAO state would not only be associated with Atlantic moisture dominance, but also with increased heat transport to Central Europe, with an inverse response (reduced heat transport) in Anatolia [99].
It follows from these considerations that the observed positive δ18Oprec–T and δ18Oprec–NAO relationships at the inland sites, along with the combination of positive δ18Oprec–T and negative δ18Oprec–NAO correlations in central Anatolia, can be attributed to the complex interplay of temperature-related oxygen isotope fractionation along the moisture transport route, plus the effect of moisture source composition. At the inland sites, temperature-related fractionation dominates over the source effect and the NAO influence appears via the heat transport. At the Anatolian site the moisture source effect exceeds the temperature-related isotope shift, inducing a negative δ18Oprec–NAO correlation.
4.3. Environmental Controls on Speleothem δ13C
Based on the review of the speleothem-based paleoclimate studies from the region, it could be deduced that variations of δ13C values are primarily interpreted as a proxy for paleohydrological changes in the studied karstic areas although the highlighted effective/dominant responsible mechanism might be different. Low δ13C values indicate enhanced soil biological activity, which occurs in the case of a rather positive soil water balance (i.e., subsurface water recharge exceeds evapotranspiration) (Abaliget Cave [49], Ascunsă Cave [46], Baradla Cave [74], Trio Cave [11], Skala Marion Cave [43], Mavri Trypa Cave [42], Kapsia Cave [13]) or simplified to corresponding low (high) δ13C values with dry (wet) periods (Urşilor Cave [47], Modrič Cave [41]). The phosphorus contents of the Trió speleothem further support that the δ13C values reflect changes in soil biological activity induced by changes in soil hydro-balance [11]. Unlike in the majority of the area, in the warm semi-arid environments of the Anatolian karst, the secular changes in δ13C may track changes in the dominance of C3 vs. C4 in the vegetation type (Dim Cave [44], Sofular Cave [38]).
The situation can be more complicated for well ventilated caves, where degassing-related kinetic fractionation causes an increase in δ13C values, which partly overprints the paleohydrological signals. Two examples in the region are the Dim E3 and Leány records, which indicated enriched carbon isotope compositions (δ13C > −5‰) compared to the others in the region (Figure 2b) likely due to a ventilation effect; see also Section 5. However, minima in speleothem δ13C curves even in these cases can be regarded as largely unaffected by such kinetic processes [49] and likely reflect wet periods (i.e., positive soil water balance).
5. Regional Patterns in Carbon- and Oxygen Isotope Records
Prior to assessing the regional patterns, the records most prone to kinetic effect must be identified to avoid using records that may not be clear indicators of an environmental change [112]. A weak or no correlation between δ13C and δ18Ospel data is conventionally indicative of deposition of calcite in isotopic equilibrium with the dripwater [113], therefore, the lack of significant correlation between the C and O isotope compositions, as in the case of the ABA_1 (p = 0.044), PU-2 (p = 0.251) and Dim-E4 (p = 0.089) records (Figure S2, Table S1), suggest a quasi-equilibrium carbonate precipitation. In cases where the δ13C and δ18O values are positively correlated with a slope exceeding a value of 1, strong kinetic isotope fractionation effect can be expected to have occurred during carbonate precipitation [114]. The highest positive slope (2.64) with a significant correlation (adjusted R2 = 0.45; p < 6.5 10−15) between δ13C and δ18Ospel values was observed in the CC-1 record. However, this is because the samples were gathered along a radial transect [45], rather than along the growth axis of the speleothem so that the kinetic effect is exaggerated as sampling points are closer to the edge. The strongest correlation (adjusted R2 = 0.64) although with a less steep slope of 0.35 (p < 0.003) is seen in the short dataset of Pos-STM-4 record (Figure S2, Table S1). This kinetic effect was not an issue in the original study, because its primary scope was to detect the increase in 14C activity due to nuclear tests and to model the dynamics of soil carbon pools producing soil CO2 [18]. In addition, other exposed records to kinetic effect were the Dim-E2, E3 and S1 records with significant positive δ13C-δ18Ospel slopes (>1.4; p < 1.7 10−15), which have to be handled with caution in advanced (paleo)climatological studies.
Nowadays, however, a weak correlation between δ13C and δ18Ospel values is less taken to indicate isotopic equilibrium conditions. The replication test which investigates a high degree of coherence between individual δ18O and/or δ13C profiles from different speleothems from the same cave over the common period is a more stringent test of suitability for paleoclimatic studies [115]. Moving from the cave level (speleothems from the same cave [115]) to a regional level (speleothems from a cave system or nearby caves), the SISAL_v1 database and future versions provides a good opportunity for regional replication tests. On the one hand, if the records share common patterns, it might confirm a regional environmental signal, as in the case of e.g., South American Monsoon System [116]. On the other hand, trends and/or anomalies in stable isotope composition of speleothems occurring exclusively in an individual record may be owed to site specific factors. For example, the pronounced 13C enrichment prevailing in the older section of the CC-1 record and preceding the growth stops of S1 is hardly replicated in the coeval speleothems from the region (Figure 3b). This suggests that at least some of their sections carry a strong kinetic effect and should be also treated with caution. It is worth mentioning, that these records (e.g., CC-1, S1) were also among the ones, possibly most affected by kinetic fractionation according to the δ18Ospel vs. δ13C correlation.
5.1. Major Patterns of Speleothem δ13c and δ18o Records in the Eastern Part of Europe and Turkey from the Sisal_V1 Database
An abrupt increase in δ18Ospel values marks the transition from MIS 5e to MIS 6, recorded both in the Abaliget- and Baradla caves’ speleothems (Figure 2a). Positive shifts in δ18Ospel values corresponding to Heinrich events were documented in South Anatolian (Dim Cave [44]) speleothems, and inverse sudden changes in a north Anatolian (Sofular Cave [38]) record. The negative shift in So-1 resonates to a decreased heat transport from the cooled Atlantic inland. The mirrored pattern of δ18O from the Dim speleothems is in agreement with the Levantine records [117]. Hence, these variations can similarly be linked to hydroclimatological changes, i.e., less precipitation.
Regarding the full interval covered by the region’s records, the negative peaks in δ13C at ~120 ka BP and ~43 ka BP are most profoundly replicated by two pairs of records: BAR-II#L and BAR-II#B and So-1 and Dim-E3 respectively (Figure 2b). However, the one at ~43 ka BP is not associated with a concomitant 18O peak (Figure 2).
Comparing late-MIS 6 and MIS 2 glacial patterns, δ18O behave systematically (low δ18Ospel values in glacial and high δ18Ospel values in interglacial times), while the average δ13C of the ABA-1 record (Hungary) in the late-MIS 6 is lower and less variable than the average carbon isotope composition during MIS 2 in Anatolian records (Figure 2). This difference may derive from locally influenced carbon isotope values (e.g., related to ventilation and variable host rock contribution), but it may also be attributed to climatic conditions. Supporting the latter, paleoglaciological reconstructions argue for significantly more extended ice cover in the Dinarides and Hellenides in the MIS 6 compared to MIS 2 [118,119] suggesting more humid conditions. Paleoglaciological and paleobiological evidence argue for a similar MIS 2 vs. MIS 6 contrast regarding hydroclimate in the western Mediterranean (e.g., [120]). This hydroclimatological contrast might be partially reflected in speleothem isotopic records. Following the last glacial maximum (~20 ka BP) all available records (except Dim-E2) indicate an increase in δ18Ospel. The highest change is displayed by the So-1 (~5‰ between 12 ka BP and 8 ka BP). This gradual drift in δ18Ospel was linked to the long-term change in Black Sea moisture contribution [38].
In the Holocene, most of the records’ δ13C values scatter around -10‰ and do not show any common trend or shift (Figure 3b). Important Holocene climate swings in Europe (e.g., 8.2 and 4.2 ka BP events) have been reported in some speleothem records of European subregions [31,121], however such records are not included in the regional—Eastern Europe and Turkey—subset of the current version of the SISAL_v1 database [30]. Negative δ13C anomalies around 3.5 ka BP were recorded in the Sofular- and the Trio cave records, which were attributed to regional climate-change events [14]. The climate change starting at ~3.7 ka BP with shifting to wetter conditions (lower δ13C values), was interrupted by a positive δ13C peak at ~3.6 ka BP (Figure 3c). This prominent δ13C shift has been interpreted as a sign of environmental deterioration induced by the Thera volcanic eruption [14], which was later challenged on the basis of a significant time lag between the deposition of volcanic material and the positive δ13C shift [15].
The strong negative shift in δ13C around 3.6–3.5 ka BP is associated with a negative δ18Ospel peak in both Trio- and So-1 records, likely related to a cold and wet phase [11]. Notably, the MAR_L record [43] replicates this δ13C pattern, although with different pattern in its δ18O values. The low sampling resolution of other currently available records covering the 4 to 3 ka BP period (PU-2, POM2; Figure 4) makes these records unsuitable for contributing to this issue. In the meanwhile, the high-resolution d-excess [122] record of the cave ice deposit from Scărişoara Ice Cave (Romania) shows an abrupt increase at that time, likely suggesting more Mediterranean moisture contribution, accompanying wetter conditions [21].
5.2. Assessment of Spatial Patterns of Speleothem δ18O in the Holocene
The SISAL_v1 database contains 12 records from the Eastern part of Europe and Turkey covering the past 11.7 kyr, with δ18Ospel values ranging between -3 and -12‰ (Figure 3a). The mean δ18O values tend to follow a latitudinal trend, albeit, two records stand out from this pattern. MOD-22 has the highest δ18Ospel values despite not being at the southernmost location, while the So-1 has relatively low δ δ18Ospel values (Figure 3a) despite its host cave not being the northernmost one (Figure 1; Table 1), thus contradicting a putative latitudinal gradient. These low values of So-1 could be driven by moisture, derived from the less evaporated nearby Black Sea [38,39], compared to the strongly evaporated surface waters of the Mediterranean Sea feeding other areas of the region [36].
The relatively higher abundance of data from the mid-Holocene (Figure 3a) provides an additional insight into the spatial trends of δ18Ospel values. Average δ18Ospel values were calculated for contemporarily formed deposits from three separate semi-millennial periods from the Holocene (Figure 6). Unlike previous observations [123] continental trends could not be observed probably due to the limited spatial extent of the available data (latitudinal extent <12°, longitudinal extent <18°; Figure 1). Additionally, the infiltration of precipitation water at individual cave sites is seasonally biased [90,92], resulting in drip waters with varying winter/summer precipitation contributions and consequently changing δ18O values.
However, we found negative correlations between δ18Ospel records from eastern and southeastern Europe and site elevation (Figure 6). This stands even though “elevation m amsl” (Table 1) in the database corresponds to the cave entrance elevation [29,30] rather than the elevation of dripwater recharge area, the latter being the actual controlling factor. It can be assumed that the difference in site elevation primarily represents the difference in infiltration area elevations.
Despite this uncertainty regarding the elevation of the actual recharge area, estimated δ18Ospel elevation gradients for SE Europe calculated for three non-overlapping semi-millennial periods (and excluding records with high risk of kinetic effects as pointed out in Section 5) during the past ~5 kyr suggests that this elevation trend is characteristic of the Holocene. Computed elevation gradients were significant (at p < 0.1 level) in all but one cases and scatter around −0.26‰/100 m.
The documented negative shift in δ18Ospel values with increasing elevation is regulated by two main factors. Depletion of meteoric precipitation in heavy isotopes with elevation is expected [124] and isotopic “elevation effect” in precipitation has been measured in this region as ranging from −0.24‰ per 100 m to −0.39‰ per 100 m [37,88,125,126,127] transferring with a less steep gradient to shallow groundwater (e.g., −0.24 ‰ per 100 m, [128], interquartile margins: −0.11 and −0.24‰ per 100 m, ref. [129] and dripwater (e.g., −0.11‰ per 100 m, [88]). This process may account for most of the variance. Mean surface temperature also decreases with elevation, which is reflected in cave air temperature. Temperature dependent calcite-water fractionation—with a gradient of −0.24‰ per °C [108]—likely plays an additional role.
Whether the δ18Ospel—elevation gradient (Figure 6) prevails over geological timescales, especially under distinct climate settings such as the LGM, can be better explored with an increased number of records, providing a much-improved replication in this specific period. The robustness of these empirical gradients can be further explored extending the study region towards nearby regions [31,117].
6. Stable Isotopic Composition of Fluid Inclusions of Speleothems from South East Europe and Turkey to Complement Paleoenvironmental Implications of δ18Ospel
Stable isotope analyses of inclusion-hosted water were performed on about a third of the speleothems records (n = 18) included in the SISAL_v1 database from the region; six speleothems belonging to four caves. Note, that the fluid inclusion data of the ABA 1 and ABA 2 flowstone cores [49] are unpublished. Out of the 371 speleothem records in the entire SISAL_v1 database, the isotopic composition of fluid inclusions was analyzed only in 27; 6 out of 18 in the study region. Despite the relatively small number of locations studied, stable isotope composition of inclusion-hosted water as a complementary parameter is well represented in the region.
This regional database provides an opportunity to illustrate the auxiliary information of fluid inclusion δ2H in interpreting carbonate stable isotope compositions for paleoclimate inferences. The sub-regional Middle Bronze Age (~3.5 ka BP) climate swing recorded by certain Hungarian, Turkish and Greek speleothems’ δ13C and δ18O records (Section 5.1) coincides with a ~15‰ negative shift of fluid inclusion δ2H of the Trió speleothem peaking at 3.5 ka BP (Figure 3a). This was interpreted as a combined effect of temperature change and an increased contribution of winter precipitation to the infiltration [11]. Detailed paleoclimatological reconstruction for this period is important because archaeological evidence points to substantial societal-changes in the European–Mediterranean region occurring at the same time [11,130,131]. A similar series of temperature and precipitation seasonality changes were inferred for the last interglacial on the base of coupled negative shifts in δ13C, δ18Ospel and fluid inclusion δ2H [48]. These complex paleoenvironmental changes could not have been revealed without the combined assessment of carbonate and fluid inclusion stable isotope compositions illustrating that latter serves as an important paleotemperature proxy.
7. Conclusions and Outlook
The diverse karst landscapes of the Eastern part of Europe and Turkey offer a great potential for reconstructing past environmental changes based on isotope records from speleothems. The regional subset of the first global database on carbonate stable isotope composition (SISAL_v1 [29,30]) includes 18 speleothem records. The number of overlapping records in this subset is generally low, with the most represented period spanning from 5–1 ka BP with 5 to 8 records. The Sofular Cave So-1 record is the only one in the region covering the last glacial cycle and extending into the Holocene. This is an obvious weakness in temporal coverage that should to be improved in the future. Thus, there is a strong need to gather speleothems from this region that provide a continuous record of the environmental response induced by a transition from cold glacial to warm interglacial climate regime.
As documented by most of the case-studies, stable carbon isotope compositions of speleothems of the region generally reflect hydroclimatological signals via related changes in soil activity. In the present study, a spatially complex picture was observed when the modern-day δ18Oprec data were compared with annual and winter climate variables (temperature, precipitation amount and NAO) across the Eastern part of Europe and Turkey (Figure 5). The generally positive δ18O-T relationships are associated with positive δ18O-NAO correlations in eastern Central Europe, and a statistically significant negative δ18O-NAO coefficient in Central Anatolia. These relationships can be attributed to the complex interplay of temperature-dependent oxygen isotope fractionation in meteoric waters and δ18O differences in the moisture source regions, i.e., 18O-depleted Atlantic and 18O-enriched Mediterranean areas. The strong positive δ18O-T relationships at the inland sites reflect the effect of NAO-driven heat transport that should be evaluated at the individual locations of future paleoclimatic studies.
The limited number of records in the regional subset of SISAL_v1 reflect the expected contrast between glacial and inter-glacial conditions. Low δ18Ospel values dominated glacial periods and high ones characterized interglacial times. Regarding glacial times, the few available glacial δ13C records (Abaliget Cave (S Hungary), Sofular- and Dim caves (Turkey)) suggest a difference between MIS6 and MIS2 periods with the former assumed to be more humid than the latter.
Systematic δ13C or δ18Ospel shifts or drifts have not been observed in the Holocene apart from the period of 4 to 3 ka BP, which is characterized by a series of corresponding isotope shifts in different records. This presumed Middle Bronze Age climate fluctuation is further confirmed by speleothem derived fluid inclusion δ2H from the area, which aid the complex paleoclimatological interpretation [11]. It would be intriguing to further explore the presence of the “~3.5 ka event” in other records from the Eastern part of Europe and Turkey and compare the observations on a larger geographical scale.
The limited horizontal extent of the area covered by the regional subset, did not allow to confirm the existence of longitudinal trends in δ18Ospel data across south-eastern Europe during the Holocene. However, examination of elevation gradients from South East Europe suggested a long-term elevational gradient in δ18Ospel values (around −0.26‰ 100 m−1) during the Holocene.
Expansion of the database by including recently published data, and exploration and exploitation of regions such as the Dinaric Karst [7] will yield more information in the near future. The number of identified, but not yet included records (Table 1) will obviously increase the probability to explore common temporal patterns in δ13C and δ18Ospel data in a spatially robust way. The combined use of additional parameters complementary to carbonate stable isotopes from speleothems (e.g., radiocarbon activity data, trace element content, δ2H of fluid inclusion) and other sources (e.g., paleobiological and archaeological information, etc.) are needed to improve our understanding on the environmental response of surface- and subsurface systems to climate changes. Lastly, it should be emphasized that speleothem derived paleoenvironmental data—typically unevenly spaced and associated with timescale error should be assessed using proper statistical tools [132,133] capable to provide more robust results in speleothem paleoclimatology than before.
Supplementary Materials
The following are available online at https://0-www-mdpi-com.brum.beds.ac.uk/2571-550X/2/3/31/s1; Figure S1: Climate of the Eastern Europe & Turkey SISAL region; Figure S2: Cross plot of δ13C vs. δ18O; Table S1: Statistics for the regression models δ13C vs. δ18O.
Author Contributions
Conceptualization, Z.K.; Software, I.G.H.; Visualization, I.G.H; Writing – original draft, Z.K. and I.G.H.; Writing – review & editing, Z.K., A.D., A.P. and I.G.H. We applied the FLAE approach for the sequence of authors; see 10.1371/journal.pbio.0050018.
Funding
This research was funded by the Hungarian Academy of Sciences (MTA “Lendület” program; LP2012-27/2012), the work of IGH by the János Bolyai Research Scholarship of the Hungarian Academy of Sciences. A.P. was partially supported by UEFISCDI Romania through grant no PN-III-P1-1.1-TE-2016-2210.
Acknowledgments
Authors thank all colleagues involved in SISAL for intriguing discussions and collaboration on the preparation of this manuscript. SISAL is a working group of the Past Global Changes (PAGES) programme and we thank PAGES for their support of this activity. We are grateful to Andy Baker, Sandy Harrison and Laia Comas-Bru for detailed and constructive criticism. Authors also thank the members of the World Karst Aquifer Mapping project for providing the shape file used to derive the carbonate aquifer maps (Figure 2) and acknowledge the E-OBS dataset from the EU-FP6 project UERRA (http://www.uerra.eu) and the Copernicus Climate Change Service, and the data providers in the ECA&D project (https://www.ecad.eu). In addition, we thank Laia Comas-Bru for plotting Figure 1 and Figure 4 for the study.
Conflicts of Interest
The authors declare no conflict of interest. The funders had no role in the design of the study; in the collection, analyses, or interpretation of data; in the writing of the manuscript, or in the decision to publish the results.
References
- Cvijić, J. Das Karstphänomen: Versuch Einer Morphologischen Monographie. Ph.D. Thesis, Universität Wien, Vienna, Austria, 1983. [Google Scholar]
- Cvijic, J. Hydrographie souterraine et évolution morphologique du karst. Rev. Géographie Alp. 1918, 6, 375–426. [Google Scholar] [CrossRef]
- von Terzaghi, C. Beitrag zur Hydrographie und Morphologie des Kroatischen Karstes; Buchdruckerei des Franklin-vereins: Budapest, Hungary, 1913. [Google Scholar]
- Gabrovšek, F. 60 years of Karst Research Institute ZRC SAZU: The insider’s story of Who is Who at the Karst Research Institute. Acta Carsologica 2007, 36, 353–355. [Google Scholar] [CrossRef]
- Racoviţă, G. The Founder of Biospeleology and World’s First Speleological Institute. In Cave and Karst Systems of Romania; Ponta, G.M.L., Onac, B.P., Eds.; Springer: Cham, Switzerland, 2019; pp. 1–3. [Google Scholar]
- Surić, M. Submarine karst of Croatia-evidence of former lower sea levels. Acta Carsologica 2002, 31, 89–98. [Google Scholar] [CrossRef]
- Surić, M. Speleothem-based Quaternary research in Croatian karst—A review. Quat. Int. 2018, 490, 113–122. [Google Scholar] [CrossRef]
- Nita, D.; Richards, D.; Surić, M.; De Waele, J. MC-ICPMS U-Th age determinations on altered submerged speleothems from Croatia. In Proceedings of the NSF Workshop “Sea-level Changes into MIS 5: From observations to prediction”, Palma de Mallorca, Spain, 10–14 April 2012. [Google Scholar]
- Surić, M.; Richards, D.A.; Hoffmann, D.L.; Tibljaš, D.; Juračić, M. Sea-level change during MIS 5a based on submerged speleothems from the eastern Adriatic Sea (Croatia). Mar. Geol. 2009, 262, 62–67. [Google Scholar] [CrossRef]
- Warken, S.F.; Fohlmeister, J.; Schröder-Ritzrau, A.; Constantin, S.; Spötl, C.; Gerdes, A.; Esper, J.; Frank, N.; Arps, J.; Terente, M.; et al. Reconstruction of late Holocene autumn/winter precipitation variability in SW Romania from a high-resolution speleothem trace element record. Earth Planet. Sci. Lett. 2018, 499, 122–133. [Google Scholar] [CrossRef]
- Demény, A.; Kern, Z.; Czuppon, G.; Németh, A.; Schöll-Barna, G.; Siklósy, Z.; Leél-Őssy, S.; Cook, G.; Serlegi, G.; Bajnóczi, B.; et al. Middle Bronze Age humidity and temperature variations, and societal changes in East-Central Europe. Quat. Int. 2019, 504, 80–95. [Google Scholar] [CrossRef] [Green Version]
- Ünal-İmer, E.; Shulmeister, J.; Zhao, J.-X.; Uysal, I.T.; Feng, Y.-X. High-resolution trace element and stable/radiogenic isotope profiles of late Pleistocene to Holocene speleothems from Dim Cave, SW Turkey. Palaeogeogr. Palaeoclimatol. Palaeoecol. 2016, 452, 68–79. [Google Scholar] [CrossRef]
- Finné, M.; Bar-Matthews, M.; Holmgren, K.; Sundqvist, H.S.; Liakopoulos, I.; Zhang, Q. Speleothem evidence for late Holocene climate variability and floods in Southern Greece. Quat. Res. 2014, 81, 213–227. [Google Scholar] [CrossRef]
- Siklósy, Z.; Demény, A.; Vennemann, T.W.; Pilet, S.; Kramers, J.; Leél-Őssy, S.; Bondár, M.; Shen, C.-C.; Hegner, E. Bronze Age volcanic event recorded in stalagmites by combined isotope and trace element studies. Rapid Commun. Mass Spectrom. 2009, 23, 801–808. [Google Scholar] [CrossRef]
- Badertscher, S.; Borsato, A.; Frisia, S.; Cheng, H.; Edwards, R.L.; Tüysüz, O.; Fleitmann, D. Speleothems as sensitive recorders of volcanic eruptions—The Bronze Age Minoan eruption recorded in a stalagmite from Turkey. Earth Planet. Sci. Lett. 2014, 392, 58–66. [Google Scholar] [CrossRef]
- Siklósy, Z.; Kern, Z.; Demeny, A.; Pilet, S.; Leel-Ossy, S.; Lin, K.; Shen, C.-C.; Széles, E.; Breitner, D. Speleothems and pine trees as sensitive indicators of environmental pollution—A case study of the effect of uranium-ore mining in Hungary. Appl. Geochem. 2011, 26, 666–678. [Google Scholar] [CrossRef]
- Pazdur, A.; Pazdur, M.F.; Pawlyta, J.; Górny, A.; Olszewski, M. Paleoclimatic Implications of Radiocarbon Dating Of Speleothems from the Cracow-Wieluń Upland, Southern Poland. Radiocarbon 1995, 37, 103–110. [Google Scholar] [CrossRef]
- Genty, D.; Vokal, B.; Obelic, B.; Massault, M. Bomb 14C time history recorded in two modern stalagmites—Importance for soil organic matter dynamics and bomb 14C distribution over continents. Earth Planet. Sci. Lett. 1998, 160, 795–809. [Google Scholar] [CrossRef]
- Lauritzen, S.-E.; Onac, B.P. Isotopic stratigraphy of a last interglacial stalagmite from northwestern Romania: Correlation with the deep-sea record and northern-latitude speleothem. J. Caves Karst Stud. 1999, 61, 22–29. [Google Scholar]
- Comas-Bru, L.; Harrison, S.P. SISAL: Bringing Added Value to Speleothem Research. Quaternary 2019, 2, 7. [Google Scholar] [CrossRef]
- Perșoiu, A.; Onac, B.P.; Wynn, J.G.; Blaauw, M.; Ionita, M.; Hansson, M. Holocene winter climate variability in Central and Eastern Europe. Sci. Rep. 2017, 7, 1196. [Google Scholar] [CrossRef]
- Johnston, V.E.; McDermott, F.; Tămaş, T. A radiocarbon dated bat guano deposit from N.W. Romania: Implications for the timing of the Little Ice Age and Medieval Climate Anomaly. Palaeogeogr. Palaeoclimatol. Palaeoecol. 2010, 291, 217–227. [Google Scholar] [CrossRef]
- Forray, F.L.; Onac, B.P.; Tanţău, I.; Wynn, J.G.; Tămaş, T.; Coroiu, I.; Giurgiu, A.M. A Late Holocene environmental history of a bat guano deposit from Romania: An isotopic, pollen and microcharcoal study. Quat. Sci. Rev. 2015, 127, 141–154. [Google Scholar] [CrossRef]
- Cleary, D.M.; Onac, B.P.; Tanţău, I.; Forray, F.L.; Wynn, J.G.; Ionita, M.; Tămaş, T. A guano-derived δ13C and δ15N record of climate since the Medieval Warm Period in north-west Romania. J. Quat. Sci. 2018, 33, 677–688. [Google Scholar] [CrossRef]
- Harmon, R.S.; Schwarcz, H.P. Changes of 2H and 18O enrichment of meteoric water and Pleistocene glaciation. Nature 1981, 290, 125–128. [Google Scholar] [CrossRef]
- Yonge, C.J. Stable isotope Studies of Water Extracted from Speleothems. Ph.D. Thesis, McMaster University, Hamilton, ON, Canada, 1982. [Google Scholar]
- Demény, A.; Czuppon, G.; Kern, Z.; Leél-Őssy, S.; Németh, A.; Szabó, M.; Tóth, M.; Wu, C.-C.; Shen, C.-C.; Molnár, M.; et al. Recrystallization-induced oxygen isotope changes in inclusion-hosted water of speleothems—Paleoclimatological implications. Quat. Int. 2016, 415, 25–32. [Google Scholar] [CrossRef]
- McDermott, F. Palaeo-climate reconstruction from stable isotope variations in speleothems: A review. Quat. Sci. Rev. 2004, 23, 901–918. [Google Scholar] [CrossRef]
- Atsawawaranunt, K.; Comas-Bru, L.; Amirnezhad Mozhdehi, S.; Deininger, M.; Harrison, S.P.; Baker, A.; Boyd, M.; Kaushal, N.; Ahmad, S.M.; Ait Brahim, Y.; et al. The SISAL database: A global resource to document oxygen and carbon isotope records from speleothems. Earth Syst. Sci. Data 2018, 10, 1687–1713. [Google Scholar] [CrossRef]
- Atsawawaranunt, K.; Harrison, S.; Comas-Bru, L. SISAL (Speleothem Isotopes Synthesis and AnaLysis Working Group) Database Version 1.0, 1st ed.; University of Reading: Reading, UK, 2018. [Google Scholar]
- Lechleitner, F.A.; Amirnezhad-Mozhdehi, S.; Columbu, A.; Comas-Bru, L.; Labuhn, I.; Pérez-Mejías, C.; Rehfeld, K. The Potential of Speleothems from Western Europe as Recorders of Regional Climate: A Critical Assessment of the SISAL Database. Quaternary 2018, 1, 30. [Google Scholar] [CrossRef]
- Kottek, M.G.; Grieser, J.; Beck, C.; Rudolf, B.; Rubel, F. World Map of the Köppen-Geiger climate classification updated. Meteorol. Z. 2006, 15, 259–263. [Google Scholar] [CrossRef]
- Mätlik, O.; Post, P. Synoptic weather types that have caused heavy precipitation in Estonia in the period 1961–2005. Est. J. Eng. 2008, 14, 195–208. [Google Scholar] [CrossRef]
- Gómez-Hernández, M.; Drumond, A.; Gimeno, L.; Garcia-Herrera, R. Variability of moisture sources in the Mediterranean region during the period 1980–2000. Water Resour. Res. 2013, 49, 6781–6794. [Google Scholar] [CrossRef]
- Krklec, K.; Domínguez-Villar, D.; Lojen, S. The impact of moisture sources on the oxygen isotope composition of precipitation at a continental site in central Europe. J. Hydrol. 2018, 561, 810–821. [Google Scholar] [CrossRef]
- Ciric, D.; Nieto, R.; Losada, L.; Drumond, A.; Gimeno, L. The Mediterranean Moisture Contribution to Climatological and Extreme Monthly Continental Precipitation. Water 2018, 10, 519. [Google Scholar] [CrossRef]
- Bădăluță, C.-A.; Perșoiu, A.; Ionita, M.; Nagavciuc, V.; Bistricean, P.-I. Stable isotope-based investigation of moisture sources and their role in river and groundwater recharge in the NE Carpathian Mountains, East-Central Europe. Isot. Health Environ. Stud. 2019, 55, 161–178. [Google Scholar] [CrossRef] [PubMed]
- Fleitmann, D.; Cheng, H.; Badertscher, S.; Edwards, R.L.; Mudelsee, M.; Göktürk, O.M.; Fankhauser, A.; Pickering, R.; Raible, C.C.; Matter, A.; et al. Timing and climatic impact of Greenland interstadials recorded in stalagmites from northern Turkey. Geophys. Res. Lett. 2009, 36. [Google Scholar] [CrossRef] [Green Version]
- Göktürk, O.M.; Fleitmann, D.; Badertscher, S.; Cheng, H.; Edwards, R.L.; Leuenberger, M.; Fankhauser, A.; Tüysüz, O.; Kramers, J. Climate on the southern Black Sea coast during the Holocene: Implications from the Sofular Cave record. Quat. Sci. Rev. 2011, 30, 2433–2445. [Google Scholar] [CrossRef]
- Hartmann, A.; Gleeson, T.; Rosolem, R.; Pianosi, F.; Wada, Y.; Wagener, T. A large-scale simulation model to assess karstic groundwater recharge over Europe and the Mediterranean. Geosci. Model Dev. 2015, 8, 1729–1746. [Google Scholar] [CrossRef] [Green Version]
- Rudzka, D.; McDermott, F.; Surić, M. A late Holocene climate record in stalagmites from Modrič Cave (Croatia). J. Quat. Sci. 2012, 27, 585–596. [Google Scholar] [CrossRef]
- Finné, M.; Holmgren, K.; Shen, C.-C.; Hu, H.-M.; Boyd, M.; Stocker, S. Late Bronze Age climate change and the destruction of the Mycenaean Palace of Nestor at Pylos. PLoS ONE 2017, 12, e0189447. [Google Scholar] [CrossRef] [PubMed]
- Psomiadis, D.; Dotsika, E.; Albanakis, K.; Ghaleb, B.; Hillaire-Marcel, C. Speleothem record of climatic changes in the northern Aegean region (Greece) from the Bronze Age to the collapse of the Roman Empire. Palaeogeogr. Palaeoclimatol. Palaeoecol. 2018, 489, 272–283. [Google Scholar] [CrossRef]
- Ünal-İmer, E.; Shulmeister, J.; Zhao, J.-X.; Tonguç Uysal, I.; Feng, Y.-X.; Duc Nguyen, A.; Yüce, G. An 80 kyr-long continuous speleothem record from Dim Cave, SW Turkey with paleoclimatic implications for the Eastern Mediterranean. Sci. Rep. 2015, 5, 13560. [Google Scholar] [CrossRef]
- Kacanski, A.; Carmi, I.; Shemesh, A.; Kronfeld, J.; Yam, R.; Flexer, A. Late Holocene Climatic Change in the Balkans: Speleothem Isotopic Data from Serbia. Radiocarbon 2001, 43, 647–658. [Google Scholar] [CrossRef] [Green Version]
- Drăguşin, V.; Staubwasser, M.; Hoffmann, D.L.; Ersek, V.; Onac, B.P.; Veres, D. Constraining Holocene hydrological changes in the Carpathian–Balkan region using speleothem δ18O and pollen-based temperature reconstructions. Clim. Past 2014, 10, 1363–1380. [Google Scholar] [CrossRef]
- Onac, B.P.; Constantin, S.; Lundberg, J.; Lauritzen, S.-E. Isotopic climate record in a Holocene stalagmite from Ursilor Cave (Romania). J. Quat. Sci. 2002, 17, 319–327. [Google Scholar] [CrossRef]
- Demény, A.; Kern, Z.; Czuppon, G.; Németh, A.; Leél-Őssy, S.; Siklósy, Z.; Lin, K.; Hu, H.-M.; Shen, C.-C.; Vennemann, T.W.; et al. Stable isotope compositions of speleothems from the last interglacial—Spatial patterns of climate fluctuations in Europe. Quat. Sci. Rev. 2017, 161, 68–80. [Google Scholar] [CrossRef]
- Koltai, G.; Spötl, C.; Shen, C.-C.; Wu, C.-C.; Rao, Z.; Palcsu, L.; Kele, S.; Surányi, G.; Bárány-Kevei, I. A penultimate glacial climate record from southern Hungary. J. Quat. Sci. 2017, 32, 946–956. [Google Scholar] [CrossRef]
- Chen, Z.; Auler, A.S.; Bakalowicz, M.; Drew, D.; Griger, F.; Hartmann, J.; Jiang, G.; Moosdorf, N.; Richts, A.; Stevanovic, Z.; et al. The World Karst Aquifer Mapping project: Concept, mapping procedure and map of Europe. Hydrogeol. J. 2017, 25, 771–785. [Google Scholar] [CrossRef]
- Regattieri, E.; Zanchetta, G.; Isola, I.; Bajo, P.; Perchiazzi, N.; Drysdale, R.N.; Boschi, C.; Hellstrom, J.C.; Francke, A.; Wagner, B. A MIS 9/MIS 8 speleothem record of hydrological variability from Macedonia (F.Y.R.O.M.). Glob. Planet. Chang. 2018, 162, 39–52. [Google Scholar] [CrossRef]
- Lončar, N.; Bar-Matthews, M.; Avalon, A.; Surić, M.; Faivre, S. Early and mid-holocene environmental conditions in the eastern Adriatic recorded in speleotherms from Mala Špilja cave and Velika Špilja cave (Mljet island, Croatia). Acta Carsologica 2017, 46, 229–249. [Google Scholar] [CrossRef]
- Chiarini, V.; Couchoud, I.; Drysdale, R.; Bajo, P.; Milanolo, S.; Frisia, S.; Greig, A.; Hellstrom, J.; De Waele, J. Petrographical and geochemical changes in Bosnian stalagmites and their palaeo-environmental significance. Int. J. Speleol. 2017, 46, 33–49. [Google Scholar] [CrossRef] [Green Version]
- Benson, A.; Hoffmann, D.L.; Bella, P.; Drury, A.J.; Hercman, H.; Atkinson, T.C. Building robust age models for speleothems—A case-study using coeval twin stalagmites. Quat. Geochronol. 2018, 43, 83–90. [Google Scholar] [CrossRef]
- Staubwasser, M.; Drăgușin, V.; Onac, B.P.; Assonov, S.; Ersek, V.; Hoffmann, D.L.; Veres, D. Impact of climate change on the transition of Neanderthals to modern humans in Europe. Proc. Natl. Acad. Sci. USA 2018, 115, 9116–9121. [Google Scholar] [CrossRef] [Green Version]
- Urban, J.; Margielewski, W.; Žák, K.; Hercman, H.; Sujka, G.; Mleczek, T. The calcareous speleothems in the pseudokarst Jaskinia Słowiańska-Drwali cave, Beskid Niski Mts., Poland. Nat. Conserv. 2007, 63, 119–128. [Google Scholar]
- Lindgren, A.; Hugelius, G.; Kuhry, P.; Christensen, T.R.; Vandenberghe, J. GIS-based Maps and Area Estimates of Northern Hemisphere Permafrost Extent during the Last Glacial Maximum. Permafr. Periglac. Process. 2016, 27, 6–16. [Google Scholar] [CrossRef]
- Szewczyk, J. The deep-seated lowland relict permafrost from the Suwałki region (NE Poland)—Analysis of conditions of its development and preservation. Geol. Q. 2017, 61, 845–858. [Google Scholar] [CrossRef]
- Błaszczyk, M.; Hercman, H.; Pawlak, J.; Gąsiorowski, M.; Matoušková, Š.; Aninowska, M.; Kicińska, D.; Tyc, A. Low to middle Pleistocene paleoclimatic record from the Kraków-Częstochowa Upland (Poland) based on isotopic and calcite fabrics analyses. Geochronometria 2018, 45, 185–197. [Google Scholar] [CrossRef]
- Majorowicz, J. Permafrost at the Ice Base of Recent Pleistocene Glaciations–Inferences from Borehole Temperature Profiles. Bull. Geogr. 2012, 5, 7–28. [Google Scholar] [CrossRef]
- Koit, O. The distribution and development of karst in Estonia. Dyn. Environ. 2019, 39. in press. [Google Scholar]
- Eensaar, J.; Pani, T.; Gaskov, M.; Sepp, H.; Kirsimae, K. Stable isotope composition of hypogenic speleothem calcite in Kalana (Estonia) as a record of microbial methanotrophy and fluid evolution. Geol. Mag. 2017, 154, 57–67. [Google Scholar] [CrossRef]
- Heinsalu, Ü. Stalaktiidid Eestis. Eest. Lood. 1984, 1, 36–39. [Google Scholar]
- Tămaş, T.; Onac, B.P.; Bojar, A.-V. Lateglacial-Middle Holocene stable isotope records in two coeval stalagmites from the Bihor Mountains, NW Romania. Geol. Q. 2005, 49, 185–194. [Google Scholar]
- Constantin, S.; Bojar, A.-V.; Lauritzen, S.-E.; Lundberg, J. Holocene and Late Pleistocene climate in the sub-Mediterranean continental environment: A speleothem record from Poleva Cave (Southern Carpathians, Romania). Palaeogeogr. Palaeoclimatol. Palaeoecol. 2007, 243, 322–338. [Google Scholar] [CrossRef]
- Pawlak, J.; Hercman, H. Numerical correlation of speleothem stable isotope records using a genetic algorithm. Quat. Geochronol. 2016, 33, 1–12. [Google Scholar] [CrossRef]
- Jex, C.N.; Baker, A.; Eden, J.M.; Eastwood, W.J.; Fairchild, I.J.; Leng, M.J.; Thomas, L.; Sloane, H.J. A 500 yr speleothem-derived reconstruction of late autumn–winter precipitation, northeast Turkey. Quat. Res. 2011, 75, 399–405. [Google Scholar] [CrossRef]
- Rowe, P.J.; Mason, J.E.; Andrews, J.E.; Marca, A.D.; Thomas, L.; van Calsteren, P.; Jex, C.N.; Vonhof, H.B.; Al-Omari, S. Speleothem isotopic evidence of winter rainfall variability in northeast Turkey between 77 and 6 ka. Quat. Sci. Rev. 2012, 45, 60–72. [Google Scholar] [CrossRef]
- Badertscher, S.; Fleitmann, D.; Cheng, H.; Edwards, R.L.; Göktürk, O.M.; Zumbühl, A.; Leuenberger, M.; Tüysüz, O. Pleistocene water intrusions from the Mediterranean and Caspian seas into the Black Sea. Nat. Geosci. 2011, 4, 236–239. [Google Scholar] [CrossRef]
- Constantin, S.; Lauritzen, S.E.; Lundberg, J. New data on the chronology of the Termination II and paleoclimate during MIS-5, based on the study of a stalagmite from Closani Cave (SW Romania). Arch. Clim. Chang. Karst Karst Waters Inst. Spec. Publ. 2006, 10, 98–100. [Google Scholar]
- Tămaş, T.; Bojar, A.-V.; Constantin, S.; Lauritzen, S.-E. The δ18O record of a Holocene stalagmite from V11 Cave, NW Romania. Studia UBB 2007, 57, 77–79. [Google Scholar]
- Demény, A.; Czuppon, G.; Siklósy, Z.; Leél-Őssy, S.; Lin, K.; Shen, C.-C.; Gulyás, K. Mid-Holocene climate conditions and moisture source variations based on stable H, C and O isotope compositions of speleothems in Hungary. Quat. Int. 2013, 293, 150–156. [Google Scholar] [CrossRef]
- Siklósy, Z.; Demény, A.; Szenthe, I.; Leél-Őssy, S.; Pilet, S.; Lin, Y.; Shen, C.-C. Reconstruction of climate variation for the last millennium in the Bükk Mountains, northeast Hungary, from a stalagmite record. Q. J. Hung. Meteorol. Serv. 2009, 113, 245–263. [Google Scholar]
- Demény, A.; Németh, A.; Kern, Z.; Czuppon, G.; Molnár, M.; Leél-Őssy, S.; Óvári, M.; Stieber, J. Recently forming stalagmites from the Baradla Cave and their suitability assessment for climate–proxy relationships. Cent. Eur. Geol. 2017, 60, 1–34. [Google Scholar] [CrossRef]
- Siklósy, Z.; Demény, A.; Leél-Őssy, S.; Szenthe, I.; Lauritzen, S.-E.; Shen, C.-C. A cseppkövek kormeghatározása és azok paleoklimatológiai jelentősége. Földtani Közlöny 2011, 141, 1–100. [Google Scholar]
- Onac, B.P.; Lauritzen, S. The Climate of the Last 150,000 Years Recorded Inspeleothems: Preliminary Results from North-Western Romania. Theor. Appl. Karstol. 1996, 9, 9–21. [Google Scholar]
- Constantin, S.; Lauritzen, S.-E. Speleothem datings in SW Romania. Theor. Appl. Karstol. 1998, 11–12, 35–45. [Google Scholar]
- Surić, M.; Lončarić, R.; Lončar, N.; Bočić, N.; Bajo, P.; Columbu, A.; Drysdale, R.N.; Hellstrom, J.C. Eastern Adriatic Paleoenvironmental Changes Recorded from MIS 10 to the Recent in the Modrič Cave (Croatia) Speleothems–Preliminary Report; Climate Change: The Karst Record. 8th International Conference KR8; University of Texas: Austin, TX, USA, 2017; p. 105. [Google Scholar]
- Demény, A.; Leél-Őssy, S.; Shen, C.-C.; Surányi, G. Middle Pleistocene Speleothem Record from the Baradla Cave, Northeast Hungary. Geophys. Res. Abstr. 2018, 20, EGU2018-8894. [Google Scholar]
- Hellstrom, J.; Pickering, R. Recent advances and future prospects of the U–Th and U–Pb chronometers applicable to archaeology. J. Archaeol. Sci. 2015, 56, 32–40. [Google Scholar] [CrossRef]
- Richards, D.A.; Bottrell, S.H.; Cliff, R.A.; Ströhle, K.; Rowe, P.J. U-Pb dating of a speleothem of Quaternary age. Geochim. Cosmochim. Acta 1998, 62, 3683–3688. [Google Scholar] [CrossRef]
- Lisiecki, L.E.; Raymo, M.E. A Pliocene-Pleistocene stack of 57 globally distributed benthic δ18O records. Paleoceanography 2005, 20, PA1003. [Google Scholar] [CrossRef]
- Heinrich, H. Origin and Consequences of Cyclic Ice Rafting in the Northeast Atlantic Ocean During the Past 130,000 Years. Quat. Res. 1988, 29, 142–152. [Google Scholar] [CrossRef]
- Spötl, C.; Mattey, D. Stable isotope microsampling of speleothems for palaeoenvironmental studies: A comparison of microdrill, micromill and laser ablation techniques. Chem. Geol. 2006, 235, 48–58. [Google Scholar] [CrossRef]
- Hellstrom, J. Rapid and accurate U/Th dating using parallel ion-counting multi-collector ICP-MS. J. Anal. At. Spectrom. 2003, 18, 1346–1351. [Google Scholar] [CrossRef]
- Drăguşin, V.; Balan, S.; Blamart, D.; Forray, F.L.; Marin, C.; Mirea, I.; Nagavciuc, V.; Orăşeanu, I.; Perşoiu, A.; Tîrlă, L.; et al. Transfer of environmental signals from the surface to the underground at Ascunsă Cave, Romania. Hydrol. Earth Syst. Sci. 2017, 21, 5357–5373. [Google Scholar] [CrossRef]
- Riechelmann, D.F.C.; Schröder-Ritzrau, A.; Scholz, D.; Fohlmeister, J.; Spötl, C.; Richter, D.K.; Mangini, A. Monitoring Bunker Cave (NW Germany): A prerequisite to interpret geochemical proxy data of speleothems from this site. J. Hydrol. 2011, 409, 682–695. [Google Scholar] [CrossRef]
- Surić, M.; Lončarić, R.; Lončar, N.; Buzjak, N.; Bajo, P.; Drysdale, R.N. Isotopic characterization of cave environments at varying altitudes on the eastern Adriatic coast (Croatia)—Implications for future speleothem-based studies. J. Hydrol. 2017, 545, 367–380. [Google Scholar] [CrossRef]
- Surić, M.; Lončarić, R.; Bočić, N.; Lončar, N.; Buzjak, N. Monitoring of selected caves as a prerequisite for the speleothem-based reconstruction of the Quaternary environment in Croatia. Quat. Int. 2018, 494, 263–274. [Google Scholar] [CrossRef]
- Surić, M.; Roller-Lutz, Z.; Mandić, M.; Bronić, I.K.; Juračić, M. Modern C, O, and H isotope composition of speleothem and dripwater from Modrič Cave, eastern Adriatic coast (Croatia). Int. J. Speleol. 2010, 39, 91–97. [Google Scholar] [CrossRef]
- Ersek, V.; Onac, B.P.; Perșoiu, A. Kinetic processes and stable isotopes in cave dripwaters as indicators of winter severity. Hydrol. Process. 2018, 32, 2856–2862. [Google Scholar] [CrossRef] [Green Version]
- Czuppon, G.; Bočić, N.; Buzjak, N.; Óvári, M.; Molnár, M. Monitoring in the Barać and Lower Cerovačka caves (Croatia) as a basis for the characterization of the climatological and hydrological processes that control speleothem formation. Quat. Int. 2018, 494, 52–65. [Google Scholar] [CrossRef]
- Czuppon, G.; Demény, A.; Leél-Őssy, S.; Óvari, M.; Molnár, M.; Stieber, J.; Kiss, K.; Kármán, K.; Surányi, G.; Haszpra, L. Cave monitoring in the Béke and Baradla caves (Northeastern Hungary): Implications for the conditions for the formation cave carbonates. Int. J. Speleol. 2018, 47, 13–28. [Google Scholar] [CrossRef]
- Fehér, K.; Kovács, J.; Márkus, L.; Borbás, E.; Tanos, P.; Hatvani, I.G. Analysis of drip water in an urban karst cave beneath the Hungarian capital (Budapest). Acta Carsologica 2016, 45, 213–231. [Google Scholar] [CrossRef]
- Domínguez-Villar, D.; Lojen, S.; Krklec, K.; Kozdon, R.; Edwards, R.L.; Cheng, H. Ion microprobe δ18O analyses to calibrate slow growth rate speleothem records with regional δ18O records of precipitation. Earth Planet. Sci. Lett. 2018, 482, 367–376. [Google Scholar] [CrossRef]
- LeGrande, A.N.; Schmidt, G.A. Global gridded data set of the oxygen isotopic composition in seawater. Geophys. Res. Lett. 2006, 33. [Google Scholar] [CrossRef] [Green Version]
- Gat, J.R.; Klein, B.; Kushnir, Y.; Roether, W.; Wernli, H.; Yam, R.; Shemesh, A. Isotope composition of air moisture over the Mediterranean Sea: An index of the air-sea interaction pattern. Tellus B 2003, 55, 953–965. [Google Scholar] [CrossRef]
- Hurrell, J.W. Decadal Trends in the North Atlantic Oscillation: Regional Temperatures and Precipitation. Science 1995, 269, 676–679. [Google Scholar] [CrossRef] [PubMed] [Green Version]
- Trigo, R.M.; Osborn, T.J.; Corte-Real, J.M. The North Atlantic Oscillation influence on Europe: Climate impacts and associated physical mechanisms. Clim. Res. 2002, 20, 9–17. [Google Scholar] [CrossRef]
- Bojar, A.-V.; Ottner, F.; Bojar, H.-P.; Grigorescu, D.; Perşoiu, A. Stable isotope and mineralogical investigations on clays from the Late Cretaceous sequences, Haţeg Basin, Romania. Appl. Clay Sci. 2009, 45, 155–163. [Google Scholar] [CrossRef]
- Vystavna, Y.; Holko, L.; Hejzlar, J.; Perșoiu, A.; Graham, N.D.; Juras, R.; Huneau, F.; Gibson, J. Isotopic response of run-off to forest disturbance in small mountain catchments. Hydrol. Process. 2018, 32, 3650–3661. [Google Scholar] [CrossRef]
- Gat, J.R.; Mook, W.G.; Meijer, H.A. Environmental Isotopes in the Hydrological Cycle, 2nd ed.; International Atomic Energy Agency: Paris, France, 2001; Volume 2, p. 73. [Google Scholar]
- Baker, A.; Hartmann, A.; Duan, W.; Hankin, S.; Comas-Bru, L.; Cuthbert, M.O.; Treble, P.C.; Banner, J.; Genty, D.; Baldini, L.M.; et al. Global analysis reveals climatic controls on the oxygen isotope composition of cave drip water. Nat. Commun. 2019, 10, 2984. [Google Scholar] [CrossRef] [PubMed]
- IAEA. Global Network of Isotopes in Precipitation. The GNIP Database. Available online: http://www.isohis.iaea.org (accessed on 12 December 2015).
- Cornes, R.C.; van der Schrier, G.; van den Besselaar, E.J.M.; Jones, P.D. An Ensemble Version of the E-OBS Temperature and Precipitation Data Sets. J. Geophys. Res. Atmos. 2018, 123, 9391–9409. [Google Scholar] [CrossRef] [Green Version]
- Hurrell, J.W.; Deser, C. North Atlantic climate variability: The role of the North Atlantic Oscillation. J. Mar. Syst. 2009, 78, 28–41. [Google Scholar] [CrossRef]
- Comas-Bru, L.; Hernández, A. Reconciling North Atlantic climate modes: Revised monthly indices for the East Atlantic and the Scandinavian patterns beyond the 20th century. Earth Syst. Sci. Data 2018, 10, 2329–2344. [Google Scholar] [CrossRef]
- O’Neil, J.R.; Taylor, H.P. Oxygen isotope equilibrium between muscovite and water. J. Geophys. Res. 1969, 74, 6012–6022. [Google Scholar] [CrossRef] [Green Version]
- Jex, C.N.; Baker, A.; Fairchild, I.J.; Eastwood, W.J.; Leng, M.J.; Sloane, H.J.; Thomas, L.; Bekaroğlu, E. Calibration of speleothem δ18O with instrumental climate records from Turkey. Glob. Planet. Chang. 2010, 71, 207–217. [Google Scholar] [CrossRef]
- Baldini, L.M.; McDermott, F.; Foley, A.M.; Baldini, J.U.L. Spatial variability in the European winter precipitation δ18O-NAO relationship: Implications for reconstructing NAO-mode climate variability in the Holocene. Geophys. Res. Lett. 2008, 35. [Google Scholar] [CrossRef]
- Comas-Bru, L.; McDermott, F.; Werner, M. The effect of the East Atlantic pattern on the precipitation δ18O-NAO relationship in Europe. Clim Dyn. 2016, 47, 2059–2069. [Google Scholar] [CrossRef]
- Daëron, M.; Guo, W.; Eiler, J.; Genty, D.; Blamart, D.; Boch, R.; Drysdale, R.; Maire, R.; Wainer, K.; Zanchetta, G. 13C18O clumping in speleothems: Observations from natural caves and precipitation experiments. Geochim. Cosmochim. Acta 2011, 75, 3303–3317. [Google Scholar] [CrossRef]
- Hendy, C.H. The isotopic geochemistry of speleothems—I. The calculation of the effects of different modes of formation on the isotopic composition of speleothems and their applicability as palaeoclimatic indicators. Geochim. Cosmochim. Acta 1971, 35, 801–824. [Google Scholar] [CrossRef]
- Mickler, P.J.; Stern, L.A.; Banner, J.L. Large kinetic isotope effects in modern speleothems. GSA Bull. 2006, 118, 65–81. [Google Scholar] [CrossRef]
- Dorale, J.A.; Liu, Z. Limitations of Hendy test criteria in judging the paleoclimatic suitability of speleothems and the need for replication. J. Cave Karst Stud. 2009, 71, 73–80. [Google Scholar]
- Deininger, M.; Ward, B.M.; Novello, V.F.; Cruz, F.W. Late Quaternary Variations in the South American Monsoon System as Inferred by Speleothems—New Perspectives using the SISAL Database. Quaternary 2019, 2, 6. [Google Scholar] [CrossRef]
- Burstyn, Y.; Martrat, B.; Lopez, J.F.; Iriarte, E.; Jacobson, M.J.; Lone, M.A.; Deininger, M. Speleothems from the Middle East: An Example of Water Limited Environments in the SISAL Database. Quaternary 2019, 2, 16. [Google Scholar] [CrossRef]
- Hughes, P.D.; Woodward, J.C.; van Calsteren, P.C.; Thomas, L.E. The glacial history of the Dinaric Alps, Montenegro. Quat. Sci. Rev. 2011, 30, 3393–3412. [Google Scholar] [CrossRef]
- Hughes, P.D.; Woodward, J.C.; van Calsteren, P.C.; Thomas, L.E.; Adamson, K.R. Pleistocene ice caps on the coastal mountains of the Adriatic Sea. Quat. Sci. Rev. 2010, 29, 3690–3708. [Google Scholar] [CrossRef]
- Camuera, J.; Jiménez-Moreno, G.; Ramos-Román, M.J.; García-Alix, A.; Toney, J.L.; Anderson, R.S.; Jiménez-Espejo, F.; Bright, J.; Webster, C.; Yanes, Y.; et al. Vegetation and climate changes during the last two glacial-interglacial cycles in the western Mediterranean: A new long pollen record from Padul (southern Iberian Peninsula). Quat. Sci. Rev. 2019, 205, 86–105. [Google Scholar] [CrossRef]
- Isola, I.; Zanchetta, G.; Drysdale, R.N.; Regattieri, E.; Bini, M.; Bajo, P.; Hellstrom, J.C.; Baneschi, I.; Lionello, P.; Woodhead, J.; et al. The 4.2 ka event in the central Mediterranean: New data from a Corchia speleothem (Apuan Alps, central Italy). Clim. Past 2019, 15, 135–151. [Google Scholar] [CrossRef]
- Dansgaard, W. Stable isotopes in precipitation. Tellus 1964, 16, 436–468. [Google Scholar] [CrossRef]
- McDermott, F.; Atkinson, T.C.; Fairchild, I.J.; Baldini, L.M.; Mattey, D.P. A first evaluation of the spatial gradients in δ18O recorded by European Holocene speleothems. Glob. Planet. Chang. 2011, 79, 275–287. [Google Scholar] [CrossRef]
- Poage, M.A.; Chamberlain, C.P. Empirical Relationships Between Elevation and the Stable Isotope Composition of Precipitation and Surface Waters: Considerations for Studies of Paleoelevation Change. Am. J. Sci. 2001, 301, 1–15. [Google Scholar] [CrossRef]
- Krajcar-Bronić, I.; Horvatinčić, N.; Obelić, B. Two decades of environmental isotope records in Croatia: Reconstruction of the past and prediction of future levels. Radiocarbon 1998, 40, 399–416. [Google Scholar] [CrossRef]
- Vreča, P.; Bronić, I.K.; Horvatinčić, N.; Barešić, J. Isotopic characteristics of precipitation in Slovenia and Croatia: Comparison of continental and maritime stations. J. Hydrol. 2006, 330, 457–469. [Google Scholar] [CrossRef]
- Hunjak, T.; Lutz, H.O.; Roller-Lutz, Z. Stable isotope composition of the meteoric precipitation in Croatia. Isot. Environ. Health Stud. 2013, 49, 336–345. [Google Scholar] [CrossRef]
- Mezga, K.; Urbanc, J.; Cerar, S. The isotope altitude effect reflected in groundwater: A case study from Slovenia. Isot. Environ. Health Stud. 2014, 50, 33–51. [Google Scholar] [CrossRef]
- Dotsika, E.; Lykoudis, S.; Poutoukis, D. Spatial distribution of the isotopic composition of precipitation and spring water in Greece. Glob. Planet. Chang. 2010, 71, 141–149. [Google Scholar] [CrossRef]
- Primavera, M.; D’Oronzo, C.; Muntoni, I.M.; Radina, F.; Fiorentino, G. Environment, crops and harvesting strategies during the II millennium BC: Resilience and adaptation in socio-economic systems of Bronze Age communities in Apulia (SE Italy). Quat. Int. 2017, 436, 83–95. [Google Scholar] [CrossRef]
- Drake, B.L. The influence of climatic change on the Late Bronze Age Collapse and the Greek Dark Ages. J. Archaeol. Sci. 2012, 39, 1862–1870. [Google Scholar] [CrossRef]
- Hatvani, I.G.; Kern, Z.; Leél-Őssy, S.; Demény, A. Speleothem stable isotope records for east-central Europe: Resampling sedimentary proxy records to obtain evenly spaced time series with spectral guidance. Earth Syst. Sci. Data 2018, 10, 139–149. [Google Scholar] [CrossRef]
- Deininger, M.; McDermott, F.; Mudelsee, M.; Werner, M.; Frank, N.; Mangini, A. Coherency of late Holocene European speleothem δ18O records linked to North Atlantic Ocean circulation. Clim. Dyn. 2017, 49, 595–618. [Google Scholar] [CrossRef]
Figure 1.
Map indicating the location of speleothem records from the Eastern part of Europe and Turkey. Purple circles show records in SISAL_v1 and green triangles note records not yet in the database. Background map show karst aquifers from the World Karst Aquifer Mapping Project [50]. Numbers next to the sites refer to the site names in Table 1.
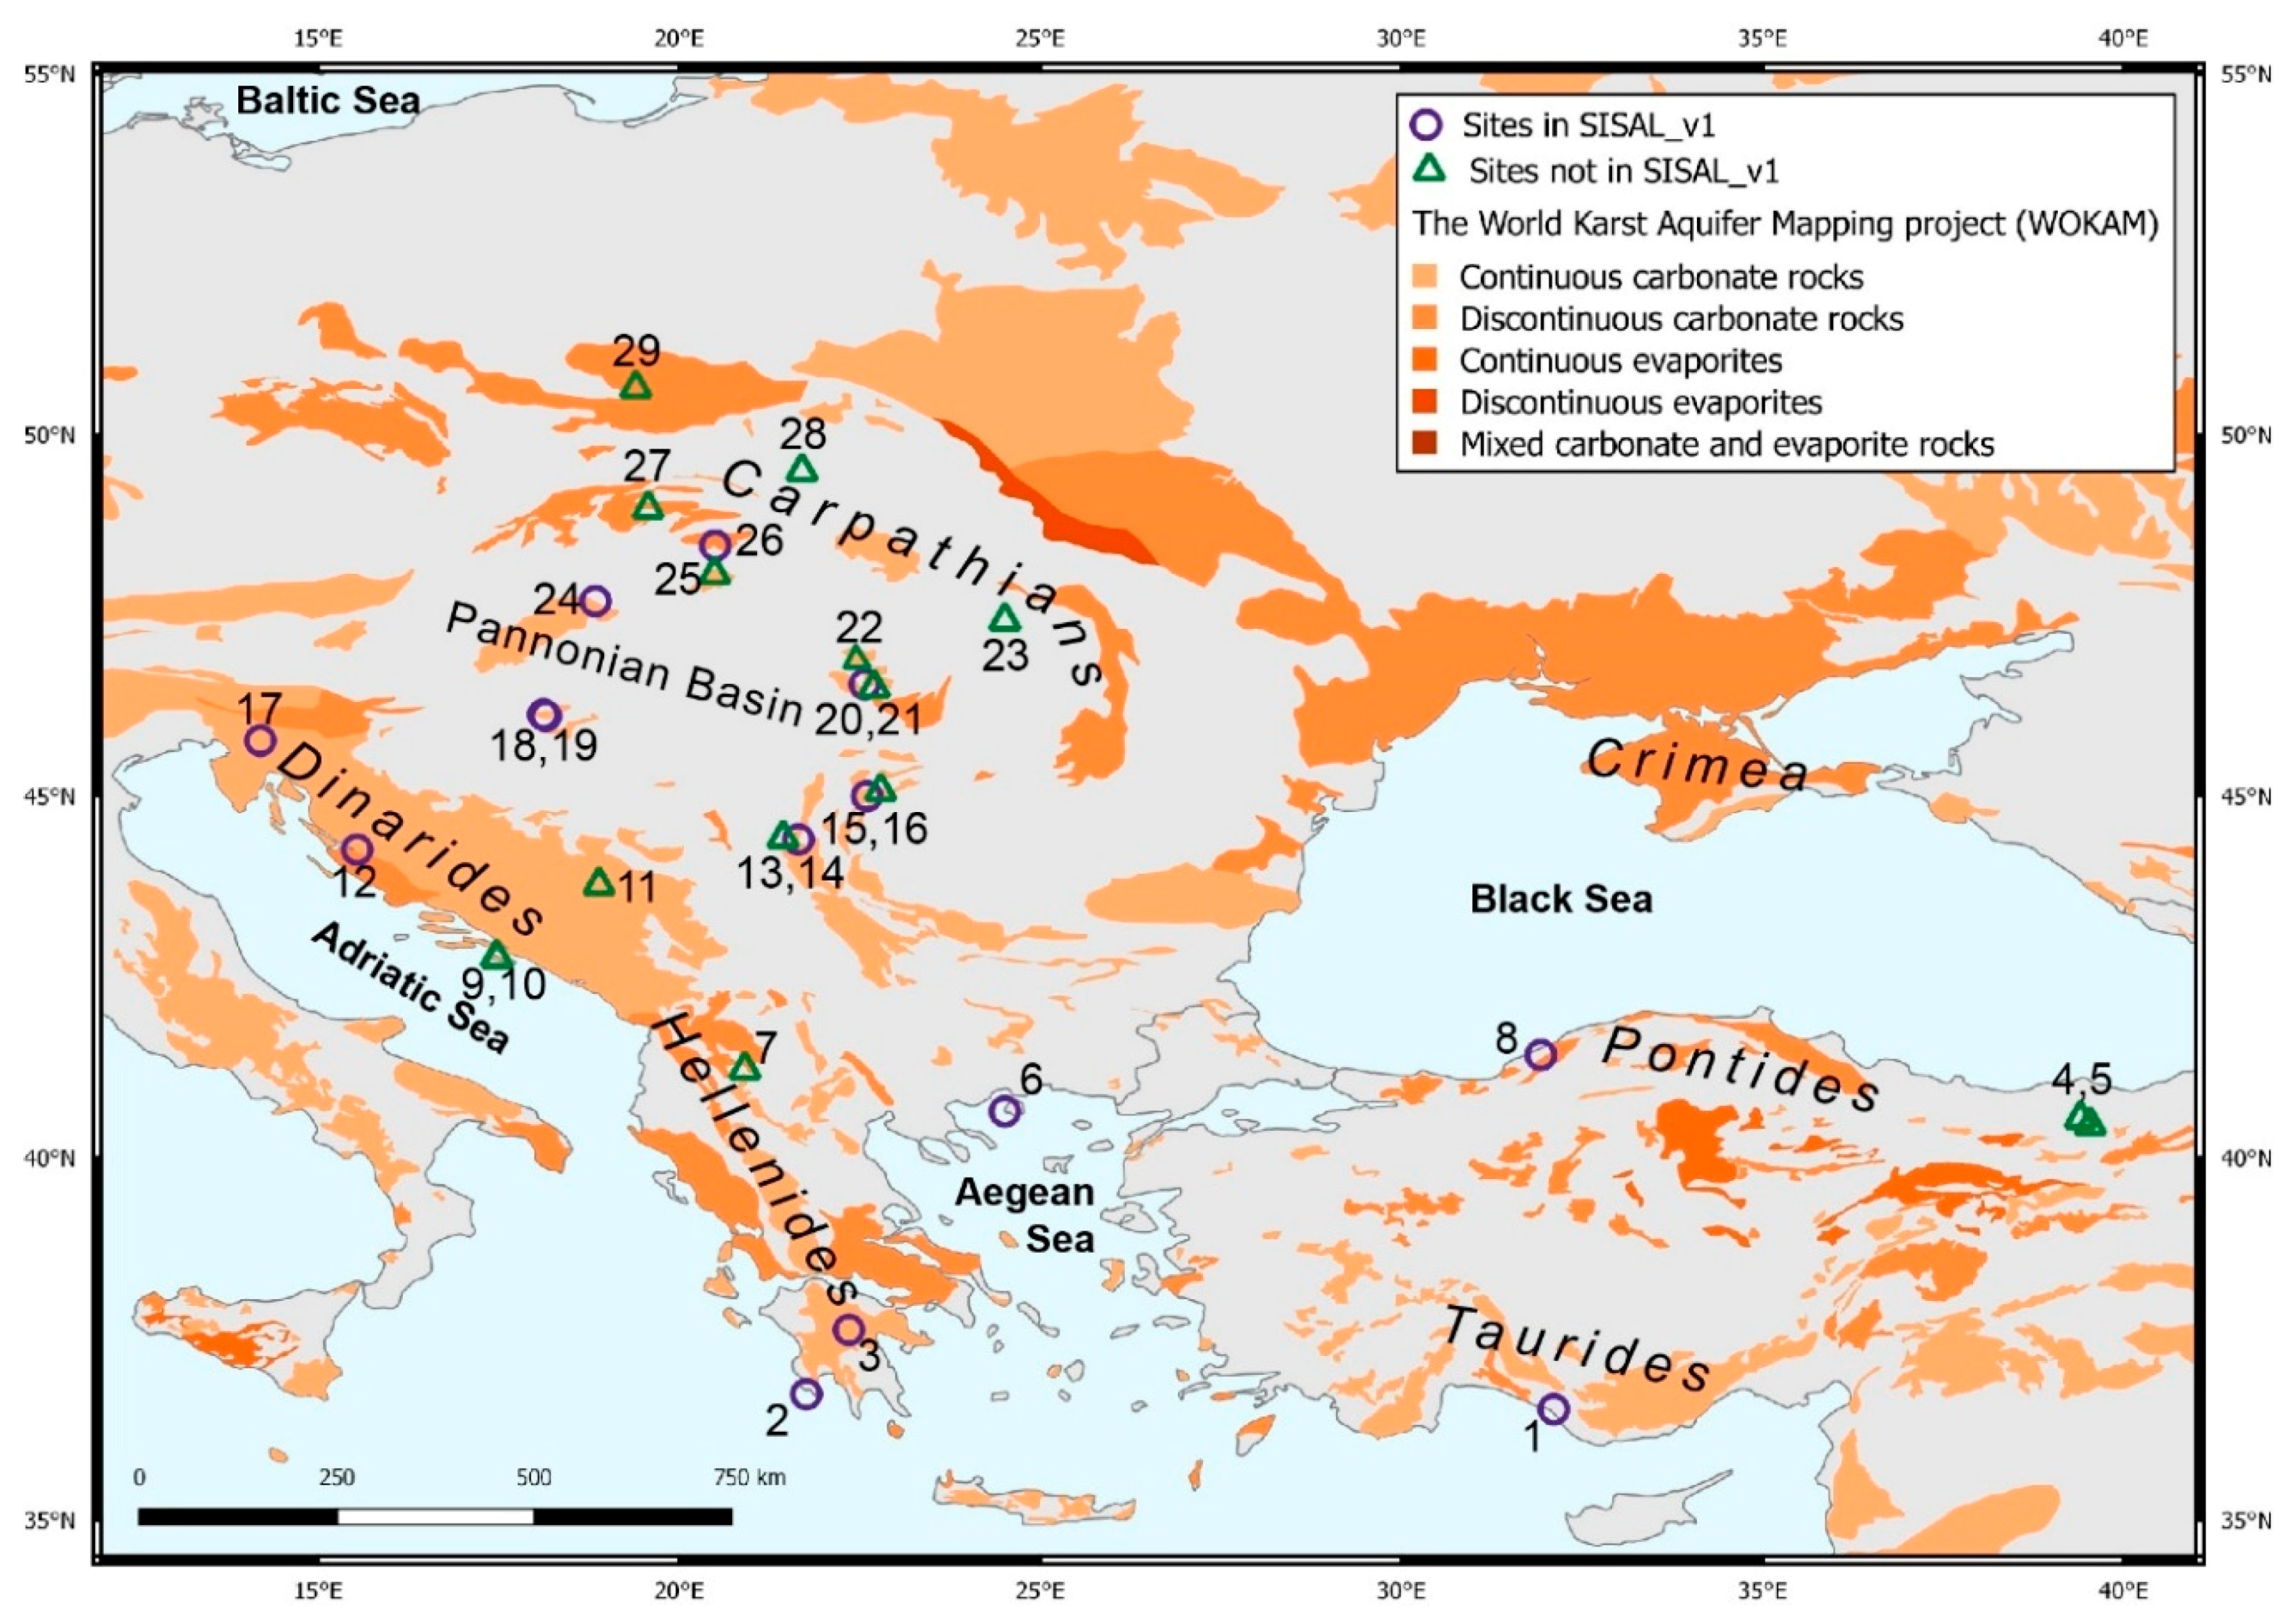
Figure 2.
Timeseries of individual speleothem records from the Eastern part of Europe and Turkey for (A) δ18O and (B) δ13C during the last 160 kyrs. Marine Isotope Stages (MIS [82]) are indicated by dashed horizontal arrows. Durations of Heinrich events (e.g., H1 [83]) are shown with black boxes between panels (A,B).

Figure 3.
Stable isotope records of individual speleothems in the Eastern part of Europe and Turkey SISAL region for the Holocene: (A) Fluid inclusion δ2H, (B) δ18Ospel and (C) δ13C. The vertical arrow marks 3.5 ka BP.
Figure 3.
Stable isotope records of individual speleothems in the Eastern part of Europe and Turkey SISAL region for the Holocene: (A) Fluid inclusion δ2H, (B) δ18Ospel and (C) δ13C. The vertical arrow marks 3.5 ka BP.

Figure 4.
Temporal coverage of the records included in SISAL_v1 from Eastern part of Europe and Turkey (A) back to 160 ka BP, and (B) back to 21 ka BP. Hiatuses in individual records are shown by blank spaces. Records are sorted by latitude, with the southernmost site at the top.
Figure 4.
Temporal coverage of the records included in SISAL_v1 from Eastern part of Europe and Turkey (A) back to 160 ka BP, and (B) back to 21 ka BP. Hiatuses in individual records are shown by blank spaces. Records are sorted by latitude, with the southernmost site at the top.

Figure 5.
Map of Eastern part of Europe and Turkey, with the modern day δ18O/T (‰ per °C) (A) and δ18O/precipitation slopes (‰ per 100 mm) (B) in precipitation, and the δ18O–NAO Spearman correlations (C) for the whole year (upper row) and winter half year (October–March; lower row) for the GNIP stations indicated by letters in the circles with the corresponding station names in the inset table in panel (A). The circles with a black background indicate significance level p ≤ 0.1; while the ones with a double circle indicate p ≤ 0.05. The blue line shows the border of the studied region. The background is the Ocean Basemap is taken from Esri, GEBCO, NOAA, National Geographic, DeLorme, HERE, Geonames.org, and other contributors.

Figure 6.
Elevation gradient of δ18Ospel for three semi-millennial time horizons for the past 5000 yrs for SE Europe. The italic numbers above the dots refer to the site names found in Table 1.
Figure 6.
Elevation gradient of δ18Ospel for three semi-millennial time horizons for the past 5000 yrs for SE Europe. The italic numbers above the dots refer to the site names found in Table 1.
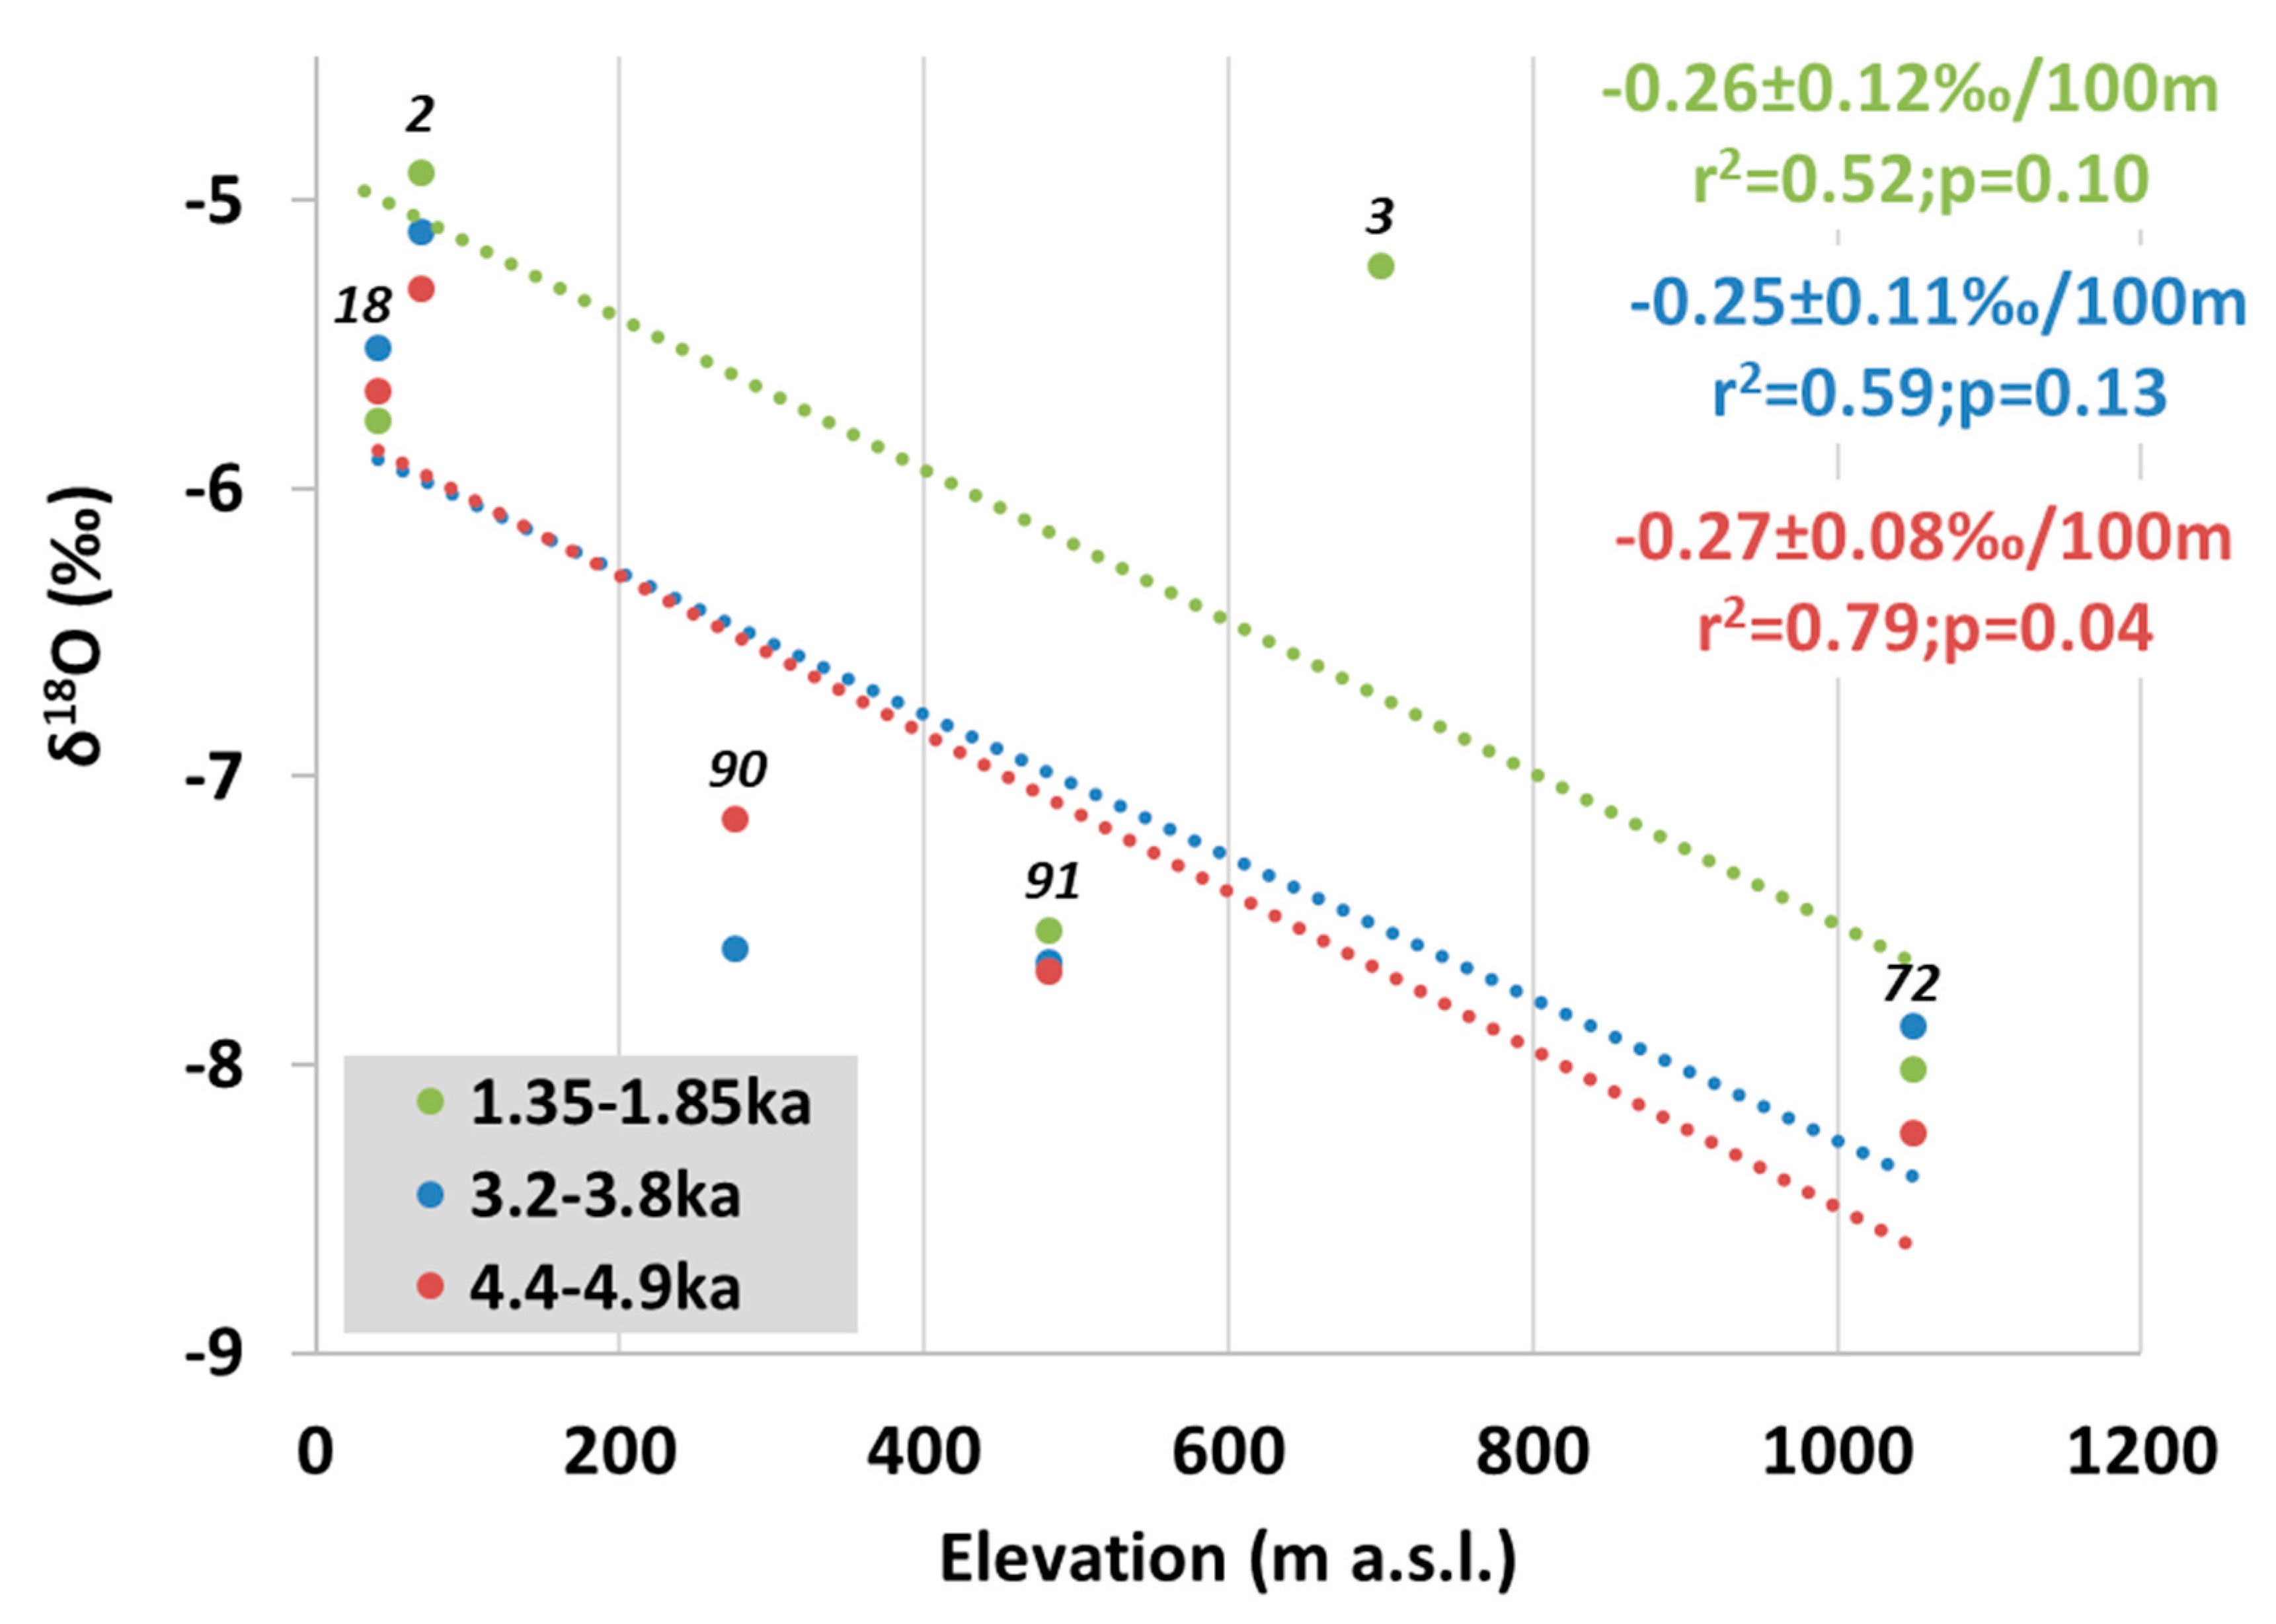

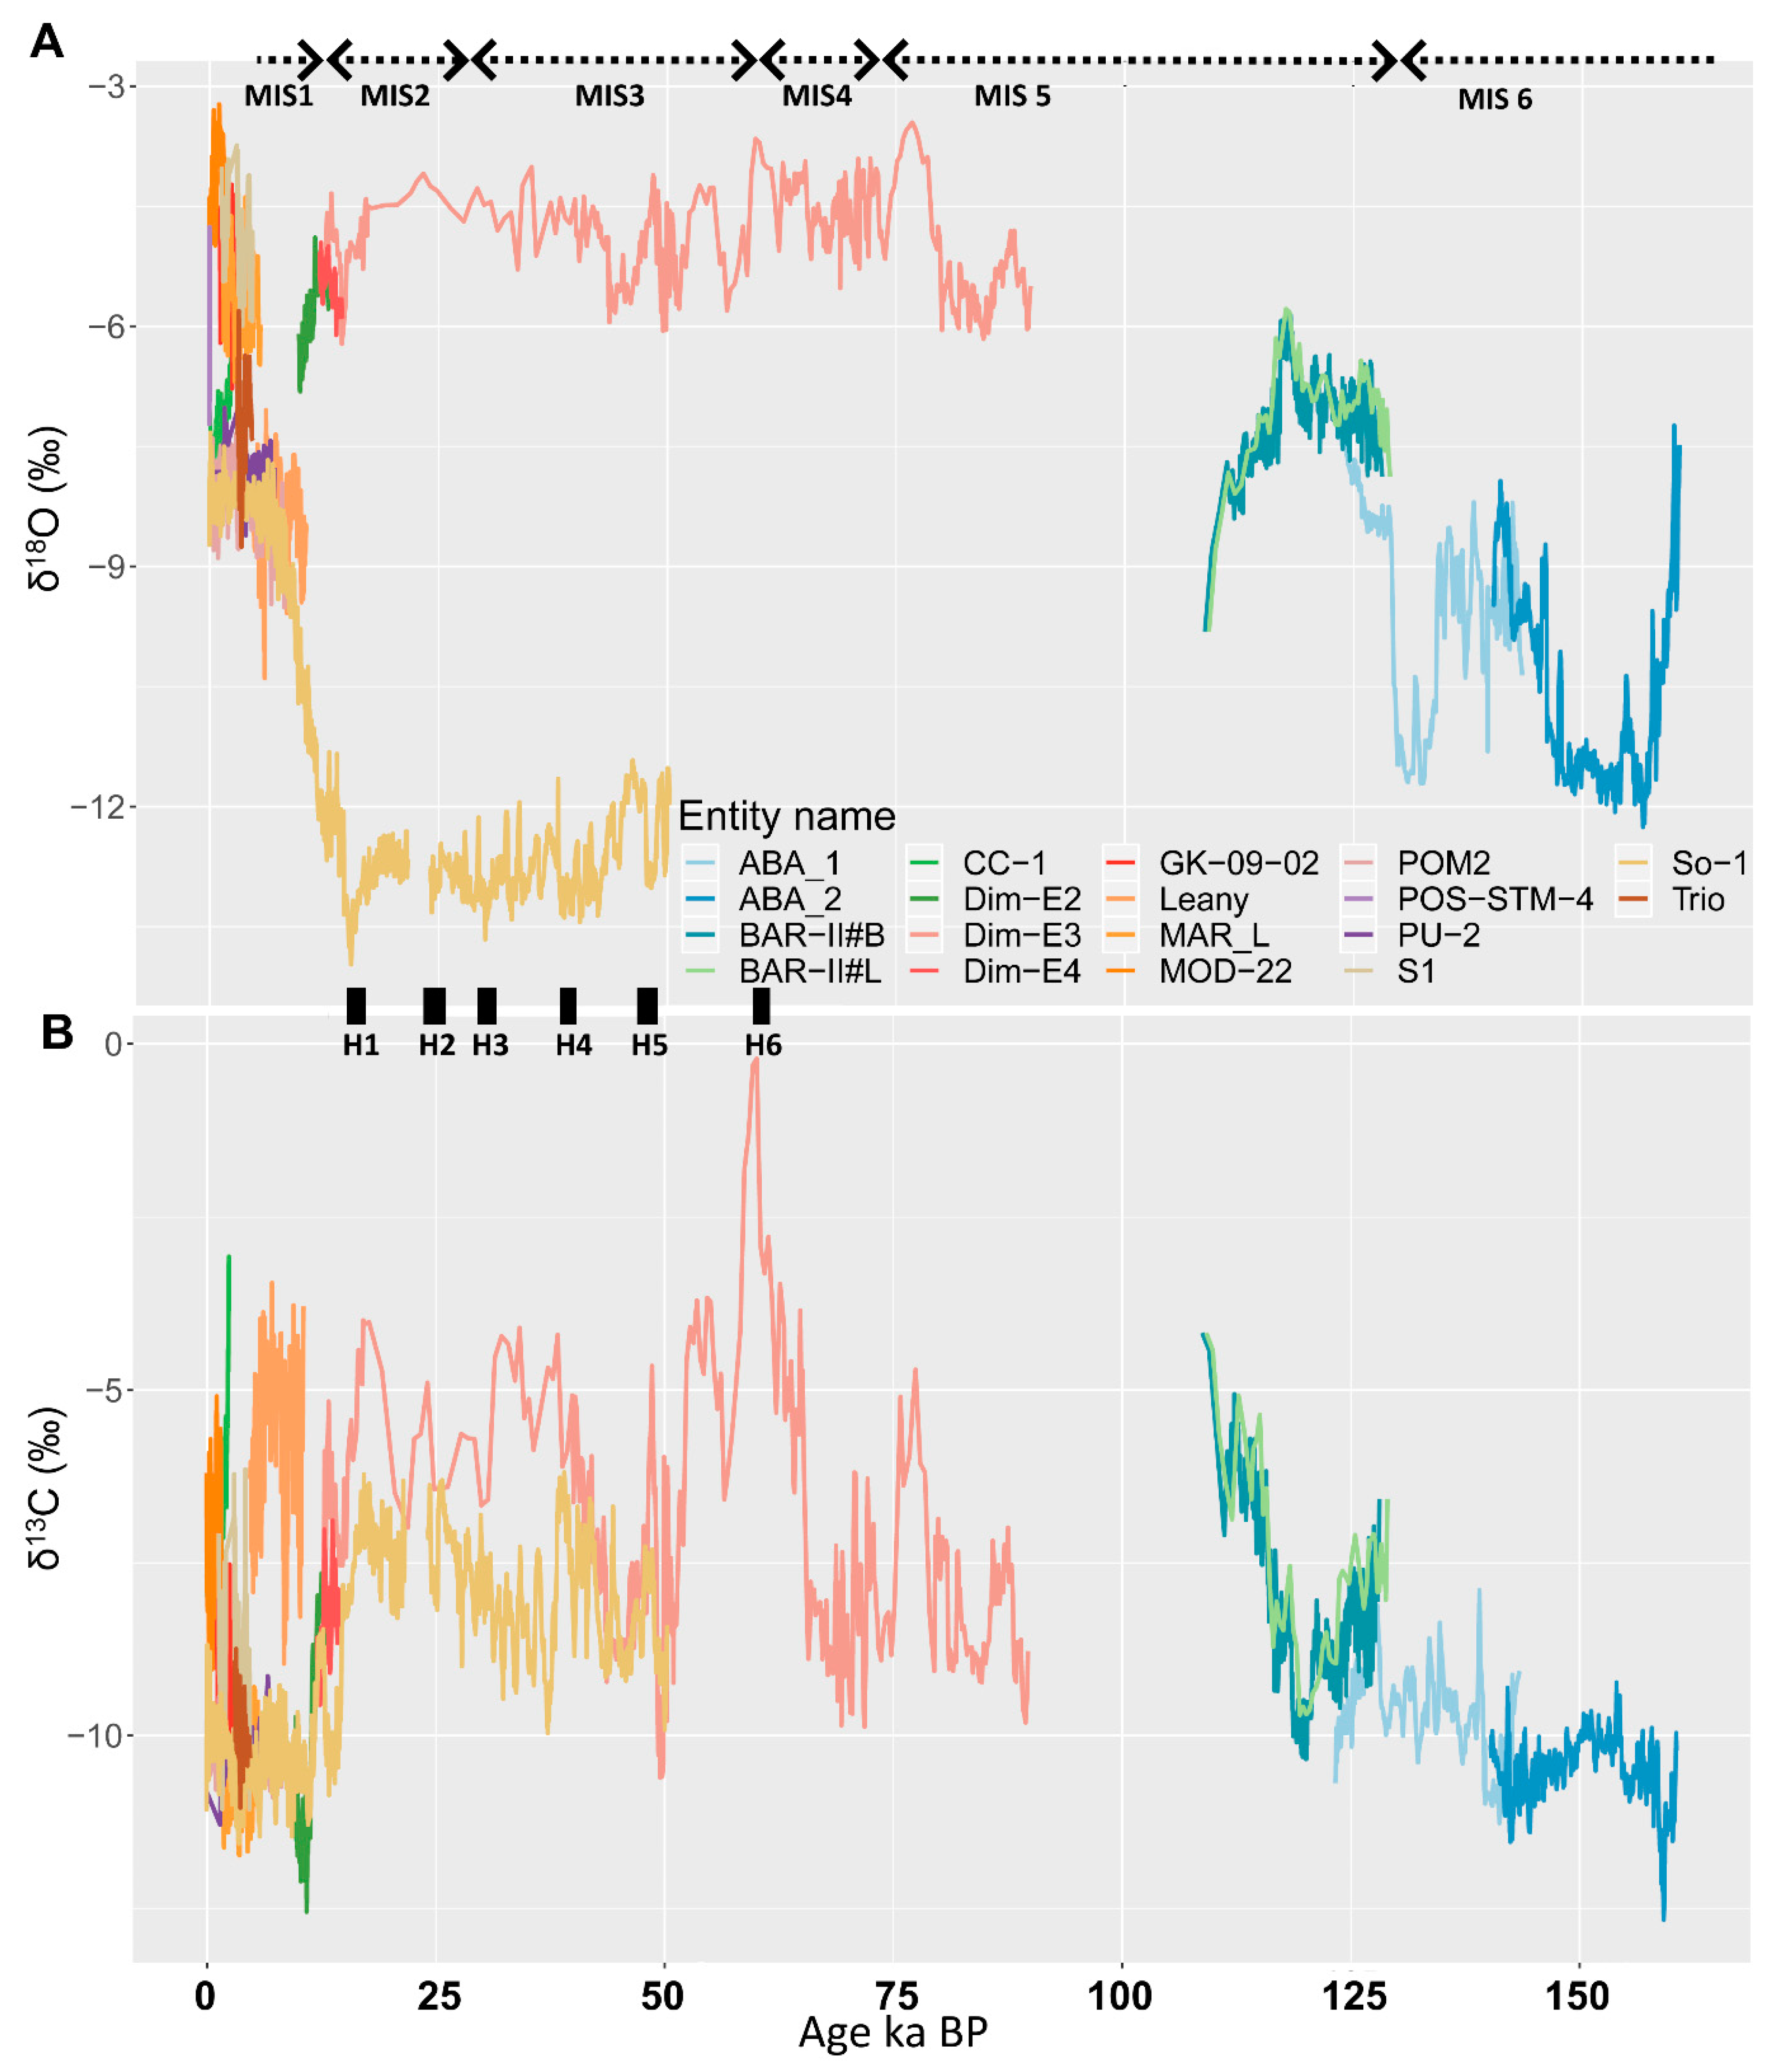
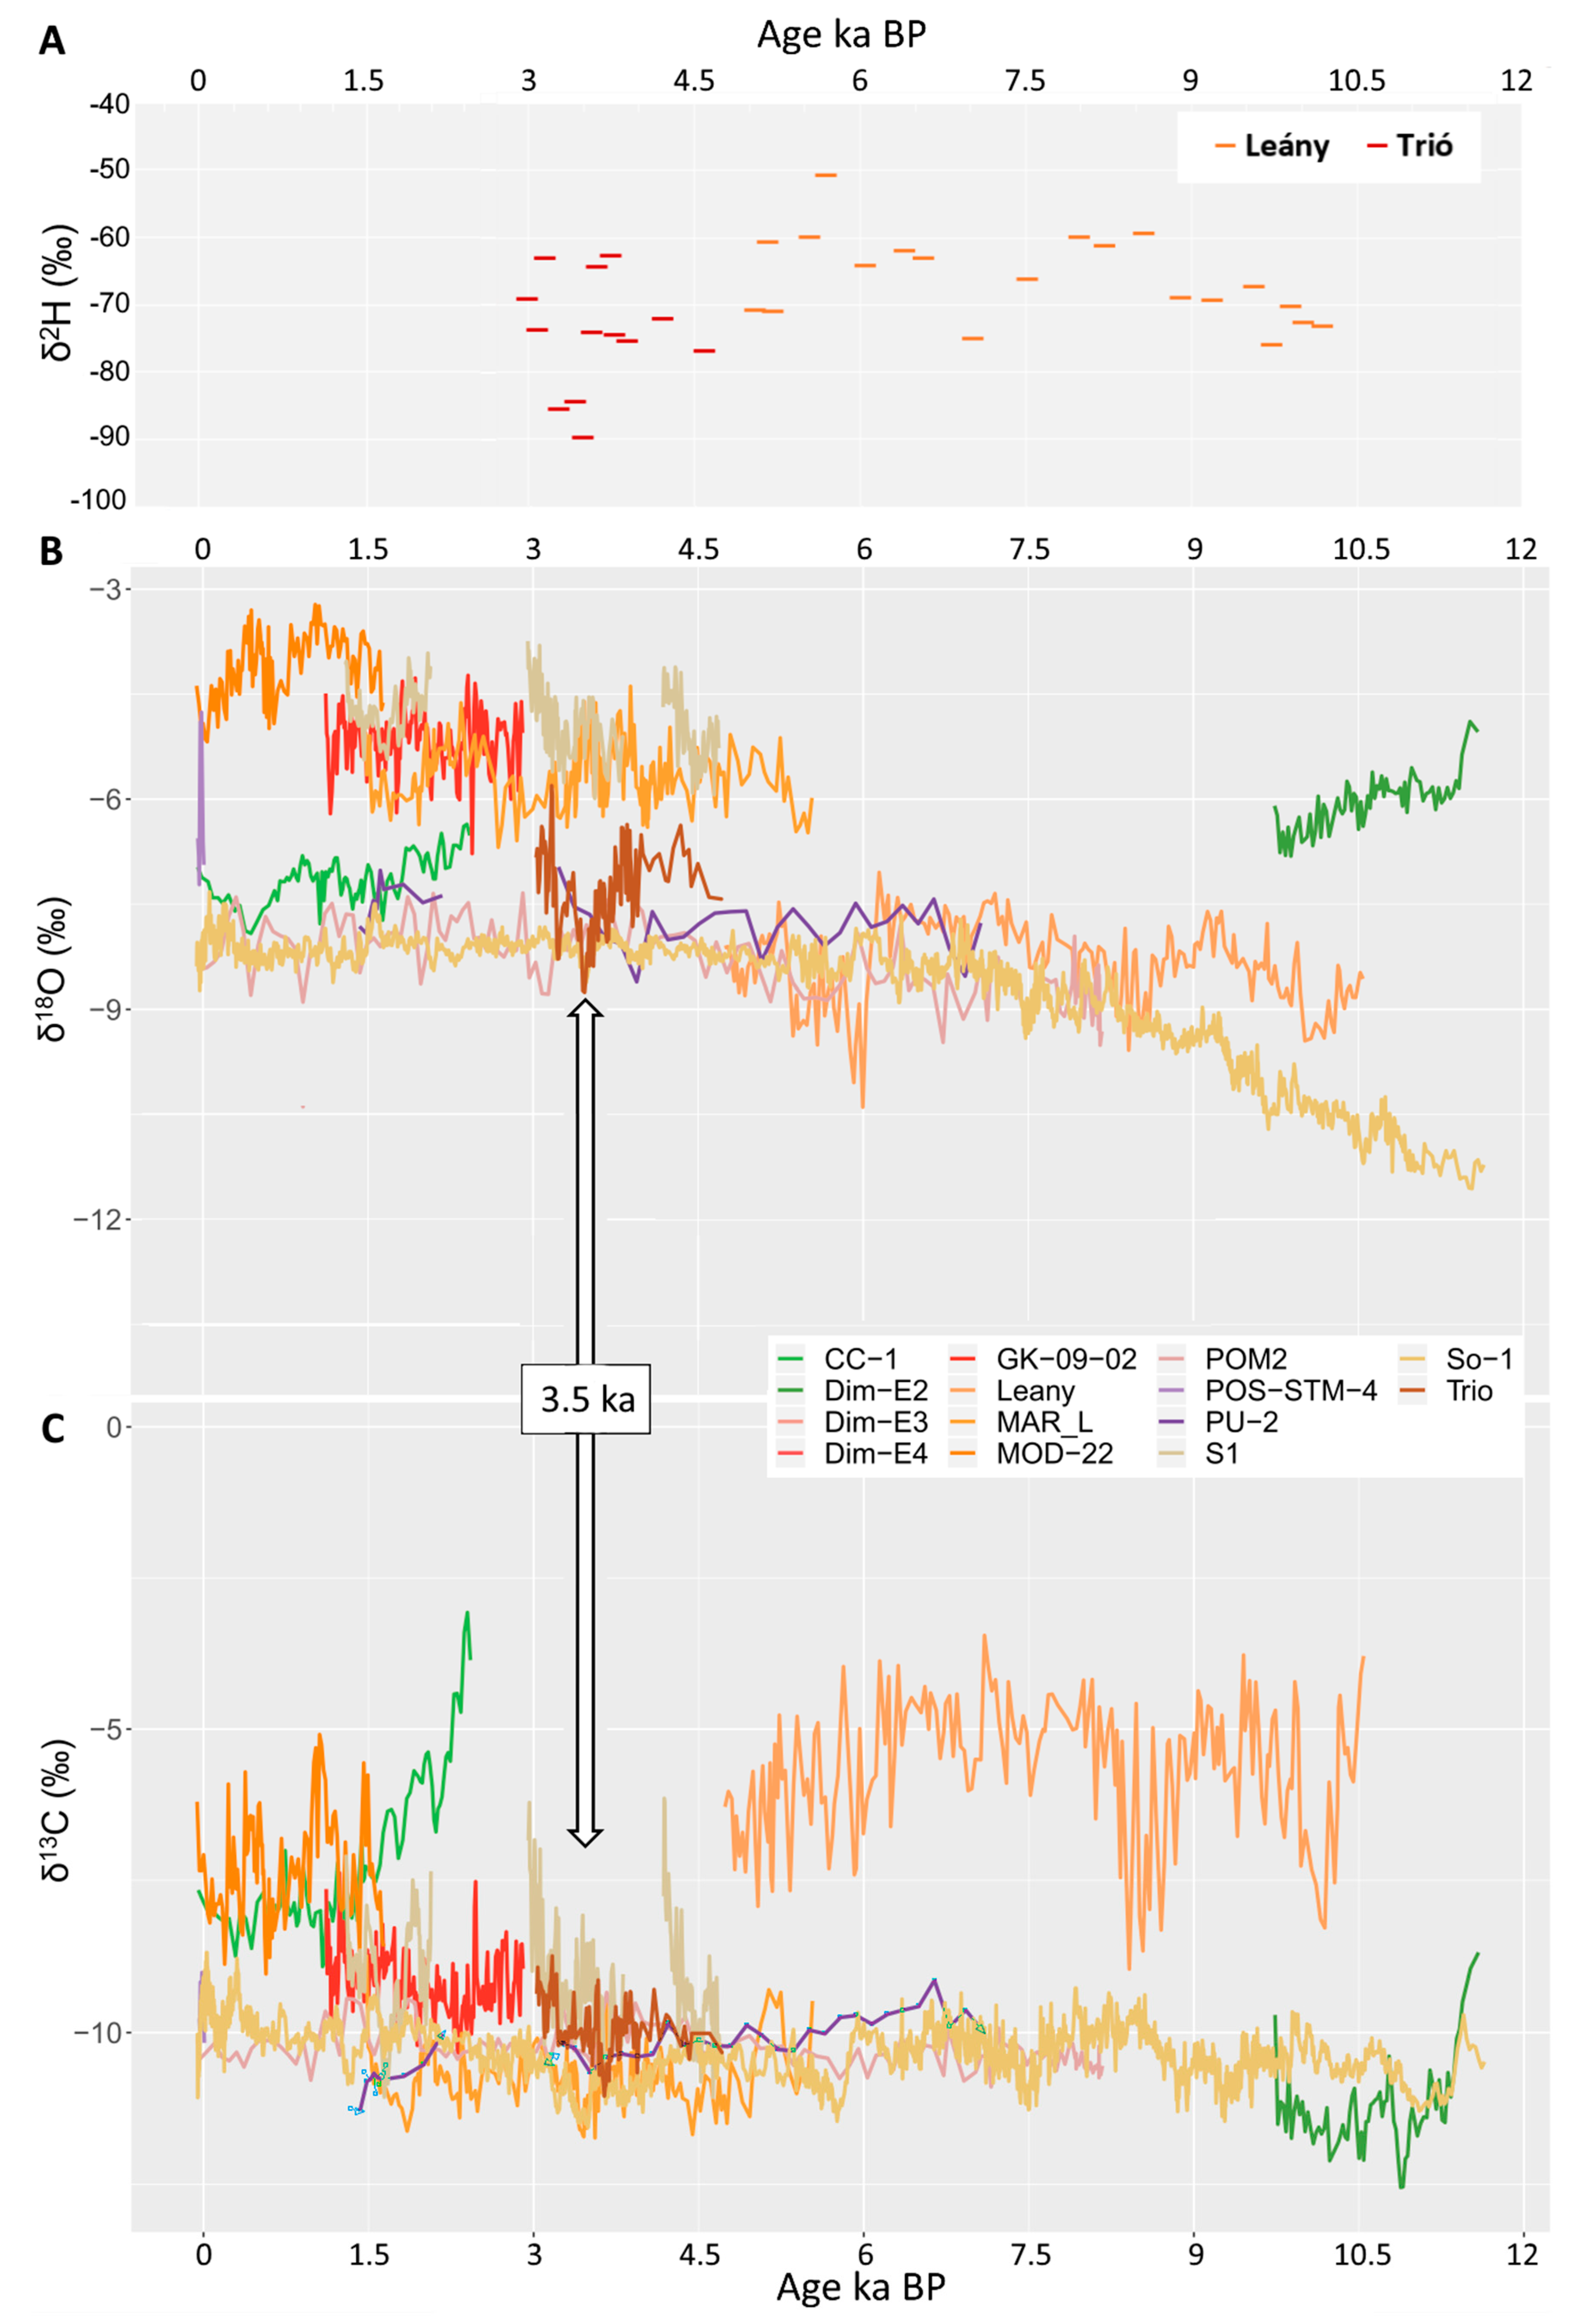
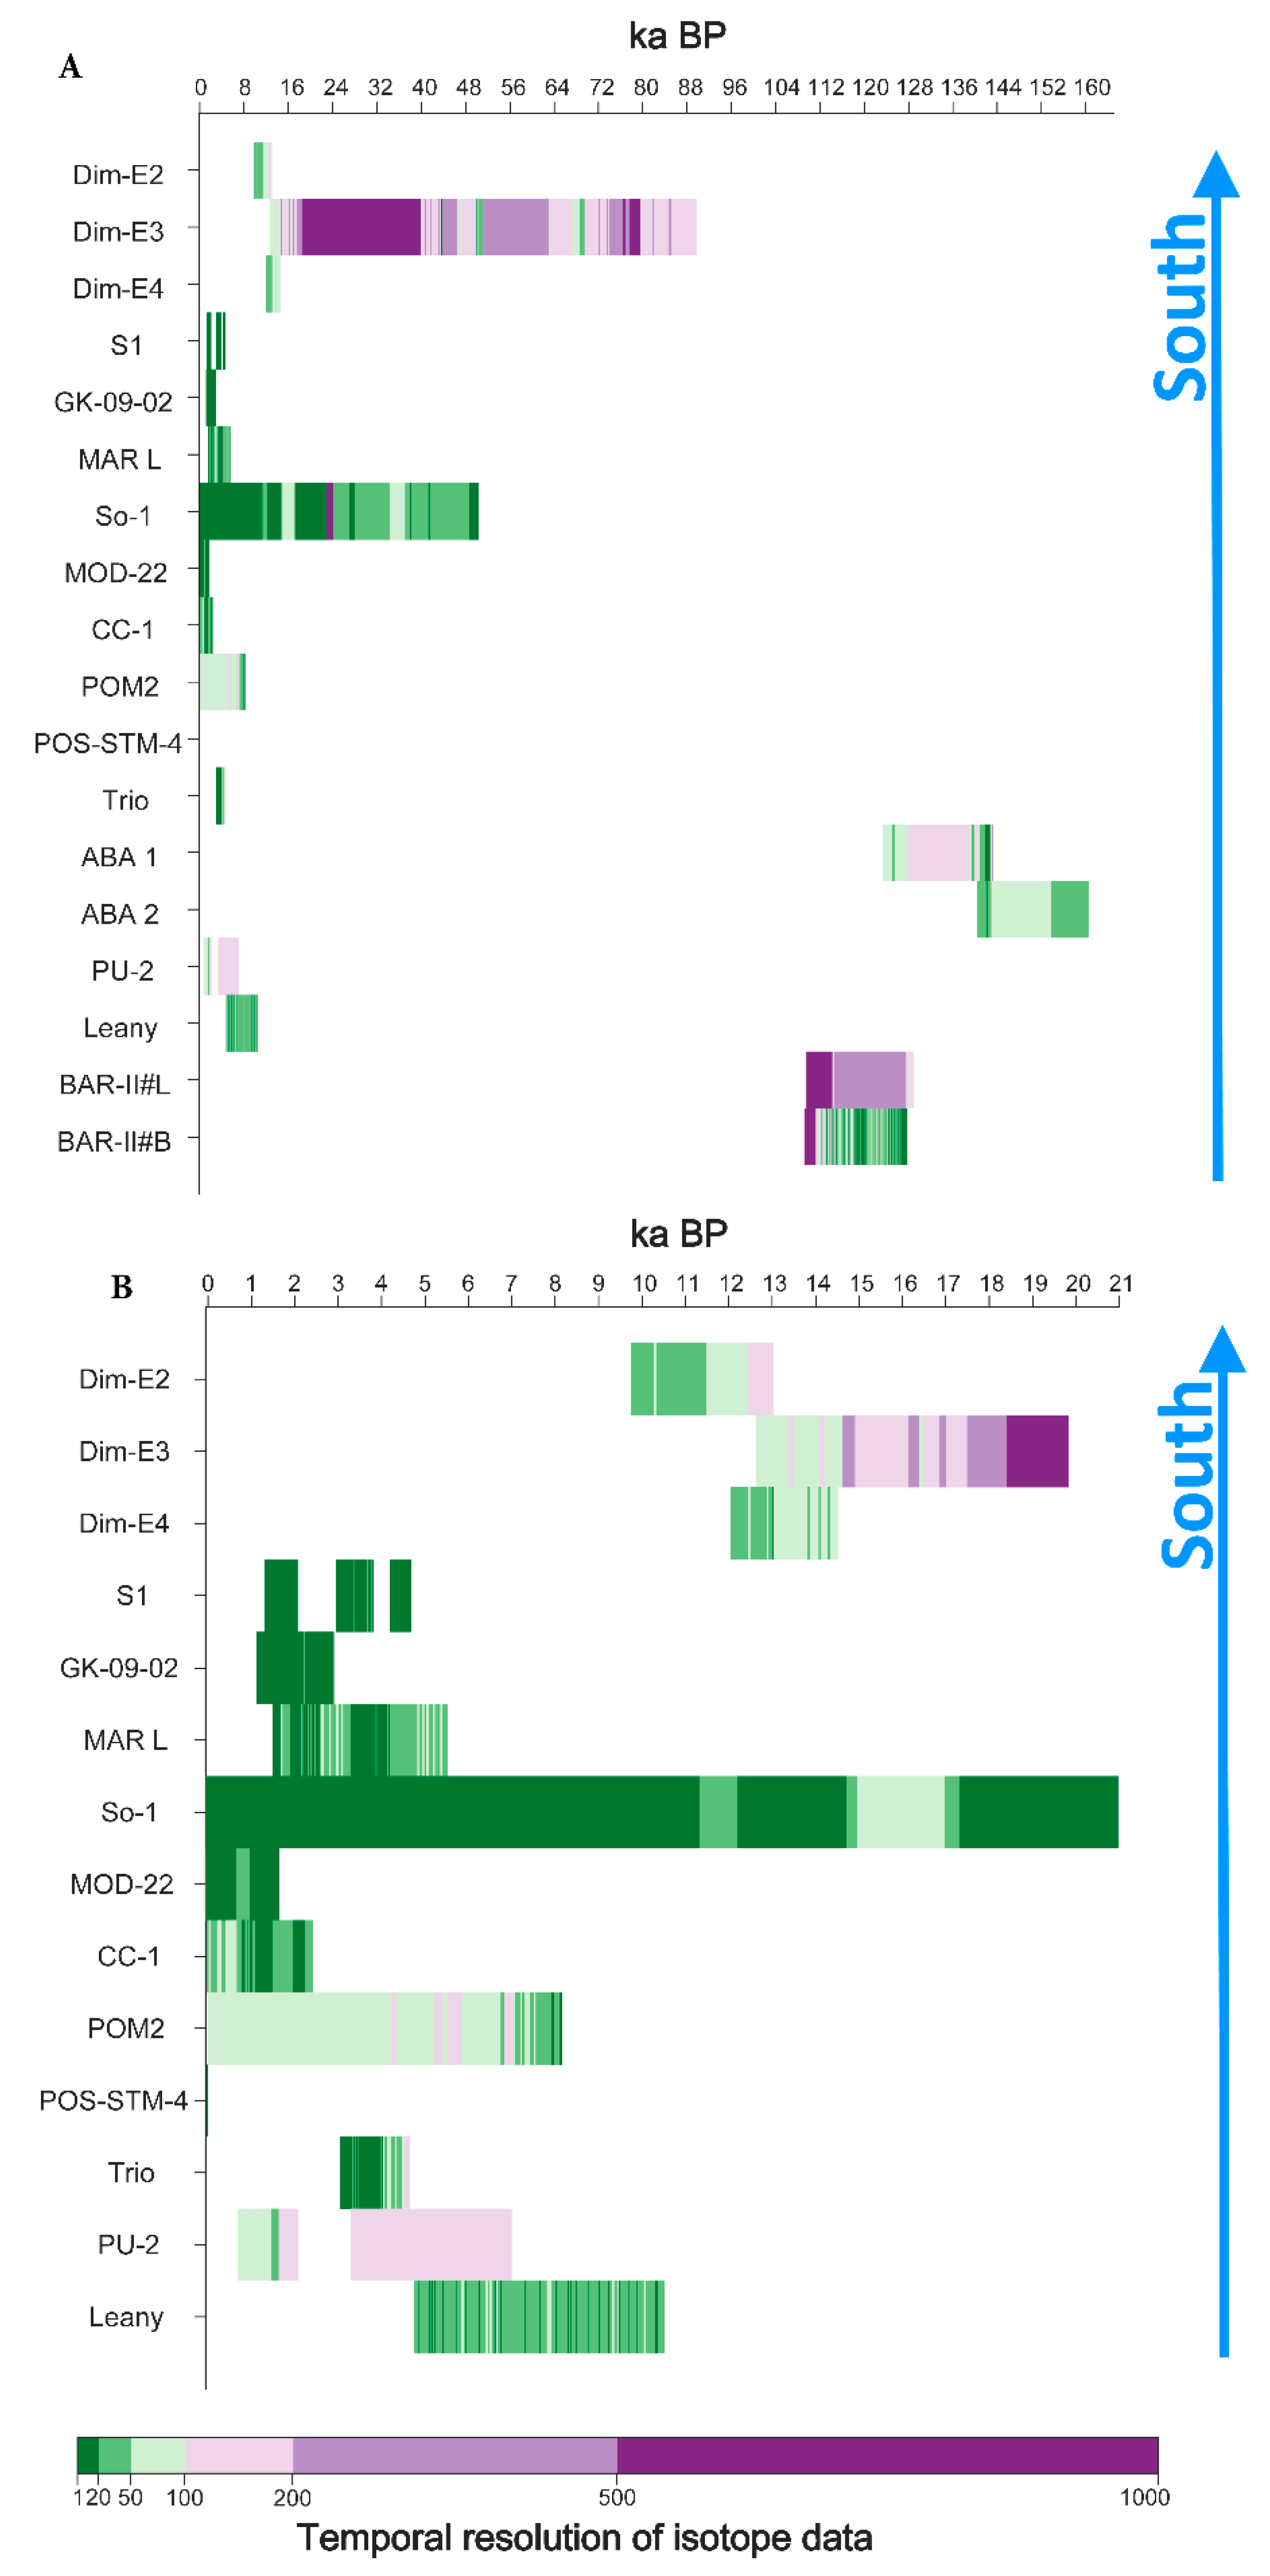
Table 1.
Metadata of the speleothem records from the Eastern part of Europe and Turkey. Column headings in italics represent field names that can be queried in the SISAL database. The numbers in parentheses next to the site names identify the site locations in Figure 1. Min/Max year correspond to the last/first ages of stable isotope data, respectively. BP is defined as years before present, where present is 1950 CE. Minimum and maximum age of stable isotope records were rounded to integer. Speleothems without an entity_id are not in SISAL_v1 [29,30].
| Site_name | Site_id | Country | Latitude (° N) | Longitude (° E) | Elevation m amsl | Entity_name | Entity_id | Min. Year (BP) | Max. Year (BP) | Ref. |
|---|---|---|---|---|---|---|---|---|---|---|
| Dim Cave (1) | 79 | Turkey | 36.53 | 32.11 | 232 | Dim-E2 | 168 | 9738 | 13,094 | [44] |
| Dim-E3 | 169 | 12,575 | 89,714 | |||||||
| Dim-E4 | 170 | 12,020 | 14,555 | |||||||
| Mavri Trypa Cave (2) | 156 | Greece | 36.74 | 21.76 | 70 | S1 | 347 | 1296 | 4687 | [42] |
| Kapsia Cave (3) | 44 | 37.62 | 22.35 | 700 | GK-09-02 | 120 | 1115 | 2904 | [13] | |
| Akcakale Cave (4) | Turkey | 40.45 | 39.54 | 2p | [67] | |||||
| Karaca Cave (5) | 40.54 | 39.40 | 1536 | K1 | [68] | |||||
| Skala Marion Cave (6) | 56 | Greece | 40.64 | 24.51 | 41 | MAR_L | 136 | 1481 | 5534 | [43] |
| — (7) | Macedonia | 41.22 | 20.91 | 1130 | OH2 | [51] | ||||
| Sofular Cave (8) | 141 | Turkey | 41.42 | 31.93 | 700 | So-1 | 305 | −56 | 50,275 | [38] |
| SO-2 | [38] | |||||||||
| SO-17 | [69] | |||||||||
| Mala Splilja Cave (9) | Croatia | 42.76 | 17.48 | 60 | MSM-1 | [52] | ||||
| Velika Spilja Cave (10) | 42.77 | 17.47 | 90 | VSM-1 | [52] | |||||
| Mračna Cave (11) | Bosnia and Herzegovina | 43.77 | 18.89 | 597 | BS14, BS15 | [53] | ||||
| Modrič Cave (12) | 86 | Croatia | 44.26 | 15.54 | 32 | MOD-22 | 179 | −58 | 1637 | [41] |
| Ceremosnja Cave (13) | 76 | Serbia | 44.40 | 21.65 | 530 | CC-1 | 165 | −48 | 2426 | [45] |
| Poleva Cave (14) | Romania | 44.42 | 21.44 | 390 | PP-10 | [65] | ||||
| Ascunsă Cave (15) | 72 | 45.00 | 22.60 | 1050 | POM2 | 161 | −32 | 8169 | [46] | |
| POM1 | [55] | |||||||||
| Cloşani Cave (16) | 45.07 | 22.79 | 433 | C09-2 | [10] | |||||
| C-6 | [70] | |||||||||
| Postojna Cave (17) | 88 | Slovenia | 45.77 | 14.20 | 529 | POS-STM-4 | 181 | −46 | 8 | [18] |
| Trio Cave (18) | 90 | Hungary | 46.11 | 18.15 | 275 | Trio | 183 | 3028 | 4711 | [11] |
| Abaliget Cave (19) | 31 | 46.13 | 18.12 | 209 | ABA_1 | 105 | 123,303 | 143,456 | [49] | |
| ABA_2 | 106 | 140,274 | 160,598 | |||||||
| V11 Cave (20) | Romania | 46.50 | 22.70 | 1254 | S139 | [71] | ||||
| S22, S117 | [64] | |||||||||
| Urşilor Cave (21) | 91 | 46.55 | 22.57 | 482 | PU-2 | 184 | −50 | 7068 | [47] | |
| Lithophagus Cave (22) | 46.83 | 22.60 | LFG-2 | [19] | ||||||
| Tăuşoare Cave (23) | 47.43 | 24.51 | 950 | T-1152 | [55] | |||||
| Leany Cave (24) | 84 | Hungary | 47.70 | 18.84 | 420 | Leany | 177 | 4739 | 10,543 | [72] |
| Kiskőhát Shaft (25) | 48.07 | 20.49 | 915 | Kiskőhát | [73] | |||||
| Baradla Cave (26) | 71 | 48.47 | 20.50 | 375 | BAR-II#B | 160 | 108,758 | 128,125 | [74] | |
| BAR-II#L | 159 | 109,194 | 129,003 | [74] | ||||||
| NU2 | [74] | |||||||||
| Demänovská Cave of Liberty/Demianova Cave System (27) | Slovakia | 48.98 | 19.57 | HcH2A | [54] | |||||
| HcH2B | ||||||||||
| JS7 | [66] | |||||||||
| JMr 14 | ||||||||||
| Jaskyňa Slowianska Drwali Cave (28) | Poland | 49.50 | 21.70 | 420 | Sample 2 | [56] | ||||
| Wierna Cave (29) | 50.65 | 19.40 | 385 | JWi2 | [17] |
© 2019 by the authors. Licensee MDPI, Basel, Switzerland. This article is an open access article distributed under the terms and conditions of the Creative Commons Attribution (CC BY) license (http://creativecommons.org/licenses/by/4.0/).
Share and Cite
MDPI and ACS Style
Kern, Z.; Demény, A.; Perşoiu, A.; Hatvani, I.G. Speleothem Records from the Eastern Part of Europe and Turkey—Discussion on Stable Oxygen and Carbon Isotopes. Quaternary 2019, 2, 31. https://0-doi-org.brum.beds.ac.uk/10.3390/quat2030031
AMA Style
Kern Z, Demény A, Perşoiu A, Hatvani IG. Speleothem Records from the Eastern Part of Europe and Turkey—Discussion on Stable Oxygen and Carbon Isotopes. Quaternary. 2019; 2(3):31. https://0-doi-org.brum.beds.ac.uk/10.3390/quat2030031
Chicago/Turabian StyleKern, Zoltán, Attila Demény, Aurel Perşoiu, and István Gábor Hatvani. 2019. "Speleothem Records from the Eastern Part of Europe and Turkey—Discussion on Stable Oxygen and Carbon Isotopes" Quaternary 2, no. 3: 31. https://0-doi-org.brum.beds.ac.uk/10.3390/quat2030031