Meeting Report

State of the Art in Paleoenvironment Mapping for Modeling Applications in Archeology—Summary, Conclusions, and Future Directions from the PaleoMaps Workshop

by
Christian Willmes
1,2,*,
Kamil Niedziółka
3,
Benjamin Serbe
4,
Sonja B. Grimm
5,
Daniel Groß
5,
Andrea Miebach
2,6,
Michael Märker
7,
Felix Henselowsky
2,8,
Alexander Gamisch
9,
Masoud Rostami
2,10,
Ana Mateos
11,
Jesús Rodríguez
11,
Heiko Limberg
2,6,
Isabell Schmidt
2,12,
Martin Müller
2,12,
Ericson Hölzchen
13,14,15,
Michael Holthausen
16,
Konstantin Klein
2,10,
Christian Wegener
2,10,
Bernhard Weninger
12,
Trine Kellberg Nielsen
2,12,17,
Taylor Otto
2,12,17,
Gerd-Christian Weniger
2,12,17,
Olaf Bubenzer
2,8 and
Georg Bareth
1,2
add Show full author list remove Hide full author list
1
Institute of Geography, University of Cologne, Albertus-Magnus-Platz, 50923 Cologne, Germany
2
Collaborative Research Centre 806, University of Cologne, Bernhard-Feilchenfeld-Str. 11, 50969 Cologne, Germany
3
Institute of Archaeology, Cardinal Stefan Wyszyński University in Warsaw, Wóycickiego 1/3, 01-938 Warsaw, Poland
4
Cluster of Excellence ROOTS, Kiel University, Leibnizstraße 3, 24118 Kiel, Germany
5
CRC 1266, ZBSA, Centre for Baltic and Scandinavian Archaeology, Schloss Gottorf, 24837 Schleswig, Germany
6
Institute of Geosciences, University of Bonn, Nussallee 8, 53115 Bonn, Germany
7
Department of Earth and Environmental Sciences, Pavia University, Via Ferrata 1, 27100 Pavia, Italy
8
Institute for Geography, Heidelberg University, Berliner Straße 48, 69120 Heidelberg, Germany
9
Department of Biosciences, University of Salzburg, Hellbrunnerstrasse 34, 5020 Salzburg, Austria
10
Institute for Geophysics and Meteorology, University of Cologne, Pohligstraße 3, 50969 Cologne, Germany
11
National Research Center on Human Evolution (CENIEH), Paseo Sierra de Atapuerca, 3, 09003 Burgos, Spain
12
Department of Prehistoric Archaeology, University of Cologne, Weyertal 125, 50923 Cologne, Germany
13
Senckenberg Research Institute, ROCEEH, Senckenberganlage 25, 60325 Frankfurt am Main, Germany
14
ROCEEH, Heidelberg Academy of Sciences, Karlstraße 4, 69117 Heidelberg, Germany
15
Department of Paleobiology and Environment, Goethe University Frankfurt, Max-von-Laue-Straße 13, 60438 Frankfurt am Main, Germany
16
terrestris GmbH, Kölnstr. 99, 53111 Bonn, Germany
17
Neanderthal Museum, Talstraße 300, 40822 Mettmann, Germany
*
Author to whom correspondence should be addressed.
Submission received: 23 January 2020 / Revised: 18 April 2020 / Accepted: 21 April 2020 / Published: 8 May 2020

Abstract

:
In this report, we present the contributions, outcomes, ideas, discussions and conclusions obtained at the PaleoMaps Workshop 2019, that took place at the Institute of Geography of the University of Cologne on 23 and 24 September 2019. The twofold aim of the workshop was: (1) to provide an overview of approaches and methods that are presently used to incorporate paleoenvironmental information in human–environment interaction modeling applications, and building thereon; (2) to devise new approaches and solutions that might be used to enhance the reconstruction of past human–environmental interconnections. This report first outlines the presented papers, and then provides a joint protocol of the often extensive discussions that came up following the presentations or else during the refreshment intervals. It concludes by adressing the open points to be resolved in future research avenues, e.g., implementation of open science practices, new procedures for reviewing of publications, and future concepts for quality assurance of the often complex paleoenvironmental data. This report may serve as an overview of the state of the art in paleoenvironment mapping and modeling. It includes an extensive compilation of the basic literature, as provided by the workshop attendants, which will itself facilitate the necessary future research.

Graphical Abstract

1. Introduction

Data describing paleoenvironment reconstructions are heterogeneous and diverse, in form or format, in method of creation, in terminology, in spatial scale, in semantics, in statistical significance or validity and many further dimensions. We can distinguish between observational measurements and inferred or modelled paleoenvironmental reconstructions. Data of the observational kind, for example, a palynological sediment core analysis and its results, are mostly included in a spatially implicit/tacit form into a common study on human–environment interaction, by describing the paleoenvironment of the “surrounding” of a site which, however is not explicitly defined. Consequently, it is difficult to include this kind of paleoenvironment reconstruction into a geospatial explicit and discrete modeling application. In contrast, quantitatively modelled geospatial data, for example, a paleoclimate model, or a digital elevation model, can be included in a spatial explicit modeling application without much additional technical effort, because this kind of data is already modelled in the same domain of describing space, i.e., spatially explicit.
A spatial explicit (geospatial) paleoenvironmental model which contains information describing objects, events or phenomena that have an explicit location in space and time, in a consistently defined spatiotemporal reference frame and data format that can be processed by specialized software (i.e., geographic information system (GIS)). In contrast, an implicit or tacit paleoenvironmental model would be a (textual) description of a paleoenvironment, not bound to an explicit model of space-time, i.e., coordinates on earth surface and in time, thus not given in a strictly defined data format. The latter kind of paleoenvironment data would be for example a description of a paleolandscape, for example, as a qualitative interpretation of geoscientific information from a sedimentological interpretation, of a geologic or gemorphologic land formation process, described in a traditional geoscientific study [1,2,3]. This kind of information is, of course, very valid, useful and important for the understanding of specific paleoenvironments, but it can not directly be used in spatially explicit archeological modeling applications. An example for an explicit model of a paleoenvironment, would be the Paleoclimate Modelling Intercomparison Project (PMIP) paleoclimate simulations and its publicly available data sets [4] or the widely re-used PMIP derived WorldClim paleo data sets [5].
Following this argument, PaleoMaps is about creating geospatial explicit paleoenvironmental data from the vast amount of published implicit paleoenvironmental information and knowledge, by compiling and creating paleoenvironmental reconstructions in reusable digital (preferably GIS) data format [6]. The general contribution of this approach to the human–environment interaction modeling community is to make tacit or implicit paleoenvironment information explicitly available as geospatial data, for re-use in archeological, geospatial, human–environment modeling applications.
The idea and basic first maps of the PaleoMaps project were developed as a side project of the Collaborative Research Centre (CRC) 806 data management and data services project [7,8,9]. The CRC 806 (www.sfb806.de) is an interdisciplinary collaborative research project, concerning the history of human mankind and in particular human–environment-interaction, with about 80 participating researchers from the Universities of Cologne, Bonn and Aachen [10].

2. Workshop Summary

The workshop was set out as a two half-days event, compare the program (Figure 1), or the workshop website (https://crc806db.uni-koeln.de/paleomaps/intro/), which remains online including all abstracts for documentation.
The first day of the workshop dealt with the question of how to compile spatiotemporal data sets (i.e., PaleoMaps), that can be applied in modeling applications such as agent-based models (ABMs) [11,12,13], species distribution models (SDMs) [14,15,16] or any other geospatial modeling applications within the paleoenvironmental and archeological domain [17,18]. On the second day, this was followed by presentations addressing specific aspects of how to make use of explicit paleoenvironmental models and data (i.e., PaleoMaps) in exemplary human-environment interaction modeling applications.
In the following short summaries of the presentations are provided, in the order they were held at the workshop (see Figure 1 for an overview of the program schedule). The presenters will summarize their projects independently and afterwards in Section 3 the interrelations and possible connections of these projects are discussed.

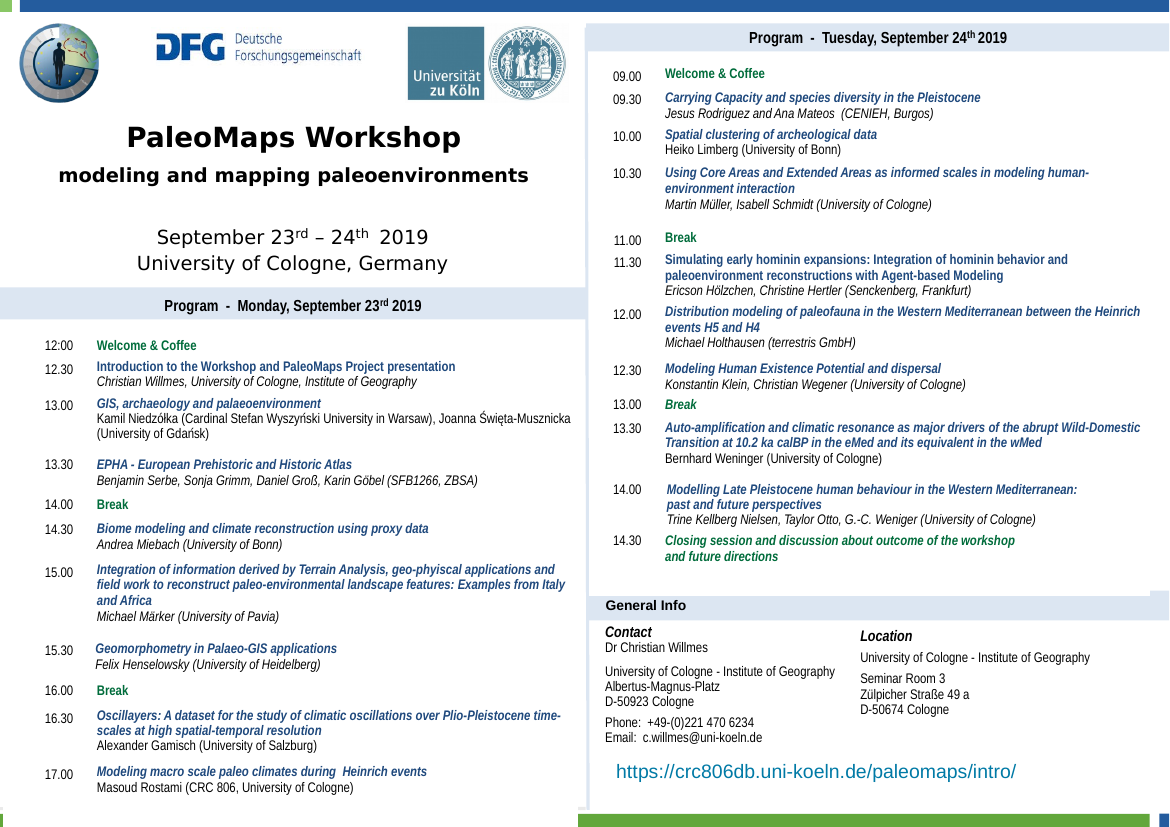
2.1. Day 1—Monday, 23 September

On the first day, eight talks were scheduled that dealt with the reconstruction and modeling of, as well as the preparation of maps of spatially explicit pleoenvironments.

2.1.1. Introduction to the Paleomaps Workshop by Christian Willmes

The workshop started with a talk by Christian Willmes (the workshop host), outlining the aims of the PaleoMaps idea (see Figure 2 for an example). The first formulation of the PaleoMaps idea was formulated and published already 3 years ago [6], still mainly focused on the infrastructure and data model aspects, but not yet named PaleoMaps. This idea was afterwards developed further, to generally include all aspects of gathering data and information, as well as methods and techniques for modeling these information as GIS based representations of paleoenvironments. The following two questions will be addressed: What exactly is the idea behind the project? What are the key challenges for compiling comprehensive PaleoMaps, i.e., a collection of paleoenvironmental spatial data for a given spatiotemporal context?

2.1.2. GIS, Archeology and Paleoenvironment by Kamil Niedziółka

Currently, GIS tools are widely used at various stages of archeological investigations [20]. One of their biggest advantages is the ability to integrate various types of data, not just archeological ones. This gives great opportunity to modern exploitation of environmental and paleoenvironmental data and its comparison with archeological data sets. Due to that, three case studies from the area of contemporary Poland (see Figure 3) which are based–however in a different manner–on the utilization of archeological and environmental/paleoenvironmental data with the support of GIS tools, were discussed. These case studies are connected with: comparison of archeological data and recently obtained pollen data in specific part of Polish Central Pomerania where numerous archeological sites are known (1); investigation of settlement transformations in the area of Polish Eastern Pomerania during the end of the Bronze Age and at the Early Iron Age. In this case archeological data was compared with chosen data sets of environmental data in order to verify statements present in current archeological literature and related with settlement conditions at that periods (2); archeological researches of the Białowieża Forest based on the analysis of airborne laser scanning (ALS) data of the whole woodland complex with additional use of environmental datasets (3). Particular emphasis was put on the main problems related with the utilisation of different sorts of data and its quality (especially in case of archeological data). Similarly, the issues connected with cooperation between different disciplines, both in the field and while the elaboration of the research effects, were also discussed.

2.1.3. EPHA–European Prehistoric and Historic Atlas by Benjamin Serbe

On behalf of his work-group, Benjamin Serbe presented the latest state of the “European Prehistoric and Historic Atlas” (EPHA) that was compiled at the “Centre for Baltic and Scandinavian Archeology” (ZBSA) in Schleswig. The general idea was that mapping prehistoric sites on contemporaneous maps ignores the different reality people faced in former times and bears the chance of misinterpreting patterns or relations of dots on maps. The research of the ZBSA focuses particularly on the North Sea and Baltic Sea area where the topography changed significantly over time. Considering this problem, EPHA was developed to provide base layers for distribution maps. Similar maps of different time slices were previously published for the North Sea [21] and for the Baltic Sea [22] to show the development of ice sheets and coastlines of the inspected areas during the Late Weichelian and Early Holocene. The direct predecessor of our project, the “Maps of Late Glacial NW Europe”, was developed by Grimm [23] and later updated [24]. In 2016, the idea of these base layer maps was renewed with the aim to provide a set of maps which were also useable in a GIS. During the development of the project, we decided to define the geographic boundary to cover most of continental Europe except the Mediterranean (which will be covered in future steps of the project) and further defined a timeframe from the last glacial maximum (LGM) up until today. Since 2016, a total of nine maps (Figure 4) were published online (www.epha.zbsa.eu). As the project is ongoing, additional time slices and updates of the already existing ones are constantly in preparation. All the maps are published as Open Access (CC-BY 4.0 Licence) and the workgroup invites interested colleagues to contribute by sharing new data or corrections.

2.1.4. Biome Modeling and Climate Reconstruction Using Proxy Data by Andrea Miebach

After the first coffee break, Andrea Miebach reported on the latest approaches and recent publications of the B3 project of the CRC 806. The project uses different methods to reconstruct paleoenvironments in the Near East and Europe during the last 200,000 years to get a better understanding of human–environment interaction in the past (see Figure 5). The applied methods include: (I) Spatial biome modeling for different climate scenarios using a biome-climate transfer function [25]. Here, the response of vegetation to changing climate parameters is explored and biome probabilities are mapped. (II) Diachronic local biome and climate reconstruction based on pollen data of sediment cores (e.g., [26,27,28]). With the help of biome-climate transfer functions, fossil pollen data is used to reconstruct time-series of climate parameters in a probabilistically way. (III) Spatial climate reconstruction using paleo proxy data (e.g., [27,29,30]). The third method combines a set of botanical fossil data with climate model simulations to get a spatially explicit climate reconstruction. The results of these different approaches provide new insights into the environmental history on different scales.

2.1.5. Integration of Information Derived by Terrain Analysis, Geo-Physical Applications and Field Work to Reconstruct Paleo-Environmental Landscape Features: Examples from Italy and Africa by Michael Märker

The reconstruction of paleo-landscape features for archeological and/or paleontological purposes is primarily based on available environmental data and additional site information (e.g., [31]). Hence, site location analysis is usually a combination of multi-variate statistics and spatial continuous datasets that have been prepared by advanced GIS applications [31,32]. For example, digital elevation data of different origin and on different scales are utilized to derive topographic indices describing certain processes or characteristics of geomorphologic, geologic, climatic, hydrologic, vegetation or strategic circumstances [33,34,35,36,37,38]. In three case studies from Italy (see Figure 6) and Eastern Africa, we illustrate what DEMs, remotely sensed data, detailed terrain analysis, data mining technologies and geophysical methods tell us about Landscape pattern and how their integration might help to understand, and to reconstruct paleo-landscapes [34,39,40,41,42].

2.1.6. Geomorphometry in Paleo-GIS Applications by Felix Henselowsky

Abtiotic landscape parameters such as a very smooth or rough topography are also highly affecting the way in which humans have lived in a given landscape. However, the modeling and mapping of paleoenvironments in context of Pleistocene human behaviour tend to focus on parameter such as climate, vegetation or associated biomes. They represent mainly direct and indirect biotic parameters. As an additional important abiotic parameter, the impact of topography at various scales in the spatial analysis of a given landscape with regard to geoarcheological questions has been discussed with case studies from Northeast Africa and the Eastern Desert of Egypt [43]. Two issues in particular are of major importance in geomorphometry: the spatial resolution of a DEM, and the spatial scale of landforms under consideration. A clear identification of various scales is important, as geomorphometry operates on a wide spectrum of scales ranging from a few millimetres up to several hundreds of kilometres, resulting in a wide range of landforms. It is discussed what the topography can contribute to the characterisation of a given landscape at various scales, where hunter-gatherers have lived and how this can be integrated into the characterisation of paleolandscapes with particular focus on human behaviour at different scales (see Figure 7).

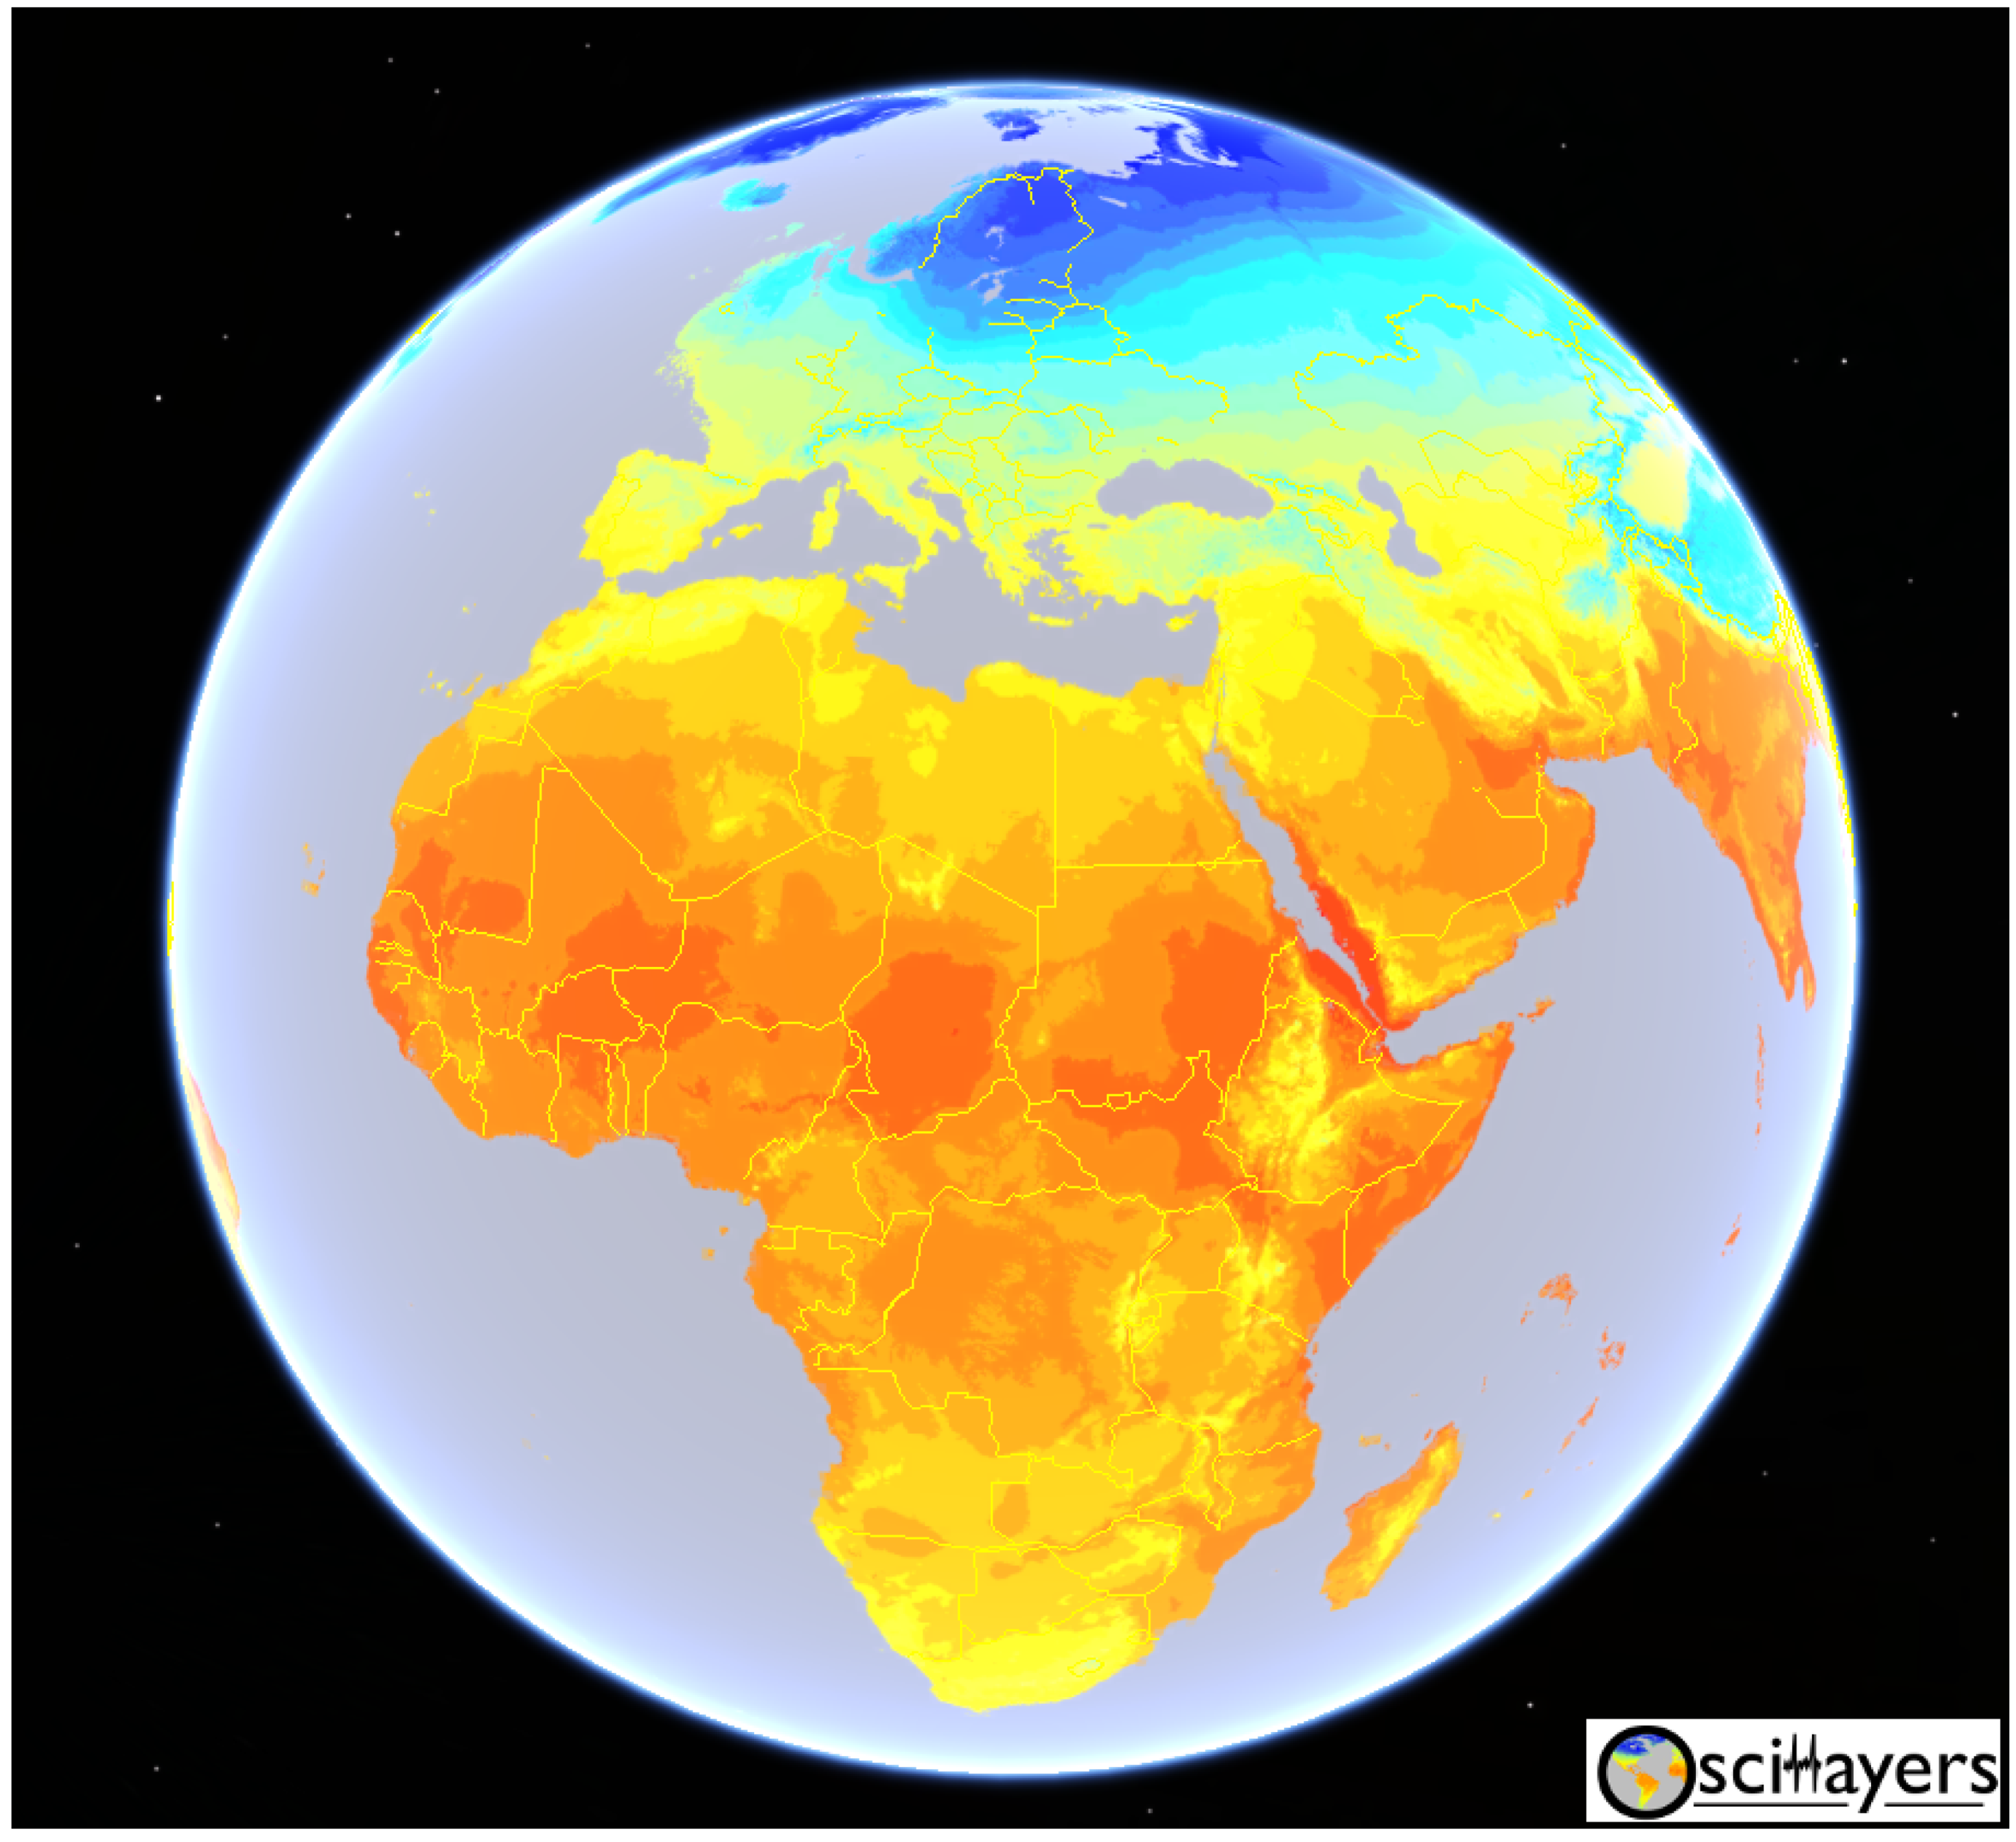
2.1.7. Oscillayers: A Dataset for the Study of Climatic Oscillations over Plio-Pleistocene Time-Scales at High Spatial-Temporal Resolution by Alexander Gamisch

Alexander Gamisch presented his work about the Oscillayers data set (see Figure 8). The presentation started with a short introduction about spatial explicit climatic data, including the biologically relevant bioclim variables derived from observational data (e.g., WorldClim, [5]) as well as simulations of large scale general circulation models (GCM). Then, he gave a short overview of the available sources for paleo-bioclimatic data for different time points (https://www.worldclim.org; [5]; http://chelsa-climate.org; [44]; http://ecoclimate.org; [45]; https://github.com/GlobalEcologyLab/PaleoView/releases/tag/v1.3; [46]; http://paleoclim.org; [47]) while simultaneously pointing out the general lack of a global paleo-climatic dataset spanning the entire Plio-Pleistocene. To fill this gap he introduced Oscillayers, a global-scale climatic dataset, representing the 19 bioclim variables for the last 5.4 million years at high spatial (2.5 arc-minutes = 4.65 × 4.65 = 21.62 km 2 at the equator) and temporal (10 kyr time periods) resolution [48]. This dataset builds upon interpolated anomalies ( Δ layers) between two end member climates (here the present and the LGM) that were scaled relative to a spatial implicit global mean temperature curve, derived from benthic stable oxygen isotope ratios (cf. [49]). After a walkthrough of the methodological steps required and the corresponding data validation steps the utility and potential applications in macroecology, macroevolution, paleobiology and human evolution science etc. for this and similar approaches (cf. [50]), was discussed. The Oscillayers dataset is available at the Dryad digital repository [51].

2.1.8. Modeling Macro Scale Paleo Climates during Heinrich Events by Masoud Rostami

A Heinrich event (HE) is a natural phenomenon that occurred during the last glacial periods. It is assumed that the broken off large amounts of icebergs traversed the North Atlantic at these periods. As it is hypothesized that the HEs may indicate an extreme global climate change, so paying enough attention to these phenomena is important. The precise evolution of these glacial events is still under debate. Although there is no consensus, some mechanisms for the periodic iceberg release during HEs have been proposed, e.g., a multi-millennial buildup collapse (binge–purge) cycle of the Laurentide ice sheet (LIS) by [52]. Based on this classical hypothesis, a steady, time-independent snow accumulation rate without any variation in external climate is the only requirement of an oscillatory behavior from the LIS. Some prominent Heinrich layers, H1, H2, H4, and H5, appear are accompanied by massive discharges of large amounts of icebergs with a major source area from Hudson Strait into the North Atlantic. Old versions of the Earth system models (ESMs) were based on this assumption that the extent and elevation of the Greenland and Antarctic ice sheets are time invariant without any interaction with other parts of the climate system, while it has been established that they have mutual interaction with atmospheric and ocean currents on time scales of a decade or less. After introducing improved ice sheet dynamics of HEs in a ESM model, we colleagues simulate HEs by applying the LGM boundary conditions under different freshwater and sea surface temperature (SST) forcing scenarios over the northern North Atlantic. By means of reproduced climate variables for stadial and interstadial cycles, a human existence potential (HEP), and archaeological data, we estimate the HEP over Europe for some Upper Palaeolithic technocomplexes (see Figure 9).

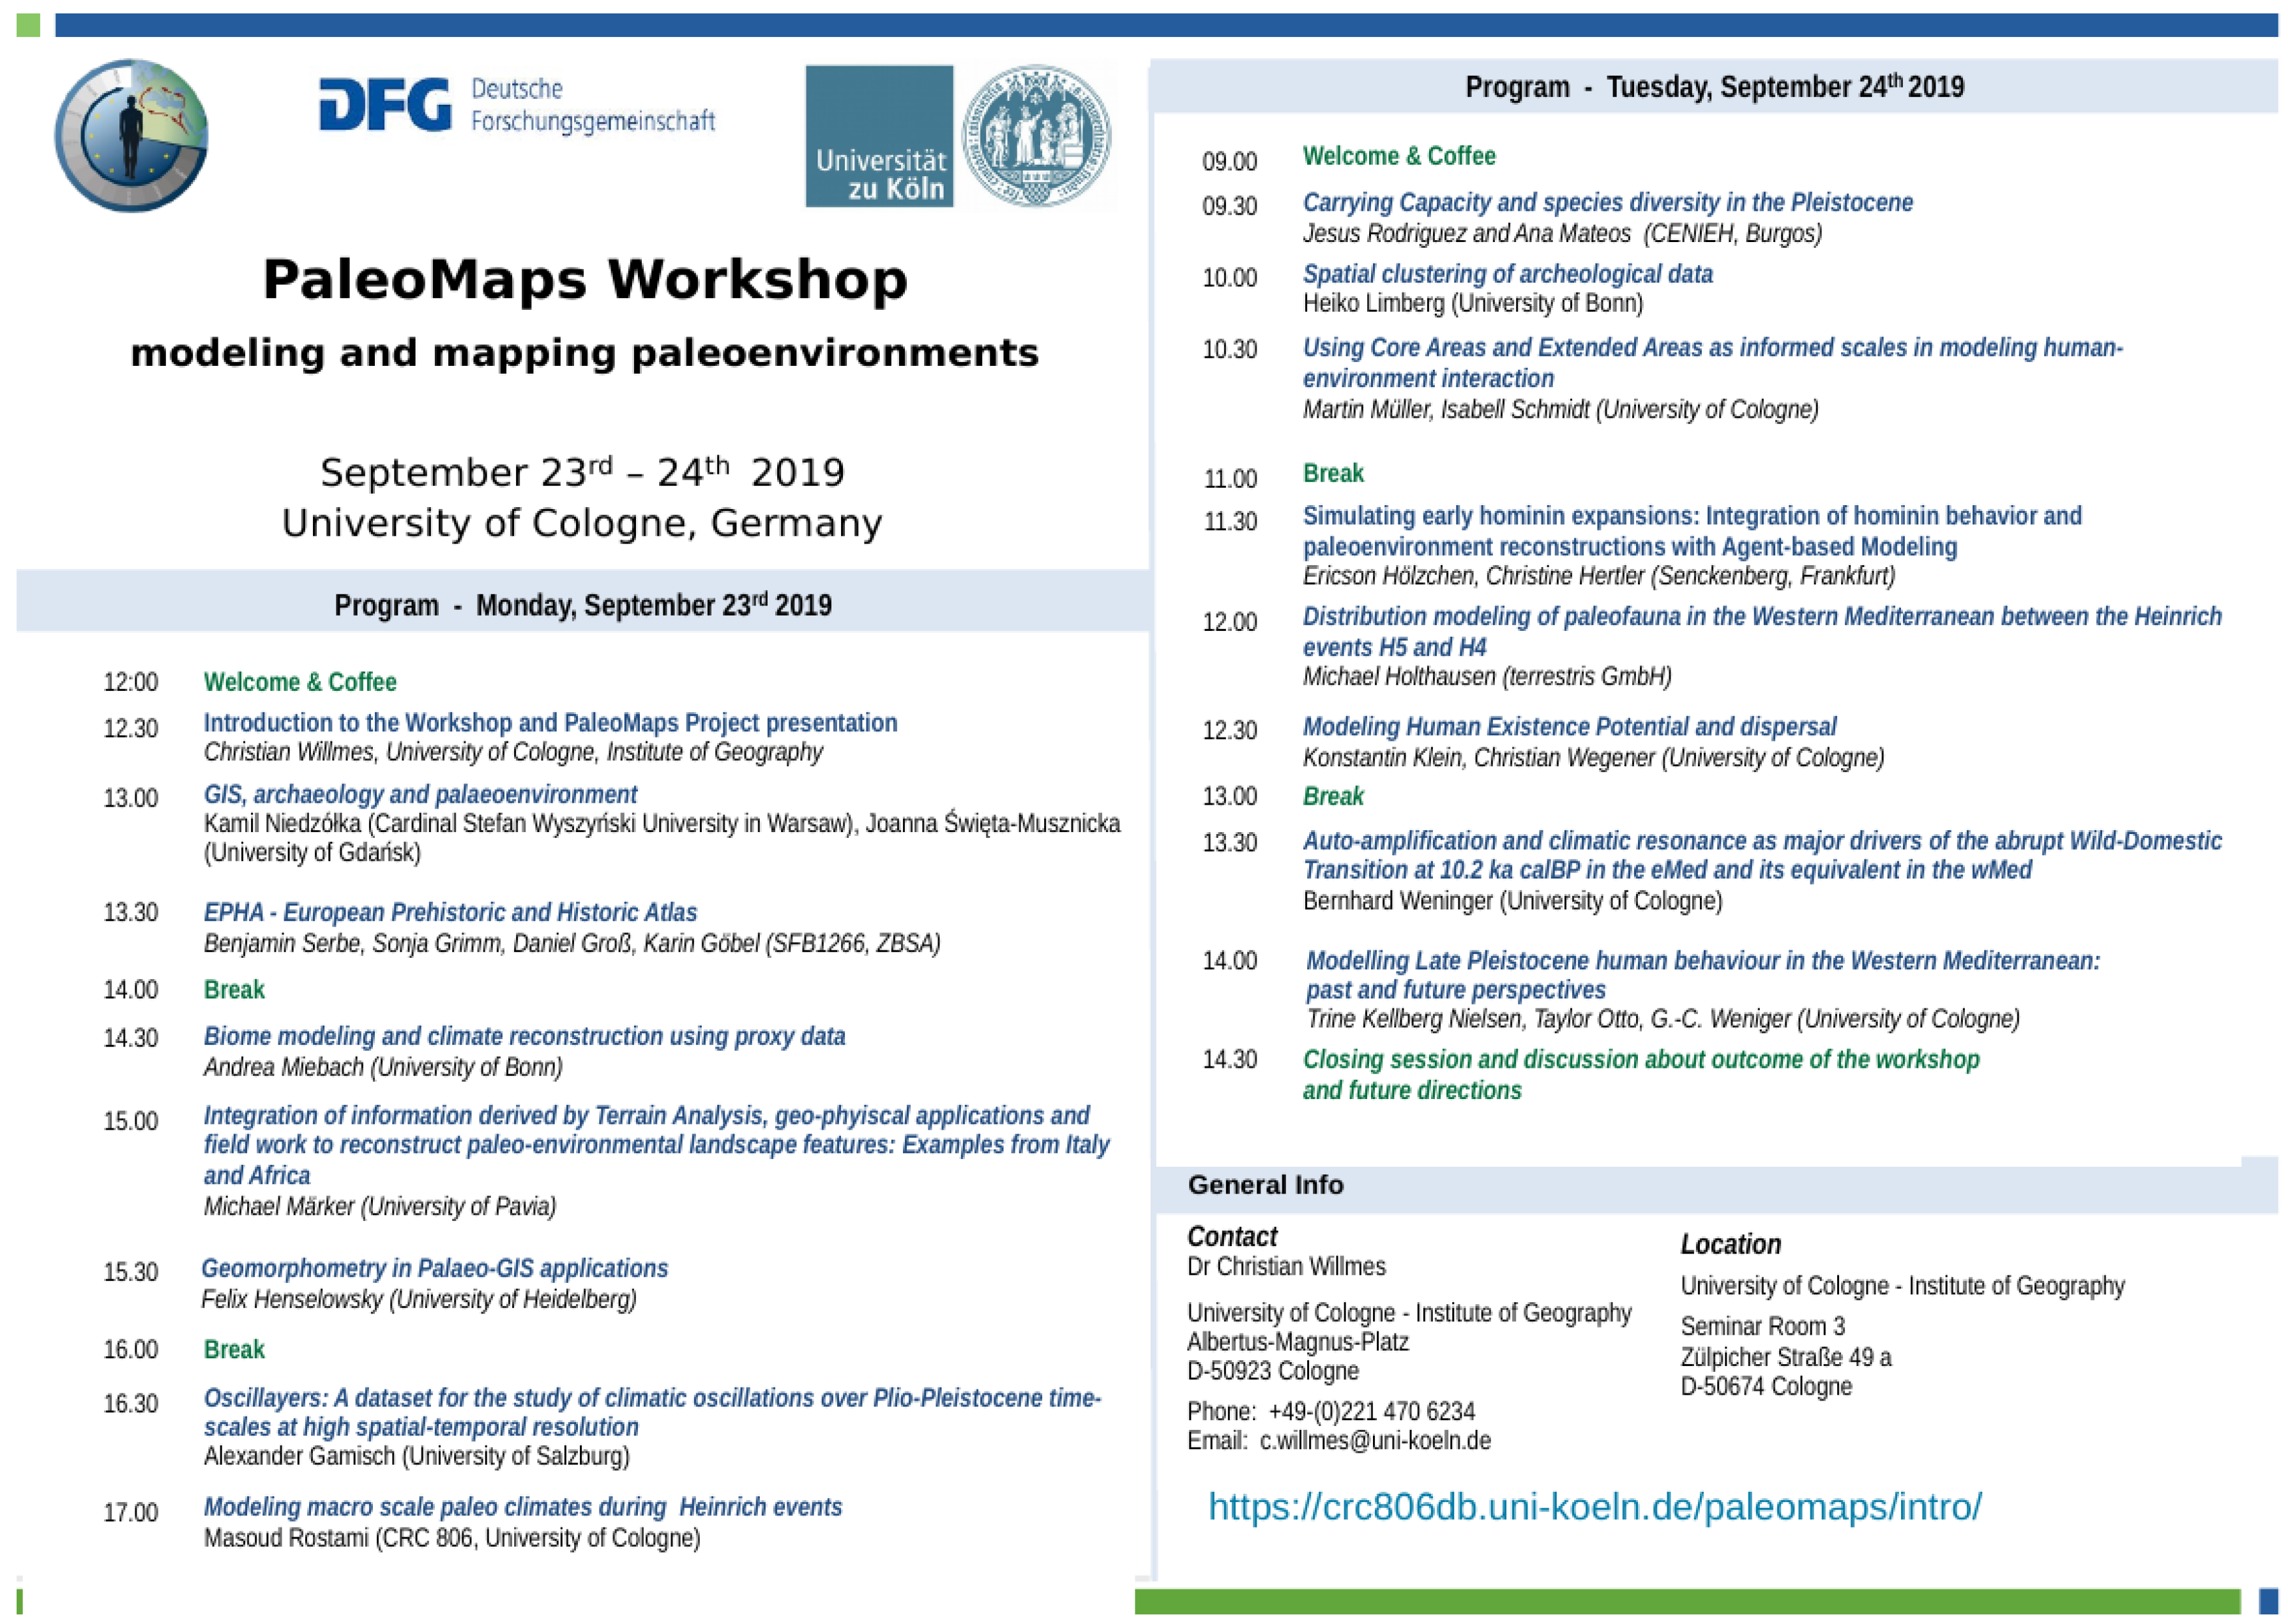
2.2. Day 2—Tuesday, 24 September

For the second day of the workshop, eight talks concerning modeling applications in the archeological context were held. The different approaches should shed light into the questions of how paleoenvironmental models are applied and re-used by archeological modeling applications.

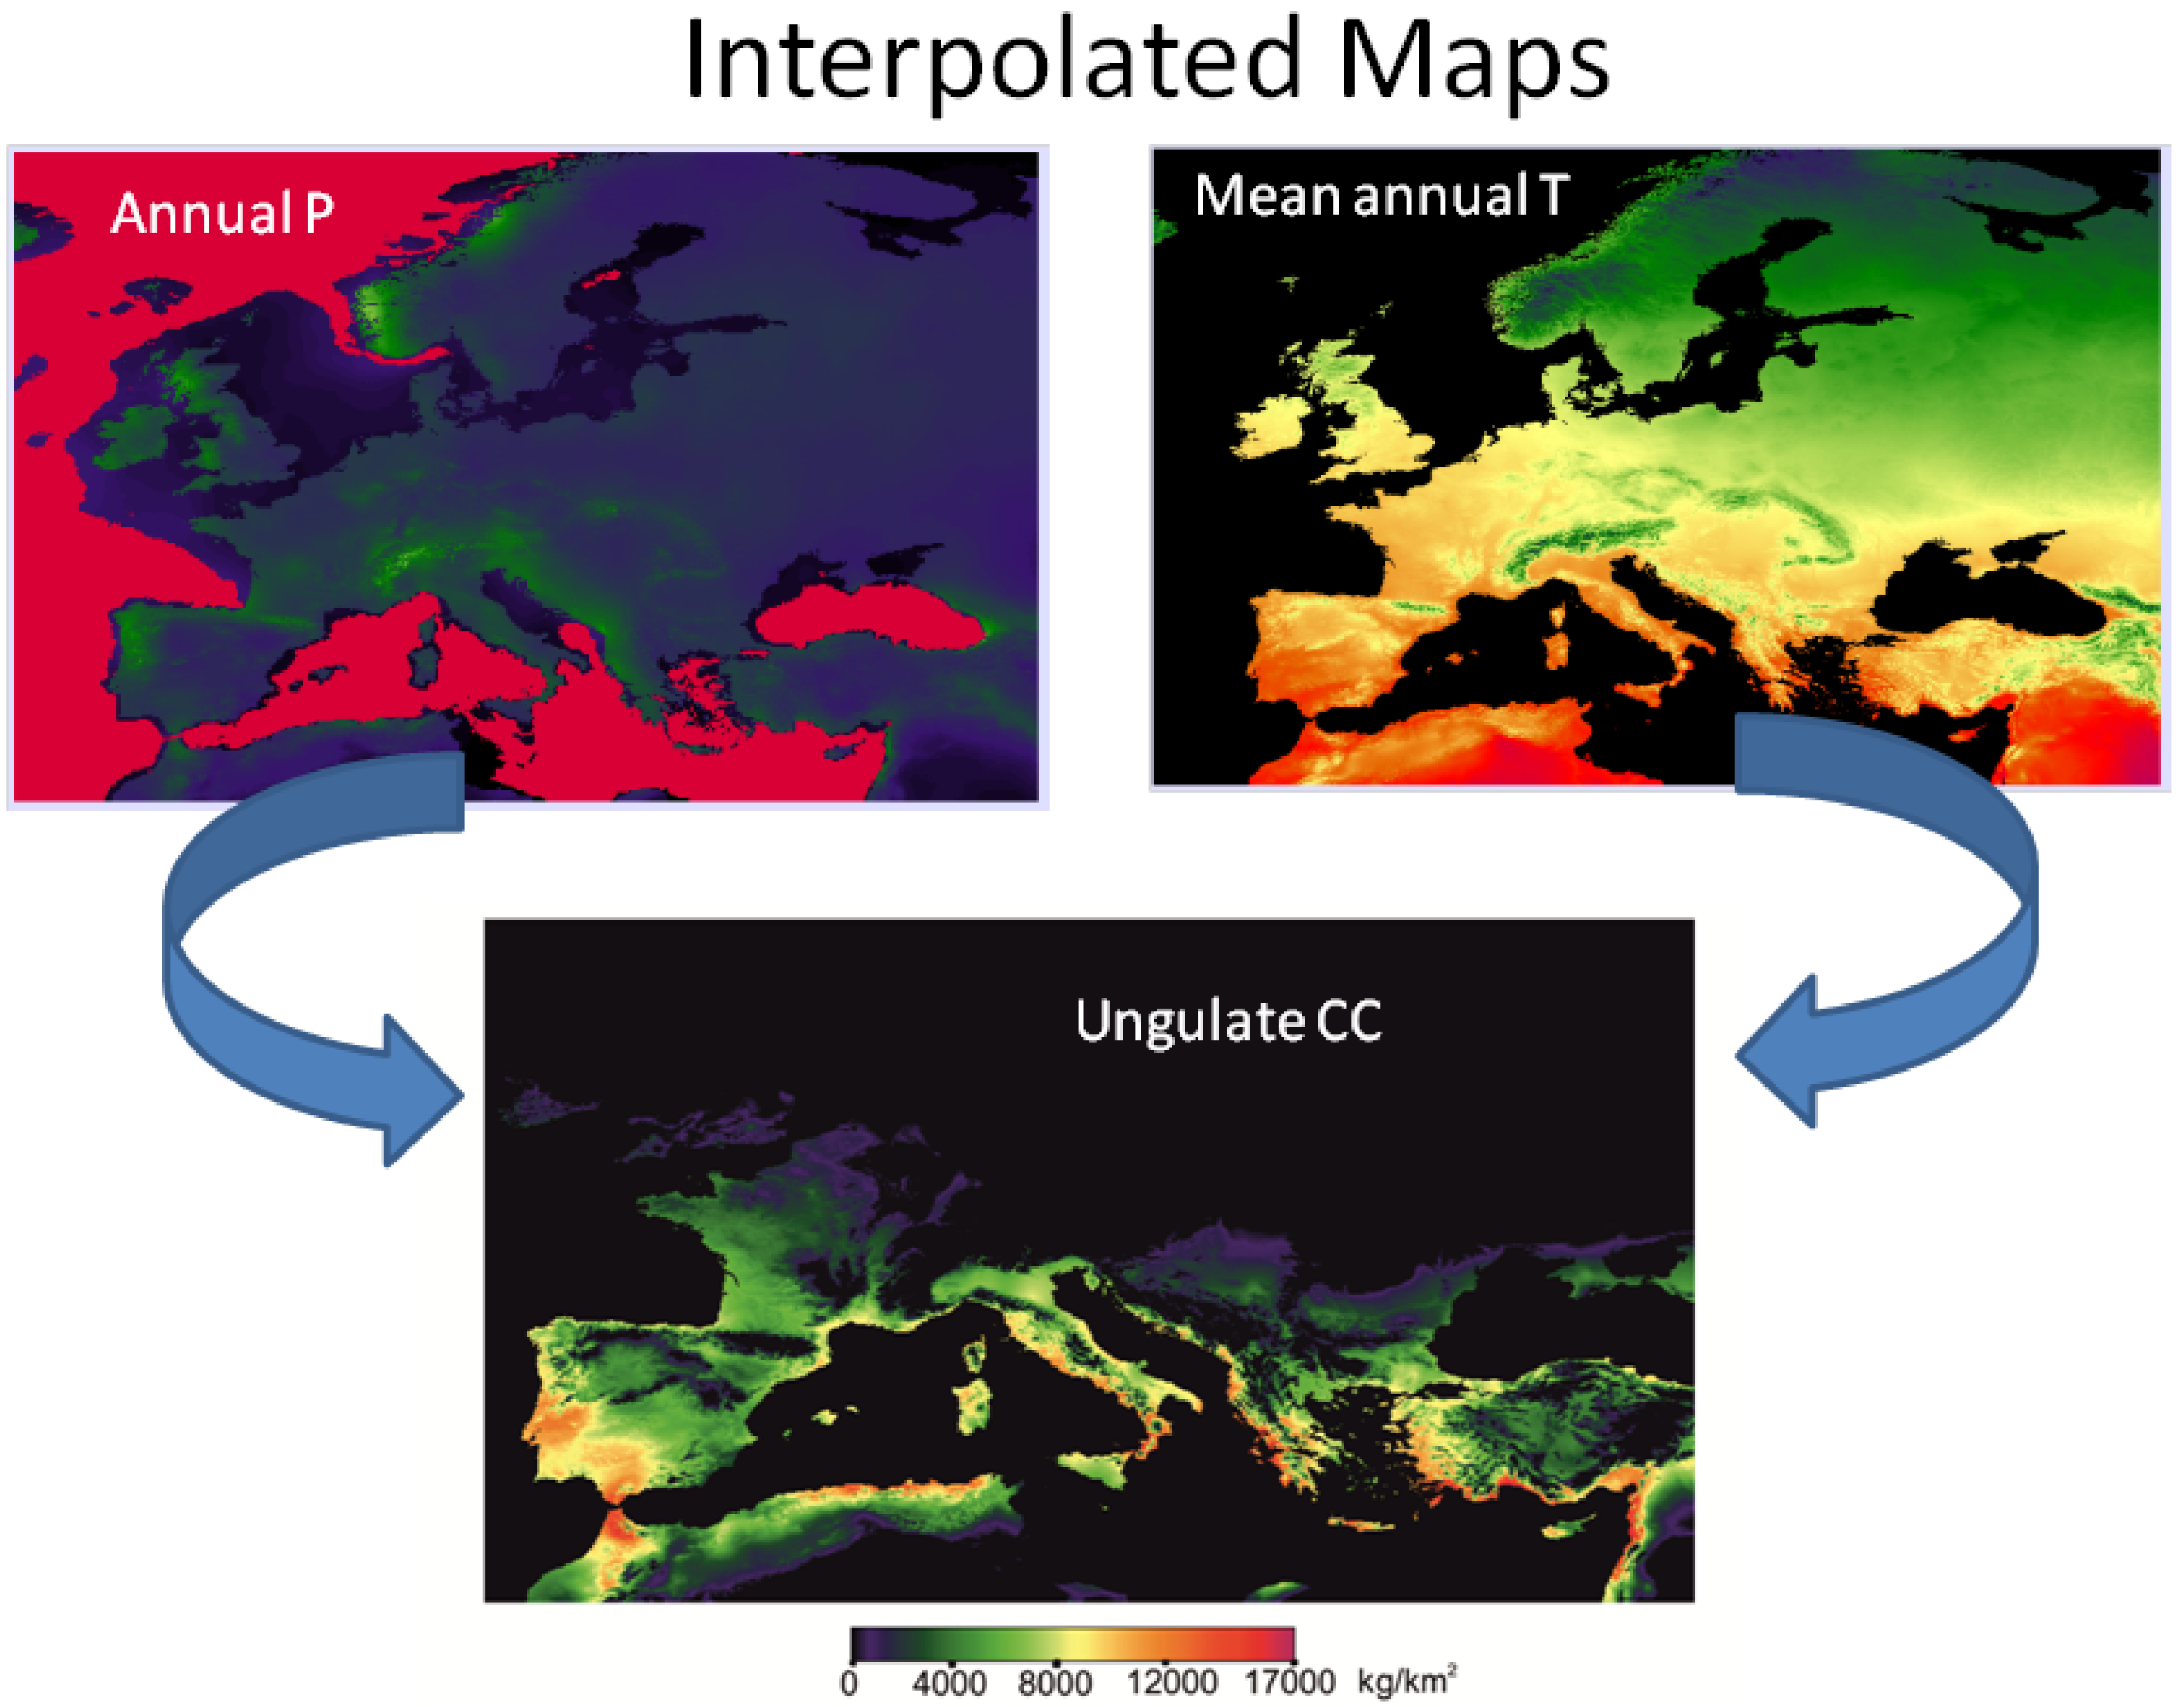
2.2.1. Carrying Capacity (CC) and Species Diversity in the Pleistocene by Jesús Rodríguez

Carrying capacity (CC) is a theoretical concept that represents the maximum biomass that an ecosystem can sustain over the long term. Many past ecosystems differ in ecological structure from their recent counterparts, especially in the diversity and ecological characteristics of the large mammal fauna [53,54]. Since carrying capacity (CC) is directly related to the maximum sustainable population density of each species in the ecosystem [50], estimating the CC of large mammals in those past ecosystems is essential to understand their functioning. As an example, the number of large herbivores (weighing more than 450 kg) was much higher in Europe during the Pleistocene than in the present [55,56]. Similarly, carnivore diversity was extremely high at the end of the early Pleistocene [57] in Mediterranean Europe. In his presentation, J. Rodríguez adressed the question of whether that high diversity was related to an increased CC in those past ecosystems. Most archeologist agree that ungulates were a major food resource for the Paleolithic hunter-gatherers [58,59,60,61]. Thus, estimating ungulate abundance in the past provides key information to evaluate the availability of that key resource for humans in those environments. It is well known that ungulate carrying capacity (UCC) is ultimately determined by net primary production (NPP) [62,63] and that the main factors determining NPP are temperature and rainfall [64]. Thus, Rodríguez et al. [65] developed a simple model to predict maximum UCC in recent ecosystems from mean Annual Temperature and Annual Rainfall. That model was eventually used by [50] to map the variation in UCC in Mediterranean Europe during the Late Early Pleistocene and the Early Middle Pleistocene. Annual Rainfall and Mean Annual Temperature for those periods were obtained from interpolated paleoclimate maps, following the same interpolation methodology applied by other authors [48,49]. Using the interpolated UCC maps [50] (see Figure 10) showed that carnivore species richness was as high in the Early Pleistocene as it is in the richer recent African ecosystems. In contrast carnivore CC, which depends on UCC, was much lower. Consequently carnivores necessarily occurred in the late Early Pleistocene ecosystems of Europe at low population densities, and this undoubtedly affected ecosystem functioning and the survival opportunities for hominins.

2.2.2. Spatial Clustering of Archeological Data by Heiko Limberg

Most techniques for spotting regions of higher site densities are of spatial nature and do not take the uncertainty of the radiocarbon dating into account. This requires the archeologist to split datasets of site distributions into epochs in the first place. We develop a density-based clustering algorithm, which extends the very flexible (in terms of ability to cluster arbitrary shaped patterns) OPTICS algorithm [66]. It interprets distance to the nearest points in a probabilistic sense and can incorporate the entire temporal information from the calibrated radiocarbon data. We thereby translate the mutual reachability distance developed for the OPTICS algorithm into probabilistic information. Consequently, transition probabilities from site to site are defined such that the transition tends to be towards higher density regions. Different density regions can then be identified with the help of the Analysis of absorbing reducible Markov chains.

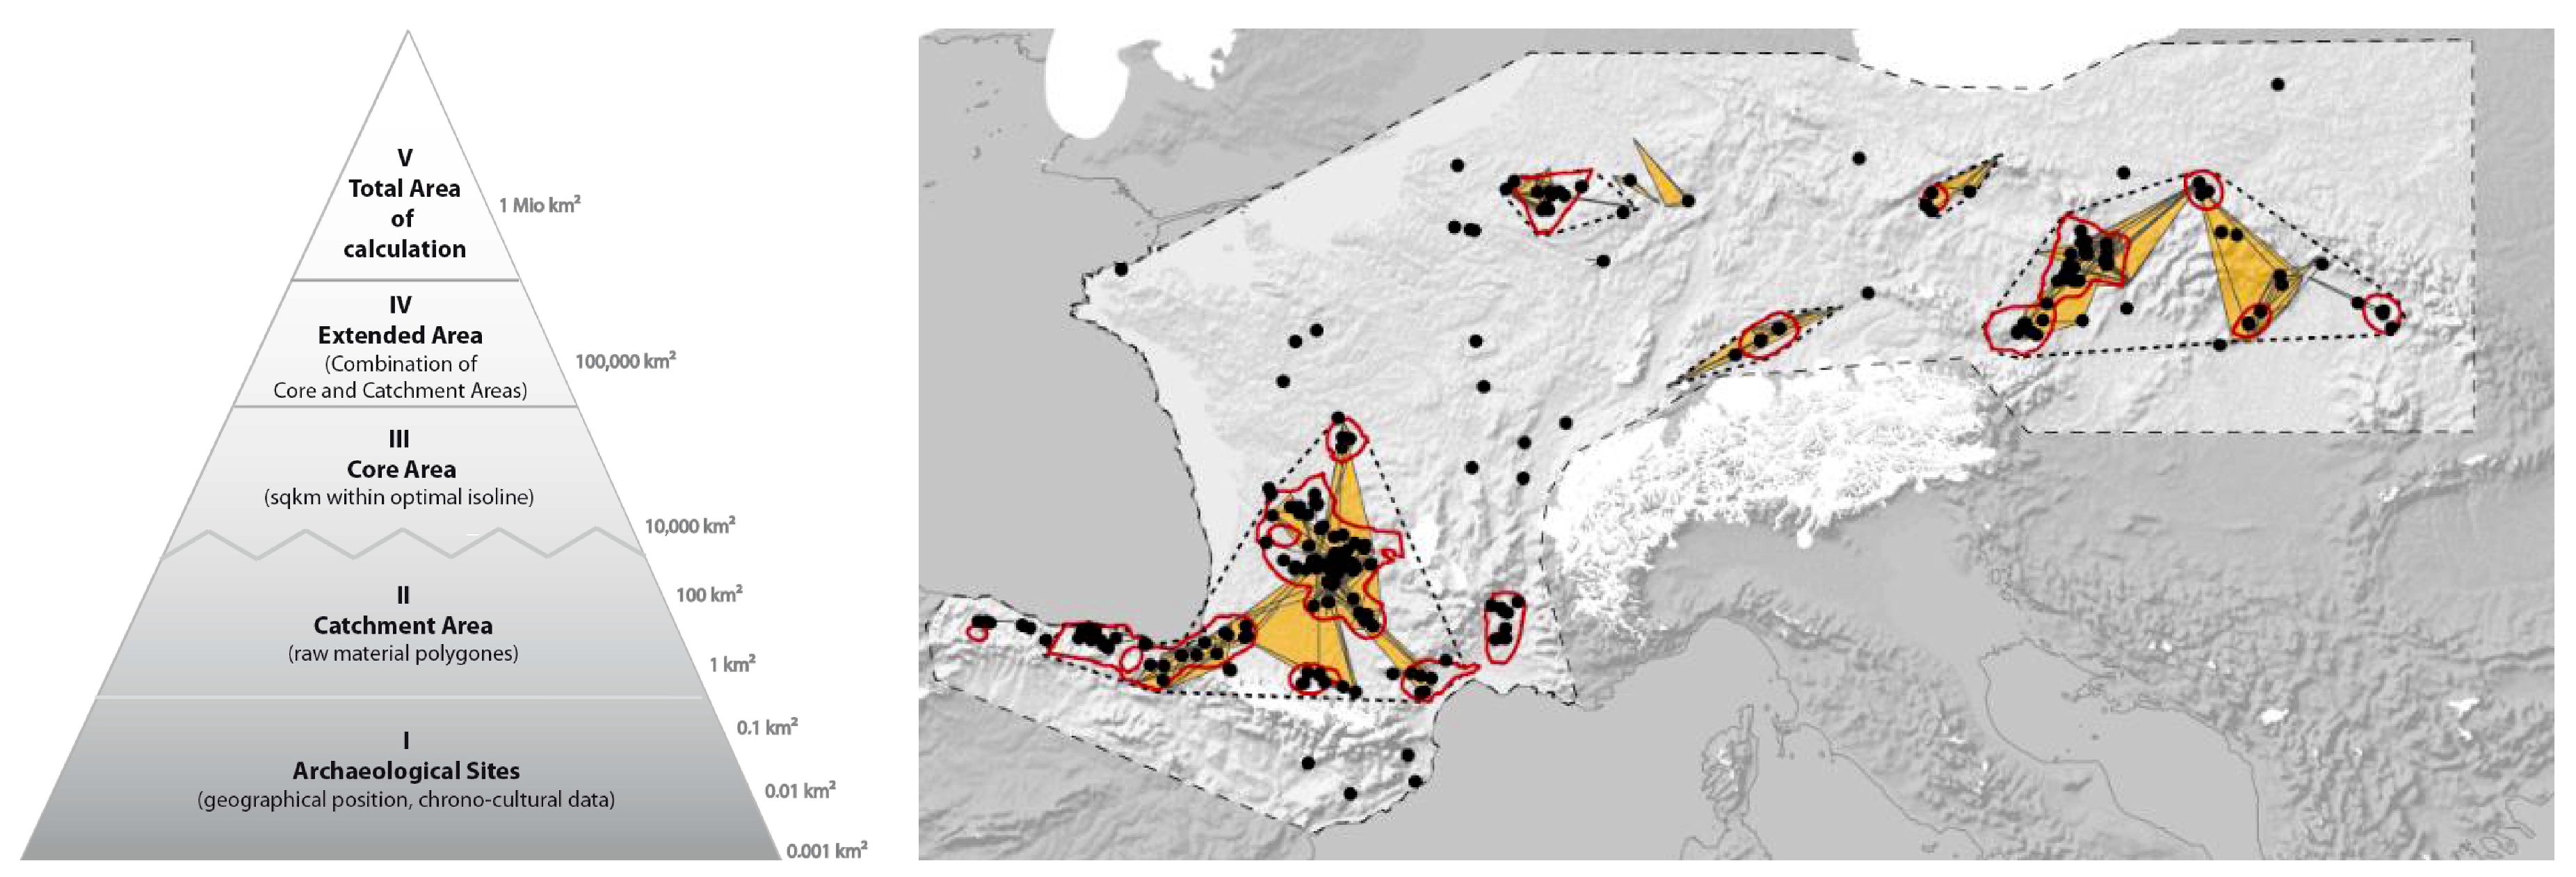
2.2.3. Using Core Areas and Extended Areas as Informed Scales in Modeling Human-Environment Interaction by Isabell Schmidt and Martin MüLler

Core Areas and Extended Areas are archeologically informed scale levels, introduced in the framework of the Cologne Protocol [67,68] to obtain population estimates for Prehistoric mobile foraging societies in well-studied regions of Europe [69,70]. They form part of the scalar model presented in Figure 11 left. Their informative value in the field of modeling human–environment interaction is discussed.
The Cologne Protocol uses a site-density based geostatistical procedure to discern Core Areas of dense site distribution from “empty areas” of less dense and thus less intensive occupation (Figure 11 right; [17,69,71,72]). Since archeological sites are prone to numerous biases, our approach requires explicit data on positive as well as negative evidence for observed patterns. We argue that Core Areas then provide a necessary mean to adjust the temporal scale of archeological data prior to integration into and comparisons with environmental models.
Modeling approaches run the risk of integrating parameters with different temporal and spatial resolution and relevance in the model set-up. Data on site distribution (as a proxy for human presence) and climatic/environmental conditions are frequently used in this context—and are a case in point. While commonly used climatic models reconstruct conditions of a single moment in time, archeological data frequently subsume evidence from a large temporal scale, covering several environmental conditions and shifts. To reduce distortions caused by the short-term outliers in site distributions, Core Areas are proposed as a meaningful way to address the problem [73].
“Extended Areas” constitute the next scale level (Figure 11), describing an interconnected social/economic area of past societies, obtained through superimposition of Core Areas and evidence on lithic raw material transport (for more details see [68]). Other archeological correlates for economic or social contact might be added at this scale level. Since Extended Areas—by definition—include information on human mobility and interaction, they provide meaningful spatial data to model cultural adaptation to environmental conditions (see [74] and references therein for a similar application).
The use of Core Areas in modeling context has been subject to a study characterising humans’ relationship with Europe’s main river systems [75]. The relationship was investigated diachronically throughout the Upper and Final Paleolithic as well as Neolithic. The results show that the percentage distances of the Core Areas to the rivers aligned across two spatial scales (Europe and Central Europe) and two culture-economic phases (the Upper Paleolithic and the Neolithic) (ibid.).

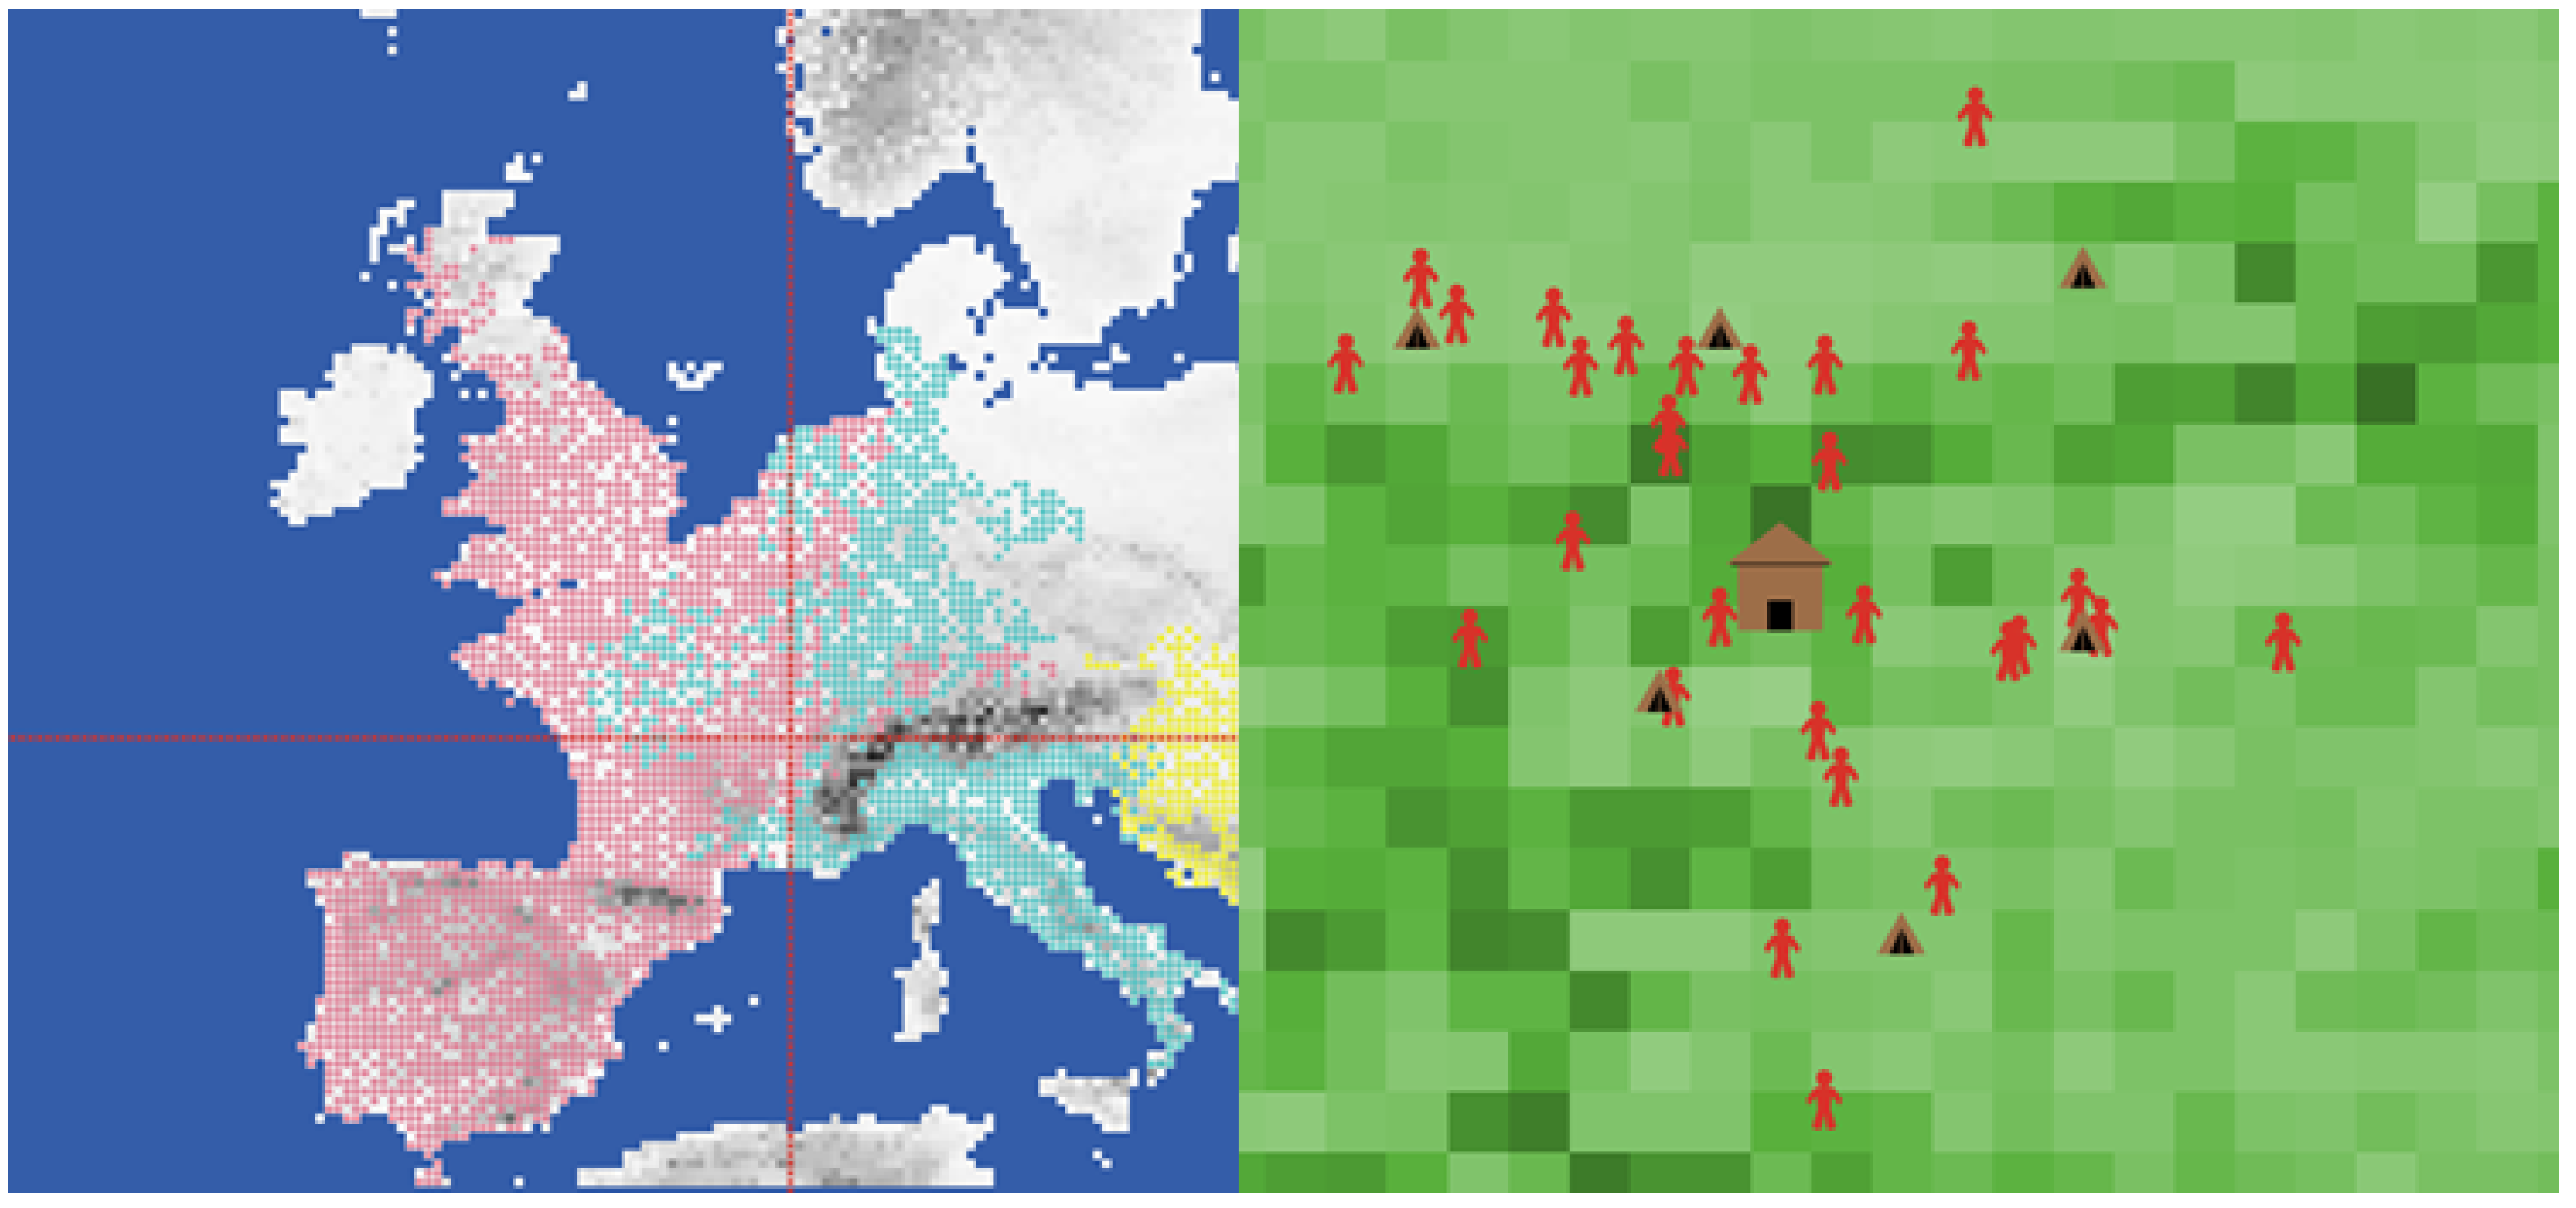
2.2.4. Simulating Early Hominin Expansions: Integration of Hominin Behavior and Paleoenvironment Reconstructions with Agent-Based Modeling by Ericson HöLzchen

Ericson Hölzchen discussed applications of agent-based modeling, to examine hominin expansions at different scales (see Figure 12). To approach the complex history of hominin expansions the expertise from different disciplines, such as archeology, paleoanthropology, geology etc. is required. The advantage of agent-based modeling is that it allows integrating data from fossil and archeological finds and behavioural models from various disciplines to explicitly test hypotheses on hominin expansions in dynamic simulations. In combination with GIS-environmental reconstructions it provides a virtual laboratory, where the behaviour of hominins can be examined on reality-oriented landscapes. Nonetheless, good scientific practice is required to obtain valuable results from the simulation experiments. Therefore, a substantial amount of effort needs to be invested in extensive sensitivity analyses, good documentation and interdisciplinary discussions when formulating the conceptual model. When considering GIS-data, technical aspects such as resolution and projection will affect the simulation results. Therefore, to reduce the sources of errors when integrating GIS-data and for the sake of efficiency, the collaboration with geographers is strongly suggested. To illustrate the application of agent-based modeling with GIS-data, ongoing modeling projects within the frame of the ROCEEH project and the METHOD IFG were presented. Future directions point to address hominin expansion ABMs at different scales and the transition between scales.

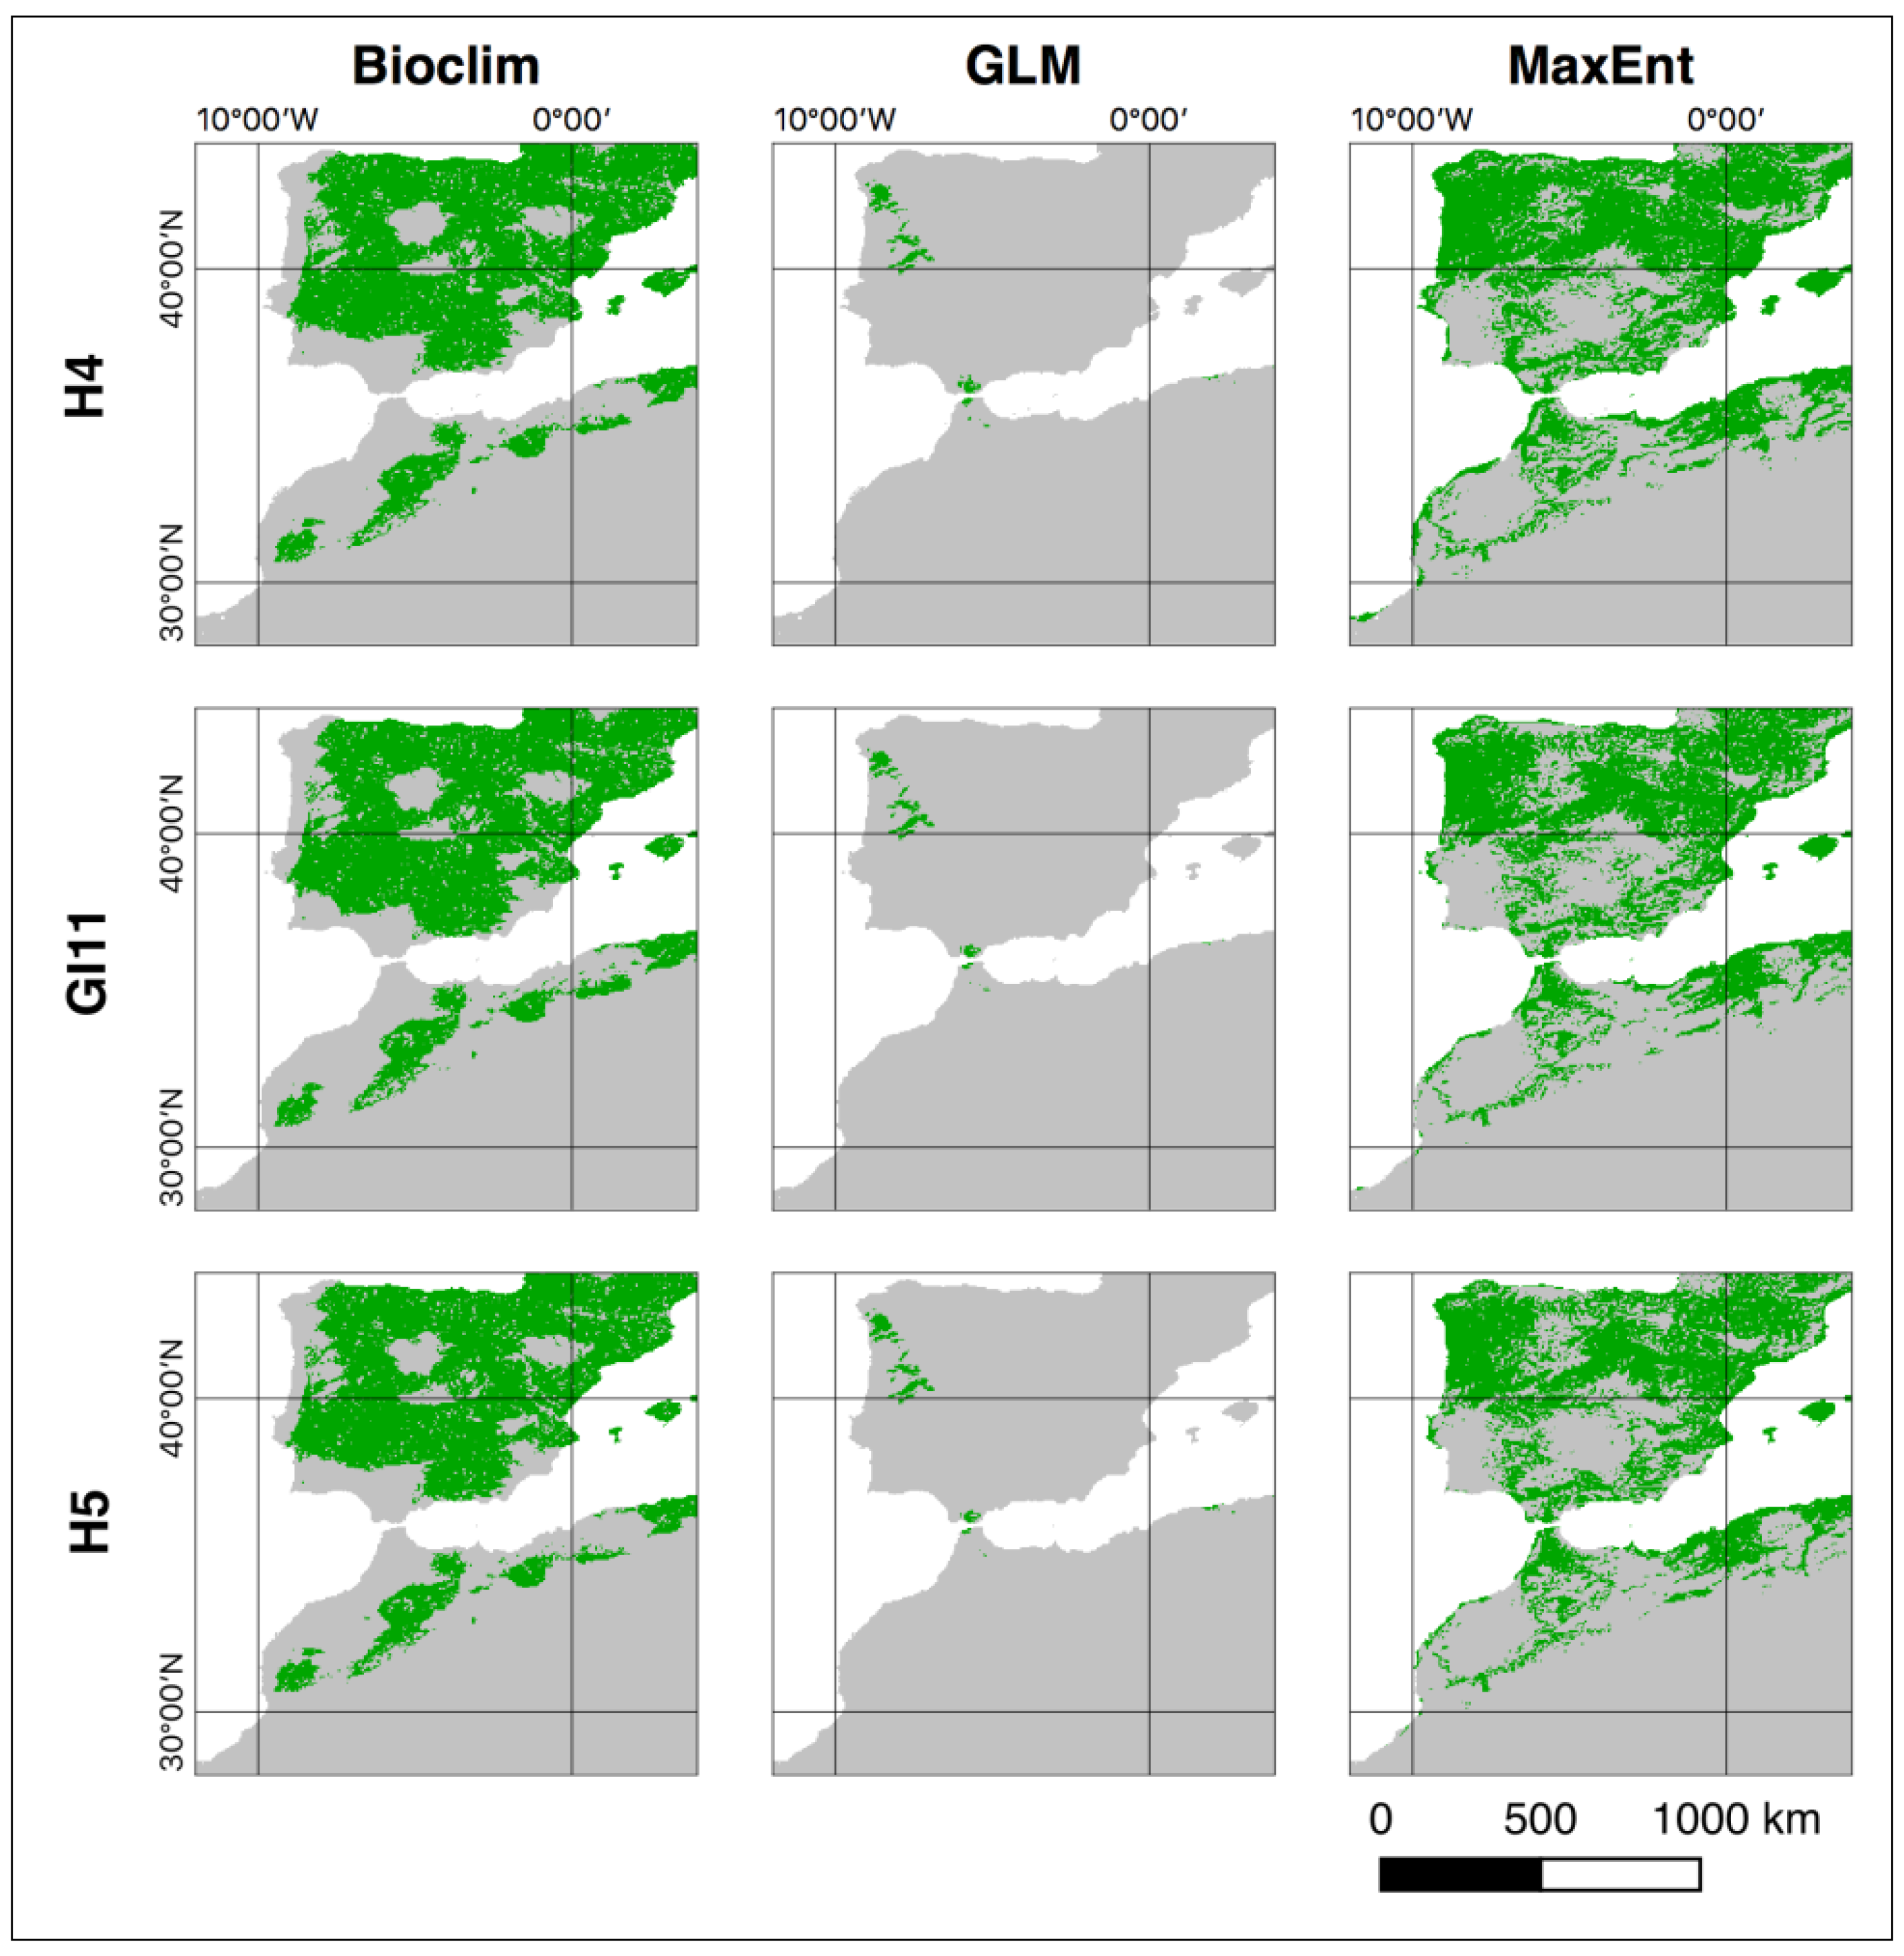
2.2.5. Distribution Modeling of Paleofauna in the Western Mediterranean between the Heinrich Events (HEs) H5 and H4 by Michael Holthausen

The master‘s thesis [76] from which Michael Holthausens talk emerged, deals with SDM for eight selected prey animals of the Neanderthals and the anatomically modern human within the framework of the Collaborative Research Center 806 (“Our way to Europe”). This research was realized for three methods in three climatically different time slices during the Late Pleistocene. One profile method, one regression method and one machine learning method were used. A model was developed that performs these three methods in order to obtain a potential distribution of the paleofauna in the Late Pleistocene and to link it to the dispersal of humans in this region. The results show that all three methods predict conditions for the presence of the species (see Figure 13) which may have hunted from both Neanderthals and anatomically modern humans. However, there are differences in the predicted regions between the individual methods for each species. Another task was to determine the best performing method. Based on this work, MaxEnt [77], a machine learning method, emerged as the best performing method among the applied methods.

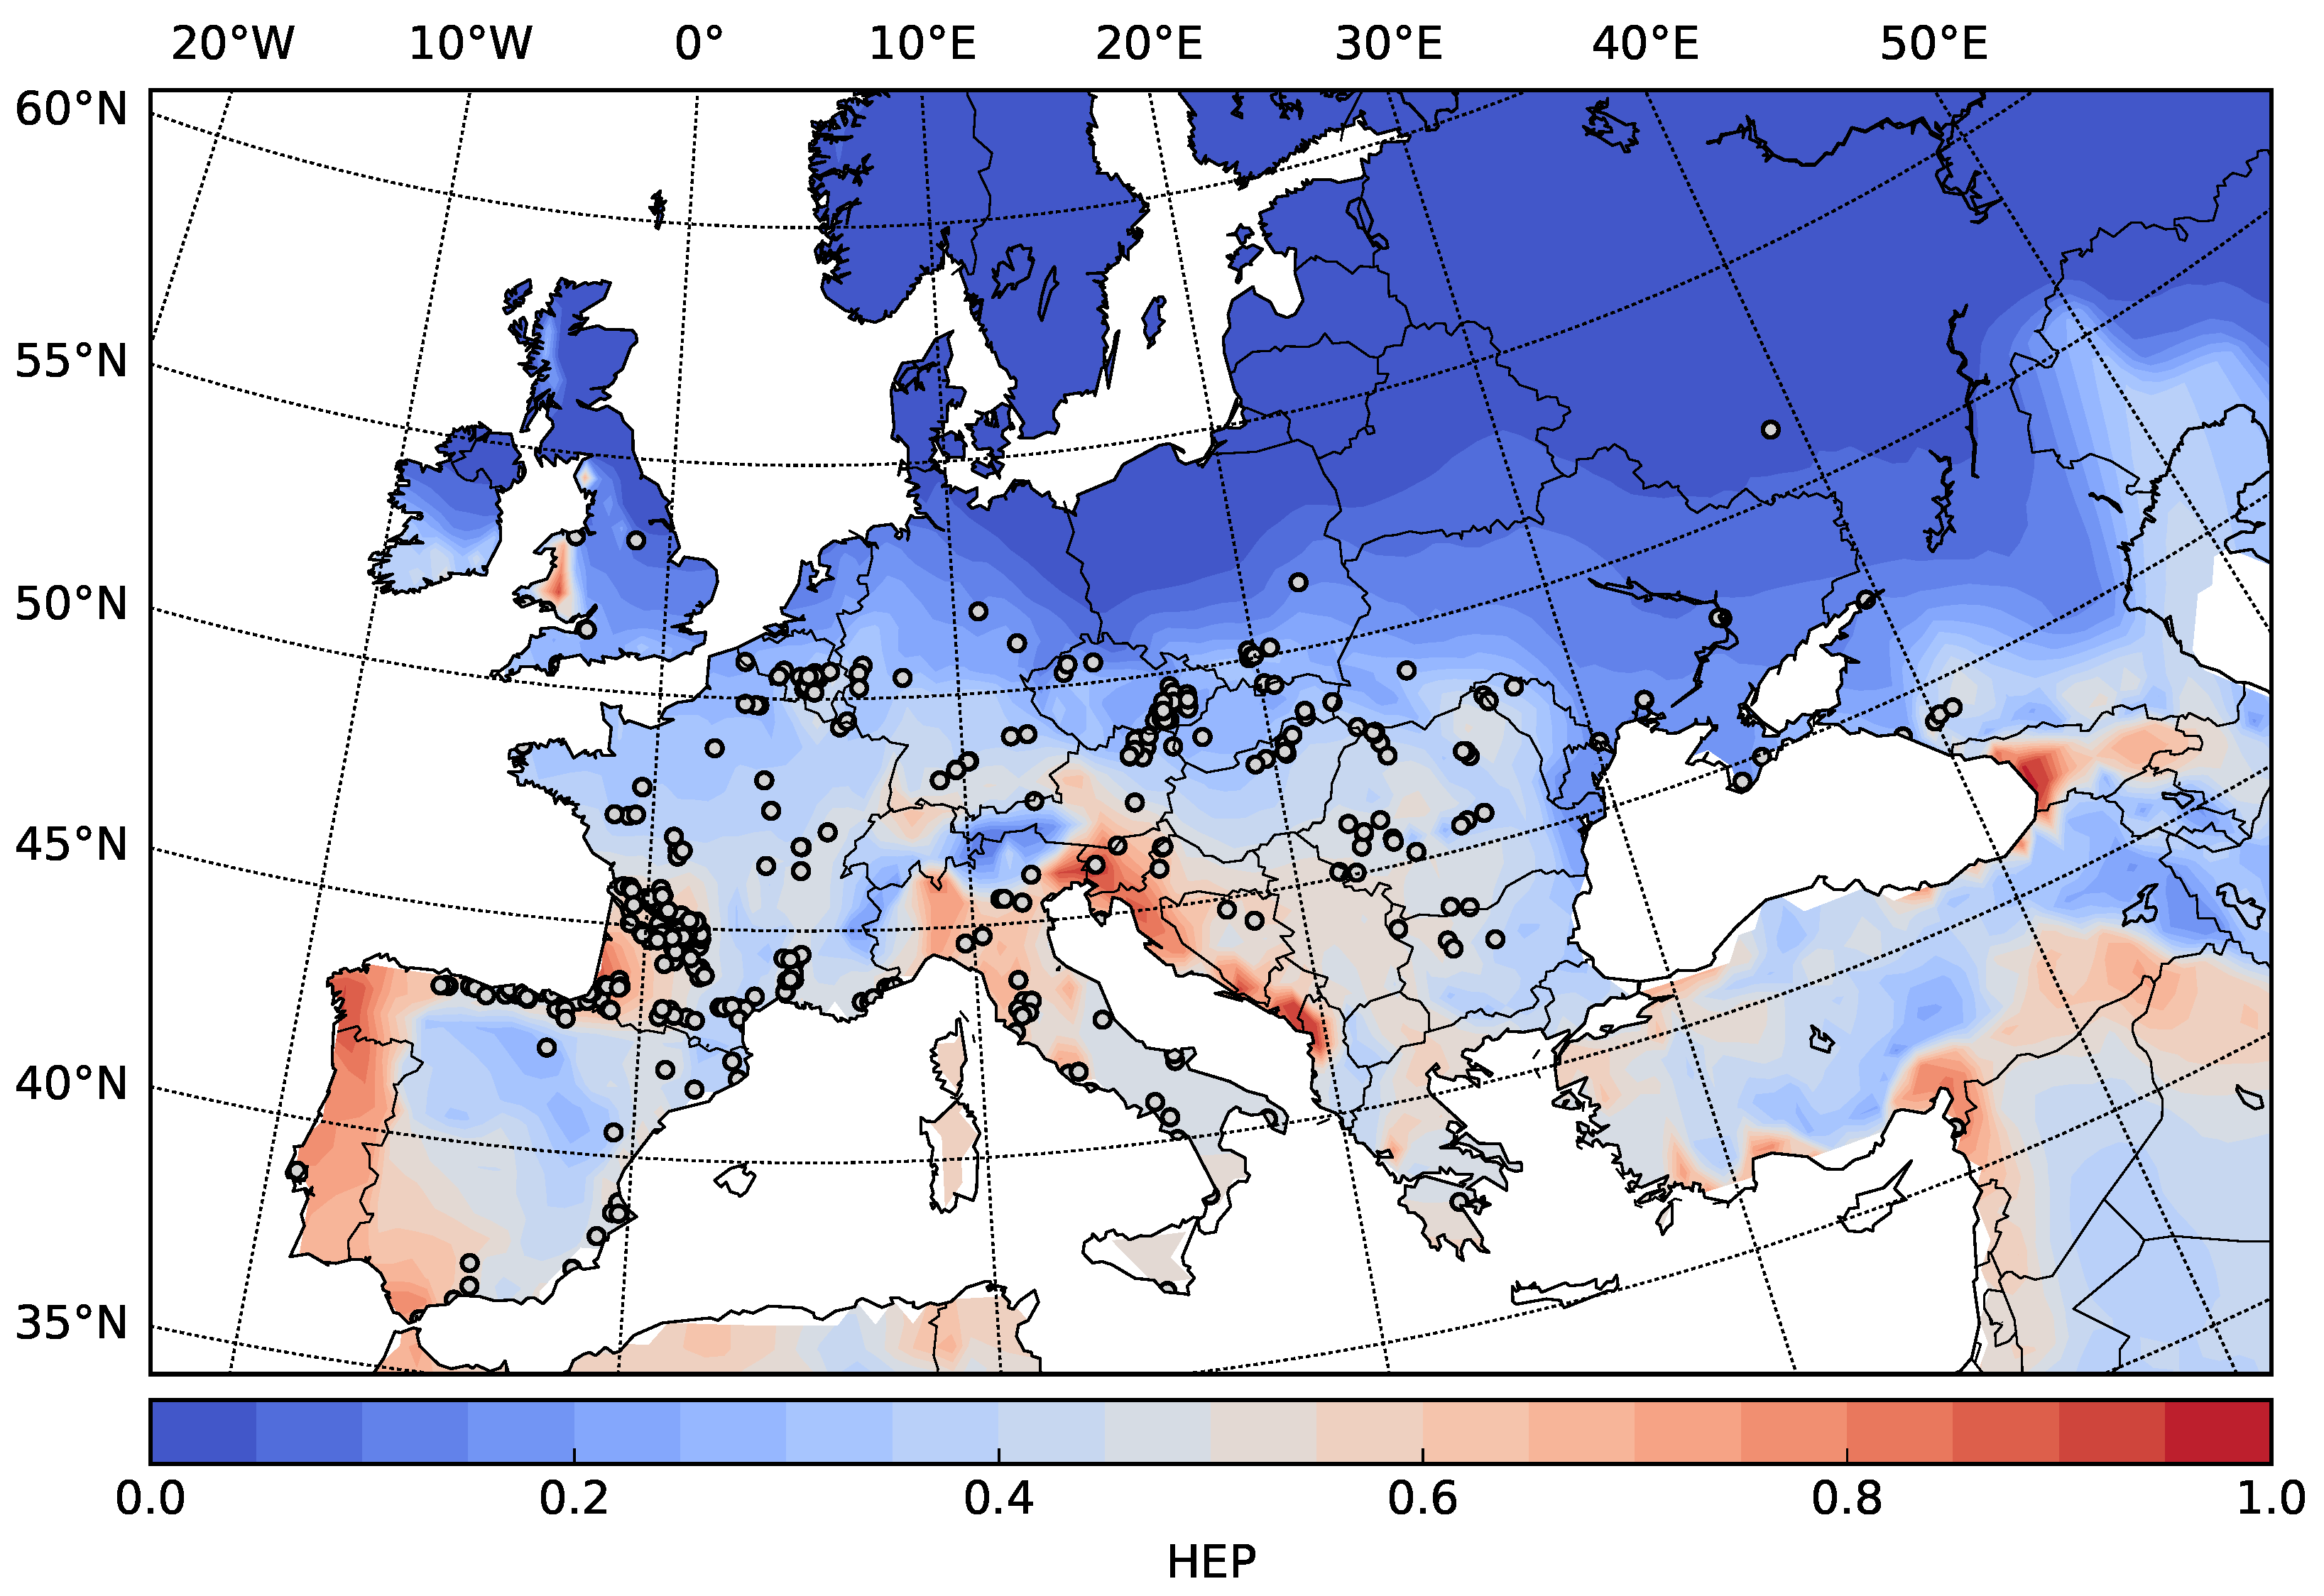
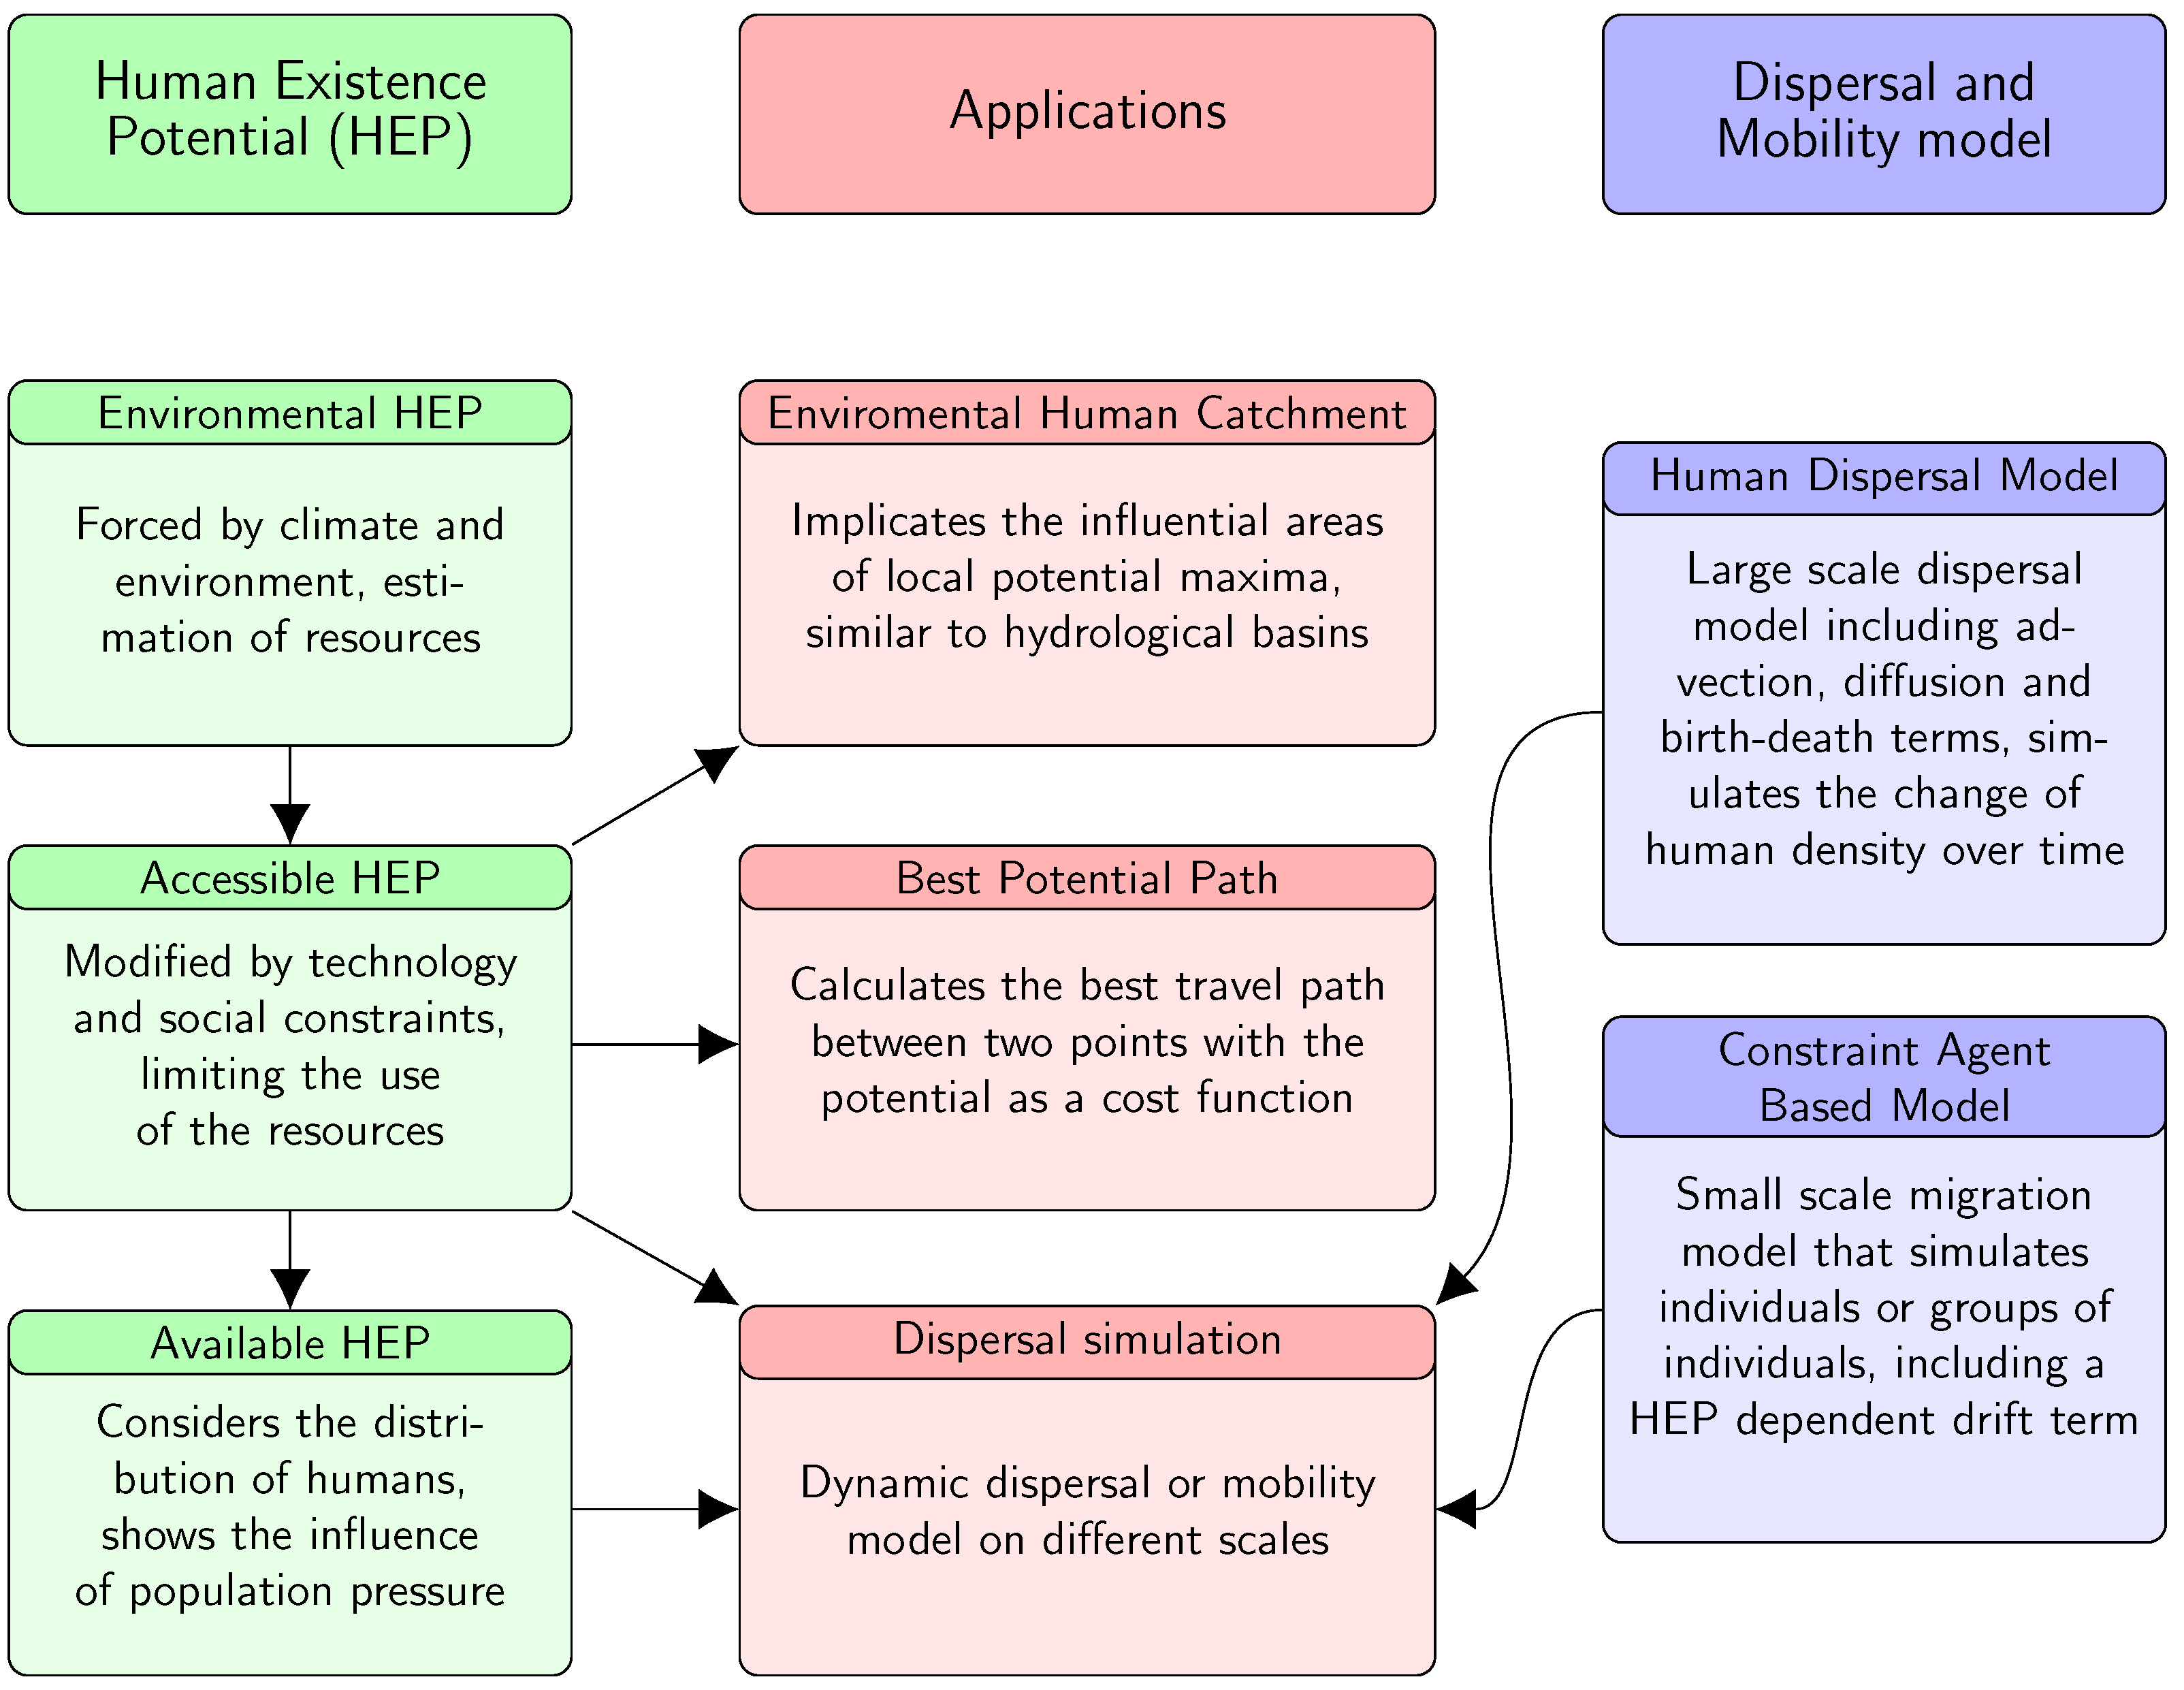
2.2.6. Modeling Human Existence Potential (HEP) and Dispersal by Konstantin Klein

Archeological records indicate that human population experienced frequent decline and growth as humans were on their way to populate the whole planet. These fluctuations can be seen in the development of population patterns and techno-cultures. Despite of the diverse setbacks, humans adapted to various environments and improved their technology. Climate, together with other environmental factors, profoundly influenced the development of human population. Our hypotheses is that climate and environment were the main drivers for human existence and dispersal. In the workshop, we presented a case study of HEP in Europe during the Last Glacial Maximum [73]. HEP for hunter-gatherer existence is estimated using climate/environment data, supported by archeological evidences. In Klein et al., we introduced the concept of Environmental Human Catchment and Best Potential Path to investigate the social and technological interactions between hunter-gatherer groups and identified HEP barriers which prevented the interactions. We have shown that the Solutrean population in western Europe adapted to different environmental conditions than the Epigravettian population in eastern Europe, as the contact between them was prevented by an HEP barrier. In the second part of the talk, two human dispersal models were presented. The first model simulates the large scale changes of human population density over time. Our main assumptions are that humans disperse in the direction of high HEP and the population growth and decay can be estimated by solving the population density conservation equation. Preliminary results of human dispersal of an initially arbitrary population distribution in Europe during the Last Glacial Maximum were shown. The second model, the Constraint Agent Based Model, simulates the movement of individual humans and estimates human mobility based on the statistical behavior of a large ensemble of individuals. In contrast to some existing ABMs, the movement of the individuals is influenced by random factors but constrained by a drift term which depends on the HEP. Processes such as reproduction, cooperation and conflicts are being included in the model (see Figure 14).

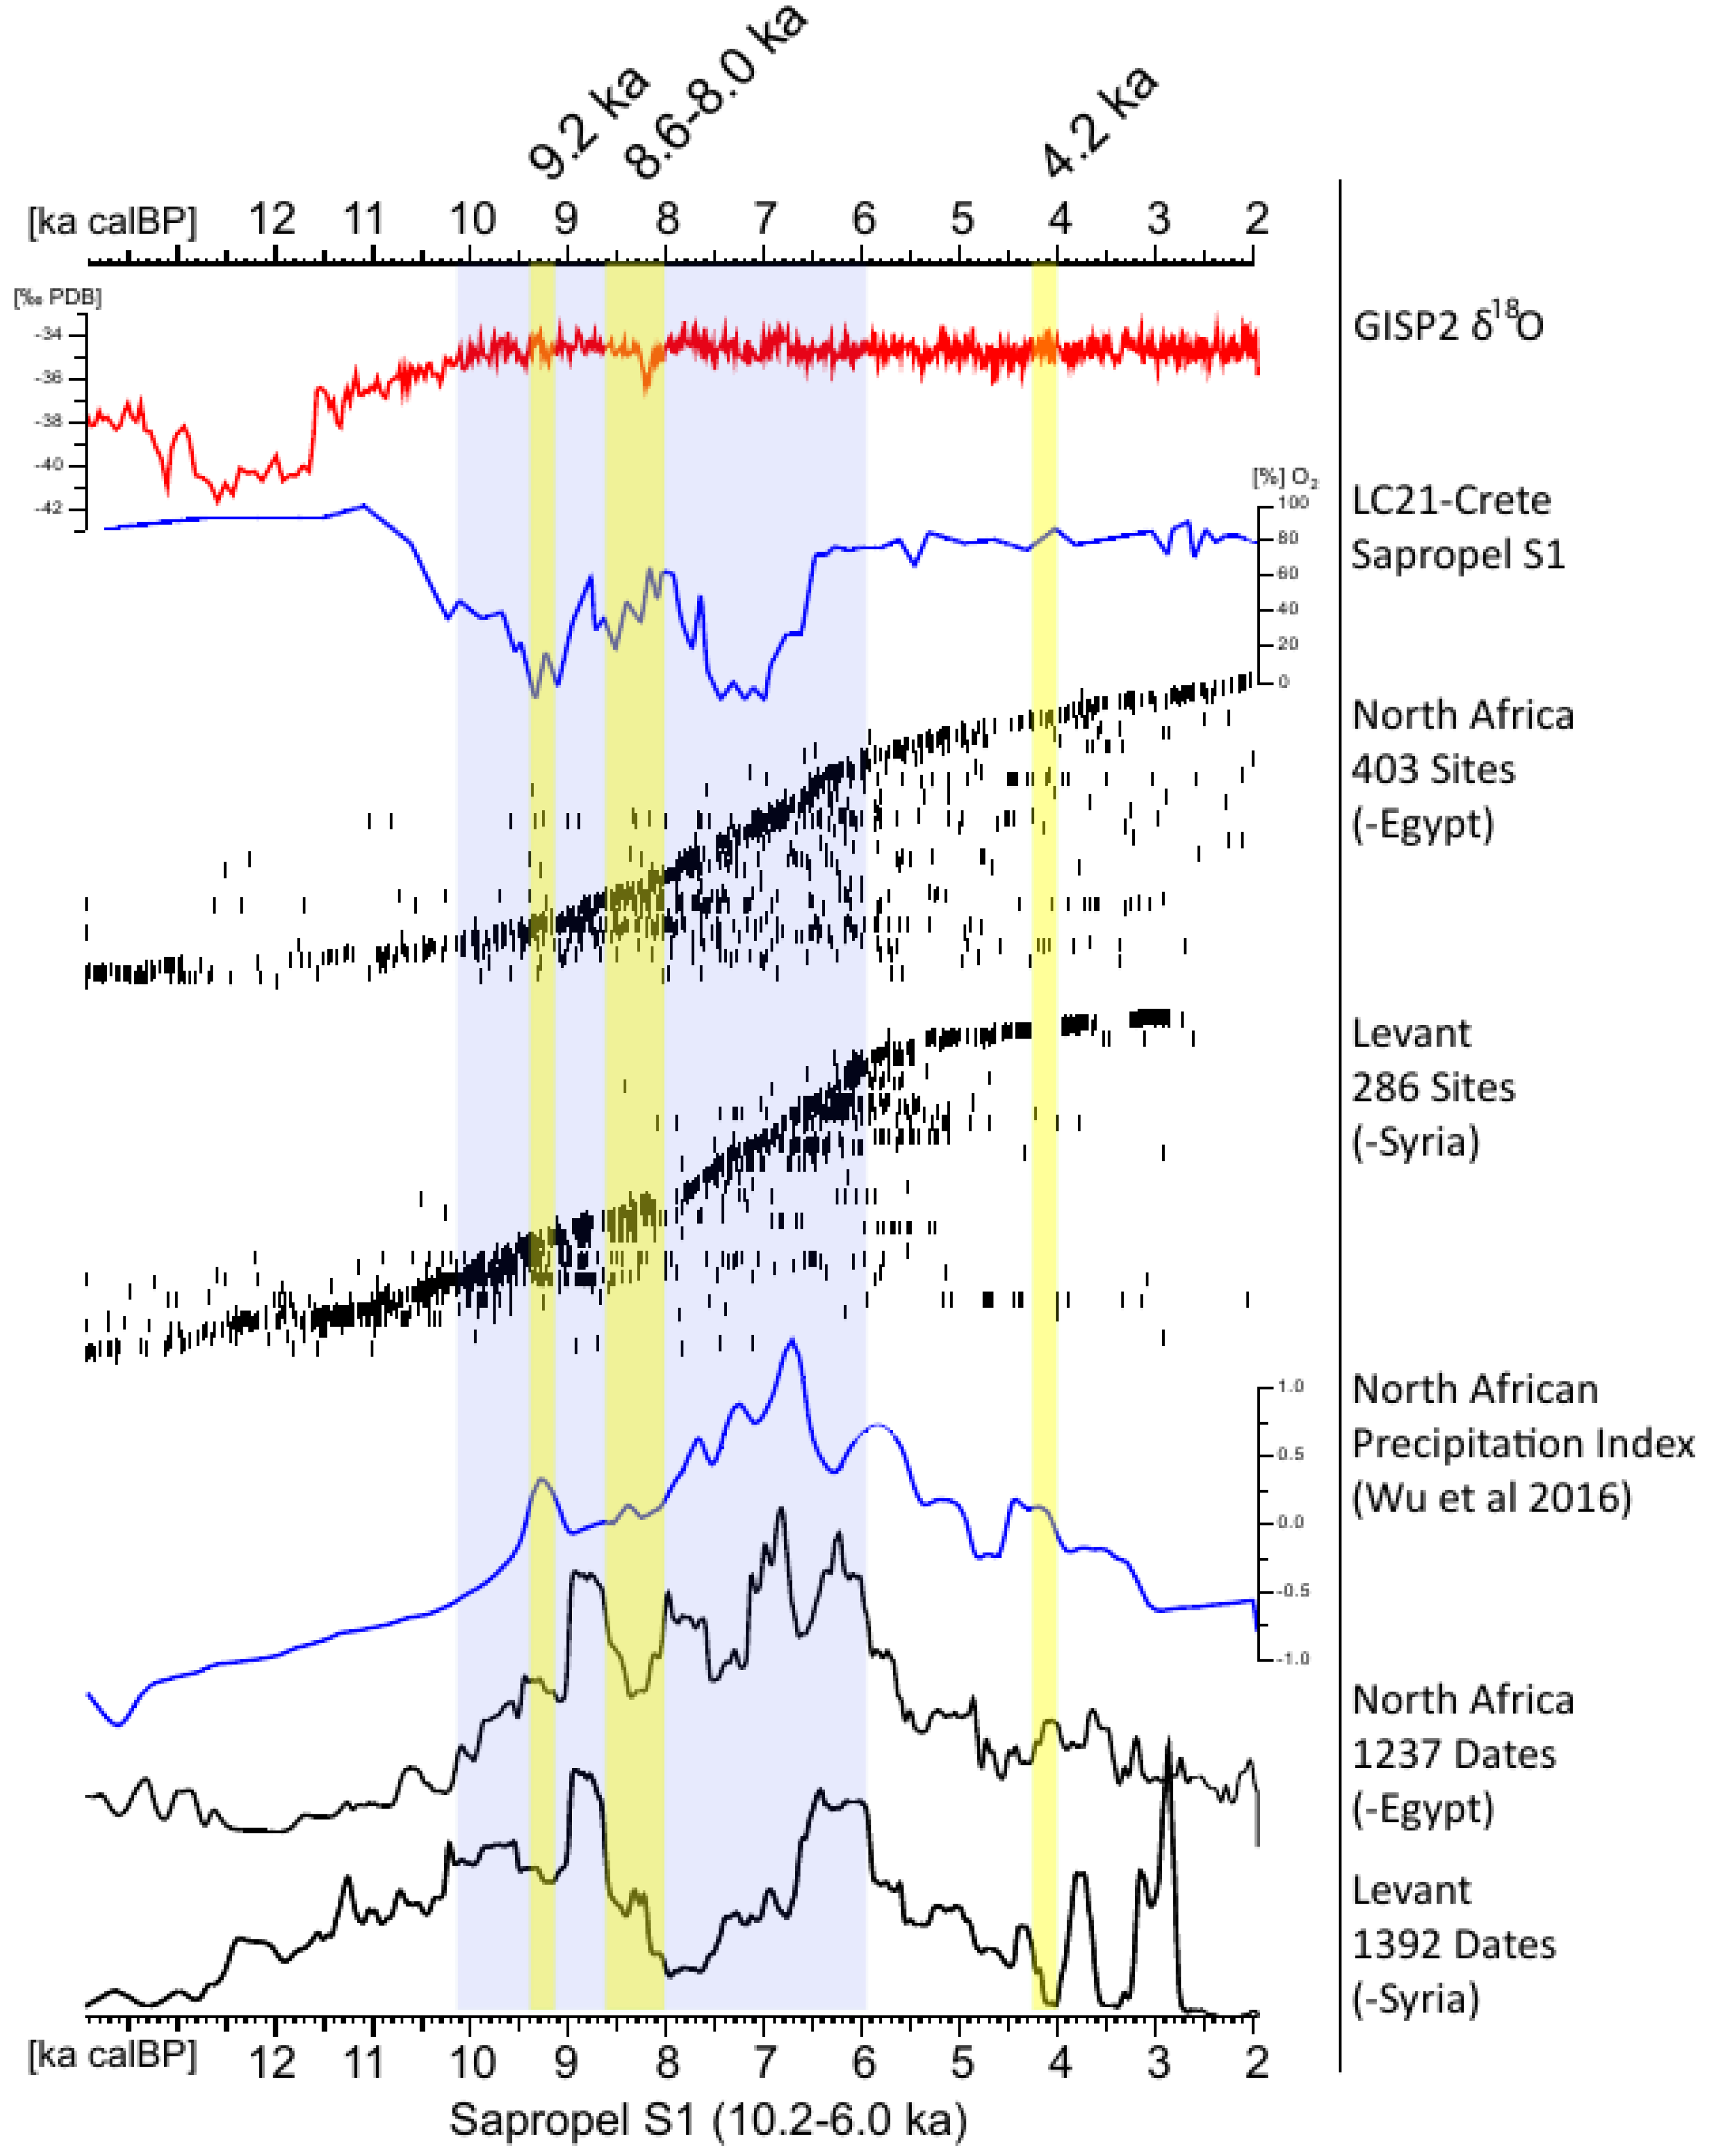
2.2.7. Auto-Amplification and Climatic Resonance as Major Drivers of the Abrupt Wild-Domestic-Transition (WDT) at 10.2 Ka Calbp in the Emed and Its Equivalent in the Wmed by Bernhard Weninger

In contemporary archeological research, the domestication of plants and animals in the Near East during the Early Holocene is alternatively interpreted as an overall slow and gradual, or else as rapid process. Both positions are supposedly supported by 14C-radiometric data, but which is of generally low quality. A recent chronological re-analysis [78] of the archeological, archeobotanical and archeozoological data confirmed that the wild-domestic-transition (WDT) was indeed initially slow (millennial scale), but terminated at 10.2 ± 0.2 ka calBP with an abrupt switch to herding and agriculture. Interestingly, the WDT is itself synchronous with an abrupt climatic switch to higher precipitation, as documented in marine and terrestrial climate records in the Mediterranean and adjacent regions (e.g., Levant, Iran). The WDT is immediately associated with the onset of Neolithic dispersal out of the Fertile Crescent into Central Anatolia, and from the Northern into the Southern Levant. From the viewpoint of Complex System Theory (Niche Construction, Punctuated Equilibrium), it appears possible to understand the rapidity of WDT as due to amplification with feedback (i.e., resonance) for a small number of causal factors, abbreviated: human agency tightly coupled with the genetic properties of domesticates and enhanced water availability. In the present paper, we compare the eMed (Neolithic) response to the precipitation increase at 10.2 ka calBP (Sapropel S1) with the response of contemporaneous Hunter-gatherer (Epipaleolithic) societies in the wMed (Iberian Peninsula (IP), North Africa, Saharan Regions). The method applied is large-scale combination of paleoclimate records with archeological 14C-data using the method of Barcode Seriation (see Figure 15).

2.2.8. Modeling Late Pleistocene Human Behaviour in the Western Mediterranean: Past and Future Perspectives by Trine Kellberg Nielsen

The IP is a particularly interesting region for the research of hunter-gatherer behaviour in Europe. There has been and continues to be a long discussion about the asynchronous patterns of human occupation and adaptation between the Northern and Southern regions of the IP. Studies such as [18,80] show that climate events impacted the lives of the hunter-gatherer societies of the Western Mediterranean, but oftentimes the exact nature of this influence and its effect on human mobility is not known. This is why, especially in the past few years, there has been an increase in the application of modeling approaches to the archeological data record of the IP, in order to describe in more detail the effects of climate change on human societies.
Especially HEs 4 to 1 seem to have impacted the human population histories on the IP, leading to bottlenecks and subsequent local and/or regional extinction events [81]. An example of this is the decrease in precipitation during HE 1 in the Southeast of the IP [80], which may have led to a local population breakdown [18]. Related to this approach—comparing models of climate history with settlement history—is the modeling of habitat suitability [82,83], which helps us to not only understand human dispersal and distribution, but also human adaptive flexibility and allows us to identify important climate parameters influencing human dispersal range.
Especially concerning Neanderthals, the IP has been in the focus of Paleolithic research for its possible role as a refugium. A particularly well-known discussion deals with the arrival time in the North and subsequent distribution to the South of the IP by the first Homo sapiens populations spreading in to the European Western Mediterranean. This debate, which has its roots in the “Ebro frontier” hypothesis [84], has recently resurfaced again by the controversial claim that early Homo sapiens with Aurignacian artifacts were already present at Bajondillo cave in the South of the IP already at around 45–43 ka BP [85], and see discussion in [86,87]. However, climate models combined with chronostratigraphic Bayesian modeling seems to confirm that Neanderthals disappeared between the cold periods of H5 and H4 [88,89].
On a more regional scale, the IP is the perfect test case to analyse human–environment interactions. Our research group has been working on linking archeological sites back to the landscape, which can tell us how the human groups interacted with the landscape as well as each other [18] (see Figure 16). This can then be connected to climate changes. Least Cost Path and Site Catchment analysis are two classical examples of this, employed to analyse human mobility and resource selection and how these may have changed throughout time [90,91]. Site pattern analysis can also tell us a lot about settlement histories of hunter-gatherers. Kernel Density Estimation and Ripley’s K analysis results allow us to identify settlement hubs; the distribution of these tells us which areas in the landscape were particularly suitable for human settlement, such as the Southern and Northern coastlines of the IP during the Last Glacial Maximum [18]. These analyses also allow the identification of settlement breakdowns, as we can see for Heinrich 1 in the Southeast of the IP. Using the site distribution as a basis for social network modeling, we can also discuss long-term stability of a society. Applying Wobst’s mating network model [92], we could see clear breakdowns of social networks in this same Southeastern Iberian region during HE 1. This breakdown was apparently so devastating that the human groups could not bounce back after the climate got better in Greenland Interstadial 1.
Ultimately, these models all rest on the quality of the input data. Data comes in many different forms and different scales, from the intra-site scale (assemblage data) to global climate models. Each of these data sources has their own set of biases which must be accounted for during modeling, e.g., the inherent problem of only having presence data for many archeological complexes, determined by preservation and research history. Therefore, we need to rigorously test our models against all different types of data and especially against new data appearing. modeling human–environment interaction is such an important aspect of archeological research, reflecting the more dynamic aspects of hunter-gatherer lifeways, that we must continue to critically assess and apply the multitude of different modeling approaches to archeological datasets.

3. Discussion, Conclusions, Future Directions

The thematically diverse set of talks, given by researchers from archeological, paleontological and geoscientific backgrounds, presented a wide spectrum of different approaches to create and re-use digital paleoenvironment reconstructions in the domain of human–environment modeling applications.
The talks of the first day dealt with approaches, methods and implementations to gather, collect, compile and create explicit paleoenvironmental models and datasets. The diversity in approaches and in how the resulting data and models are formalized or stored and published, showed how compilations such as the PaleoMaps idea can help to integrate these quite heterogeneous information and data into spatially explicit modeling applications. The diversity also showed how very interesting and hetereogenous paleoenvironmental information can be included in spatial archeological and paleontological modeling applications.
In the field of human–environment interaction modeling, like ABM or SDM for example, it is visible in the scientific record so far, that most applications depend on few published paleoclimate models. Mostly the well known climate model implementations, for the time slices Pre-Industrial, Mid-Holocene, and LGM of the (Paleo Model Intercomparison Project) PMIP 2 & 3 projects (i.e., CMIP/PMIP [4] and its derivates like WorldClim [5], ecoClimate [45] or PaleoClim [47]). PMIP 4 is currently under way and will add two additional time slices [93]. These models sometimes also apply additionally paleoenvironmental features like according sea levels or lake levels, but if it comes to the integration of granular site specific geoscientific paleoenvironment reconstructions from sediments and drill cores, in an explicit paleoenvironmental model, this is seen quite seldom in the published record. These latter kinds of reconstructions are mostly included implicitly, for evaluating explicit paleoclimate models, or for testing non-spatial hypotheses. An interesting example of a quite ambitious and comprehensive project to create explicit GIS data for Quaternary glaciation features, was the collection on “Quarternary Glaciations” [94] including very comprehensive freely available GIS data sets (https://0-booksite-elsevier-com.brum.beds.ac.uk/9780444534477/). Another very positive study in this direction is the Loessmap project [95]. This kind of research studies and approaches for creating GIS data sets and publishing them for reuse needs to be promoted and established more widely in the geoscientific, paleoenvironmental and archeological domains.
A further important point that was discussed at the workshop, was how to ensure reproducibility [96] of archeological models in the scientific record. Like many programs that are implemented in code, ABMs may be a “black box” where it is difficult to understand what happens during a simulation and in the code. Therefore good documentation is required to understand and to reproduce the code. The Overview, Design concepts, and Details protocol (ODD protocol) is such a standardized description of ABMs [97]. The questions of how the data of the paleoenvironment reconstructions are published, emerged in many of the talks and discussions. In this regard, many authors already try to publish the underlying data with its publications, but it is far from being the standard. Analyses made with R often have a role model character (e.g., [98,99,100]. During the closing discussion of the workshop, the implementation of Open Science paradigms to ensure reproducibility was emphasized. This particularly means the publication of data and code that was used or produced in a study. In general the principles of Open Science [101,102,103], like open access publication, open licenses and access for the underlying data and also an open peer review process, is the best way to go forward.
Each discipline concerning paleoenvironment reconstruction has very particular approaches to data formats and how to publish underlying data of scientific studies. For example, many scientists and working groups publish paleoenvironmental reconstructions and models in a scientific paper that describe the reasoning behind the modeling in prose, and some explicit mathematical formulation of some aspects of the model. If lucky, the code of the model will be published as supplement of the study. But what you will see rather seldom in this domain, is the publication of the modeled output itself or even more rare, a map in a digital geospatial (GIS) data format. In reality, to access these results and data, it is common to get in contact with the authors and ask for a copy or how to access this data. But the audience agreed that both major approaches (in the form of explicit and implicit spatial information) of including paleoenvironmental information into an archeo-paleontological modeling application are valid and useful depending on the methodological approach and design of the specific study. It was also clear, that the PaleoMaps idea should be developed further and implemented by producing more PaleoMaps. An open question for future development of the idea is, if a central infrastructure or a decentralized platform can be developed. There are very good arguments in favor of a centralized website hosting PaleoMaps datasets, but there are also very good arguments to keep it decentralized, meaning no central data repository. But a collaborative metadata collection, for example via Wikidata, by describing PaleoMaps datasets in Wikidata [104] could be a very promising way forward. This would provide a central data store for paleoenvironmental data for the application in forthcoming human–environment interaction studies. These data sets are favorably spatiotemporally as explicit as possible and thus would facilitate potential for re-usability.
In summary, the workshop was a success, many interesting topics were addressed and good discussions took place. The ideas and results presented and discussed in this report can contribute to improve the representation of paleoenvironmental models and data in archeological and human–environment interaction modeling applications.

Funding

The work for compiling and publishing this report and the workshop itself was funded by German Research Foundation (DFG) through the Collaborative Research Centre 806 (www.sfb806.de), Data Management and Data Services Project Z2 (DFG project number 57444011). B.S., S.B.G. and D.G. as members of the EPHA project were funded by the Collaborative Research Centre 1266 “Scales of Transformation— human–environmental interaction in prehistoric and archaic societies” of the German Research Foundation (DFG, DFG project number 2901391021-SFB 1266). The work of A.G. was funded by the FWF grant (P29371) to Hans Peter Comes (University of Salzburg).

Acknowledgments

Thanks are due to the Institute of Geography of the University of Cologne for providing the workshop location, and to the student research assistants Johanna Steiner and Alexander Hoffmann for helping with the organization and the logistics of facilitating the workshop.

Conflicts of Interest

The authors declare no conflict of interest. The funders had no role in the design of the study; in the collection, analyses, or interpretation of data; in the writing of the manuscript, or in the decision to publish the results.

References

  1. Bösken, J.; Obreht, I.; Zeeden, C.; Klasen, N.; Hambach, U.; Sümegi, P.; Lehmkuhl, F. High-resolution paleoclimatic proxy data from the MIS3/2 transition recorded in northeastern Hungarian loess. Quat. Int. 2019, 502, 95–107. [Google Scholar] [CrossRef]
  2. Foerster, V.; Junginger, A.; Langkamp, O.; Gebru, T.; Asrat, A.; Umer, M.; Lamb, H.F.; Wennrich, V.; Rethemeyer, J.; Nowaczyk, N.; et al. Climatic change recorded in the sediments of the Chew Bahir basin, southern Ethiopia, during the last 45,000 years. Quat. Int. 2012, 274, 25–37. [Google Scholar] [CrossRef]
  3. Obreht, I.; Zeeden, C.; Hambach, U.; Veres, D.; Marković, S.B.; Bösken, J.; Svirčev, Z.; Bačević, N.; Gavrilov, M.B.; Lehmkuhl, F. Tracing the influence of Mediterranean climate on Southeastern Europe during the past 350,000 years. Sci. Rep. 2016, 6, 36334. [Google Scholar] [CrossRef] [PubMed] [Green Version]
  4. Harrison, S.P.; Bartlein, P.J.; Izumi, K.; Li, G.; Annan, J.; Hargreaves, J.; Braconnot, P.; Kageyama, M. Evaluation of CMIP5 palaeo-simulations to improve climate projections. Nat. Clim. Chang. 2015, 5, 735–743. [Google Scholar] [CrossRef]
  5. Hijmans, R.J.; Cameron, S.E.; Parra, J.L.; Jones, P.G.; Jarvis, A. Very high resolution interpolated climate surfaces for global land areas. Int. J. Climatol. 2005, 25, 1965–1978. [Google Scholar] [CrossRef]
  6. Willmes, C.; Becker, D.; Verheul, J.; Yener, Y.; Zickel, M.; Bolten, A.; Bubenzer, O.; Bareth, G. PaleoMaps: SDI for open paleoenvironmental GIS data. Int. J. Spat. Data Infrastruct. Res. 2017, 12, 39–61. [Google Scholar] [CrossRef]
  7. Willmes, C.; Kürner, D.; Bareth, G. Building Research Data Management Infrastructure using Open Source Software. Trans. GIS 2014, 18, 496–509. [Google Scholar] [CrossRef]
  8. Willmes, C. CRC806-Database: A Semantic e-Science Infrastructure for an Interdisciplinary Research Centre. Ph.D. Thesis, University of Cologne, Cologne, Germany, 24 May 2016. [Google Scholar]
  9. Willmes, C.; Viehberg, F.; Esteban Lopez, S.; Bareth, G. CRC806-KB: A Semantic MediaWiki Based Collaborative Knowledge Base for an Interdisciplinary Research Project. Data 2018, 3, 44. [Google Scholar] [CrossRef] [Green Version]
  10. Richter, J.; Melles, M.; Schäbitz, F. Temporal and spatial corridors of Homo sapiens sapiens population dynamics during the Late Pleistocene and early Holocene. Quat. Int. 2012, 274, 1–4. [Google Scholar] [CrossRef]
  11. Davies, B.; Romanowska, I.; Harris, K.; Crabtree, S.A. Combining Geographic Information Systems and Agent-Based Models in Archaeology: Part 2 of 3. Adv. Archaeol. Pract. 2019, 7, 185–193. [Google Scholar] [CrossRef] [Green Version]
  12. Hölzchen, E.; Hertler, C.; Timm, I.; Lorig, F. Evaluation of Out of Africa hypotheses by means of agent-based modeling. Quat. Int. 2016, 413, 78–90. [Google Scholar] [CrossRef]
  13. Crooks, A.; Malleson, N.; Manley, E.; Heppenstall, A. Agent-Based Modelling and Geographical Information Systems: A Practical Primer; Spatial Analytics and GIS; SAGE Publications: Thousand Oaks, CA, USA, 2018. [Google Scholar]
  14. Elith, J.; Leathwick, J.R. Species Distribution Models: Ecological Explanation and Prediction Across Space and Time. Annu. Rev. Ecol. Evol. Syst. 2009, 40, 677–697. [Google Scholar] [CrossRef]
  15. Hao, T.; Elith, J.; Guillera-Arroita, G.; Lahoz-Monfort, J.J. A review of evidence about use and performance of species distribution modelling ensembles like BIOMOD. Divers. Distrib. 2019, 25, 839–852. [Google Scholar] [CrossRef]
  16. Becker, D.; Willmes, C.; Bareth, G.; Weniger, G.C. A plugin to interface openmodeller from qgis for species’ potential distribution modelling. ISPRS Ann. Photogramm. Remote Sens. Spat. Inf. Sci. 2016, III-7, 251–256. [Google Scholar] [CrossRef]
  17. Schmidt, I.; Zimmermann, A. Population dynamics and socio-spatial organization of the Aurignacian: Scalable quantitative demographic data for western and central Europe. PLoS ONE 2019, 14, e0211562. [Google Scholar] [CrossRef]
  18. Weniger, G.C.; de Andrés-Herrero, M.; Bolin, V.; Kehl, M.; Otto, T.; Potì, A.; Tafelmaier, Y. Late Glacial rapid climate change and human response in the Westernmost Mediterranean (Iberia and Morocco). PLoS ONE 2019, 14, e0225049. [Google Scholar] [CrossRef] [Green Version]
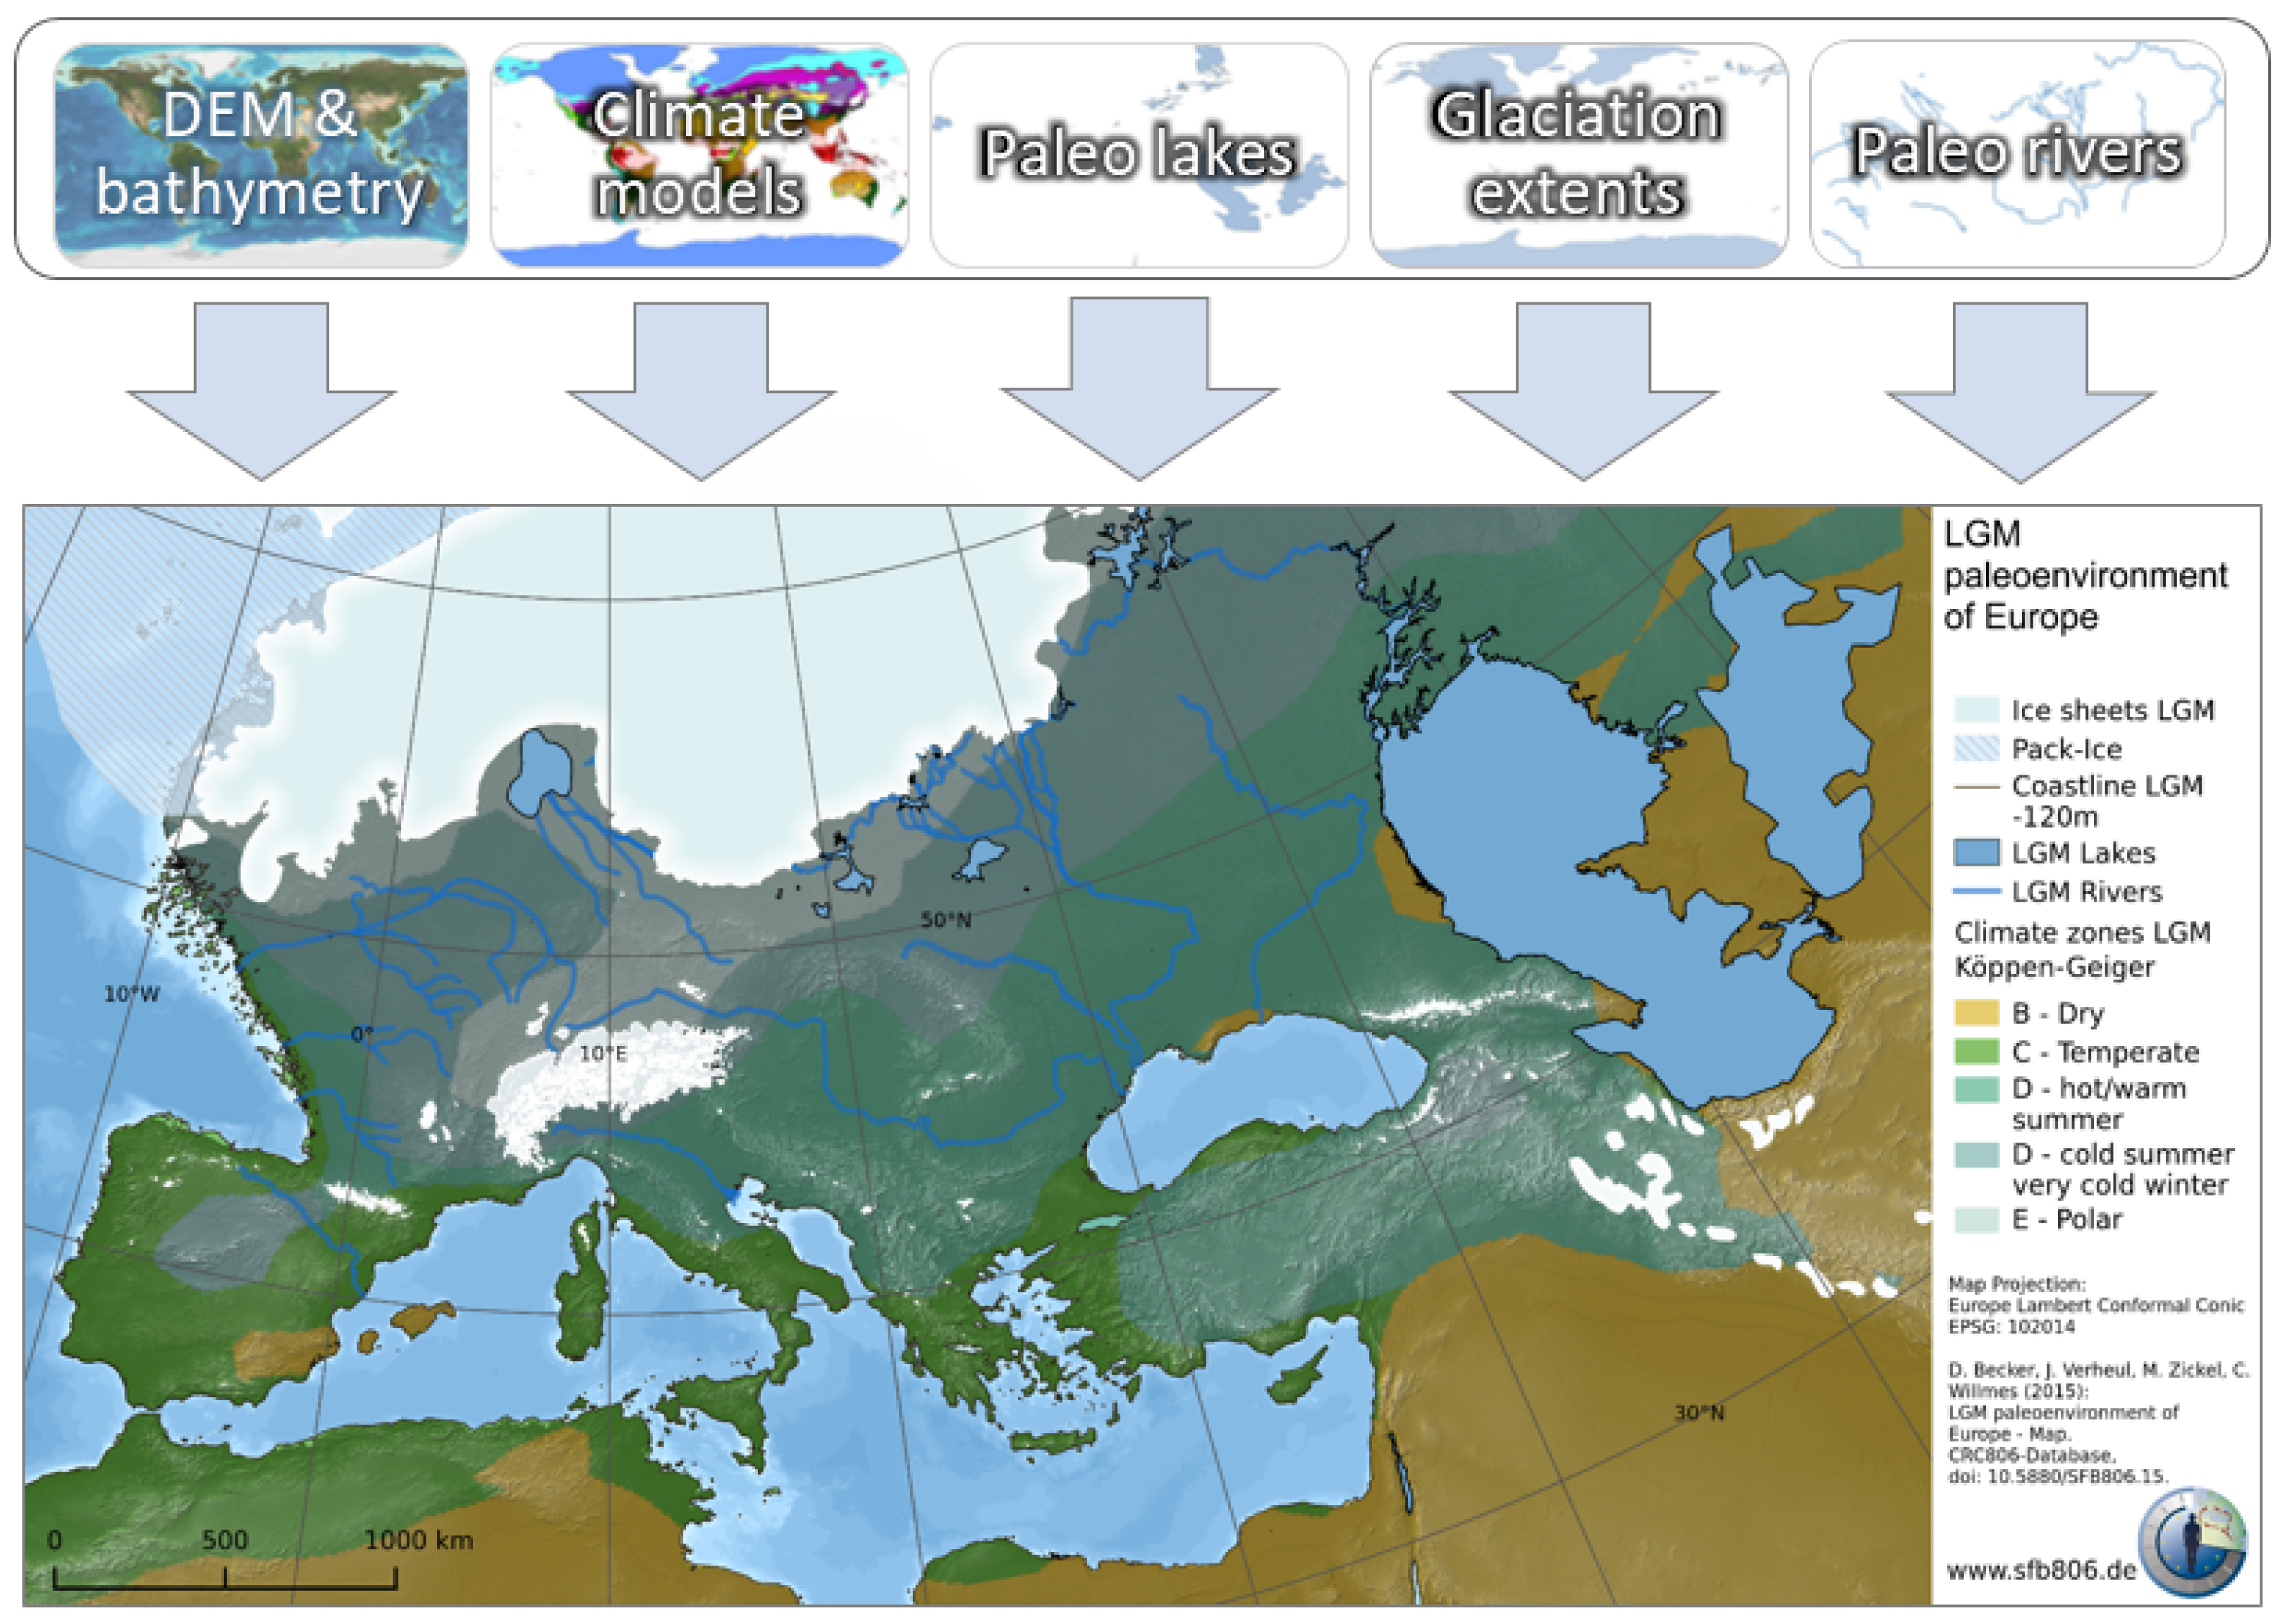
  19. Becker, D.; Verheul, J.; Zickel, M.; Willmes, C. LGM Paleoenvironment of Europe-Map; CRC806-Database: Köln, Germany, 2015. [Google Scholar] [CrossRef]
  20. Wheatley, D.; Gillings, M. Spatial Technology and Archaeology: The Archaeological Applications in GIS; CRC Press: London, UK; New York, NY, USA, 2005. [Google Scholar]
  21. Coles, B. Doggerland: A Speculative Survey. Proc. Prehist. Soc. 1998, 64, 45–81. [Google Scholar] [CrossRef]
  22. Björck, S. A review of the history of the Baltic Sea, 13.0–8.0 ka BP. Quat. Int. 1995, 27, 19–40. [Google Scholar] [CrossRef]
  23. Grimm, S.B. Maps of Late Glacial NW-Europe. 2007. Available online: http://web.rgzm.de/572.0.html (accessed on 19 September 2007).
  24. Grimm, S.B. Maps of Lateglacial NW-Europe. An Update. 2011. Available online: http://monrepos-rgzm.de/tl_files/monrepos/content/projektarchiv/ (accessed on 26 September 2014).
  25. Miebach, A.; Stolzenberger, S.; Wacker, L.; Hense, A.; Litt, T. A new Dead Sea pollen record reveals the last glacial paleoenvironment of the southern Levant. Quat. Sci. Rev. 2019, 214, 98–116. [Google Scholar] [CrossRef]
  26. Litt, T.; Ohlwein, C.; Neumann, F.H.; Hense, A.; Stein, M. Holocene climate variability in the Levant from the Dead Sea pollen record. Quat. Sci. Rev. 2012, 49, 95–105. [Google Scholar] [CrossRef]
  27. Stolzenberger, S. On the Probabilistic Evaluation of Decadal and Paleoclimate Model Predictions. Ph.D. Thesis, University of Bonn, Bonn, Germany, 12 July 2017. [Google Scholar]
  28. Thoma, B.M. Palaeoclimate Reconstruction in the Levant and on the Balkans. Ph.D. Thesis, University of Bonn, Bonn, Germany, 30 May 2017. [Google Scholar]
  29. Simonis, D.; Hense, A.; Litt, T. Reconstruction of late Glacial and Early Holocene near surface temperature anomalies in Europe and their statistical interpretation. Quat. Int. 2012, 274, 233–250. [Google Scholar] [CrossRef]
  30. Weitzel, N.; Hense, A.; Ohlwein, C. Combining a pollen and macrofossil synthesis with climate simulations for spatial reconstructions of European climate using Bayesian filtering. Clim. Past 2019, 15, 1275–1301. [Google Scholar] [CrossRef] [Green Version]
  31. Märker, M.; Kropáček, J.; Mussi, M.; Melis, R.; Schillaci, C.; Kropáček, J. Morphometric Terrain Analysis to explore present day Geohazards and Paleolandscape forms and features in the surroundings of the Melka Kunture prehistoric site, Upper Awash Valley, Central Ethiopia. AUC Geogr. 2018, 53, 10–19. [Google Scholar] [CrossRef] [Green Version]
  32. Vogel, S.; Märker, M.; Rellini, I.; Hoelzmann, P.; Wulf, S.; Robinson, M.; Steinhübel, L.; Maio, G.D.; Imperatore, C.; Kastenmeier, P.; et al. From a stratigraphic sequence to a landscape evolution model: Late Pleistocene and Holocene volcanism, soil formation and land use in the shade of Mount Vesuvius (Italy). Quat. Int. 2016, 394, 155–179. [Google Scholar] [CrossRef]
  33. Bachofer, F.; Quénéhervé, G.; Zwiener, T.; Maerker, M.; Hochschild, V. Comparative analysis of Edge Detection techniques for SAR images. Eur. J. Remote Sens. 2016, 49, 205–224. [Google Scholar] [CrossRef] [Green Version]
  34. Bachofer, F.; Quénéhervé, G.; Hochschild, V.; Maerker, M. Multisensoral Topsoil Mapping in the Semiarid Lake Manyara Region, Northern Tanzania. Remote Sens. 2015, 7, 9563–9586. [Google Scholar] [CrossRef] [Green Version]
  35. Bachofer, F.; Quénéhervé, G.; Märker, M.; Hochschild, V. Comparison of SVM and Boosted Regression Trees for the Delineation of Lacustrine Sediments using Multispectral ASTER Data and Topographic Indices in the Lake Manyara Basin. Photogramm. Fernerkund. Geoinf. 2015, 2015, 81–94. [Google Scholar] [CrossRef] [Green Version]
  36. Kropacek, J.; Schillaci, C.; Salvini, R.; Märker, M. Assessment of gully erosion in the Upper Awash, Central Ethiopian Highlands based on comparison of archived aerial photographs and very high resolution satellite images. Geogr. Fis. Din. Quat. 2016, 39, 161–170. [Google Scholar] [CrossRef]
  37. Maerker, M.; Quénéhervé, G.; Bachofer, F.; Mori, S. A simple DEM assessment procedure for gully system analysis in the Lake Manyara area, northern Tanzania. Nat. Hazards 2015, 79, 235–253. [Google Scholar] [CrossRef]
  38. Quénéhervé, G.; Bachofer, F.; Maerker, M. Experimental Assessment of Runoff Generation Processes on Hillslope Scale in a Semiarid Region in Northern Tanzania. Geogr. Fis. Din. Quat. 2015, 38, 55–66. [Google Scholar]
  39. Vogel, S.; Märker, M. Modeling the spatial distribution of AD 79 pumice fallout and pyroclastic density current and derived deposits of Somma-Vesuvius (Campania, Italy) integrating primary deposition and secondary redistribution. Bull. Volcanol. 2013, 75, 778. [Google Scholar] [CrossRef]
  40. Flores-Prieto, E.; Quénéhervé, G.; Bachofer, F.; Shahzad, F.; Maerker, M. Morphotectonic interpretation of the Makuyuni catchment in Northern Tanzania using DEM and SAR data. Geomorphology 2015, 248, 427–439. [Google Scholar] [CrossRef]
  41. Vogel, S.; Märker, M.; Esposito, D.; Seiler, F. The Ancient Rural Settlement Structure in the Hinterland of Pompeii Inferred from Spatial Analysis and Predictive Modeling of Villae Rusticae. Geoarchaeology 2016, 31, 121–139. [Google Scholar] [CrossRef]
  42. Maerker, M.; Schillaci, C.; Melis, R.T.; Kropáček, J.; Bosino, A.; Vilímek, V.; Hochschild, V.; Sommer, C.; Altamura, F.; Mussi, M. Geomorphological processes, forms and features in the surroundings of the Melka Kunture Palaeolithic site, Ethiopia. J. Maps 2019, 15, 797–806. [Google Scholar] [CrossRef] [Green Version]
  43. Henselowsky, F. Early Late Pleistocene Environments in Northeast Africa and Their Relevance for Anatomically Modern Human Dispersal. Ph.D. Thesis, Universität zu Köln, Köln, Germany, 12 July 2019. [Google Scholar]
  44. Karger, D.N.; Conrad, O.; Böhner, J.; Kawohl, T.; Kreft, H.; Soria-Auza, R.W.; Zimmermann, N.E.; Linder, H.P.; Kessler, M. Climatologies at high resolution for the earth’s land surface areas. Sci. Data 2017, 4, 170122. [Google Scholar] [CrossRef] [Green Version]
  45. Lima-Ribeiro, M.; Varela, S.; González-Hernández, J.; Oliveira, G.; Diniz-Filho, J.; Terribile, L. ecoClimate: A database of climate data from multiple models for past, present, and future for Macroecologists and Biogeographers. Biodivers. Inform. 2015, 10, 1–21. [Google Scholar] [CrossRef] [Green Version]
  46. Fordham, D.A.; Saltré, F.; Haythorne, S.; Wigley, T.M.L.; Otto-Bliesner, B.L.; Chan, K.C.; Brook, B.W. PaleoView: A tool for generating continuous climate projections spanning the last 21,000 years at regional and global scales. Ecography 2017, 40, 1348–1358. [Google Scholar] [CrossRef]
  47. Brown, J.L.; Hill, D.J.; Dolan, A.M.; Carnaval, A.C.; Haywood, A.M. PaleoClim, high spatial resolution paleoclimate surfaces for global land areas. Sci. Data 2018, 5, 180254. [Google Scholar] [CrossRef] [Green Version]
  48. Gamisch, A. Oscillayers: A dataset for the study of climatic oscillations over Plio-Pleistocene time-scales at high spatial-temporal resolution. Glob. Ecol. Biogeogr. 2019, 28, 1552–1560. [Google Scholar] [CrossRef] [Green Version]
  49. Lawing, A.M.; Polly, P.D. Pleistocene Climate, Phylogeny, and Climate Envelope Models: An Integrative Approach to Better Understand Species’ Response to Climate Change. PLoS ONE 2011, 6, e0028554. [Google Scholar] [CrossRef]
  50. Rodríguez, J.; Mateos, A. Carrying capacity, carnivoran richness and hominin survival in Europe. J. Hum. Evol. 2018, 118, 72–88. [Google Scholar] [CrossRef] [PubMed]
  51. Gamisch, A. Data from: Oscillayers: A Dataset for the Study of Climatic Oscillations over Plio-Pleistocene Time Scales at High Spatial-Temporal Resolution; Dataset; Dryad Digital Repository: Albuquerque, NM, USA, 2019. [Google Scholar] [CrossRef]
  52. MacAyeal, D.R. Binge/purge oscillations of the Laurentide Ice Sheet as a cause of the North Atlantic’s Heinrich events. Paleoceanography 1993, 8, 775–784. [Google Scholar] [CrossRef]
  53. Rodríguez, J. Stability in Pleistocene Mediterranean mammalian communities. Palaeogeogr. Palaeoclimatol. Palaeoecol. 2004, 207, 1–22. [Google Scholar] [CrossRef]
  54. Rodríguez, J. Structural continuity and multiple alternative stable States in Middle Pleistocene European mammalian communities. Palaeogeogr. Palaeoclimatol. Palaeoecol. 2006, 239, 355–373. [Google Scholar] [CrossRef]
  55. Kahlke, R.D.; García, N.; Kostopoulos, D.S.; Lacombat, F.; Lister, A.M.; Mazza, P.P.; Spassov, N.; Titov, V.V. Western Palaearctic palaeoenvironmental conditions during the Early and early Middle Pleistocene inferred from large mammal communities, and implications for hominin dispersal in Europe. Quat. Sci. Rev. 2011, 30, 1368–1395. [Google Scholar] [CrossRef]
  56. Raia, P.; Meloro, C.; Barbera, C. Inconstancy in predator/prey ratios in Quaternary large mammal communities of Italy, with an appraisal of mechanisms. Quat. Res. 2007, 67, 255–263. [Google Scholar] [CrossRef]
  57. Rodríguez, J.; Rodríguez-Gómez, G.; Martín-González, J.A.; Goikoetxea, I.; Mateos, A. Predator–prey relationships and the role of Homo in Early Pleistocene food webs in Southern Europe. Palaeogeogr. Palaeoclimatol. Palaeoecol. 2012, 365–366, 99–114. [Google Scholar] [CrossRef]
  58. Binford, L.R. Bones: Ancient Men and Modern Myths; Academic Press: New York, NY, USA, 1981. [Google Scholar]
  59. Binford, L.R. Human ancestors: Changing views of their behavior. J. Anthropol. Archaeol. 1985, 4, 292–327. [Google Scholar] [CrossRef]
  60. Marean, C.W. Sabertooth cats and their relevance for early hominid diet and evolution. J. Hum. Evol. 1989, 18, 559–582. [Google Scholar] [CrossRef]
  61. Speth, J.D. The Paleoanthropology and Archaeology of Big-Game Hunting; Springer: New York, NY, USA, 2010. [Google Scholar]
  62. McNaughton, S.J.; Oesterheld, M.; Frank, D.A.; Williams, K.J. Ecosystem-level patterns of primary productivity and herbivory in terrestrial habitats. Nature 1989, 341, 142–144. [Google Scholar] [CrossRef]
  63. Oesterheld, M.; Sala, O.E.; McNaughton, S.J. Effect of animal husbandry on herbivore-carrying capacity at a regional scale. Nature 1992, 356, 234–236. [Google Scholar] [CrossRef]
  64. Nemani, R.R.; Keeling, C.D.; Hashimoto, H.; Jolly, W.M.; Piper, S.C.; Tucker, C.J.; Myneni, R.B.; Running, S.W. Climate-Driven Increases in Global Terrestrial Net Primary Production from 1982 to 1999. Science 2003, 300, 1560–1563. [Google Scholar] [CrossRef] [Green Version]
  65. Rodríguez, J.; Blain, H.A.; Mateos, A.; Martín-González, J.; Cuenca-Bescós, G.; Rodríguez-Gómez, G. Ungulate carrying capacity in Pleistocene Mediterranean ecosystems: Evidence from the Atapuerca sites. Palaeogeogr. Palaeoclimatol. Palaeoecol. 2014, 393, 122–134. [Google Scholar] [CrossRef]
  66. Ankerst, M.; Breunig, M.M.; peter Kriegel, H.; Sander, J. OPTICS: Ordering Points To Identify the Clustering Structure; ACM Press: New York, NY, USA, 1999; pp. 49–60. [Google Scholar]
  67. Zimmermann, A.; Wendt, K.; Frank, T.; Hilpert, J. Landscape Archaeology in Central Europe. Proc. Prehist. Soc. 2009, 75, 1–53. [Google Scholar] [CrossRef]
  68. Schmidt, I.; Hilpert, J.; Kretschmer, I.; Peters, R.; Broich, M.; Schiesberg, S.; Vogels, O.; Wendt, K.; Zimmermann, A.; Maier, A. Approaching Prehistoric Demography: Proxies, Scales and Scopes of the Cologne Protocol in European contexts. Proc. R. Soc. B 2020. under review. [Google Scholar]
  69. Kretschmer, I. Demographische Untersuchungen zu Bevölkerungsdichten, Mobilität und Landnutzungsmustern im Späten Jungpaläolithikum. In Kölner Studien zur Prähistorischen Archäologie 6; Verlag Marie Leidorf: Rhaden, Germany, 2015; ISBN 978-3-86757-366-5. (In German) [Google Scholar]
  70. Kretschmer, I. Demographic studies of hunters and gatherers in the European Late Upper Palaeolithic. In The Final Palaeolithic of Northern Eurasia. Proceedings of the Amersfoort, Schleswig and Burgos UISPP Commission Meetings; Eriksen, B.V., Rensink, E., Harris, S., Eds.; Ludwig Verlag: Kiel, Germany, 2019; pp. 231–245. ISBN 978-3-86935-363-0. [Google Scholar]
  71. Maier, A.; Lehmkuhl, F.; Ludwig, P.; Melles, M.; Schmidt, I.; Shao, Y.; Zeeden, C.; Zimmermann, A. Demographic estimates of hunter–gatherers during the Last Glacial Maximum in Europe against the background of palaeoenvironmental data. Quat. Int. 2016, 425, 49–61. [Google Scholar] [CrossRef] [Green Version]
  72. Maier, A.; Zimmermann, A. Populations headed south? The Gravettian from a palaeodemographic point of view. Antiquity 2017, 91, 573–588. [Google Scholar] [CrossRef]
  73. Klein, K.; Wegener, C.; Schmidt, I.; Rostami, M.; Ludwig, P.; Ulbrich, S.; Weniger, G.C.; Shao, Y. Human Existence Potential in Europe during the Last Glacial Maximum. Quat. Int. 2020. under review. [Google Scholar]
  74. Banks, W.E. The application of ecological niche modeling methods to archaeological data in order to examine culture-environment relationships and cultural trajectories. Quaternaire 2017, 28, 271–276. [Google Scholar] [CrossRef] [Green Version]
  75. Müller, M. Coastlines and Large River Systems in Europe—Corridors of Communication during the Palaeolithic and Neolithic? Master’s Thesis, University of Cologne, Cologne, Germany, 8 October 2019. [Google Scholar]
  76. Holthausen, M. Distribution Modeling of Paleofauna in the Western Mediterranean between the Heinrich Events H5 and H4. Master’s Thesis, University of Cologne, Cologne, Germany, 24 Septemper 2018. [Google Scholar]
  77. Phillips, S.J.; Dudík, M.; Schapire, R.E. Maxent Software for Modeling Species Niches and Distributions (Version 3.4.1). 2019. Available online: http://biodiversityinformatics.amnh.org/open_source/maxent/ (accessed on 11 December 2019).
  78. Weninger, B. Niche construction and theory of agricultural origins. Case studies in punctuated equilibrium. Doc. Praehist. 2017, 44, 6–17. [Google Scholar] [CrossRef]
  79. Wu, J.; Liu, Z.; Stuut, J.; Zhao, Y.; Schirone, A.; de Lange, G. North-African paleodrainage discharges to the central Mediterranean during the last 18,000 years: A multiproxy characterization. Quat. Sci. Rev. 2017, 163, 95–113. [Google Scholar] [CrossRef]
  80. Ludwig, P.; Shao, Y.; Kehl, M.; Weniger, G.C. The Last Glacial Maximum and Heinrich event I on the Iberian Peninsula: A regional climate modelling study for understanding human settlement patterns. Glob. Planet. Chang. 2018, 170, 34–47. [Google Scholar] [CrossRef]
  81. Bradtmöller, M.; Pastoors, A.; Weninger, B.; Weniger, G.C. The Repeated Replacement Model—Rapid Climate Change and Population Dynamics in Upper Pleistocene Europe. Quat. Int. 2012, 247, 38–49. [Google Scholar] [CrossRef]
  82. Wren, C.D.; Burke, A. Habitat suitability and the genetic structure of human populations during the Last Glacial Maximum (LGM) in Western Europe. PLoS ONE 2019, 14, e0217996. [Google Scholar] [CrossRef] [Green Version]
  83. Benito, B.M.; Svenning, J.C.; Kellberg-Nielsen, T.; Riede, F.; Gil-Romera, G.; Mailund, T.; Kjaergaard, P.C.; Sandel, B.S. The ecological niche and distribution of Neanderthals during the Last Interglacial. J. Biogeogr. 2017, 44, 51–61. [Google Scholar] [CrossRef]
  84. Zilhão, J. The Ebro frontier: A model for the late extinction of Iberian Neanderthals. In Neandertals on the Edge: 150th Anniversary Conference of the Forbes’ Quarry discovery, Gibraltar; Stringer, C., Barton, R., Finlayson, C., Eds.; Oxbow Books: Oxford, UK, 2000; pp. 111–121. [Google Scholar]
  85. Cortés-Sánchez, M.; Jiménez-Espejo, F.J.; Simón-Vallejo, M.D.; Stringer, C.; Lozano Francisco, M.C.; García-Alix, A.; Vera Peláez, J.L.; Odriozola, C.P.; Riquelme-Cantal, J.A.; Parrilla Giráldez, R.; et al. An early Aurignacian arrival in southwestern Europe. Nat. Ecol. Evol. 2019, 3, 207–212. [Google Scholar] [CrossRef]
  86. de la Peña, P. Dating on its own cannot resolve hominin occupation patterns. Nat. Ecol. Evol. 2019, 3, 712. [Google Scholar] [CrossRef]
  87. Anderson, L.; Reynolds, N.; Teyssandier, N. No reliable evidence for a very early Aurignacian in Southern Iberia. Nat. Ecol. Evol. 2019, 3, 713. [Google Scholar] [CrossRef]
  88. Staubwasser, M.; Drăgusin, V.; Onac, B.P.; Assonov, S.; Ersek, V.; Hoffmann, D.L.; Veres, D. Impact of climate change on the transition of Neanderthals to modern humans in Europe. Proc. Natl. Acad. Sci. USA 2018, 115, 9116–9121. [Google Scholar] [CrossRef] [Green Version]
  89. Higham, T.; Douka, K.; Wood, R.; Ramsey, C.B.; Brock, F.; Basell, L.; Camps, M.; Arrizabalaga, A.; Baena, J.; Barroso-Ruíz, C.; et al. The timing and spatiotemporal patterning of Neanderthal disappearance. Nature 2014, 512, 306–309. [Google Scholar] [CrossRef]
  90. de Andrés Herrero, M.; Becker, D.; Weniger, G.C. Reconstruction of LGM faunal patterns using Species Distribution Modelling. The archaeological record of the Solutrean in Iberia. Quat. Int. 2018, 485, 199–208. [Google Scholar] [CrossRef]
  91. de Andrés Herrero, M. Site Catchment Analysis in the Upper Palaeolithic in the Iberian Peninsula. Ph.D. Thesis, University of Cologne, Cologne, Germany, 29 May 2019. [Google Scholar]
  92. Wobst, H.M. Boundary Conditions for Paleolithic Social Systems. A Simulation Approach. Am. Antiq. 1974, 39, 147–178. [Google Scholar] [CrossRef]
  93. Kageyama, M.; Braconnot, P.; Harrison, S.P.; Haywood, A.M.; Jungclaus, J.H.; Otto-Bliesner, B.L.; Peterschmitt, J.Y.; Abe-Ouchi, A.; Albani, S.; Bartlein, P.J.; et al. The PMIP4 contribution to CMIP6–Part 1: Overview and over-arching analysis plan. Geosci. Model Dev. 2018, 11, 1033–1057. [Google Scholar] [CrossRef]
  94. Ehlers, J.; Gibbard, P.; Hughes, P. Quaternary Glaciations—Extent and Chronology. In Developments in Quaternary Science; Elsevier: Amsterdam, The Netherlands, 2011; Volume 15. [Google Scholar]
  95. Lehmkuhl, F.; Bösken, J.; Hošek, J.; Sprafke, T.; Marković, S.B.; Obreht, I.; Hambach, U.; Sümegi, P.; Thiemann, A.; Steffens, S.; et al. Loess distribution and related Quaternary sediments in the Carpathian Basin. J. Maps 2018, 14, 661–670. [Google Scholar] [CrossRef] [Green Version]
  96. Peng, R.D. Reproducible Research in Computational Science. Science 2011, 334, 1226–1227. [Google Scholar] [CrossRef] [Green Version]
  97. Grimm, V.; Berger, U.; DeAngelis, D.L.; Polhill, J.G.; Giske, J.; Railsback, S.F. The ODD protocol: A review and first update. Ecol. Model. 2010, 221, 2760–2768. [Google Scholar] [CrossRef] [Green Version]
  98. Hamer, W.; Knitter, D. FuzzyLandscapes—Fuzzy Analyses with a Focus on Raster Data; Zenodo: Genève, Switzerland, 2018. [Google Scholar] [CrossRef]
  99. Marwick, B. How To Do Archaeological Science Using R. 2017. Available online: https://benmarwick.github.io/How-To-Do-Archaeological-Science-Using-R/ (accessed on 27 April 2020).
  100. Nakoinz, O.; Knitter, D. Modelling Human Behaviour in Landscapes. Basic Concepts and Modelling Elements; Quantitative Archaeology and Archaeological Modelling; Springer: Berlin/Heidelberg, Germany, 2016. [Google Scholar]
  101. Brinckman, A.; Chard, K.; Gaffney, N.; Hategan, M.; Jones, M.B.; Kowalik, K.; Kulasekaran, S.; Ludäscher, B.; Mecum, B.D.; Nabrzyski, J.; et al. Computing environments for reproducibility: Capturing the “Whole Tale”. Future Gener. Comput. Syst. 2019, 94, 854–867. [Google Scholar] [CrossRef]
  102. Groves, T.; Godlee, F. Open science and reproducible research. BMJ 2012, 344, e4383. [Google Scholar] [CrossRef] [Green Version]
  103. Molloy, J.C. The Open Knowledge Foundation: Open Data Means Better Science. PLoS Biol. 2011, 9, e1001195. [Google Scholar] [CrossRef]
  104. Vrandecic, D. Describing Datasets in Wikidata. 2019. AKTS Workshop at eScience Conference 2019. Available online: https://ai.google/research/pubs/pub48587 (accessed on 24 April 2020).
Figure 1. The program of the PaleoMaps Workshop, available online https://crc806db.uni-koeln.de/paleomaps/program/.
Quaternary 03 00013 g001
Figure 2. A PaleoMap is a geographic information system (GIS) based model of a paleoenvironment reconstruction, consisting of several data sources, for example a paleo digital elevation model (DEM), a paleo climate model, a paleo hydrology model, and glaciation extends. Example PaleoMap-LGM Paleoenvironment of Europe [19].
Quaternary 03 00013 g002
Figure 3. Research locations associated with the three case studies mentioned in the text: 1—Central Pomerania (Wierzchowo Lake micro-region); 2—Eastern Pomerania; 3—The Białowieża Forest.
Quaternary 03 00013 g003
Figure 4. One of the prerendered maps (Younger Dryas) as provided by the European Prehistoric and Historic Atlas (EPHA)-project (www.epha.zbsa.eu).
Quaternary 03 00013 g004
Figure 5. The described methods of the Collaborative Research Centre (CRC) 806 B3 project provide spatial and diachronic reconstructions of climate and vegetation in the past. Here we show examples of the three methods: (I) Probable biome distribution in the Eastern Mediterranean region during Marine Isotope Stage 3. Modeled probabilities for each biome (color range) differ from today’s biome distribution (grey grids). Modified after [25]. (II) Diachronic climate reconstruction (winter temperature and annual precipitation) based on fossil pollen data from a Holocene sediment core from the Dead Sea. Marginal probability density of reconstruction (color range) with interdecile range (outer full lines), interquartile range (hatched area), mode (black line), expectation value (thick white line), and partial linear trends (thin white lines). Reprinted from [26] with permission from Elsevier. (III) Difference between assimilated temperatures (using paleo proxy data combined with paleo climate model simulations from the PMIP3 ensemble) and the PMIP3 multi-model mean, for winter temperatures during the Mid-Holocene. Modified after [27].
Quaternary 03 00013 g005
Figure 6. Pre-79 AD environmental reconstruction of the Sarno River plain, Campania, Italy according to [41].
Quaternary 03 00013 g006
Figure 7. Synthesis of spatial scales based on geomorphological relief units and their link to human behavior as classification in geomorphometric analysis in Paleo-GIS Applications, source [43].
Quaternary 03 00013 g007
Figure 8. Example layer (Bio1; the first out of 539 time points) of the Oscillayers paleo-bioclim dataset (Bio1–Bio19) spanning the Plio-Pleistocene (the last 5.4 Myr) in steps of 10 kyr plotted in GoogleEarth.
Quaternary 03 00013 g008
Figure 9. Estimation of the human existence potential (HEP) of the cold stadials during the Aurignacian technocomplex. Excavation sites are presented as white squares.
Quaternary 03 00013 g009
Figure 10. Example of the estimation of ungulate carrying capacity (Ungulate CC) in southern Europe for the period 1.6–1.07 Ma. from interpolated maps of annual rainfall (Annual P) and mean anual temperature.
Quaternary 03 00013 g010
Figure 11. Hierarchical scale model of the Cologne Protocol for the estimation of population densities during the Upper Paleolithic in Europe (left, after [70]), and a map on central Europe, with Core Areas (red lines), Extended Areas (dotted lines), and the Total Area of Calculation (dashed line) for a case study of the early Upper Paleolithic (right, after [17]).
Quaternary 03 00013 g011
Figure 12. Agent-based models (ABMs) that integrate GIS maps as agent-based modeling environment with which the agents interact. Shown are example visualizations of a continental-scale model (left) and a regional scale model (right).
Quaternary 03 00013 g012
Figure 13. Exemplary result maps for the species Equus caballus for the methods Bioclim, GLM and Maxent, and the time slices H4, GI11 and H5. Green areas indicate a presence or suitable area and gray indicates a predicted absence of the species. Source: [76].
Quaternary 03 00013 g013
Figure 14. Overview and description of the components of our modeling framework.
Quaternary 03 00013 g014
Figure 15. Comparison of Epipaleolithic and Neolithic (14C-based) Demography between the Levante (without Syria) and North Africa (without Egypt). The results of Barcode Seriation are compared with Summed Calibrated Probability Distributions of the same data. Interpretation: (1) in both regions, the demographic development is strongly dependent on water availability; (2) Neolithic (farming) demography is more sensitive to climatic extremes (RCC = rapid climate change) than Epipaleolithic (hunting/gathering). (North African Precipitation Index data from [79]).
Quaternary 03 00013 g015
Figure 16. Archaeological sites with Solutrean, Magdalenian, or Iberomaurusian occupation layers on an ombrotype map of the Worldwide Bioclimatic Classification System (1996–2015) for Iberia (original scale 1:1 Mio.) and Africa (original scale 1:25 Mio.). Source: [18].
Quaternary 03 00013 g016

