
Lake Sedimentary DNA Research on Past Terrestrial and Aquatic Biodiversity: Overview and Recommendations

 , , ,
, , ,  , ,
, ,  , , , , , ,
  , , , ,
  , , , , , , and add
Show full author list
, , , , , , and add
Show full author list
Abstract
:1. Tracking Past Ecological Changes from Lakes and Catchments with Sedimentary DNA
1.1. Sedimentary DNA, a Powerful Proxy to Track Past Biodiversity Changes
1.2. sedaDNA to Study Past Vegetation Changes from Lake Catchment
1.3. sedaDNA to Detect Human and Animal Presence in the Lake Catchment
1.4. sedaDNA to Unravel Past Diversity and Composition of Lake Biota
1.5. Influence of Taphonomic Processes on the Burial and Persistence of sedaDNA
2. To What Degree does the sedaDNA Signal Represent Past Communities?
2.1. sedaDNA Data Compared to Historical, Archaeological and Monitoring Data
2.2. sedaDNA Data Compared to Other Sediment Proxies
2.3. Dead or Alive: What Makes Up the sedaDNA Pool?
3. State of the Art Lake sedaDNA Analyses
3.1. Criteria for the Selection of Lakes
3.2. Number of Sediment Cores to Collect for sedaDNA
3.3. Storage of Sediment Cores Prior to DNA Analysis
3.4. Number of Analytical Replicates to Perform for sedaDNA Research
3.5. Tracing Contamination of sedaDNA Samples
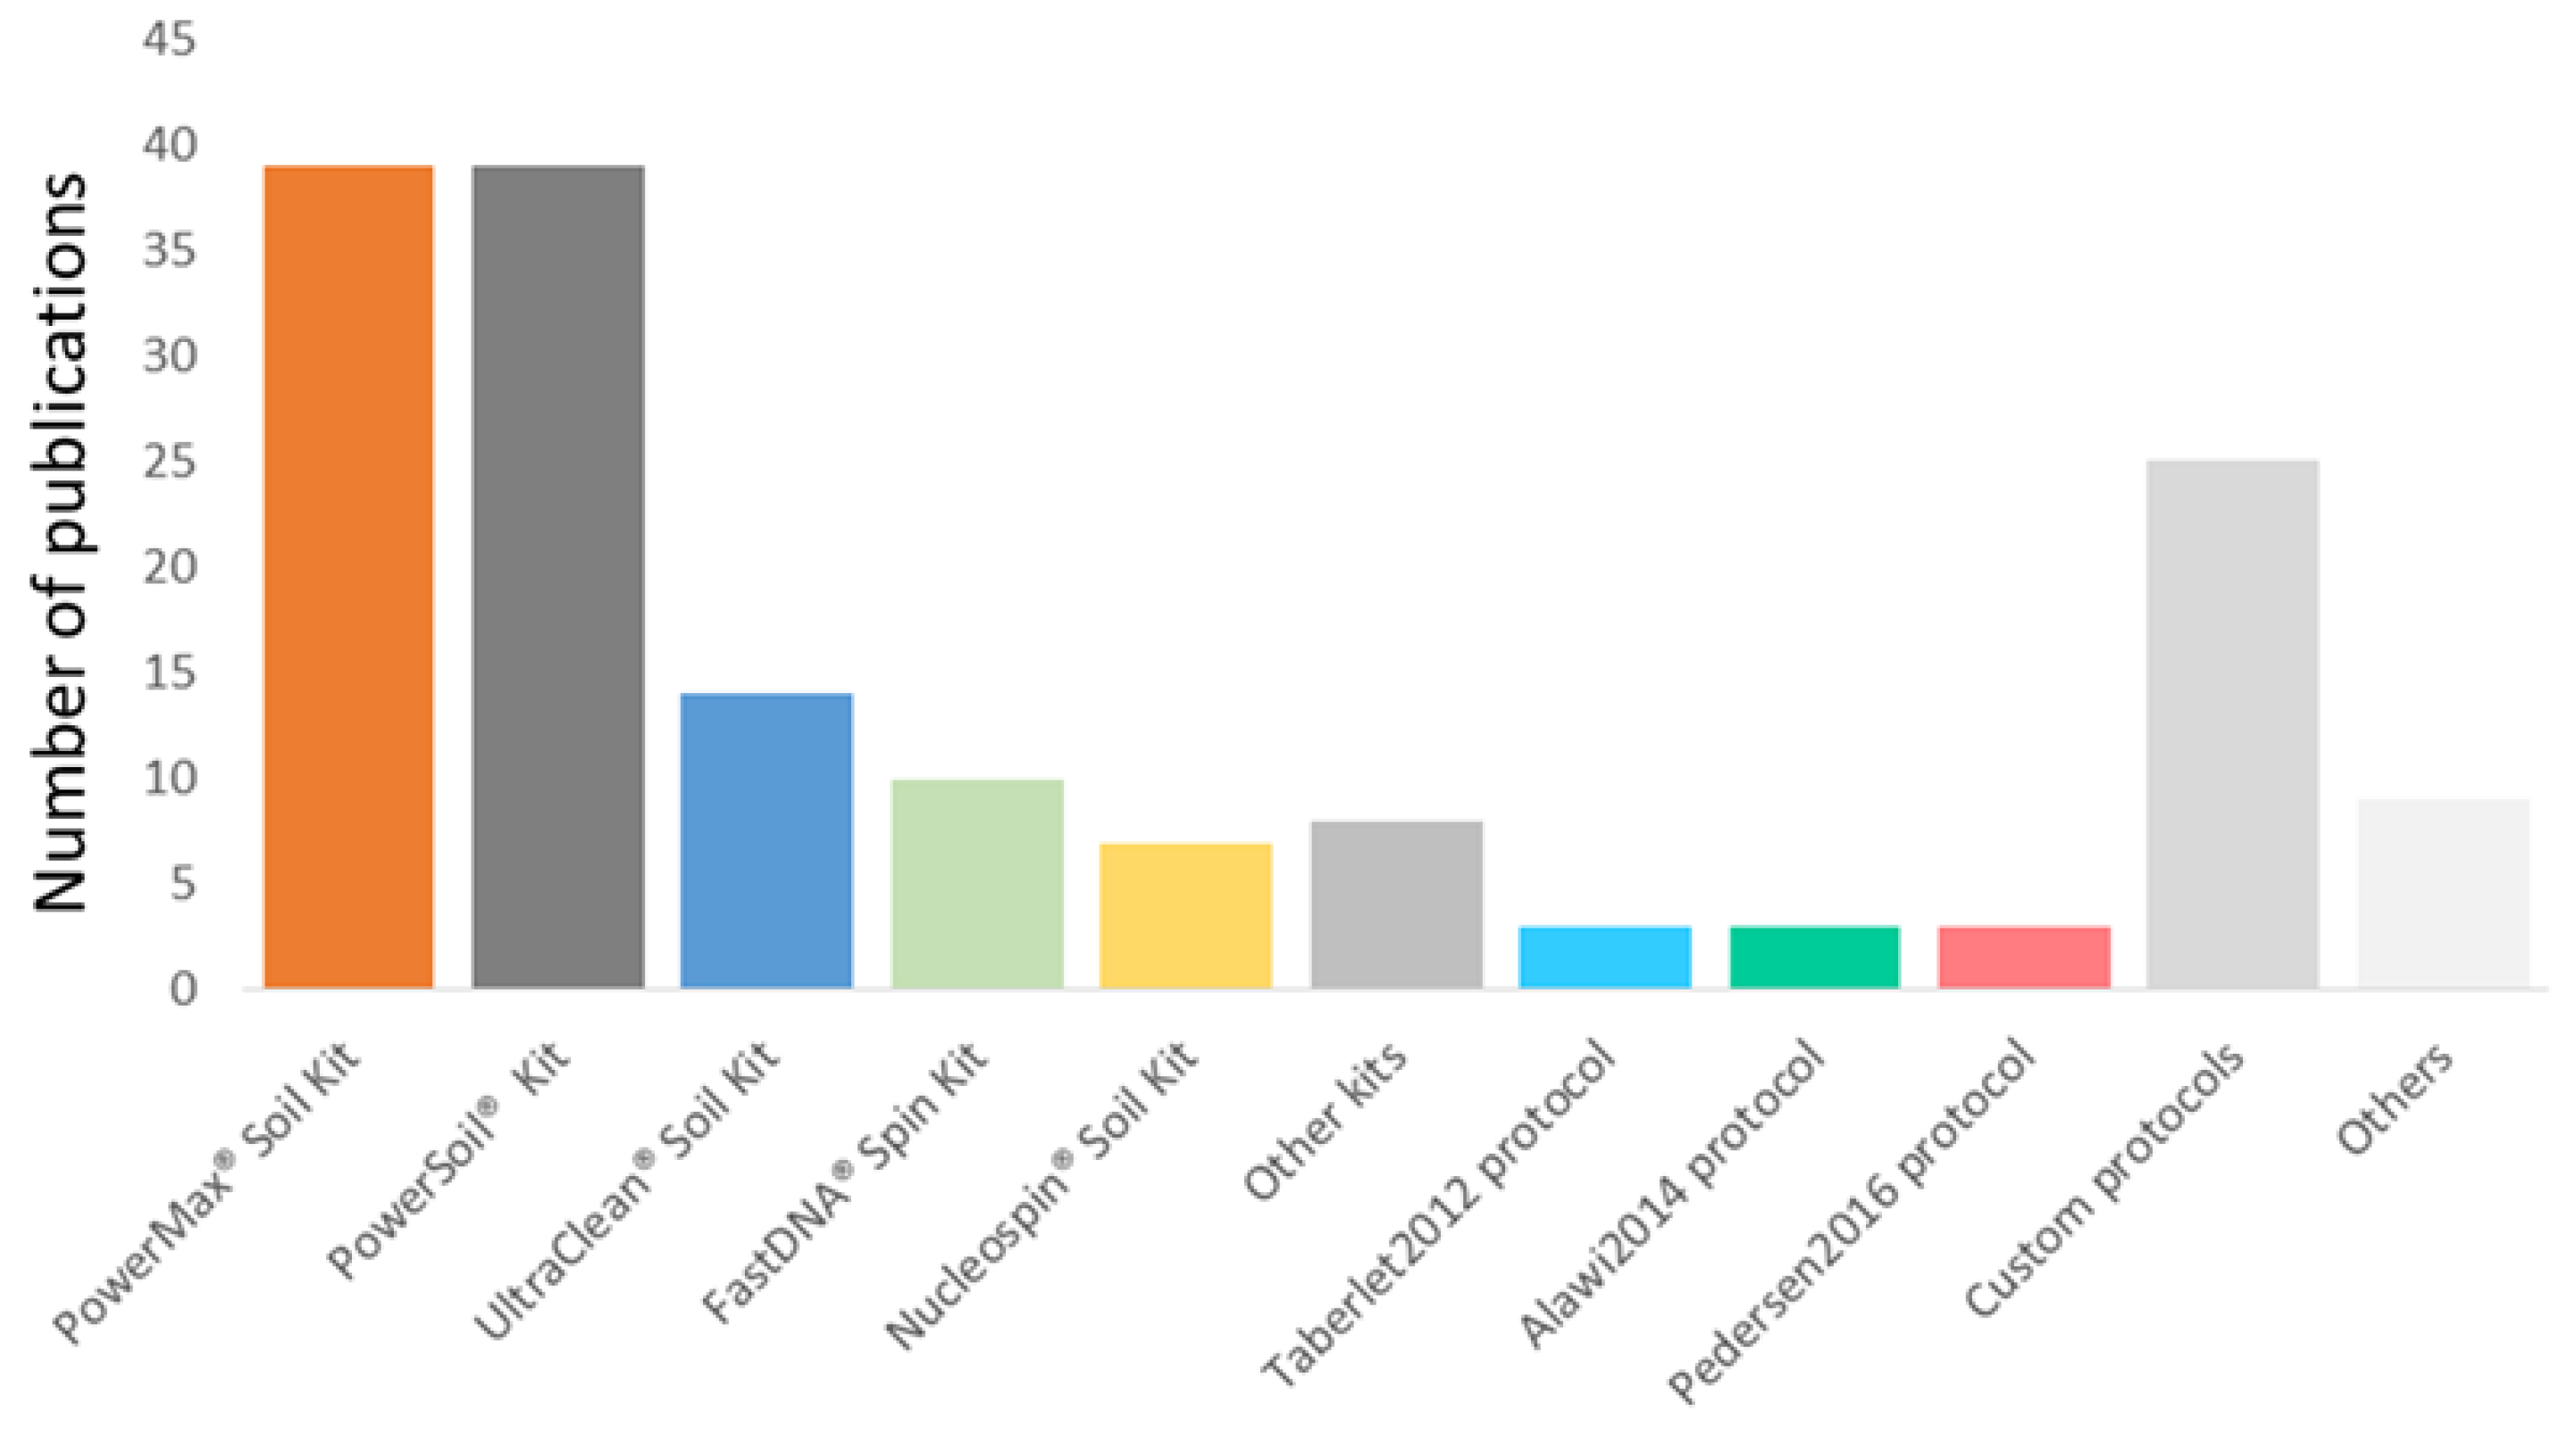
3.6. DNA Extraction Methods for sedaDNA Research
3.7. Sediment Amount to Use for DNA Extraction
3.8. Molecular Methods for Generating sedaDNA Data
3.9. DNA Markers and Reference Databases Used in Current sedaDNA Research
3.10. Bioinformatic Filtering and Analysis of sedaDNA Data
4. Recommendations
Supplementary Materials
Author Contributions
Funding
Data Availability Statement
Acknowledgments
Conflicts of Interest
Appendix A
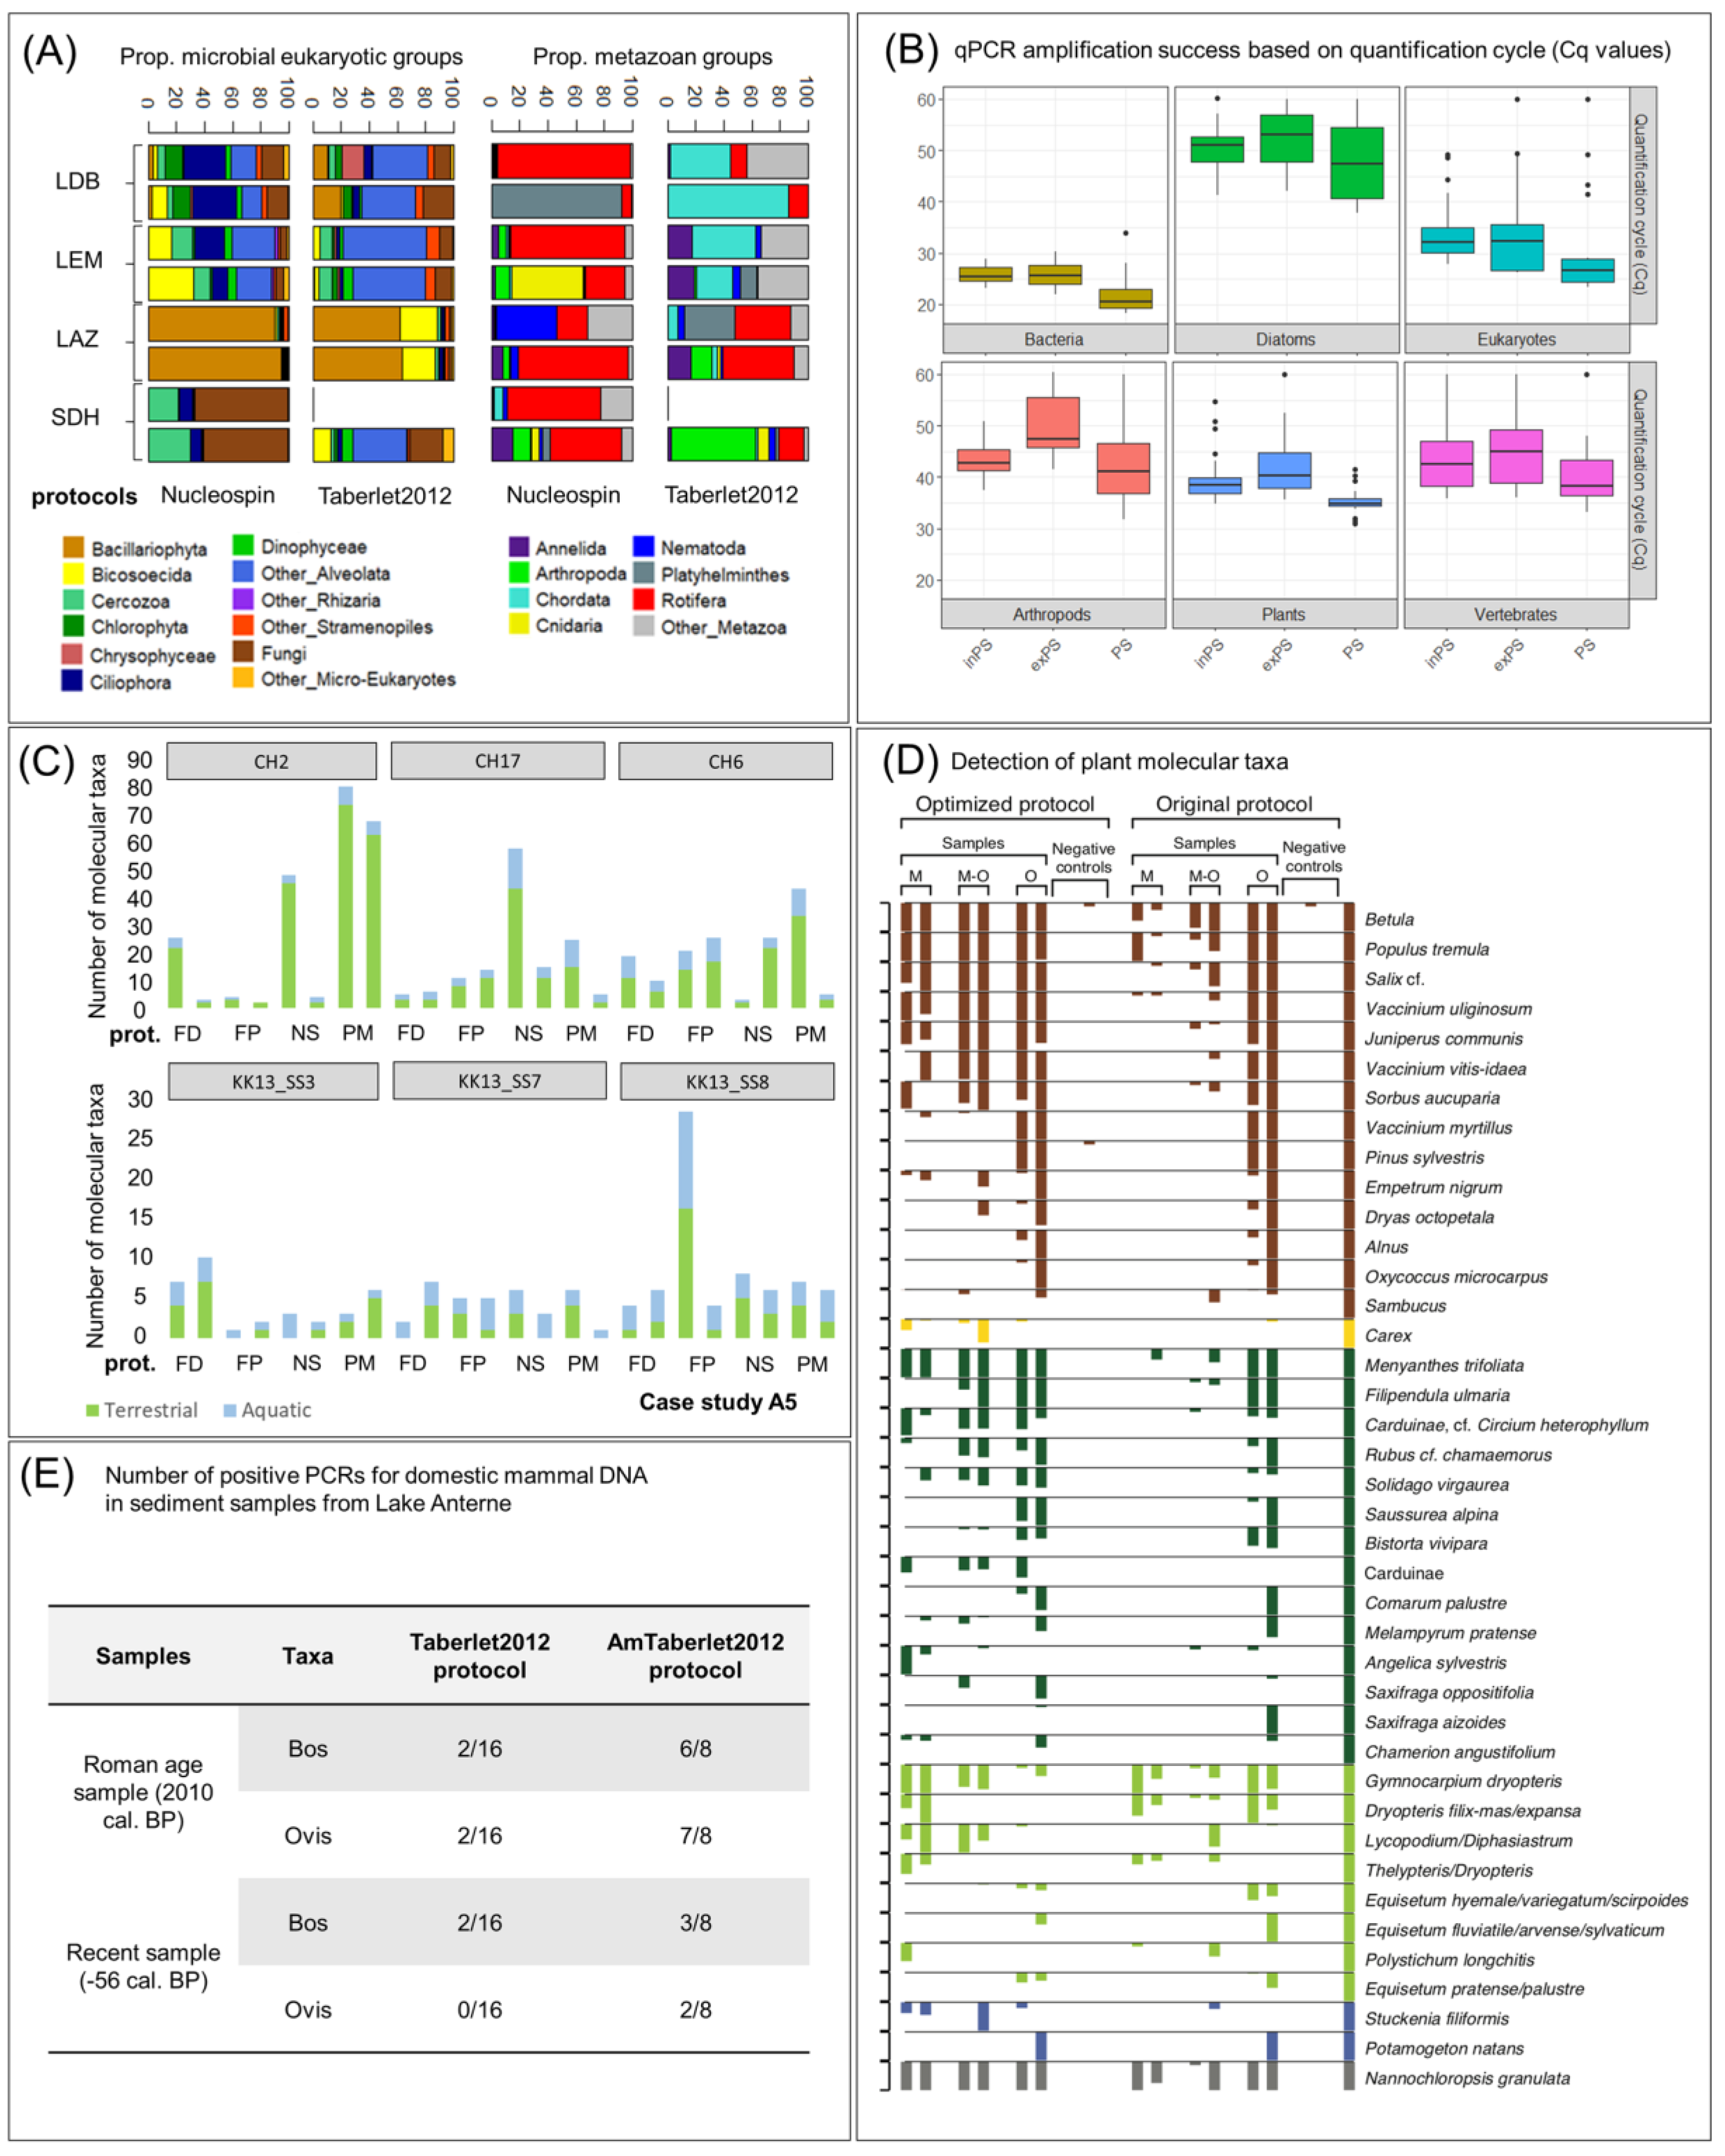
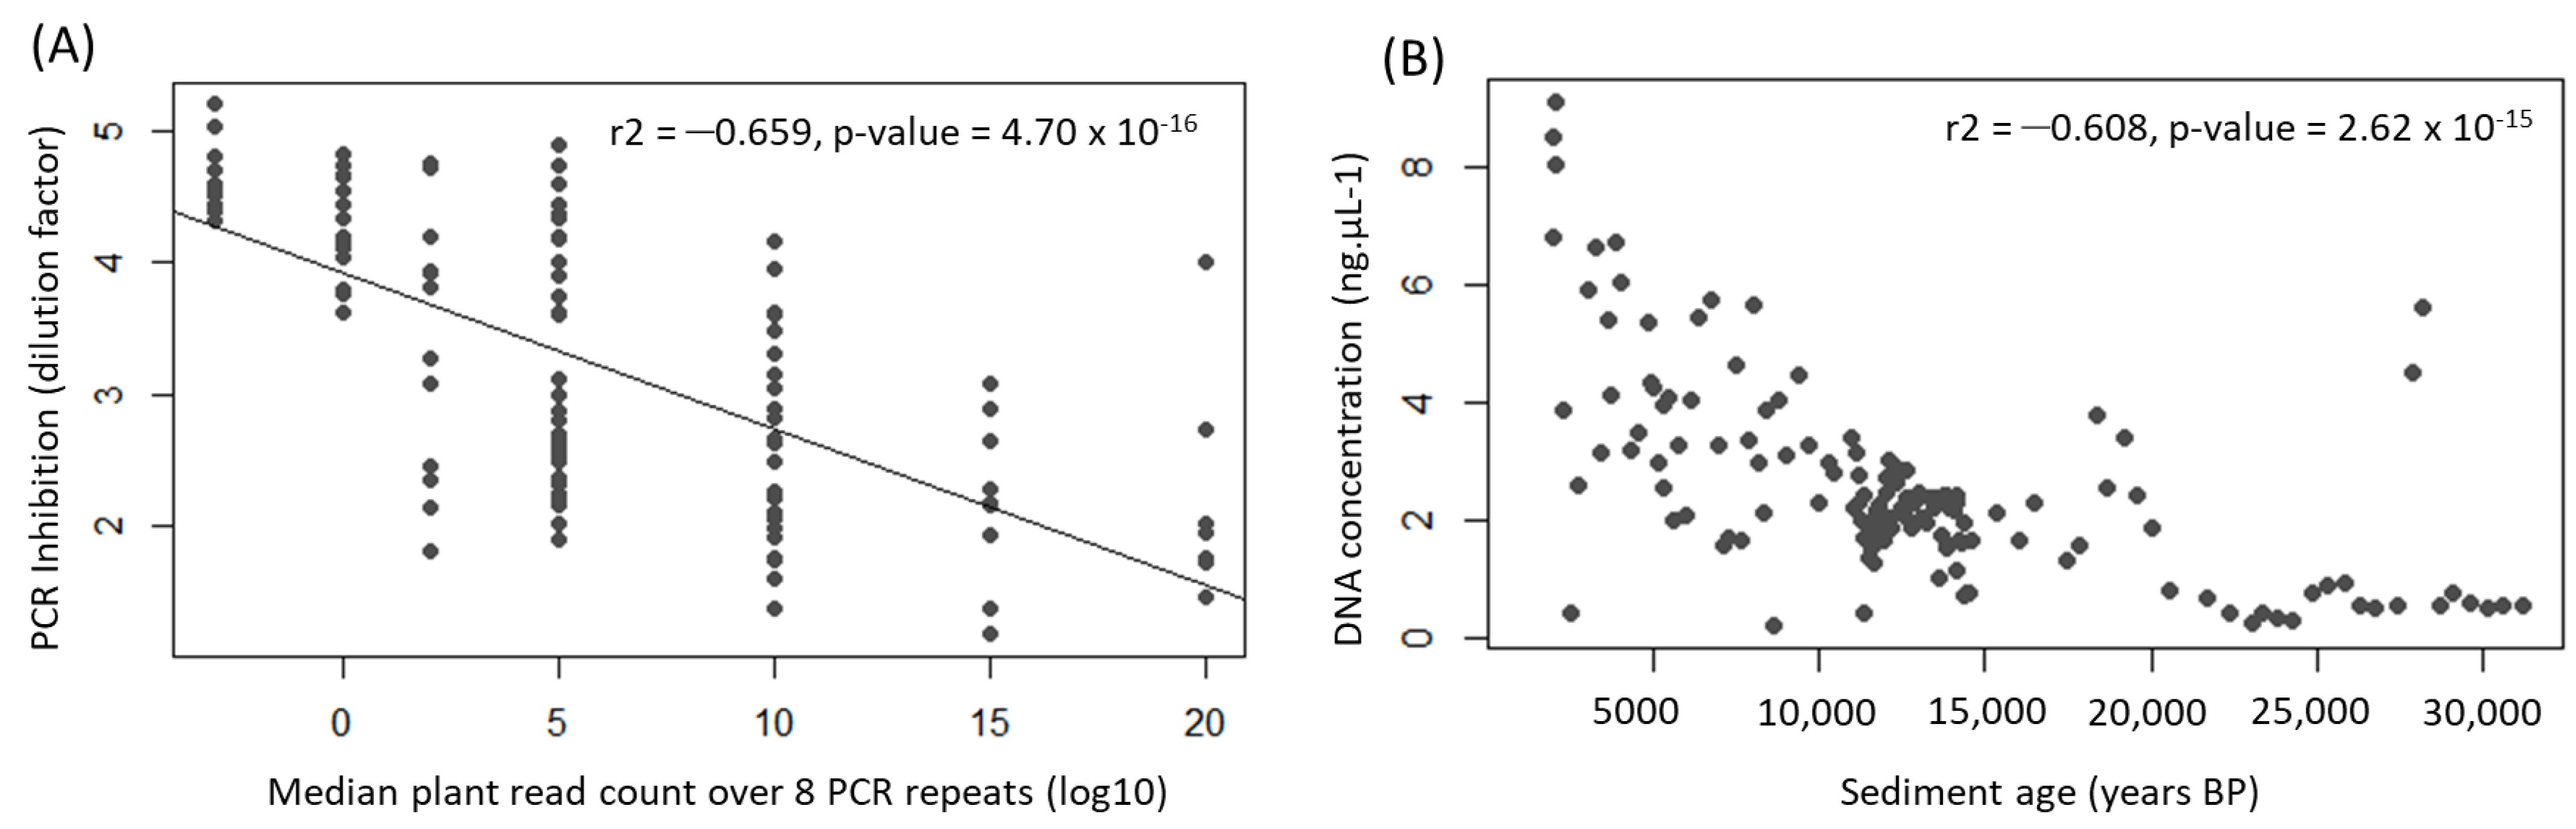
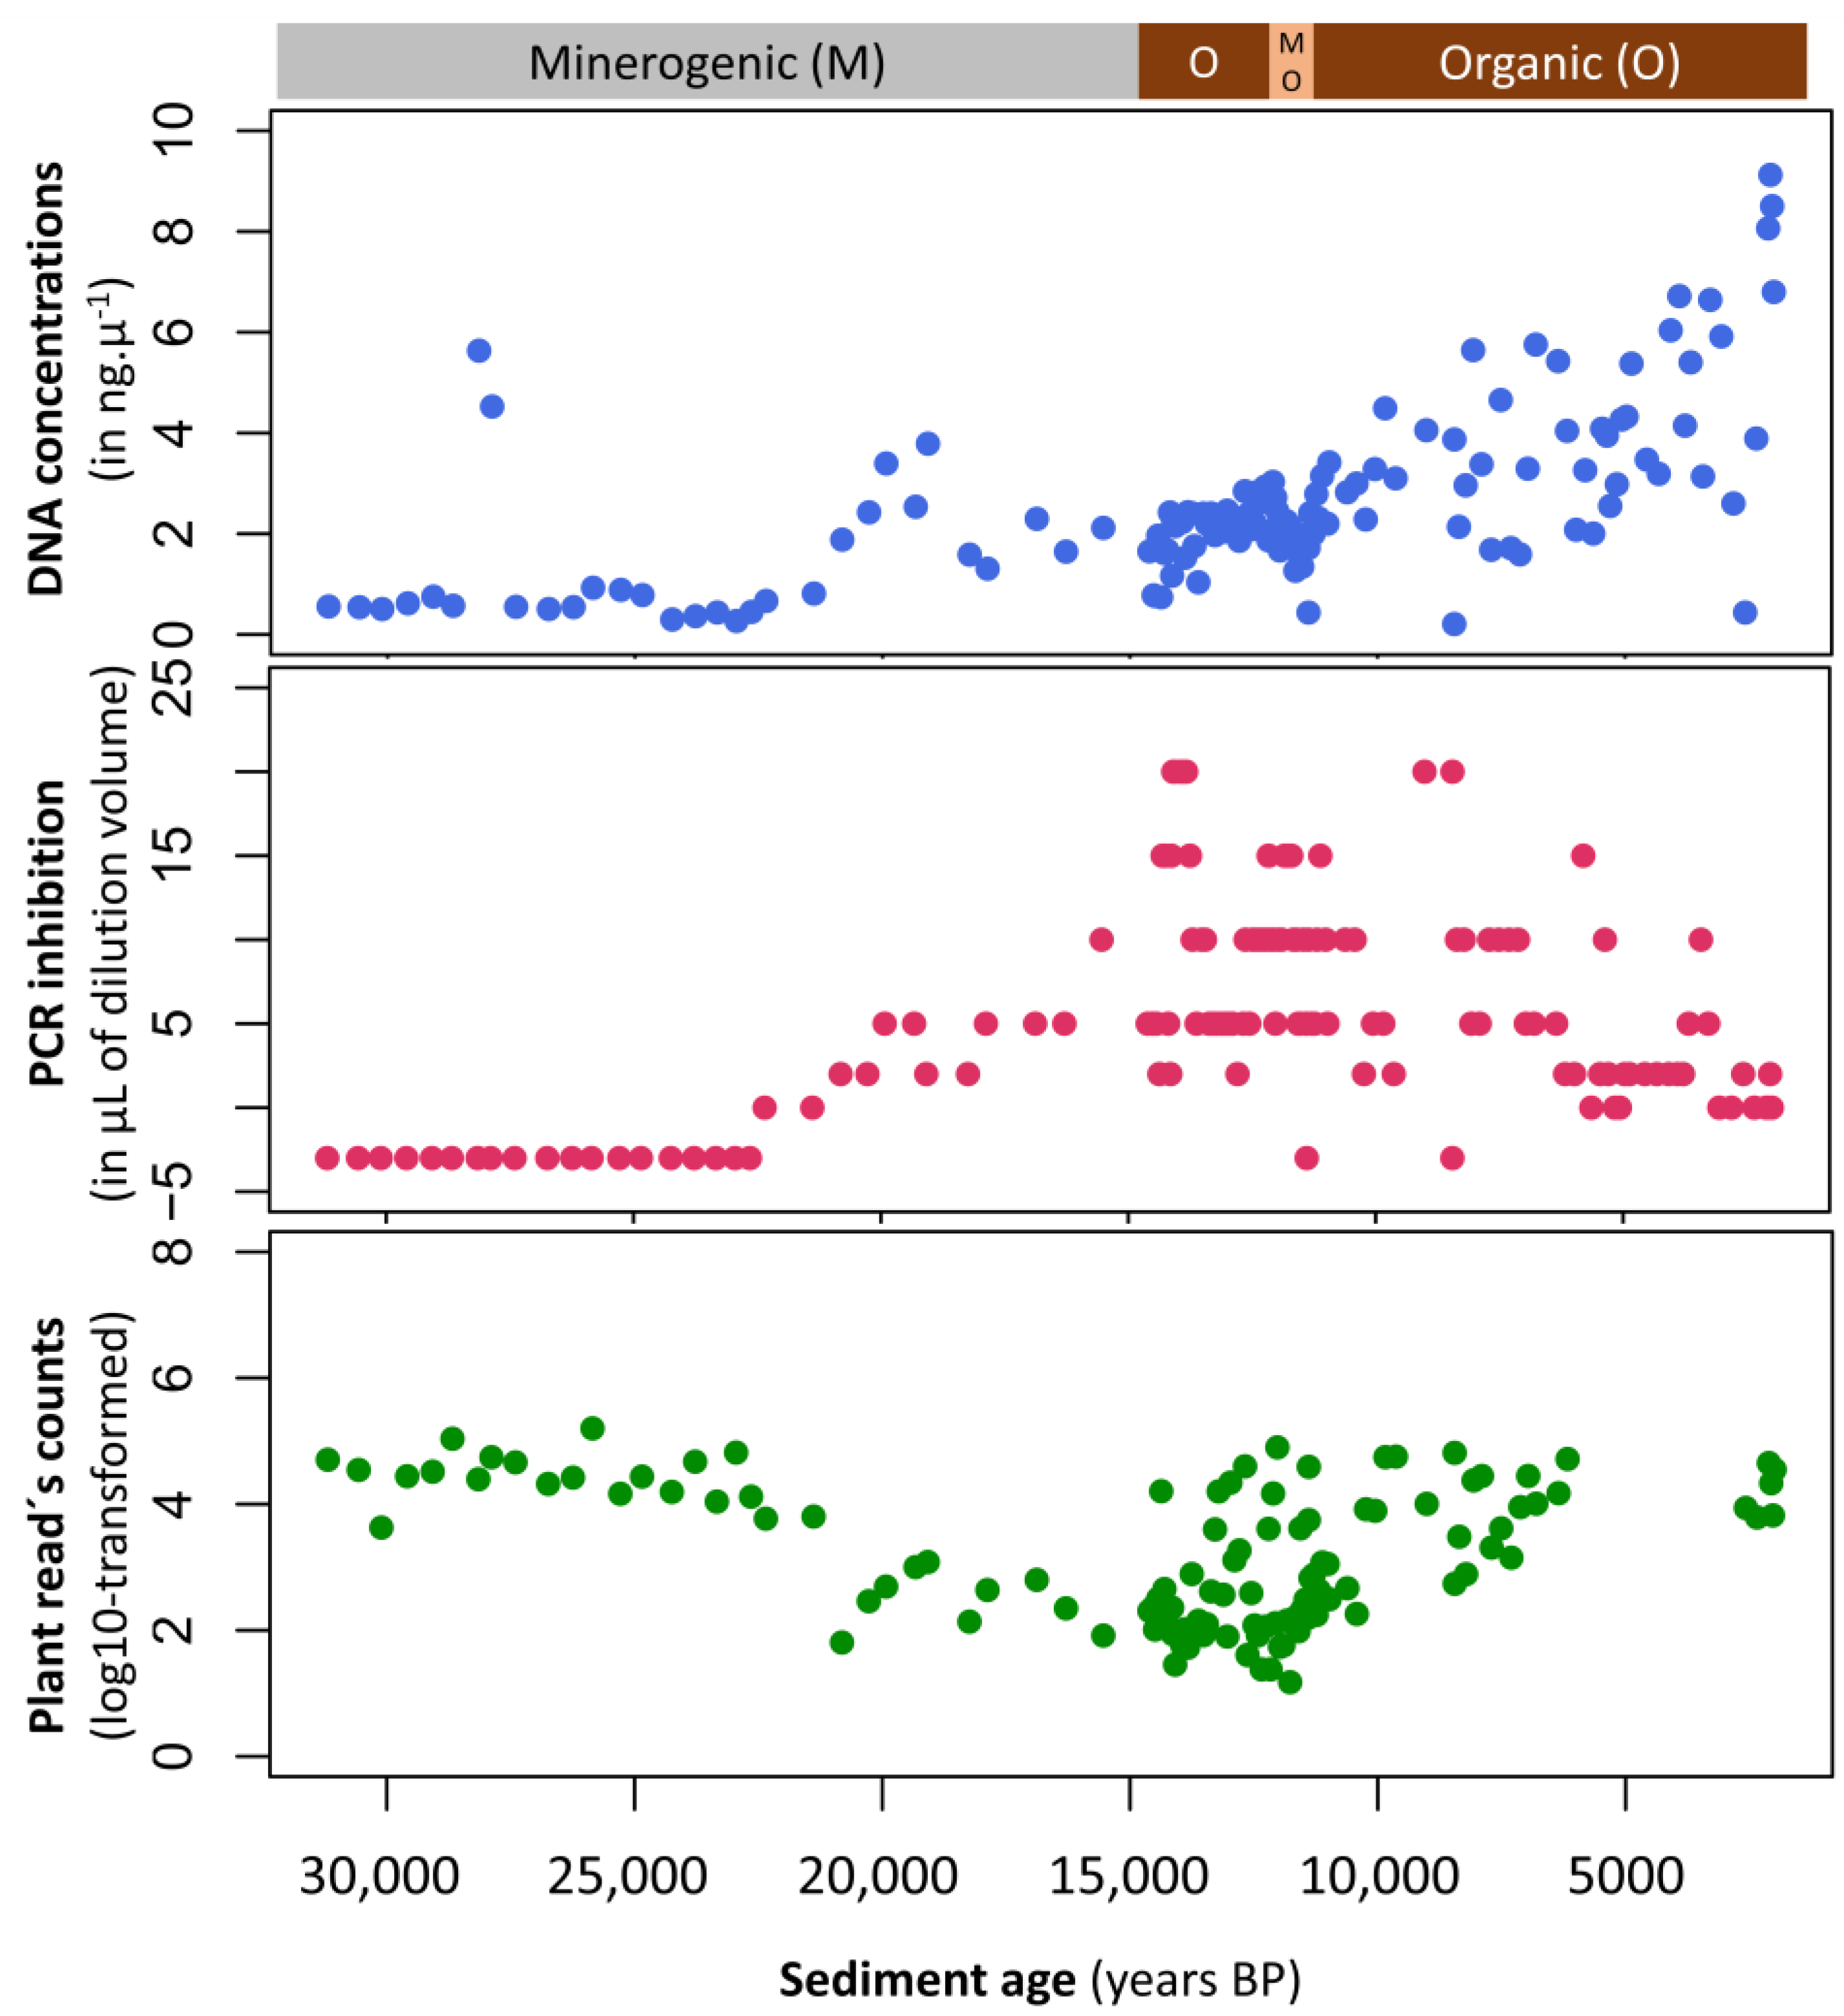
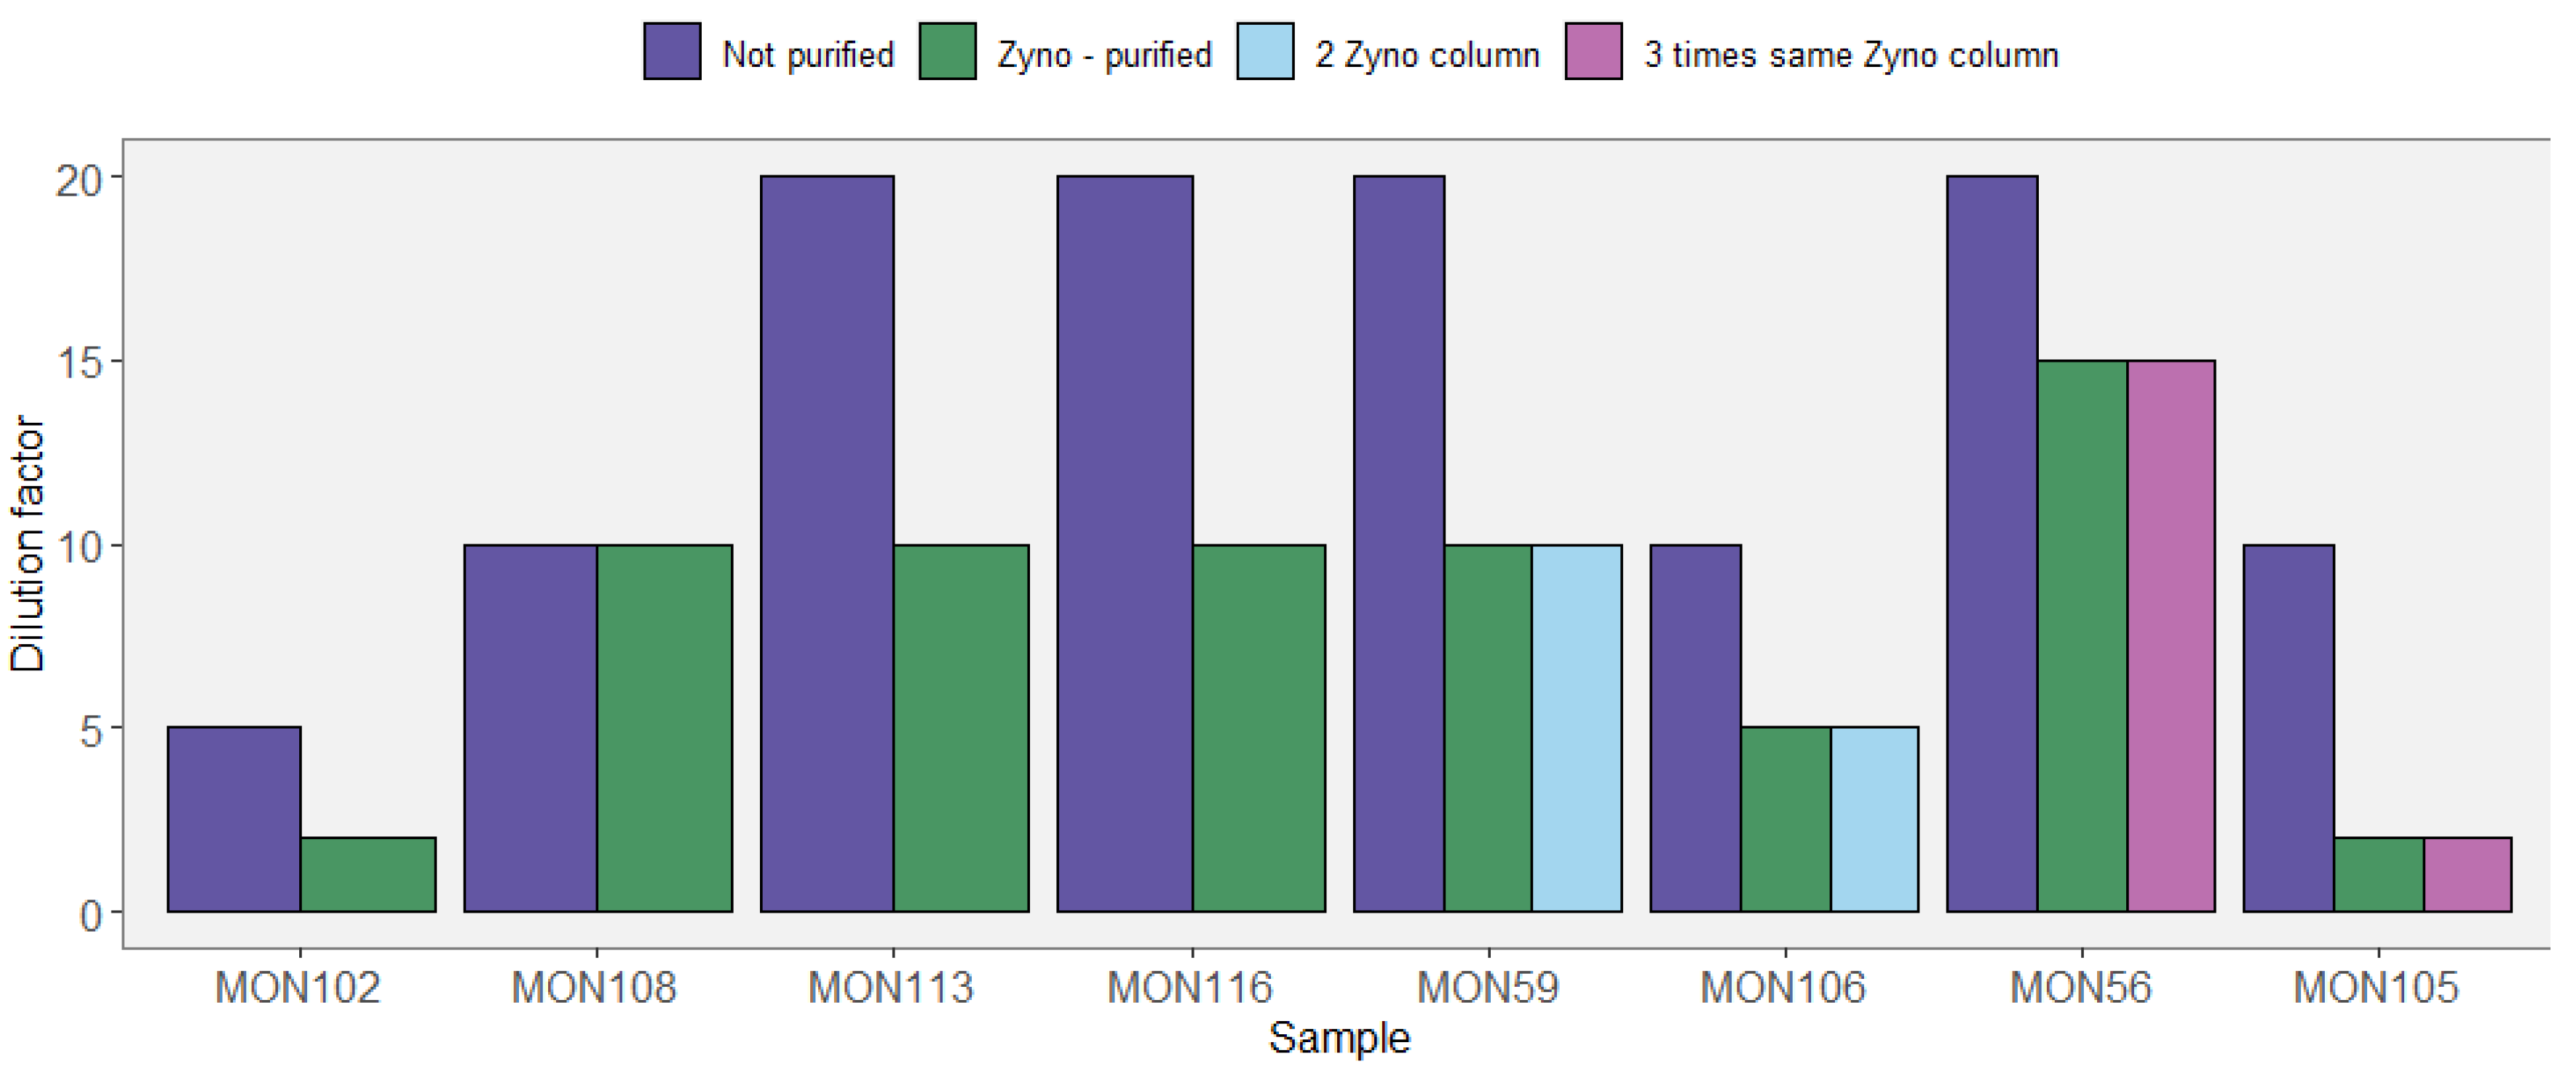
Appendix A.1. Case Study A1—Effects of Sediment Type on PCR Amplification Success
By Kevin Nota 5 and Laura Parducci 5,31


| Inhibition | DNA Concentration in ng/µL | |||||
|---|---|---|---|---|---|---|
| Sample | Age (Years BP) | (Before Cleaning) | Before Cleaning | After Cleaning | Difference | Recovery (%) |
| Mon 163 | 31,191 | 0 | 0.21 | 0.16 | 0.05 | 0.75 |
| Mon 157 | 28,151 | 0 | 3.94 | 3.06 | 0.88 | 0.78 |
| Mon 144 | 21,676 | 1 | 0.25 | 0.2 | 0.06 | 0.78 |
| Mon 136 | 17,467 | 5 | 0.38 | 0.37 | 0.01 | 0.98 |
| Mon 127 | 14,476 | 5 | 0.42 | 0.42 | −0.01 | 1.02 |
| Mon 121 | 14,181 | 5 | 0.38 | 0.38 | 0.01 | 0.98 |
| Mon 115 | 13,933 | 20 | 0.37 | 0.38 | −0.01 | 1.04 |
| Mon 100 | 12,779 | 2 | 0.66 | 0.6 | 0.06 | 0.91 |
| Mon 064 | 10,271 | 10 | 0.89 | 0.88 | 0.01 | 0.99 |
| Mon 063 | 10,008 | 2 | 0.83 | 0.81 | 0.02 | 0.98 |
| Mon 050 | 7510 | 10 | 1.26 | 1.16 | 0.1 | 0.92 |
| Mon 047 | 6964 | 5 | 1.07 | 0.97 | 0.1 | 0.91 |
| Mon 040 | 5462 | 2 | 1.75 | 1.52 | 0.23 | 0.87 |
| Mon 027 | 3425 | 10 | 1.28 | 1.17 | 0.11 | 0.91 |
| Mon 025 | 3054 | 1 | 2.9 | 2.5 | 0.4 | 0.86 |
| Mon 020 | 2061 | 1 | 2.38 | 2.07 | 0.31 | 0.87 |
| Mean | 0.91 | |||||
Material and Methods
| Oligo Name | Sequence | GC% | Tm (°C) |
|---|---|---|---|
| In_CF_85 | ACGGAGTGCGGTCTTAATGG | 55 | 57.3 |
| In_CR_85 | GGTACGGGTCTGTCGGATAG | 60 | 56.5 |
| Inh_Template_Nota85 | ACGGAGTGCGGTCTTAATGGCGTTCAATTGCGTTAATTGACGGCTCGAGTGTCCCCTACATCTTGCTATCCGACAGACCCGTACC | 52.9 | 72.7 |
| Plate | Sample Age Range | Number of Samples | Extraction Negatives | PCR Negatives | Index Cycles |
|---|---|---|---|---|---|
| Lane 1 | 14,149–31,191 yr BP | 4 × 2 × 40 | 4 × 2 × 4 | 4 | 10 |
| Lane 2 | 11,520–14,132 yr BP | 4 × 2 × 40 | 4 × 2 × 4 | 4 | 16 |
| Lane 3 | 1993–11,458 yr BP | 4 × 2 × 40 | 4 × 2 × 4 | 4 | 10 |
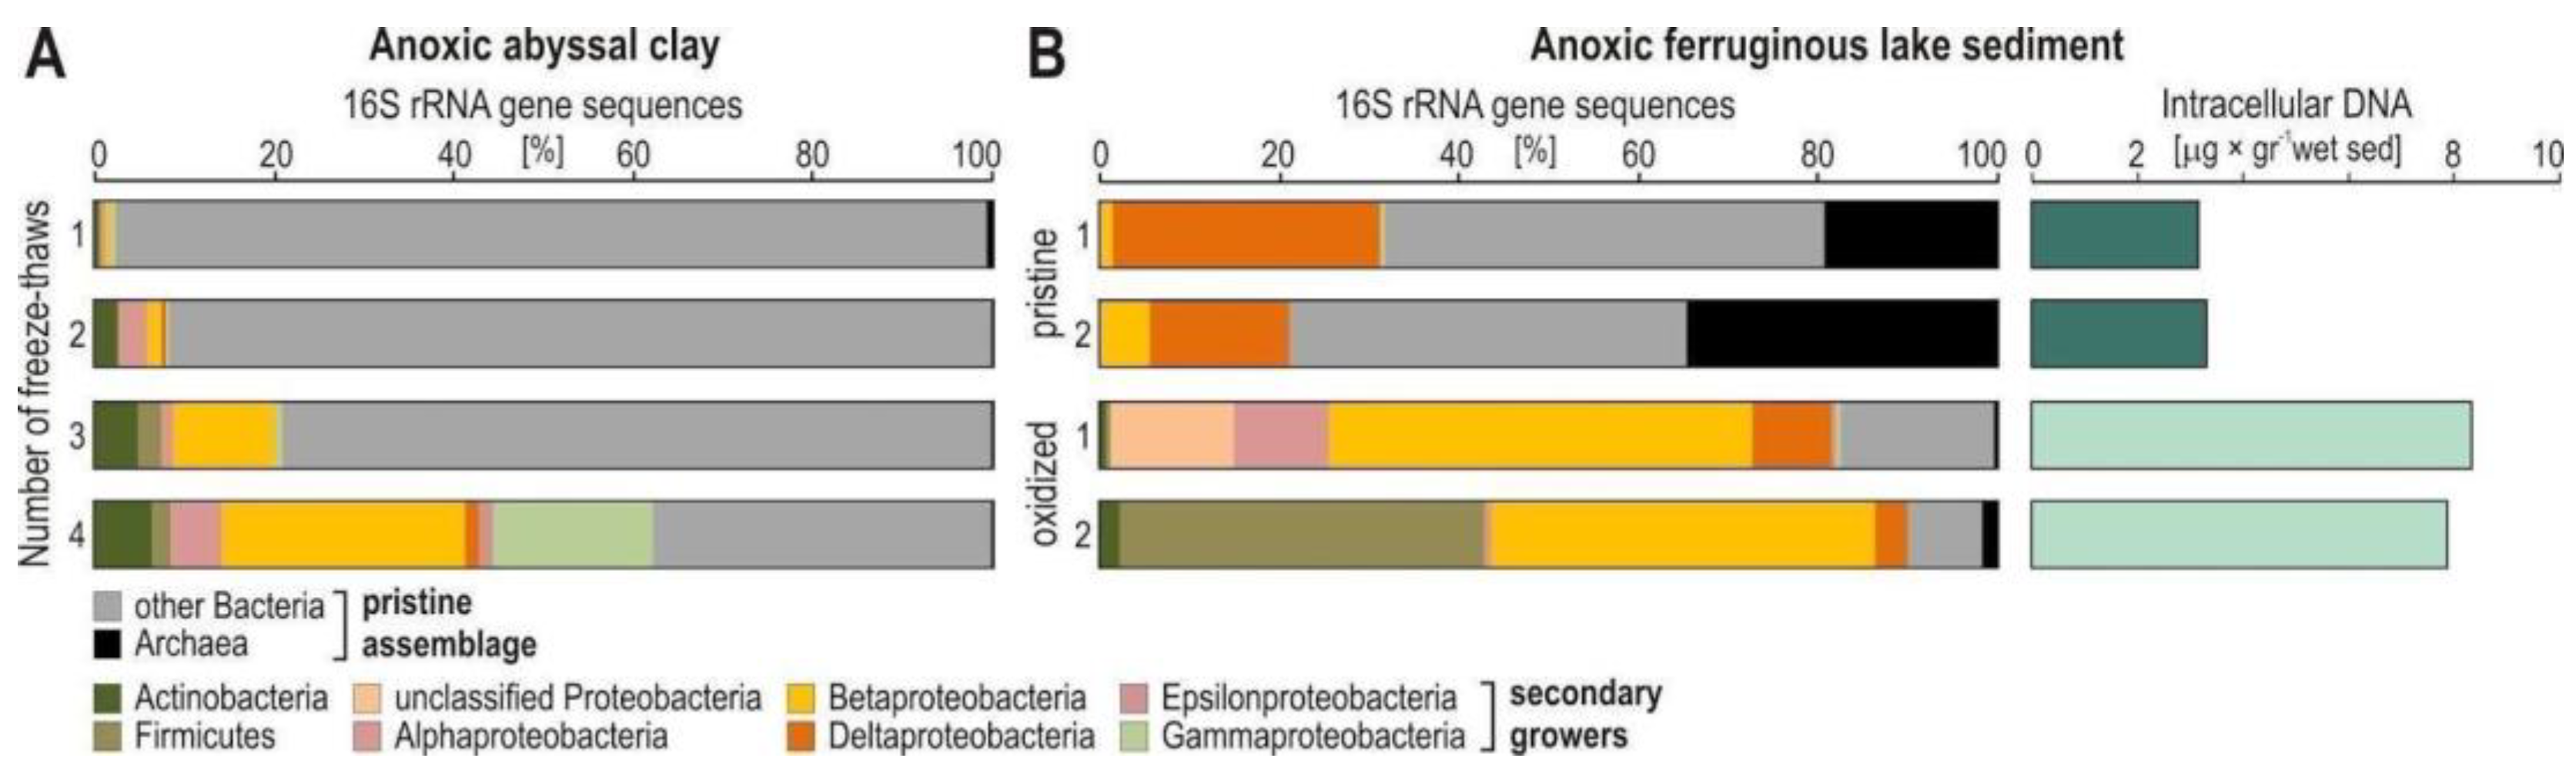
Appendix A.2. Case Study A2—Secondary Growth of Metabolically Versatile and Facultative Anaerobes during Sediment Storage and Handling of Sediment Cores
By Aurèle Vuillemin 7,8 and William D. Orsi 7,8
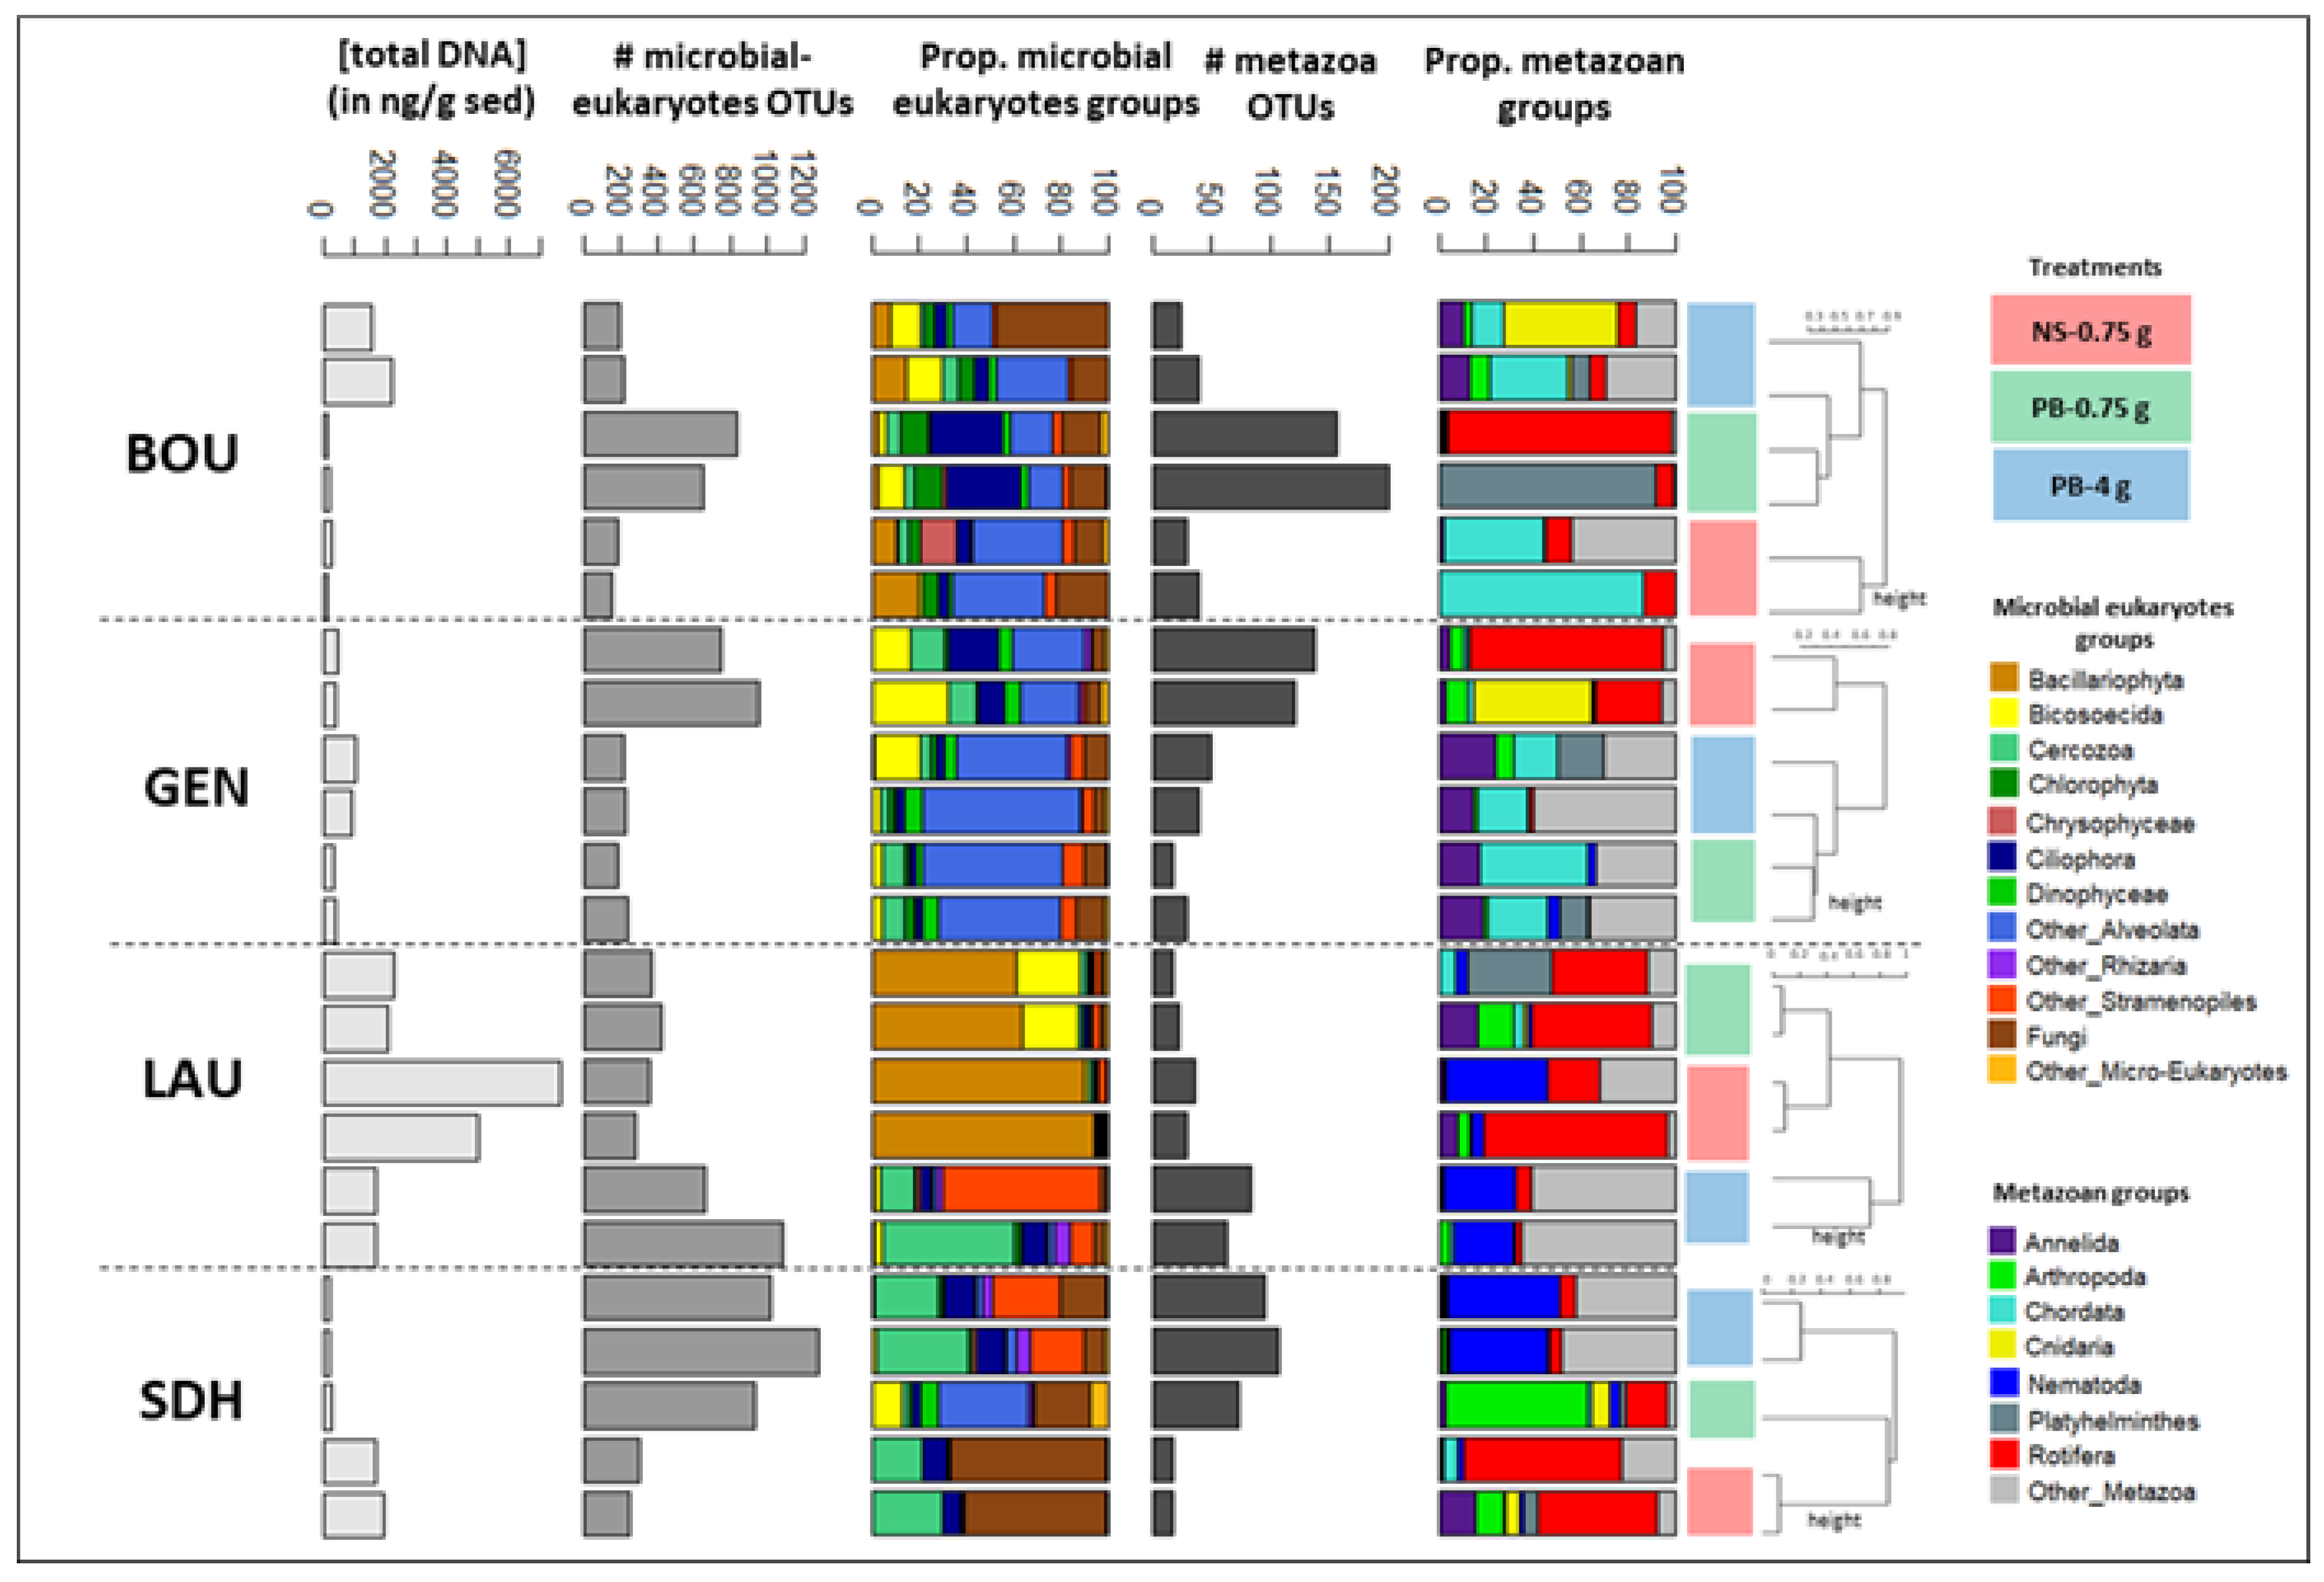
Appendix A.3. Case Study A3—Variability in Eukaryotic Inventories across Different DNA Extraction Protocols
By Isabelle Domaizon 29,30, Eric Capo 1, Charline Giguet Covex 2 and Irene Gregory-Eaves 18

Material and Methods
| Lake | Age (yr BP) | Sediment Features |
|---|---|---|
| Lauzanier | −30 to −7 | 15 to 20% of organic matter (OM), 3 to 3.5% of carbonate, >75% of loss on ignition (LOI) residue |
| Serre de l’Homme | −36 to −24 | 52 to 62% of OM, 2.3 to 2.5% of carbonates, >35.5% of LOI residue |
| Bourget | −25 to −6 | 4 to 7% of organic matter (OM), 45 to 60 % of carbonates |
| Léman | −30 to −8 | 4 to 9% of organic matter (OM), 35 to 58% of carbonates |
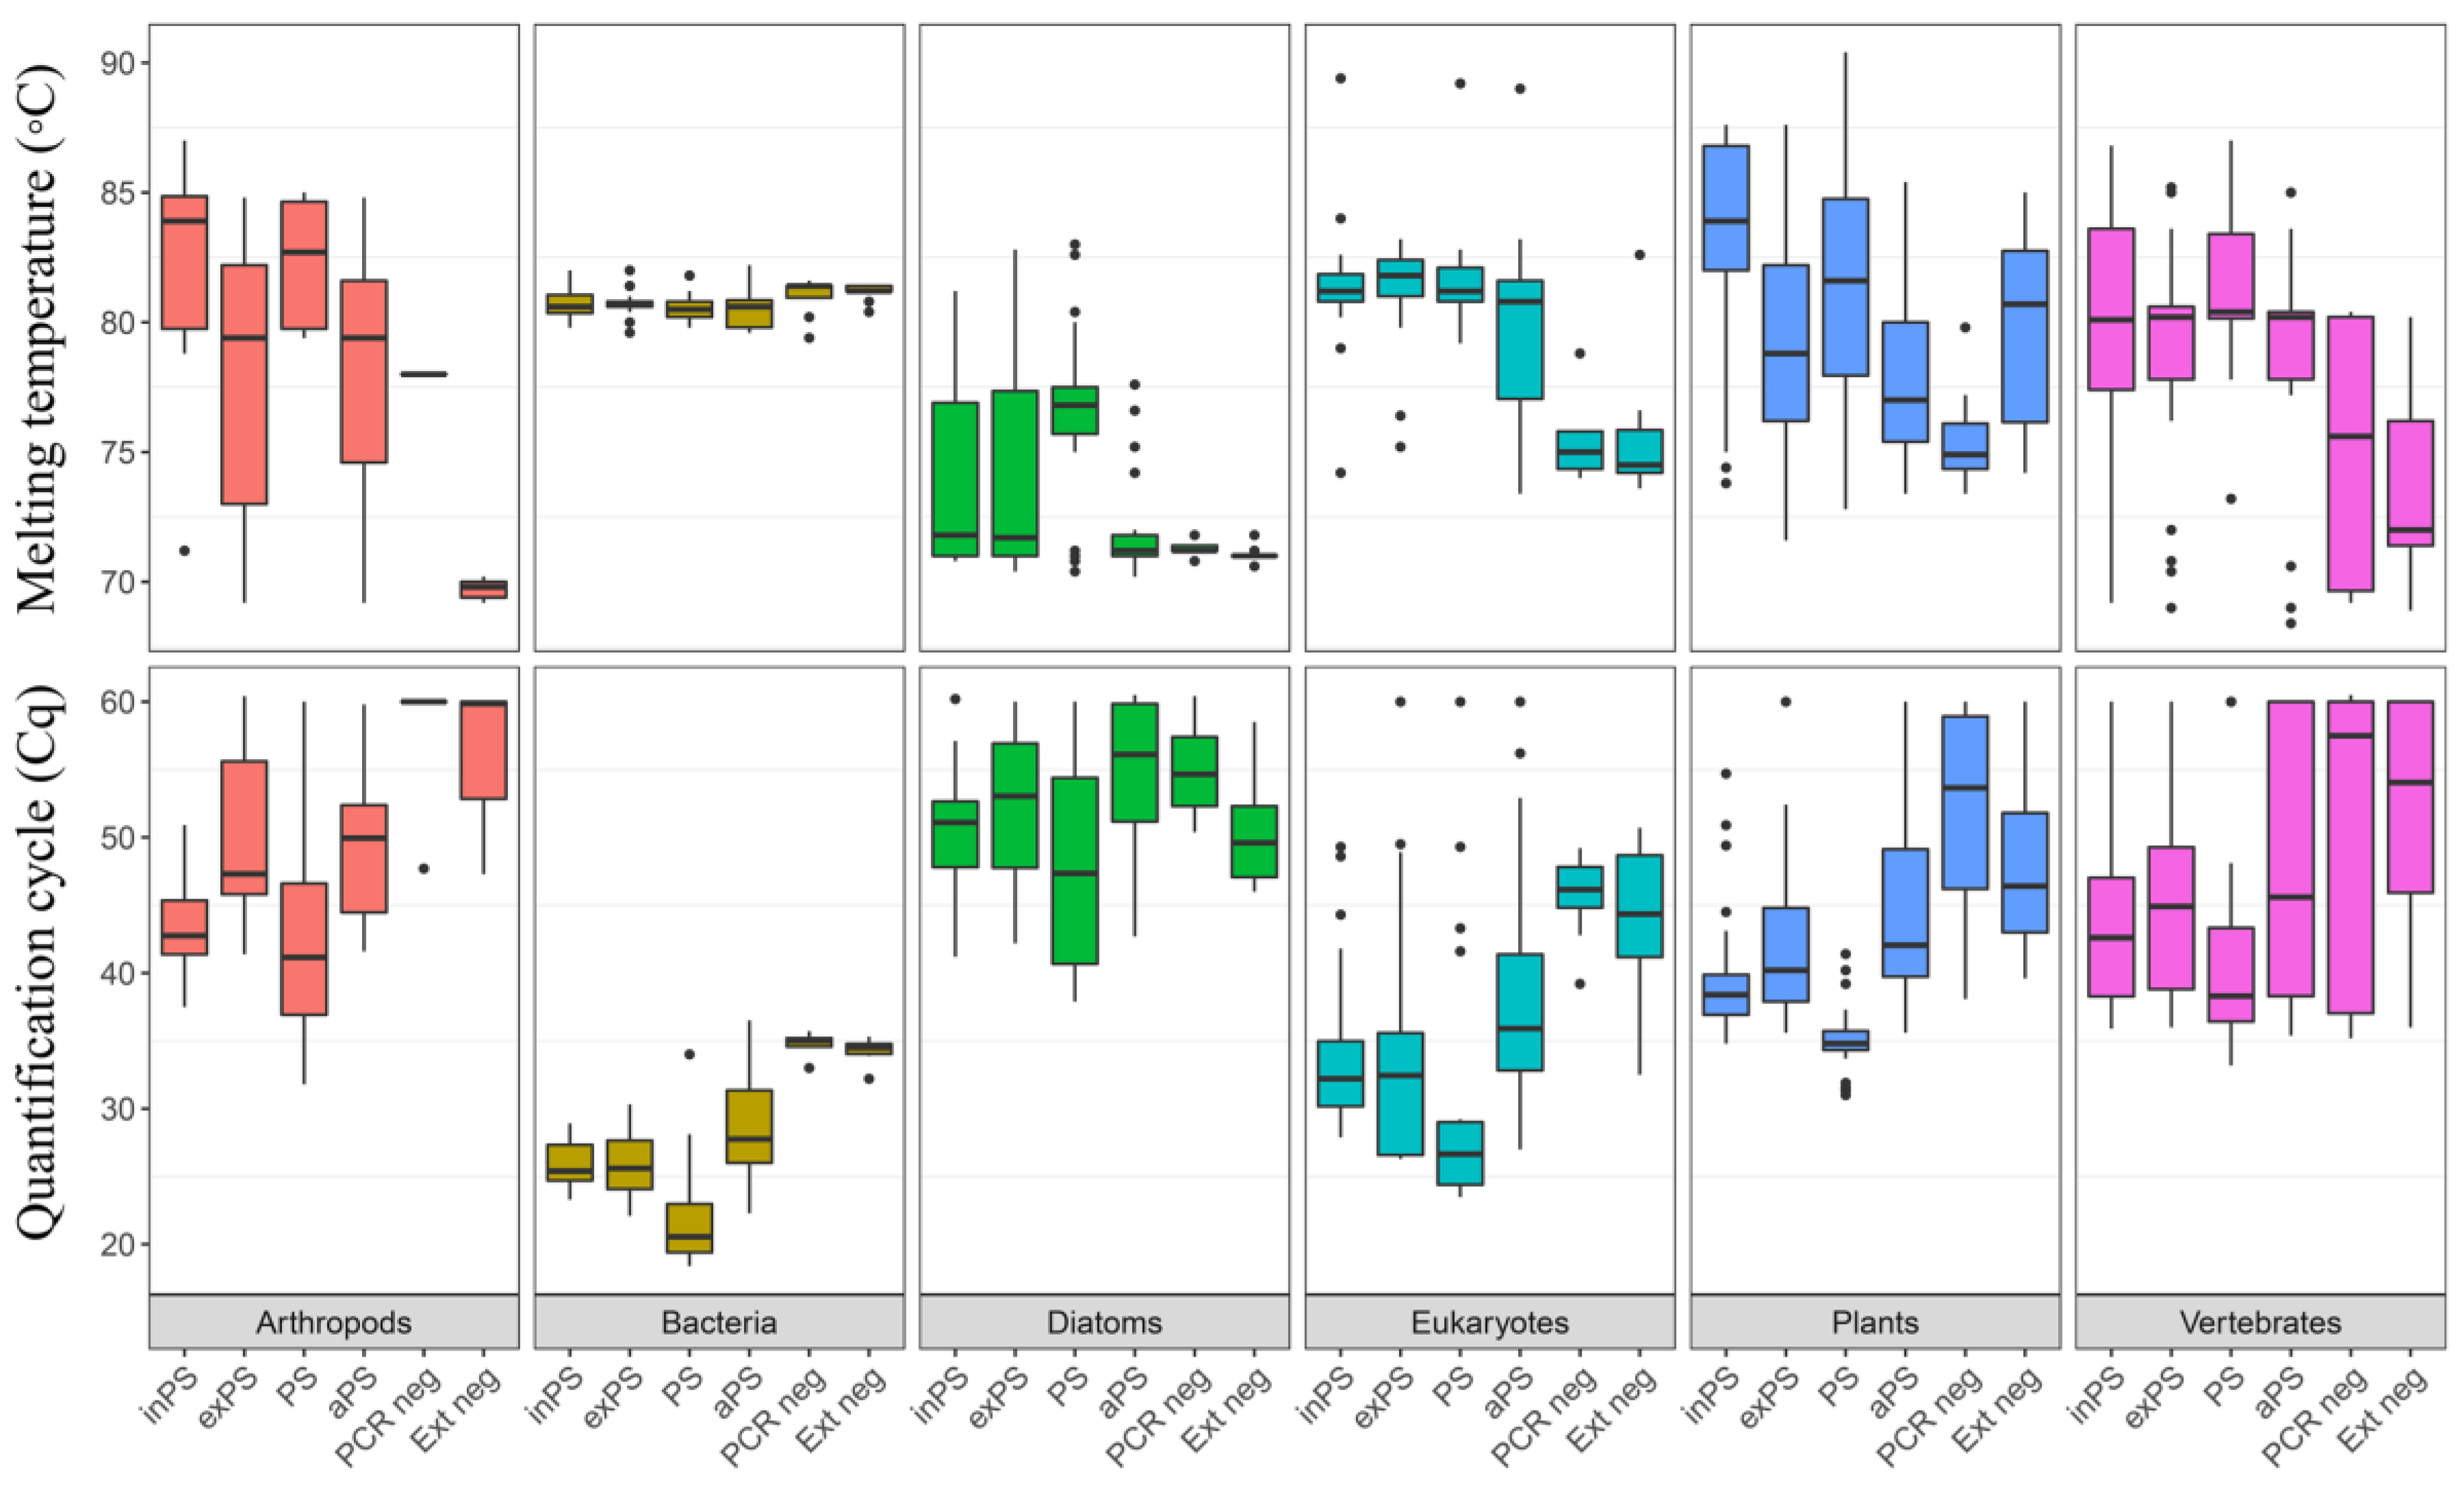
Appendix A.4. Case Study A4—Variability in Biological Groups across Different DNA Extraction Methods
By Kevin Nota 5 and Laura Parducci 5,31
| Extraction | Mean (±sd) | Median | Min | Max |
|---|---|---|---|---|
| PS protocol | 557 ± 448 | 442 | 81 | 1531 |
| exPS protocol | 34 ± 29 | 23 | 9 | 102 |
| inPS protocol | 24 ± 25 | 15 | 0 | 94 |
| aPS protocol | 24 ± 15 | 21 | 0 | 50 |

Material and Methods
| Id | Location | Sediment Type | Age (yBP) | References |
|---|---|---|---|---|
| NER2 | North-east Russia | Peat-Permafrost | ~6000 | [125] |
| NER11 | North-east Russia | Peat-Permafrost | ~8200 | [125] |
| MON18 | Southern Italy | Lake | ~1993 | [284] |
| MON78 | Southern Italy | Lake | ~11,562 | [284] |
| NWF2 | North-west Finland | Peat | ~42,000 | [125] |
| ATT2 | Southern Sweden | Lake | ~11,000 | [285] |
| ATT25 | Southern Sweden | Lake | ~15,000 | [285] |

| Primer Name | Target Taxa | Target Marker | Used Annealing Temperature | Length (bp) | References |
|---|---|---|---|---|---|
| Euka01For | Eukaryota | 18S rRNA | 59 °C | 48–777 | [288] |
| Euka01Rev | |||||
| Diat_rbcL_705F | Diatoms | rbcL | 49 °C | 76 | [105] |
| Diat_rbcL_808R | |||||
| Sper01For (g Taberlet) | Seed plants | trnL | 52 °C | 10–220 | [201] |
| Sper01Rev (h Taberlet) | |||||
| Atrh01For | Arthropoda | 16S mt DNA | 48 °C | 18–97 | |
| Atrh01Rev | [167] | ||||
| Vert01For | Vertebrata | 12S mt DNA | 49 °C | 56–132 | [289] |
| Vert01Rev | |||||
| A967F | Bacteria | 16S rRNA | 55 °C | 98 | [290] |
| 1046R |
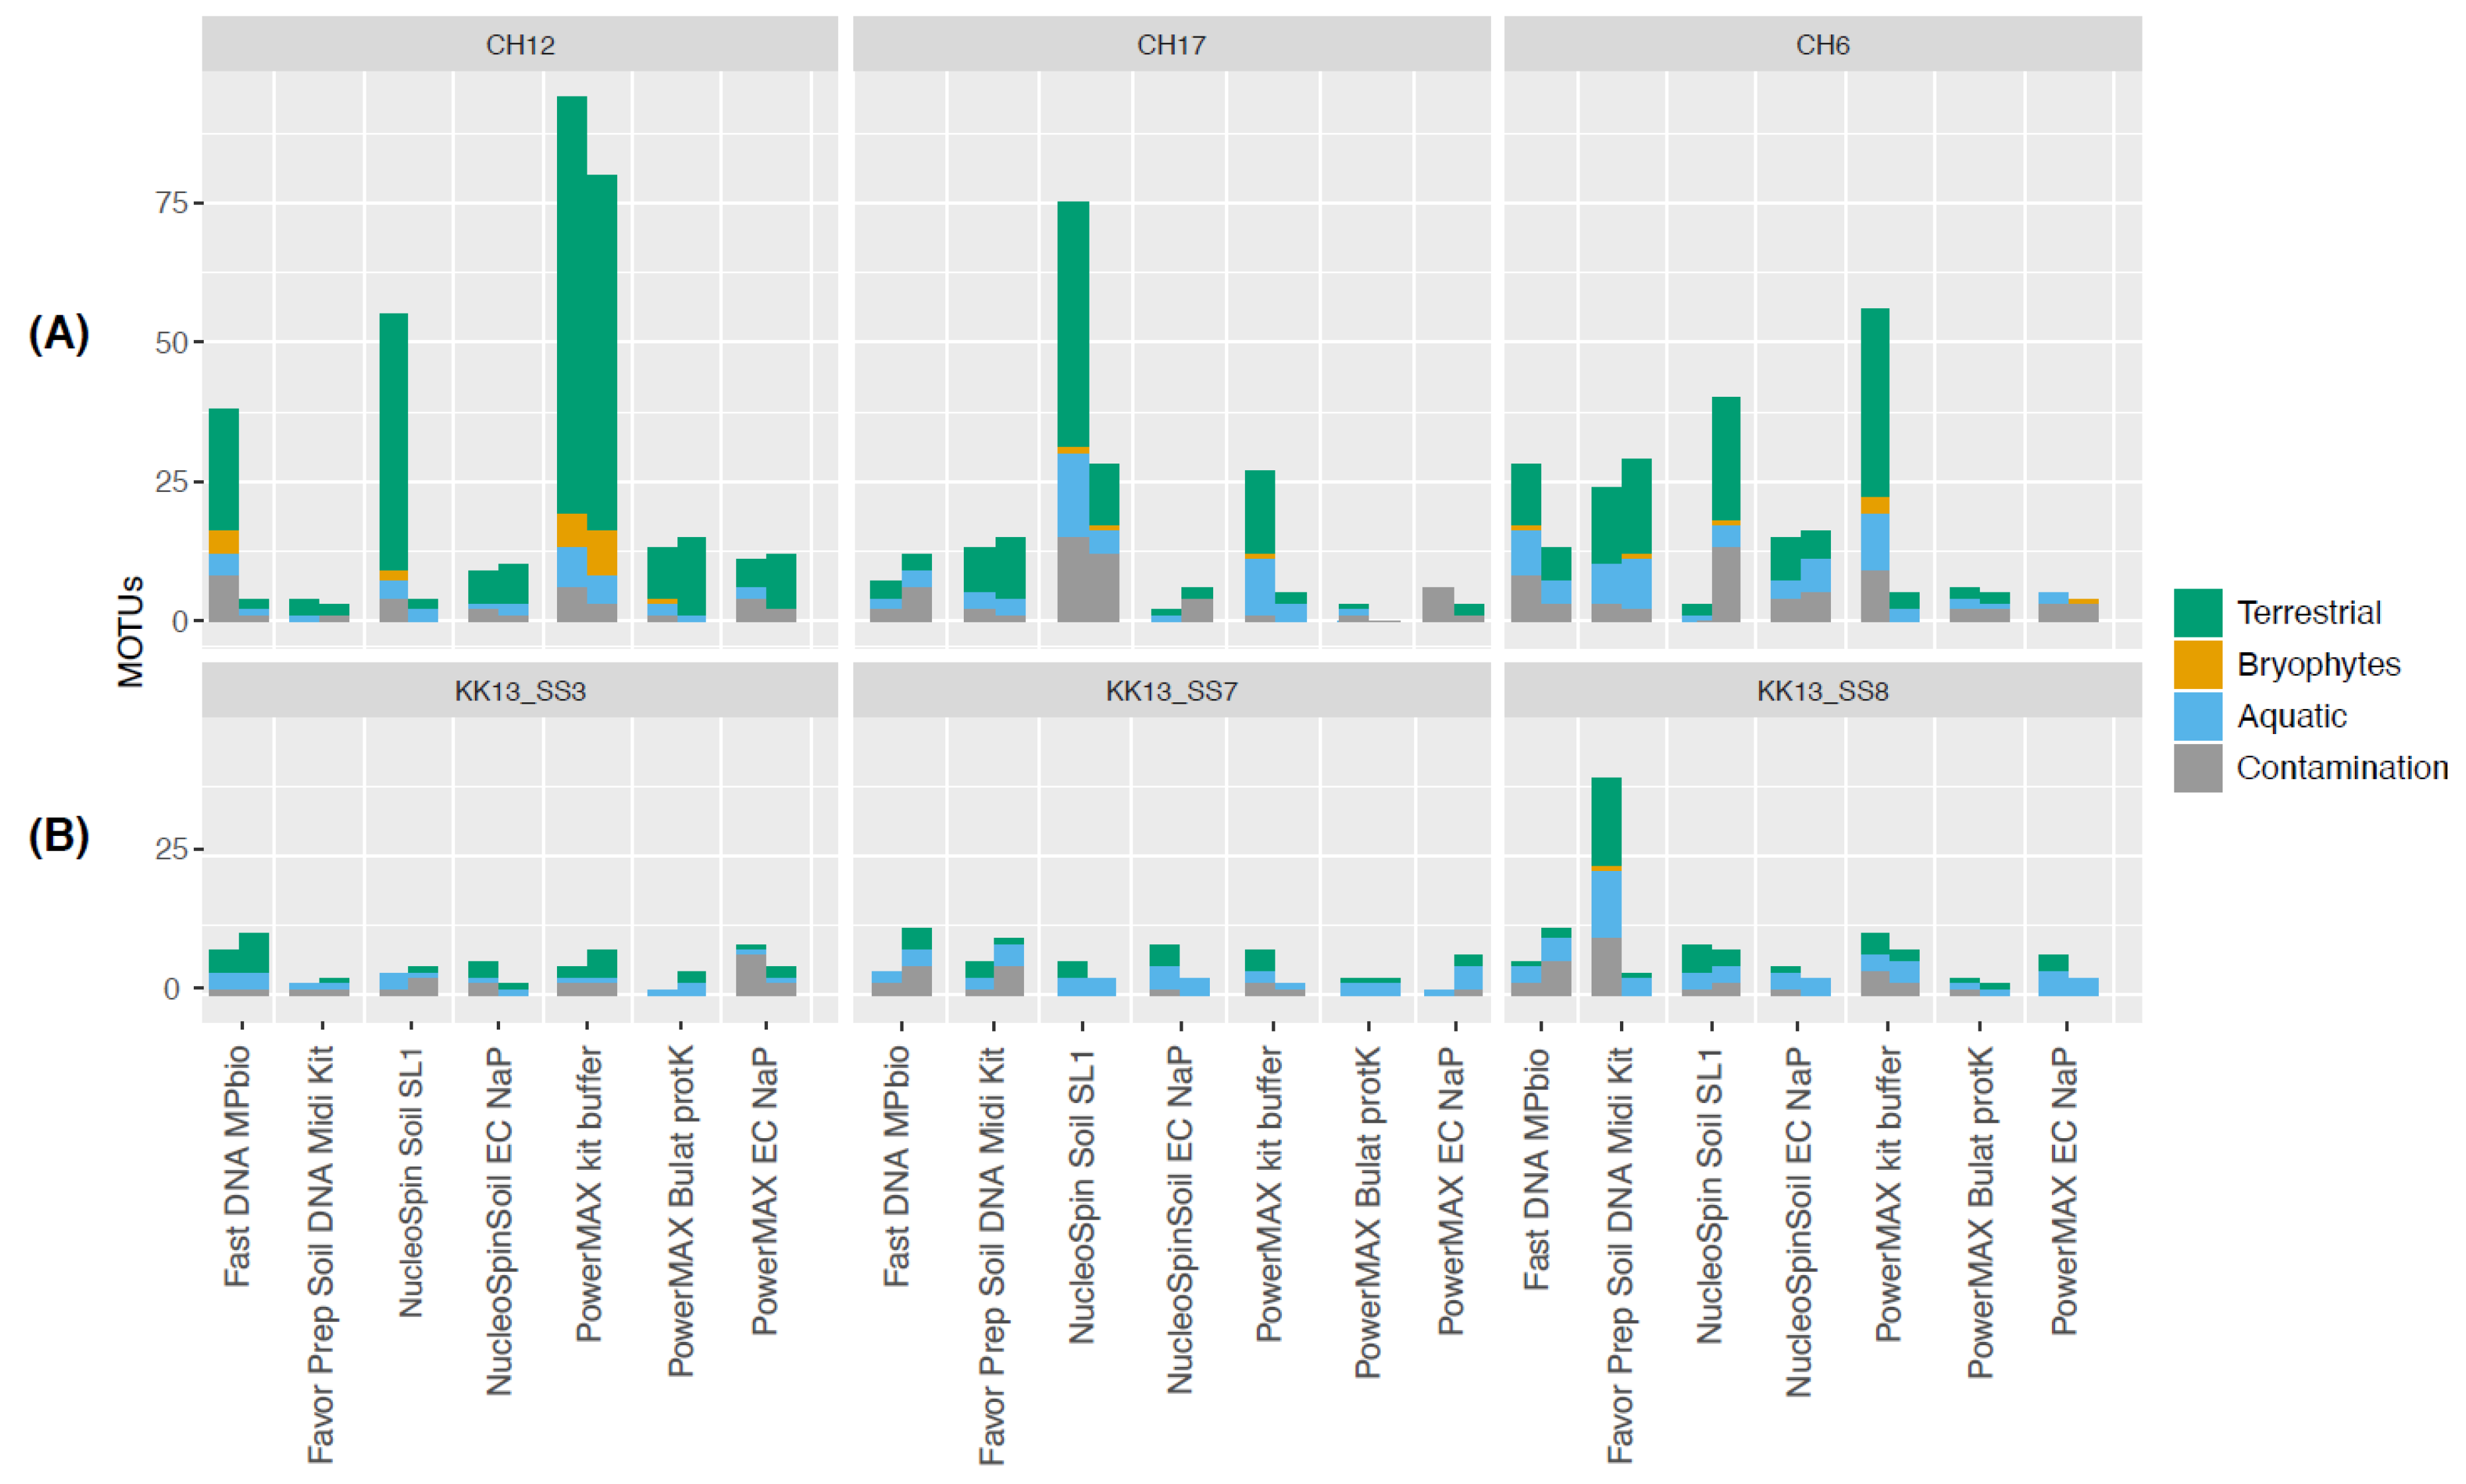
Appendix A.5. Case Study A5—Effects of DNA Extraction Methods on the Diversity of the Plant DNA Signal
By Laura S. Epp 23, Liv Heinecke 19,20, Heike H. Zimmermann 19, Kathleen R. Stoof-Leichsenring 19 and Ulrike Herzschuh 19,21
Summary
Experimental Procedures
| Sample | Lake | Geographical Area | Coordinates | Elevation (m asl) | Water Depth (m) | pH | Lake Area |
|---|---|---|---|---|---|---|---|
| 11-CH06 | 11-CH06 | Siberia, Southern Taymyr Peninsula | 97.715861 N/70.667444 E | 103 | 4.8 | 6.42 | 0.05 km2 |
| 11-CH12 | 11-CH12 | 102.288566 N/ 72.398881 E | 60 | 14.3 | 7.5 | 0.03 km2 | |
| 11-CH17 | 11-CH17 | 102.235194 N/72.244486 E | 51 | 3.4 | 7.87 | 0.03 km2 | |
| KK13_SS3 | Lake Karakul | Tajikistan, High Pamir Mountains | 39.01814 N/73.52910E | 3915 | 15.9 | 9.2 | 380 km2 |
| KK13_SS7 | Lake Karakul | 39.02255 N/73.51955 E | 3915 | 20.4 | 9.2 | 380 km2 | |
| KK13_SS8 | Lake Karakul | 73.51955 N/73.53254 E | 3915 | 13.8 | 9.2 | 380 km2 |
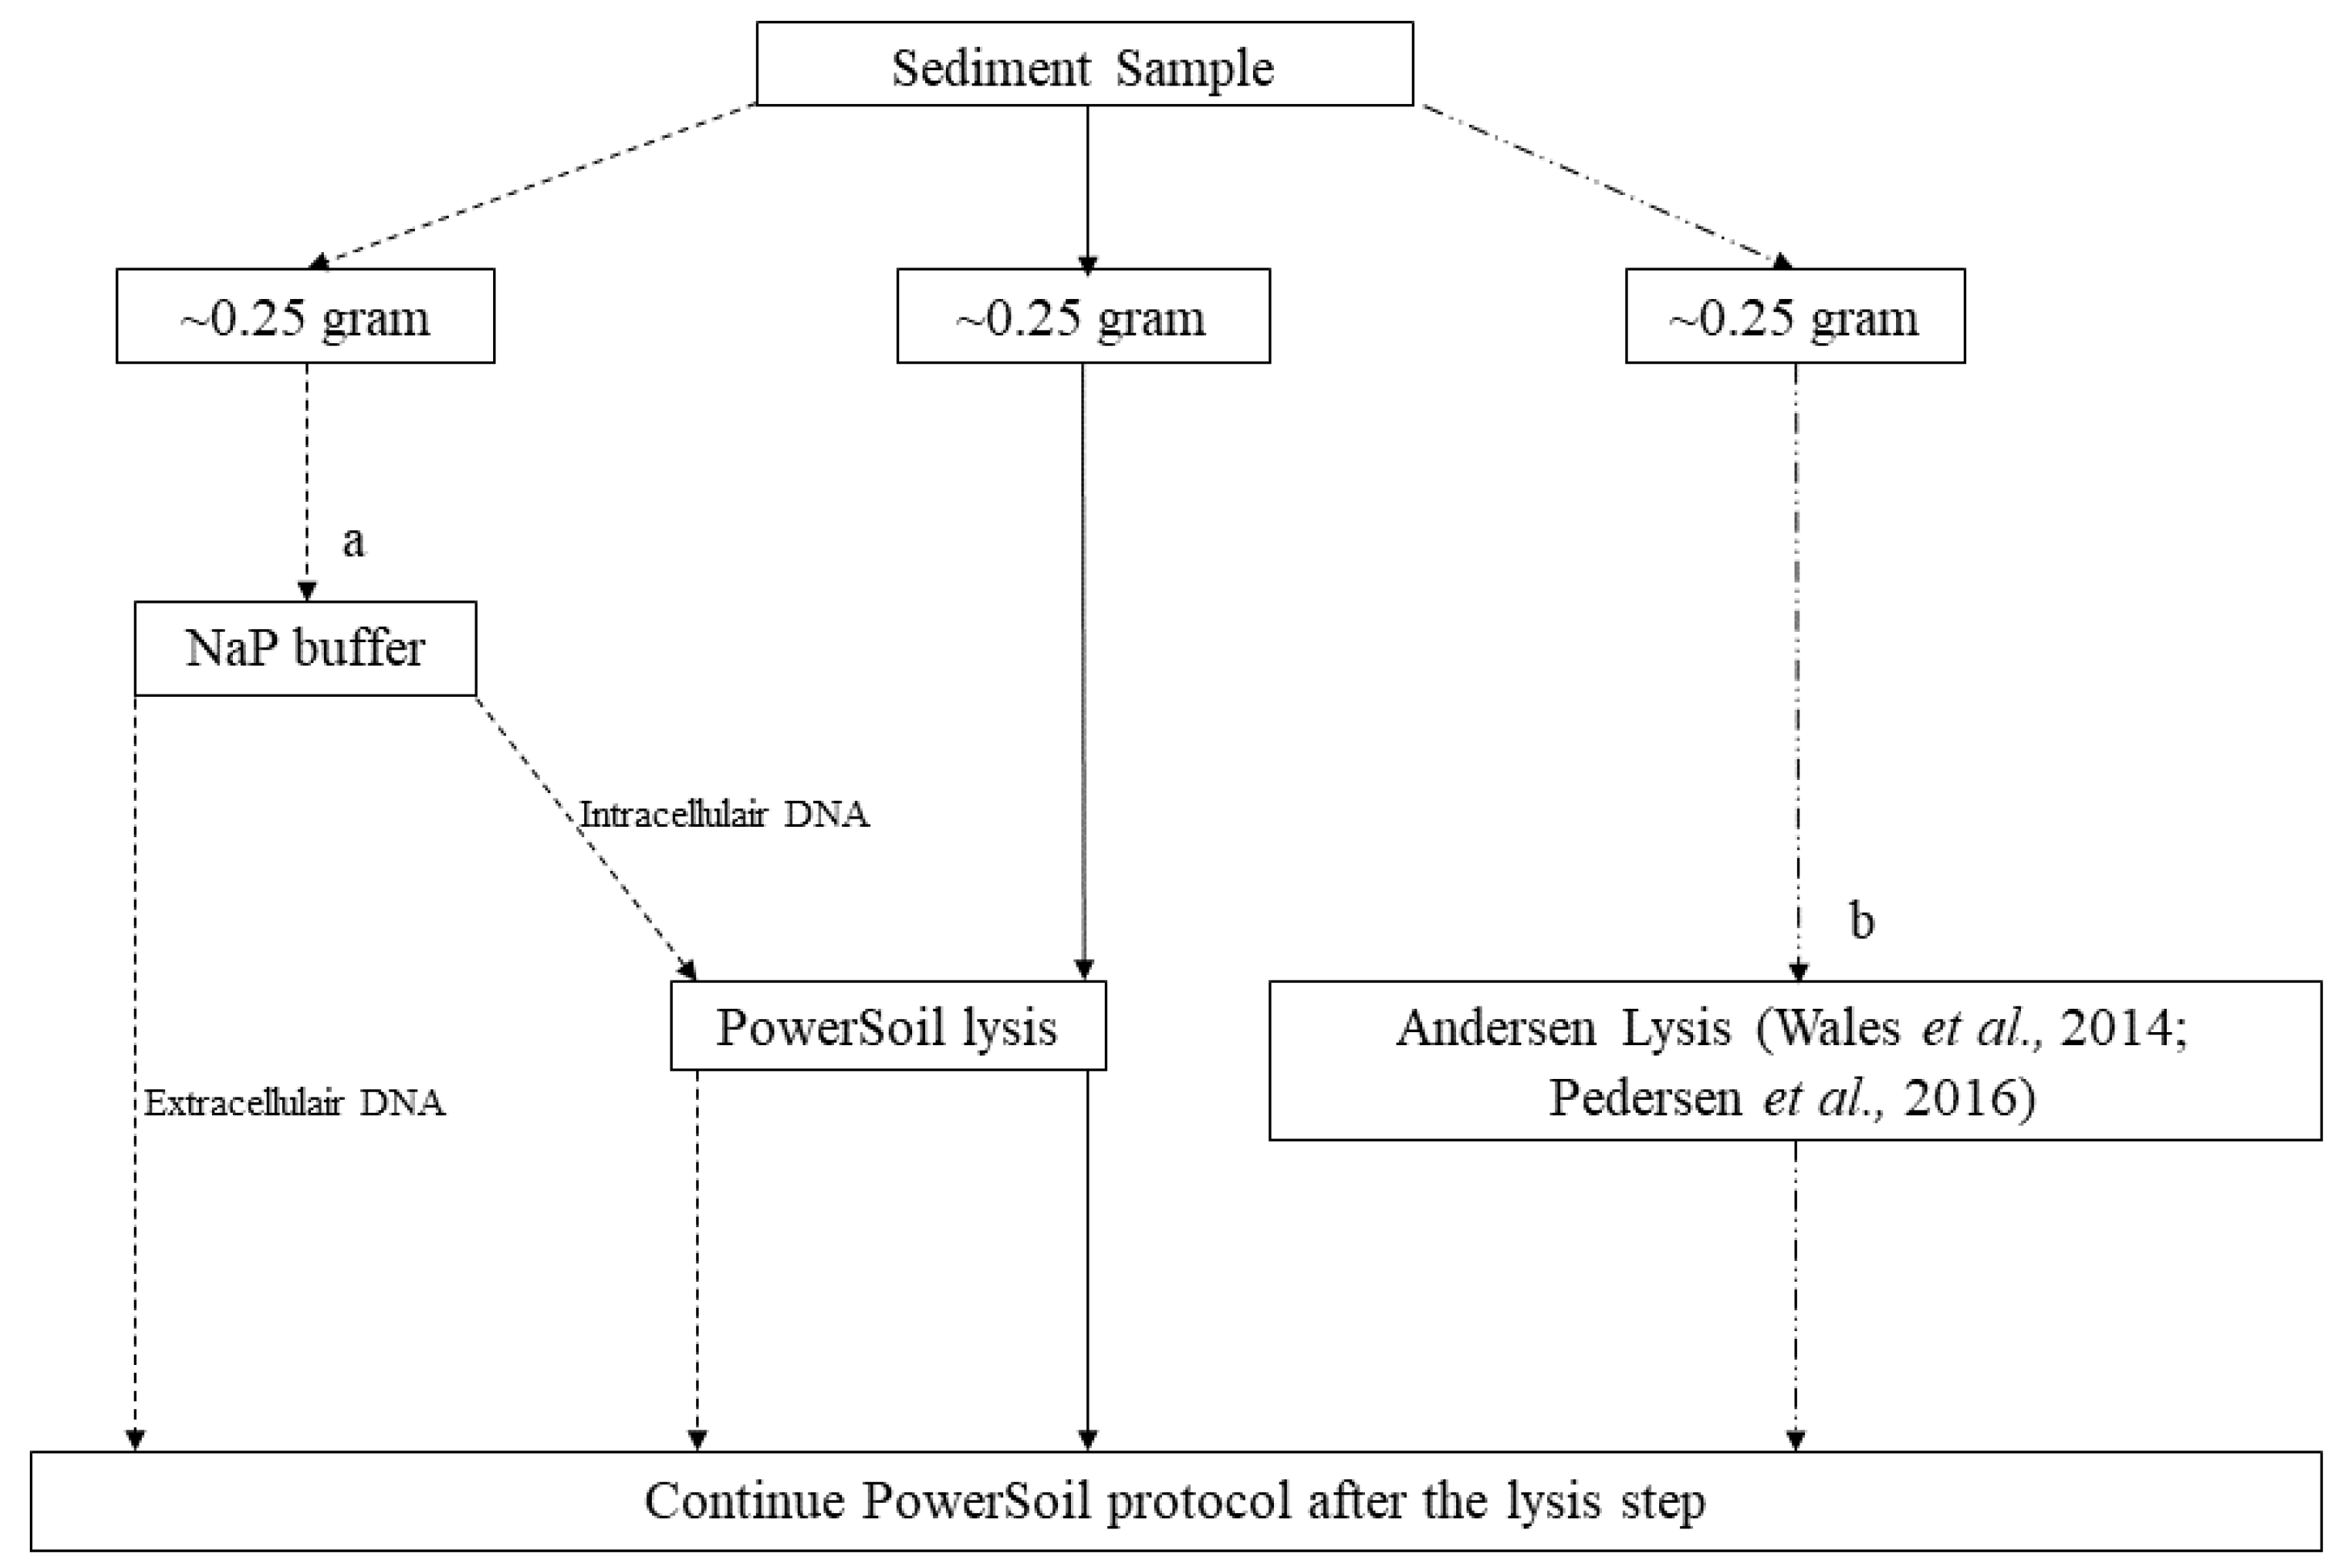
| Extraction Kit | Kit Lysis Buffer | Phosphate Buffer (Extracellular) | Bulat Buffer + Proteinase K |
|---|---|---|---|
| FastDNA Spin Kit for Soil, 50 mL tubes (MP Biomedicals) | ~5 g | - | - |
| FavorPrep Soil DNA Isolation Midi Kit (FavorGen) | ~5 g | - | - |
| NucleoSpin Soil, Mini Kit (Macherey-Nagel) | ~0.25 g | ~5 g | - |
| PowerMax Soil Kit (originally MoBio, now Qiagen) | ~5 g | ~5 g | ~5 g |
Results
Conclusions
Appendix A.6. Case Study A6—A Protocol for Ancient DNA Extraction from Calcite-Rich Minerogenic Lake Sediments
Peter D. Heintzman 6, Dilli P. Rijal 6, Antony G. Brown 6,11 and Inger G. Alsos 6
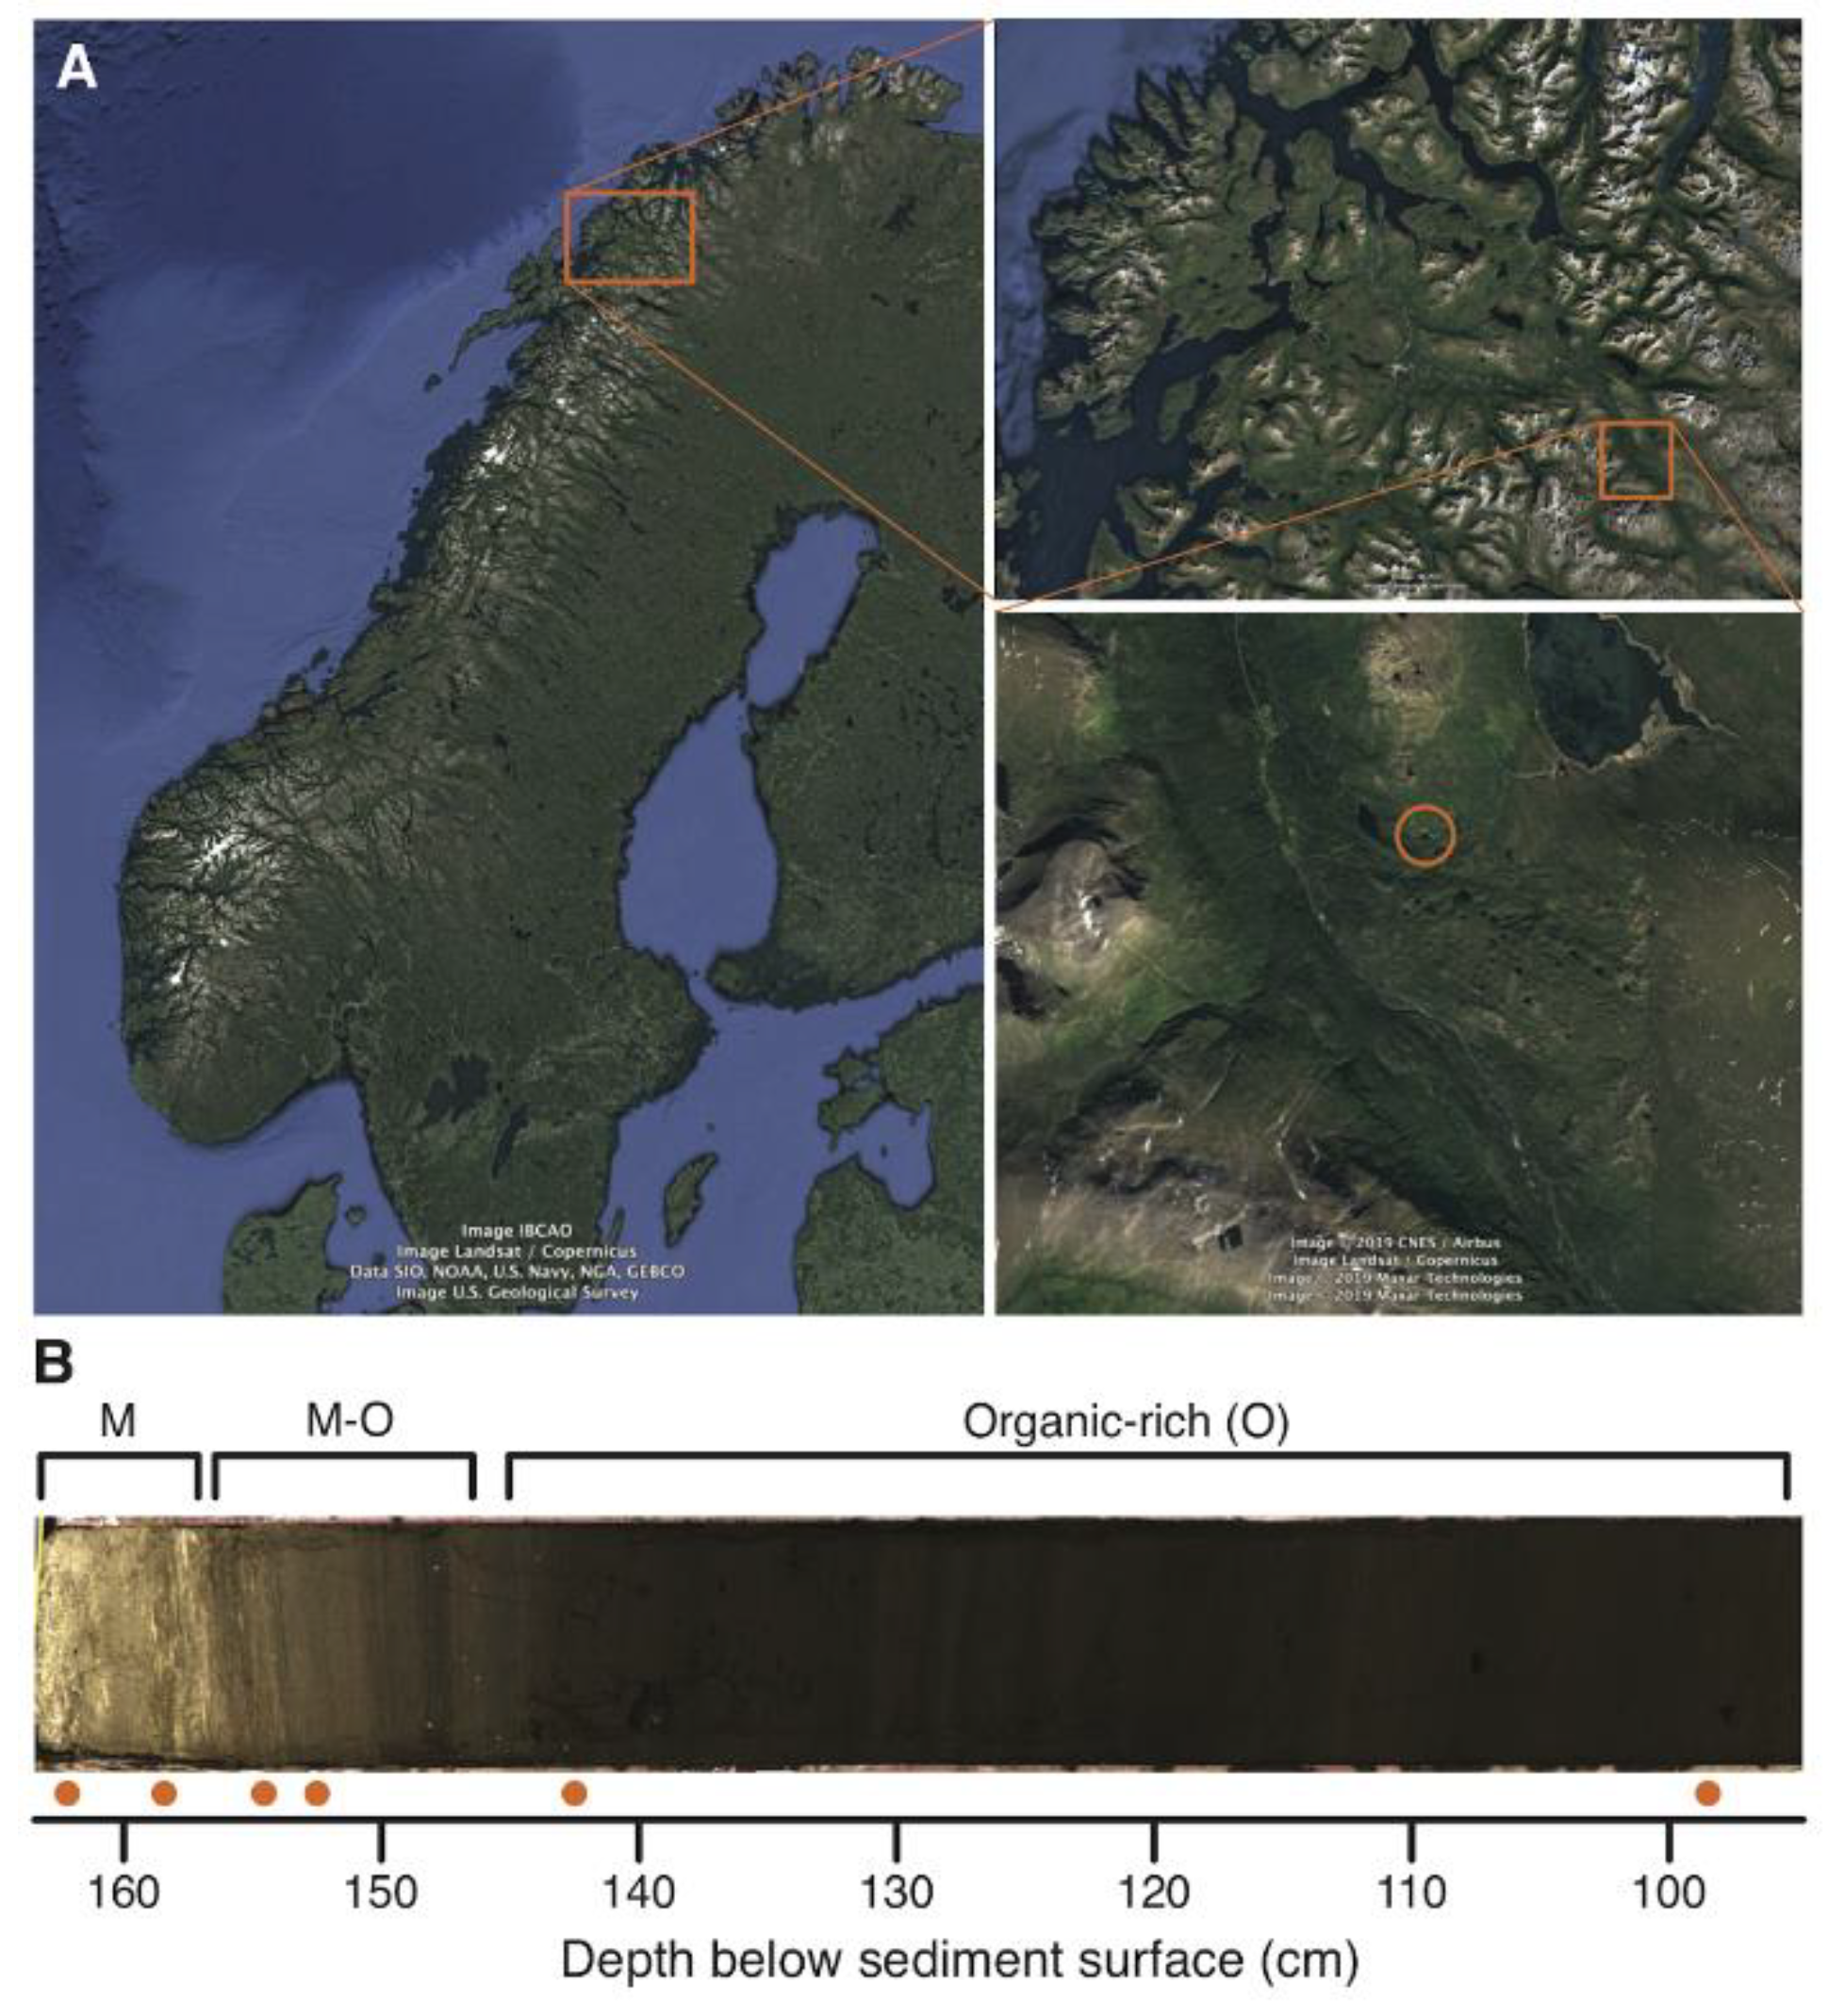
| Sample | Depth (cm) | M/O | LOI (%) | XRF | Original Protocol | Optimised Protocol | Overlap | Fold Increase | |||||||
|---|---|---|---|---|---|---|---|---|---|---|---|---|---|---|---|
| 550 | 950 | Ca/Ti | Si/Ti | Fe/Ti | Richness | Replic. | Richness | Replic. | Richness | Prop. | Richness | Replic. | |||
| EG13_NEC | na | na | na | na | na | na | na | 0 | na | 0 | na | 0 | 0 | na | na |
| EG13_NEC | na | na | na | na | na | na | na | 0 | na | 2 | 0.125 | 0 | 0 | na | na |
| EG13_NEC | na | na | na | na | na | na | na | 1 | 0.125 | 0 | na | 0 | 0 | na | na |
| EG13_NPC | na | na | na | na | na | na | na | 0 | na | 0 | na | 0 | 0 | na | na |
| EG13_NPC | na | na | na | na | na | na | na | 0 | na | 0 | na | 0 | 0 | na | na |
| EG13_L097 | 98.5 | O | 50.56 | 4.66 | 9.92 | 4.67 | 9.23 | 44 | 0.707 | 38 | 0.599 | 36 | 0.82 | 0.86 | 0.85 |
| EG13_L141 | 142.5 | O | 79.16 | 2.64 | 7.53 | 0.58 | 5.89 | 32 | 0.539 | 35 | 0.496 | 26 | 0.81 | 1.09 | 0.92 |
| EG13_L151 | 152.5 | M-O | 34.50 | 23.43 | 161.64 | 0.89 | 12.51 | 20 | 0.438 | 30 | 0.600 | 14 | 0.70 | 1.50 | 1.37 |
| EG13_L153 | 154.5 | M-O | 31.83 | 25.08 | 197.30 | 1.10 | 13.94 | 11 | 0.227 | 26 | 0.543 | 9 | 0.82 | 2.36 | 2.39 |
| EG13_L157 | 158.5 | M | 16.42 | 34.91 | 384.53 | 0.87 | 5.07 | 10 | 0.300 | 24 | 0.568 | 10 | 1.00 | 2.40 | 1.89 |
| EG13_L161 | 162.5 | M | 12.36 | 33.73 | 238.23 | 1.01 | 2.01 | 9 | 0.611 | 27 | 0.551 | 8 | 0.89 | 3.00 | 0.90 |
Material and Methods
Appendix A.7. Case Study A7—Improvement of DNA Extraction Methods for the Detection of Catchment Mammal DNA Signal
By Charline Giguet-Covex 2, Francesco Gentile Ficetola 14,15 and Pierre Taberlet 6,15
References
- Zeeb, B.A.; Smol, J.P. Chrysophyte Scales and Cysts. In Tracking Environmental Change Using Lake Sediments; Kluwer Academic Publishers: Dordrecht, The Netherlands, 2002; pp. 203–223. [Google Scholar]
- Bennion, H.; Battarbee, R.W.; Sayer, C.D.; Simpson, G.L.; Davidson, T.A. Defining Reference Conditions and Restoration Targets for Lake Ecosystems Using Palaeolimnology: A Synthesis. J. Paleolimnol. 2011, 45, 533–544. [Google Scholar] [CrossRef]
- Battarbee, R.W.; Morley, D.; Bennion, H.; Simpson, G.L.; Hughes, M.; Bauere, V. A Palaeolimnological Meta-Database for Assessing the Ecological Status of Lakes. J. Paleolimnol. 2011, 45, 405–414. [Google Scholar] [CrossRef]
- Seddon, A.W.R.; Mackay, A.W.; Baker, A.G.; Birks, H.J.B.; Breman, E.; Buck, C.E.; Ellis, E.C.; Froyd, C.A.; Gill, J.L.; Gillson, L.; et al. Looking Forward through the Past: Identification of 50 Priority Research Questions in Palaeoecology. J. Ecol. 2014, 102, 256–267. [Google Scholar] [CrossRef] [Green Version]
- Dearing, J.; Acma, B.; Bub, S.; Chambers, F.; Chen, X.; Cooper, J.; Crook, D.; Dong, X.; Dotterweich, M.; Edwards, M.; et al. Social-Ecological Systems in the Anthropocene: The Need for Integrating Social and Biophysical Records at Regional Scales. Anthr. Rev. 2015, 2, 220–246. [Google Scholar] [CrossRef]
- Väliranta, M.; Salonen, J.S.; Heikkilä, M.; Amon, L.; Helmens, K.; Klimaschewski, A.; Kuhry, P.; Kultti, S.; Poska, A.; Shala, S.; et al. Plant Macrofossil Evidence for an Early Onset of the Holocene Summer Thermal Maximum in Northernmost Europe. Nat. Commun. 2015, 6, 6809. [Google Scholar] [CrossRef] [Green Version]
- Herzschuh, U.; Birks, H.J.B.; Laepple, T.; Andreev, A.; Melles, M.; Brigham-Grette, J. Glacial Legacies on Interglacial Vegetation at the Pliocene-Pleistocene Transition in NE Asia. Nat. Commun. 2016, 7, 11967. [Google Scholar] [CrossRef] [Green Version]
- Kamerling, I.M.; Schofield, J.E.; Edwards, K.J.; Aronsson, K.-Å. High-Resolution Palynology Reveals the Land Use History of a Sami Renvall in Northern Sweden. Veg. Hist. Archaeobot. 2017, 26, 369–388. [Google Scholar] [CrossRef] [Green Version]
- Birks, H.J.B.; Berglund, B.E. One Hundred Years of Quaternary Pollen Analysis 1916–2016. Veg. Hist. Archaeobot. 2018, 27, 271–309. [Google Scholar] [CrossRef] [Green Version]
- Birks, H.H. Holocene Vegetational History and Climatic Change in West spitsbergen-Plant Macrofossils from Skardtjørna, an Arctic Lake. Holocene 1991, 1, 209–218. [Google Scholar] [CrossRef]
- Coolen, M.J.L.; Orsi, W.D.; Balkema, C.; Quince, C.; Harris, K.; Sylva, S.P.; Filipova-Marinova, M.; Giosan, L. Evolution of the Plankton Paleome in the Black Sea from the Deglacial to Anthropocene. Proc. Natl. Acad. Sci. USA 2013, 110, 8609–8614. [Google Scholar] [CrossRef] [PubMed] [Green Version]
- Castañeda, I.; Schouten, S. A Review of Molecular Organic Proxies for Examining Modern and Ancient Lacustrine Environments. Quat. Sci. Rev. 2011, 30, 2851–2891. [Google Scholar] [CrossRef]
- Domaizon, I.; Winegardner, A.; Capo, E.; Gauthier, J.; Gregory-Eaves, I. DNA-Based Methods in Paleolimnology: New Opportunities for Investigating Long-Term Dynamics of Lacustrine Biodiversity. J. Paleolimnol. 2017, 58, 1–21. [Google Scholar] [CrossRef]
- Parducci, L.; Bennett, K.D.; Ficetola, G.F.; Alsos, I.G.; Suyama, Y.; Wood, J.R.; Pedersen, M.W. Ancient Plant DNA in Lake Sediments. New Phytol. 2017, 214, 924–942. [Google Scholar] [CrossRef] [Green Version]
- Edwards, M.E. The Maturing Relationship between Quaternary Paleoecology and Ancient Sedimentary DNA. Quat. Res. 2020, 96, 39–47. [Google Scholar] [CrossRef]
- Rijal, D.P.; Heintzman, P.D.; Lammers, Y.; Yoccoz, N.G.; Lorberau, K.E.; Pitelkova, I.; Goslar, T.; Murguzur, F.J.A.; Salonen, J.S.; Helmens, K.F.; et al. Sedimentary Ancient DNA Shows Terrestrial Plant Richness Continuously Increased over the Holocene in Northern Fennoscandia. bioRxiv 2020. [Google Scholar] [CrossRef]
- Smith, C.I.; Chamberlain, A.T.; Riley, M.S.; Cooper, A.; Stringer, C.B.; Collins, M.J. Not Just Old but Old and Cold? Nature 2001, 410, 771–772. [Google Scholar] [CrossRef] [Green Version]
- Coolen, M.J.; Overmann, J. Analysis of Subfossil Molecular Remains of Purple Sulfur Bacteria in a Lake Sediment. Appl. Environ. Microbiol. 1998, 64, 4513–4521. [Google Scholar] [CrossRef] [Green Version]
- Anderson-Carpenter, L.L.; McLachlan, J.S.; Jackson, S.T.; Kuch, M.; Lumibao, C.Y.; Poinar, H.N. Ancient DNA from Lake Sediments: Bridging the Gap between Paleoecology and Genetics. BMC Evol. Biol. 2011, 11, 1–15. [Google Scholar] [CrossRef] [PubMed] [Green Version]
- Thomsen, P.F.; Kielgast, J.; Iversen, L.L.; Wiuf, C.; Rasmussen, M.; Gilbert, M.T.P.; Orlando, L.; Willerslev, E. Monitoring Endangered Freshwater Biodiversity Using Environmental DNA. Mol. Ecol. 2012, 21, 2565–2573. [Google Scholar] [CrossRef] [PubMed]
- Pedersen, M.W.; Overballe-Petersen, S.S.; Ermini, L.; Der Sarkissian, C.; Haile, J.; Hellstrom, M.; Spens, J.; Thomsen, P.F.; Bohmann, K.; Cappellini, E.; et al. Ancient and Modern Environmental DNA. Philos. Trans. R. Soc. Biol. Sci. 2015, 370, 20130383. [Google Scholar] [CrossRef] [Green Version]
- Armbrecht, L.H.; Coolen, M.J.L.; Lejzerowicz, F.; George, S.C.; Negandhi, K.; Suzuki, Y.; Young, J.; Foster, N.R.; Armand, L.K.; Cooper, A.; et al. Ancient DNA from Marine Sediments: Precautions and Considerations for Seafloor Coring, Sample Handling and Data Generation. Earth-Sci. Rev. 2019, 196, 102887. [Google Scholar] [CrossRef]
- Pedersen, M.W.; Ginolhac, A.; Orlando, L.; Olsen, J.; Andersen, K.; Holm, J.; Funder, S.; Willerslev, E.; Kjær, K.H. A Comparative Study of Ancient Environmental DNA to Pollen and Macrofossils from Lake Sediments Reveals Taxonomic Overlap and Additional Plant Taxa. Quat. Sci. Rev. 2013, 75, 161–168. [Google Scholar] [CrossRef]
- Alsos, I.G.; Sjögren, P.; Edwards, M.E.; Landvik, J.Y.; Gielly, L.; Forwick, M.; Coissac, E.; Brown, A.G.; Jakobsen, L.V.; Føreid, M.K.; et al. Sedimentary Ancient DNA from Lake Skartjørna, Svalbard: Assessing the Resilience of Arctic Flora to Holocene Climate Change. Holocene 2016, 26, 627–642. [Google Scholar] [CrossRef] [Green Version]
- Alsos, I.G.; Sjögren, P.; Brown, A.G.; Gielly, L.; Merkel, M.K.F.; Paus, A.; Lammers, Y.; Edwards, M.E.; Alm, T.; Leng, M.; et al. Last Glacial Maximum Environmental Conditions at Andøya, Northern Norway; Evidence for a Northern Ice-Edge Ecological “Hotspot”. Quat. Sci. Rev. 2020, 239, 106364. [Google Scholar] [CrossRef]
- Clarke, C.L.; Edwards, M.E.; Brown, A.G.; Gielly, L.; Lammers, Y.; Heintzman, P.D.; Ancin-Murguzur, F.J.; Bråthen, K.A.; Goslar, T.; Alsos, I.G. Holocene Floristic Diversity and Richness in Northeast Norway Revealed by sedimentary ancient dna (sedadna) and Pollen. Boreas 2019. [Google Scholar] [CrossRef] [Green Version]
- Clarke, C.L.; Alsos, I.G.; Edwards, M.E.; Paus, A.; Gielly, L.; Haflidason, H.; Mangerud, J.; Regnéll, C.; Hughes, P.D.M.; Svendsen, J.I.; et al. A 24,000-Year Ancient DNA and Pollen Record from the Polar Urals Reveals Temporal Dynamics of Arctic and Boreal Plant Communities. Quat. Sci. Rev. 2020, 247, 106564. [Google Scholar] [CrossRef]
- Parducci, L.; Matetovici, I.; Fontana, S.L.; Bennett, K.D.; Suyama, Y.; Haile, J.; Kjaer, K.H.; Larsen, N.K.; Drouzas, A.D.; Willerslev, E. Molecular- and Pollen-Based Vegetation Analysis in Lake Sediments from Central Scandinavia. Mol. Ecol. 2013, 22, 3511–3524. [Google Scholar] [CrossRef]
- Parducci, L.; Alsos, I.G.; Unneberg, P.; Pedersen, M.W.; Han, L.; Lammers, Y.; Salonen, J.S.; Väliranta, M.M.; Slotte, T.; Wohlfarth, B. Shotgun Environmental DNA, Pollen, and Macrofossil Analysis of Lateglacial Lake Sediments from Southern Sweden. Front. Ecol. Evol. 2019, 7. [Google Scholar] [CrossRef] [Green Version]
- Niemeyer, B.; Epp, L.S.; Stoof-Leichsenring, K.R.; Pestryakova, L.A.; Herzschuh, U. A Comparison of Sedimentary DNA and Pollen from Lake Sediments in Recording Vegetation Composition at the Siberian Treeline. Mol. Ecol. Resour. 2017, 17, e46–e62. [Google Scholar] [CrossRef] [PubMed]
- Giguet-Covex, C.; Pansu, J.; Arnaud, F.; Rey, P.-J.; Griggo, C.; Gielly, L.; Domaizon, I.; Coissac, E.; David, F.; Choler, P.; et al. Long Livestock Farming History and Human Landscape Shaping Revealed by Lake Sediment DNA. Nat. Commun. 2014, 5, 3211. [Google Scholar] [CrossRef] [Green Version]
- Pansu, J.; Giguet-Covex, C.; Ficetola, G.F.; Gielly, L.; Boyer, F.; Zinger, L.; Arnaud, F.; Poulenard, J.; Taberlet, P.; Choler, P. Reconstructing Long-Term Human Impacts on Plant Communities: An Ecological Approach Based on Lake Sediment DNA. Mol. Ecol. 2015, 24, 1485–1498. [Google Scholar] [CrossRef] [PubMed]
- Graham, R.W.; Belmecheri, S.; Choy, K.; Culleton, B.J.; Davies, L.J.; Froese, D.; Heintzman, P.D.; Hritz, C.; Kapp, J.D.; Newsom, L.A.; et al. Timing and Causes of Mid-Holocene Mammoth Extinction on St. Paul Island, Alaska. Proc. Natl. Acad. Sci. USA 2016, 113, 9310–9314. [Google Scholar] [CrossRef] [Green Version]
- Capo, E.; Debroas, D.; Arnaud, F.; Perga, M.-E.; Chardon, C.; Domaizon, I. Tracking a Century of Changes in Microbial Eukaryotic Diversity in Lakes Driven by Nutrient Enrichment and Climate Warming. Environ. Microbiol. 2017, 19, 2873–2892. [Google Scholar] [CrossRef] [Green Version]
- Ficetola, G.F.; Poulenard, J.; Sabatier, D.; Messager, E.; Gielly, L.; Leloup, A.; Etienne, D.; Bakke, J.; Malet, E.; Fanget, B.; et al. DNA from lake sediments reveals long-term ecosystem changes after a biological invasion. Sci. Adv. 2018, 4, eaar4292. [Google Scholar] [CrossRef] [Green Version]
- Kyle, M.; Haande, S.; Ostermaier, V.; Rohrlack, T. The Red Queen Race between Parasitic Chytrids and Their Host, Planktothrix: A Test Using a Time Series Reconstructed from Sediment DNA. PLoS ONE 2015, 10, e0118738. [Google Scholar] [CrossRef] [Green Version]
- Kyle, M.; Haande, S.; Sønstebø, J.; Rohrlack, T. Amplification of DNA in Sediment Cores to Detect Historic Planktothrix Occurrence in Three Norwegian Lakes. J. Paleolimnol. 2015, 53, 61–72. [Google Scholar] [CrossRef]
- Ibrahim, A.; Capo, E.; Wessels, M.; Martin, I.; Meyer, A.; Schleheck, D.; Epp, L.S. Anthropogenic Impact on the Historical Phytoplankton Community of Lake Constance Reconstructed by Multimarker Analysis of Sediment-Core Environmental DNA. Mol. Ecol. 2020, 1–17. [Google Scholar] [CrossRef]
- Giguet-Covex, C.; Ficetola, G.F.; Walsh, K.; Poulenard, J.; Bajard, M.; Fouinat, L.; Sabatier, P.; Gielly, L.; Messager, E.; Develle, A.L.; et al. New Insights on Lake Sediment DNA from the Catchment: Importance of Taphonomic and Analytical Issues on the Record Quality. Sci. Rep. 2019, 9, 1–21. [Google Scholar] [CrossRef] [PubMed]
- Savichtcheva, O.; Debroas, D.; Perga, M.-E.E.; Arnaud, F.; Villar, C.; Lyautey, E.; Kirkham, A.; Chardon, C.; Alric, B.; Domaizon, I. Effects of Nutrients and Warming on Planktothrix Dynamics and Diversity: A Palaeolimnological View Based on Sedimentary DNA and RNA. Freshw. Biol. 2015, 60, 31–49. [Google Scholar] [CrossRef]
- Giosan, L.; Coolen, M.J.L.; Kaplan, J.O.; Constantinescu, S.; Filip, F.; Filipova-Marinova, M.; Kettner, A.J.; Thom, N. Early Anthropogenic Transformation of the Danube-Black Sea System. Sci. Rep. 2012, 2, 1–6. [Google Scholar] [CrossRef] [PubMed] [Green Version]
- Giosan, L.; Orsi, W.D.; Coolen, M.; Wuchter, C.; Dunlea, A.G.; Thirumalai, K.; Munoz, S.E.; Clift, P.D.; Donnelly, J.P.; Galy, V.; et al. Neoglacial Climate Anomalies and the Harappan Metamorphosis. Clim. Past 2018, 14, 1669–1686. [Google Scholar] [CrossRef] [Green Version]
- Willerslev, E.; Hansen, A.J.; Binladen, J.; Brand, T.B.; Gilbert, M.T.P.; Shapiro, B.; Bunce, M.; Wiuf, C.; Gilichinsky, D.A.; Cooper, A. Diverse Plant and Animal Genetic Records from Holocene and Pleistocene Sediments. Science 2003, 300, 791–795. [Google Scholar] [CrossRef] [Green Version]
- Willerslev, E.; Cappellini, E.; Boomsma, W.; Nielsen, R.; Hebsgaard, M.B.; Brand, T.B.; Hofreiter, M.; Bunce, M.; Poinar, H.N.; Dahl-Jensen, D.; et al. Ancient Biomolecules from Deep Ice Cores Reveal a Forested Southern Greenland. Science 2007, 317, 111–114. [Google Scholar] [CrossRef] [Green Version]
- Epp, L.S.; Gussarova, G.; Boessenkool, S.; Olsen, J.; Haile, J.; Schrøder-Nielsen, A.; Ludikova, A.; Hassel, K.; Stenøien, H.K.; Funder, S.; et al. Lake Sediment Multi-Taxon DNA from North Greenland Records Early Post-Glacial Appearance of Vascular Plants and Accurately Tracks Environmental Changes. Quat. Sci. Rev. 2015, 117, 152–163. [Google Scholar] [CrossRef] [Green Version]
- Epp, L.S.; Kruse, S.; Kath, N.J.; Stoof-Leichsenring, K.R.; Tiedemann, R.; Pestryakova, L.A.; Herzschuh, U. Temporal and Spatial Patterns of Mitochondrial Haplotype and Species Distributions in Siberian Larches Inferred from Ancient Environmental DNA and Modeling. Sci. Rep. 2018, 8, 17436. [Google Scholar] [CrossRef]
- Clarke, C.L.; Edwards, M.E.; Gielly, L.; Ehrich, D.; Hughes, P.D.M.; Morozova, L.M.; Haflidason, H.; Mangerud, J.; Svendsen, J.I.; Alsos, I.G. Persistence of Arctic-Alpine Flora during 24,000 Years of Environmental Change in the Polar Urals. Sci. Rep. 2019, 9, 19613. [Google Scholar] [CrossRef] [Green Version]
- Crump, S.E.; Miller, G.H.; Power, M.; Sepúlveda, J.; Dildar, N.; Coghlan, M.; Bunce, M. Arctic Shrub Colonization Lagged Peak Postglacial Warmth: Molecular Evidence in Lake Sediment from Arctic Canada. Glob. Chang. Biol. 2019, 25, 4244–4256. [Google Scholar] [CrossRef] [PubMed]
- Voldstad, L.H.; Alsos, I.G.; Farnsworth, W.R.; Heintzman, P.D.; Håkansson, L.; Kjellman, S.E.; Rouillard, A.; Schomacker, A.; Eidesen, P.B. A Complete Holocene Lake Sediment Ancient DNA Record Reveals Long-Standing High Arctic Plant Diversity Hotspot in Northern Svalbard. Quat. Sci. Rev. 2020, 234. [Google Scholar] [CrossRef]
- Willerslev, E.; Davison, J.; Moora, M.; Zobel, M.; Coissac, E.; Edwards, M.E.; Lorenzen, E.D.; Vestergård, M.; Gussarova, G.; Haile, J.; et al. Fifty Thousand Years of Arctic Vegetation and Megafaunal Diet. Nature 2014, 506, 47–51. [Google Scholar] [CrossRef] [PubMed] [Green Version]
- Bajard, M.; Poulenard, J.; Sabatier, P.; Develle, A.-L.; Giguet-Covex, C.; Jacob, J.; Crouzet, C.; David, F.; Pignol, C.; Arnaud, F. Progressive and Regressive Soil Evolution Phases in the Anthropocene. Catena 2017, 150, 39–52. [Google Scholar] [CrossRef] [Green Version]
- Boessenkool, S.; Mcglynn, G.; Epp, L.S.; Taylor, D.; Pimentel, M.; Gizaw, A.; Nemomissa, S.; Brochmann, C.; Popp, M. Use of Ancient Sedimentary DNA as a Novel Conservation Tool for High-Altitude Tropical Biodiversity. Conserv. Biol. 2014, 28, 446–455. [Google Scholar] [CrossRef]
- Bremond, L.; Favier, C.; Ficetola, G.F.; Tossou, M.G.; Akouégninou, A.; Gielly, L.; Giguet-Covex, C.; Oslisly, R.; Salzmann, U. Five Thousand Years of Tropical Lake Sediment DNA Records from Benin. Quat. Sci. Rev. 2017, 170, 203–211. [Google Scholar] [CrossRef]
- Dommain, R.; Andama, M.; McDonough, M.M.; Prado, N.A.; Goldhammer, T.; Potts, R.; Maldonado, J.E.; Nkurunungi, J.B.; Campana, M.G. The Challenges of Reconstructing Tropical Biodiversity with Sedimentary Ancient DNA: A 2200-Year-Long Metagenomic Record from Bwindi Impenetrable Forest, Uganda. Front. Ecol. Evol. 2020, 8. [Google Scholar] [CrossRef]
- Behre, K. The Interpretation of Anthropogenic Indicators in Pollen Diagrams. Pollen Spores 1981, 23, 225–244. [Google Scholar]
- Madeja, J.; Wacnik, A.; Wypasek, E.; Chandran, A.; Stanjiewicz, E. Integrated Palynological and Molecular Analyses of Late Holocene Deposits from Lake Miłkowskie (NE Poland): Verification of Local Human Impact on Environment. Quat. Int. 2010, 220, 147–152. [Google Scholar] [CrossRef]
- Madeja, J.; Wacnik, A.; Et, A. Bacterial Ancient DNA as an Indicator of Human Presence in the Past: Its Correlation with Palynological and Archaeological Data. J. Quat. Sci. 2009, 22, 311–320. [Google Scholar] [CrossRef]
- Bajard, M.; Poulenard, J.; Sabatier, P.; Etienne, D.; Ficetola, F.; Chen, W.; Gielly, L.; Taberlet, P.; Develle, A.-L.; Rey, P.-J.; et al. Long-Term Changes in Alpine Pedogenetic Processes: Effect of Millennial Agro-Pastoralism Activities (French-Italian Alps). Geoderma 2017, 306, 217–236. [Google Scholar] [CrossRef] [Green Version]
- Bajard, M.; Poulenard, J.; Sabatier, P.; Bertrand, Y.; Crouzet, C.; Ficetola, G.F.; Blanchet, C.; Messager, E.; Giguet-Covex, C.; Gielly, L.; et al. Pastoralism Increased Vulnerability of a Subalpine Catchment to Flood Hazard through Changing Soil Properties. Palaeogeogr. Palaeoclimatol. Palaeoecol. 2020, 538, 109462. [Google Scholar] [CrossRef]
- Sabatier, P.; Wilhelm, B.; Ficetola, G.F.; Moiroux, F.; Poulenard, J.; Develle, A.-L.; Bichet, A.; Chen, W.; Pignol, C.; Reyss, J.-L.; et al. 6-Kyr Record of Flood Frequency and Intensity in the Western Mediterranean Alps—Interplay of Solar and Temperature Forcing. Quat. Sci. Rev. 2017, 170, 121–135. [Google Scholar] [CrossRef]
- Walsh, K.; Giguet-Covex, C. A History of Human Exploitation of Alpine Regions. In Reference Module in Earth Systems and Environmental Sciences; Elsevier: Amsterdam, The Netherlands, 2019; pp. 1–3. ISBN 9780124095489. [Google Scholar]
- Pedersen, M.W.; Ruter, A.; Schweger, C.; Friebe, H.; Staff, R.A.; Kjeldsen, K.K.; Mendoza, M.L.Z.; Beaudoin, A.B.; Zutter, C.; Larsen, N.K.; et al. Postglacial Viability and Colonization in North America’s Ice-Free Corridor. Nature 2016, 537, 45–49. [Google Scholar] [CrossRef]
- Moore, C.R.; Brooks, M.J.; Goodyear, A.C.; Ferguson, T.A.; Perrotti, A.G.; Mitra, S.; Listecki, A.M.; King, B.C.; Mallinson, D.J.; Lane, C.S.; et al. Sediment Cores from White Pond, South Carolina, Contain a Platinum Anomaly, Pyrogenic Carbon Peak, and Coprophilous Spore Decline at 12.8 Ka. Sci. Rep. 2019, 9, 15121. [Google Scholar] [CrossRef] [PubMed] [Green Version]
- Lammers, Y.; Clarke, C.L.; Erséus, C.; Brown, A.G.; Edwards, M.E.; Gielly, L.; Haflidason, H.; Mangerud, J.; Rota, E.; Svendsen, J.I.; et al. Clitellate Worms (Annelida) in Lateglacial and Holocene Sedimentary DNA Records from the Polar Urals and Northern Norway. Boreas 2018, 48, 317–329. [Google Scholar] [CrossRef]
- Keck, F.; Millet, L.; Debroas, D.; Etienne, D.; Galop, D.; Rius, D.; Domaizon, I. Assessing the Response of Micro-Eukaryotic Diversity to the Great Acceleration Using Lake Sedimentary DNA. Nat. Commun. 2020, 11, 1–8. [Google Scholar] [CrossRef]
- Coolen, M.J.L.; Hopmans, E.C.; Rijpstra, W.I.C.; Muyzer, G.; Schouten, S.; Volkman, J.K.; Sinninghe Damsté, J.S. Evolution of the Methane Cycle in Ace Lake (Antarctica) during the Holocene: Response of Methanogens and Methanotrophs to Environmental Change. Org. Geochem. 2004, 35, 1151–1167. [Google Scholar] [CrossRef]
- Coolen, M.J.L.; Muyzer, G.; Rijpstra, W.I.C.; Schouten, S.; Volkman, J.K.; Sinninghe Damsté, J.S. Combined DNA and Lipid Analyses of Sediments Reveal Changes in Holocene Haptophyte and Diatom Populations in an Antarctic Lake. Earth Planet. Sci. Lett. 2004, 223, 225–239. [Google Scholar] [CrossRef]
- Coolen, M.J.L.; Talbot, H.M.; Abbas, B.A.; Ward, C.; Schouten, S.; Volkman, J.K.; Damsté, J.S.S. Sources for Sedimentary Bacteriohopanepolyols as Revealed by 16S rDNA Stratigraphy. Environ. Microbiol. 2008, 10, 1783–1803. [Google Scholar] [CrossRef]
- Boere, A.C.; Abbas, B.; Rijpstra, W.I.C.; Versteegh, G.J.M.; Volkman, J.K.; Sinninghe Damsté, J.S.; Coolen, M.J.L. Late-Holocene Succession of Dinoflagellates in an Antarctic Fjord Using a Multi-Proxy Approach: Paleoenvironmental Genomics, Lipid Biomarkers and Palynomorphs. Geobiology 2009, 7, 265–281. [Google Scholar] [CrossRef]
- Domaizon, I.; Savichtcheva, O.; Debroas, D.; Arnaud, F.; Villar, C.; Pignol, C.; Alric, B.; Perga, M.E. DNA from Lake Sediments Reveals the Long-Term Dynamics and Diversity of Synechococcus Assemblages. Biogeosci. Discuss. 2013, 10, 2515–2564. [Google Scholar] [CrossRef]
- Hou, W.; Dong, H.; Li, G.; Yang, J.; Coolen, M.J.L.; Liu, X.; Wang, S.; Jiang, H.; Wu, X.; Xiao, H.; et al. Identification of Photosynthetic Plankton Communities Using Sedimentary Ancient DNA and Their Response to Late-Holocene Climate Change on the Tibetan Plateau. Sci. Rep. 2014, 4, 6648. [Google Scholar] [CrossRef] [Green Version]
- Randlett, M.-È.; Coolen, M.J.L.; Stockhecke, M.; Pickarski, N.; Litt, T.; Balkema, C.; Kwiecien, O.; Tomonaga, Y.; Wehrli, B.; Schubert, C.J. Alkenone Distribution in Lake Van Sediment over the Last 270 Ka: Influence of Temperature and Haptophyte Species Composition. Quat. Sci. Rev. 2014, 104, 53–62. [Google Scholar] [CrossRef]
- Monchamp, M.E.; Walser, J.C.; Pomati, F.; Spaak, P. Sedimentary DNA Reveals Cyanobacterial Community Diversity over 200 Years in Two Perialpine Lakes. Appl. Environ. Microbiol. 2016, 82, 6472–6482. [Google Scholar] [CrossRef] [Green Version]
- Monchamp, M.E.; Spaak, P.; Domaizon, I.; Dubois, N.; Bouffard, D.; Pomati, F. Homogenization of Lake Cyanobacterial Communities over a Century of Climate Change and Eutrophication. Nat. Ecol. Evol. 2018, 2, 317–324. [Google Scholar] [CrossRef] [Green Version]
- Monchamp, M.E.; Spaak, P.; Pomati, F. Long Term Diversity and Distribution of Non-Photosynthetic Cyanobacteria in Peri-Alpine Lakes. Front. Microbiol. 2019, 9, 3344. [Google Scholar] [CrossRef] [PubMed] [Green Version]
- Capo, E.; Debroas, D.; Arnaud, F.; Guillemot, T.; Bichet, V.; Millet, L.; Gauthier, E.; Massa, C.; Develle, A.-L.; Pignol, C.; et al. Long-Term Dynamics in Microbial Eukaryotes Communities: A Palaeolimnological View Based on Sedimentary DNA. Mol. Ecol. 2016, 25, 5925–5943. [Google Scholar] [CrossRef] [PubMed]
- Tse, T.J.; Doig, L.E.; Tang, S.; Zhang, X.; Sun, W.; Wiseman, S.B.; Feng, C.X.; Liu, H.; Giesy, J.P.; Hecker, M.; et al. Combining High-Throughput Sequencing of sedaDNA and Traditional Paleolimnological Techniques to Infer Historical Trends in Cyanobacterial Communities. Environ. Sci. Technol. 2018, 52, 6842–6853. [Google Scholar] [CrossRef] [PubMed]
- Kisand, V.; Talas, L.; Kisand, A.; Stivrins, N.; Reitalu, T.; Alliksaar, T.; Vassiljev, J.; Liiv, M.; Heinsalu, A.; Seppä, H.; et al. From microbial eukaryotes to metazoan vertebrates: Wide spectrum paleo-diversity in sedimentary ancient DNA over the last ~14,500 years. Geobiology 2018, 16, 628–639. [Google Scholar] [CrossRef]
- More, K.D.; Orsi, W.D.; Galy, V.; Giosan, L.; He, L.; Grice, K.; Coolen, M.J.L. A 43 Kyr Record of Protist Communities and Their Response to Oxygen Minimum Zone Variability in the Northeastern Arabian Sea. Earth Planet. Sci. Lett. 2018, 496, 248–256. [Google Scholar] [CrossRef]
- Garner, R.E.; Gregory-Eaves, I.; Walsh, D.A. Sediment Metagenomes as Time Capsules of Lake Microbiomes. mSphere 2020, 5, 1–15. [Google Scholar] [CrossRef]
- Lammers, Y.; Heintzman, P.D.; Alsos, I.G. Environmental Palaeogenomic Reconstruction of an Ice Age Algal Population. bioRxiv 2020. [Google Scholar] [CrossRef] [Green Version]
- Alsos, I.G.; Lammers, Y.; Yoccoz, N.G.; Jørgensen, T.; Sjögren, P.; Gielly, L.; Edwards, M.E. Plant DNA Metabarcoding of Lake Sediments: How Does It Represent the Contemporary Vegetation. PLoS ONE 2018, 13, e0195403. [Google Scholar] [CrossRef] [PubMed]
- Epp, L.S.; Stoof, K.R.; Trauth, M.H.; Tiedemann, R. Historical Genetics on a Sediment Core from a Kenyan Lake: Intraspecific Genotype Turnover in a Tropical Rotifer is Related to Past Environmental Changes. J. Paleolimnol. 2010, 43, 939–954. [Google Scholar] [CrossRef]
- Monchamp, M.E.; Enache, I.; Turko, P.; Pomati, F.; Rîşnoveanu, G.; Spaak, P. Sedimentary and Egg-Bank DNA from 3 European Lakes Reveal Concurrent Changes in the Composition and Diversity of Cyanobacterial and Daphnia Communities. Hydrobiologia 2017, 800, 155–172. [Google Scholar] [CrossRef]
- Olajos, F.; Bokma, F.; Bartels, P.; Myrstener, E.; Rydberg, J.; Öhlund, G.; Bindler, R.; Wang, X.R.; Zale, R.; Englund, G. Estimating Species Colonization Dates Using DNA in Lake Sediment. Methods Ecol. Evol. 2018, 9, 535–543. [Google Scholar] [CrossRef]
- Nelson-Chorney, H.T.; Davis, C.S.; Poesch, M.S.; Vinebrooke, R.D.; Carli, C.M.; Taylor, M.K. Environmental DNA in Lake Sediment Reveals Biogeography of Native Genetic Diversity. Front. Ecol. Environ. 2019, 17, 313–318. [Google Scholar] [CrossRef]
- Kuwae, M.; Tamai, H.; Doi, H.; Sakata, M.K.; Minamoto, T.; Suzuki, Y. Sedimentary DNA Tracks Decadal-Centennial Changes in Fish Abundance. Commun. Biol. 2020, 3, 1–12. [Google Scholar] [CrossRef]
- Coolen, M.J.L. 7000 Years of Emiliania Huxleyi Viruses in the Black SEA. Science. 2011, 333, 451–452. [Google Scholar] [CrossRef] [PubMed]
- Pilon, S.; Zastepa, A.; Taranu, Z.E.; Gregory-Eaves, I.; Racine, M.; Blais, J.M.; Poulain, A.J.; Pick, F.R. Contrasting Histories of Microcystin-Producing Cyanobacteria in Two Temperate Lakes as Inferred from Quantitative Sediment DNA Analyses. Lake Reserv. Manag. 2019, 35, 102–117. [Google Scholar] [CrossRef]
- Konkel, R.; Toruńska-Sitarz, A.; Cegłowska, M.; Ežerinskis, Ž.; Šapolaitė, J.; Mažeika, J.; Mazur-Marzec, H. Blooms of Toxic Cyanobacterium Nodularia Spumigena in Norwegian Fjords during Holocene Warm Periods. Toxins (Basel) 2020, 12, 257. [Google Scholar] [CrossRef]
- Yang, J.; Jiang, H.; Dong, H.; Hou, W.; Li, G.; Wu, G. Sedimentary Archaeal amoA Gene Abundance Reflects Historic Nutrient Level and Salinity Fluctuations in Qinghai Lake, Tibetan Plateau. Sci. Rep. 2015, 5, 1–9. [Google Scholar] [CrossRef] [Green Version]
- Poulain, A.J.; Aris-Brosou, S.; Blais, J.M.; Brazeau, M.; Keller, W.B.; Paterson, A.M. Microbial DNA Records Historical Delivery of Anthropogenic Mercury. ISME J. 2015, 9, 2541–2550. [Google Scholar] [CrossRef] [Green Version]
- Ruuskanen, M.O.; Aris-Brosou, S.; Poulain, A.J. Swift Evolutionary Response of Microbes to a Rise in Anthropogenic Mercury in the Northern Hemisphere. ISME J. 2020, 14, 788–800. [Google Scholar] [CrossRef] [Green Version]
- Belle, S.; Parent, C.; Frossard, V.; Verneaux, V.; Millet, L.; Chronopoulou, P.-M.; Sabatier, P.; Magny, M. Temporal Changes in the Contribution of Methane-Oxidizing Bacteria to the Biomass of Chironomid Larvae Determined Using Stable Carbon Isotopes and Ancient DNA. J. Paleolimnol. 2014, 52, 215–228. [Google Scholar] [CrossRef] [Green Version]
- Belle, S.; Verneaux, V.; Millet, L.; Parent, C.; Magny, M. A Case Study of the Past CH4 Cycle in Lakes by the Combined Use of Dual Isotopes (Carbon and Hydrogen) and Ancient DNA of Methane-Oxidizing Bacteria: Rearing Experiment and Application to Lake Remoray (Eastern France). Aquat. Ecol. 2015, 49, 279–291. [Google Scholar] [CrossRef]
- Belle, S.; Millet, L.; Verneaux, V.; Lami, A.; David, E.; Murgia, L.; Parent, C.; Musazzi, S.; Gauthier, E.; Bichet, V.; et al. 20Th Century Human Pressures Drive Reductions in Deepwater Oxygen Leading to Losses of Benthic Methane-Based Food Webs. Quat. Sci. Rev. 2016, 137, 209–220. [Google Scholar] [CrossRef]
- Belle, S.; Parent, C. Reconstruction of Past Dynamics of Methane-Oxidizing Bacteria in Lake Sediments Using a Quantitative PCR Method: Connecting Past Environmental Changes and Microbial Community. Geomicrobiol. J. 2019, 36, 570–579. [Google Scholar] [CrossRef]
- Barnes, M.A.; Turner, C.R.; Jerde, C.L.; Renshaw, M.A.; Chadderton, W.L.; Lodge, D.M. Environmental Conditions Influence eDNA Persistence in Aquatic Systems. Environ. Sci. Technol. 2014, 48, 1819–1827. [Google Scholar] [CrossRef]
- Barnes, M.A.; Turner, C.R. The Ecology of Environmental DNA and Implications for Conservation Genetics. Conserv. Genet. 2016, 17, 1–17. [Google Scholar] [CrossRef] [Green Version]
- Coolen, M.J.L.; Gibson, J.A.E. Ancient DNA in lake Sediment Records. Pages News 2009, 17, 104–106. [Google Scholar] [CrossRef]
- Kanbar, H.J.; Olajos, F.; Englund, G.; Holmboe, M. Geochemical Identification of Potential DNA-Hotspots and DNA-Infrared Fingerprints in Lake Sediments. Appl. Geochem. 2020, 122, 104728. [Google Scholar] [CrossRef]
- Freeman, C.L.; Dieudonné, L.; Collins, M.J.; Sand, K.K. Survival of Environmental DNA in Natural Environments: Surface Charge and Topography of Minerals as DRIVER FOR DNA STORage. bioRxiv 2020. [Google Scholar] [CrossRef]
- Torti, A.; Alexander, M.; Barker, B. Marine Genomics Origin, Dynamics, and Implications of Extracellular DNA Pools in Marine Sediments. Mar. Genomics 2015, 24, 185–196. [Google Scholar] [CrossRef]
- Vuillemin, A.; Friese, A.; Alawi, M.; Henny, C.; Nomosatryo, S.; Wagner, D.; Crowe, S.A.; Kallmeyer, J. Geomicrobiological Features of Ferruginous Sediments from Lake Towuti, Indonesia. Front. Microbiol. 2016, 7, 1–16. [Google Scholar] [CrossRef] [PubMed]
- Stoof-Leichsenring, K.R.; Epp, L.S.; Trauth, M.H.; Tiedemann, R. Hidden Diversity in Diatoms of Kenyan Lake Naivasha: A genetic Approach Detects Temporal Variation. Mol. Ecol. 2012, 21, 1918–1930. [Google Scholar] [CrossRef]
- Lejzerowicz, F.; Esling, P.; Majewski, W.; Szczuciński, W.; Decelle, J.; Obadia, C.; Arbizu, P.M.; Pawlowski, J. Ancient DNA Complements Microfossil Record in Deep-Sea Subsurface Sediments. Biol. Lett. 2013, 9, 20130283. [Google Scholar] [CrossRef] [PubMed] [Green Version]
- Capo, E.; Domaizon, I.; Maier, D.; Debroas, D.; Bigler, C. To What Extent Is the DNA of Microbial Eukaryotes Modified during Burying into Lake Sediments? A Repeat-Coring Approach on Annually Laminated Sediments. J. Paleolimnol. 2017, 58, 479–495. [Google Scholar] [CrossRef]
- Dell’Anno, A.; Danovaro, R. Extracellular DNA Plays a Key Role in deep-Sea Ecosystem Functioning. Science 2005, 309, 2179. [Google Scholar] [CrossRef]
- Dabney, J.; Meyer, M.; Pääbo, S. Ancient DNA Damage. Cold Spring Harb. Perspect. Biol. 2013, 5, a012567. [Google Scholar] [CrossRef]
- Kirkpatrick, J.B.; Walsh, E.A.; D’Hondt, S. Fossil DNA Persistence and Decay in Marine Sediment over Hundred-Thousand-Year to Million-Year Time Scales. Geology 2016, 44, 615–618. [Google Scholar] [CrossRef] [Green Version]
- Lindahl, T. Instability and Decay of the Primary Structure of DNA. Nature 1993, 362, 709–715. [Google Scholar] [CrossRef]
- Renaud, G.; Schubert, M.; Sawyer, S.; Orlando, L. Authentication and Assessment of Contamination in Ancient DNA. Methods Mol. Biol. Anc. DNA 2019, 1963, 163–194. [Google Scholar]
- Willerslev, E.; Cooper, A. Ancient DNA. Proc. R. Soc. B 2005, 272, 3–16. [Google Scholar] [CrossRef] [PubMed] [Green Version]
- Orlando, L.; Cooper, A. Using Ancient DNA to Understand Evolutionary and Ecological Processes. Annu. Rev. Ecol. Evol. Syst. 2014, 45, 573–598. [Google Scholar] [CrossRef]
- Cappellini, E.; Prohaska, A.; Racimo, F.; Welker, F.; Pedersen, M.W.; Allentoft, M.E.; de Barros Damgaard, P.; Gutenbrunner, P.; Dunne, J.; Hammann, S.; et al. Ancient Biomolecules and Evolutionary Inference. Annu. Rev. Biochem. 2018, 87, 1029–1060. [Google Scholar] [CrossRef] [Green Version]
- Coolen, M.J.L.; Boere, A.; Abbas, B.; Baas, M.; Wakeham, S.G.; Sinninghe Damsté, J.S. Ancient DNA Derived from Alkenone-Biosynthesizing Haptophytes and Other Algae in Holocene Sediments from the Black SEA. Paleoceanography 2006, 21, 1–17. [Google Scholar] [CrossRef] [Green Version]
- Zinger, L.; Bonin, A.; Alsos, I.G.; Bálint, M.; Bik, H.; Boyer, F.; Chariton, A.A.; Creer, S.; Coissac, E.; Deagle, B.E.; et al. DNA Metabarcoding—Need for Robust Experimental Designs to Draw Sound Ecological Conclusions. Mol. Ecol. 2019, 28, 1857–1862. [Google Scholar] [CrossRef] [Green Version]
- Ahmed, E.; Parducci, L.; Unneberg, P.; Ågren, R.; Schenk, F.; Rattray, J.E.; Han, L.; Muschitiello, F.; Pedersen, M.W.; Smittenberg, R.H.; et al. Archaeal Community Changes in Lateglacial Lake Sediments: Evidence from Ancient DNA. Quat. Sci. Rev. 2018, 181, 19–29. [Google Scholar] [CrossRef]
- Sjögren, P.; Edwards, M.E.; Gielly, L.; Langdon, C.T.; Croudace, I.W.; Merkel, M.K.F.; Fonville, T.; Alsos, I.G. Lake Sedimentary DNA Accurately Records 20th Century Introductions of Exotic Conifers in Scotland. New Phytol. 2017, 213, 929–941. [Google Scholar] [CrossRef] [PubMed] [Green Version]
- Capo, E.; Debroas, D.; Arnaud, F.; Domaizon, I. Is Planktonic Diversity Well Recorded in Sedimentary DNA? Toward the Reconstruction of Past Protistan Diversity. Microb. Ecol. 2015, 70, 865–875. [Google Scholar] [CrossRef]
- Brett, M.; Müller-Navarra, D. The Role of Highly Unsaturated Fatty Acids in Aquatic Foodweb Processes. Freshw. Biol. 1997, 38, 483–499. [Google Scholar] [CrossRef]
- Johnson, M.D.; Beaudoin, D.J.; Frada, M.J.; Brownlee, E.F.; Stoecker, D.K. High Grazing Rates on Cryptophyte Algae in Chesapeake Bay. Front. Mar. Sci. 2018, 5, 241. [Google Scholar] [CrossRef]
- Bissett, A.; Gibson, J.; Jarman, S.; Swadling, K.; Cromer, L. Isolation, Amplification, and Identification of Ancient Copepod DNA from Lake Sediments. Limnol. Oceanogr. Methods 2005, 3, 533–542. [Google Scholar] [CrossRef] [Green Version]
- Birks, H.J.B.; Birks, H.H. How Have Studies of Ancient DNA from Sediments Contributed to the Reconstruction of Quaternary Floras? New Phytol. 2016, 209, 499–506. [Google Scholar] [CrossRef] [Green Version]
- Parducci, L.; Väliranta, M.; Sakari Salonen, J.; Ronkainen, T.; Matetovici, I.; Fontana, S.L.; Eskola, T.; Sarala, P.; Suyama, Y. Proxy Comparison in Ancient Peat Sediments: Pollen, Macrofossil and Plant DNA. Philos. Trans. R. Soc. B Biol. Sci. 2015, 370, 20130382. [Google Scholar] [CrossRef] [PubMed]
- Paus, A.; Boessenkool, S.; Brochmann, C.; Epp, L.S.; Fabel, D.; Haflidason, H.; Linge, H. Lake Store Finnsjøen–a Key for Understanding Lateglacial/Early Holocene Vegetation and Ice Sheet Dynamics in the Central Scandes Mountains. Quat. Sci. Rev. 2015, 121, 36–51. [Google Scholar] [CrossRef] [Green Version]
- Wang, Y.; Heintzman, P.D.; Newsom, L.; Bigelow, N.H.; Wooller, M.J.; Shapiro, B.; Williams, J.W. The Southern Coastal Beringian Land Bridge: Cryptic Refugium or Pseudorefugium for Woody Plants during the Last Glacial Maximum? J. Biogeogr. 2017, 44, 1559–1571. [Google Scholar] [CrossRef]
- Evrard, O.; Laceby, J.P.; Ficetola, G.F.; Gielly, L.; Huon, S.; Lefèvre, I.; Onda, Y.; Poulenard, J. Environmental DNA Provides Information on Sediment Sources: A Study in Catchments Affected by Fukushima Radioactive Fallout. Sci. Total Environ. 2019, 665, 873–881. [Google Scholar] [CrossRef]
- Madeja, J. A New Tool to Trace Past Human Presence from Lake Sediments: The Human-Specific Molecular Marker Bacteroides Strain HF 183. J. Quat. Sci. 2015, 30, 349–354. [Google Scholar] [CrossRef]
- Etienne, D.; Destas, M.; Lyautey, E.; Marti, R.; Ruffaldi, P.; Georges-Leroy, M.; Dambrine, E.; Topp, E. Two thousand-year reconstruction of livestock production intensity in France using sediment-archived fecal Bacteroidales and source-specific mitochondrial markers. Holocene 2015, 25, 1384–1393. [Google Scholar] [CrossRef]
- Mahaney, W.C.; Allen, C.C.R.; Pentlavalli, P.; Kulakova, A.; Young, J.M.; Dirszowsky, R.W.; West, A.; Kelleher, B.; Jordan, S.; Pulleyblank, C.; et al. Biostratigraphic Evidence Relating to the Age-Old Question of Hannibal’s Invasion of Italy, II: Chemical Biomarkers and Microbial Signatures. Archaeometry 2017, 59, 179–190. [Google Scholar] [CrossRef] [Green Version]
- Vachula, R.S.; Huang, Y.; Russell, J.M.; Abbott, M.B.; Finkenbinder, M.S.; O’Donnell, J.A. Sedimentary Biomarkers Reaffirm Human Impacts on Northern Beringian Ecosystems during the Last Glacial Period. Boreas 2020, 49, 514–525. [Google Scholar] [CrossRef]
- D’Anjou, R.M.; Bradley, R.S.; Balascio, N.L.; Finkelstein, D.B. Climate Impacts on Human Settlement and Agricultural Activities in Northern Norway Revealed through Sediment Biogeochemistry. Proc. Natl. Acad. Sci. USA 2012, 109, 20332–20337. [Google Scholar] [CrossRef] [Green Version]
- Dubois, N.; Jacob, J. Molecular Biomarkers of Anthropic Impacts in Natural Archives: A Review. Front. Ecol. Evol. 2016, 4, 92. [Google Scholar] [CrossRef] [Green Version]
- Schroeter, N.; Lauterbach, S.; Stebich, M.; Kalanke, J.; Mingram, J.; Yildiz, C.; Schouten, S.; Gleixner, G. Biomolecular Evidence of Early Human Occupation of a High-Altitude Site in Western Central Asia during the Holocene. Front. Earth Sci. 2020, 8, 20. [Google Scholar] [CrossRef] [Green Version]
- Seersholm, F.V.; Pedersen, M.W.; Søe, M.J.; Shokry, H.; Mak, S.S.T.; Ruter, A.; Raghavan, M.; Fitzhugh, W.; Kjær, K.H.; Willerslev, E.; et al. DNA Evidence of Bowhead Whale Exploitation by Greenlandic Paleo-Inuit 4000 Years Ago. Nat. Commun. 2016, 7, 13389. [Google Scholar] [CrossRef] [Green Version]
- Coolen, M.J.L.; Saenz, J.P.; Giosan, L.; Trowbridge, N.Y.; Dimitrov, P.; Dimitrov, D.; Eglinton, T.I. DNA and Lipid Molecular Stratigraphic Records of Haptophyte Succession in the Black Sea during the Holocene. Earth Planet. Sci. Lett. 2009, 284, 610–621. [Google Scholar] [CrossRef]
- Pal, S.; Gregory-Eaves, I.; Pick, F.R. Temporal Trends in Cyanobacteria Revealed through DNA and Pigment Analyses of Temperate Lake Sediment Cores. J. Paleolimnol. 2015, 54, 87–101. [Google Scholar] [CrossRef]
- Vuillemin, A.; Ariztegui, D.; Leavitt, P.R.; Bunting, L.; Anselmetti, F.; Ariztegui, D.; Corbella, H.; Francus, P.; Lücke, A.; Maidana, N.I.; et al. Recording of Climate and Diagenesis through Sedimentary DNA and Fossil Pigments at Laguna Potrok Aike, Argentina. Biogeosciences 2016, 13, 2475–2492. [Google Scholar] [CrossRef] [Green Version]
- Stivrins, N.; Soininen, J.; Tõnno, I.; Freiberg, R.; Veski, S.; Kisand, V. Towards Understanding the Abundance of Non-Pollen Palynomorphs: A Comparison of Fossil Algae, Algal Pigments and sedaDNA from Temperate Lake Sediments. Rev. Palaeobot. Palynol. 2018, 249, 9–15. [Google Scholar] [CrossRef] [Green Version]
- Capo, E.; Rydberg, J.; Tolu, J.; Domaizon, I.; Debroas, D.; Bindler, R.; Bigler, C. How Does Environmental Interannual Fluctuations Impact Aquatic Microbial Communities? A 40 Years Record of Protistan and Cyanobacterial Communities from a Boreal Lake (Nylandssjön, Sweden). Front. Ecol. Evol. 2019, 7, 1–13. [Google Scholar] [CrossRef] [Green Version]
- Stoof-Leichsenring, K.R.; Bernhardt, N.; Pestryakova, L.A.; Epp, L.S.; Herzschuh, U.; Tiedemann, R. A Combined Paleolimnological/Genetic Analysis of Diatoms Reveals Divergent Evolutionary Lineages of Staurosira and Staurosirella (Bacillariophyta) in Siberian Lake Sediments along a Latitudinal Transect. J. Paleolimnol. 2014, 52, 77–93. [Google Scholar] [CrossRef] [Green Version]
- Stoof-Leichsenring, K.R.; Herzschuh, U.; Pestryakova, L.; Klemm, J.; Epp, L.S.; Tiedemann, R. Genetic Data from Algae Sedimentary DNA Reflect the Influence of Environment over Geography. Sci. Rep. 2015, 5, 12924. [Google Scholar] [CrossRef] [PubMed] [Green Version]
- Stoof-Leichsenring, K.R.; Dulias, K.; Biskaborn, B.K.; Pestryakova, L.A.; Herzschuh, U. Lake-Depth Related Pattern of Genetic and Morphological Diatom Diversity in Boreal Lake Bolshoe Toko, Eastern Siberia. PLoS ONE 2020, 15, e0230284. [Google Scholar] [CrossRef] [PubMed] [Green Version]
- Stoof-Leichsenring, K.R.; Pestryakova, L.A.; Epp, L.S.; Herzschuh, U. Phylogenetic Diversity and Environment form Assembly Rules for Arctic Diatom Genera—A study on Recent and Ancient Sedimentary DNA. J. Biogeogr. 2020, 1–14. [Google Scholar] [CrossRef]
- Dulias, K.; Stoof-Leichsenring, K.R.; Pestryakova, L.A.; Herzschuh, U. Sedimentary DNA versus Morphology in the Analysis of Diatom-Environment Relationships. J. Paleolimnol. 2017, 57, 51–66. [Google Scholar] [CrossRef] [Green Version]
- Huang, S.; Herzschuh, U.; Pestryakova, L.A.; Zimmermann, H.H.; Davydova, P.; Biskaborn, B.K.; Shevtsova, I.; Stoof-Leichsenring, K.R. Genetic and Morphologic Determination of Diatom Community Composition in Surface Sediments from Glacial and Thermokarst Lakes in the Siberian Arctic. J. Paleolimnol. 2020, 64, 225–242. [Google Scholar] [CrossRef]
- Lewin, H.A.; Robinson, G.E.; Kress, W.J.; Baker, W.J.; Coddington, J.; Crandall, K.A.; Durbin, R.; Edwards, S.V.; Forest, F.; Gilbert, M.T.P.; et al. Earth BioGenome Project: Sequencing Life for the Future of Life. Proc. Natl. Acad. Sci. USA 2018, 115, 4325–4333. [Google Scholar] [CrossRef] [Green Version]
- Heinecke, L.; Epp, L.S.; Reschke, M.; Stoof-Leichsenring, K.R.; Mischke, S.; Plessen, B.; Herzschuh, U. Aquatic Macrophyte Dynamics in Lake Karakul (Eastern Pamir) over the Last 29 Cal Ka Revealed by Sedimentary Ancient DNA and Geochemical Analyses of Macrofossil Remains. J. Paleolimnol. 2017, 58, 403–417. [Google Scholar] [CrossRef]
- Kallmeyer, J.; Pockalny, R.; Adhikari, R.; Smith, D.; D’Hondt, S. Global Distribution of Microbial Abundance and Biomass in Subseafloor Sediment. Proc. Natl. Acad. Sci. USA 2012, 109, 16213–16216. [Google Scholar] [CrossRef] [Green Version]
- Parkes, R.; Cragg, B.; Wellsbury, P. Recent Studies on Bacterial Populations and Processes in Subseafloor Sediments: A Review. Hydrogeol. J. 2000, 8, 11–28. [Google Scholar] [CrossRef]
- Ariztegui, D.; Thomas, C.; Vuillemin, A. Present and Future of Subsurface Biosphere Studies in Lacustrine Sediments through Scientific Drilling. Int. J. Earth Sci. 2015, 104, 1655–1665. [Google Scholar] [CrossRef] [Green Version]
- Vuillemin, A.; Ariztegui, D.; Horn, F.; Kallmeyer, J.; Orsi, W.D. Microbial Community Composition along a 50,000-Year Lacustrine Sediment Sequence. FEMS Microbiol. Ecol. 2018, 94, 1–14. [Google Scholar] [CrossRef] [Green Version]
- Orsi, W.D.; Coolen, M.J.L.; Wuchter, C.; He, L.; More, K.D.; Irigoien, X.; Chust, G.; Johnson, C.; Hemingway, J.D.; Lee, M.; et al. Climate Oscillations Reflected within the Microbiome of Arabian Sea Sediments. Sci. Rep. 2017, 7, 1–12. [Google Scholar] [CrossRef]
- Starnawski, P.; Bataillon, T.; Ettema, T.J.G.; Jochum, L.M.; Schreiber, L.; Chen, X.; Lever, M.A.; Polz, M.F.; Jørgensen, B.B.; Schramm, A.; et al. Microbial Community Assembly and Evolution in Subseafloor Sediment. Proc. Natl. Acad. Sci. USA 2017, 114, 2940–2945. [Google Scholar] [CrossRef] [Green Version]
- Møller, T.E.; van der Bilt, W.G.M.; Roerdink, D.L.; Jørgensen, S.L. Microbial Community Structure in Arctic Lake Sediments Reflect Variations in Holocene Climate Conditions. Front. Microbiol. 2020, 11, 1520. [Google Scholar] [CrossRef]
- Thomas, C.; Ariztegui, D. Fluid Inclusions from the Deep Dead Sea Sediment Provide New Insights on Holocene Extreme Microbial Life. Quat. Sci. Rev. 2019, 212, 18–27. [Google Scholar] [CrossRef] [Green Version]
- Emerson, J.B.; Adams, R.I.; Román, C.M.B.; Brooks, B.; Coil, D.A.; Dahlhausen, K.; Ganz, H.H.; Hartmann, E.M.; Hsu, T.; Justice, N.B.; et al. Schrödinger’s Microbes: Tools for Distinguishing the Living from the Dead in Microbial Ecosystems. Microbiome 2017, 5, 86. [Google Scholar] [CrossRef]
- Vuillemin, A.; Horn, F.; Alawi, M.; Henny, C.; Wagner, D.; Crowe, S.A.; Kallmeyer, J. Preservation and Significance of Extracellular DNA in Ferruginous Sediments from Lake Towuti, Indonesia. Front. Microbiol. 2017, 8, 1–15. [Google Scholar] [CrossRef] [Green Version]
- Vuillemin, A.; Vargas, S.; Coskun, Ö.K.; Pocka lny, R.; Murray, R.W.; Smith, D.C.; D’Hondt, S.; Orsi, W.D. Atribacteria Reproducing over Millions of Years in the Atlantic Abyssal Subseafloor. MBio 2020, 11. [Google Scholar] [CrossRef] [PubMed]
- Keer, J.; Birch, L. Molecular Methods for the Assessment of Bacterial Viability. J. Microbiol. Methods 2003, 53, 175–183. [Google Scholar] [CrossRef]
- Heise, J.; Nega, M.; Alawi, M.; Wagner, D. Propidium Monoazide Treatment to Distinguish between Live and Dead Methanogens in Pure Cultures and Environmental Samples. J. Microbiol. Methods 2016, 121, 11–23. [Google Scholar] [CrossRef] [PubMed]
- Emiola, A.; Oh, J. High Throughput in Situ Metagenomic Measurement of Bacterial Replication at Ultra-Low Sequencing Coverage. Nat. Commun. 2018, 9, 4956. [Google Scholar] [CrossRef] [PubMed]
- Fulton, T.L.; Shapiro, B. Setting up an Ancient DNA Laboratory. In Ancient DNA; Humana Press: New York, NY, USA, 2019; pp. 1–13. [Google Scholar]
- Epp, L.S.; Zimmermann, H.H.; Stoof-Leichsenring, K.R. Sampling and Extraction of Ancient DNA from Sediments. Methods Mol. Biol. 2019, 1963, 31–44. [Google Scholar] [CrossRef]
- Thomsen, P.F.; Willerslev, E. Environmental DNA—An Emerging Tool in Conservation for Monitoring Past and Present Biodiversity. Biol. Conserv. 2015, 183, 4–18. [Google Scholar] [CrossRef]
- Taberlet, P.; Bonin, A.; Zinger, L.; Coissac, E. Environmental DNA: For Biodiversity Research and Monitoring; Oxford University Press: London, UK, 2018; ISBN 9780198767220. [Google Scholar]
- Brothers, S.; Vermaire, J.C.; Gregory-Eaves, I. Empirical Models for Describing Recent Sedimentation Rates in Lakes Distributed across Broad Spatial Scales. J. Paleolimnol. 2008, 40, 1003–1019. [Google Scholar] [CrossRef]
- Marwick, T.R.; Borges, A.V.; Van Acker, K.; Darchambeau, F.; Bouillon, S. Disproportionate Contribution of Riparian Inputs to Organic Carbon Pools in Freshwater Systems. Ecosystems 2014, 17, 974–989. [Google Scholar] [CrossRef] [Green Version]
- Rouillard, A.; Greenwood, P.; Grice, K.; Skrzypek, G.; Dogramaci, S.; Turney, C.; Grierson, P. Interpreting Vegetation Change in Tropical Arid Ecosystems from Sediment Molecular Fossils and their Stable Isotope Compositions: A Baseline Study from the Pilbara Region of Northwest Australia. Palaeogeogr. Palaeoclimatol. Palaeoecol. 2016, 459, 495–507. [Google Scholar] [CrossRef] [Green Version]
- Boere, A.C.; Rijpstra, W.I.C.; De Lange, G.J.; Sinninghe Damsté, J.S.; Coolen, M.J.L. Preservation Potential of Ancient Plankton DNA in Pleistocene Marine Sediments. Geobiology 2011, 9, 377–393. [Google Scholar] [CrossRef] [Green Version]
- Rydberg, J.; Rosén, P.; Lambertsson, L.; De Vleeschouwer, F.; Tomasdotter, S.; Bindler, R. Assessment of the Spatial Distributions of Total- and Methyl-Mercury and their Relationship to Sediment Geochemistry from a Whole-Lake Perspective. J. Geophys. Res. Biogeosci. 2012, 117. [Google Scholar] [CrossRef] [Green Version]
- Wilhelm, B.; Sabatier, P.; Arnaud, F. Is a Regional Flood Signal Reproducible from Lake Sediments? Sedimentology 2015, 62, 1103–1117. [Google Scholar] [CrossRef]
- Tolu, J.; Rydberg, J.; Meyer-Jacob, C.; Gerber, L.; Bindler, R. Spatial Variability of Organic Matter Molecular Composition and Elemental Geochemistry in Surface Sediments of a Small Boreal Swedish Lake. Biogeosciences 2017, 14, 1773–1792. [Google Scholar] [CrossRef]
- Hansen, B.K.; Bekkevold, D.; Clausen, L.W.; Nielsen, E.E. The Sceptical Optimist: Challenges and Perspectives for the Application of Environmental DNA in Marine Fisheries. Fish Fish. 2018, 19, 751–768. [Google Scholar] [CrossRef]
- Lawson Handley, L.; Read, D.S.; Winfield, I.J.; Kimbell, H.; Johnson, H.; Li, J.; Hahn, C.; Blackman, R.; Wilcox, R.; Donnelly, R.; et al. Temporal and Spatial Variation in Distribution of Fish Environmental DNA in England’s Largest Lake. Environ. DNA 2019, 1, 26–39. [Google Scholar] [CrossRef] [Green Version]
- Etienne, D.; Wilhelm, B.; Sabatier, P.; Reyss, J.-L.; Arnaud, F. Influence of Sample Location and Livestock Numbers on Sporormiella Concentrations and Accumulation rates in Surface Sediments of Lake Allos, French Alps. J. Paleolimnol. 2013, 49, 117–127. [Google Scholar] [CrossRef]
- Weisbrod, B.; Wood, S.A.; Steiner, K.; Whyte-Wilding, R.; Puddick, J.; Laroche, O.; Dietrich, D.R. Is a Central Sediment Sample Sufficient? Exploring Spatial and Temporal Microbial Diversity in a Small Lake. Toxins 2020, 12, 580. [Google Scholar] [CrossRef]
- Giguet-Covex, C.; Messager, E.; Arthaud, F.; Gielly, L.; Jenny, J.-P. Aquatic Plant Dynamic and Fishes over the Last 1800 Years in the Lake Aiguebelette (Northern French Alps). In Proceedings of the INQUA International Union for Quaternary Research, Dublin, Ireland, 26 July 2019. [Google Scholar]
- Matisoo-Smith, E.; Yasuda, Y.; Roberts, K.; Welikala, N.; Tannock, G.; Chester, P.; Feek, D.; Flenley, J. Recovery of DNA and Pollen from New Zealand Lake Sediments. Quat. Int. 2008, 184, 139–149. [Google Scholar] [CrossRef]
- Parducci, L. Glacial SURVIVAL of Boreal Trees in Northern Scandinavia. Science 2012, 338, 1083–1087. [Google Scholar] [CrossRef] [PubMed]
- Epp, L.S.; Stoof-Leichsenring, K.R.; Trauth, M.H.; Tiedemann, R. Molecular Profiling of Diatom Assemblages in Tropical Lake Sediments Using Taxon-Specific PCR and Denaturing High-Performance Liquid Chromatography (PCR-DHPLC). Mol. Ecol. Resour. 2011, 11, 842–853. [Google Scholar] [CrossRef] [PubMed]
- Ficetola, G.F.; Pansu, J.; Bonin, A.; Coissac, E.; Giguet-Covex, C.; De Barba, M.; Gielly, L.; Lopes, C.M.; Boyer, F.; Pompanon, F.; et al. Replication Levels, False Presences and the Estimation of the Presence/Absence from eDNA Metabarcoding Data. Mol. Ecol. Resour. 2015, 15, 543–556. [Google Scholar] [CrossRef]
- Shirazi, S.; Meyer, R.; Shapiro, B. PCR Replication in Environmental DNA Metabarcoding. Authorea Prepr. 2020. [Google Scholar] [CrossRef]
- Ficetola, G.F.; Taberlet, P.; Coissac, E. How to limit false positives in environmental DNA and metabarcoding? Mol. Ecol. Resour. 2016, 16, 604–607. [Google Scholar] [CrossRef] [Green Version]
- Cooper, A.; Poinar, H. Ancient DNA: Do It Right or not at all. Science 2000, 289, 1139. [Google Scholar] [CrossRef]
- Lahoz-Monfort, J.J.; Guillera-Arroita, G.; Tingley, R. Statistical Approaches to Account for False-Positive Errors in Environmental DNA Samples. Mol. Ecol. Resour. 2016, 16, 673–685. [Google Scholar] [CrossRef]
- Chen, W.; Ficetola, G.F. Numerical Methods for Sedimentary-Ancient-DNA-Based Study on Past Biodiversity and Ecosystem Functioning. Environ. DNA 2020, 1–15. [Google Scholar] [CrossRef] [Green Version]
- Murchie, T.J.; Kuch, M.; Duggan, A.T.; Ledger, M.L.; Roche, K.; Klunk, J.; Karpinski, E.; Hackenberger, D.; Sadoway, T.; MacPhee, R.; et al. Optimizing Extraction and Targeted Capture of Ancient Environmental DNA for Reconstructing Past Environments Using the PalaeoChip Arctic-1.0 Bait-Set. Quat. Res. 2020, 99, 1–24. [Google Scholar] [CrossRef]
- Corinaldesi, C.; Danovaro, R.; Dell’Anno, A. Simultaneous Recovery of Extracellular and Intracellular DNA Suitable for Molecular Studies from Marine Sediments. Appl. Environ. Microbiol. 2005, 71, 46–50. [Google Scholar] [CrossRef] [PubMed] [Green Version]
- Taberlet, P.; Coissac, E.; Hajibabaei, M.; Rieseberg, L.H. Environmental DNA. Mol. Ecol. 2012, 21, 1789–1793. [Google Scholar] [CrossRef] [PubMed]
- Slon, V.; Hopfe, C.; Weiß, C.L.; Mafessoni, F.; de la Rasilla, M.; Lalueza-Fox, C.; Rosas, A.; Soressi, M.; Knul, M.V.; Miller, R.; et al. Neandertal and Denisovan DNA from Pleistocene sediments. Science 2017, 608, 605–608. [Google Scholar] [CrossRef] [PubMed] [Green Version]
- More, K.D.; Giosan, L.; Grice, K.; Coolen, M.J.L. Holocene Paleodepositional Changes Reflected in the Sedimentary Microbiome of the Black Sea. Geobiology 2019, 17, 436–448. [Google Scholar] [CrossRef]
- McLaren, M.R.; Willis, A.D.; Callahan, B.J. Consistent and Correctable Bias in Metagenomic Sequencing Experiments. eLife 2019, 8, e46923. [Google Scholar] [CrossRef]
- Kang, W.; Anslan, S.; Börner, N.; Schwarz, A.; Schmidt, R.; Künzel, S.; Rioual, P.; Echeverría-Galindo, P.; Vences, M.; Wang, J.; et al. Diatom Metabarcoding and Microscopic Analyses from Sediment Samples at Lake Nam Co, Tibet: The Effect of Sample-Size and Bioinformatics on the Identified Communities. Ecol. Indic. 2021, 121, 107070. [Google Scholar] [CrossRef]
- Capo, E.; Spong, G.; Koizumi, S.; Puts, I.; Olajos, F.; Königsson, H.; Karlsson, J.; Byström, P. Droplet Digital PCR Applied to Environmental DNA, a Promising Method to Estimate Fish Population Abundance from Humic-Rich Aquatic Ecosystems. Environ. DNA 2020, 1–10. [Google Scholar] [CrossRef]
- Capo, E.; Spong, G.; Norman, S.; Königsson, H.; Bartels, P.; Byström, P. Droplet Digital PCR Assays for the Quantification of Brown Trout (Salmo Trutta) and Arctic Char (Salvelinus Alpinus) from Environmental DNA Collected in the Water of Mountain Lakes. PLoS ONE 2019, 14, e0226638. [Google Scholar] [CrossRef] [PubMed] [Green Version]
- Hebert, P.D.N.; Cywinska, A.; Ball, S.L.; de Waard, J.R. Biological Identifications through DNA Barcodes. Proc. R. Soc. London. Ser. B Biol. Sci. 2003, 270, 313–321. [Google Scholar] [CrossRef] [Green Version]
- Zimmermann, H.H.; Raschke, E.; Epp, L.S.; Stoof-Leichsenring, K.R.; Schirrmeister, L.; Schwamborn, G.; Herzschuh, U. The History of Tree and Shrub Taxa on Bol’shoy Lyakhovsky Island (New Siberian Archipelago) since the Last Interglacial Uncovered by Sedimentary Ancient DNA and Pollen Data. Genes (Basel) 2017, 8, 273. [Google Scholar] [CrossRef] [Green Version]
- Nichols, R.V.; Vollmers, C.; Newsom, L.A.; Wang, Y.; Heintzman, P.D.; Leighton, M.; Green, R.E.; Shapiro, B. Minimizing Polymerase Biases in Metabarcoding. Mol. Ecol. Resour. 2018, 18, 927–939. [Google Scholar] [CrossRef] [PubMed] [Green Version]
- Taberlet, P.; Coissac, E.; Pompanon, F.; Gielly, L.; Miquel, C.; Valentini, A.; Vermat, T.; Corthier, G.; Brochmann, C.; Willerslev, E. Power and Limitations of the Chloroplast trnL (UAA) Intron for Plant DNA Barcoding. Nucleic Acids Res. 2007, 35, e14. [Google Scholar] [CrossRef] [Green Version]
- Schulte, L.; Bernhardt, N.; Stoof-Leichsenring, K.; Zimmermann, H.; Pestryakova, L.; Epp, L.; Herzschuh, U. Hybridization Capture of Larch (Larix Mill) Chloroplast Genomes from Sedimentary Ancient DNA Reveals Past Changes of Siberian Forests. bioRxiv 2020. [Google Scholar] [CrossRef] [Green Version]
- Dabney, J.; Meyer, M. Length and GC-Biases during Sequencing Library Amplification: A Comparison of Various Polymerase-Buffer Systems with Ancient and Modern DNA Sequencing Libraries. Biotechniques 2012, 52. [Google Scholar] [CrossRef] [Green Version]
- Li, H.-T.; Yi, T.-S.; Gao, L.-M.; Ma, P.-F.; Zhang, T.; Yang, J.-B.; Gitzendanner, M.A.; Fritsch, P.W.; Cai, J.; Luo, Y.; et al. Origin of Angiosperms and the Puzzle of the Jurassic Gap. Nat. Plants 2019, 5, 461–470. [Google Scholar] [CrossRef] [PubMed]
- Nevill, P.G.; Zhong, X.; Tonti-Filippini, J.; Byrne, M.; Hislop, M.; Thiele, K.; van Leeuwen, S.; Boykin, L.M.; Small, I. Large Scale Genome Skimming from Herbarium Material for Accurate Plant Identification and Phylogenomics. Plant Methods 2020, 16, 1. [Google Scholar] [CrossRef]
- Alsos, I.G.; Lavergne, S.; Merkel, M.K.F.; Boleda, M.; Lammers, Y.; Alberti, A.; Pouchon, C.; Denoeud, F.; Pitelkova, I.; Pușcaș, M.; et al. The Treasure Vault Can Be Opened: Large-Scale Genome Skimming Works Well Using Herbarium and Silica Gel Dried Material. Plants 2020, 9, 432. [Google Scholar] [CrossRef] [PubMed] [Green Version]
- Wood, S.A.; Pochon, X.; Laroche, O.; Ammon, U.; Adamson, J.; Zaiko, A. A comparison of droplet digital polymerase chain reaction (PCR), quantitative PCR and metabarcoding for species‐specific detection in environmental DNA. Mol. Ecol. Resour. 2019, 19, 1407–1419. [Google Scholar] [CrossRef]
- Harper, L.R.; Lawson Handley, L.; Hahn, C.; Boonham, N.; Rees, H.C.; Gough, K.C.; Lewis, E.; Adams, I.P.; Brotherton, P.; Phillips, S.; et al. Needle in a Haystack? A Comparison of eDNA Metabarcoding and Targeted qPCR for Detection of the Great Crested Newt (Triturus Cristatus). Ecol. Evol. 2018, 8, 6330–6341. [Google Scholar] [CrossRef]
- Dritsoulas, A.; Campos-Herrera, R.; Blanco-Pérez, R.; Duncan, L. Comparing High Throughput Sequencing and Real Time qPCR for Characterizing Entomopathogenic Nematode Biogeography. Soil Biol. Biochem. 2020, 145, 107793. [Google Scholar] [CrossRef]
- Bista, I.; Carvalho, G.R.; Tang, M.; Walsh, K.; Zhou, X.; Hajibabaei, M.; Shokralla, S.; Seymour, M.; Bradley, D.; Liu, S.; et al. Performance of Amplicon and Shotgun Sequencing for Accurate Biomass Estimation in Invertebrate Community Samples. Mol. Ecol. Resour. 2018, 18, 1020–1034. [Google Scholar] [CrossRef]
- Wilson, J.-J.; Brandon-Mong, G.-J.; Gan, H.-M.; Sing, K.-W. High-Throughput Terrestrial Biodiversity Assessments: Mitochondrial Metabarcoding, Metagenomics or Metatranscriptomics? Mitochondrial DNA Part A 2019, 30, 60–67. [Google Scholar] [CrossRef] [PubMed]
- Arribas, P.; Anujar, C.; Hopkins, K.; Shepherd, M.; Vogler, A. Metabarcoding and Mitochondrial Metagenomics of Endogean Arthropods to Unveil the Mesofauna of the soil. Methods Ecol. Evol. 2016, 7, 1071–1081. [Google Scholar] [CrossRef]
- Ziesemer, K.A.; Mann, A.E.; Sankaranarayanan, K.; Schroeder, H.; Ozga, A.T.; Brandt, B.W.; Zaura, E.; Waters-Rist, A.; Hoogland, M.; Salazar-García, D.C.; et al. Intrinsic Challenges in Ancient Microbiome Reconstruction Using 16S rRNA Gene Amplification. Sci. Rep. 2015, 5, 16498. [Google Scholar] [CrossRef]
- Nichols, R.V.; Curd, E.; Heintzman, P.D.; Shapiro, B. Targeted Amplification and Sequencing of Ancient Environmental and Sedimentary DNA. In Ancient DNA.; Humana Press: New York, NY, USA, 2019; pp. 149–161. [Google Scholar]
- Hollingsworth, P.M.; Graham, S.W.; Little, D.P. Choosing and Using a Plant DNA Barcode. PLoS ONE 2011, 6, e19254. [Google Scholar] [CrossRef] [PubMed]
- Li, X.; Yang, Y.; Henry, R.J.; Rossetto, M.; Wang, Y.; Chen, S. Plant DNA Barcoding: From Gene to Genome. Biol. Rev. 2015, 90, 157–166. [Google Scholar] [CrossRef] [PubMed]
- Meusnier, I.; Singer, G.A.; Landry, J.-F.; Hickey, D.A.; Hebert, P.D.; Hajibabaei, M. A Universal DNA Mini-Barcode for Biodiversity Analysis. BMC Genomics 2008, 9, 214. [Google Scholar] [CrossRef] [PubMed] [Green Version]
- Little, D.P. A DNA Mini-Barcode for Land Plants. Mol. Ecol. Resour. 2014, 14, 437–446. [Google Scholar] [CrossRef]
- Cribdon, B.; Ware, R.; Smith, O.; Gaffney, V.; Allaby, R.G. PIA: More Accurate Taxonomic Assignment of Metagenomic Data Demonstrated on sedaDNA from the North Sea. Front. Ecol. Evol. 2020, 8, 84. [Google Scholar] [CrossRef] [Green Version]
- Staats, M.; Erkens, R.H.J.; van de Vossenberg, B.; Wieringa, J.J.; Kraaijeveld, K.; Stielow, B.; Geml, J.; Richardson, J.E.; Bakker, F.T. Genomic Treasure Troves: Complete Genome Sequencing of Herbarium and Insect Museum Specimens. PLoS ONE 2013, 8, e69189. [Google Scholar] [CrossRef] [Green Version]
- Miya, M.; Sato, Y.; Fukunaga, T.; Sado, T.; Poulsen, J.Y.; Sato, K.; Minamoto, T.; Yamamoto, S.; Yamanaka, H.; Araki, H.; et al. MiFish, a Set of Universal PCR Primers for Metabarcoding Environmental DNA from Fishes: Detection of more than 230 Subtropical Marine Species. R. Soc. Open Sci. 2015, 2, 150088. [Google Scholar] [CrossRef] [Green Version]
- Guardiola, M.; Uriz, M.J.; Taberlet, P.; Coissac, E.; Wangensteen, O.S.; Turon, X. Deep-Sea, Deep-Sequencing: Metabarcoding Extracellular DNA from Sediments of Marine Canyons. PLoS ONE 2015, 10, e0139633. [Google Scholar] [CrossRef] [Green Version]
- Geller, J.; Meyer, C.; Parker, M.; Hawk, H. Redesign of PCR Primers for Mitochondrial Cytochrome C Oxidase Subunit I for Marine Invertebrates and Application in All-Taxa Biotic Surveys. Mol. Ecol. Resour. 2013, 13, 851–861. [Google Scholar] [CrossRef]
- Tedersoo, L.; Bahram, M.; Põlme, S.; Kõljalg, U.; Yorou, N.S.; Wijesundera, R.; Ruiz, L.V.; Vasco-Palacios, A.M.; Thu, P.Q.; Suija, A.; et al. Global Diversity and Geography of Soil Fungi. Science 2014, 346. [Google Scholar] [CrossRef] [Green Version]
- Pawlowski, J.; Audic, S.; Adl, S.S.; Bass, D.; Belbahri, L.; Berney, C.; Bowser, S.S.; Cepicka, I.; Decelle, J.; Dunthorn, M.; et al. CBOL Protist Working Group: Barcoding Eukaryotic Richness beyond the Animal, Plant, and Fungal Kingdoms. PLoS Biol. 2012, 10, e1001419. [Google Scholar] [CrossRef] [Green Version]
- Sønstebø, J.; Gielly, L.; Brysting, A.; Elven, R.; Edwards, M.; Haile, J.; Taberlet, P. Using Next-Generation Sequencing for Molecular Reconstruction of Past Arctic Vegetation and Climate. Mol. Ecol. Resour. 2010, 10, 1009–1018. [Google Scholar] [CrossRef] [PubMed]
- Soininen, E.M.; Gauthier, G.; Bilodeau, F.; Berteaux, D.; Gielly, L.; Taberlet, P.; Gussarova, G.; Bellemain, E.; Hassel, K.; Stenøien, H.K.; et al. Highly Overlapping Winter Diet in Two Sympatric Lemming Species Revealed by DNA Metabarcoding. PLoS ONE 2015, 10, e0115335. [Google Scholar] [CrossRef] [PubMed] [Green Version]
- Taylor, P. Reproducibility of Ancient DNA Sequences from Extinct Pleistocene Fauna. Mol. Biol. Evol. 1996, 13, 283–285. [Google Scholar] [CrossRef] [PubMed] [Green Version]
- Poinar, H.; Hofreiter, M.; Spaulding, W.; Martin, P.; Stankiewicz, B.; Bland, H.; Pääbo, S. Molecular Coproscopy: Dung and Diet of the Extinct Ground Sloth Nothrotheriops Shastensis. Science 1998, 281, 402–406. [Google Scholar] [CrossRef] [Green Version]
- Hofreiter, M.; Mead, J.I.; Martin, P.; Poinar, H.N. Molecular Caving. Curr. Biol. 2003, 13, R693–R695. [Google Scholar] [CrossRef] [Green Version]
- Haile, J.; Holdaway, R.; Oliver, K.; Bunce, M.; Gilbert, M.T.P.; Nielsen, R.; Munch, K.; Ho, S.Y.W.; Shapiro, B.; Willerslev, E. Ancient DNA Chronology within Sediment Deposits: Are Paleobiological Reconstructions Possible and Is DNA Leaching a Factor? Mol. Biol. Evol. 2007, 24, 982–989. [Google Scholar] [CrossRef] [PubMed]
- Haile, J.; Froese, D.; MacPhee, R.; Roberts, R.G.; Arnold, L.J.; Reyes, A.V.; Willerslev, E. Ancient DNA Reveals Late Survival of Mammoth and Horse in Interior Alaska. Proc. Natl. Acad. Sci. USA 2009, 106, 22352–22357. [Google Scholar] [CrossRef] [PubMed] [Green Version]
- Hebsgaard, M.B.; Gilbert, M.T.P.; Arneborg, J.; Heyn, P.; Allentoft, M.E.; Bunce, M.; Munch, K.; Schweger, C.; Willerslev, E. ‘The Farm Beneath the Sand’—An Archaeological Case Study on Ancient ‘Dirt’ DNA. Antiquity 2009, 83, 430–444. [Google Scholar] [CrossRef] [Green Version]
- Rasmussen, M.; Li, Y.; Lindgreen, S.; Pedersen, J.S.; Albrechtsen, A.; Moltke, I.; Metspalu, M.; Metspalu, E.; Kivisild, T.; Gupta, R.; et al. Ancient Human Genome Sequence of an Extinct Palaeo-Eskimo. Nature 2010, 463, 757–762. [Google Scholar] [CrossRef]
- Boessenkool, S.; Epp, L.S.; Haile, J.; Bellemain, E.; Edwards, M.; Coissac, E.; Willerslev, E.; Brochmann, C. Blocking Human Contaminant DNA during PCR Allows Amplification of Rare Mammal Species from Sedimentary Ancient DNA. Mol. Ecol. 2012, 21, 1806–1815. [Google Scholar] [CrossRef]
- Ficetola, G.F.; Manenti, R.; Taberlet, P. Environmental DNA and Metabarcoding for the Study of Amphibians and Reptiles: Species Distribution, the Microbiome, and much more. Amphibia-Reptilia 2019, 40, 129–148. [Google Scholar] [CrossRef] [Green Version]
- Nübel, U.; Garcia-Pichel, F.; Muyzer, G. PCR Primers to Amplify 16S rRNA Genes from Cyanobacteria. Appl. Environ. Microbiol. 1997, 63, 3327–3332. [Google Scholar] [CrossRef] [Green Version]
- Guillou, L.; Bachar, D.; Audic, S.; Bass, D.; Berney, C.; Bittner, L.; Del Campo, J. The Protist Ribosomal Reference Database (PR2): A Catalog of Unicellular Eukaryote Small Sub-Unit rRNA Sequences with Curated Taxonomy. Nucleic Acids Res. 2012, 41, D597–D604. [Google Scholar] [CrossRef] [Green Version]
- Quast, C.; Pruesse, E.; Yilmaz, P.; Gerken, J.; Schweer, T.; Yarza, P.; Peplies, J.; Glöckner, F.O. The SILVA Ribosomal RNA Gene Database Project: Improved Data Processing and Web-Based Tools. Nucleic Acids Res. 2013, 41, D590–D596. [Google Scholar] [CrossRef]
- Schoch, C.L.; Seifert, K.A.; Huhndorf, S.; Robert, V.; Spouge, J.L.; Levesque, C.A.; Chen, W.; Consortium, F.B. Nuclear ribosomal internal transcribed spacer (ITS) region as a universal DNA barcode marker for Fungi. Proc. Natl. Acad. Sci. USA 2012, 109, 6241–6246. [Google Scholar] [CrossRef] [Green Version]
- Ortega-Arbulú, A.; Pichler, M.; Vuillemin, A.; Orsi, W.D. Effects of Organic Matter and Low Oxygen on the Mycobenthos in a Coastal Lagoon. Environ. Microbiol. 2019, 21, 374–388. [Google Scholar] [CrossRef] [PubMed]
- Tõnno, I.; Freiberg, R.; Talas, L.; Kisand, A.; Belle, S.; Stivrins, N.; Alliksaar, T.; Heinsalu, A.; Veski, S.; Kisand, V. Drivers of Change and Ecosystem Status in a Temperate Lake over the Last Post-Glacial Period from 14.5 Kyr. bioRxiv 2020. [Google Scholar] [CrossRef]
- Kõljalg, U.; Nilsson, R.H.; Abarenkov, K.; Tedersoo, L.; Taylor, A.F.S.; Bahram, M.; Bates, S.T.; Bruns, T.D.; Bengtsson-Palme, J.; Callaghan, T.M.; et al. Towards a unified paradigm for sequence-based identification of fungi. Mol. Ecol. 2013, 22, 5271–5277. [Google Scholar] [CrossRef] [PubMed] [Green Version]
- Vasselon, V.; Bouchez, A.; Rimet, F.; Jacquet, S.; Trobajo, R.; Corniquel, M.; Tapolczai, K.; Domaizon, I. Avoiding Quantification Bias in Metabarcoding: Application of a Cell Biovolume Correction Factor in Diatom Molecular Biomonitoring. Methods Ecol. Evol. 2018, 9, 1060–1069. [Google Scholar] [CrossRef] [Green Version]
- Zimmermann, J.; Abarca, N.; Enk, N.; Skibbe, O.; Kusber, W.-H.; Jahn, R. Taxonomic Reference Libraries for Environmental Barcoding: A Best Practice Example from Diatom Research. PLoS ONE 2014, 9, e108793. [Google Scholar] [CrossRef]
- Zimmermann, H.; Stoof-Leichsenring, K.; Kruse, S.; Müller, J.; Stein, R.; Tiedemann, R.; Herzschuh, U. Changes in the Composition of Marine and Sea-Ice Diatoms Derived from Sedimentary Ancient DNA of the Eastern Fram Strait over the Past 30,000 Years. Ocean Sci. Discuss. 2020, 1–25. [Google Scholar] [CrossRef]
- An, S.; Choi, D.; Lee, H.; Lee, J.; Noh, J. Next-Generation Sequencing Reveals the Diversity of Benthic Diatoms in Tidal Flats. Algae 2018, 33, 167–180. [Google Scholar] [CrossRef]
- Piredda, R.; Sarno, D.; Lange, C.B.; Tomasino, M.P.; Zingone, A.; Montresor, M. Diatom Resting Stages in Surface Sediments: A Pilot Study Comparing Next Generation Sequencing and Serial Dilution Cultures. Cryptogam. Algol. 2017, 38, 31–46. [Google Scholar] [CrossRef]
- Piredda, R.; Claverie, J.; Decelle, J.; de Vargas, C.; Dunthorn, M.; Edvardsen, B.; Massana, R. Diatom Diversity through HTS-Metabarcoding in Coastal European Seas. Sci. Rep. 2018, 8, 1–12. [Google Scholar] [CrossRef] [PubMed] [Green Version]
- Bailet, B.; Apothéloz-Perret-Gentil, L.; Baričević, A.; Chonova, T.; Franc, A.; Frigerio, J.-M.; Kelly, M.; Mora, D.; Pfannkuchen, M.; Proft, S.; et al. Diatom DNA Metabarcoding for Ecological Assessment: Comparison among Bioinformatics Pipelines Used in Six European Countries Reveals the Need for Standardization. Sci. Total Environ. 2020, 745, 140948. [Google Scholar] [CrossRef] [PubMed]
- Garcés-Pastor, S.; Wangensteen, O.S.; Pérez-Haase, A.; Pèlachs, A.; Pérez-Obiol, R.; Cañellas-Boltà, N.; Mariani, S.; Vegas-Vilarrúbia, T. DNA Metabarcoding Reveals Modern and Past Eukaryotic Communities in a High-Mountain Peat Bog System. J. Paleolimnol. 2019, 62, 425–441. [Google Scholar] [CrossRef] [Green Version]
- Crease, T.; Colbourne, J. The Unusually Long Small-Subunit Ribosomal RNA of the Crustacean, Daphnia pulex: Sequence and Predicted Secondary Structure. J. Mol. Evol. 1998, 46, 307–313. [Google Scholar] [CrossRef]
- Stager, J.C.; Sporn, L.A.; Johnson, M.; Regalado, S.; Waldman, J.; Grunwald, C.; Wirgin, I.; Bryan, M.; Zalinski, D.; Filcek, K.; et al. Of Paleo-Genes and Perch: What if an “Alien” Is Actually a Native? PLoS ONE 2015, 10, e0119071. [Google Scholar] [CrossRef] [PubMed] [Green Version]
- Collins, R.A.; Bakker, J.; Wangensteen, O.S.; Soto, A.Z.; Corrigan, L.; Sims, D.W.; Genner, M.J.; Mariani, S. Non-specific Amplification Compromises Environmental DNA Metabarcoding with COI. Methods Ecol. Evol. 2019, 10, 1985–2001. [Google Scholar] [CrossRef]
- Bylemans, J.; Gleeson, D.M.; Lintermans, M.; Hardy, C.M.; Beitzel, M.; Gilligan, D.M.; Furlan, E.M. Monitoring Riverine Fish Communities through eDNA Metabarcoding: Determining Optimal Sampling Strategies along an Altitudinal and Biodiversity Gradient. Metab. Metagenom. 2018, 2, e30457. [Google Scholar] [CrossRef] [Green Version]
- Giusti, A.; Tinacci, L.; Sotelo, C.G.; Marchetti, M.; Guidi, A.; Zheng, W.; Armani, A. Seafood Identification in Multispecies Products: Assessment of 16SrRNA, cytb, and COI Universal Primers’ Efficiency as a Preliminary Analytical Step for Setting up Metabarcoding Next-Generation Sequencing Techniques. J. Agric. Food Chem. 2017, 65, 2902–2912. [Google Scholar] [CrossRef] [Green Version]
- de Filippo, C.; Meyer, M.; Prüfer, K. Quantifying and Reducing Spurious Alignments for the Analysis of Ultra-Short Ancient DNA Sequences. BMC Biol. 2018, 16, 121. [Google Scholar] [CrossRef] [Green Version]
- Alberdi, A.; Aizpurua, O.; Gilbert, M.T.P.; Bohmann, K. Scrutinizing Key Steps for Reliable Metabarcoding of Environmental Samples. Methods Ecol. Evol. 2018, 9, 134–147. [Google Scholar] [CrossRef] [Green Version]
- Pauvert, C.; Buée, M.; Laval, V.; Edel-Hermann, V.; Fauchery, L.; Gautier, A.; Vacher, C. Bioinformatics Matters: The Accuracy of Plant and Soil Fungal Community Data is Highly Dependent on the Metabarcoding Pipeline. Fungal Ecol. 2019, 41, 23–33. [Google Scholar] [CrossRef]
- Calderón-Sanou, I.; Münkemüller, T.; Boyer, F.; Zinger, L.; Thuiller, W. From Environmental DNA Sequences to Ecological Conclusions: How Strong Is the Influence of Methodological Choices? J. Biogeogr. 2020, 47, 193–206. [Google Scholar] [CrossRef] [Green Version]
- Boyer, F.; Mercier, C.; Bonin, A.; Le Bras, Y.; Taberlet, P.; Coissac, E. obitools: A Unix -Inspired Software Package for DNA Metabarcoding. Mol. Ecol. Resour. 2016, 16, 176–182. [Google Scholar] [CrossRef] [PubMed]
- Curd, E.E.; Gold, Z.; Kandlikar, G.S.; Gomer, J.; Ogden, M.; O’Connell, T.; Pipes, L.; Schweizer, T.M.; Rabichow, L.; Lin, M.; et al. Anacapa Toolkit: An Environmental DNA Toolkit for Processing Multilocus Metabarcode Datasets. Methods Ecol. Evol. 2019, 10, 1469–1475. [Google Scholar] [CrossRef] [Green Version]
- Skoglund, P.; Northoff, B.; Shunkov, M.; Derevianko, A.; Pääbo, S.; Krause, J.; Jakobsson, M. Separating Endogenous Ancient DNA from Modern Day Contamination in a Siberian Neandertal. Proc. Natl. Acad. Sci. USA 2014, 111, 2229–2234. [Google Scholar] [CrossRef] [Green Version]
- Jónsson, H.; Ginolhac, A.; Schubert, M.; Johnson, P.L.F.; Orlando, L. Mapdamage2. 0: Fast Approximate Bayesian Estimates of Ancient DNA Damage Parameters. Bioinformatics 2013, 29, 1682–1684. [Google Scholar] [CrossRef]
- Birks, J.B.H.; Lotter, A.F.; Juggins, S.; Smol, J.P. Tracking Environmental Change Using Lake Sediments: Data Handling and Numerical Techniques; Springer: Berlin/Heidelberg, Germany, 2012. [Google Scholar]
- Simpson, G.L. Modelling Palaeoecological Time Series Using Generalised Additive Models. Front. Ecol. Evol. 2018, 6, 149. [Google Scholar] [CrossRef] [Green Version]
- Alberdi, A.; Gilbert, M.T.P. A Guide to the Application of Hill Numbers to DNA-Based Diversity Analyses. Mol. Ecol. Resour. 2019, 19, 804–817. [Google Scholar] [CrossRef]
- Carøe, C.; Gopalakrishnan, S.; Vinner, L.; Mak, S.S.T.; Sinding, M.H.S.; Samaniego, J.A.; Wales, N.; Sicheritz-Pontén, T.; Gilbert, M.T.P. Single-Tube Library Preparation for Degraded DNA. Methods Ecol. Evol. 2018, 9, 410–419. [Google Scholar] [CrossRef]
- Meyer, M.; Kircher, M. Illumina Sequencing Library Preparation for Highly Multiplexed Target Capture and Sequencing. Cold Spring Harb. Protoc. 2010, 6. [Google Scholar] [CrossRef] [PubMed]
- Kataoka, N.; Tokiwa, Y.; Tanaka, Y.; Takeda, K.; Suzuki, T. Enrichment Culture and Isolation of Slow-Growing Bacteria. Appl. Microbiol. Biotechnol. 1996, 45, 771–777. [Google Scholar] [CrossRef]
- Vuillemin, A.; Wankel, S.D.; Coskun, Ö.K.; Magritsch, T.; Vargas, S.; Estes, E.R.; Spivack, A.J.; Smith, D.C.; Pockalny, R.; Murray, R.W.; et al. Archaea Dominate Oxic Subseafloor Communities over Multimillion-Year Time Scales. Sci. Adv. 2019, 5, eaaw4108. [Google Scholar] [CrossRef] [PubMed] [Green Version]
- Aragno, M.; Schlegel, H.G. The Hydrogen-Oxidizing Bacteria. In The Prokaryotes; Springer: Berlin/Heidelberg, Germany, 1981; pp. 865–893. [Google Scholar]
- Birck, C.; Epaillard, I.; Leccia, F.; Crassous, C.; Morand, A. Sentinel Lakes: A Network for the Study and Management of Mountain Lakes in the French Alps and in Corsica. Manag. Policy Issues 2013, 5, 1–7. [Google Scholar] [CrossRef] [Green Version]
- Gast, R.J.; Dennett, M.R.; Caron, D.A. Characterization of Protistan Assemblages in the Ross Sea, Antarctica, by Denaturing Gradient Gel Electrophoresis. Appl. Environ. Microbiol. 2004, 70, 2028–2037. [Google Scholar] [CrossRef] [Green Version]
- Van de Peer, Y.; De Rijk, P.; Wuyts, J.; Winkelmans, T.; De Wachter, R. The European Small Subunit Ribosomal RNA database. Nucleic Acids Res. 2000, 28, 175–176. [Google Scholar] [CrossRef] [Green Version]
- Edgar, R.C. UPARSE: Highly Accurate OTU Sequences from Microbial Amplicon Reads. Nat. Methods 2013, 10, 996–998. [Google Scholar] [CrossRef] [PubMed]
- Edgar, R.C.; Haas, B.J.; Clemente, J.C.; Quince, C.; Knight, R. UCHIME Improves Sensitivity and Speed of Chimera Detection. Bioinformatics 2011, 27, 2194–2200. [Google Scholar] [CrossRef] [PubMed] [Green Version]
- Pruesse, E.; Quast, C.; Knittel, K.; Fuchs, B.M.; Ludwig, W.; Peplies, J.; Glöckner, F.O. SILVA: A Comprehensive Online Resource for Quality Checked and Aligned Ribosomal RNA Sequence Data Compatible with ARB. Nucleic Acids Res. 2007, 35, 7188–7196. [Google Scholar] [CrossRef] [PubMed] [Green Version]
- Lefranc, M.; Thénot, A.; Lepère, C.; Debroas, D. Genetic Diversity of Small Eukaryotes in Lakes Differing by Their Trophic Status. Appl. Environ. Microbiol. 2005, 71, 5935–5942. [Google Scholar] [CrossRef] [Green Version]
- Lepère, C.; Boucher, D.; Jardillier, L.; Domaizon, I.; Debroas, D. Succession and Regulation Factors of Small Eukaryote Community Composition in a Lacustrine Ecosystem (Lake Pavin). Appl. Environ. Microbiol. 2006, 72, 2971–2981. [Google Scholar] [CrossRef] [PubMed] [Green Version]
- Lepère, C.; Domaizon, I.; Debroas, D. Unexpected Importance of Potential Parasites in the Composition of the Freshwater Small-Eukaryote Community. Appl. Environ. Microbiol. 2008, 74, 2940–2949. [Google Scholar] [CrossRef] [Green Version]
- Mangot, J.-F.; Domaizon, I.; Taib, N.; Marouni, N.; Duffaud, E.; Bronner, G.; Debroas, D. Short-Term Dynamics of Diversity Patterns: Evidence of Continual Reassembly within Lacustrine Small Eukaryotes. Environ. Microbiol. 2013, 15, 1745–1758. [Google Scholar] [CrossRef] [PubMed]
- Oksanen, A.J.; Blanchet, F.G.; Kindt, R.; Legendre, P.; Minchin, P.R.; Hara, R.B.O.; Simpson, G.L.; Solymos, P.; Stevens, M.H.H.; Wagner, H. The Vegan Package. Community Ecology Package. 2015. Available online: http://CRAN.R-project.org/package=vegan (accessed on 1 January 2019).
- Allen, J.; Watts, W.; McGee, E.; Huntley, B. Holocene Environmental Variability—The Record from Lago Grande Di Monticchio, Italy. Quat. Int. 2002, 88, 69–80. [Google Scholar] [CrossRef]
- Wohlfarth, B.; Luoto, T.P.; Muschitiello, F.; Väliranta, M.; Björck, S.; Davies, S.M.; Kylander, M.; Ljung, K.; Reimer, P.J.; Smittenberg, R.H. Climate and Environment in Southwest Sweden 15.5-11.3 Cal. Ka BP. Boreas 2018, 47, 687–710. [Google Scholar] [CrossRef] [Green Version]
- Alawi, M.; Schneider, B.; Kallmeyer, J. A Procedure for Separate Recovery of Extra-and Intracellular DNA from a Single Marine Sediment Sample. J. Microbiol. Methods 2014, 104, 36–42. [Google Scholar] [CrossRef]
- Wales, N.; Andersen, K.; Cappellini, E.; Ávila-Arcos, M.C.; Gilbert, M.T.P. Optimization of DNA Recovery and Amplification from Non-Carbonized Archaeobotanical Remains. PLoS ONE 2014, 9, e86827. [Google Scholar] [CrossRef] [PubMed] [Green Version]
- Hardy, S.; Legagneux, V.; Audic, Y.; Paillard, L. Reverse Genetics in Eukaryotes. Biol. Cell 2010, 102, 561–580. [Google Scholar] [CrossRef] [Green Version]
- Riaz, T.; Shehzad, W.; Viari, A.; Pompanon, F.; Taberlet, P.; Coissac, E. EcoPrimers: Inference of New DNA Barcode Markers from Whole Genome Sequence Analysis. Nucleic Acids Res. 2011, 39, 1–11. [Google Scholar] [CrossRef]
- Sogin, M.L.; Morrison, H.G.; Huber, J.A.; Mark Welch, D.; Huse, S.M.; Neal, P.R.; Arrieta, J.M.; Herndl, G.J. Microbial Diversity in the Deep Sea and the Underexplored “Rare Biosphere”. Proc. Natl. Acad. Sci. USA 2006, 103, 12115–12120. [Google Scholar] [CrossRef] [Green Version]
- Heinecke, L.; Fletcher, W.J.; Mischke, S.; Tian, F.; Herzschuh, U. Vegetation Change in the Eastern Pamir Mountains, Tajikistan, Inferred from Lake Karakul Pollen Spectra of the Last 28 Kyr. Palaeogeogr. Palaeoclimatol. Palaeoecol. 2018, 511, 232–242. [Google Scholar] [CrossRef] [Green Version]
- Bulat, S.; Lübeck, M.; Alekhina, I.; Jensen, D.F.; Knudsen, I.M.B.; Lübeck, P.S. Identification of a Universally Primed-PCR-Derived Sequence-Characterized Amplified Region Marker for an Antagonistic Strain of Clonostachys Rosea and Development. Appl. Environ. Microbiol. 2000, 66, 4758–4763. [Google Scholar] [CrossRef] [PubMed] [Green Version]
- Epp, L.; Boessenkool, S.; Bellemain, E.; Haile, J.; Esposito, A.; Riaz, T.; Stenoien, H.K. New Environmental Metabarcodes for Analysing Soil DNA: Potential for Studying Past and Present Ecosystems. Mol. Ecol. 2012, 21, 1821–1833. [Google Scholar] [CrossRef]
- Gebremedhin, B.; Flagstad, Ø.; Bekele, A.; Chala, D.; Bakkestuen, V.; Boessenkool, S.; Popp, M.; Gussarova, G.; Schrøder-Nielsen, A.; Nemomissa, S.; et al. DNA Metabarcoding Reveals Diet Overlap between the Endangered Walia Ibex and Domestic Goats–Implications for Conservation. PLoS ONE 2016, 11, e0159133. [Google Scholar] [CrossRef] [PubMed]
- Dean, W. Determination of Carbonate and Organic Matter in Calcareous Sediments and Sedimentary Rocks by Loss on Ignition; Comparison with Other Methods. J. Sediment. Res. 1974, 44, 242–248. [Google Scholar]
- Heiri, O.; Lotter, A.F.; Lemcke, G. Loss on Ignition as a Method for Estimating Organic and Carbonate Content in Sediments: Reproducibility and Comparability of Results. J. Paleolimnol. 2001, 25, 101–110. [Google Scholar] [CrossRef]
- Jensen, C.; Vorren, K.-D. Holocene Vegetation and Climate Dynamics of the Boreal Alpine Ecotone of Northwestern Fennoscandia. J. Quat. Sci. 2008, 23, 719–743. [Google Scholar] [CrossRef]
- Nesje, A. A Piston Corer for Lacustrine and Marine Sediments. Arct. Alp. Res. 1992, 24, 257–259. [Google Scholar] [CrossRef]
- Juggins, S. Rioja: Analysis of Quaternary Science Data v0.9-21 (CRAN, 2017). Available online: https://rdrr.io/cran/rioja/man/PTF.html (accessed on 1 January 2019).
- Bienert, F.; De Danieli, S.; Miquel, C.; Coissac, E.; Poillot, C.; Brun, J.-J.; Taberlet, P. Tracking Earthworm Communities from Soil DNA. Mol. Ecol. 2012, 21, 2017–2030. [Google Scholar] [CrossRef]
- Yoccoz, N.G. The Future of Environmental DNA in Ecology. Mol. Ecol. 2012, 21, 2031–2038. [Google Scholar] [CrossRef] [PubMed]
- Foucher, A.; Evrard, O.; Ficetola, G.F.; Gielly, L.; Poulain, J.; Giguet-Covex, C.; Laceby, J.P.; Salvador-Blanes, S.; Cerdan, O.; Poulenard, J. Persistence of Environmental DNA in Cultivated Soils: Implication of this Memory Effect for Reconstructing the Dynamics of Land Use and Cover Changes. Sci. Rep. 2020, 10, 10502. [Google Scholar] [CrossRef] [PubMed]
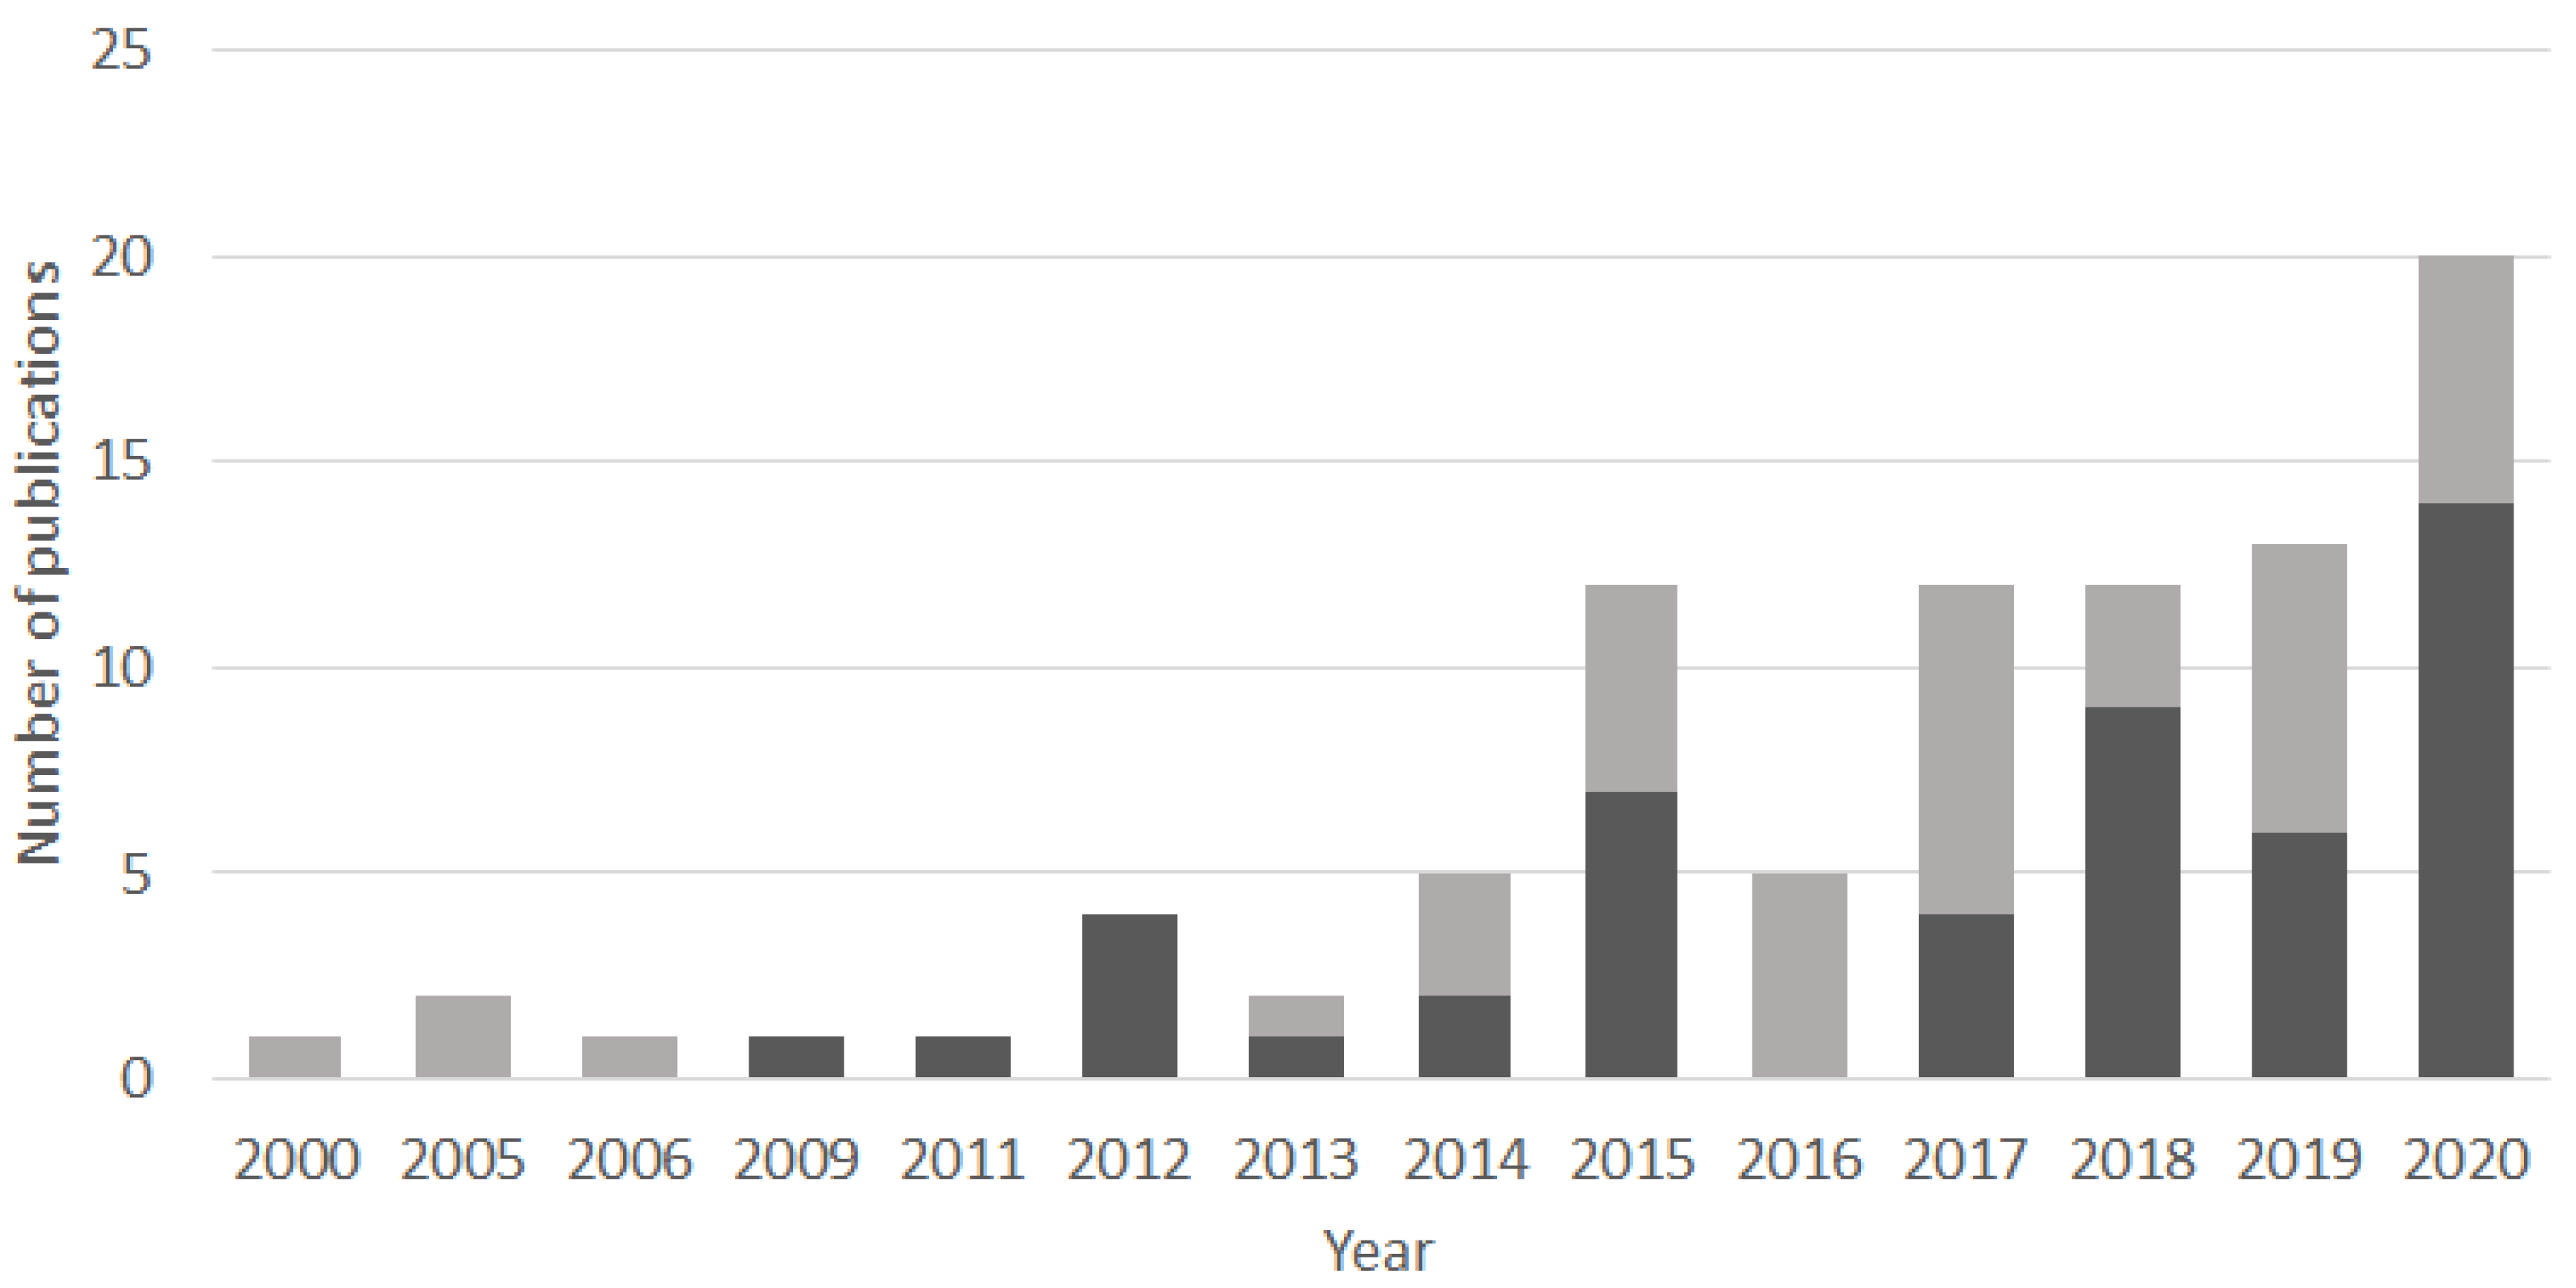


| Organisms | Genic Regions | Length (bp) | References |
|---|---|---|---|
| plants | tnrL P6 loop | 49–188 | [201] |
| mammals | 16S mtDNA | 60–84 | [31] |
| fish | 12S gene | 163–185 | [221] |
| zooplankton | 18S V7 | 100–110 | [222] |
| zooplankton | COI gene | 313 | [223] |
| microbial eukaryotes | 18S V1-V3 | 560 | [11] |
| microbial eukaryotes | 18S V4 | 300–540 | [78] |
| microbial eukaryotes | 18S V7 | 260 | [76] |
| microbial eukaryotes | 18S V9 | 130 | [79] |
| fungi | ITS2 region | 250–500 | [224] |
| diatoms | rbcL gene | 67–76 | [105] |
| diatoms | rbcL gene | 577 | [142] |
| diatoms | 18S V4 | 400 | [225] |
| archaea | 16S gene | 220 | [91] |
| bacteria | 16S gene | 194 | [97] |
| ammonium-oxidizing bacteria | amoA gene | 635 | [91] |
| cyanobacteria | 16S gene | 400 | [74] |
| methanotrophs | 16S gene | 111–200 | [97] |
| dsDNA virus | mcp gene | 260 | [88] |
Publisher’s Note: MDPI stays neutral with regard to jurisdictional claims in published maps and institutional affiliations. |
© 2021 by the authors. Licensee MDPI, Basel, Switzerland. This article is an open access article distributed under the terms and conditions of the Creative Commons Attribution (CC BY) license (http://creativecommons.org/licenses/by/4.0/).
Share and Cite
Capo, E.; Giguet-Covex, C.; Rouillard, A.; Nota, K.; Heintzman, P.D.; Vuillemin, A.; Ariztegui, D.; Arnaud, F.; Belle, S.; Bertilsson, S.; et al. Lake Sedimentary DNA Research on Past Terrestrial and Aquatic Biodiversity: Overview and Recommendations. Quaternary 2021, 4, 6. https://0-doi-org.brum.beds.ac.uk/10.3390/quat4010006
Capo E, Giguet-Covex C, Rouillard A, Nota K, Heintzman PD, Vuillemin A, Ariztegui D, Arnaud F, Belle S, Bertilsson S, et al. Lake Sedimentary DNA Research on Past Terrestrial and Aquatic Biodiversity: Overview and Recommendations. Quaternary. 2021; 4(1):6. https://0-doi-org.brum.beds.ac.uk/10.3390/quat4010006
Chicago/Turabian StyleCapo, Eric, Charline Giguet-Covex, Alexandra Rouillard, Kevin Nota, Peter D. Heintzman, Aurèle Vuillemin, Daniel Ariztegui, Fabien Arnaud, Simon Belle, Stefan Bertilsson, and et al. 2021. "Lake Sedimentary DNA Research on Past Terrestrial and Aquatic Biodiversity: Overview and Recommendations" Quaternary 4, no. 1: 6. https://0-doi-org.brum.beds.ac.uk/10.3390/quat4010006