Article

Sedimentological-Geochemical Data Based Reconstruction of Climate Changes and Human Impacts from the Peat Sequence of Round Lake in the Western Foothill Area of the Eastern Carpathians, Romania

1
Department of Geology and Palaeontology, University of Szeged, Egyetem Str. 2-6, H-6722 Szeged, Hungary
2
Isotope Climatology and Environmental Research Centre, Institute for Nuclear Research, Bem Square 18/c, H-4026 Debrecen, Hungary
3
Institute for Geological and Geochemical Research, RCAES, Budaörsi Str. 45, H-1112 Budapest, Hungary
*
Author to whom correspondence should be addressed.
Submission received: 17 March 2021 / Revised: 3 May 2021 / Accepted: 28 May 2021 / Published: 10 June 2021
(This article belongs to the Special Issue Quaternary Loess Deposition and Climate Change)

Abstract

:
This paper presents the results of comparative sedimentological and geochemical analysis of the mire at Sânpaul, Round Lake (Kerek-tó). The palaeoecological site is situated in the western foothill area of the Eastern Carpathians in Romania. The primary objective of this study was to analyse the accumulation of major and trace elements in a 7500 year-long peat and lake deposition. The concentrations of 13 elements were determined by using handheld XRF. This paper presents the results of a multidisciplinary study, for which the principal aims were to examine the long-term relationship between land degradation in the Homoród Hills using various palaeoecological techniques, primarily comparative geochemical analyses. The PCA of elemental concentrations suggests that Round Lake is mainly controlled by the input of inorganic mineral matter and the LOI550 of peat. However, some elements are influenced by biological processes of vegetation and groundwater. Geohistorical studies compared with vegetation changes and elemental distribution helped the detection of erosion phases in the level of 12 prehistoric cultures.

1. Introduction

Peats are accumulated and formed by the partial decomposition of mosses and other bryophytes, sedges, grasses, shrubs and trees under waterlogged conditions [1]. Peatlands are important paleoenvironmental archives, enclosing plant matter, soil deposition, atmospheric particles and anthropogenic aerosols. Geochemical analysis of these objects has an important role in paleoenvironmental and palaeoclimatological investigations because major and trace elements are the indicators of natural environmental and anthropogenic processes. Their presence can be attributed to the soil, vegetation, atmospheric precipitation and groundwater supply [1,2,3,4,5,6,7].
Round Lake is a dried-up, human-made rainwater reservoir lake, used for watering livestock at the end of the 19th century. This protected the Holocene 7500 year-long peat and lake record from dehydration and degradation, rendering it ideal for absolute dated palaeoecological and paleoenvironmental studies. Moreover, as there are Medieval, Roman Imperial and even older settlements in the vicinity of the site, potential records of human impact on the site must have been preserved as well. The peat and sediment layers of the lake basin provide a record of climatic, palaeoecological and hydrological changes and are suitable to reconstruct the relationship between prehistoric human communities and their surrounding environment. Today Round Lake is surrounded by a wet meadow with shrubs and trees [8]. Our work was mainly motivated by the fact that the examined site is located near the lower part of the mid-mountain zone and up to now Transylvanian environmental historical works, based on geochemistry and pollen analyses, focused solely on high mountains or hilly-alluvial areas [9,10,11,12,13,14,15,16,17,18,19,20].

2. Materials and Methods
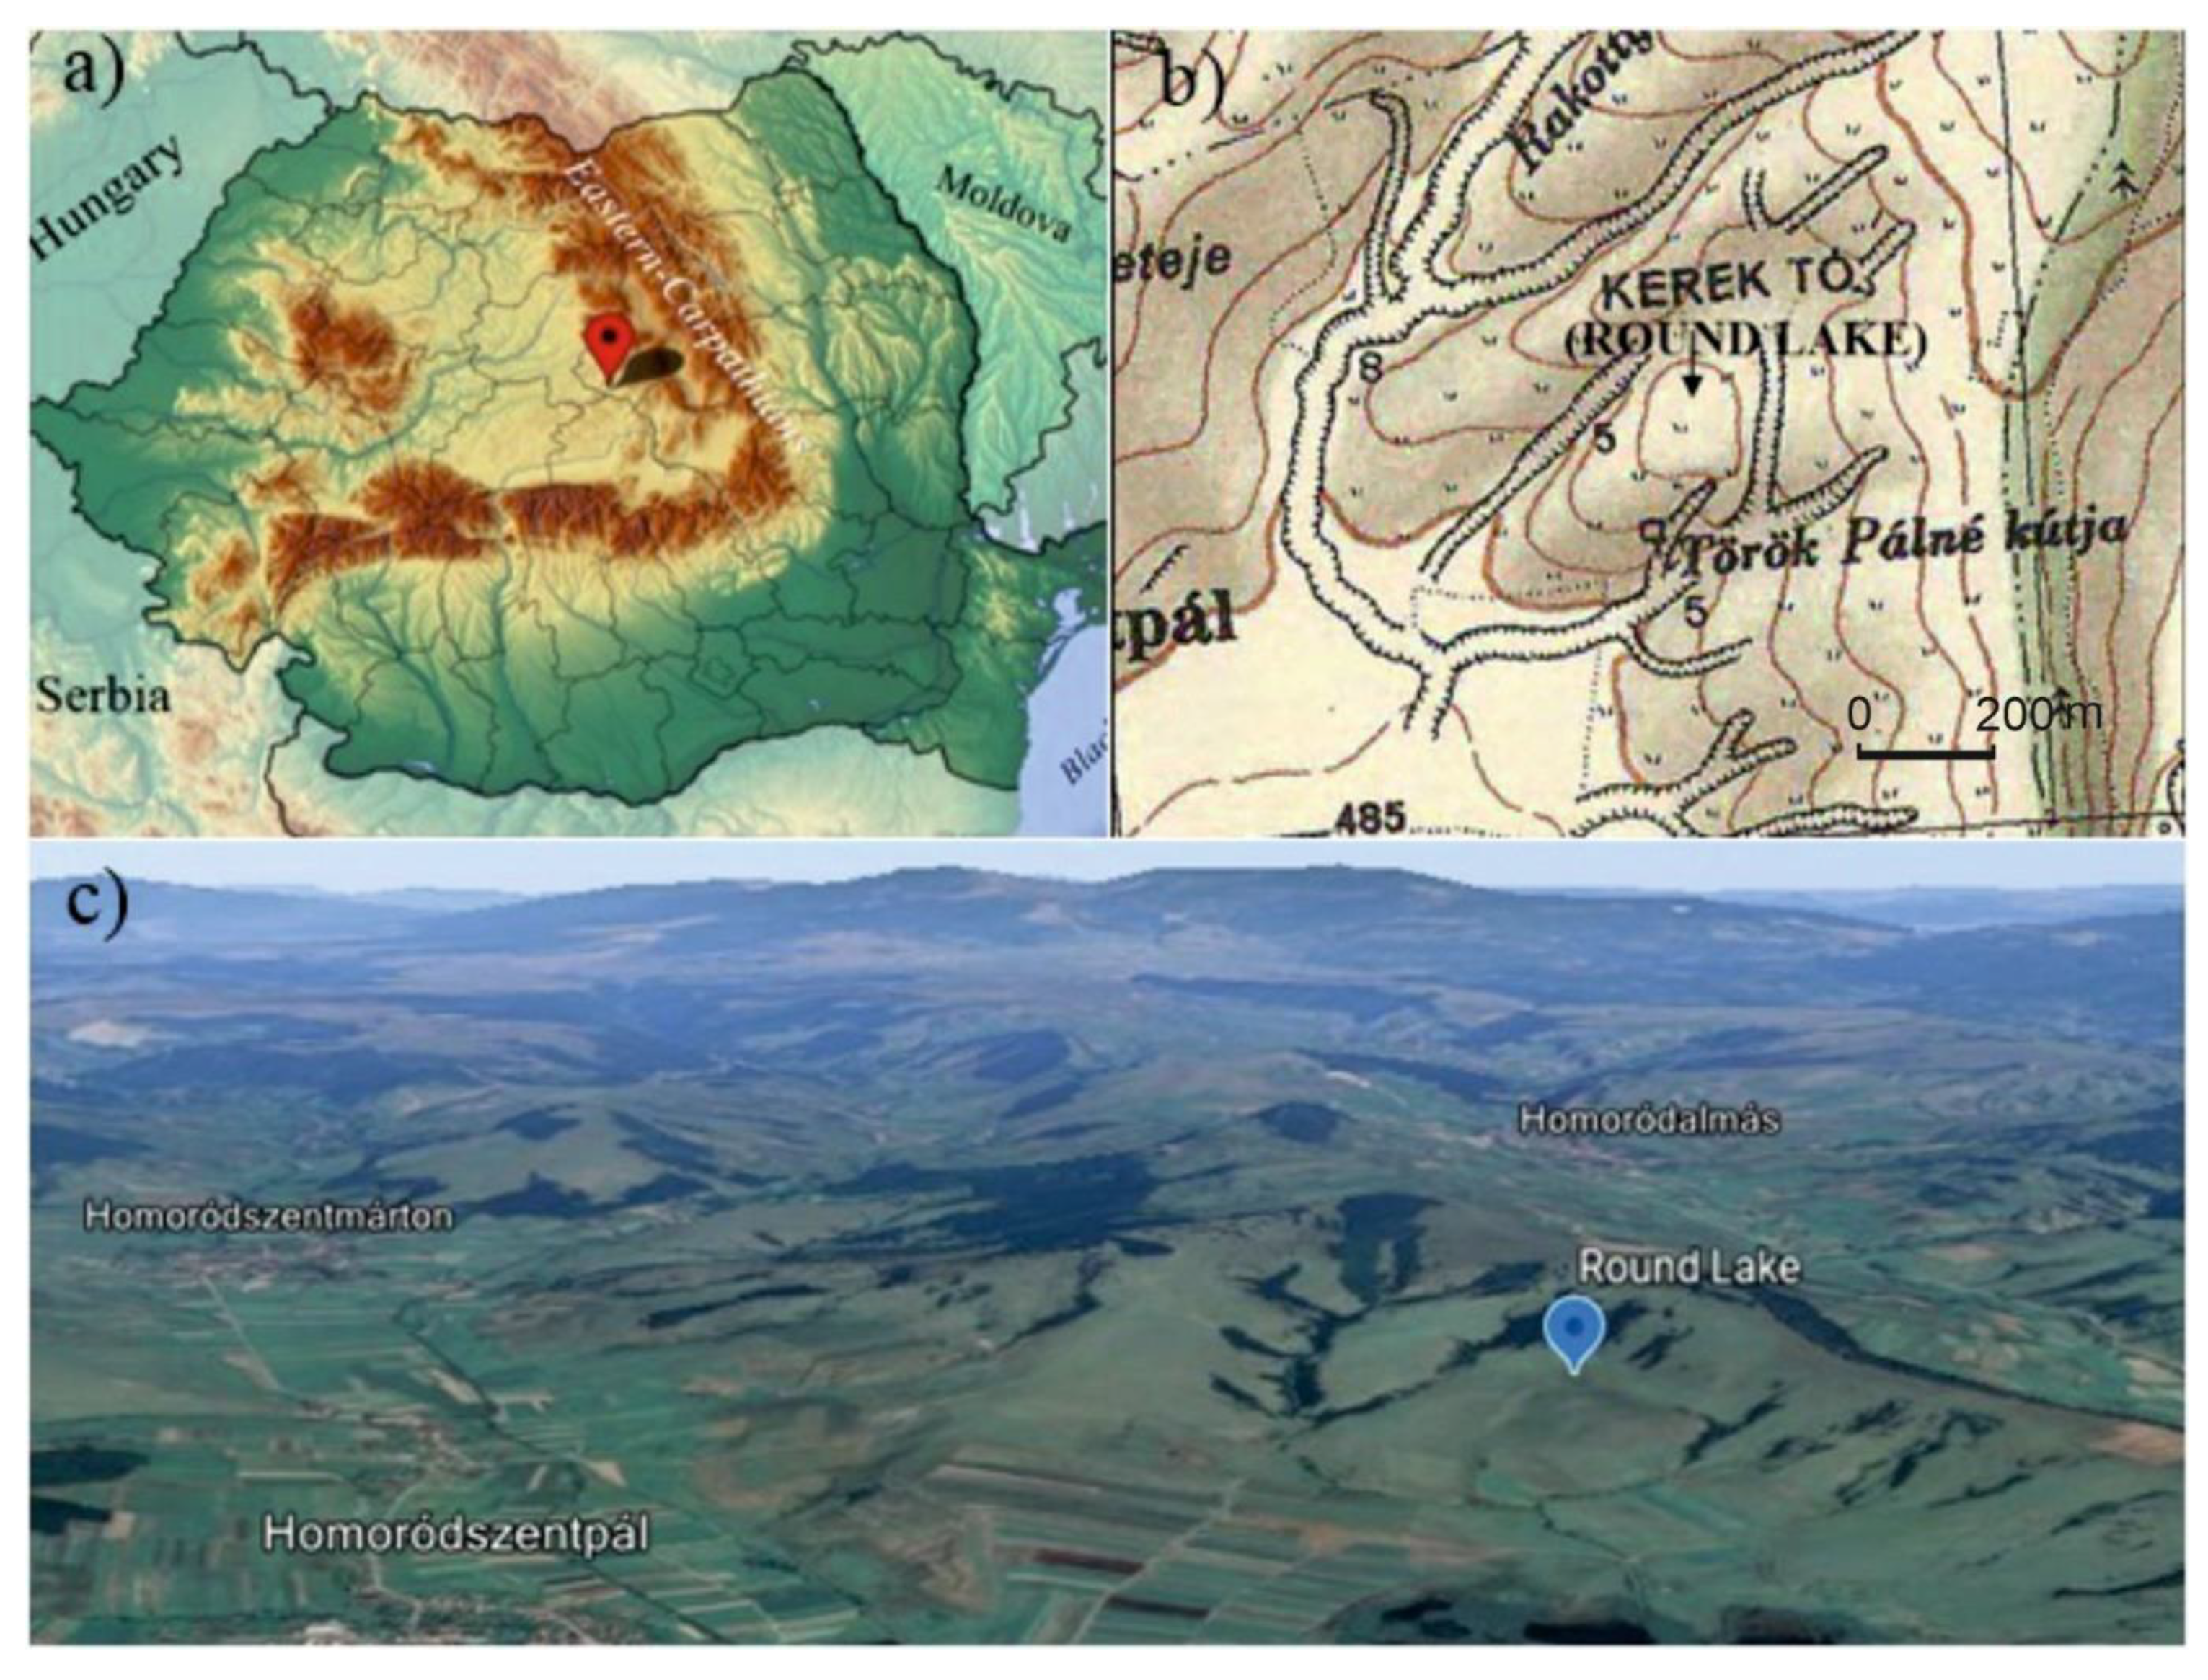
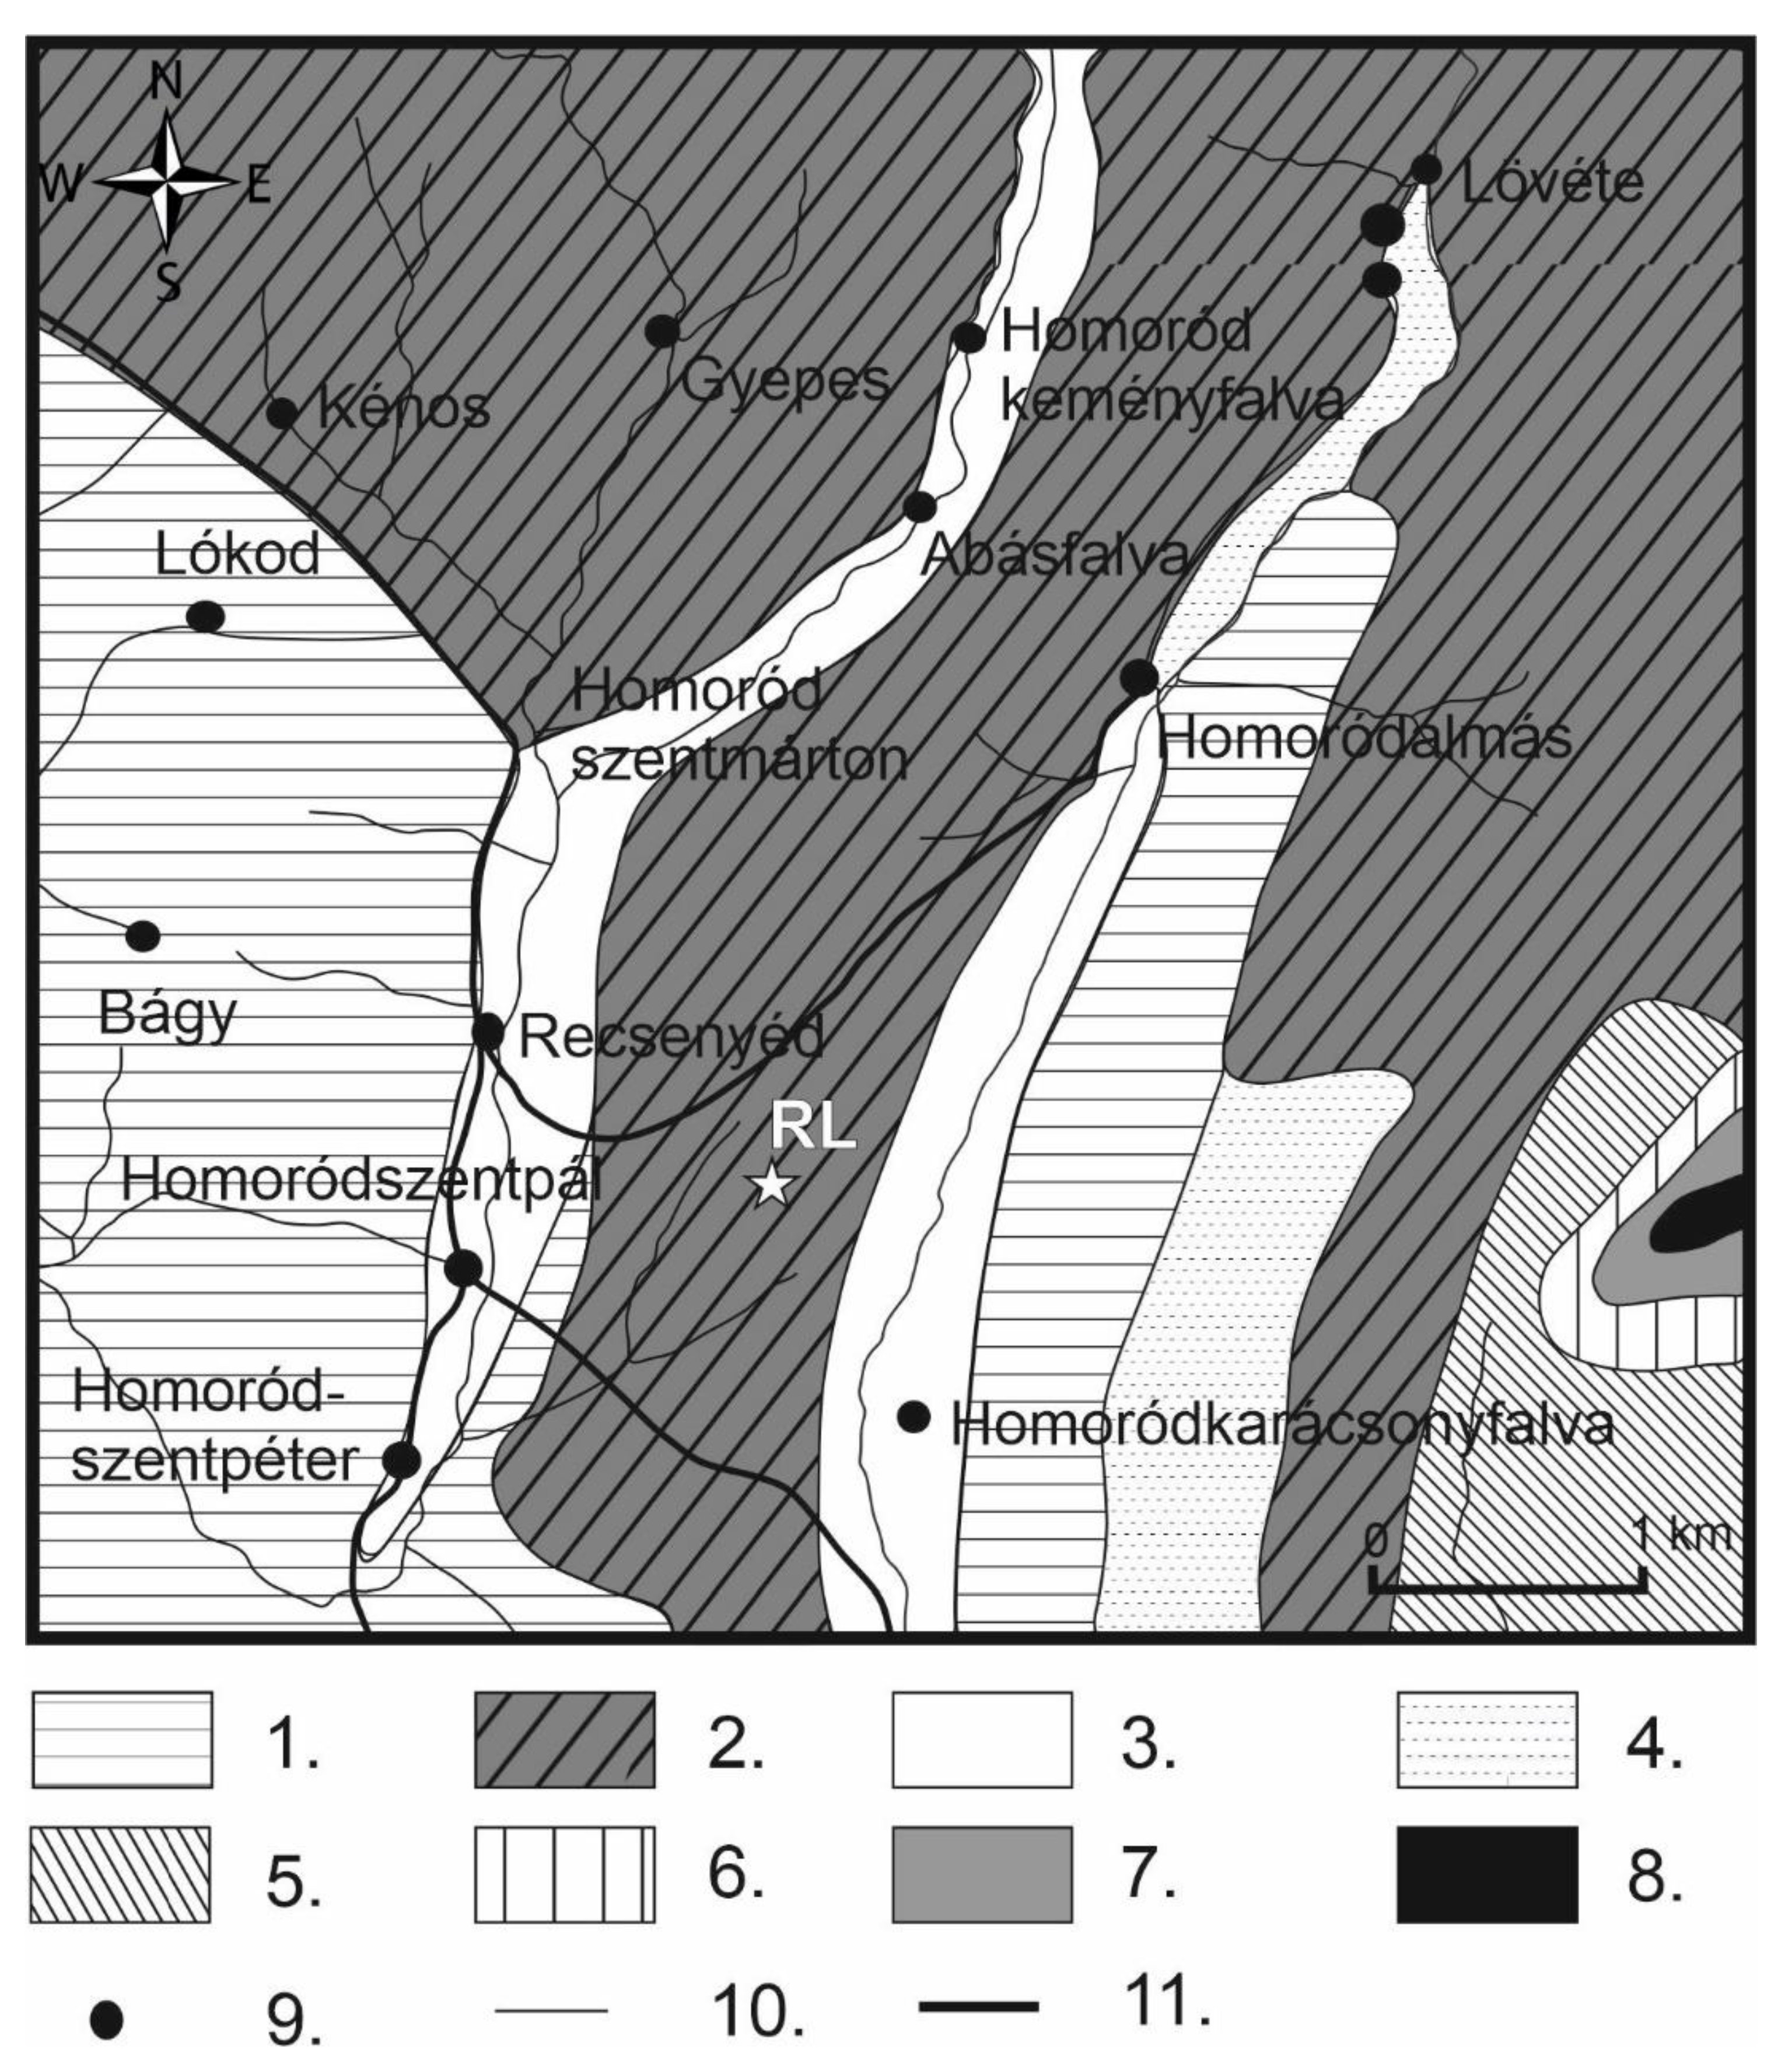
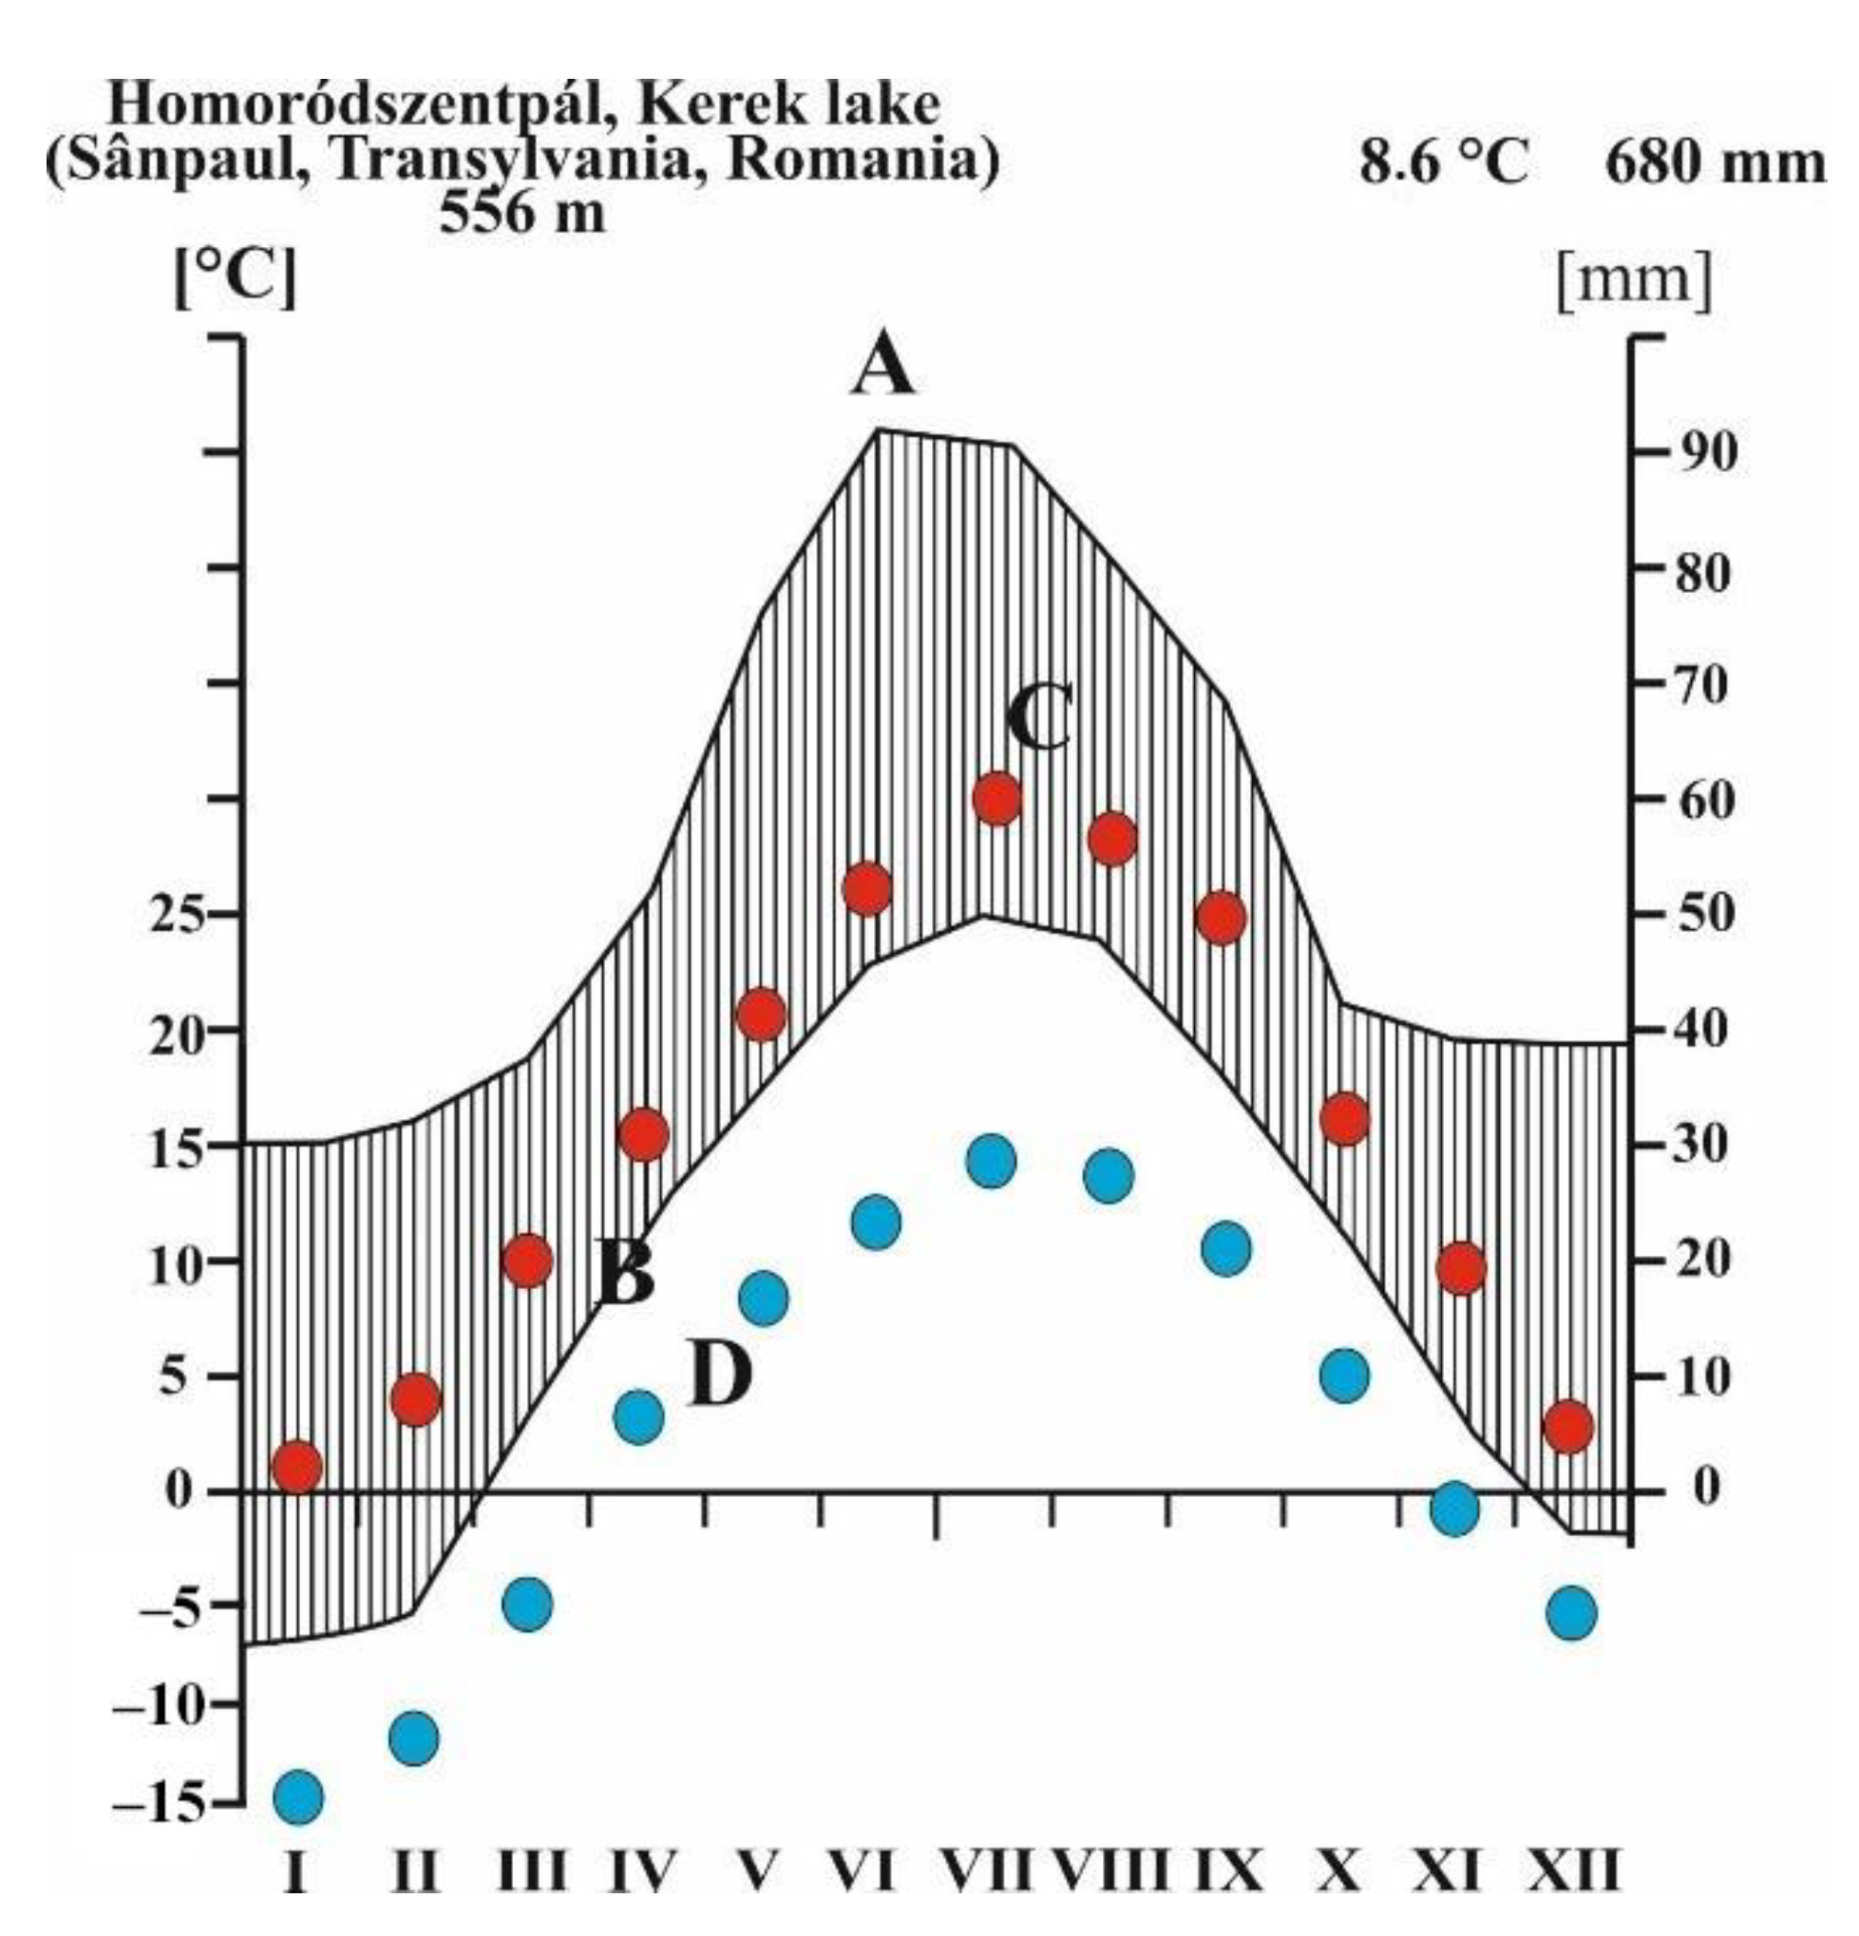
2.1. Site Location

Round Lake is situated in the southwestern foothills of Hargita Mountains in the Eastern Carpathians at an altitude of 547 m above sea level (Figure 1). The area of the former lake, which was located 2 km northeast of Sânpaul (Transylvania, Romania), may have been approximately 2–3 hectares. The wider surrounding of the bedrock consists of tertiary silty clay layers at the bottom, overlain by Late Tertiary-Quaternary volcanic tuff and tuffite [21,22].
The foothill surfaces around Sânpaul are comprised of middle Miocene (primary Sarmatian) siliciclastics, while along the valleys Quaternary alluvial deposits occur (Figure 2). The topmost part of the hills, hence the limbs of the anticline consist of Sarmatian marls, sandstone and few centimetre-thick tuff layers [23,24]. The folds, observable around Sânpaul, were formed as a result of a large, basin-scale late Miocene (primary Sarmatian) gravitational slide which affected the whole Transylvanian Basin [24]. The salt pushed the covering Sarmatian sedimentary record on different scales, but in several places, like Sânpaul, the salty subsoil water extruded to the surface [25] in the alluvial surfaces of the Quaternary valleys. During the Quaternary the climate changes and the sediment supply vs. rivers low base level and transport capacity filled up the valleys, generating wetlands in the floodplain (lakes and swamps within salty lakes) [26,27,28]. The catchment basin of Round Lake is surrounded by an extensive pastureland surface with some pine forests and degraded, eroded soil blanket. Based on the excavations at the edge of the pastureland, the original soil may have been brown earth. The original vegetation has been completely changed to pastures and subordinately arable land. The current vegetation of the surroundings of the catchment basin can be defined as a mixture of pine patches and strips, and overgrazed meadows. In addition to the deforestation activities as basic human impact [29], the soil erosion intensified–similar to the regressive valley evolution, can be observed in the area–by the strong tectonic uplift of the Eastern Carpathians-including Seklerland and Subcarpatii Homoroadelor regions [30,31,32].
This region forms a contact area between the so-called Transylvanian Plain and the foothill region of the Hargita Mountains, characterized by 500–700 m high hills, and a large antecedent valley system within fishponds and a few salty lakes. Today, the climate in the region is temperate continental, and can be characterized by 7–9 °C annual mean temperature and 550–600 mm annual mean precipitation (Figure 3) with the highest values in boreal spring and summer [26]. The climate data on which the Walter-Lieth diagram is based, have been interpreted for the Round Lake of Sânpaul l because there is no climate station with standard, public data. Based on the climate data, the natural vegetation–without human impact–would be suggested as a temperate closed forest (beeches, hornbeam with beeches) with well-developed brown forest soil. Due to the human impact, the natural forest cover is completely missing. The soil cover has been transformed into anthrasol and earthy barren soil [33].

2.2. Sampling

Coring was accomplished by a 5 cm diameter sealed liner tube Russian peat corer [34,35] in the centre of the former lake in June 2015. Two overlapping cores were extracted, conforming to the general practice in Quaternary paleoenvironmental studies [35]. After transportation to the lab, they were cut in half lengthwise. Sections for sedimentological, geochemical and palaeobotanical analysis were stored at 4 °C by the international standard. The core was sliced into 4-cm intervals for geochemical analysis.

2.3. Magnetic Susceptibility Analysis

Environmental magnetic analyses were carried out on bulk samples [36,37,38,39]. Samples were collected at 1–4 cm intervals. Before the start of the measurement, all samples were crushed in a glass mortar after weighing. At that time samples were cased in plastic boxes and dried in air in an oven at 40 °C for 24 h. Afterwards, magnetic susceptibilities were measured at a frequency of 2 kHz using an MS2 Bartington magnetic susceptibility meter with an MS2E high-resolution sensor [40,41]. All of the samples were measured three times, and the average values of magnetic susceptibility were computed and reported. The MS is used to detect paleosol layers in loess sediments [36,39,42,43,44]. In our case, the presence of magnetic minerals in the mire was used for the appearance of soil and rock erosion [45].

2.4. Sedimentological Analysis and Lithological Description

Grain-size composition was determined using the Mie method. Samples were pre-treated with 1 M HCl and H2O2 to remove CaCO3 and LOI550, respectively. For a more detailed description of the pre-treatment process, see [46]. All the samples were measured for 42 size intervals between 0.0001 and 0.5 mm using a Laser Particle Size Analyzer type Easy Sizer 2.0 and Fritsch sieves at the Geoarchaeological and Palaeoecological Lab of the Department of Geology and Palaeontology, University of Szeged, Hungary.
The lithostratigraphic description of the samples followed the system of Troels-Smith [47,48,49], which was developed for unconsolidated sediments. The basis of the system is the consideration of Quaternary lake, swamp and peat sediments as a mixture of a specified number of components and grouping them into six categories according to their genetics.

2.5. Loss-On Ignition

For LOI examination sub-samples were taken at every 2 cm intervals and the loss on ignition method was applied, commonly used for the analysis of LOI550 and carbonate content of calcareous sediments [50,51,52]. In the first step, the samples are prepared for analysis by drying (60 °C) and grounding. Approximately 1 g of sample was weighed accurately into a porcelain crucible, which was weighed before and after heating and the two weights compared. The sample placed in a previously weighed crucible, and oven-drying at 105 °C (24 h) to constant weight. The cooled samples are then weighed to obtain the weight of the air-dry sample. In the second phase, the samples are heated at 550 °C (2.5 h), to combust the LOI550. The LOI550 content is calculated from the the following equation.
LOI550 = ((DW105 − DW550)/DW105) × 100
In the third and final phase, the sample is heated at 950 °C (DEAN 1974, HEIRI et al., 2001) [52,53], to evolve the carbonate content. Calculated as:
LOI950 = ((DW550 − DW950)/DW105) × 100
According to Santiteban et al., 2004. [54] we use LOI550, LOI950 and LOI res (residum) expressions for different stages of measurements.

2.6. Sample Preparation and Geochemical Analysis

The element composition analysis of samples was performed with Spectro xSort COMBI HH03 handheld X-ray fluorescence spectrometer (pXRF), equipped with a Rh tube and SSD detector. During the measurements, the handheld XRF was placed in a docking station. The element compositions (Mg to U) were measured with Mining FP calibration. This calibration tested with certificated CRM geological standards samples.
Samples were prepared for measurement by drying at 105 °C to constant weight, then grinded to less than 63 micrometre particle size. Each sample prepared 3 times to parallel measurements. To the measurement 5 gram sample infused to the plastic sample holder following the Spectro sample preparation guide. The uniform density of the samples was guaranteed by pressure. The measurement time with two filter 180 s/sample. Measurement results were evaluated using the XRF Analyzer Pro program. After each sample series we plotted the cal. concentration and net count data as a cross plot. The fitted equation R2 parameter more than 0.9.

2.7. Statistical Analysis and PCA

Statistical analysis was performed by using SPSS 25.0 statistical software package and PAST 3X Paleontological Data Analysis [53]. Spearman rho correlation coefficient was used for the XRF data. Principal Component analysis was used to identify the main factors that control elemental distribution in the core section. The PCA was performed in the correlation mode and a varimax rotation to maximize the loadings of the variables in the components. Before analysis all data were converted to Z-scores calculated as (Xi − Xavg)/Xstd, where Xi is the variable and Xavg and Xstd are the series average and standard deviation, respectively, of the variable Xi [54,55].

2.8. Radiocarbon Dating

AMS 14C dating was performed in the Hertelendi Laboratory of Environmental Studies in the Nuclear Research Center of the Hungarian Academy of Sciences in Debrecen (Hungary) and Direct AMS Laboratory in Seattle (USA) on ten samples for plants and peat samples from the core sequence. The preparation of the samples and the actual steps of the measurement followed the methods of Hertelendi et al. [56,57,58,59,60,61,62,63,64,65,66,67,68] and Molnár et al. [59]). The-depth model was generated using Bacon [60,61]. Conventional radiocarbon ages were converted to calendar ages using IntCal20 calibration curve [62]. Calibrated ages are reported at the 2-sigma confidence level (95.4%).

2.9. Pollen Analysis

The undisturbed core sequence was sampled for pollen at 4-cm intervals. Samples of 1 cm3 wet sediment were prepared for pollen analysis in the pollen laboratory of the Department of Geology and Palaeontology at Szeged University using standard methods and micro-sieving at 10 um [63]. Lycopodium spore tablets of known concentrations were added to each sample [64] to work out pollen concentrations. Pollen and spores were identified and counted under a light microscope at 400–1000× magnification. Minimum 500 pollen grains were counted. For the identification of pollen and spores, the reference database of the Department of Geology and Palaeontology at Szeged University and pollen atlases and keys were used [65,66,67,68]. The palaeovegetation was reconstructed using the works of Sugita [69], Soepboer et al. [70], Jacobson and Bradshaw [71], Prentice [72] and Magyari et al. [73,74]. Statistical analysis and plotting of the pollen data were done using the software package Psimpoll [75,76].

3. Results

The characteristics of Round Lake peat are various; thus, 6 different sediment types and 16 layers can be distinguished [77]. The dominant botanical composition of the peat is reed and sedge peat, and two Sphagnum peat layers present in two sections (320–362 cm and 510–530 cm). In terms of its evolution, the sequence can be divided into a lake sediment zone (0–104 cm), a mire zone (198–560 cm) and the upper part of the mire zone can be defined as a geochemical transition zone (104–198 cm).

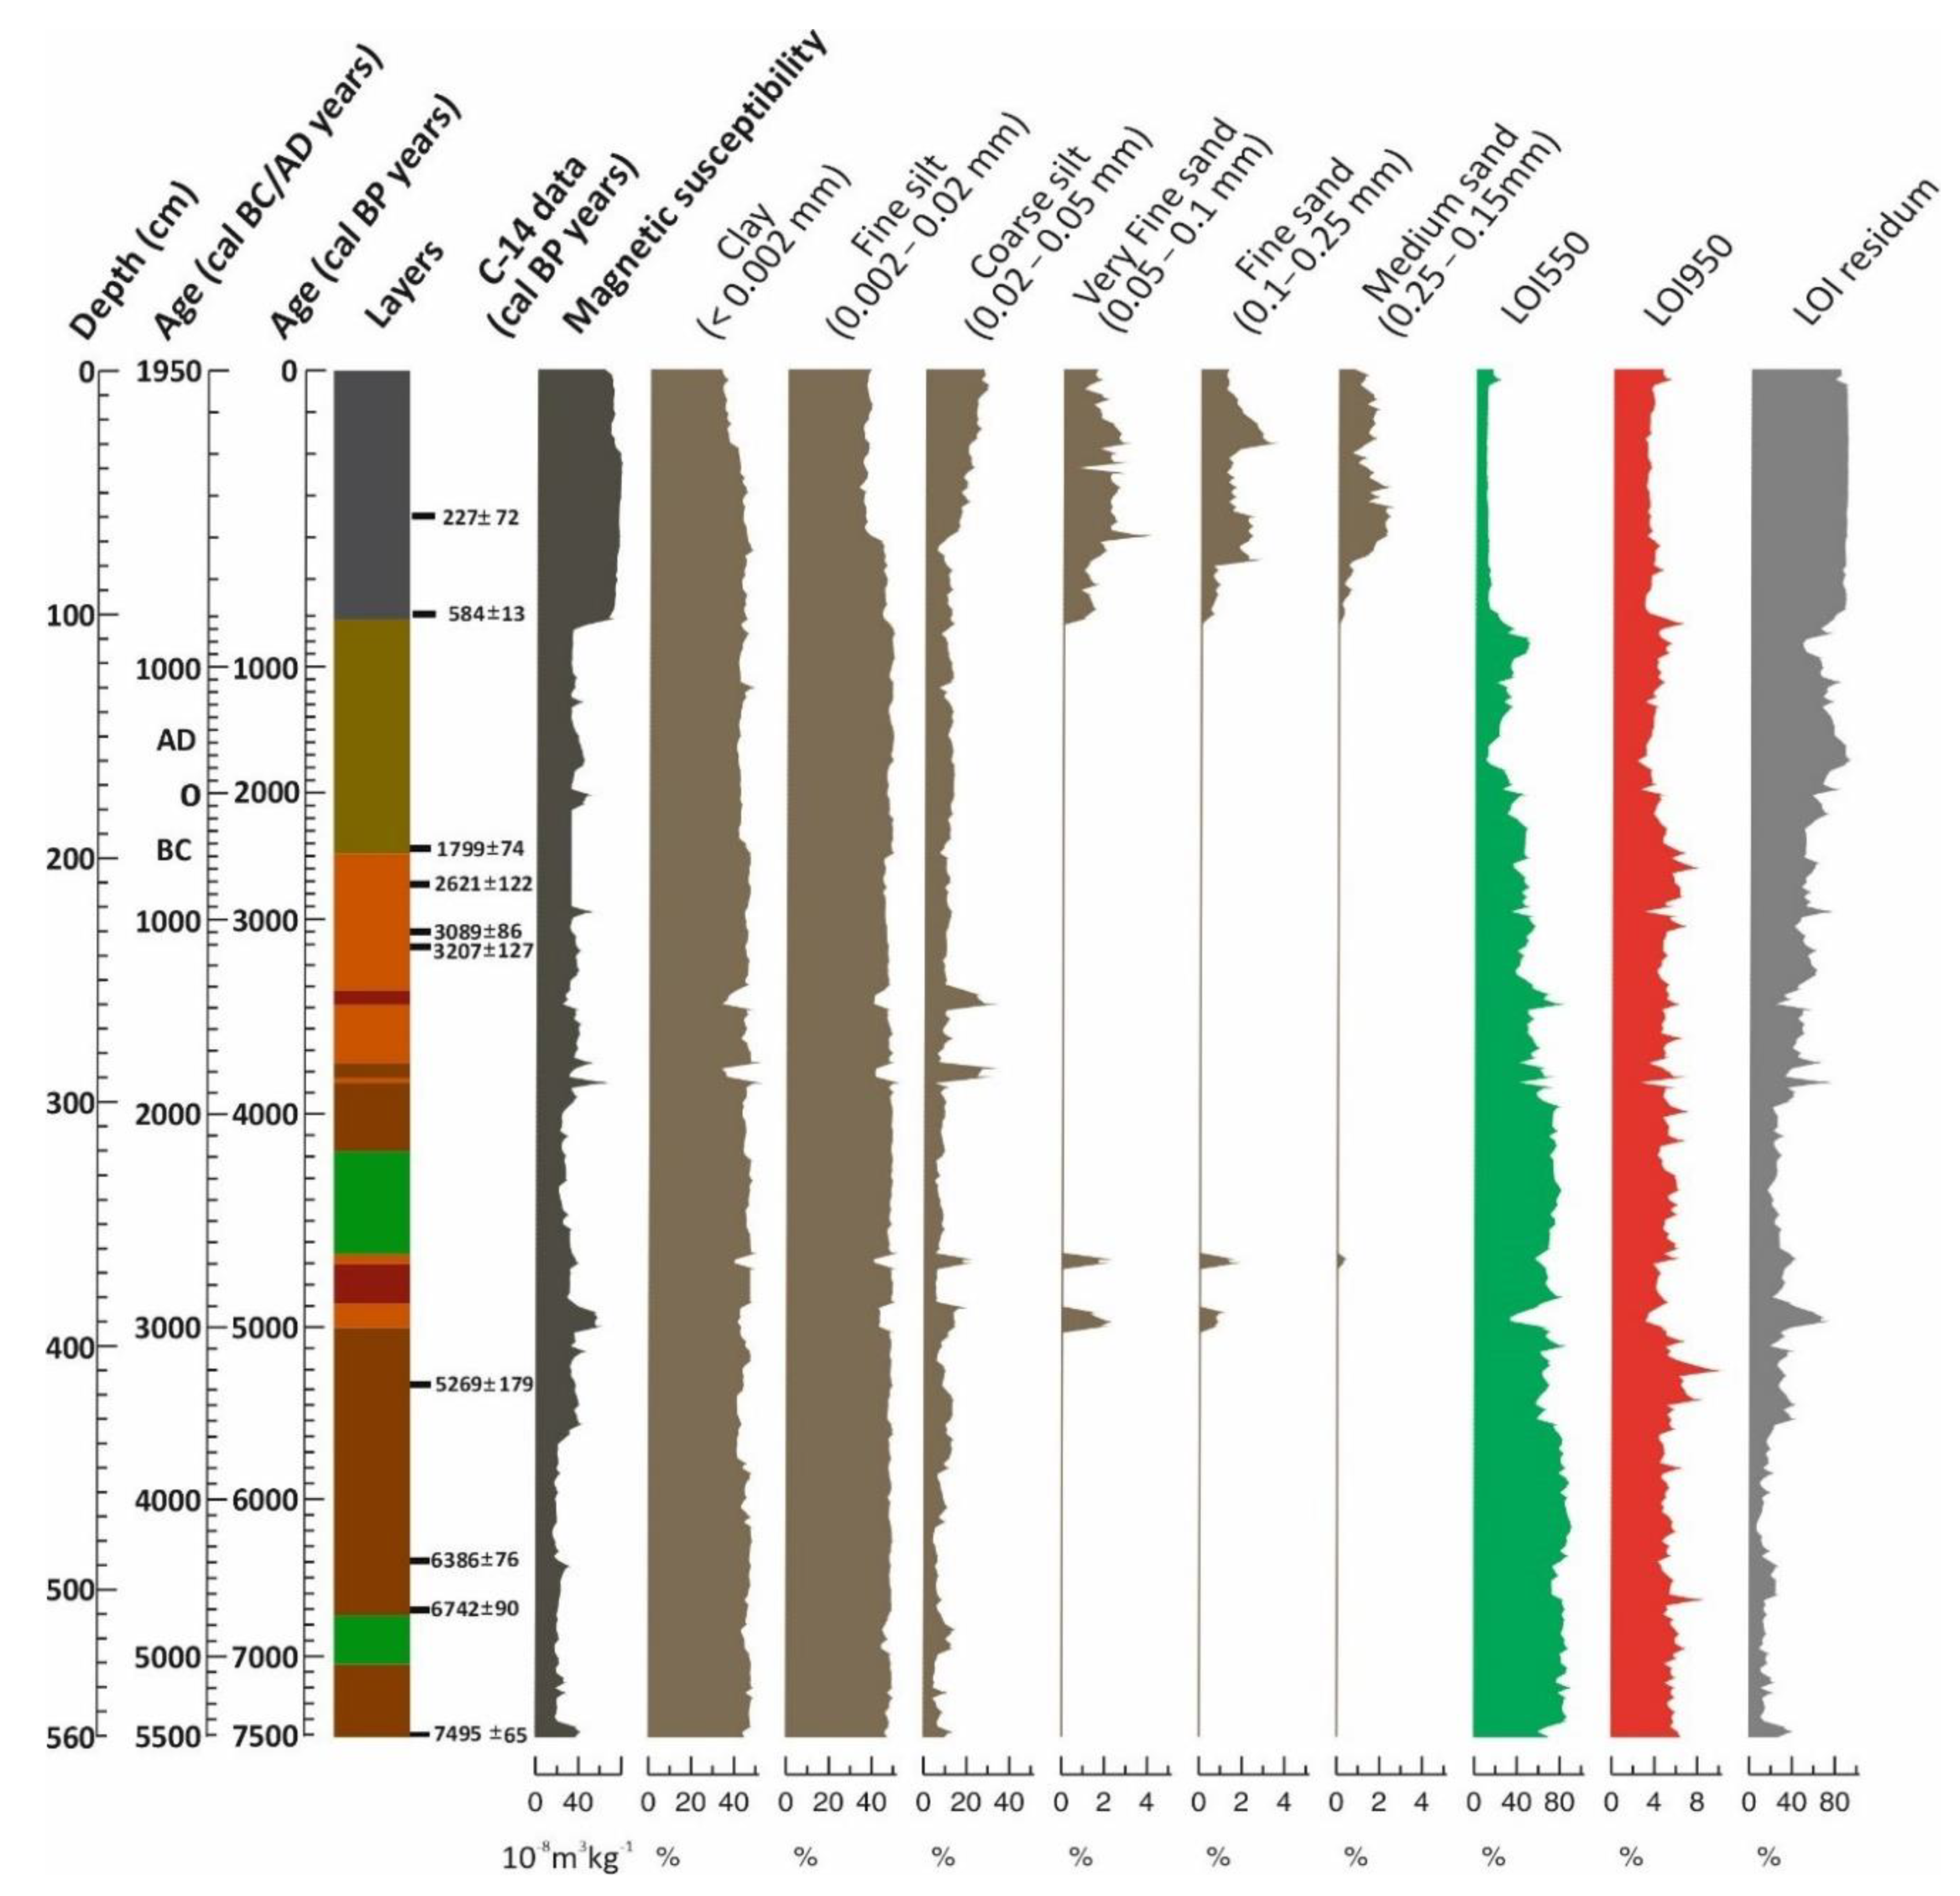
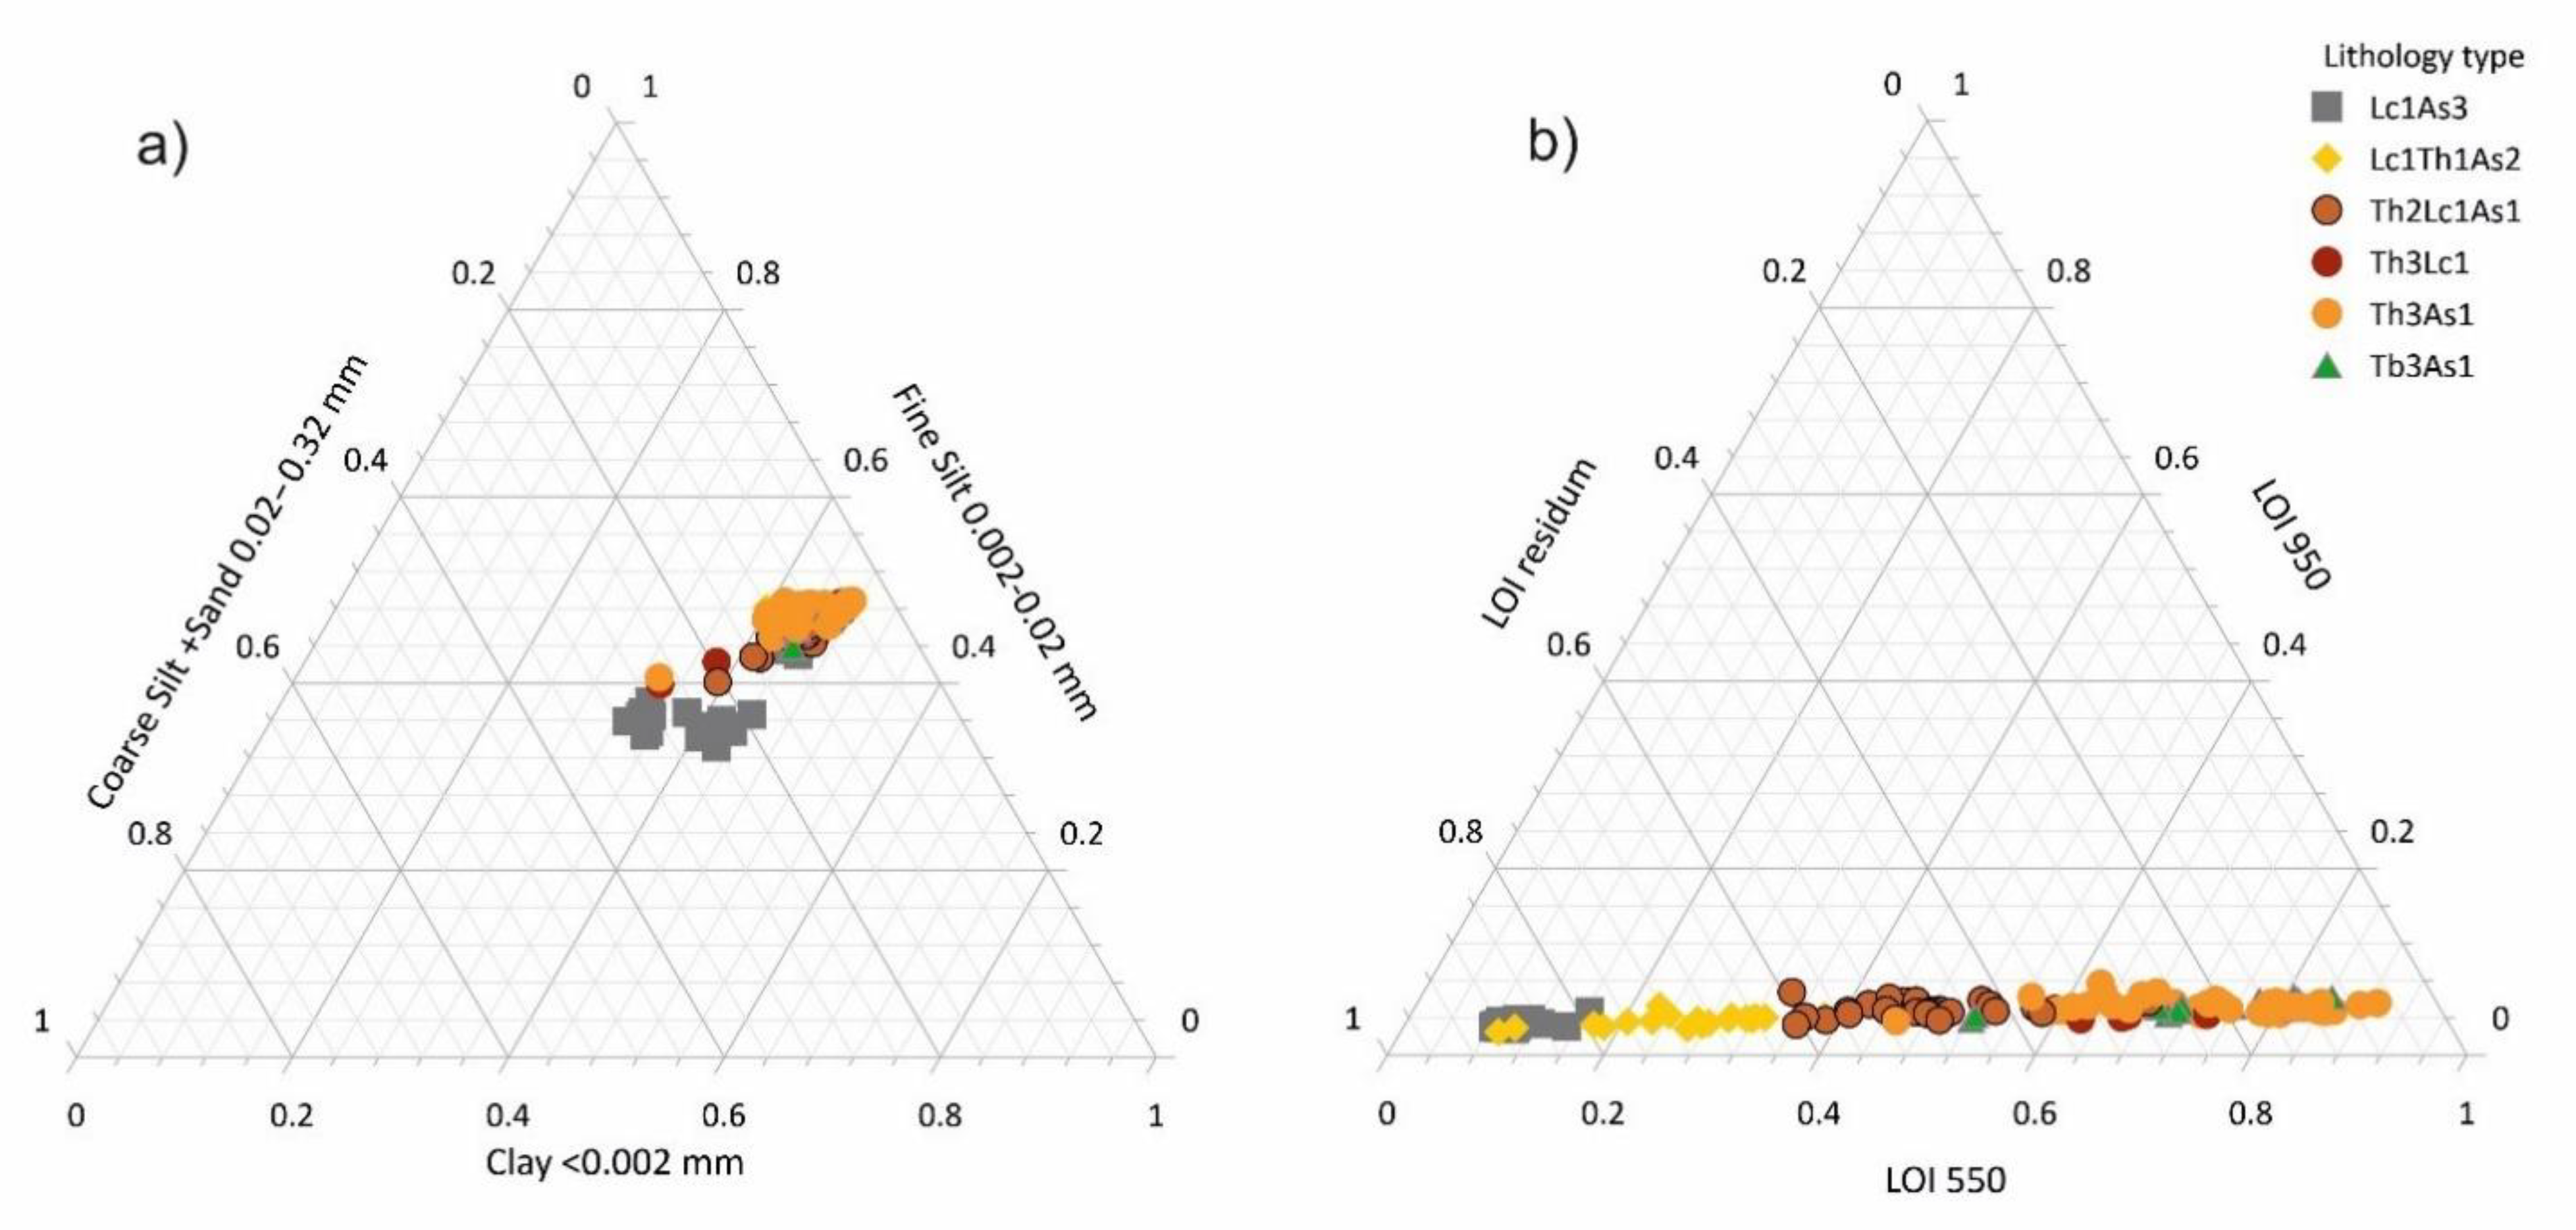
3.1. Sedimentological Results and Undisturbed Core Sequence Description

Based on the macroscopic observations on the profile, the particle size distribution, the loss on ignition and magnetic susceptibility measurements (279 samples), 16 sedimentary units could be distinguished (Table 1).
The bottom layer of the borehole consists of slightly carbonaceous peat (Troels-Smith: Th3As1) with 75%–82% organic content by LOI550 (Table 1). Unfortunately, despite the extraordinary effort made during the fieldwork [77] it was not possible to drill through the peat layer and reach the bottom layer of the peat series of the lake because of the extreme pressure and groundwater effect. The bottom of the borehole can be defined as the slightly pelitic carbonaceous peat layer which was formed between 7500 and 7000 cal BP (5500–5000 cal BC).
Peat formation continued between 530 and 510 cm but the composition of the peat changed. Sphagnum taxa appeared in the profile and a dark brown, slightly pelitic carbonaceous peat level with significant LOI550 content of more than 80% developed between 7000 and 6500 cal BP/5000–4500 cal BC in the Late Neolithic phase (Table 1).
The third layer, between 510–392 cm (6500 and 5000 cal BP/4500–3000 cal BC), also consists of peat (Table 1) but Sphagnum disappeared at this level and slightly carbonaceous, pelitic-fine silty peat layer developed (Th2Lc1As1) with an LOI550 content of over 80% from flowering plants (Figure 4).
The fourth level (392–384 cm) consisted of a characteristic leaching, degradation-accumulation level with notable carbonate content, increased fine silt, coarse silt and sand content, and less significant (below 40%) LOI550 (Figure 4, Table 1). This characteristic erosion-accumulation level (392–384 cm) developed between 5000 and 4800 cal BP (3000 to 2800 cal BC) years, at the level of the Late Copper and Early Bronze Age Coţofeni culture [78].
The erosional sediment level was ended, and peat formation continued in the fifth level (384–366) (Figure 4, Table 1). As a result, a reddish-brown layer of peat developed, predominantly consists of flowering plants remains. The LOI550 exceeded 70% and the LOI950 occurred below 8% in this level (Figure 4).
Between 366–362 cm (4600–4500 cal BP/2600–2500 cal BC years) an erosion-accumulation level developed again. The development of the erosional level is also supported by the magnetic susceptibility (MS signal) values. After the erosion level spans over about 100 calendar years, peat formation continued in the catchment basin of Round Lake with the development of a Sphagnum peat level (Tb3As1) between 362–320 cm (4500–4181 cal BP/2500–2181 cal BC years). The Sphagnum peat level was slightly carbonaceous with a carbonate content of 4%–5% (Figure 3).
The development of peat levels continued between 320–292 cm (4181–3950 cal BP/2181–1950 cal BC), however instead of Sphagnum remains, flowering plants provided the major material of this peat level (Th3As1).
Between 292–290 cm (3950–3900 cal BP/1950–1900 cal BC years), a significant erosion-accumulation level developed with the sharp increase of coarse silt and LOIres. The presence of this erosion level is also supported by the values of magnetic susceptibility. This short-term erosion level is very significant, the decrease of both LOI550, clay and fine silt is more than 20% (Figure 4).
Between 290–284 cm (3900–3800 cal BP/1900–1800 cal BC years), the intensity of erosion decreased and peat formation continued. As a result, a dark gray peat layer developed with significant LOI550 content (above 60%). Compared to the previous erosion level, the coarse silt content decreased and fine silt increased with the decrease of the MS signal.
Between 284–260 cm (3800–3450 cal BP/1800–1840 cal BC), a significant erosion-accumulation level developed with sharply increased in LOI550, coarse silt and decreased LOI550 content. This erosion level is also supported by the values of magnetic susceptibility. This strong-developed erosion level, which has lasted for more than 300 years, can be characterized by decreased LOI550, clay, fine silt more than 20% (Figure 4).
A peat formation started again between 260–254 cm (3450–3400 cal BP/1450–1400 cal BC) and a slightly carbonaceous peat level (Th3Lc1) developed with a significant LOI550 content (Figure 4 and Table 1).
Between 254–198 cm (3400–1400 cal BP/1400–400 cal BC), dark brown, slightly carbonaceous, pelitic peat layer (Th2LcAs1) developed with finely dispersed clay and fine silt content in it. The LOI550 content gradually decreased in the peat layer, but at this level, it is still exceeded 40% and fluctuated between 40%–50% with smaller cycles on a decade scale (Figure 4 and Table 1). This represents a 30%–40% reduction in LOI550 compared to the bottom peat layer developed at the beginning of the Middle Holocene. In parallel, the LOI550 content varied between 30%–40%.
The last peat layer of the undisturbed profile can be found between 189–102 cm (Figure 4 and Table 1). In this layer, the LOI550 content heavily decreased, although it fluctuates between 10 and 50%. In parallel, inLOI550 and carbonate content also showed changes (Figure 4 and Table 1).
From 102 cm to 15 cm (between the 14th and 20th centuries AD) finely laminated pelitic fine silt (containing subordinate LOI550 and carbonaceous clay) accumulated in the catchment basin.
Characterization of the macroscopical sedimentological layers and loss on ignition values were interpreted by using the triangular method [79,80]. Clearly visible trends can be detected on the triangular diagram created by using LOI values (Figure 5). The LOI950 was relatively similar in all samples (varied between 4% and 6%) due to the effect of the bedrock (marine marl deposited in the Miocene). The most significant LOI550 content can be detected in the herbaceous peat layer (Th3Lc1, Th3As1,), from which, samples of Sphagnum peat layers (Tb3As1) cannot be separated. The most significant LOI550 content (60%–90%) could be detected in the oldest peat layer.

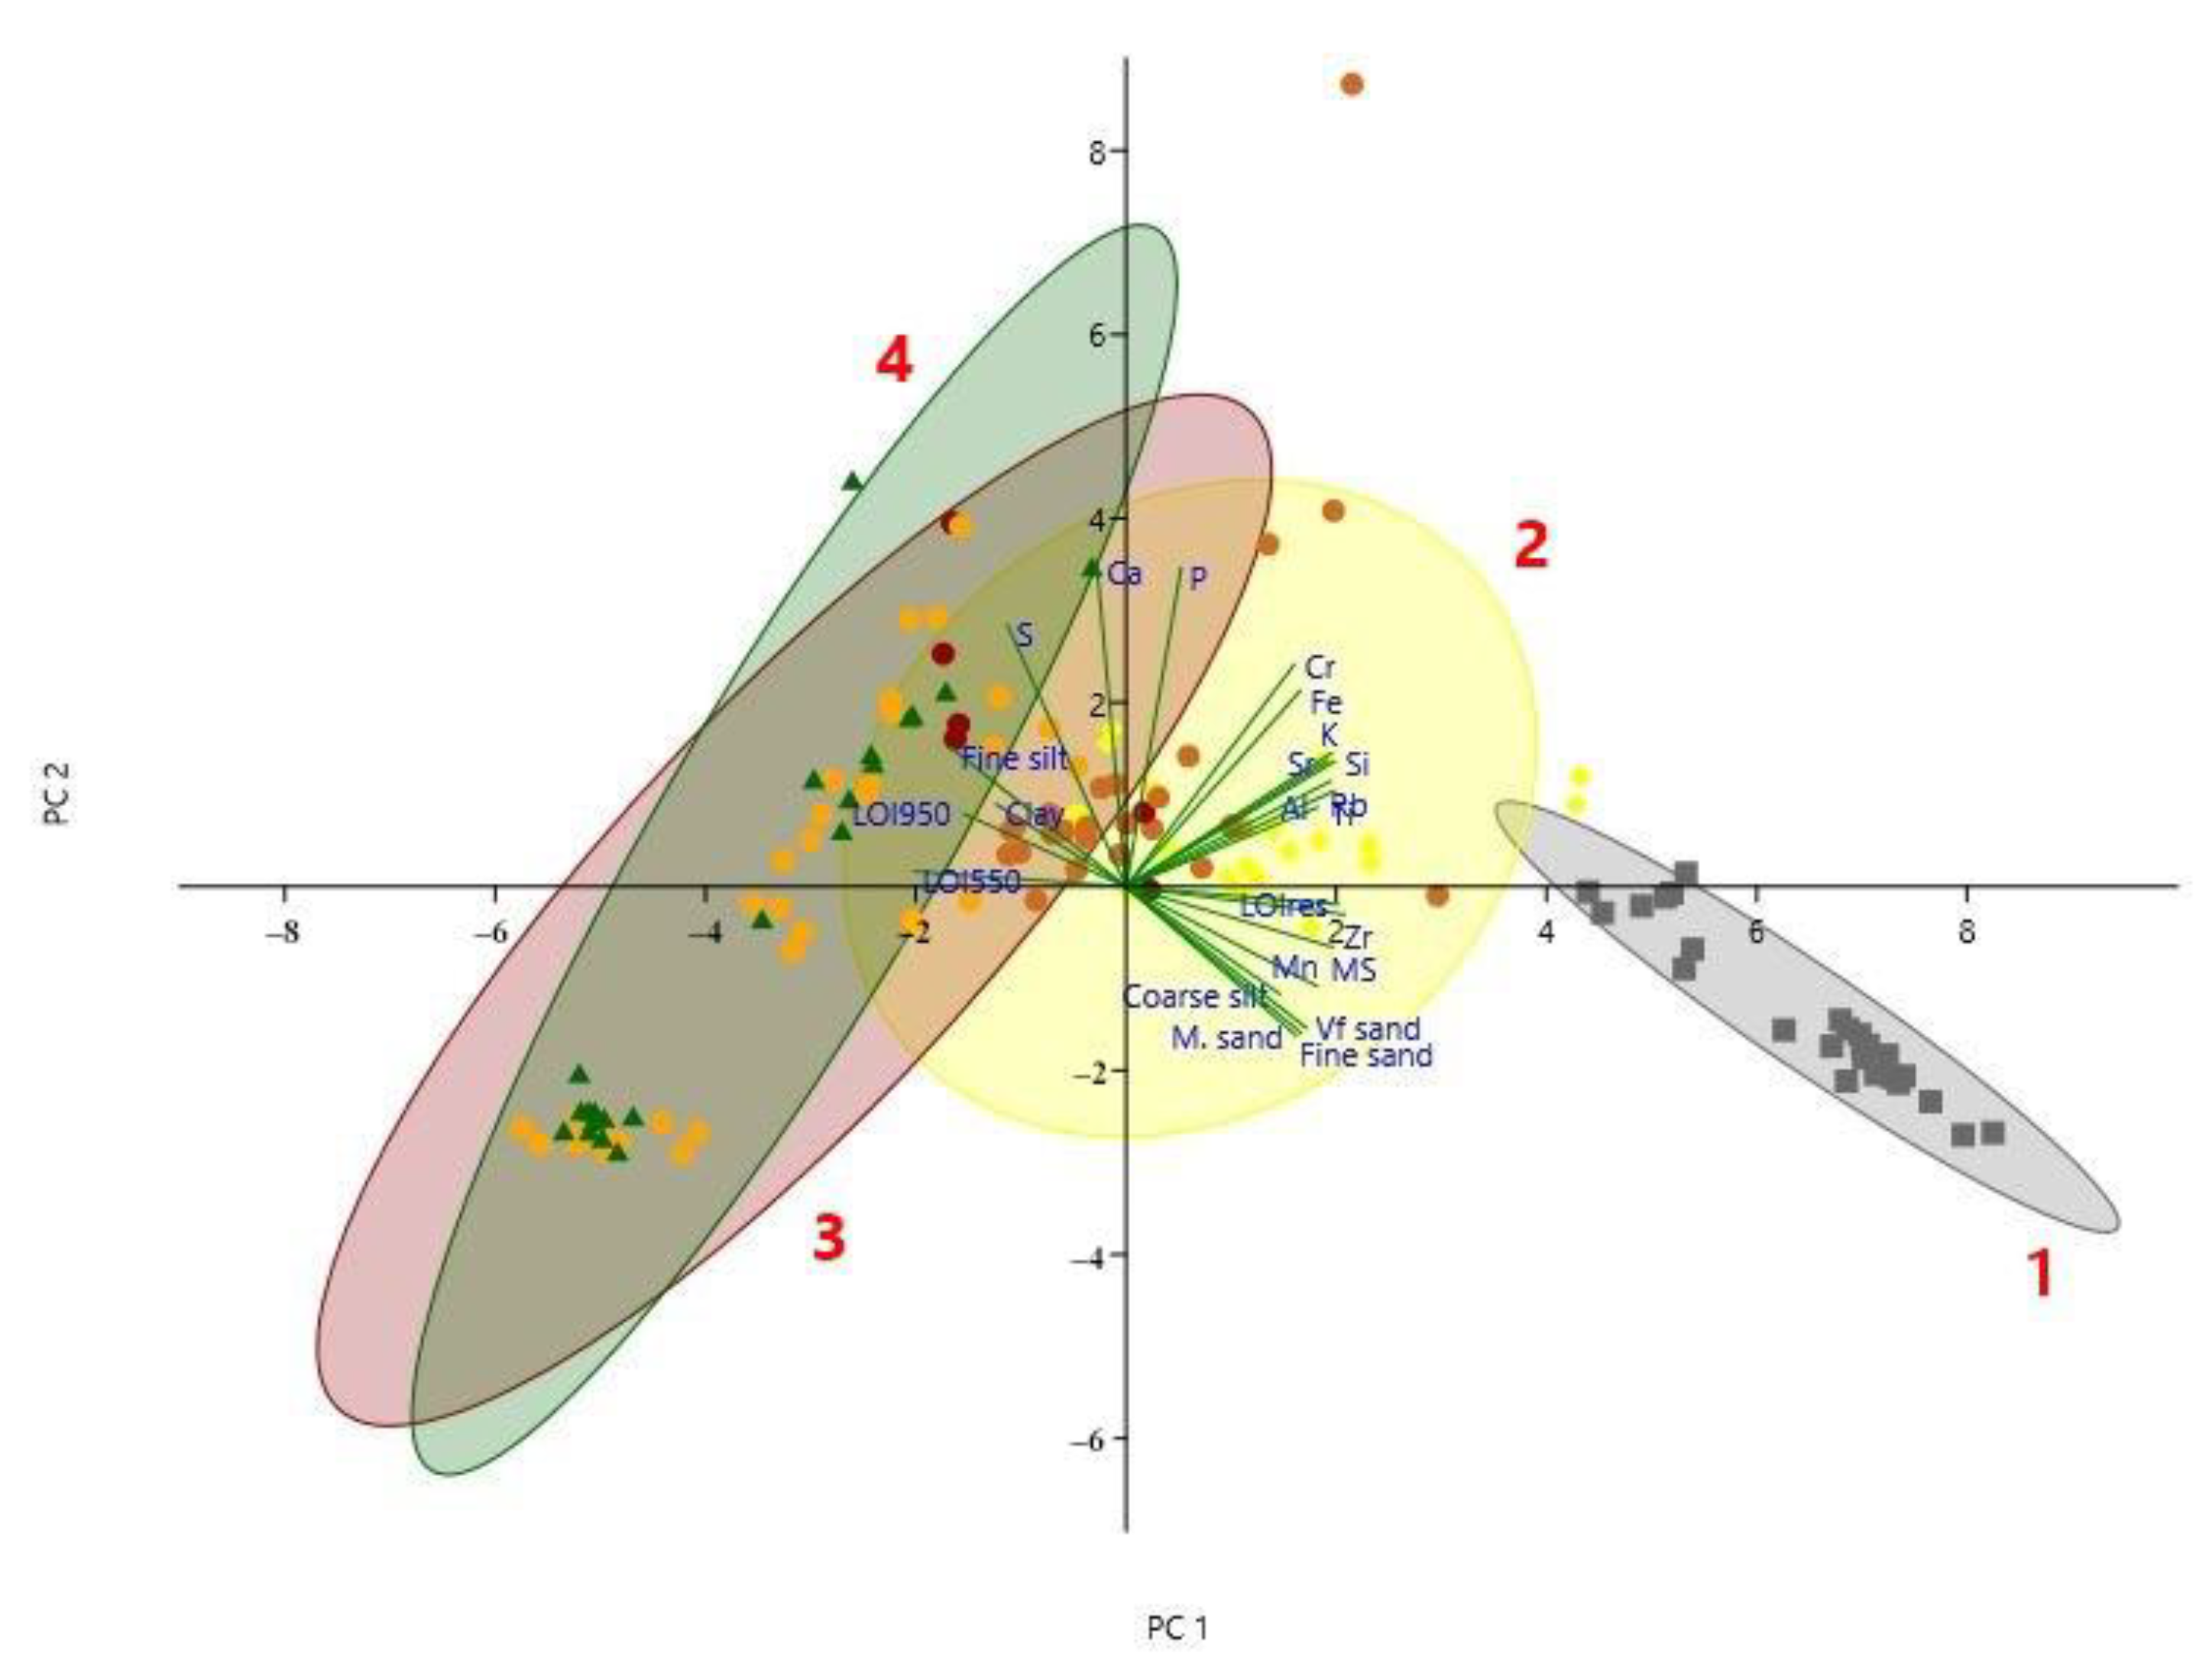
3.2. Descriptive Statistics and PCA Analysis

The geochemical development of the undisturbed profile was described using the changes in the composition of 13 elements (Table 2). Spearman’s rank correlation coefficients matrix was constructed on the basis of the changes in element composition, which resulted in the definition of two different sedimentary environments on a geochemical basis.
The two sedimentary environments with different structures show different geochemical properties, which depend on various conditions. According to the elemental concentration, the major and trace elements in the whole sediment section can be arranged in a sequence: Si >Al > Fe > K > Ca > Ti > S > P > Mn > Cr > Rb > Zr > Sr. In comparison with the peat sequence (104–560 cm) calcium (Ca) and potassium (K) changed their place and zirconium (Zr) with rubidium (Rb), therefore the arranged sequence in the mire section: Si >Al > Fe > Ca > K > Ti > S > P > Mn > Cr > Rb > Zr. At the lake phase (0–104 cm) the last seven elements have been completely reordered: Si >Al > Fe > K > Ca > Ti > Mn > Zr > Rb > Cr > S > P.
The same sedimentological picture is confirmed by the principal component analysis of the sedimentological and geochemical data of the samples (PCA), which makes clear the differences between the samples (279 pcs) described in detail macroscopically (Figure 6). We applied PCA to the MS, LOI550. LOI950, LOIres, all grainsize data and all analysed elements. We applied Z—Score transformation in the SPSS 25.0 statistical software package and PAST 3X. The two components have explained 78.9% of the total variance. The PC1 accounted for 63.45% of the total variance and PC2 component accounted for 15.45% the factor loading in Table 3. The results are well supported by the Cluster analysis of variables performed in PAST 3X using the Paired Group (UPGMA) algorithm and the Manhattan similarity index. (Figure 6).

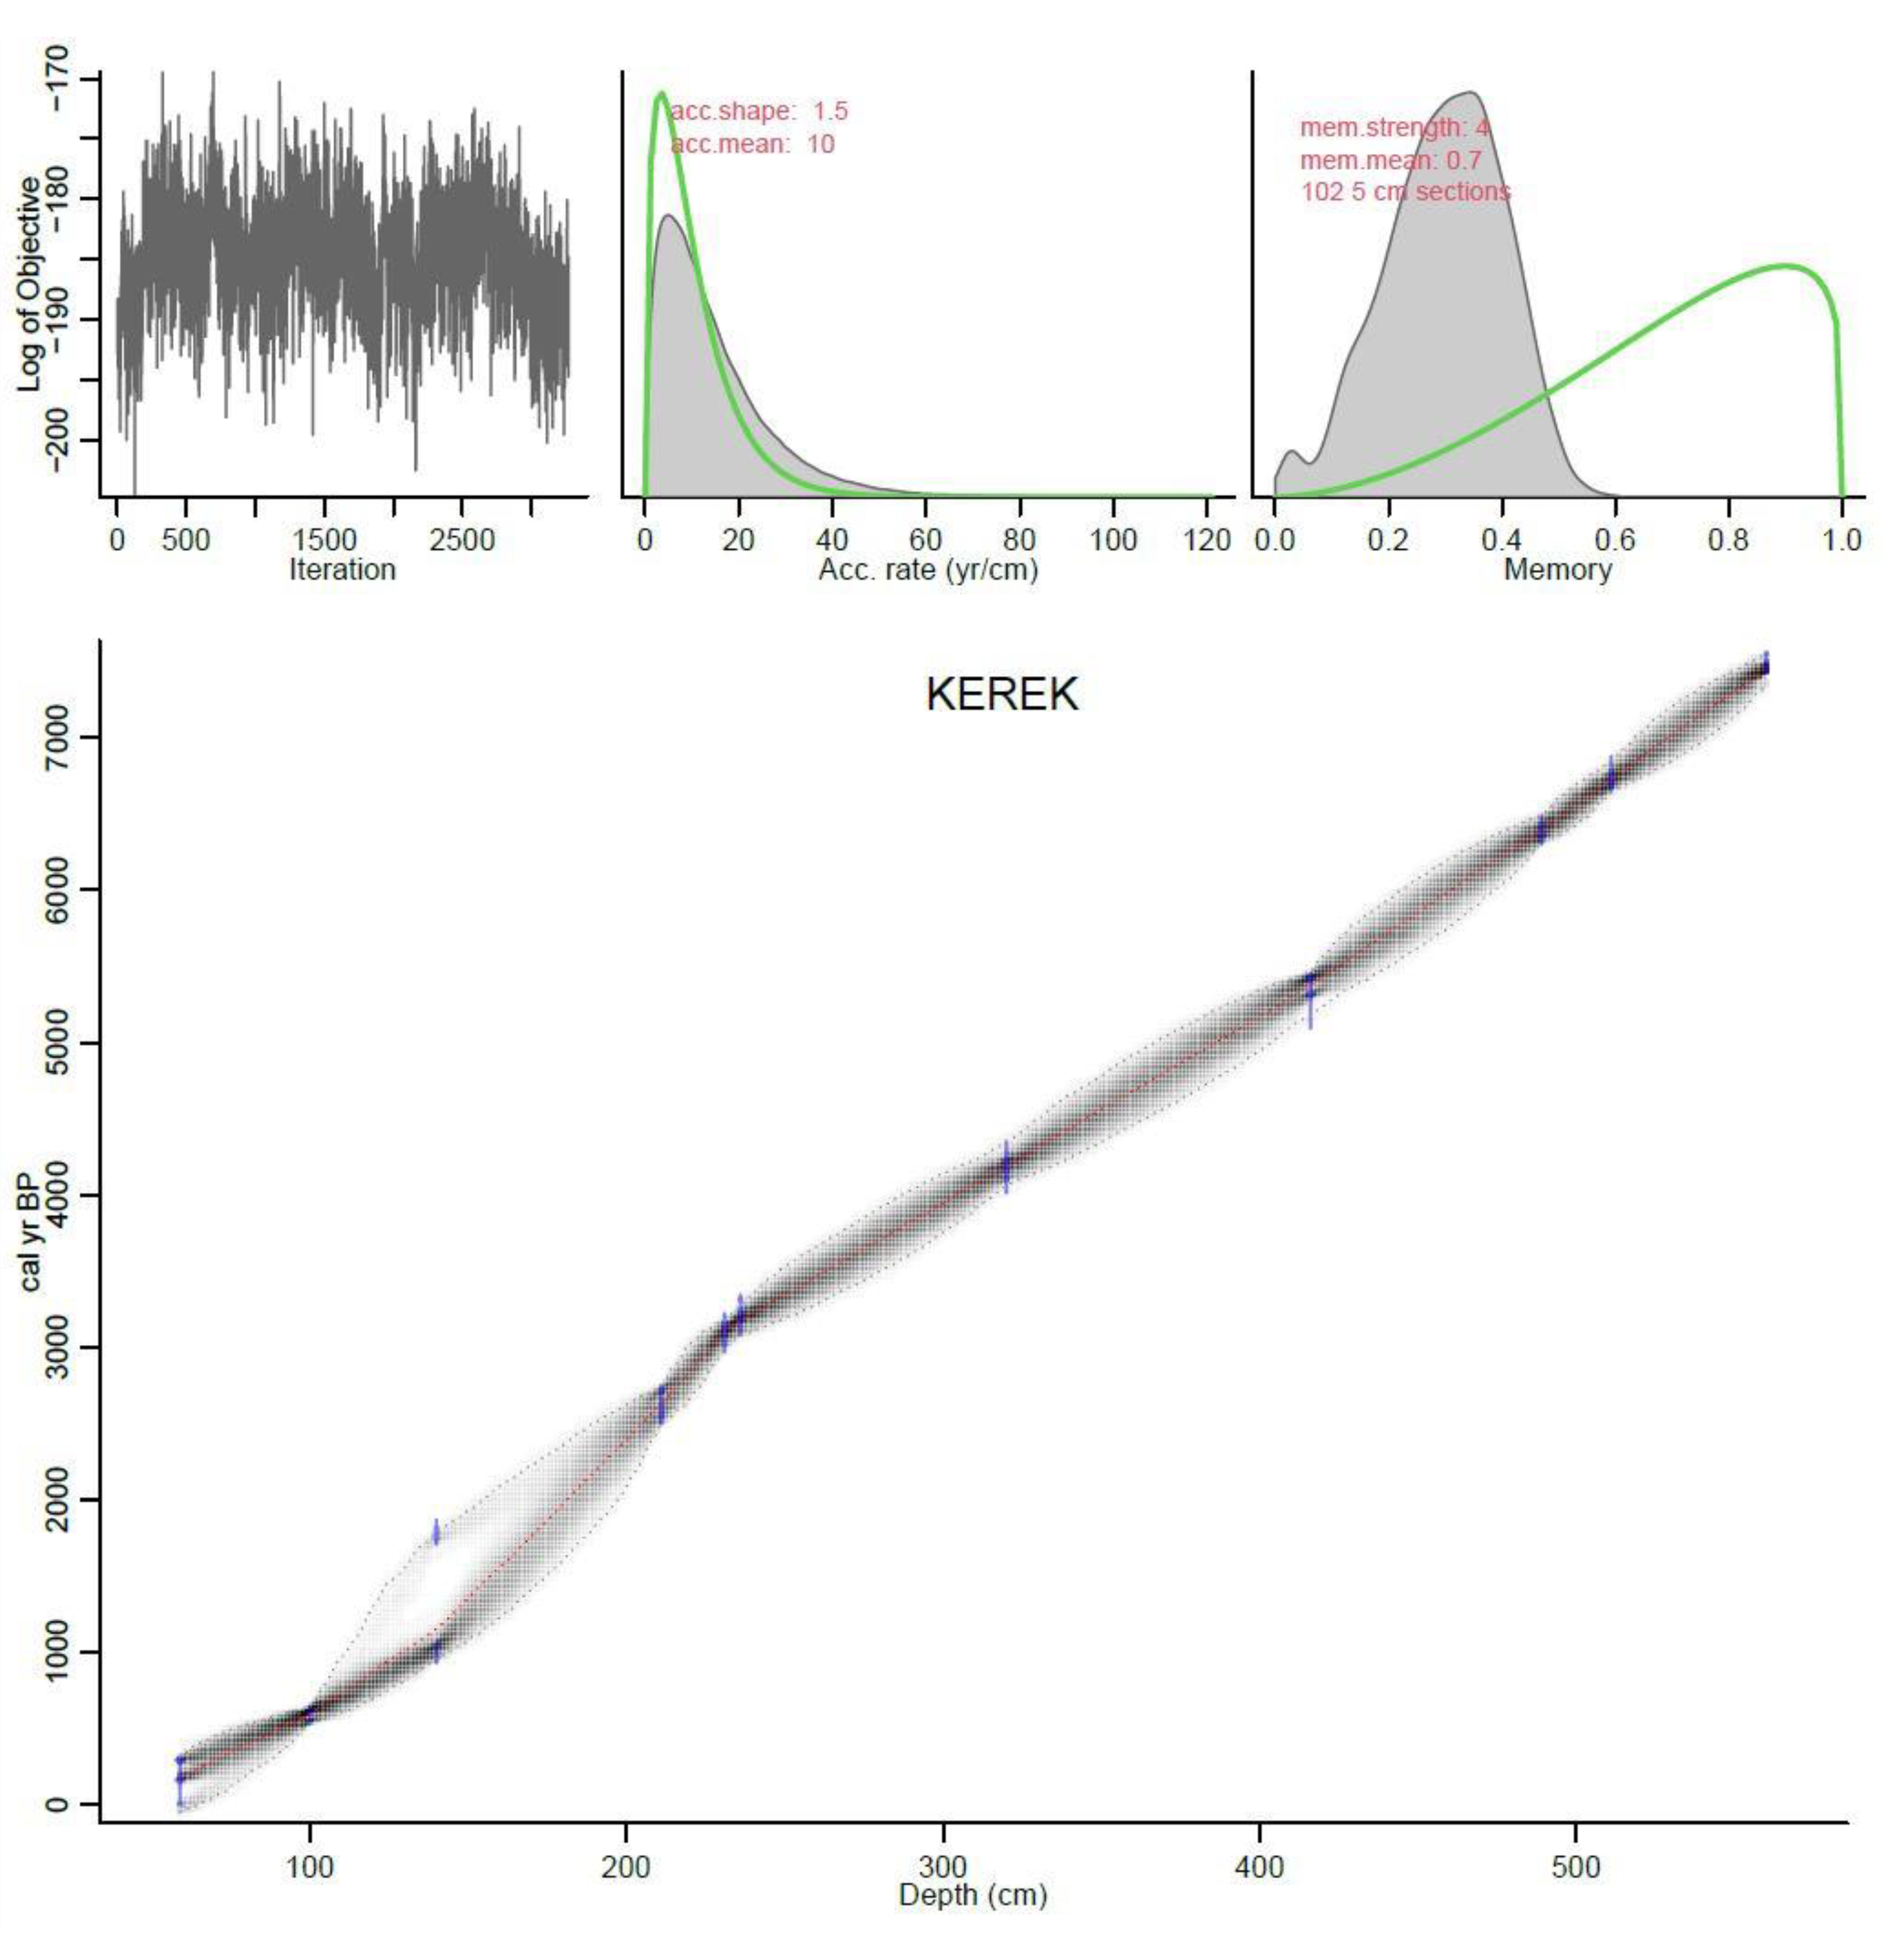
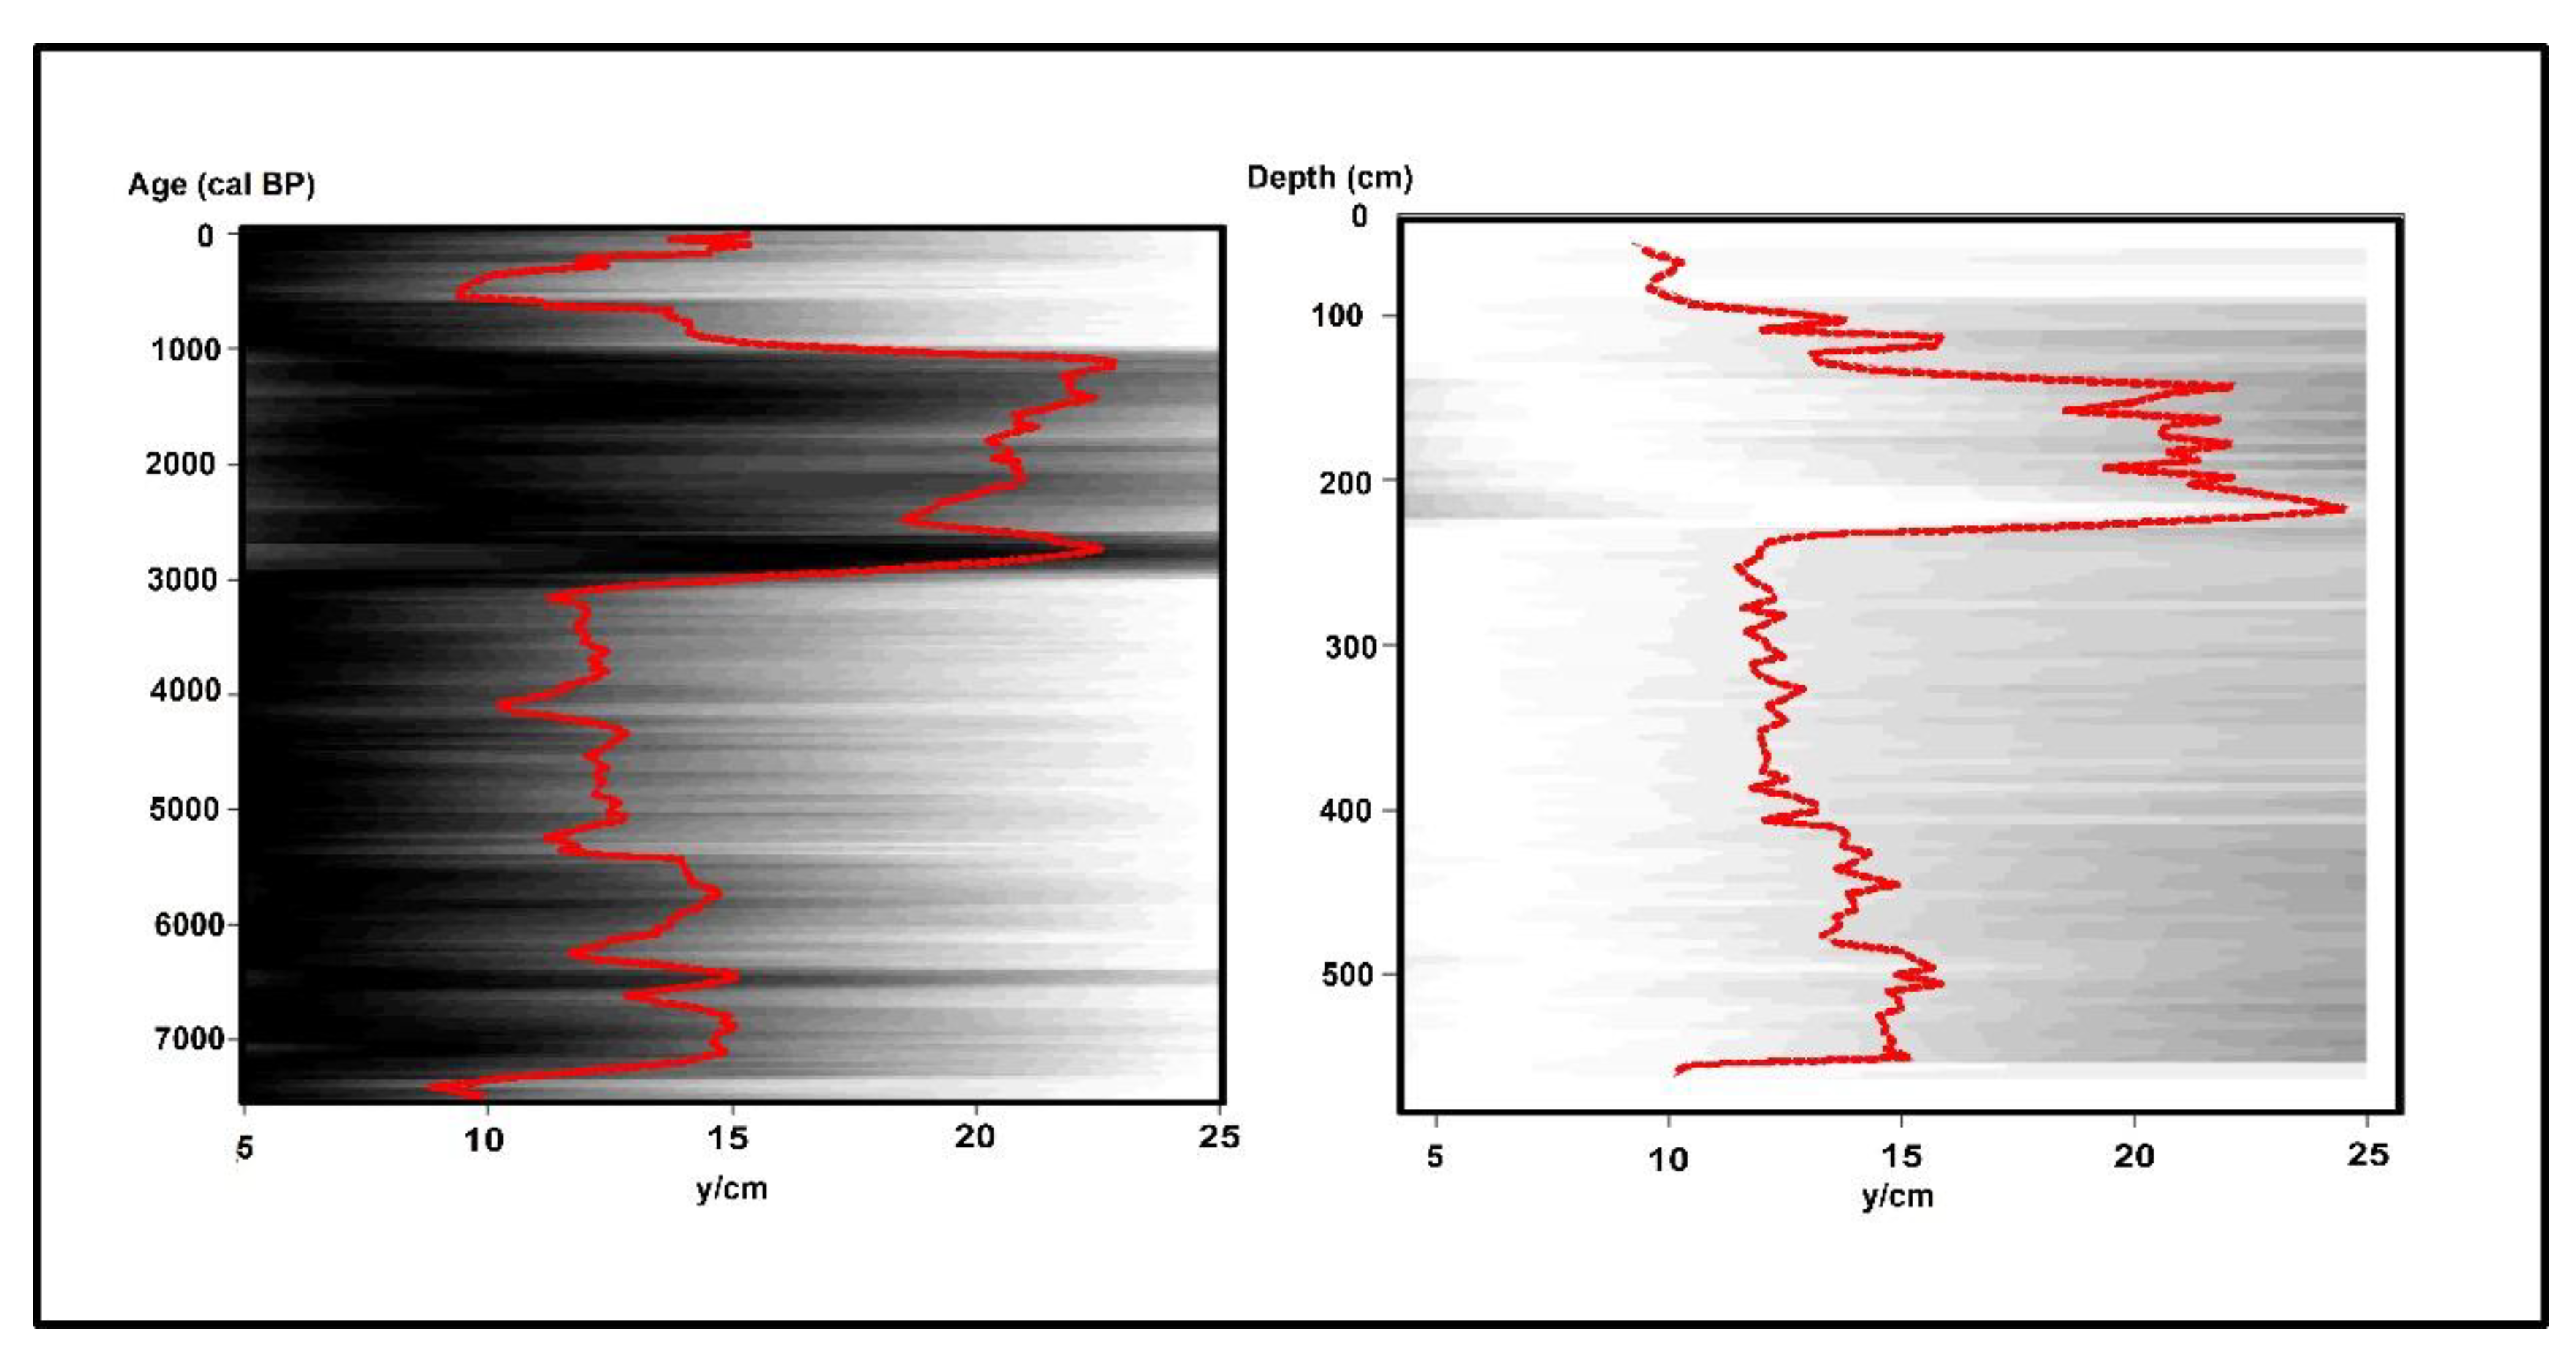
3.3. Chronological Results

Results from the 12 radiocarbon (AMS) dates (Table 4, Figure 7 and Figure 8) indicate an almost linear relationship of sediment deposition with time. The age-depth model with sedimentation rates (SR) was established by linear interpolation between the calibrated radiocarbon dates (Table 4). When indicating the age of a level where no radiocarbon date is available, we refer to the results of the linear interpolation.
The 560 cm long sequence involved approximately 7500 cal BP years (5500 cal BC years), Accumulation rates were estimated at the 1-cm resolution along with 95% CI to assess uncertainty, which gave the best result. Prior accumulations rates of 10 yr/cm with a gamma distribution of 1.5 shows a good correspondence with and the calculated 12 y/cm. Based on the chronological data and sedimentation rates, four levels of different accumulation rates were detected in the profile covers the last 7500 calendars [8]. In Figure 8, Inverse accumulation rates (sedimentation times expressed as year/cm) were estimated from Markov Chain Monte Carlo (MCMC) iterations, and these rates form the age-depth model. Accordingly, as the sedimentation time increases then the rate of accumulation decreases. It can be seen in the figure that within the different stages there are several SR decreases (AR increases) around 7300 cal BP, 6300 cal BP 4000 and 500 cal BP.

4. Discussion

The two different sediment records of Round Lake indicate many interesting changes and processes in stratigraphy and geochemistry. In this study, using the elements examined above, we attempted to use environmental proxies that have been accepted in previous studies.

4.1. Factors Affecting the Elemental Composition of the Round Lake

The correlation matrix was calculated for 13 elements from the total section of Round Lake (Table 5). A strong positive correlation can be noticed between the elements with inorganic mineral origin: Si, Al, K, Ti, Mn, Fe, Zr, Cr, Rb, Sr and between the plant-derived elements: S, P, Ca. Therefore, the elements can be classified into two groups, an allochthonous terrigenous fraction which correlates with the in LOIres content and an autochthonous chemically biogenically deposited fraction which correlate with LOI550 content.
Based on the PCA, the macroscopic description of the samples was correct, thus Troels-Smith [35] categories indicate an unconsolidated sediment environment in the mars-lake-swamp area indeed. The samples of the medieval-modern lake phase, the peat levels and the pelitic layers formed by different degrees of erosion, were excellently separated and reflect clearly the former sedimentary environment (Figure 9).
Figure 9 demonstrates that PCA1 has the greatest positive loadings with minerogenic -binding elements, MS and coarse particle size. Therefore, this refers to mineral sediment input from soil and rock erosion. At the same time, PCA1 has four significant negative weights for, LOI550, LOI950 and the finer fractions (fine silt, clay). PC2 has a high positive loading of P, S, Ca. All this indicates that LOI550 binds to organic matter (P, S), and a similar direction of Ca, fine particles and LOI 950 may indicate the local plant origin of carbonate. The figure shows the 95% CI ellipses associated with the data of the 4 lithological groups (1. laminated lacustrine mud, 2. calcareous pelitic peat, 3. herbaceous peat, 4. moss peat). Ellipses 3 and 4 overlaps well, 1 is connected to the lake sediments which are separate and represent only the upper 1 m.

4.2. Major and Trace Element Distribution

The P, S are tightly bound to the LOI550 (Figure S1) and their concentration profiles have similar trends. The P, S are tightly bound to the LOI550 (Figure S1) and their concentration profiles have similar trends. Ca follows P and S with a similar trend. They show a relatively low concentration at the bottom of the peat section between 560–450 cm except for two peaks at 560 cm and at the border of Tb3As1 and Th3As1layer between 500–510 cm. They reached the highest concentration between 400 and 300 cm. In this section the peat composition is various and there are several significant peaks (394–400 cm, 380–385 cm, 355–360 cm 255–260 cm) which is the same for all three biogenic elements. In the geochemical transition zone (198–100 cm), the concentration of these three elements decreased. Between 104 and 115 cm, there is a significant peak in P and Ca concentration which coincidence the water table level (at 104 cm). In the Lake phase (0–104 cm) the P and S fell below the detection limit therefore they were not traceable, and the Ca shows the lowest concentration (0.5%–0.8%) here.
It is conspicuous that both LOI550 and LOI950 decreased in parallel with the increase of LOIres. LOI950 does not appear to be related to surface erosion, it is more likely that the wall of the catchment basin was formed by Miocene marine calcareous marl where the carbonate originated from. Furthermore, Ca is a well-known biophilic element [81].
The terrigenous, mineral-derived elements in the peat section (560–198 cm) show a similar distribution trend, while, from the level of the geochemical transition zone (198 cm), they show different fluctuations. Between 560–450 cm the elements remain low (Si 5%, K 0.2%, Al 2%) but above the Tb3As1 layer (−500–490 cm) there is a sharp peak, similar with biogenic elements. The highest LOI550 and plant composition in the peat section (between 450–325 cm) have several significant peaks. The double peak between 392–362 cm coincides with the Th2Lc1As1 levels where the sand fraction also appears (Figure S1 and Figure 4). In the transition zone, there is a double peak between 190–210 cm and a sharp peak between 150–160 cm which correlates with the organic elements (P, S, Ca). At the water table level, all three elements drop due to diluting. This decline can also be traced in the fine-grained sediment. In the lake phase Si, K, Al, graphs are similar in the whole section. They maintain the same level (Si 27%, Al 7%, K 1,7%) no significant fluctuations were observed.
The Ti, Zr, Cr concentration are decreasing with depth. In the peat and transition zone, their distribution is parallel with other inorganic elements. Cr shows a different trend in the transition phase than the other mineral elements. There is no significant peak like Ti, Zr in the Lc1Th1As2 layer (between 150–160 cm), its concentration ranges from 90 to 120 ppm. In the Lake phase the three elements drop in the water table level, in the upper 80 cm maintain in the same level (Ti 550 ppm, Zr 160 ppm, Cr 107 ppm).
In the peat phase, between 560 and 280 cm, the Fe content is below 4%. At this stage, the LOI550 content is over 75%. Significant peaks are found between 500–490 cm and coincide with the appearance of Th2Lc1As2 layers where a coarse-grained fraction appears. In the lake phase, the iron (Fe) content is stable between 4%–6%, falling only at the water level (104 cm).
Mn is stable throughout the peat layer, falling to 6 ppm between 506–502 cm at the top of the Tb3As1 layer. From the transition phase (Lc1Th1As2), Mn increase from 40 ppm to 350 ppm. In the lake phase, the highest values of Mn can be detected above the water level (500–350 ppm).
As Rb can bind to potassium [82], its trend is very similar. In contrast, Sr binds to Ca-containing minerals [82], but a significant correlation was detected between them. The two elements Sr Rb are similar in the mire phase, while they differ in the lake phase. In the peat phase, Rb and Sr increase continuously from bottom to top, with significant peaks coinciding with other minerogens. At the water table level Rb drops significantly, Sr shows no significant change. Rb is stable in the lake phase (100–120 ppm), Sr rises from 80 to 120 ppm towards the surface.

4.3. Comparative Analyses of Geochemical and Pollen Results

Pollen analyses were not performed as a stand-alone study, but to understand the background of the geochemical changes from a perspective of vegetation. It is necessary as climate-induced vegetational changes and the anthropogenic impacts of it can be described more accurately based on pollen analytical data than from a geochemical viewpoint [83,84,85,86,87,88,89,90,91,92,93,94].
A comparative analysis of the geochemical and pollen analytical samples, converted from the meter scale to the time scale by 12 radiocarbon measurements [8], was performed based on literature [89,90,95,96]. The bases of the comparisons were the works of Willis et al. [88,94,95], and one of our aims was to test the suggestion of Willis et al. [90] about the connection between human impact and erosion levels based on the analysis of a similar mars-lake catchment basin with sedimentological, pollen analytical and geochemical methods. Land degradation is the physical and chemical depletion of the soil resulted from processes such as erosion, acidification, depletion of plant nutrients and reduction of LOI550 content [88,96]. The following palaeoecological phases can be separated on a chronological scale by the comparative analyses of geochemical-pollen analytical data. To make it comparable with other studies, the relative abundance of the studied elements expressed as concentration of oxides per sediment volume are given in Supplementary Figure S2.
The first geohistorical level formed between 7500–6500 cal BP (Figure 10). Inorganic geochemical components of mineral origin show low values at this level, except for Al2O3. It can be connected to the continuous clay deposition from the degradation of the brown forest soil formed under closed deciduous forest (reconstructed based on pollen data (Supplementary Figure S2) [88,95,97,98] in the vicinity of the Round Lake catchment basin. The Ca content can be related to the effect of the bedrock and the element content of the significant plant phytomass that forms peat [95,99,100]. Elements depend on the organic components in the forms of CaCO3 and P2O5, have three maxima in this stage, which show three maxima in biogenic accumulation and peat formation [101,102]. SO3 and MnO2 content were also significant in these levels [88,103,104,105]. Based on the elemental composition, the reductive mire environment can be characterized by rich vegetation, the appearance of Sphagnum plants, negligible element transport and significant water coverage on the surface [88,95,104,105,106,107]. In this phase, the catchment basin was dominated by biogenic sediment accumulation and peat formation.
Between 6750–6500 cal BP years, the quantity of elements of mineral origin (Al, Si, K, Cr, Rb) increased, and organic components decreased in the erosion phase deposited to the peat level (Figure 10). The proportion of pollen of deciduous woody plants also decreased during this period, indicating a decrease in forest cover. The stability of the surface vegetation cover was changed [88,108], which resulted in the leaching of several inorganic components towards the mire. This change was obviously the result of human impact by deforesting the woody plants [88]. In addition to the decrease in the proportion of arboreal elements (Figure S2), and the advance of herbaceous plants, an erosion phase developed in the sediment.
Between 6500–6000 cal BP years, the maximum of the maximum of SO3, MnO2 and CaO developed, the proportion of the elements correlated to inorganic sediment and erosion decreased. The proportion of arboreal pollen also increased. These attributes indicate a phase of forest regeneration and the reduction of erosional sediment supply to the Round Lake catchment basin. At this time the mire can be characterized by high water level and intensive biogenic accumulation. This is also supported by the presence of Sphagnum taxa detected at this level [109,110,111].
Between 6000–4750 cal BP years the quantity of the elements released from the washing in of inorganic sediment increase continuously in parallel with the decrease of the reductive mire environment-indicator elements Fe2O3 and MnO2 [88,95,104,105,106,107]. Arboreal pollen proportion also decreased drastically (Figure S1) in addition to the sharp increase of the proportion of herbaceous pollen. The element content indicating an erosion and degradation of the soils covering the surroundings and the decrease of mire environment-indicator elements suggest another erosion level and vegetation breakdown.
In the subsequently early Bronze Age level (between 4750–4250 cal BP years), the catchment basin is characterized by environmental stability. The erosion-indicator element content was in its average and based on the pollen analysis (Figure S2), the forest environment was regenerated. The continuous peat formation is also confirmed by the presence of Sphagnum remains in the sediment (Tb3As1). The beech pollen maximum in the pollen composition and the appearance of Sphagnum suggested cooler and wetter climate in the terminal phase of Coţofen culture in the transition of the early and middle Bronze Age. Similar cooler and wetter climate phase were detected, based on isotope analyses, in Asia Minor [112] and the Middle East [113] in the same chronological zone.
Sphagnum remains disappeared from the sediment between 4250–4000 cal BP years (Figure 10). Sharp changes also can be observed in the pollen material. Arboreal pollen proportion (Alnus, Betula, Tilia, Quercus) decreased below 60% (Supplementary Figure S3) [73,74,114,115,116]. Among herbaceous plants, the proportion of Artemisia, Chenopodicea, Secale, Cyperecea began to increase. Mineral content suddenly dropped, then started to increase for a short time. The increased proportion of MnO2 indicates oxidative conditions, and the maximum of P2O5 suggests decomposition processes-although this may also come from the vicinity of the catchment basin by the intensification of soil leaching [95] (Figure S2). This latter is also indicated by an increase in magnetic susceptibility (Figure 4). The changes in the pollen composition, the decrease of arboreal pollen and the appearance of cereals, rye (Secale) among the herbaceous pollens clearly show the agricultural production in the surroundings of the mire.
Geochemical analyses suggest the drying up of the mire environment, which may be related to a global event at 4.3 kyr [117]. The available AMS-based chronological data also support this idea (Table 2). Global investigations dated the Meghalayan phase (4250–4050 cal BP/2250–2050 cal BC years), identified in the northeast of India by using isotope analyses on stalagmites, approximately to this chronological-climatic phase. This climatic event had an extraordinary impact on the high cultures of Africa and Eurasia [118,119,120]. In any case, the global dry event of the mentioned Meghalayan phase coincides with the transition of early and middle Bronze Age in the Carpathian Basin. Based on the archaeological and environmental historical analyses [121,122,123,124,125,126,127,128] it is evident, that human communities respond to environmental impact and crises with cultural and technical transformations and a coincidence can be noted between the dry climate event of the Meghalayan phase and the transition of early/middle Bronze Age phase. In our cases, this coincidence requires further investigation.
At the next level, between 350–300 cm (4000–3500 cal BP/2000–1500 cal BC years), the pollen proportion of arboreal species ranged between 60%–70%. The closed forest, stabilized at the early Holocene, was replaced by a forest-steppe with loose hornbeam-beech forests, grazed and herbaceous patches [73,74,114,115,116]. As a result of this loosely structured vegetation cover, erosion became continuous in this stage, identifiable with the Middle Bronze Age. Two smaller stages of mire regeneration also can be detected. The geochemical parameters indicate a constant surface erosion (Figure S1) in parallel with the continuous decrease of arboreal species (Figures S2 and S3), and the strong soil leaching and deposition resulted in the formation of pelitic peat levels.

4.4. Paleoenvironmental Changes during the Past 7500 Years

The distribution of P, S and Ca elements are influenced by the composition of LOI550 and the surrounding vegetation. Even though calcium is originally derived from bedrock, it still correlates better with LOI550. Presumably because Ca is a well-known biophilic element [81] it is essential for growth in plants which could derive from the deciduous tree fallen leaves [83]. It can be noticed that the peaks of the biogenic elements (P, S, Ca) can be found in the middle part of a thicker, homogeneous peat layer. This can be influenced by several factors, including the sedimentation rate, which affects the deposition and depth of the stratum, thus can be related to decomposition and maturation processes. Shifts and fluctuations of geochemical elements can be attributed to plant uptake and transport. Some peaks coincide with elements from the mineral grain. The observed peaks correlate with layer boundaries, indicating the transformation of the mire environment.
The Si, Al, K, Ti are strongly correlated with mineral matter. Si and Al are the most abundant elements in the Earth’s crust and principle constituents of rock-forming minerals. Potassium is essential to growing plants, therefore it rapidly lost from peats [2].
The Mn and Fe are highly mobile in anoxic environments from very acidic to moderately alkaline pH [129,130,131,132]. This can be observed in the peat section between 560–150 cm. In addition, the distribution of Mn can be related to the activity of microbes and can take part in the degradation of organic and inorganic compounds [133,134,135]. Fe shows no significant change between both oxic and anoxic conditions, while Mn shows the highest concentration above the water table level (104 cm). The distribution of Cr can be controlled by the botanical composition and LOI550. In anoxic conditions, organic compounds can reduce in aqueous solution [7,82]. The highest concentration of Cr was detected between 150–400 cm, and it was not detectable at the bottom of the core section.

4.5. Paleoenvironment Changes from the Aspect of Human Impact

One of our aims was to examine the possibility of reconstructing the productive activity of former cultures and communities [88] by study the erosion development of the catchment basin on the basis of sedimentological, geochemical and pollen analytical results dated by radiocarbon data. By using this method, the agricultural activity and the impact of the civilization on the environment at the level of the given cultures can be reconstructed. Even though the depth of the Round Lake catchment basin did not reach the depth of the Kis-Mohos, detailed in the works of [88,95], and the sedimentation cannot date back to the end of the Ice Age, comparison can be carried out in the last 7500 calendar years. It must be noted that archaeological database on the topographic survey of sites in the vicinity of Kelemér are not available.
Nonetheless, the following erosion events and mire-forest-regeneration phases could be separated by sedimentological, geochemical and pollen analytical methods, in the undisturbed borehole profile of the Round Lake at Homoródszentpál (Table 6).
Previous studies [89,95,108,136] have indicated that increases in the abundance of elements such as Si, Al, K, Rb, Cr, Sr and inorganic material are indicative of both physical and chemical weathering associated with soil erosion. These elements represent silicate minerals eroded from the surrounding soils and rocks. This material is carried by throughflow, and overland flow washing material into the lake basin and can be used as an indicator of local land degradation and erosion process [88]. S, P, Fe, Mn elements and organic content show a maximum in the mire regeneration phase of peat levels, thus, erosion levels and mire regeneration phases can be distinguished based on the abundance of the two element groups (Table 6). Due to the steepness of the slope and the steep bank of the catchment basin, formed by landslide processes, clay fraction from the surrounding soils and carbonate from the bedrock washed in subordinately but continuously to the catchment basin. Si, Al, K, Rb, Cr, Sr, inorganic content, an increasing ratio of coarse silt and sandy fraction can be used as an indicator of erosion phases.
Table 6. Age, erosion and peat regeneration phases within archaeological and cultural data-historical data around the analysed catchment basin archaeological remains in the Homoród Hills based on [137,138,139,140,141,142,143,144,145,146,147,148,149,150,151,152,153,154,155,156].
Age (Cal BP Years)Age (Cal BC/AD Years)Erosion/Peat PhasesArcheological Stage (Age)Cultures and Phases
200–01600–2000strong erosion phaseModernMagyars
700–2001300–1800pond phaseTerminal
Medieval
Magyars
1000–7001000–1300 ADstrong erosion phaseMedievalMagyars
1100–1000900–1000 ADstrong erosion phaseTerminal
Migration
Magyars
1300–1100700–900 ADstrong erosion phaseMigrationAvars
1600–1300400–700 ADpeat regeneration phaseMigrationGepids, Huns. Goths
1900–1600400 BC–1400 ADstrong erosion phaseImperialRomans
3100–19001100 BC–100 ADsolid but continuous erosionIronDacians, La Téne, Scytians, Prescythians, Mezőcsát
3450–31001450–1100strong erosion phaseLate BronzeGáva, Noua
3800–34501800–1450strong erosion phaseMiddle Bronze IIIClassical Wietenberg
3900–38001900–1800peat regeneration phaseMiddle Bronze IIFormative Wietenberg
3950–39001950–1900strong erosion phaseMiddle Bronze IFormative Wietenberg
4183–39502193–1950strong erosion phaseEarly Bronze IIIGornea-Foci
4500–41832500–2183peat regeneration phase within Sphagnum taxaEarly Bronze IISchneckenberg
4600–45002600–2500strong erosion phaseEarly Bronze IGlobular Amphora-Late Coţofeni
4800–46002800–2600strong erosion phaseCopper/BronzeCoţofeni/Pit Grave
5000–48003000–2800human impact, vegetation disturbed, erosion phaseLate CopperLate Cucuteni B–Tripolje BIII
6500–50004500–3000peat regeneration phase within
Sphagnum taxa
CopperErősd-Cucuteni B–Tripolje BI-II
7000–65005000–4500vegetation
disturbed, solid erosion phase
Late Neolithic/CopperErősd–Precucuteni–Cucuteni A1 Tripolje A
7500–70005500–5000high organic content, peat forming, solid clay inwashing phaseMiddle NeolithicLinnear Pottery
The bottom of the undisturbed core drilling consists of a reddish-brown peat level, which formed between 7500–7000 cal BP/5500–5000 cal BC.
The first geohistorical level formed between 7500–6500 cal BP in the middle of the Holocene [154,155] or the Middle Neolithic-from an archaeological point of view. For this reason, the influence of communities with agricultural activities must be taken into account.
The first significant soil erosion phase can be dated back to the transition of the Late Neolithic/Copper Age, in the chronological horizon of the Erősd-Precucuteni-Tripolje culture complex (between 7000–6500 cal BP/5000–4500 cal BC). In this chronological-cultural horizon, hundreds of years of preurban settlements can be observed connecting with the Erősdi culture [156,157], as an evidence of the Late Neolithic-Copper Age economic spatial structure in the Transylvanian Basin. The study area could have been located in the outer livestock zone, where pasturelands were established. It must be noted that in the chronological horizon of this cultural level wheeled vehicles models were already have appeared in the wider environment of the studied region [158]. For this reason, the existence of a gradually developing commercial and agricultural network, a Late Neolithic economic spatial structure can be considered. These activities had a strong erosion-amplifying effect.
Between 6500–5000 cal BP (4500–3000 cal BC) years, the proportion of erosion-indicating elements decreased as a result of the decrease of human impact and the former climate, a peat- and forest regeneration phase developed at that time. Our data clearly confirm previous geohistorical models that throughflow and overland flow processes and inwash decreased because of the extension of closed forest in the area of the catchment basin and peat formation persisted [86,87,88,89,95,159].
The second erosion level occurred at the end of the Copper Age, in the chronological horizon of Late Cucuteni B-Tripolje BIII culture complex (between 5000–4800 cal BP/3000–2800 cal BC years) (Table 5). In the wider environment of the studied area, the settlement of the communities of the Coţofen culture was also confirmed [160,161]. In addition to the increase of the elements indicating erosion, bedrock and soil leaching, this process is also indicated by the rapid and abrupt increase of coarse silt and sand fraction (Table 1, Figure 4). Deforestation is also proven by the decrease of the pollen proportion of Quercus, Carpinus, Fagus and the rapid increase of Betula and Alnus in the cleared areas (Figure 10). Based on the increase in the proportion of herbaceous plants, mainly grasses (Poaceae = Gramineae) and Asteraceae pollens, grazing areas can be reconstructed, subordinately beside rye cultivation and local arable lands. Vegetation disturbance was less intensive at this stage, in contrast, geochemical data suggest that it was more significant than in the first erosion level. It cannot be ruled out, that the pond existed in the catchment basin of Round Lake, was used as a watering pond for animals. The erosion near the lake intensified by the trampling of these animals.
The next erosion phase in the vicinity of Round Lake may have been connected to the establishment of pasturelands by Coţofeni/Pit Grave cultures at the end of the Copper Age/beginning of the Bronze Age. The earlier thermophilous, mesophilous forest species (Tilia, Ulmus, Corylus) retreated surrounding the lake and there is a marked Fagus increase detected which indicated a cooler wetter climate. The pastoral communities of the Pit Grave Culture, large animal keepers from the Eastern European Plain appeared in several waves [162,163,164,165] in both the Carpathian and Transylvanian Basin [166]. Thus, the pastureland formation at the end of the Copper Age/beginning of the Bronze age (between 4800–4600 cal BC) can be linked to a younger wave of the communities of Pit Grave Culture (so-called III. infiltration wave) [167,168]. As communities of Coţofeni culture also existed in the transitional level of Copper/Bronze Age, it is not possible to link the establishment of pasturelands precisely to a culture. However, the pasture farming had still existed in the area at the I. phase of Early Bronze Age (4600–4500 cal BP = 2600–2500 cal BC years), when the Pit Grave culture communities were no longer, but Coţofen culture communities were still presented in the study area.
Between 4500–2150 cal BP (2500–2150 cal BC) years, human disturbance was minimized. The Round Lake area was covered with beech and hornbeam forest and a well-developed peat layer formed beside the presence of Sphagnum (Tb3As1). These circumstances suggest a forest and mire regeneration phase with a cool and wet climate. Between 4150–3950 cal BP (2225–1950 cal BC), another vegetation disturbance and erosion were presented, based on sedimentological, geochemical and pollen analytical results. The human impact was so strong (Table 5) that the reconstruction of the exact climate phase was impossible, thus this level cannot be correlated with the Meghalayan phase detected globally between 4250–4050 cal BP (2250–2050 cal BC). At the same time, it cannot be ruled out that the intensified human influences and population growth in the mid-mountain region between 500–600 m were caused by the moving of the communities towards higher and wetter regions of the Transylvanian Central Mountains.
At the beginning of the Middle Bronze Age (3900–3800 cal BP = 1900–1800 cal BC), erosion receded, human disturbance of the vegetation was stopped. Beech forest closed, and a peat layer developed in the catchment basin resulted in another forest and mire regeneration phase.
During the Middle Bronze Age, at the time of the communities of the Classical Wietenberg culture, while a diverse weed vegetation (Artemisia, Centaurea, Chenopodiaceae, Plantago, Polygonum, Rumex, Urticum, Verbascum taxa) developed. The decline in the proportion of arboreal pollens and the increasing of the herbaceous ones, the strong deforestation, the increasing abundance of the geochemical elements proving soil and bedrock erosion, the changes in grain composition indicate the presence of an extremely strong human impact in this erosion phase. The Wietenberg culture developed an important economic and social spatial structure and pasturelands in the hilly mid-mountainous region [169]. The zones with different economical roles may have been connected by road networks since most of the prehistoric wagon models were found from the sites of this culture [158]. The existence of road networks and roads are factors that increase erosion [88]. Geohistorical and chronological data show that this level of erosion was associated with the high culture level at the Middle Bronze Age.
The human-influenced forest-steppe may have been maintained during the Late Bronze Age by the communities of Noua and Gava cultures. Data indicate the existence and production of a significant number of communities in the Central Mountain region of Transylvania. As a result of their activities, the strong disturbance of forest vegetation and erosion was persisted during the Middle Bronze Age. Our data show that the studied area may have been in edge position as a peripheral part of the advanced production system of Transylvania.
Despite the continuous human disturbance in the level of all cultures and communities (Table 6) of the Iron Age, the human impact and erosion did not reach that level of the second half of the Bronze Age. Rather, a continuous, less significant disturbance–despite the more advanced tools-can be described. Sharply decreased population density can be suggested during the Iron Age compared to the Bronze Age-the area was placed on the periphery of the socio-economic system of the Iron Age.
During the Roman Empire (1900–1600 cal BP-106–271 AD), the most powerful erosion and disturbance can be observed in the vicinity of Round Lake at Sânpaul, which exceeds all previous human influences. These impacts include the developed Roman agriculture, roads, network of settlements, but the local reason for the erosion and deforestation was the construction of a Roman fortress in the 2nd century AD on the surface of the transverse crack (Orom hill), formed by landslide processes. Forests were cleared around the fortress for protective reasons, and erosion developed in the absence of forest vegetation. Deforested areas have been used for agricultural production, as weeds, the typical vegetation of pastures, trampled surfaces and cultivated fields were detected by pollen analysis.
During the early Migration period (reign of Goths, Huns, Gepids), the proportion of woody pollens increased exponentially, erosion dropped drastically and another peat layer developed in the catchment basin. Based on historical sources [170], a significant number of Goths communities settled in the Transylvanian basin and established a diverse economy-this is also supported by our Transylvanian geohistorical data [171]. The loosely structured settlements of the Goths were established on the alluvium of streams and rivers [171,172], but the forest and mire regeneration of the studied area suggest that an uninhabited band may have been formed between the interiors of the Transylvanian basin and the Eastern European Plains. This band may have stretched through the study area-this may explain the sudden and complete absence of human impact and the complete regeneration of the forest and mire environment after the Roman Imperial phase in the early Migration period (3–7th century AD/1600–1300 cal BP years).
The forest and mire regeneration phase after the 7th century AD (1300 cal BP years) ended and another erosion phase developed with vegetation change and the reduction of arboreal pollen (from 60% to 40%) and a culture steppe formed. Both historical sources and archaeological find show that this time the Avars had already lived [142,145,173] in Transylvania, which was part of the Avar Kaganath. Thus, the significant environmental change that took place in the second half of the Migration period can be linked to the Avar communities.
The most important characteristic of this level of vegetation change and erosion is that it does not show a decline in the 8–9th centuries, but constantly evolving into the next chronological horizon, the level of the Magyars Conquest. A correct AMS data is also connected to this latter. Our data indicate that agricultural production in this area has developed continuously from the end of the Avar Empire to the Magyars Conquest. As a result, continuity can be observed between the two ethnic groups–with a strong emphasis on the level of agricultural production and human impacts.
Another phase of environmental transformations developed in the study area in the period of the Magyars Conquest. The proportion of arboreal pollen decreased to 40% and a cultivated steppe developed around the catchment basin. Erosion was continuous, the elements indicating erosion increased again and remained significant after the Magyars Conquest, throughout the Middle Age. It should be mentioned that the Magyars Conquest strongly affected the mid-mountain zone of the Eastern Carpathians and in addition to animal husbandry, arable lands (crop production) were also established based on the grain pollens. These geohistorical data show a good correlation with previous data [88]. It can be concluded that a significant population grew after the settlement participated in the process of Magyars Conquest [88] and a notable part of it took part in crop production [88,174]. The increasing human impacts during the Árpádian period suggest that the region was continuously inhabited between the 7–14th centuries AD. Thus, even if there was uninhabited and non-productive grassland area in the Eastern Carpathians mid-mountain region during the Magyars Conquest, our study area did not belong to it. At the end of the Árpádian Age, an artificial pond was formed in the depression of the catchment basin, which completely changed the sedimentation by this human influence. This pond was filled up by the end of the 17th/18th centuries AD and turned into a cyclically drying swamp. This swamp was transformed into a rainwater reservoir lake in 1907 by the Gazdakör (Farmers’ association) in parallel with the improvement of the pasture. The water level of the lake was controllable by sluices and dams. It was used for watering livestock [175,176]. Unfortunately, in the second part of the 20th century, this system was completely destroyed, and the pasture was abandoned.

5. Conclusions

This paper describes the complex geochemical data analysis of Round Lake to define paleoenvironmental conditions over the past 7500 years. Chemical changes in the peat are the result of the complex processes that are not only affected by external influences but also by biological and chemical processes in the mire. We found that:
(1).
The sedimentological data make clear that the sediment series with a length of 560 cm–accumulated during the last 7500 years–do not differ much in terms of grain composition, sediment samples are fairly homogeneous. Only the lake sediment samples of the medieval-modern era differed from each other, as well as the ones that indicating erosion. The peat samples formed a completely overlapping set in terms of particle composition. Sphagnum moss peat and herbaceous peat samples are completely identical in terms of sedimentology, they can only be distinguished based on their vegetation content.
(2).
Among the examined elements, two groups can be distinguished well. The one derived from organic material (P, S, Ca, LOI550, LOI950) and another one from minerogenic material (Si, Al, K, Mn, Fe, Ti, Zr, Cr, Rb, Sr, LOIres, MS), however, some elements are transported by vegetation (K, Cr, Rb) and groundwater (Fe, Mn) within the peat.
(3).
Summarizing our geohistorical studies, erosion phases can be detected at the level of 12 cultures, and these observations (and the disturbance of the forest vegetation) can also be seen in the case of similar studies about the prehistoric horizons of the Subcarpathian region of the Northern Carpathians [91]. In addition, significant differences between the human impacts can be noted for the last 2000 years due to the different history and demography of the two areas.

Supplementary Materials

The following are available online at https://0-www-mdpi-com.brum.beds.ac.uk/article/10.3390/quat4020018/s1, Figure S1. The elemental distribution at Round Lake compared to LOI (ash, LOI550 and carbonate content) from Tapody et al. [3]. Figure S2. The elemental distribution at Round Lake calculated to oxid forms plotted against cal BP year. Figure S3. Percentage pollen diagram of selected arbor and non-arbor pollen taxa in the Holocene profile plotted against calibrated BP years.

Author Contributions

Conceptualization, R.O.T., D.M., P.S. and M.K.; methodology R.O.T., D.M., P.S., M.K., L.M. and T.T.; statistics, R.O.T.; validation, P.C. and P.S.; formal analysis, R.O.T. and M.K.; investigation, all of the authors; resources, R.O.T., D.M., M.K., L.M., T.T., P.C. and P.S.; writing—original draft preparation, R.O.T., M.K. and P.S.; writing—review and editing, R.O.T., D.M. and P.S.; visualization, R.O.T., D.M. and P.S.; supervision, D.M. and P.S.; project administration, P.S. and D.M.; funding acquisition, P.S. All authors have read and agreed to the published version of the manuscript.

Funding

Research has been supported by Hungarian Ministry of Human Capacities grant 20391-3/2018/FEKUSTRAT and European Regional Development Fund grant GINOP-2.3.2-15-2016-00009 ‘ICER’.

Data Availability Statement

The data presented in this study are available on request from the corresponding author. The data are not publicly available due to the data will also be used in ongoing research.

Conflicts of Interest

The authors declare no conflict of interest.

References

  1. Verhoven, J.T.A. Nutrient dynamics in minerotrophic peat. Mires. Aquat. Bot. 1986, 25, 117–137. [Google Scholar] [CrossRef]
  2. Shotyk, W. Review of the inorganic geochemistry of peats and peatland waters. Earth-Sci. Rev. 1988, 25, 95–176. [Google Scholar] [CrossRef]
  3. Shotyk, W. Peat mires archives of atmospheric metal deposition: Geochemical assessment of peat profiles, natural variations in metal concentrations, and metal enrichment factors. Environ. Rev. 1996, 41, 49–183. [Google Scholar]
  4. Shotyk, W. The chronology of anthropogenic, atmospheric Pb deposition recorded by peat cores in three minerogenic peat deposits from Switzerland. Sci. Total Environ. 2002, 292, 19–31. [Google Scholar] [CrossRef]
  5. Muller, J.; Wust, R.A.J.; Weiss, D.; Hu, Y. Geochemical and stratigraphic evidence of environmental change at Lynch’s Crater, Queensland, Australia. Glob. Planet. Chang. 2006, 53, 269–277. [Google Scholar] [CrossRef]
  6. Bindler, R. Mired in the past—Looking to the future: Geochemistry of peat and the analysis of past environmental changes. Glob. Planet. Chang. 2006, 53, 209–221. [Google Scholar] [CrossRef]
  7. Krumins, J.; Kuske, E.; Klavins, M. Major and Trace Element Accumulation in Fen Peat from Elki and Viki Mires in Western Latvia. Sci. J. Riga Tech. Univ. 2011, 24, 71–81. [Google Scholar]
  8. Tapody, R.O.; Gulyás, S.; Törőcsik, T.; Sümegi, P.; Molnár, D.; Sümegi, B.; Molnár, M. Radiocarbon-dated peat development: Anthropogenic and climatic signals in a Holocene raised mire and lake profile from the Eastern part of the Carpathian Basin. Radiocarbon 2018, 60, 1215–1226. [Google Scholar] [CrossRef]
  9. Fărcaş, S.; Tanţău, I.; Bodnariuc, A. The Holocene human presence in Romanian Carpathians, revealed by the palynological analysis. Wurzbg. Geogr. Manuskr. 2003, 63, 111–128. [Google Scholar]
  10. Fărcaş, S.I.; Tanţău, I.; Ursu, T.M.; Goslar, T.; Popescu, F.; Stoica, I.A. The study of the Late-and Postglacial dynamics of the vegetation from Pesteana, Poiana Rusca Mountains. Contrib. Bot. 2006, 41, 109–118. [Google Scholar]
  11. Feurdean, A.; Klotz, S.; Mosbrugger, V.; Wohlfarth, B. Pollen-based quantitative reconstructions of Holocene climate variability in NW Romania. Palaeogeogr. Palaeoclim. Palaeoecol. 2008, 260, 494–504. [Google Scholar] [CrossRef]
  12. Feurdean, A.N.; Willis, K.J.; Astaloş, C. Legacy of the past land-use changes and management on the ‘natural’ upland forest composition in the Apuseni Natural Park, Romania. Holocene 2009, 19, 967–981. [Google Scholar] [CrossRef]
  13. Feurdean, A.; Willis, K.J. Long-term variability of Abies alba in NW Romania: Implications for its conservation management. Divers. Distrib. 2008, 14, 1004–1017. [Google Scholar] [CrossRef]
  14. Feurdean, A.; Willis, K.J. The usefulness of a long-term perspective in assessing current forest conservation management in the Apuseni Natural Park, Romania. Ecol. Manag. 2008, 256, 421–430. [Google Scholar] [CrossRef]
  15. Tanţău, I.; Reille, M.; de Beaulieu, J.L.; Fărcaș, S. Late Glacial and Holocene vegetation history in the southern part of Transylvania (Romania): Pollen analysis of two sequences from Avrig. J. Quat. Sci. 2006, 21, 49–61. [Google Scholar] [CrossRef]
  16. Tanţău, I.; Reille, M.; de Beaulieu, J.L.; Fărcaș, S.; Brewer, S. Holocene vegetation history in Romanian Subcarpathians. Quat. Res. 2009, 72, e164–e173. [Google Scholar] [CrossRef]
  17. Magyari, E.; Buczkó, K.; Jakab, G.; Braun, M.; Pál, Z.; Karátson, D.; Pap, I. Palaeolimnology of the last crater lake in the Eastern Carpathian Mountains: A multiproxy study of Holocene hydrological changes. Hydrobiologia 2009, 631, 29–63. [Google Scholar] [CrossRef]
  18. Magyari, E.K.; Jakab, G.; Bálint, M.; Kern, Z.; Buczkó, K.; Braun, M. Rapid vegetation response to Lateglacial and early Holocene climatic fluctuation in the South Carpathian Mountains (Romania). Quat. Sci. Rev. 2012, 35, 116–130. [Google Scholar] [CrossRef]
  19. Magyari, E.; Vincze, I.; Orbán, I.; Bíró, T.; Pál, I. Timing of major forest compositional changes and tree expansions in the Retezat Mts during the last 16,000 years. Quat. Int. 2018, 477, 40–58. [Google Scholar] [CrossRef]
  20. Grindean, R.; Tanțău, I.; Feurdean, A. 37. Doda Pilii, Apuseni Mountains (Romania). Grana 2017, 56, 478–480. [Google Scholar] [CrossRef]
  21. Szakács, A.; Seghedi, I. The Cilimani-Gurghiu-Harghita volcanic chain, East Carpathians, Romania: Volcanological features. Acta Vulcanol. 1995, 7, 145–153. [Google Scholar]
  22. Pécskay, Z.; Edelstein, O.; Seghedi Szakacs, A.; Kovacs, M.; Crihan, M.; Bernad, A. K-Ar datings of Neogene-Quaternary calc-alkaline volcanic rocks in Romania. Acta Vulcanol. 1995, 7, 53–62. [Google Scholar]
  23. Krézsek, C.; Filipescu, S. Middle to late Miocene sequence stratigraphy of the Transylvanian Basin (Romania). Tectonophysics 2005, 410, 437–463. [Google Scholar] [CrossRef] [Green Version]
  24. Krézsek, C.; Bally, A.W. The Transylvanian basin (Romania) and its relation to the Carpathian fold and thrust belt: Insights in gravitational salt tectonics. Mar. Pet. Geol. 2006, 23, 405–446. [Google Scholar] [CrossRef]
  25. Krézsek, C.; Filipescu, S.; Silye, L.; Maţenco, L.; Doust, H. Miocene facies associations and sedimentary evolution of the Southern Transylvanian Basin (Romania): Implications for hydrocarbon exploration. Mar. Pet. Geol. 2010, 27, 191–214. [Google Scholar] [CrossRef]
  26. Mac, I.; Dan, P.; Sorocovschi, V.; Maier, A.; Ciangă, N. Depresiunea Transilvaniei (chapter 5). In Geografia României, III, Carpaţii Româneşti şi Depresiunea Transilvaniei; Oancea, D., Velcea, V., Caloianu, N., Dragomirescu, Ş., Dragu, G., Mihai, E., Niculescu, G., Sencu, V., Velcea, I., Eds.; Editura Academiei: Bucureşti, Romania, 1987. [Google Scholar]
  27. Budui, V.; Perşoiu, I. Recognition and interpretation of paleosols sequences in a floodplain from the low tableland of Transylvania Depression, Romania. Late Pleistocene and Holocene Climatic Variability in the Carpathian-Balkan Region. Georewiev 2014, 2, 16–17. [Google Scholar]
  28. Veres, D.; Hutchinson, M.S.; Haliuc, A.; Frantiu, A.; Feurdean, A. Rapid shifts in environmental conditions inferred from geochemical analyses of Lake Știucii lacustrine record, Transylvanian Lowlands, Romania. Sci. Ann. Stefan Mare Univ. Suceava Geogr. Ser. 2014, 24, 181–183. [Google Scholar]
  29. Zemke, J.J.; Enderling, M.; Klein, A.; Skubski, M. The Influence of Soil Compaction on Runoff Formation. A Case Study Focusing on Skid Trails at Forested Andosol Sites. Geosciences 2019, 9, 204. [Google Scholar] [CrossRef] [Green Version]
  30. Horváth, F. Towards a mechanical model for the formation of the Pannonian basin. Tectonophysics 1993, 226, 333–357. [Google Scholar] [CrossRef]
  31. Bada, G.; Horváth, F.; Gerner, P.; Fejes, I. Review of the present-day geodynamics of the Pannonian basin: Progress and problems. J. Geodyn. 1999, 27, 501–527. [Google Scholar] [CrossRef]
  32. Horváth, F.; Musitz, B.; Balázs, A.; Végh, A.; Uhrin, A.; Nádor, A.; Koroknai, B.; Pap, N.; Tóth, T.; Wórum, G. Evolution of the Pannonian basin and its geothermal resources. Geothermics 2015, 53, 328–352. [Google Scholar] [CrossRef]
  33. Rosi, A.; Canavesi, V.; Segoni, S.; Dias Nery, T.; Catani, F.; Casagli, N. Landslides in the mountain region of Rio de Janeiro: A proposal for the semi-automated definition of multiple rainfall thresholds. Geosciences 2019, 9, 203. [Google Scholar] [CrossRef] [Green Version]
  34. Jowsey, P.C. An improved peat sampler. New Phytol. 1966, 65, 245–248. [Google Scholar] [CrossRef]
  35. Aaby, B.; Digerfeldt, G. 1986: Sampling techniques for lakes and mires. In Handbook of Holocene Palaeoecology and Palaeohydrology; Berglund, B.E., Ed.; John Wiley Sons: Chichester, UK, 1986; pp. 181–194. [Google Scholar]
  36. An, Z.; Kukla, G.J.; Porter, S.C.; Xiao, J. Magnetic susceptibility evidence of monsoon variation on the Loess Plateau of central China during the last 130,000 years. Quat. Res. 1991, 36, 29–36. [Google Scholar] [CrossRef]
  37. Crowther, J. Potential magnetic susceptibility and fractional conversion studies of archaeological soils and sediments. Archaeometry 2003, 45, 685–701. [Google Scholar] [CrossRef]
  38. Harvey, A.M.; Foster, G.; Hannam, J.; Mather, A.E. The Tabernas alluvial fan and lake system, southeast Spain: Applications of mineral magnetic and pedogenic iron oxide analyses towards clarifying the Quaternary sediment sequences. Geomorphology 2003, 50, 151–171. [Google Scholar] [CrossRef]
  39. Zhou, R.; Liu, Q.; Jackson, M.J. Paleoenvironmental significance of the magnetic fabrics in Chinese loess-paleosols since the last interglacial (<130 ka). Earth Planet. Sci. Lett. 2004, 221, 55–69. [Google Scholar]
  40. Dearing, J. Environmental Magnetic Susceptibility: Using the Bartington MS2 System; Chi Publ: Kenilworth, UK, 1994. [Google Scholar]
  41. Oldfield, F.; Thompson, R.; Barber, K.E. Changing atmospheric fallout of magnetic particles recorded in recent ombrotrophic peat sections. Science 1978, 199, 679–680. [Google Scholar] [CrossRef]
  42. Sun, J.; Liu, T. Multiple origins and interpretations of the magnetic susceptibility signal in Chinese wind-blown sediments. Earth Planet. Sci. Lett. 2000, 180, 287–296. [Google Scholar] [CrossRef]
  43. Balsam, W.L.; Ellwood, B.B.; Ji, J.; Williams, E.R.; Long, X.; El Hassani, A. Magnetic susceptibility as a proxy for rainfall: Worldwide data from tropical and temperate climate. Quat. Sci. Rev. 2011, 30, 2732–2744. [Google Scholar] [CrossRef]
  44. Long, X.; Ji, J.; Barr, V. Climatic thresholds for pedogenic iron oxides under aerobic conditions: Processes and their significance in paleoclimate reconstruction. Quat. Sci. Rev. 2016, 150, 264–277. [Google Scholar] [CrossRef]
  45. Xiao, H.; Cheng, S.; Mao, X.; Huang, T.; Hu, Z.; Zhou, Y.; Liu, X. Characteristics of peat humification, magnetic susceptibility and trace elements of Hani peatland, northeastern China: Paleoclimatic implications: The paleoclimatic significance of peat. Atmos. Sci. Lett. 2017, 18, 140–150. [Google Scholar] [CrossRef] [Green Version]
  46. Konert, M.; Vandenberghe, J. Comparison of layer grain size analysis with pipette and sieve analysis: A solution for the underestimation of the clay fraction. Sedimentology 1997, 44, 523–535. [Google Scholar] [CrossRef] [Green Version]
  47. Troels-Smith, J. Characterization of unconsolidated sediments. Dan. Geol. Unders. 1955, 4, 10. (In Danish) [Google Scholar]
  48. Kershaw, A.P. A modification of the TroelsSmith system of sediment description and portrayal. Quat. Australas. 1997, 15, 63–68. [Google Scholar]
  49. Physical Geography. Available online: https://pg-du.org/troels-smith-scheme/ (accessed on 19 April 2021).
  50. Dean, W.E. Determination of carbonate and organic matter in calcareous sediments and sedimentary rocks by loss on ignition; comparison with other methods. J. Sediment. Petrol. 1974, 44, 242–248. [Google Scholar]
  51. Heiri, O.; Lotter, A.F.; Lemcke, G. Loss on ignition as a method for estimating organic and carbonate content in sediments: Reproducibility and comparability of results. J. Paleolim. 2001, 25, 101–110. [Google Scholar] [CrossRef]
  52. Santisteban, J.I.; Mediavilla, R.; Lopez-Pamo, E.; Dabrio, C.J.; Zapata, M.B.R.; García, M.J.G.; Martínez-Alfaro, P.E. Loss on ignition: A qualitative or quantitative method for organic matter and carbonate mineral content in sediments? J. Paleolim. 2004, 32, 287–299. [Google Scholar] [CrossRef] [Green Version]
  53. Hammer, O.; Harper, D.A.T.; Ryan, P.D. PAST: Paleontological statisticssoftware package for education and data analysis. Palaeontol. Electron. 2001, 4, 9–18. [Google Scholar]
  54. Eriksson, L.; Johansson, E.; Kettaneh-Wold, N.; Wold, S. Introduction to Multi- and Megavariate Data Analysis Using Projection Methods (PCA & PLS); Umetrics AB: Umea, Sweden, 1999. [Google Scholar]
  55. Kylander, M.E.; Martínez-Cortizas, A.; Bindler, R.; Greenwood, S.L.; Mörth, C.-M.; Rauch, S. Potentials and problems of building detailed dust records using peat archives: An example from Store Mosse (the “Great Mire”), Sweden. Geochim. Cosmochim. Acta 2016, 190, 156–174. [Google Scholar] [CrossRef]
  56. Hertelendi, E.; Csongor, É.; Záborszky, L.; Molnár, I.; Gál, I.; Győrffy, M.; Nagy, S. Counting system for high precision C-14 dating. Radiocarbon 1989, 32, 399–408. [Google Scholar] [CrossRef] [Green Version]
  57. Hertelendi, E.; Sümegi, P.; Szöőr, G. Geochronologic and paleoclimatic characterization of Quaternary sediments in the Great Hungarian Plain. Radiocarbon 1992, 34, 833–839. [Google Scholar] [CrossRef] [Green Version]
  58. Hertelendi, E.; Kalicz, N.; Raczky, P.; Horváth, F.; Veres, M.; Svingor, É.; Futó, I.; Bartosiewicz, L. Re-evaluation of the Neolithic in eastern Hungary based on calibrated radiocarbon dates. Radiocarbon 1995, 37, 239–244. [Google Scholar] [CrossRef] [Green Version]
  59. Molnár, M.; Janovics, R.; Major, I.; Orsovszki, J.; Gönczi, R.; Veres, M.; Leonard, A.G.; Castle, S.M.; Lange, T.E.; Wacker, L.; et al. Status report of the new AMS 14C sample preparation lab of the Hertelendi Laboratory of Environmental Studies (Debrecen, Hungary). Radiocarbon 2013, 55, 665–676. [Google Scholar] [CrossRef] [Green Version]
  60. Blaauw, M.; Christen, J.A. Flexible paleoclimate age-depth models using an autoregressive gamma process. Bayesian Anal. 2011, 3, 457–474. [Google Scholar] [CrossRef]
  61. Blaauw, M.; Christen, J.A.; Benett, K.D.; Reimer, P.J. Double the dates and go for Bayes-Impacts of model choice, dating density and quality of chronologies. Quat. Sci. Rev. 2018, 188, 58–66. [Google Scholar] [CrossRef] [Green Version]
  62. Reimer, P.; Austin, W.; Bard, E.; Bayliss, A.; Blackwell, P.G.; Ramsey, C.B.; Butzin, M.; Cheng, H.; Edwards, R.L.; Friedrich, M.; et al. The IntCal20 Northern Hemisphere radiocarbon age calibration curve (0–55 cal kBP). Radiocarbon 2020, 62, 725–757. [Google Scholar] [CrossRef]
  63. Bennett, K.D.; Willis, K.J. Terrestrial, algal, and siliceous indicators. In Tracking Environmental Change Using Lake Sediments; Smol, J.P., Birks, H.J.B., Last, W.M., Eds.; Kluwer Academic Publishers: Dordrecht, The Netherlands, 2001; Volume 3, pp. 32–35. [Google Scholar]
  64. Stockmarr, J. Tablets with spores used in absolute pollen analysis. Pollen Spores 1971, 13, 614–621. [Google Scholar]
  65. Moore, P.D.; Webb, J.A.; Collinson, M.E. Pollen Analysis; Blackwell Scientific Publications: Oxford, UK, 1991. [Google Scholar]
  66. Reille, M. Pollen et Spores d’Europe et d’Afrique du Nord; Laboratoirede Botanique Historique et Palynologie: Marseille, France, 1992. [Google Scholar]
  67. Reille, M. Pollen et Spores d’Europe et d’Afrique du Nord; Supplement 1; Laboratoirede Botanique Historique et Palynologie: Marseille, France, 1995. [Google Scholar]
  68. Reille, M. Pollen et Spores d’Europe et d’Afrique du Nord; Supplement 2; Laboratoirede Botanique Historique et Palynologie: Marseille, France, 1998. [Google Scholar]
  69. Sugita, S. Pollen representation of vegetation in Quaternary sediments: Theory and method in patchy vegetation. J. Ecol. 1994, 82, 881–897. [Google Scholar] [CrossRef]
  70. Soepboer, W.; Sugita, S.; Lotter, A.F.; van Leeuwen, J.F.N.; van der Knaap, W.O. Pollen productivity estimates for quantitative reconstruction of vegetation cover on the Swiss Plateau. Holocene 2007, 17, 65–77. [Google Scholar] [CrossRef]
  71. Jacobson, G.L.; Bradshaw, R.H.W. The selection of sites for palaeovegetational studies. Quat. Res. 1981, 16, 80–96. [Google Scholar] [CrossRef]
  72. Prentice, I.C. Pollen representation, source area, and basin size: Toward an unified theory of pollen analysis. Quat. Res. 1985, 23, 76–86. [Google Scholar] [CrossRef]
  73. Magyari, E.K.; Chapman, J.C.; Passmore, D.G.; Allen, J.R.M.; Huntley, J.P.; Huntley, B. Holocene persistence of wooded steppe in the Great Hungarian Plain. J. Biogeogr. 2010, 37, 915–935. [Google Scholar] [CrossRef]
  74. Magyari, E.; Shiel, R.; Passmore, D. The paleo-environment and settlement context of Polgár-10. In The Upper Tisza Project, Studies in Hungarian Landscape Archaeology, Book 4; Chapman, J., Gillings, M., Shiel, R., Gaydarska, B., Bond, C., Passmore, D., Félegyházi, E., Lumley, I., Jones, R., Edwards, J., et al., Eds.; Lowland Settlement in North East Hungary: Excavations at the Neolithic Settlement Site Polgár-10; Archaeopress: Oxford, UK, 2010. [Google Scholar]
  75. Bennett, K.D. PSIMPOLL—A quickBasic program that generates PostScript page description of pollen diagrams. INQUA Commission for the study of the Holocene: Working group on data handling methods. Newsletter 1992, 8, 11–12. [Google Scholar]
  76. Bennett, K.D. Documentation for Psimpoll 4.25 and Pscomb 1.03: C Programs for Plotting Pollen Diagrams and Analysing Pollen Data; University of Uppsala: Uppsala, Sweden, 2005. [Google Scholar]
  77. Sümegi, P.; Jakab, G.; Pál-Molnár, E.; Törőcsik, T.; Sümegi, B.P.; Bíró, N.; Molnár, M.; Tapody, R.O.; Benkő, E.; Sófalvi, A. Evolution history of Kerek (Round) lake at Homoródszentpál. Abstr. 18th Székelyföldi Geológus Találkozó 2016, 30–33. Available online: http://www.foldtan.ro/files/2016SzGT_Programfuzet_Kivonatkotet_WEB.pdf) (accessed on 31 May 2021). (In Hungarian).
  78. Gogâltan, F.; Drașovean, F. Piese preistorice din cupru şi bronz din România aflate în colecţiile British Museum, Londra I. (Prehistoric Copper and Bronze Age objects from Romania found in the collections of the British Museum in London). An. Banat. Arheol. Istor. 2015, 23, 119–150. [Google Scholar]
  79. Balogh, K. Szedimentológia I-II; Akadémiai Kiadó: Budapest, Hungary, 1991. [Google Scholar]
  80. Turer, D.; Maynard, J.B. Combining Subsidence Analysis and Detrital Modes of Sandstones to Constrain Basin History: An Example from the Eastern Pontides of Turkey. Int. Geol. Rev. 2003, 45, 329–345. [Google Scholar] [CrossRef]
  81. Gorham, E.; Janssens, J. The distribution and accumulation of chemical elements in five peat cores from the midcontinent to the eastern coast of North America. Wetlands 2005, 25, 259–278. [Google Scholar] [CrossRef]
  82. Kabata-Pendias, A. Trace Elements in Soils and Plants, 4th ed.; CRC Press: Boca Raton, FL, USA, 2010. [Google Scholar]
  83. Batty, L.C.; Younger, P.L. Growth of Phragmites australis (Cav.) Trin ex. Steudel in mine water treatment wetlands: Effects of metal and nutrient uptake. Environ. Pollut. 2004, 132, 85–93. [Google Scholar] [CrossRef]
  84. Cushing, E.J. Evidence for differential pollen preservation in late Quaternary sediments in Minnesota. Rev. Palaeobot. Palynol. 1967, 4, 87–101. [Google Scholar] [CrossRef]
  85. Bradshaw, R. Spatial scale in the pollen record. In Modelling Ecological Change; Harris, D.E., Kenneth, D.T., Eds.; Perspectives from Neoecology, Palaeoecology and Environmental Archaeology; Routledge: Abingdon, UK, 1991; pp. 41–52. [Google Scholar]
  86. Edwards, K.J. Using space in cultural palynology: The value of the off-site pollen record. In Modelling Ecological Change; Harris, D.E., Kenneth, D.T., Eds.; Perspectives from Neoecology, Palaeoecology and Environmental Archaeology; Routledge: Abingdon, UK, 1991; pp. 61–74. [Google Scholar]
  87. Edwards, K.J. Models of mid-Holocene forest farming for north-west Europe. In Climate Change and Human Impact on the Landscape; Chamgbers, F.M., Ed.; Springer: Dordrecht, The Netherlands, 1993; pp. 133–145. [Google Scholar]
  88. Willis, K.J.; Sümegi, P.; Braun, M.; Bennett, K.D.; Tóth, A. Prehistoric land degradation in Hungary: Who, how and why? Antiquity 1998, 72, 101–113. [Google Scholar] [CrossRef]
  89. Braun, M.; Sümegi, P.; Tóth, A.; Willis, K.J.; Szalóki, I.; Margitai, Z.; Somogyi, A. Reconstruciton of long-term environmental changes at Kelemér, in Hungary. In Environmental Archaeology in North-Eastern Hungary. Varia Archaeologica Hungarica Sorozat, XIX. Kötet; Gál, E., Juhász, I., Sümegi, P., Eds.; MTA Régészeti Intézet: Budapest, Hungary, 2005; pp. 25–38. [Google Scholar]
  90. Braun, M.; Hubay, K.; Magyari, E.; Veres, D.; Papp, I.; Bálint, M. Using linear discriminant analysis (LDA) of bulk lake sediment geochemical data to reconstruct lateglacial climate changes in the South Carpathian Mountains. Quat. Int. 2013, 293, 114–122. [Google Scholar] [CrossRef]
  91. Sümegi, P.; Magyari, E.; Dániel, P.; Molnár, M.; Törőcsik, T. 28,000, year record of environmental change in SE Hungary: Terrestrial response to Dansgaard-Oeshger cycles and Heinrich-events. Quat. Int. 2013, 278, 34–50. [Google Scholar] [CrossRef]
  92. Magyari, E.; Kunes, P.; Jakab, G.; Sümegi, P.; Pelánková, B.; Schabitz, F.; Braun, M.; Chytry, M. Late Pleniglacial vegetation in eastern-central Europe: Are there modern analogues in Siberia? Quat. Sci. Rev. 2014, 95, 60–79. [Google Scholar] [CrossRef]
  93. Feurdean, A.; Perşoiu, A.; Tanţău, I.; Stevens, T.; Magyari, E.K.; Onac, B.P.; Marković, S.; Andrič, M.; Connor, S.; Fărcaş, S.; et al. Climate variability and associated vegetation response throughout Central and Eastern Europe (CEE) between 60 and 8 ka. Quat. Sci. Rev. 2014, 106, 206–224. [Google Scholar] [CrossRef] [Green Version]
  94. Willis, K.J.; Sümegi, P.; Braun, M.; Tóth, A. The Late Quaternary environmental history of Bátorliget, N.E. Hungary. Palaeogeogr. Palaeoclimatol. Palaeoecol. 1995, 118, 25–47. [Google Scholar] [CrossRef]
  95. Willis, K.J.; Braun, M.; Sümegi, P.; Tóth, A. Does soil change cause vegetation change or vice, versa? A temporal perspective from Hungary. Ecology 1997, 78, 740–750. [Google Scholar] [CrossRef]
  96. Barrow, C.J. Land Degradation: Development and Breakdown of Terrestrial Environments; Cambridge University Press: Cambridge, UK, 1991. [Google Scholar]
  97. Ellis, S.; Mellor, A. Soils and Environment; Routledge: London, UK, 1995; p. 364. [Google Scholar]
  98. Huisman, D.J.; Kiden, P. A geochemical record of Late Cenozoic sedimentation history in the southern Netherlands. Geol. En Mijnb. 1997, 76, 277–291. [Google Scholar] [CrossRef]
  99. Birks, H.J.B. Late-Quaternary biotic changes in terrestrial and lacustrine environments, with particular reference to northwest Europe. In Handbook of Holocene Palaeoecology and Palaeohydrology; Berglund, B.E., Ed.; John Wiley & Sons: New York, NY, USA, 1986; pp. 3–65. [Google Scholar]
  100. Pennington, W. Lags in adjustment of vegetation to climate caused by the pace of soil development: Evidence from Britain. Vegetatio 1986, 67, 105–118. [Google Scholar] [CrossRef]
  101. Amador, J.A.; Richany, G.H.; Jones, R.D. Phosphate uptake by neutral peats of the Florida Everglades. Soil Sci. 1992, 153, 463–470. [Google Scholar] [CrossRef]
  102. Amador, J.A.; Jones, R.D. Nutrient limitations on mi-crobial reproduction in peat soils with different total phos-phorus content. Soil Biol. Biochem. 2013, 25, 793–801. [Google Scholar] [CrossRef]
  103. Damman, A.W.H. Distribution and movement of elements in ombrotrophic peat mires. Oikos 1978, 30, 480–495. [Google Scholar] [CrossRef]
  104. Braun, M.; Sümegi, P.; Szűcs, L.; Szöőr, G. A kállósemjéni Nagy–Mohos láp fejlődéstörténete (Lápképződés emberi hatásra és az ősláp hipotézis). Jósa András Múzeum Évkönyve 1993, 33–35, 335–366. (In Hungarian) [Google Scholar]
  105. Sümegi, P. The results of paleoenvironmental reconstruction and comparative geoarcheological analysis for the examined area. In The Geohistory of Bátorliget Marshland; Sümegi, P., Gulyás, S., Eds.; Archaeolingua Press: Budapest, Hungary, 2004; pp. 301–348. [Google Scholar]
  106. Sümegi, P. Régészeti Geológia—Tudományos Interdiszciplinák Találkozása [Archaeogeology—Encounter of Scientific Interdisciples]. Habilitation Thesis, Szegedi Tudományegyetem, Szeged, Hungary, 2003. (In Hungarian). [Google Scholar]
  107. Dániel, P. Geochemical analysis. In The Geohistory of Bátorliget Marshland; Sümegi, P., Gulyás, S., Eds.; Archaeolingua Press: Budapest, Hungary, 2004; pp. 52–57. [Google Scholar]
  108. Engström, D.R.; Wright, H.E., Jr. Chemical stratigraphy of lake sediments as a record of environmental change. In Lake Sediments and Environmental History. Studies in Paleolimnology and Paleoecology; Haworth, E.Y., Lund, J.W.G., Eds.; Leicester University Press: Leicester, England, 1984; pp. 11–67. [Google Scholar]
  109. Magyari, E.; Jakab, G.; Rudner, E.; Sümegi, P. Palynological and plant macrofossil data on Late Pleistocene short-term climatic oscillations in NE-Hungary. Acta Palaeobot. Suppl. 1999, 2, 491–502. [Google Scholar]
  110. Magyari, E.; Jakab, G.; Sümegi, P. Holocene vegetation dynamics in the Bereg Plain, NE Hungary—The Báb-tava pollen and plant macrofossil record. Acta GeogrDebrecina 2008, 42, 39–56. [Google Scholar]
  111. Sümegi, P.; Jakab, G.; Majkut, P.; Törőcsik, T.; Zatyko, C. Middle Age paleoecological and paleoclimatological reconstruction in the Carpathian Basin. Idojaras 2009, 113, 265–298. [Google Scholar]
  112. Masi, A.; Sadori, L.; Balossi Restelli, F.; Baneschi, I.; Zanchetta, G. Stable carbon isotope analysis as a crop management indicator at Arslantepe (Malatya, Turkey) during the Late Chalcolithic and Early Bronze Age. Vege. Hist. Archaeobot. 2014, 23, 751–760. [Google Scholar] [CrossRef]
  113. Bar-Matthews, M.; Ayalon, A. Mid-Holocene climate variations revealed by high-resolution speleothem records from Soreq Cave, Israel and their correlation with cultural changes. Holocene 2011, 21, 163–171. [Google Scholar] [CrossRef]
  114. Prentice, I.C.; Webb, T., III. Pollen percentages, tree abundances and the Fagerlind effect. J. Quat. Sci. 1986, 1, 35–43. [Google Scholar] [CrossRef]
  115. Prentice, I.C.; Cramer, W.; Harrison, S.P.; Leemans, R.; Monserud, R.A.; Solomon, A.M. A global biome model based on plant physiology and dominance, soil properties and climate. J. Biogeogr. 1992, 19, 117–134. [Google Scholar] [CrossRef]
  116. Prentice, I.C.; Guiot, J.; Huntley, B.; Jolly, D.; Cheddadi, R. Reconstructing biomes from palaeoecological data: A general method and its application to European pollen data at 0 and 6 ka. Clim. Dyn. 1996, 12, 185–194. [Google Scholar] [CrossRef]
  117. Voosen, P. New geological age comes under fire. Science 2018, 361, 537–538. [Google Scholar] [CrossRef]
  118. Gibbons, A. How the Akkadian empire was hung out to dry. Science 1993, 261, 985. [Google Scholar] [CrossRef]
  119. Staubwasser, M.; Sirocko, F.; Grootes, P.M.; Segl, M. Climate change at the 4.2 ka BP termination of the Indus valley civilization and Holocene south Asian monsoon variability. Geophys. Res. Lett. 2003, 30, 1425. [Google Scholar] [CrossRef] [Green Version]
  120. Li, C.H.; Li, Y.X.; Zheng, Y.F.; Yu, S.Y.; Tang, L.Y.; Li, B.B.; Cui, Q.Y. A high-resolution pollen record from East China reveals a large climate variability near the Northgrippian–Meghalayan boundary (around 4200 years ago) exerted societal collapse. Palaeogeogr. Palaeoecol. Palaeoclimatol. 2018, 512, 156–165. [Google Scholar] [CrossRef]
  121. Gronenborn, D.; Strien, H.C.; Dietrich, S.; Sirocko, F. Adaptive cycles’ and climate fluctuations: A case study from Linear Pottery Culture in western Central Europe. J. Archaeol. Sci. 2014, 51, 73–83. [Google Scholar] [CrossRef]
  122. Gronenborn, D. Climate fluctuations, human migrations, and the spread of farming in western Eurasia—Refining the argument. In Climate and Cultural Change in Prehistoric Europe and the Near East. 8.2 Ka Climate Event and Archaeology in the Ancient Near East (Conference); Biehl, P.F., Nieuwenhuyse, O., Eds.; Institute for European and Mediterranean Archaeology Distinguished Monograph Series; State University of New York Press: Albany, NY, USA, 2016; pp. 211–236. [Google Scholar]
  123. Gronenborn, D.; Strien, H.C.; Lemmen, C. Population dynamics, social resilience strategies, and Adaptive Cycles in early farming societies of SW Central Europe. Quat. Int. 2017, 446, 54–65. [Google Scholar] [CrossRef]
  124. Allcock, S. Long-term socio-environmental dynamics and adaptive cycles in Cappadocia, Turkey during the Holocene. Quat. Int. 2017, 446, 66–82. [Google Scholar] [CrossRef]
  125. Gulyás, S.; Sümegi, P. Riparian environment in shaping social and economic behavior during the first phase of the evolution of Late Neolithic tell complexes in SE Hungary (6th/5th millennia BC). J. Archaeol. Sci. 2011, 38, 2683–2695. [Google Scholar] [CrossRef]
  126. Gulyás, S.; Sümegi, P. Farming and/or foraging? New environmental data to the life and economic transformation of Late Neolithic tell communities (Tisza Culture) in SE Hungary. J. Archaeol. Sci. 2011, 38, 3323–3339. [Google Scholar] [CrossRef]
  127. Schöll-Barna, G.; Demény, A.; Serlegi, G.; Fábián, S.; Sümegi, P.; Fórizs, I.; Bajnóczi, B. ClimaticvariabilityintheLateCopperAge: Stableisotopefluctuationof 95 prehistoric Unio pictorum (Unionidae) shells from Lake Balaton (Hungary). J. Paleolimnol. 2012, 47, 87–100. [Google Scholar] [CrossRef]
  128. Demény, A.; Kern, Z.; Czuppon, G.; Németh, A.; Schöll-Barna, G.; Siklósy, Z.; Bondár, M. Middle Bronze Age humidity and temperature variations, and societal changes in East-Central Europe. Quat. Int. 2019, 504, 80–95. [Google Scholar] [CrossRef] [Green Version]
  129. Brookins, D.G. Eh–pH Diagrams for Geochemistry; Springer: New York, NY, USA, 1988. [Google Scholar]
  130. Steinmann, P.; Shotyk, W. Chemical composition, pH, and redox state of sulfur and iron in complete vertical porewater profiles from two Sphagnum peat mires, Jura Mountains, Switzerland. Geochim. Cosmochim. Acta 1997, 61, 1143–1163. [Google Scholar] [CrossRef]
  131. Chesworth, W.; Martínez-Cortizas, A.; García-Rodeja, E. Peatlands, Evolution and Records of Environmental and Climate Changes; Elsevier Science: Amsterdam, The Netherlands, 2006. [Google Scholar]
  132. Muller, J.; Kylander, M.; Martinez-Cortizas, A.; Wüst, R.A.J.; Weiss, D.; Blake, K.; Coles, B.; Garcia-Sanchez, R. The use of principle component analyses in characterising trace and major elemental distribution in a 55 kyr peat deposit in tropical Australia: Implications to paleoclimate. Geochim. Cosmochim. Acta 2008, 72, 449–463. [Google Scholar] [CrossRef]
  133. Megonigal, J.P.; Hines, M.E.; Vischer, P.T. Anaerobic metabolism: Linkages to trace gases and aerobic processes. In Treatise on Geochemistry, Vol. 8 Biogeochemistry; Holland, H.D., Turekian, K.K., Eds.; Elsevier: Amsterdam, The Netherlands, 2003; pp. 317–442. [Google Scholar]
  134. Tebo, B.M.; Bargar, J.R.; Clement, B.C.; Dick, G.J.; Murray, K.J.; Parker, D.; Verity, R.; Webb, S.M. Biogenic manganese oxides: Properties and mechanisms of formation. Annu. Rev. Earth Planet. Sci. 2004, 32, 287–328. [Google Scholar] [CrossRef] [Green Version]
  135. Schittek, K.; Kock, S.T.; Lücke, A.; Hense, J.; Ohlendorf, C.; Kulemeyer, J.J.; Lupo, L.C.; Schäbitz, F. A high-altitude peatland record of environmental changes inthe NW Argentine Andes (24 S) over the last 2100 years. Clim. Past 2016, 12, 1165–1180. [Google Scholar] [CrossRef] [Green Version]
  136. Heathwaite, A.L.; Burt, T.P. The evidence for past and present erosion in the Slapton catchment. In Past and Present Soil Erosion: Archaeological and Geographical Perspectives; Bell, M., Boardman, J., Eds.; Oxbow Books: Oxford, UK, 1992. [Google Scholar]
  137. Mirehian, D.; Enea, S.C. The pre-Cucuteni-Cucuteni/Tripolye cultural complex between the west and the east. Rev. Arheol. 2013, 9, 30–47. [Google Scholar]
  138. Bolohan, N. All in one Issues of methodology, paradigms and radiocarbon datings concerning the outer eastern Carpathian area. In Signa Praehistorica: Studia in Honorem Magistri Attila László Septuagesimo Anno; Bolohan, N., Florica, M., Tencariu, F.A., Eds.; Alex. I. Cuza University Press: Iasi, Romania, 2010; pp. 229–245. [Google Scholar]
  139. Ciugudean, H. Eneoliticul Final în Transilvania şi Banat: Cultura Coţofeni; Bibliotheca Historica et Archaeologica Banatica: Timişoara, Romania, 2000; p. 124. [Google Scholar]
  140. Ciugudean, H. The copper metallurgy in the Coţofeni culture (Transylvania and Banat). Apulum 2002, 39, 95–106. [Google Scholar]
  141. Collis, J. The European Iron Age; Batsford: London, UK, 1984; p. 192. [Google Scholar]
  142. Cosma, C. Avar warriors in Transylvania, Sătmar and Maramureș, Crișana and Banat. Archaeological landmarks on the political status of western Romania in the Avar Khaganate. In Warriors, Weapons, and Harness from the 5th–10th Centuries in the Carpathian Basin; Cosma, C., Ed.; Mega Publishing House: Kolozsvár, Romania, 2015; pp. 251–280. [Google Scholar]
  143. Dumitrescu, V.; Bolomey, A.; Mogoşanu, F. The prehistory of Romania from the earliest times to 1000 B.C. In The Prehistory of the Balkans and the Middle East and the Aegean World, Tenth to Eight Centuries B.C; Boardman, J., Edwards, I.E.S., Hammond, N.G.L., Sollberger, E., Eds.; Cambridge University Press: Cambridge, England, 1982; pp. 1–74. [Google Scholar]
  144. Dumitroaia, G. Comunităţi preistorice din Nord-Estul Romăniei (de la cultura Cucuteni pană in bronzul mijlociu) (Prehistoric communities from Northeast Romania from Cucuteni Culture to the Bronze Age). In Piatra Neamt: Muzeul de Istorie Piatra Neamt; Constantin Matasă: Piatra Neamt, Romania, 2000; p. 335. [Google Scholar]
  145. Gáll, E. The Avar conquest and what followed. Some ideas on the process of ‘avarisation’of Transylvanian Basin (6th‒7th centuries). In Series Patrimonium Archaeologicum Transylvanicum Volume 7; Romanian Academy Institute of Archaeology and Art History Cluj-Napoca: Cluj-Napoca, Romania, 2014; pp. 295–327. [Google Scholar]
  146. Harper, T.K. The effect of climatic variability on population dynamics of the Cucuteni-Tripolye cultural complex and the rise of the Western Tripolye giant-settlements. Chronika 2013, 3, 28–46. [Google Scholar]
  147. Härke, H. Early Iron Age Hill settlement in west Central Europe: Patterns and developments. Oxf. J. Archaeol. 1982, 1, 187–212. [Google Scholar] [CrossRef]
  148. Lazarovici, C.M. New data regarding the chronology of the Precucuteni, Cucuteni and Horodiştea-Erbiceni cultures. In Studies in Chronology and Cultural Development of the SE and Central Europe in Earlier Prehistory Presented to Juraj Pavúk on the Occasion of His 75 Birthday; Kalábková, P., Kovár, B., Pavúk, P., Suteková, J., Eds.; PANTA REI; Studia Archaeologica et Medievalia, XI; Publishing House, Comenius University in Bratislava and Archaeological Center: Olomouc—Bratislava, Czech Republic, 2010; pp. 91–114. [Google Scholar]
  149. Mantu, C.M. Metode de cercetare şi tehnici de datare pentru determinarea cronologiei culturii Cucuteni (Research methods and dating techniques for the Cucuteni culture chronology determination). Ph.D. Thesis, Alex. I. Cuza University, Iasi, Romanian, 1996. (In Romanian). [Google Scholar]
  150. Mantu, C.M. Cultura Cucuteni, Evoluţie, Cronologie, Legături (The Cucuteni Culture. Evolution, Chronology, Links); Muzeul de Istorie Piatra Neamt: Piatra Neamt, Romania, 1998; p. 324. [Google Scholar]
  151. Palincaş, N. Body and Social Order in Middle Bronze Age Transylvania (Central Romania, c. 1900−1450 BC). Eur. J. Archaeol. 2014, 17, 301–328. [Google Scholar] [CrossRef]
  152. Palincaş, N.; Rotea, M.; Sava, T.B.; Sava, G.O.; Gâza, O.; Bodea, M.; David, C. Revisiting the Radiocarbon-Based Chronology of the Wietenberg Culture (Middle Bronze Age Transylvania): A Debate of Supra-Regional Relevance. In Bridging Science and Heritage in the Balkans; Palincaş, N., Ponta, C.C., Eds.; ArcheoPress: Oxford, UK, 2019; pp. 38–51. [Google Scholar]
  153. Wells, P.S. The Iron Age. In European Prehistory: A Survey (Interdisciplinary Contributions to Archaeology); Milisauskas, S., Ed.; Springer: New York, NY, USA, 2010; pp. 405–464. [Google Scholar]
  154. Walker, M.J.; Berkelhammer, M.; Björck, S.; Cwynar, L.C.; Fisher, D.A.; Long, A.J.; Lowe, J.J.; Newnham, R.M.; Rasmussen, S.O.; Weiss, H. Formal Subdivision of the Holocene Series/Epoch: A Discussion Paper by a Working Group of INTIMATE (Integration of ice-core, marine and terrestrial records) and the Subcommission on Quaternary Stratigraphy (International Commission on Stratigraphy. J. Quat. Sci. 2012, 27, 649–659. [Google Scholar] [CrossRef]
  155. Walker, M.J.C.; Gibbard, P.; Berkelhammer, M.; Björck, S.; Cwynar, L.C.; Fisher, D.; Long, A.; Lowe, J.; Newnham, R.; Rasmussen, S.; et al. Formal Subdivision of the Holocene Series/Epoch: 1st International Congress on Stratigraphy (STRATI); Springer: Cham, Switzerland, 2014; pp. 983–987. [Google Scholar]
  156. László, A. Az Erősd-Cucuteni Kultúra Időrendjéről. Dolgozatok az Erdélyi Múzeum Érem-és Régiségtárából. Új sorozat, (I). 2006. Available online: https://eda.eme.ro/handle/10598/29213 (accessed on 31 May 2021). (in Hungarian).
  157. László, A. Ásatások az Erősdi Őstelepen. Dolgozatok az Erdélyi Múzeum Érem-és Régiségtárából. 1914. Available online: http://epa.oszk.hu/01500/01580/00010/pdf/279-386.pdf (accessed on 31 May 2021). (in Hungarian).
  158. Bondár, M. Prehistoric Wagon Models in the Carpathian Basin (3500–1500 BC); Archaeolingua Series Minor, 32; Archaeolingua Press: Budapest, Hungary, 2012; p. 135. [Google Scholar]
  159. Mackereth, F.J.H. Some chemical observations in post-glacial lake sediments. Proc. R. Acad. Sci. 1966, 250, 165–213. [Google Scholar]
  160. Sztáncsuj, S.J.; Körösfői, Z. Késő rézkori telepnyomok Fiatfalva-Alsó-Kövesföld lelőhelyen. In ‘Kutatások a Nagy-Küküllő Felső Folyása Mentén’, Molnár István Múzeum Kiadványai, I.; Körösfői, Z., Ed.; István Molnár Museum: Székelykeresztúr, Romania, 2009; pp. 15–36. [Google Scholar]
  161. Kelemen, I.A. Fiatfalva-Alsó-Kövesföld lelőhely rézkori (Coţofeni 1 kultúra) gödör állatcsontleleteinek archaeozoológiai elemzése. In ‘Kutatások a Nagy-Küküllő Felső folyása Mentén’, Molnár István Múzeum Kiadványai, I.; Körösfői, Z., Ed.; István Molnár Museum: Székelykeresztúr, Romania, 2009; pp. 38–40. [Google Scholar]
  162. Horváth, T. Hajdúnánás–Tedej–Lyukas-halom—An interdisciplinary survey of a typical kurgan from the Great Hungarian Plain region: A case study. The revision of the kurgans from the territory of Hungary). In Kurgan Studies. An. Environmental and Archaeological Multiproxy Study of Burial Mounds in the Eurasian Steppe Zone; Pető, Á., Barczi, A., Eds.; British Archaeological Reports International Series 2238; Archaeopress: Oxford, UK, 2011; pp. 71–131. [Google Scholar]
  163. Gerling, C.; Bánffy, E.; Dani, J.; Kohler, K.; Kulcsár, G.; Pike, A.; Szeverényi, V.; Heyd, V. Immigration and transhumance in the Early Bronze Age Carpathian Basin: The occupants of a kurgan. Antiquity 2012, 86, 1097–1111. [Google Scholar] [CrossRef]
  164. Szilágyi, G.; Sümegi, P.; Gulyás, S.; Molnár, D. Revision of the Age of Construction Phases of a Mound Dated to the Late Copper–Early Bronze Age in Eastern Hungary Relying on 14C-Based Chronologies. Radiocarbon 2018, 60, 1403–1412. [Google Scholar] [CrossRef]
  165. Szilágyi, G.; Náfrádi, K.; Sümegi, P. A preliminary chronological study to understand the construction phases of a Late Copper–Early Bronze Age kurgan (kunhalom). Cent. Eur. Geol. 2019, 62, 1–29. [Google Scholar] [CrossRef]
  166. Diaconescu, D. Step by Steppe: Yamnaya culture in Transylvania. Praehist. Z. 2020, 95, 17–47. [Google Scholar] [CrossRef]
  167. Gazdapusztai, G. Chronologische Fragen in der Alfölder Gruppe der Kurgan-Kultur [Chronological questions in the Kurgan Culture group of the Great Hungarian Plain]. MFMÉ 1968, 2, 91–100. [Google Scholar]
  168. Ecsedy, I. The People of the Pit-Grave Kurgans in Eastern Hungary—Fontes Archaeologici Hungaricae; Akadémiai Kiadó: Budapest, Hungary, 1979; p. 147. [Google Scholar]
  169. Quinn, C.; Ciugudean, H. Settlement placement and socio-economic priorities: Dynamic landscapes in Bronze Age Transylvania. J. Archaeol. Sci. Rep. 2018, 19, 936–948. [Google Scholar] [CrossRef]
  170. Angedent, A. A Kora Középkor; Szent István Társulat: Budapest, Hungary, 2008. [Google Scholar]
  171. Náfrádi, K.; Jakab, G.; Sümegi, P.; Szelepcsényi, Z.; Törőcsik, T. Future climate impacts in woodland and forest steppe based on Holocene paleoclimatic trends, paleobotanical change in central part of the Carpathian Basin (Hungary). Am. J. Plant. Sci. 2013, 4, 1187–1203. [Google Scholar] [CrossRef] [Green Version]
  172. Bóna, I. Daciától Erdőelvéig. A népvándorlás kora Erdélyben. In Erdély története I.; Makkai, L., Mócsy, A., Eds.; Akadémiai Kiadó: Budapest, Hungary, 1986; pp. 271–286. (In Hungarian) [Google Scholar]
  173. Daim, F. Avars and Avar Archaeology: An Introduction. In Regna and Gentes. The Relationship between Late Antique and Early Medieval Peoples and Kingdoms in the Transformation of the Roman World; Goetz, H.W., Jarnut, J., Pohl, W., Eds.; Brill Publishing House: Leiden, The Netherlands, 2003; pp. 463–570. [Google Scholar]
  174. Törőcsik, T.; Sümegi, P. Pollen-based reconstruction of the plant cultivation in the Carpathian Basin from the Migration Age to the end of the Medieval Age. Archeometriai Műhely 2019, XVI/3, 245–269. [Google Scholar]
  175. Ürmösi, J. 44 év a Lelkipásztori és Szövetkezeti Munkamezőn; Unpublished Work; Cluj-Napoca, Romania, 1949; pp. 3–5. (In Hungarian) [Google Scholar]
  176. Balázsi, D. Cooperatives in the valley of Nicou-Alb in the first half of the 20th century. In A Csíki Székely Múzeum Évkönyve 5. Régészet, történettudományok; Lóránt, D., Ed.; Pro-Print Könyvkiadó: Csíkszereda, Romania, 2009; pp. 131–196. (In Hungarian) [Google Scholar]
Figure 1. Map of Romania within the studied site Round Lake at Sănpaul (edited by Réka Orsolya Tapody adapted from: mapsland.com and Google Maps—accessed on 30 April 2021). (a) The location of the site in Romania (b) The vicinity of the site in a topographic map (which is roughly 1 × 1 km2); (c) and in an aerial view (the distance of the site and Homoródszentpál (Sânpaul) is 2 km).
Quaternary 04 00018 g001
Figure 2. The 6 × 6 km2 geology map of the environment of the Round Lake. Symbols 1: Miocene marin marl, 2: Miocene marin marl with dacite tuff layers, 3: Holocene alluvia, 4: Dacite tuff and conglomerate, 5: Capronita bearing limestone and conglomerate, 6: Tithonian limestone, 7: Kimmeridgian limestone, 8: Triassic limestone, 9: Settlement, 10: Creek, 11: Road, Star: points the investigated site, RL: the abbreviation of Round Lake.
Quaternary 04 00018 g002
Figure 3. Climate data on Walter-Lieth diagram of the Round Lake (A: mean maximum precipitation, B: mean minimum precipitation, C: mean maximum temperatures, D: mean minimum temperatures).
Quaternary 04 00018 g003
Figure 4. Magnetic susceptibility, grain size and loss on ignition of the Round Lake at Homoródszentpál (Sânpaul, Romania).
Quaternary 04 00018 g004
Figure 5. (a) The grain-size composition shown on a triangle diagram for each sample in lithology type. (b) LOI550, LOI950 and LOI residum shown on a triangle diagram for each sample in lithology type.
Quaternary 04 00018 g005
Figure 6. Dendrogram obtained (UPGMA method with Manhattan similarity by PAST 3X) for cluster analysis of observations.
Quaternary 04 00018 g006
Figure 7. Bayesian age-depth model using 14C age tie points and calculated sedimentation rates for sampled intervals using Bacon [60] for core Round Lake at Sânpaul, Romania. Top left: Markov Chain Monte Carlo model iterations. Top middle: prior (green line) and posterior (solid gray) distribution of accumulation rate. Top right: prior (heavy green line) and posterior (solid gray) distribution of the model memory. Bottom, calibrated 14C dates in blue and the age–depth model. Grey stippled lines show 95% confidence intervals. The central dotted red curve is the ‘best’ model based on the weighted mean age.
Quaternary 04 00018 g007
Figure 8. Calculated sedimentation times (yr/cm) (inverse accumulation rate) were estimated from Markov Chain Monte Carlo (MCMC) iterations against age and depth using the Bacon model (red dotted lines: mean values).
Quaternary 04 00018 g008
Figure 9. Principal components analysis (PCA) biplot of selected environmental variables and samples with Troels-Smith [35] categories (1. laminated lacustrine mud, 2. calcareous pelitic peat, 3. herbaceous peat, 4. moss peat).
Quaternary 04 00018 g009
Figure 10. Summary of palaeovegetation phase and pollen taxa correlated with the Blytt-Sernander system.
Quaternary 04 00018 g010
Table 1. Sediment layers and their description from the undisturbed core sequence of Round Lake. Th: Turfa herbacea Tb:turfa bryophitica Lc: Limus calcareus As: Agrilla steatodes (Troels-Smith scheme available on https://pg-du.org/troels-smith-scheme/ (accessed on 19 April 2021)).
Depth (cm)Troels-Smith CategoryMunsell Color CategoryColorStructureAge
(Cal BP Years)
15–0Lc1As310 YR 4/4greyish redpoliedric soil0
102–15Lc1As310 YR 3/2reddish greylaminated lake mud600–0
198–102Lc1Th1As110 YR 3/3dark browncarbonaceus pelitic sediment2400–600
254–198Th2Lc1As110 YR 3/2blackish browncarbonaceus pelitic sediment3400–2400
260–254Th3Lc110 YR 3/1dark greyherbaceus peat3450–3400
284–260Th2Lc1As110 YR 3/2blackish browncarbonaceus pelitic sediment3800–3450
290–284Th3As110 YR 3/1dark greyherbaceus peat3900–3800
292–290Th2Lc1As110 YR 3/2blackish browncarbonaceus pelitic sediment3950–3900
320–292Th3As110 YR 3/1dark greyherbaceus peat4150–3950
362–320Tb3As110 YR 2/2dark brownmoss peat4500–4150
366–362Th2Lc1As110 YR 3/2blackish browncarbonaceus pelitic sediment4600–4500
384–366Th3Lc110 YR 3/1reddish brownherbaceus peat4800–4600
392–384Th2Lc1As110 YR 3/2blackish browncarbonaceus pelitic sediment5000–4800
510–392Th3As110 YR 3/1reddish brownherbaceus peat6500–5000
530–510Tb3As110 YR 2/2dark brownmoss peat7000–6500
530–560Th3As110 YR 3/1reddish brownherbaceus peat7500–7000
Table 2. Major and trace elements mean concentration in the Round Lake whole section, compared to the lake and the peat phases (the positive deviations from the average concentrations are remarked with bold numbers).
Total Section (0–560 cm)Lake Phase (0–104 cm)Peat Phase (104–560 cm)
Si (%)16.6127.4014.06
Al (%)4.847.524.21
Fe (%)3.784.873.52
K (%)1.041.710.88
Ca (%)0.870.670.91
Ti (ppm)3067.485504.382491.48
S (%)0.130.000.16
P (%)0.060.000.07
Mn (ppm)124.97348.0772.24
Cr (ppm)90.45106.7485.95
Rb (ppm)72.66113.2663.06
Zr (ppm)72.54161.8351.43
Sr (ppm)66.3395.1759.51
Table 3. Factor loadings for PC1 and PC2 (PC1 represents the lake phase, PC2 represents the peat phase, based on the higher values (bold) of loading values.
VariablesPC 1PC 2
Al0.851280.22037
Si0.925650.32804
S−0.531870.65016
P0.240360.79389
K0.912660.3497
Ca−0.134020.81413
Ti0.926280.25136
Cr0.747130.5794
Mn0.84944−0.2622
Fe0.772340.50753
Rb0.909680.28342
Sr0.892650.32182
Zr0.97298−0.063781
MS0.92041−0.15484
LOI550−0.943130.025909
LOI950−0.723010.17593
LOIres0.94396−0.031808
Clay−0.577330.21615
Fine silt−0.781140.36674
Coarse silt0.68392−0.28212
Vf sand0.80249−0.37068
Fine sand0.77815−0.38445
M. sand0.7565−0.39059
Table 4. 12 AMS data from undisturbing core sequence of the Round Lake.
Lab CodeMaterialDepth
(cm)
14C Age yr (BP)±cal yr BP±AD/BC Years
DeA-11893charcoal5923021227721643–1799 AD
D-AMS 015575charcoal100 56622584531303–1419 AD
DeA-13155peat14010842499834894–1013 AD
DeA-11892peat19918692617997477–222 AD
DeA-11891peat2112528252621123794–547 BC
DeA-12029peat2312947283089861054–1226 BC
D-AMS 015574peat23630152632071271131–1385 BC
DeA-13157peat3203799284183534283–4090 BC
D-AMS 015577peat41646022852691793141–3499 BC
DeA-11889peat4895615316386764361–4512 BC
DeA-11888peat5115916336742904713–4892 BC
D-AMS 015576peat5606575297495655480–5610 BC
Table 5. Spearman’s rank correlation coefficients matrix between the concentrations of analysed elements. Bold fond shows a significant correlation at the 0.01 level (2-tailed). The underlined correlation coefficients are higher than 0.6.
AlSiPSKCaTiCrMnFeRbSr
Si0.913
P−0.513−0.472
S−0.704−0.6260.896
K0.8770.967−0.455−0.560
Ca−0.456−0.3520.9050.873−0.325
Ti0.8440.946−0.448−0.5670.965−0.310
Cr0.7870.766−0.324−0.4460.788−0.2430.777
Mn0.6830.798−0.417−0.5280.794−0.2700.8550.604
Fe0.7770.759−0.339−0.5580.712−0.2340.6610.6790.568
Rb0.9320.911−0.602−0.7460.901−0.5200.8570.7750.6790.816
Sr0.7100.879−0.360−0.4820.861−0.1780.8670.6070.7680.6780.764
Zr0.8970.925−0.616−0.7800.880−0.5160.8830.7120.7470.7710.9520.819
Publisher’s Note: MDPI stays neutral with regard to jurisdictional claims in published maps and institutional affiliations.

