
Submergence of the Western Greco-Roman Archaeological Site at the Eastern Harbor of Alexandria: Emerged from High Resolution Geophysical Mapping


Abstract
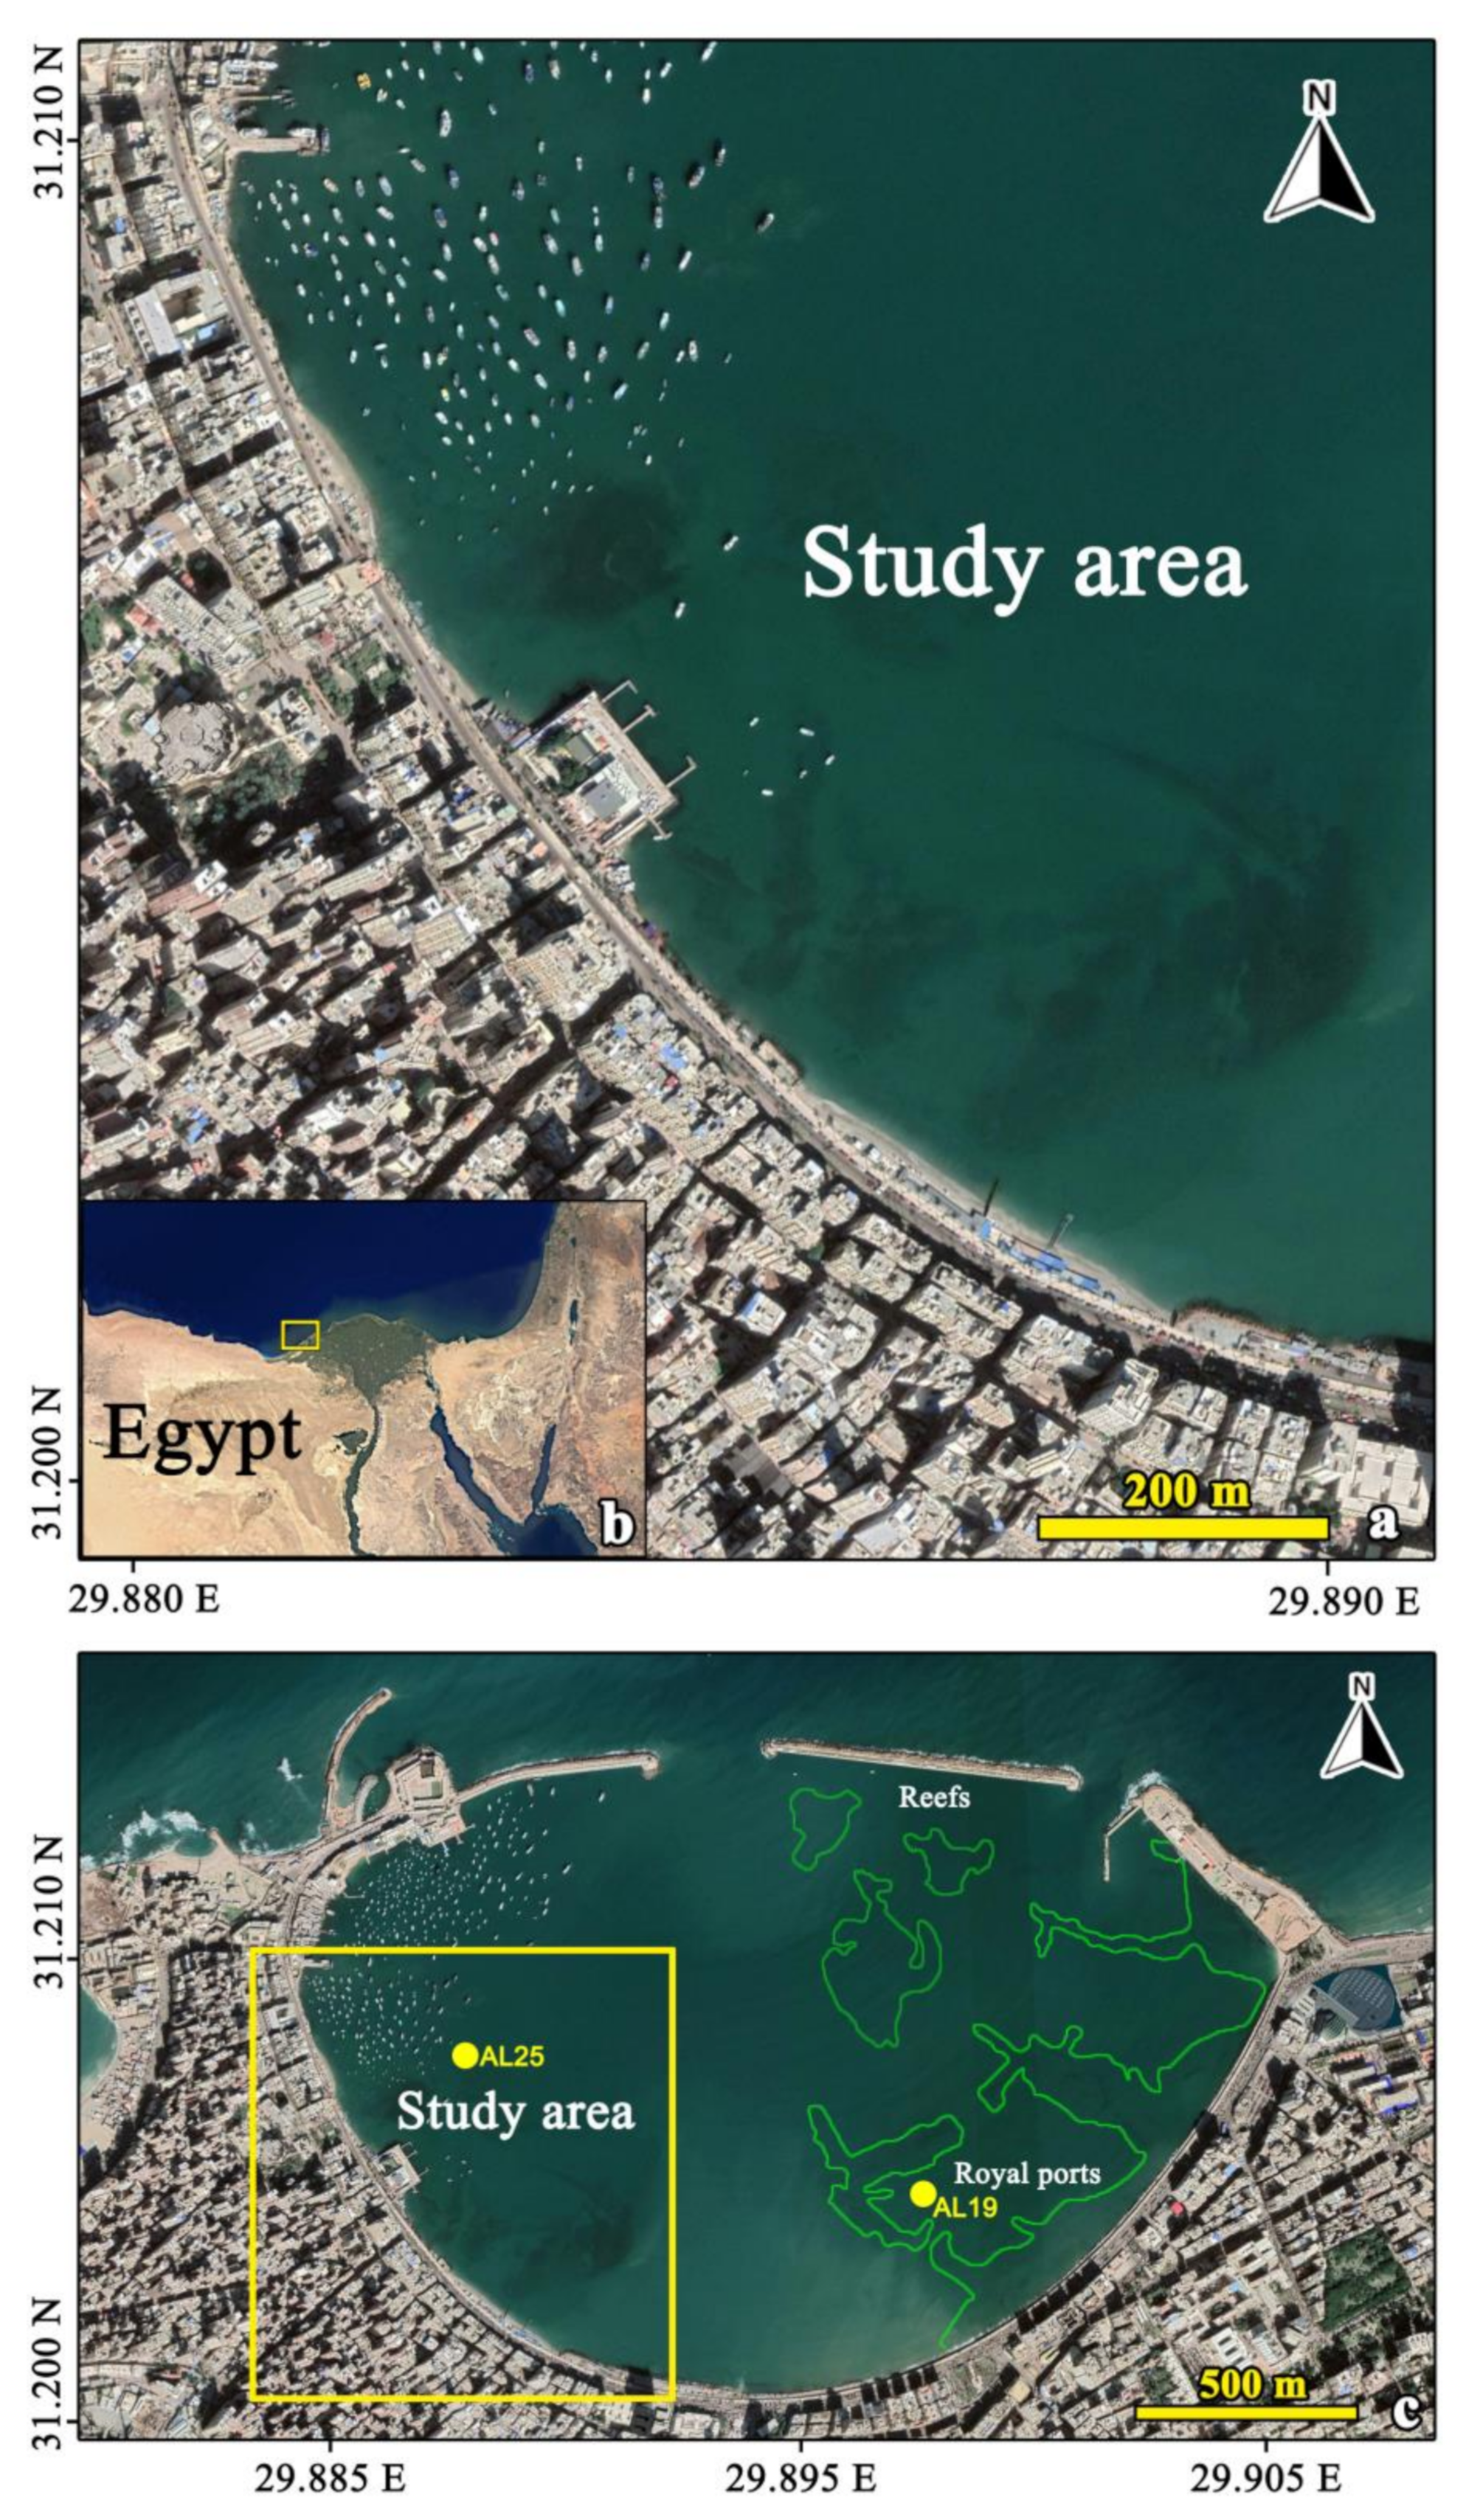
:1. Introduction
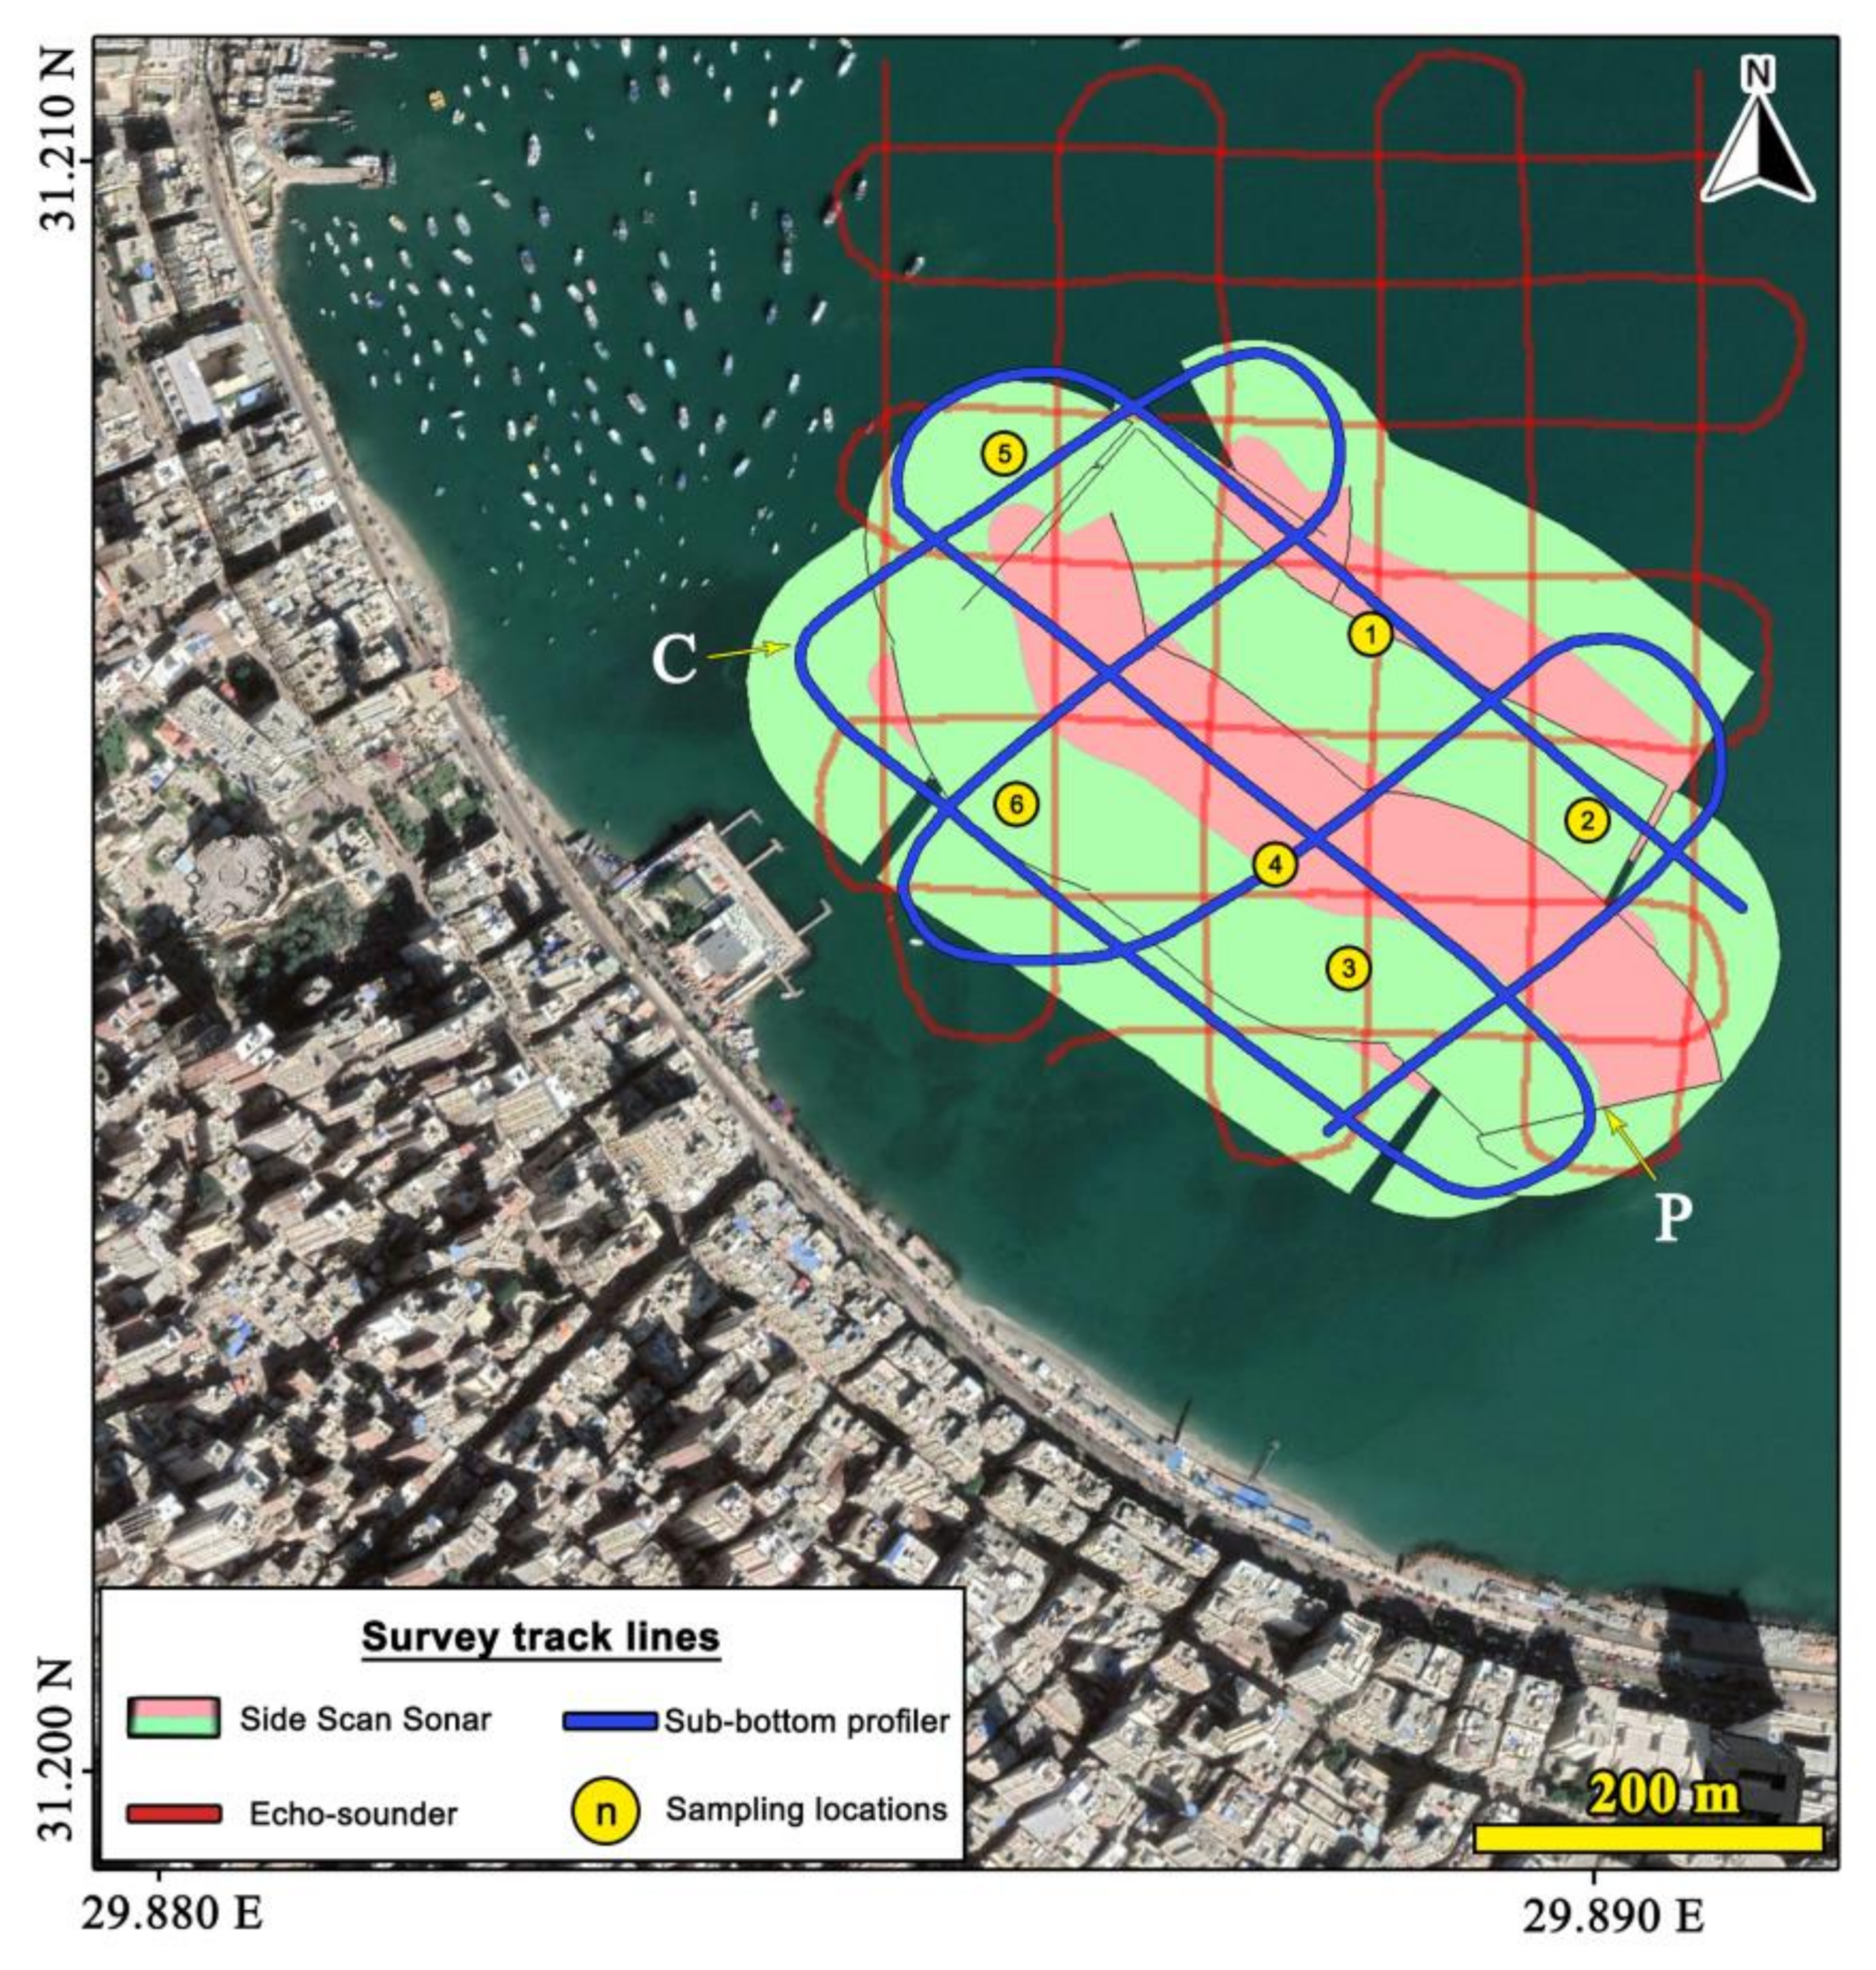
2. Materials and Methods
3. Results
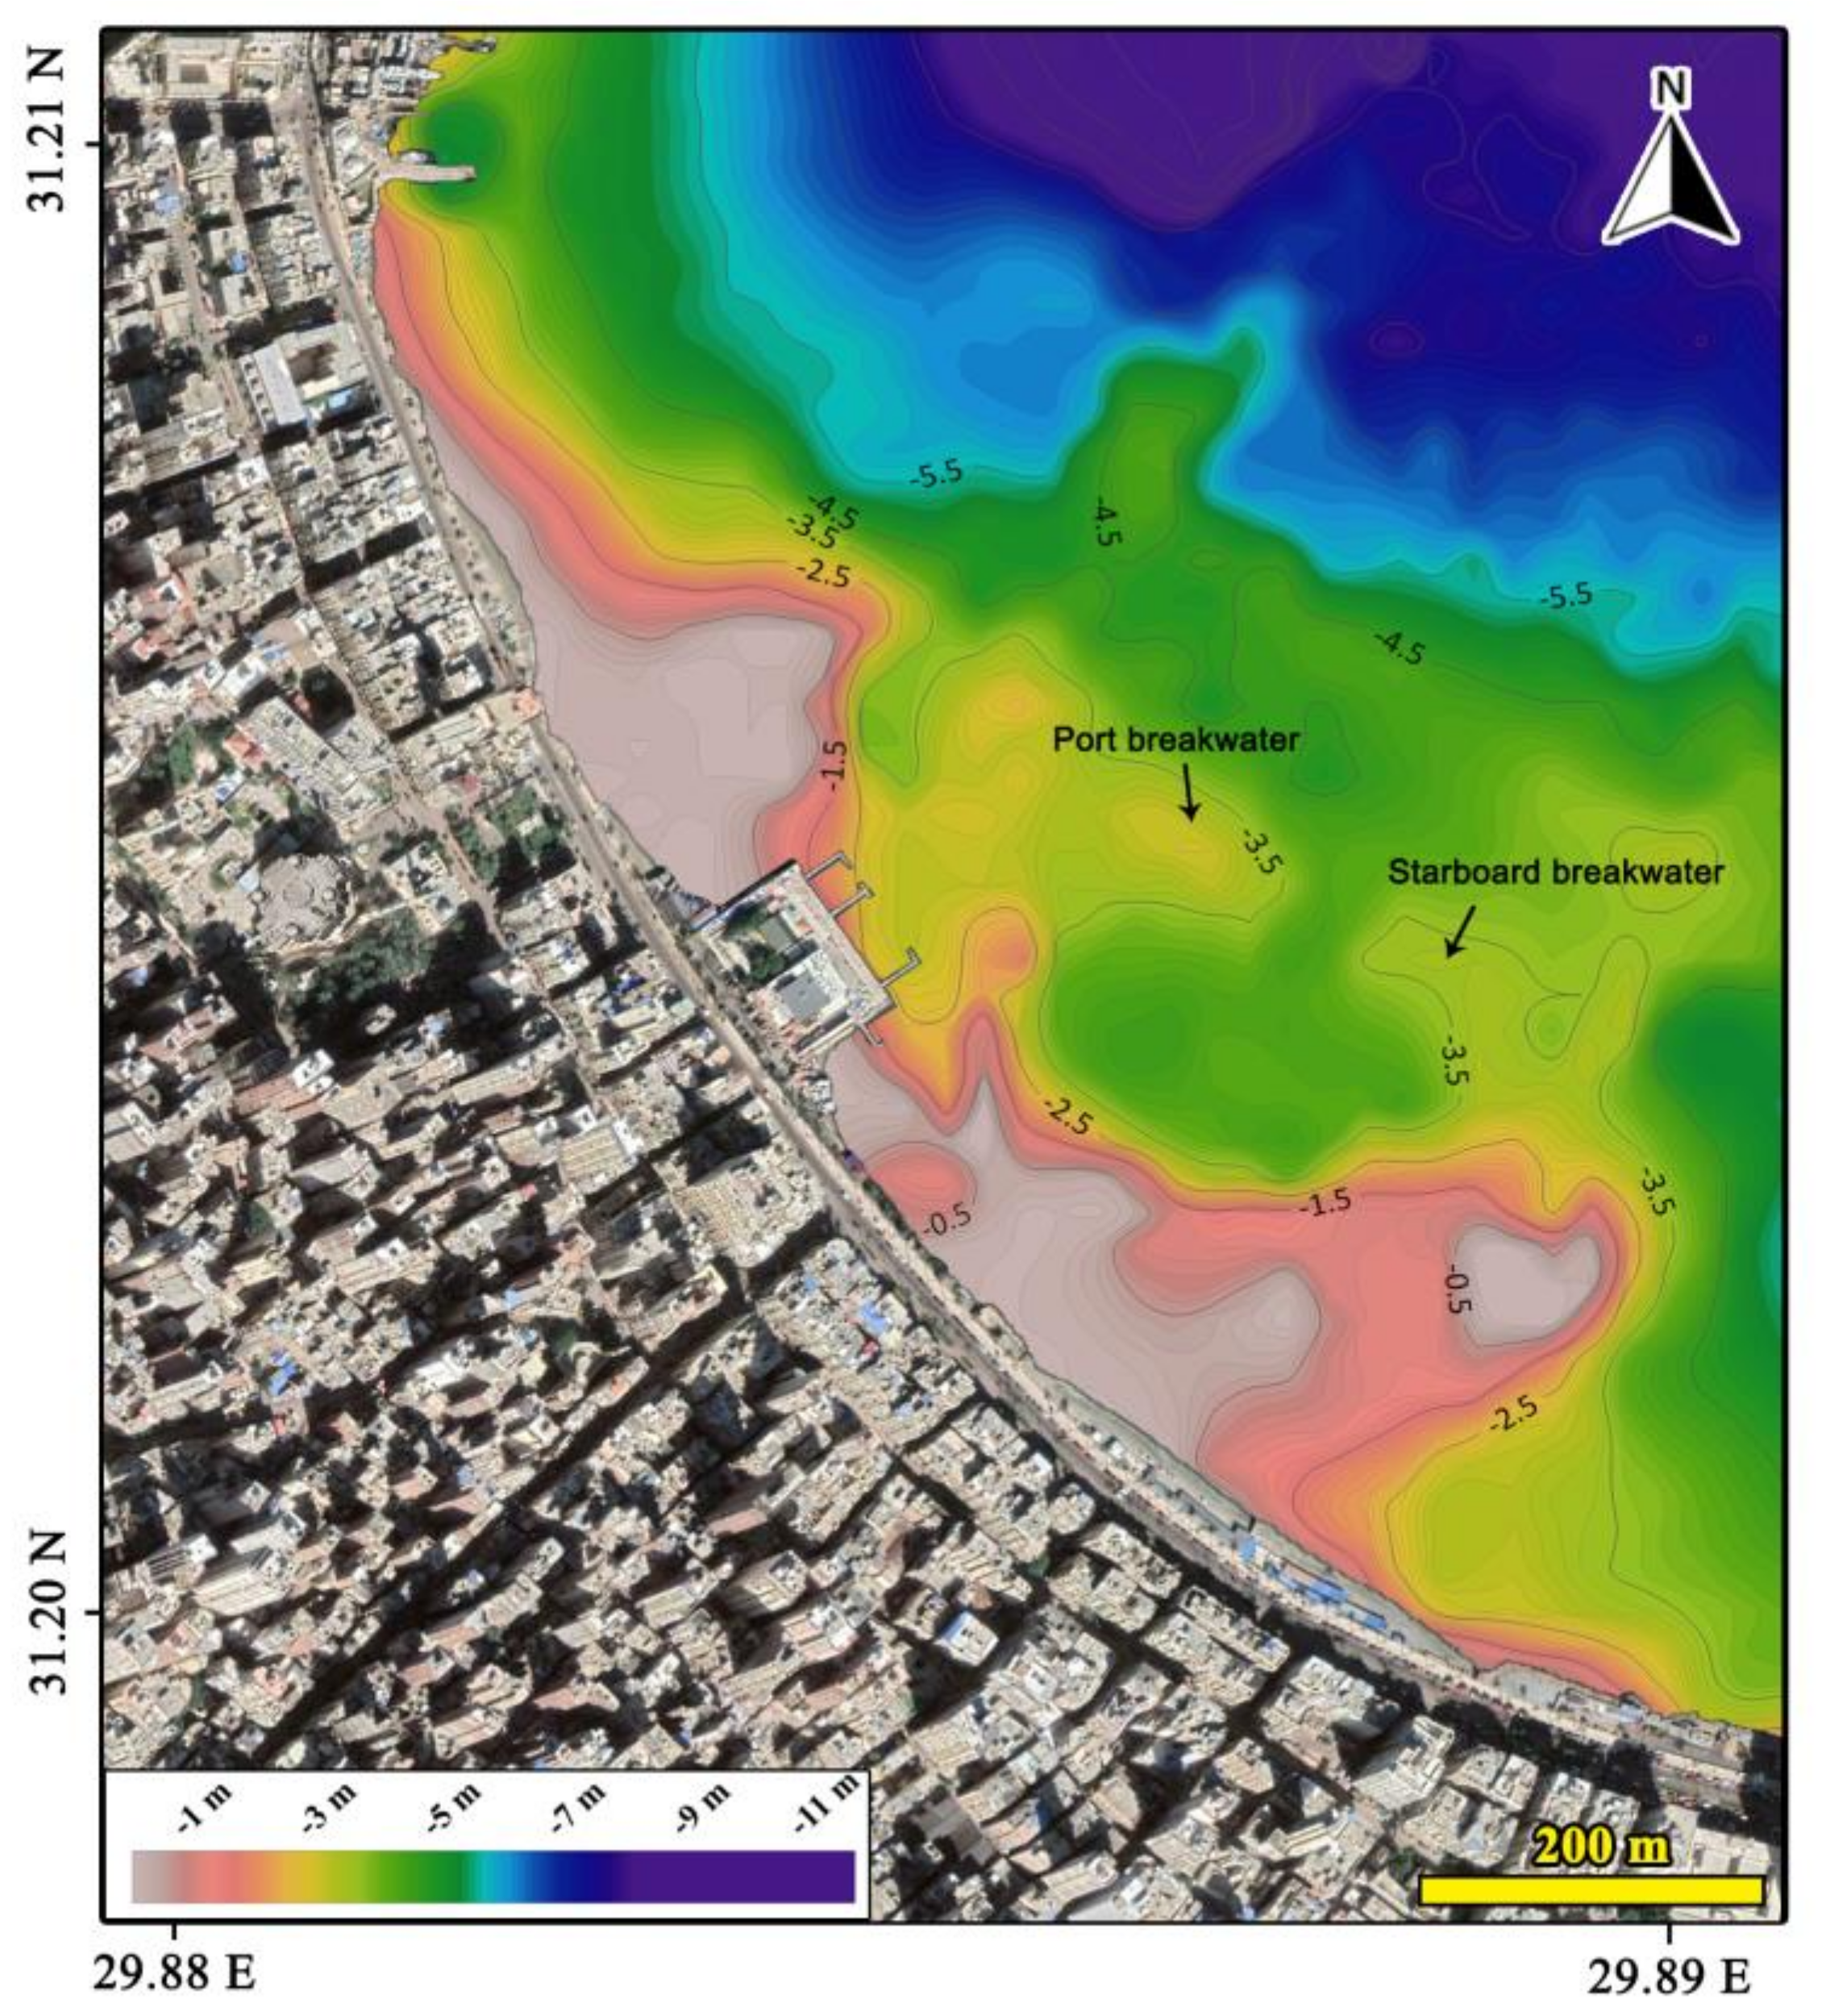
3.1. Bathymetry
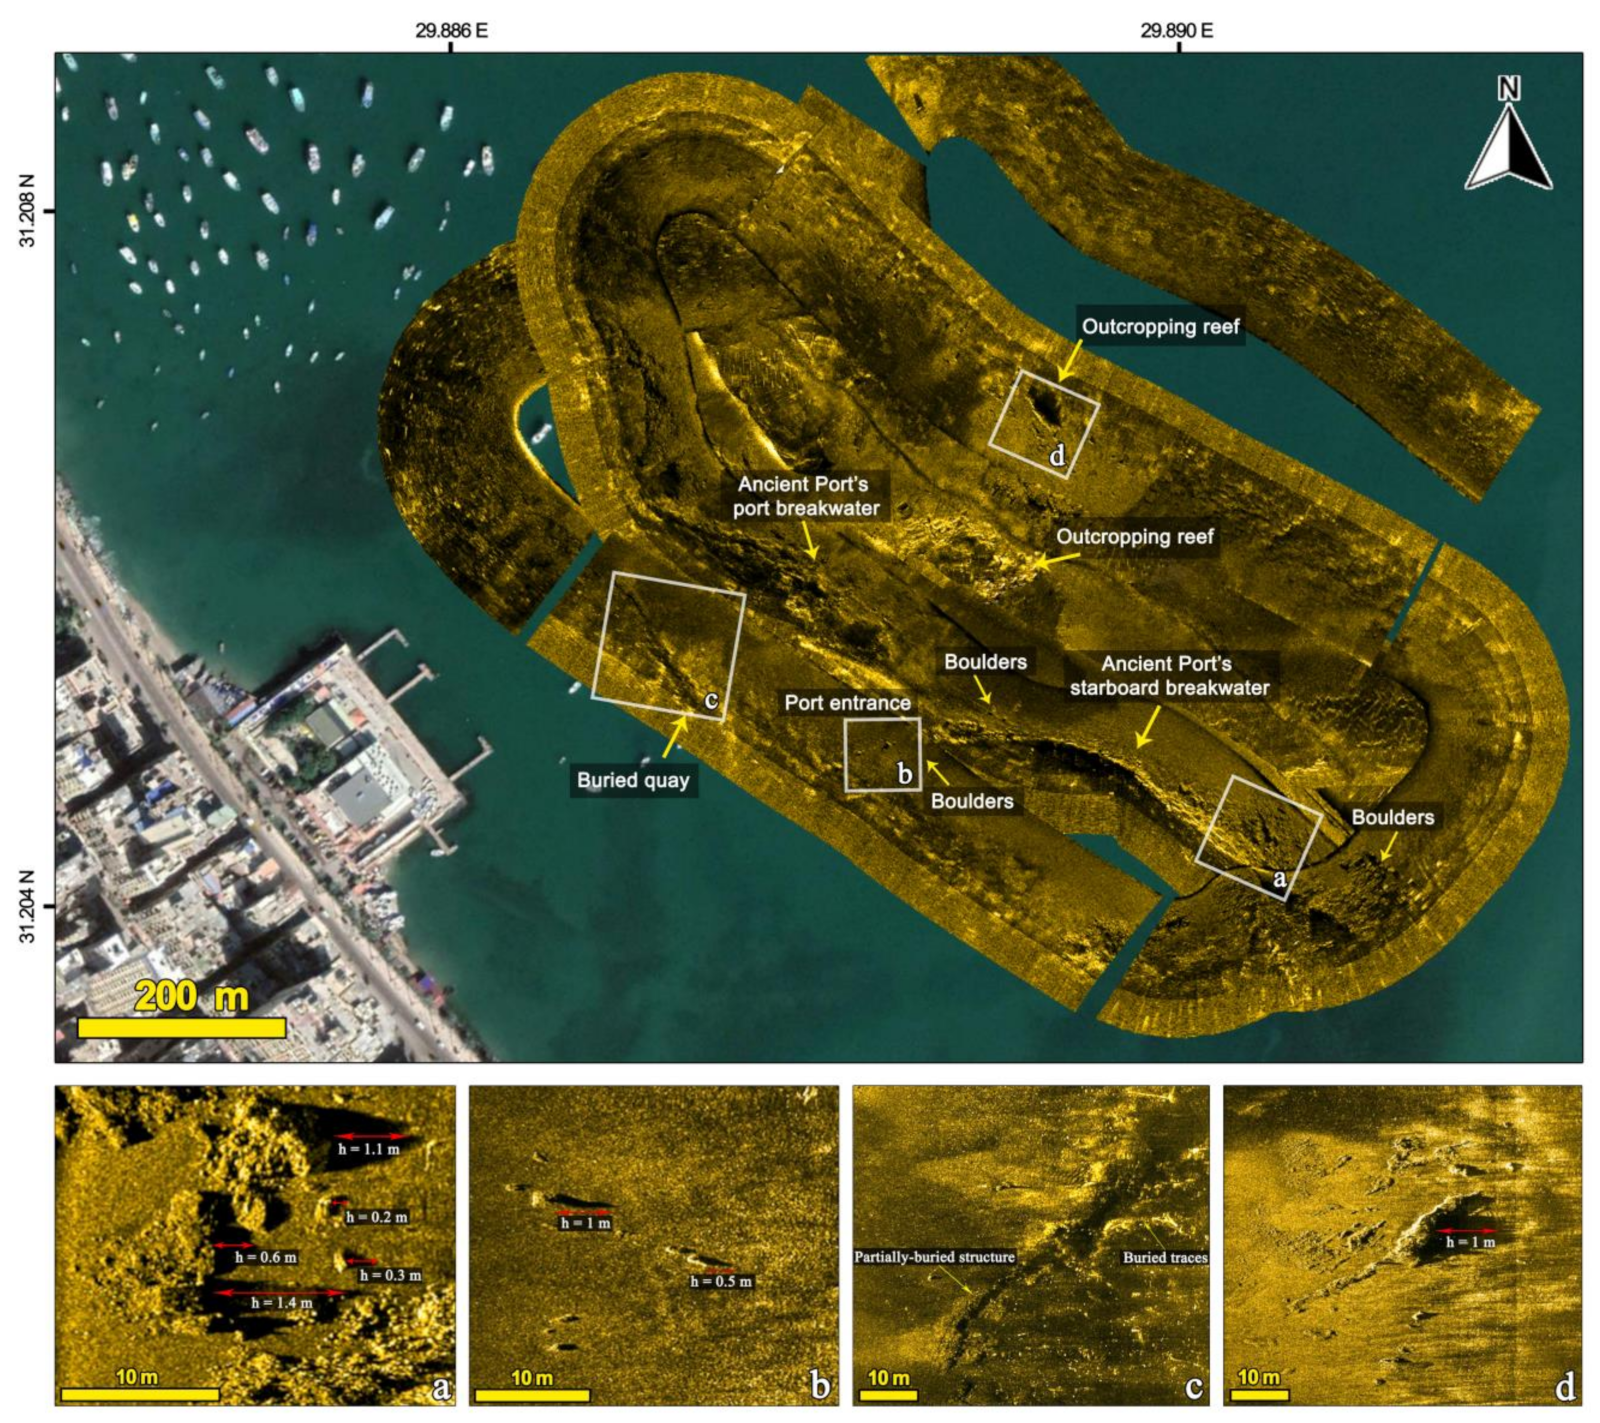
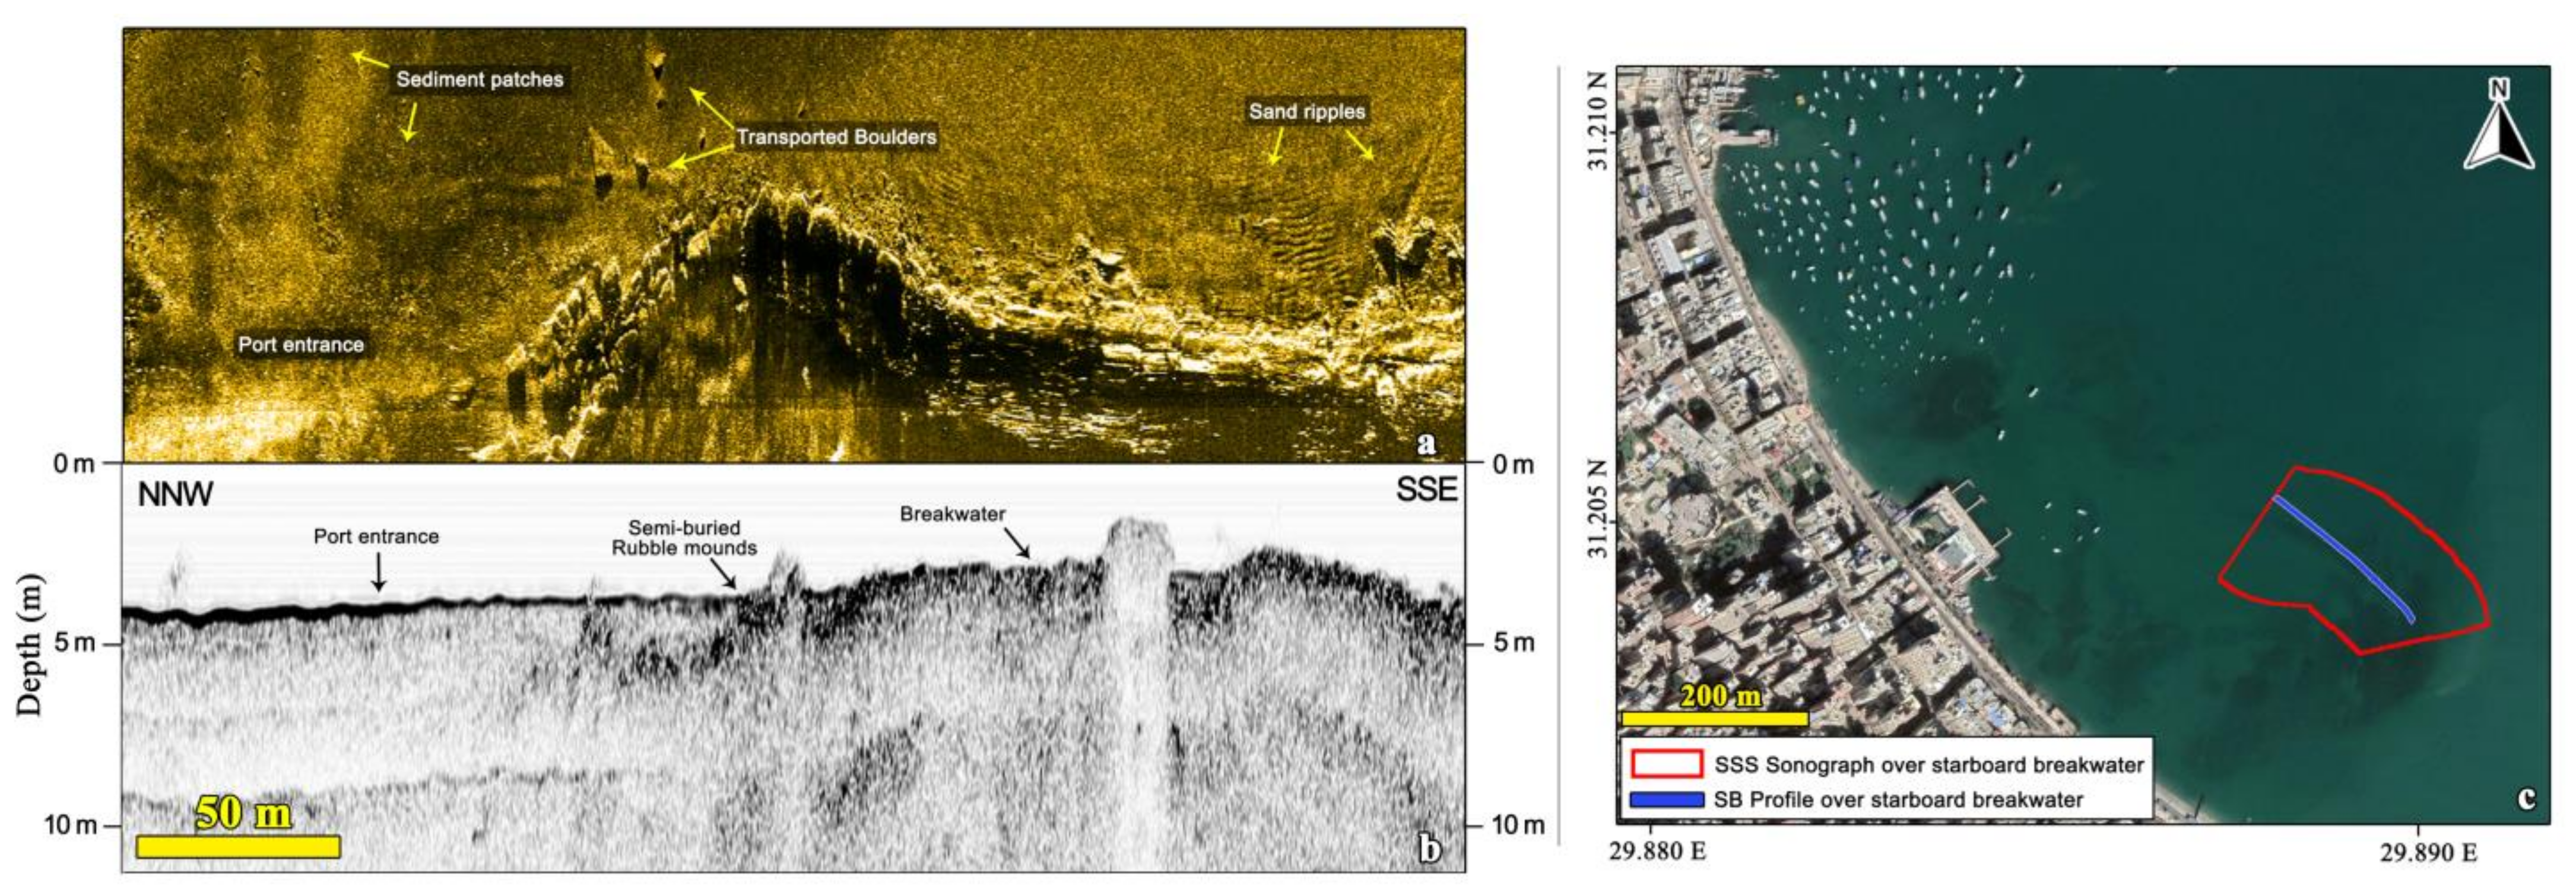
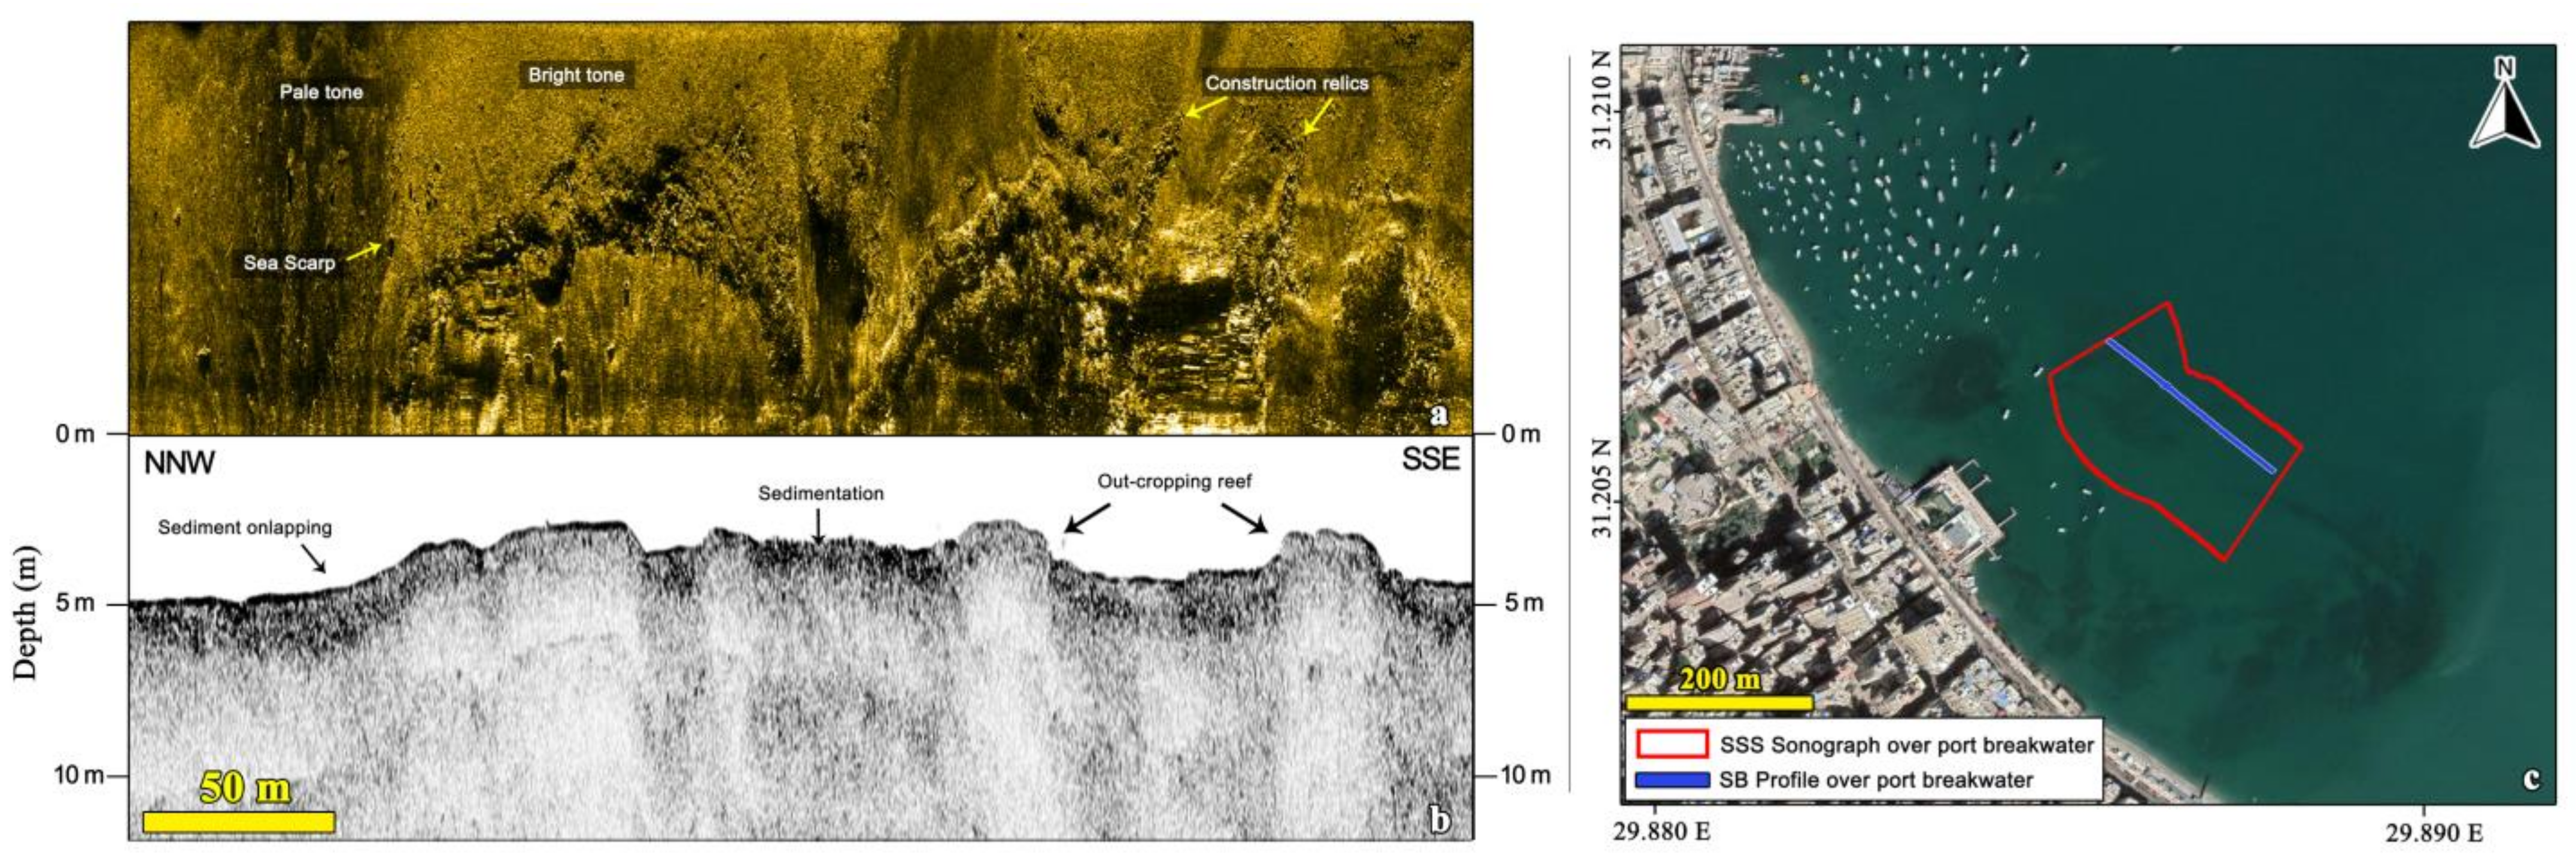
3.2. Sonar Imaging
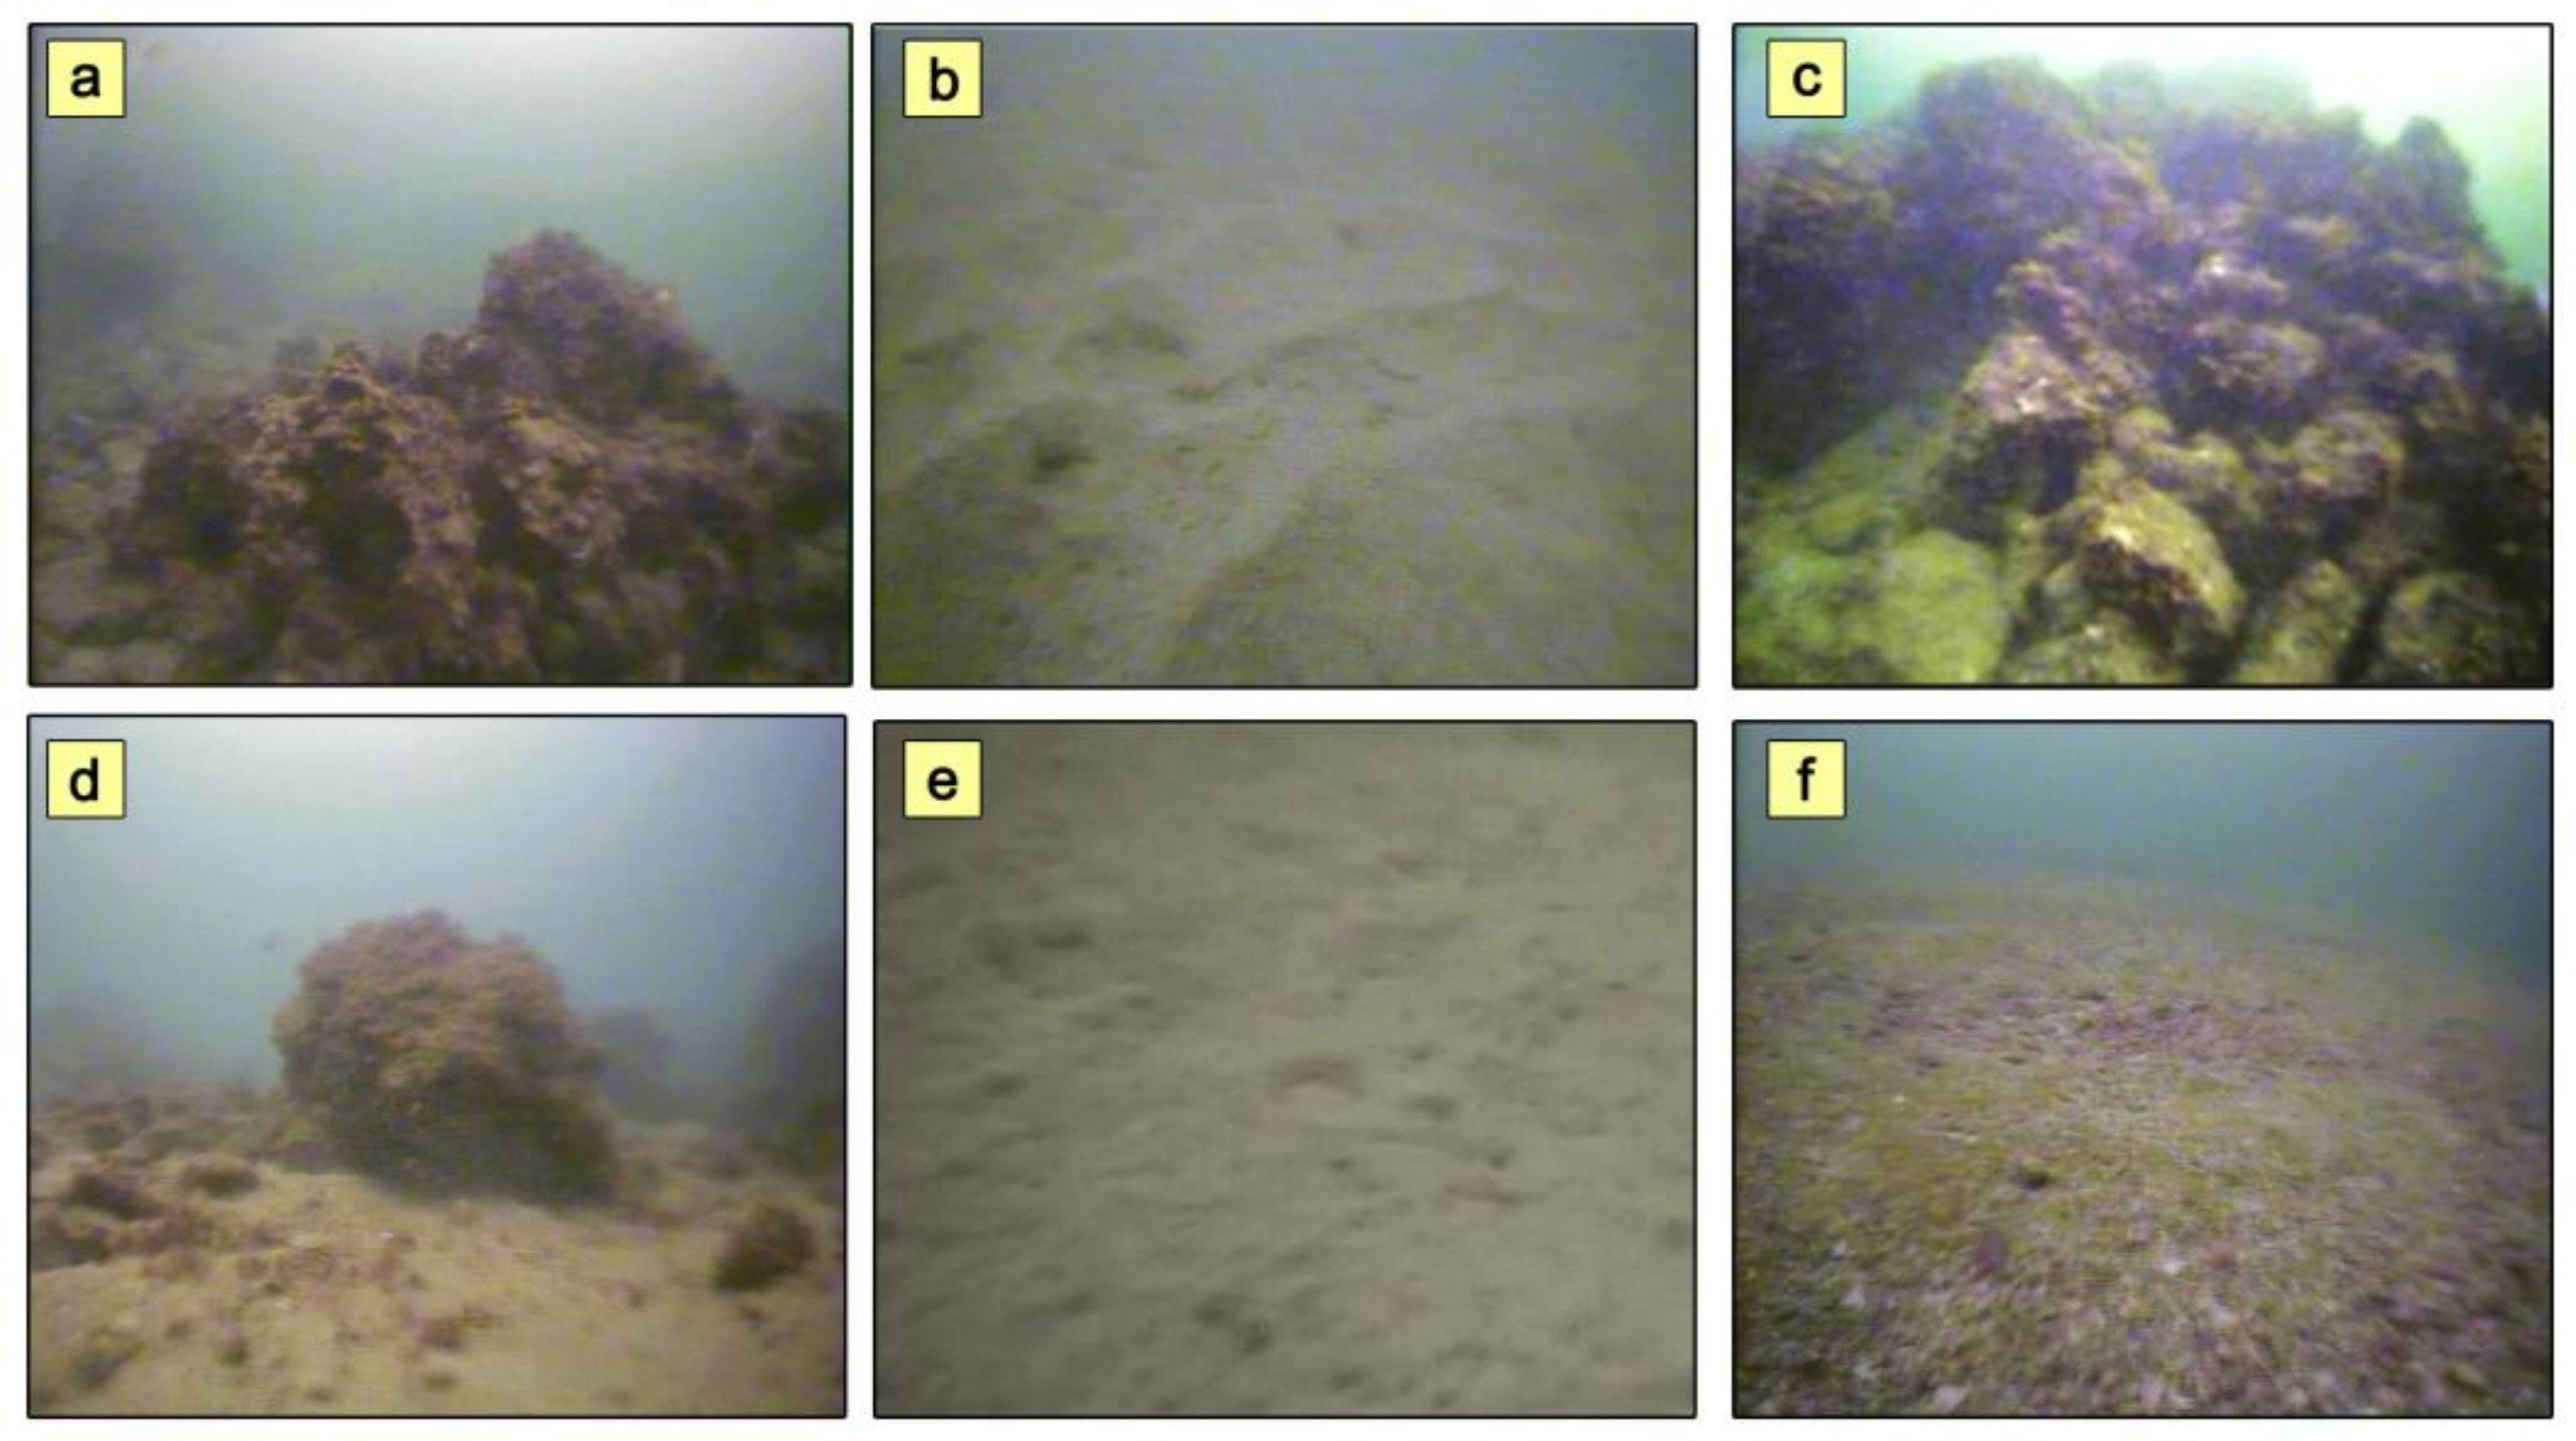
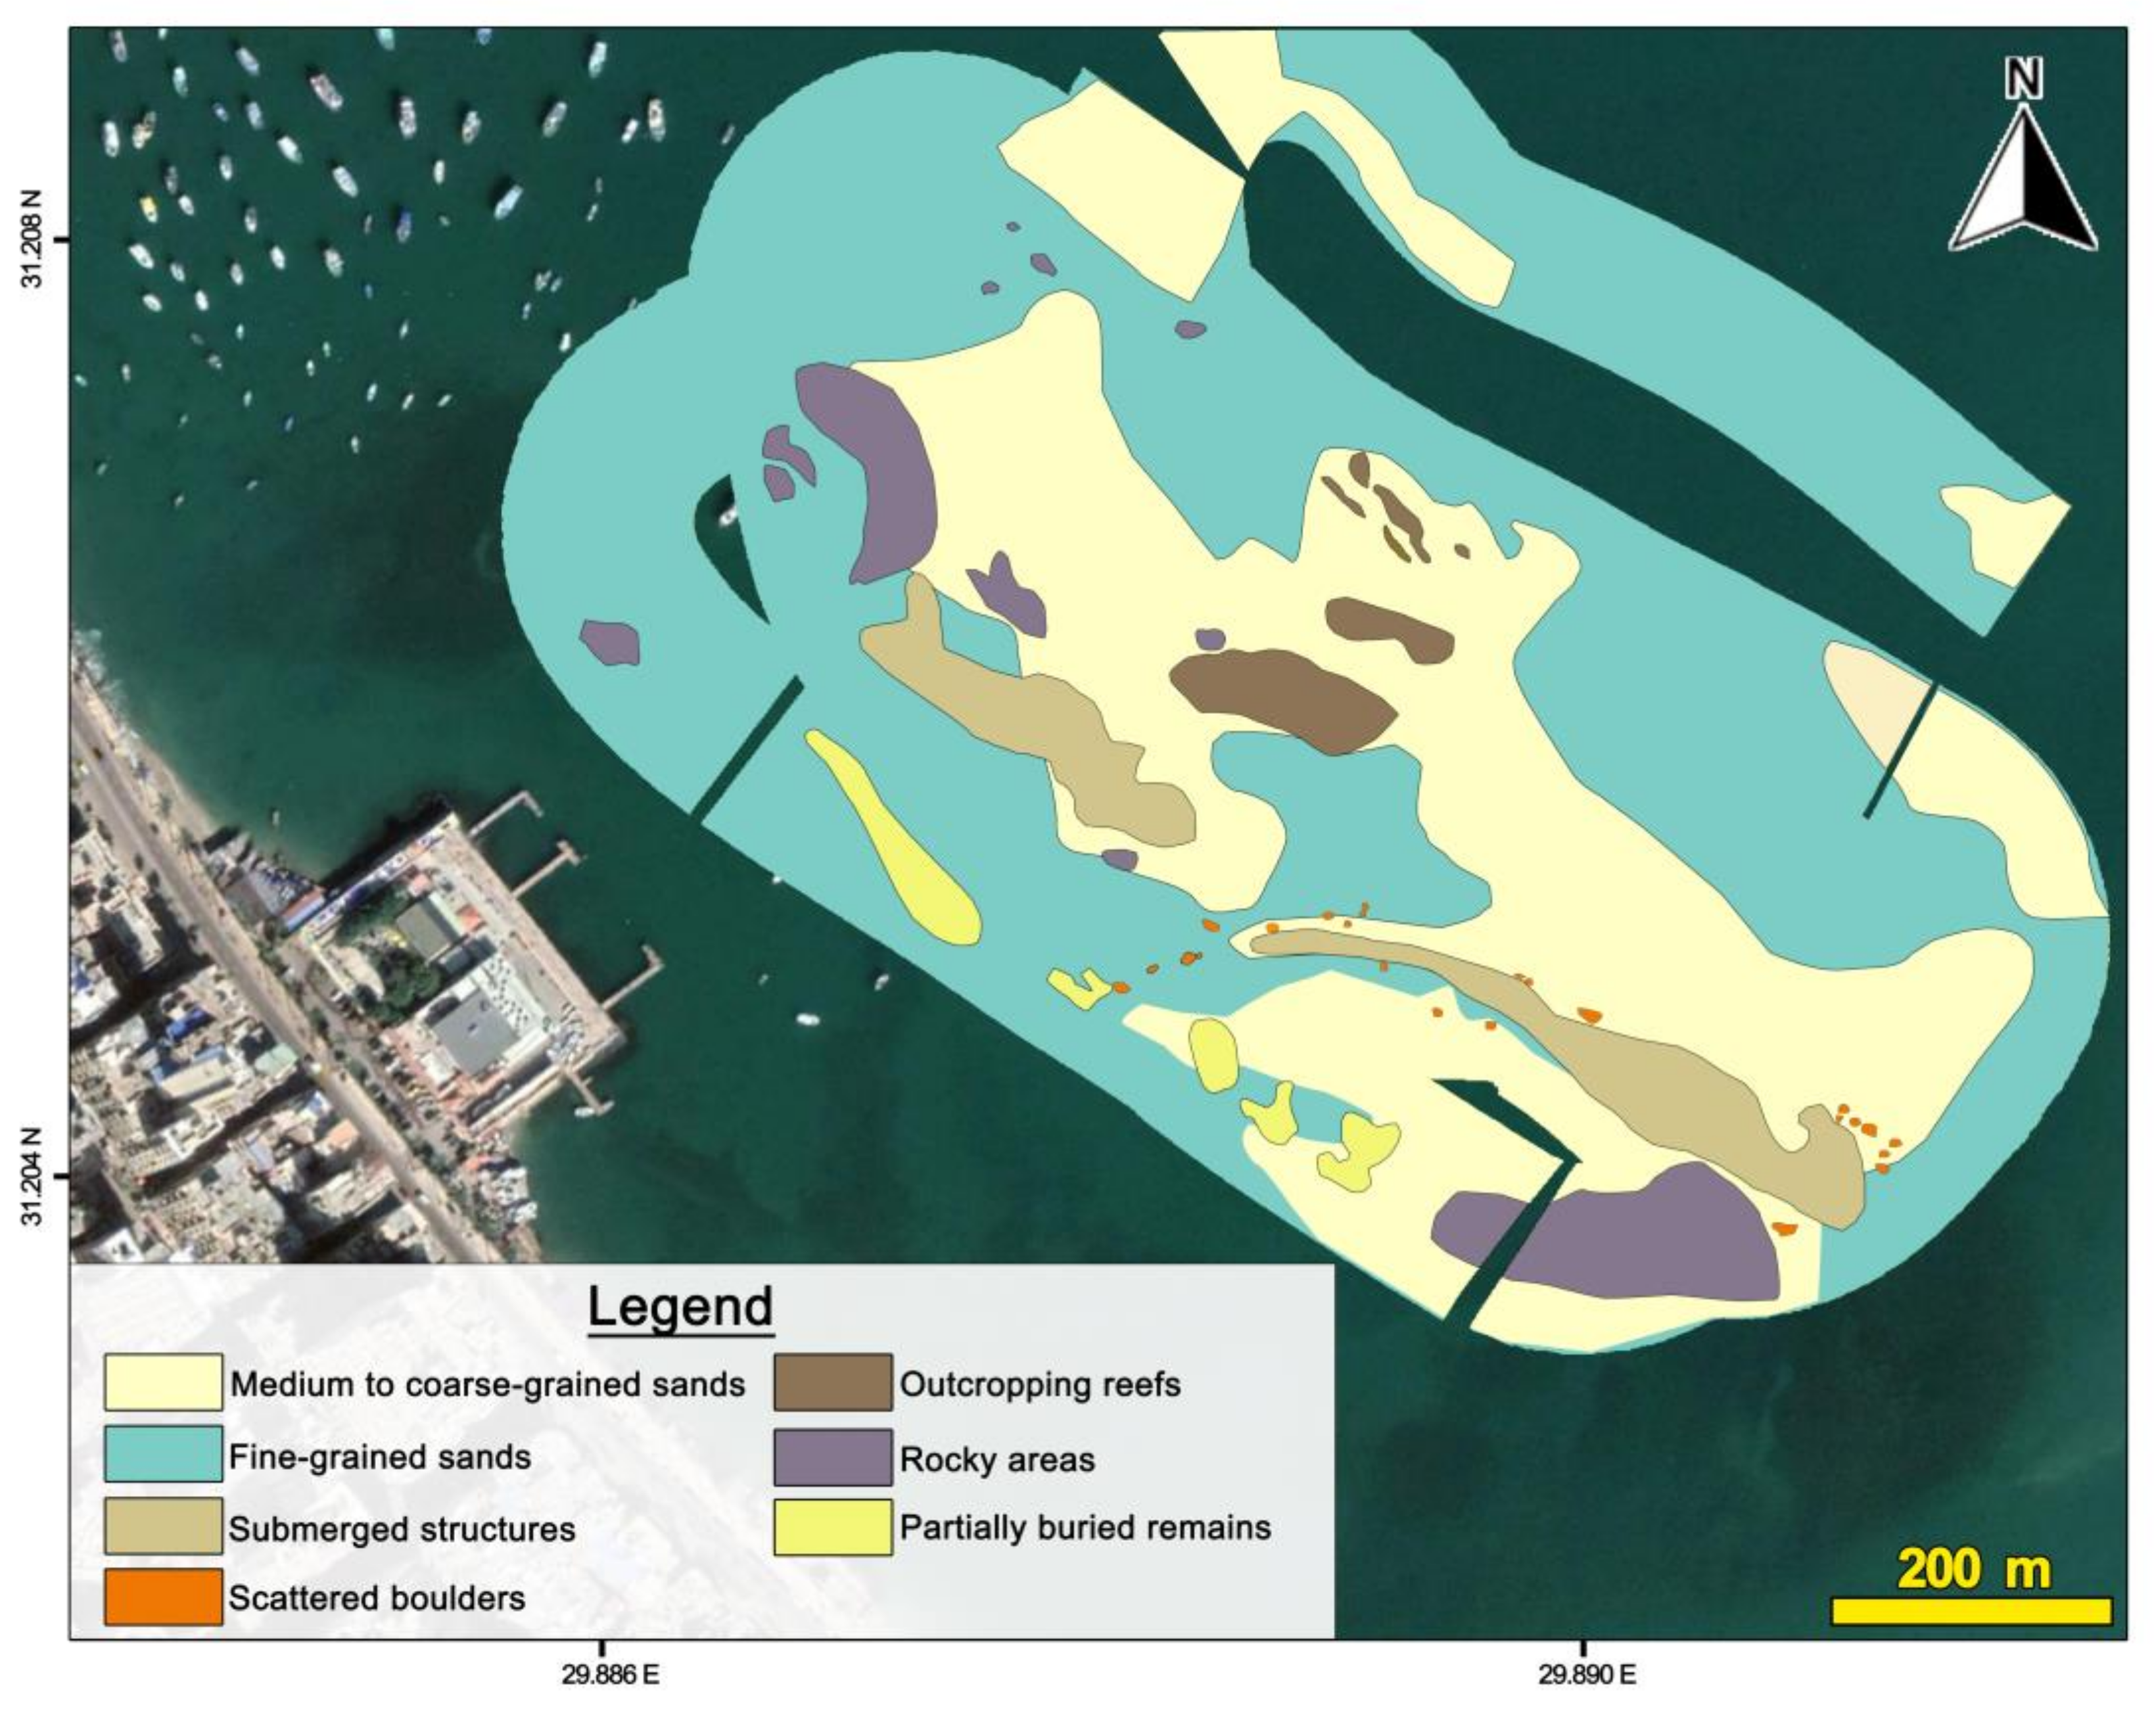
3.3. Ground-Truthing
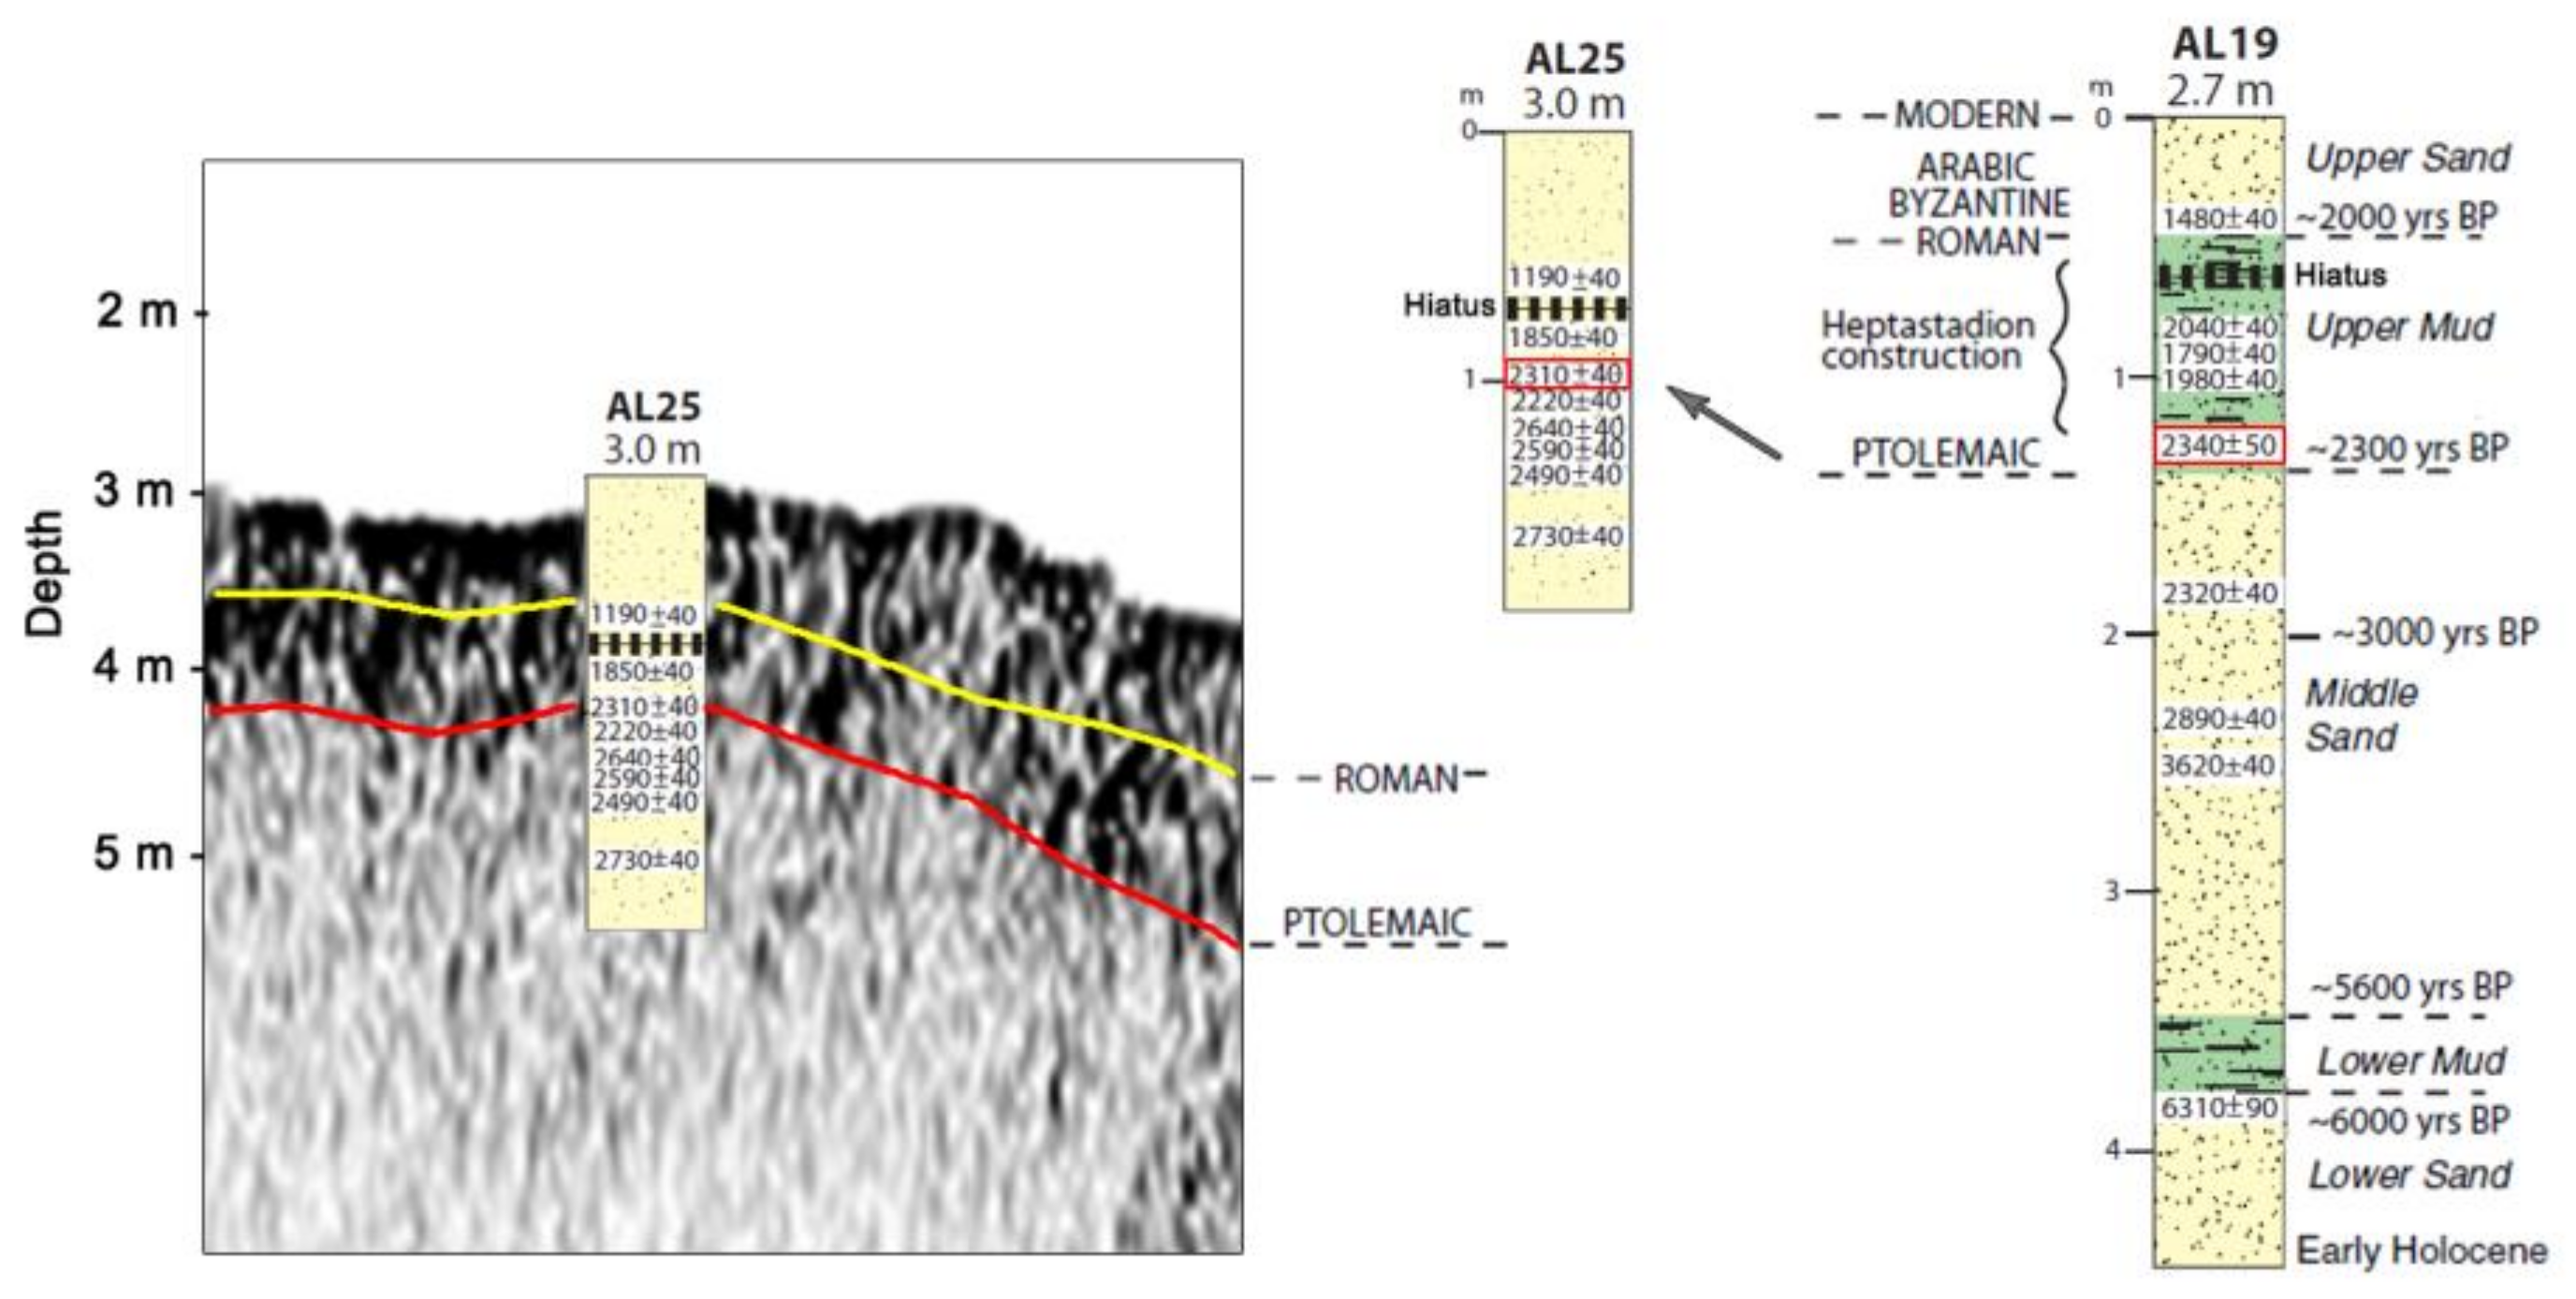
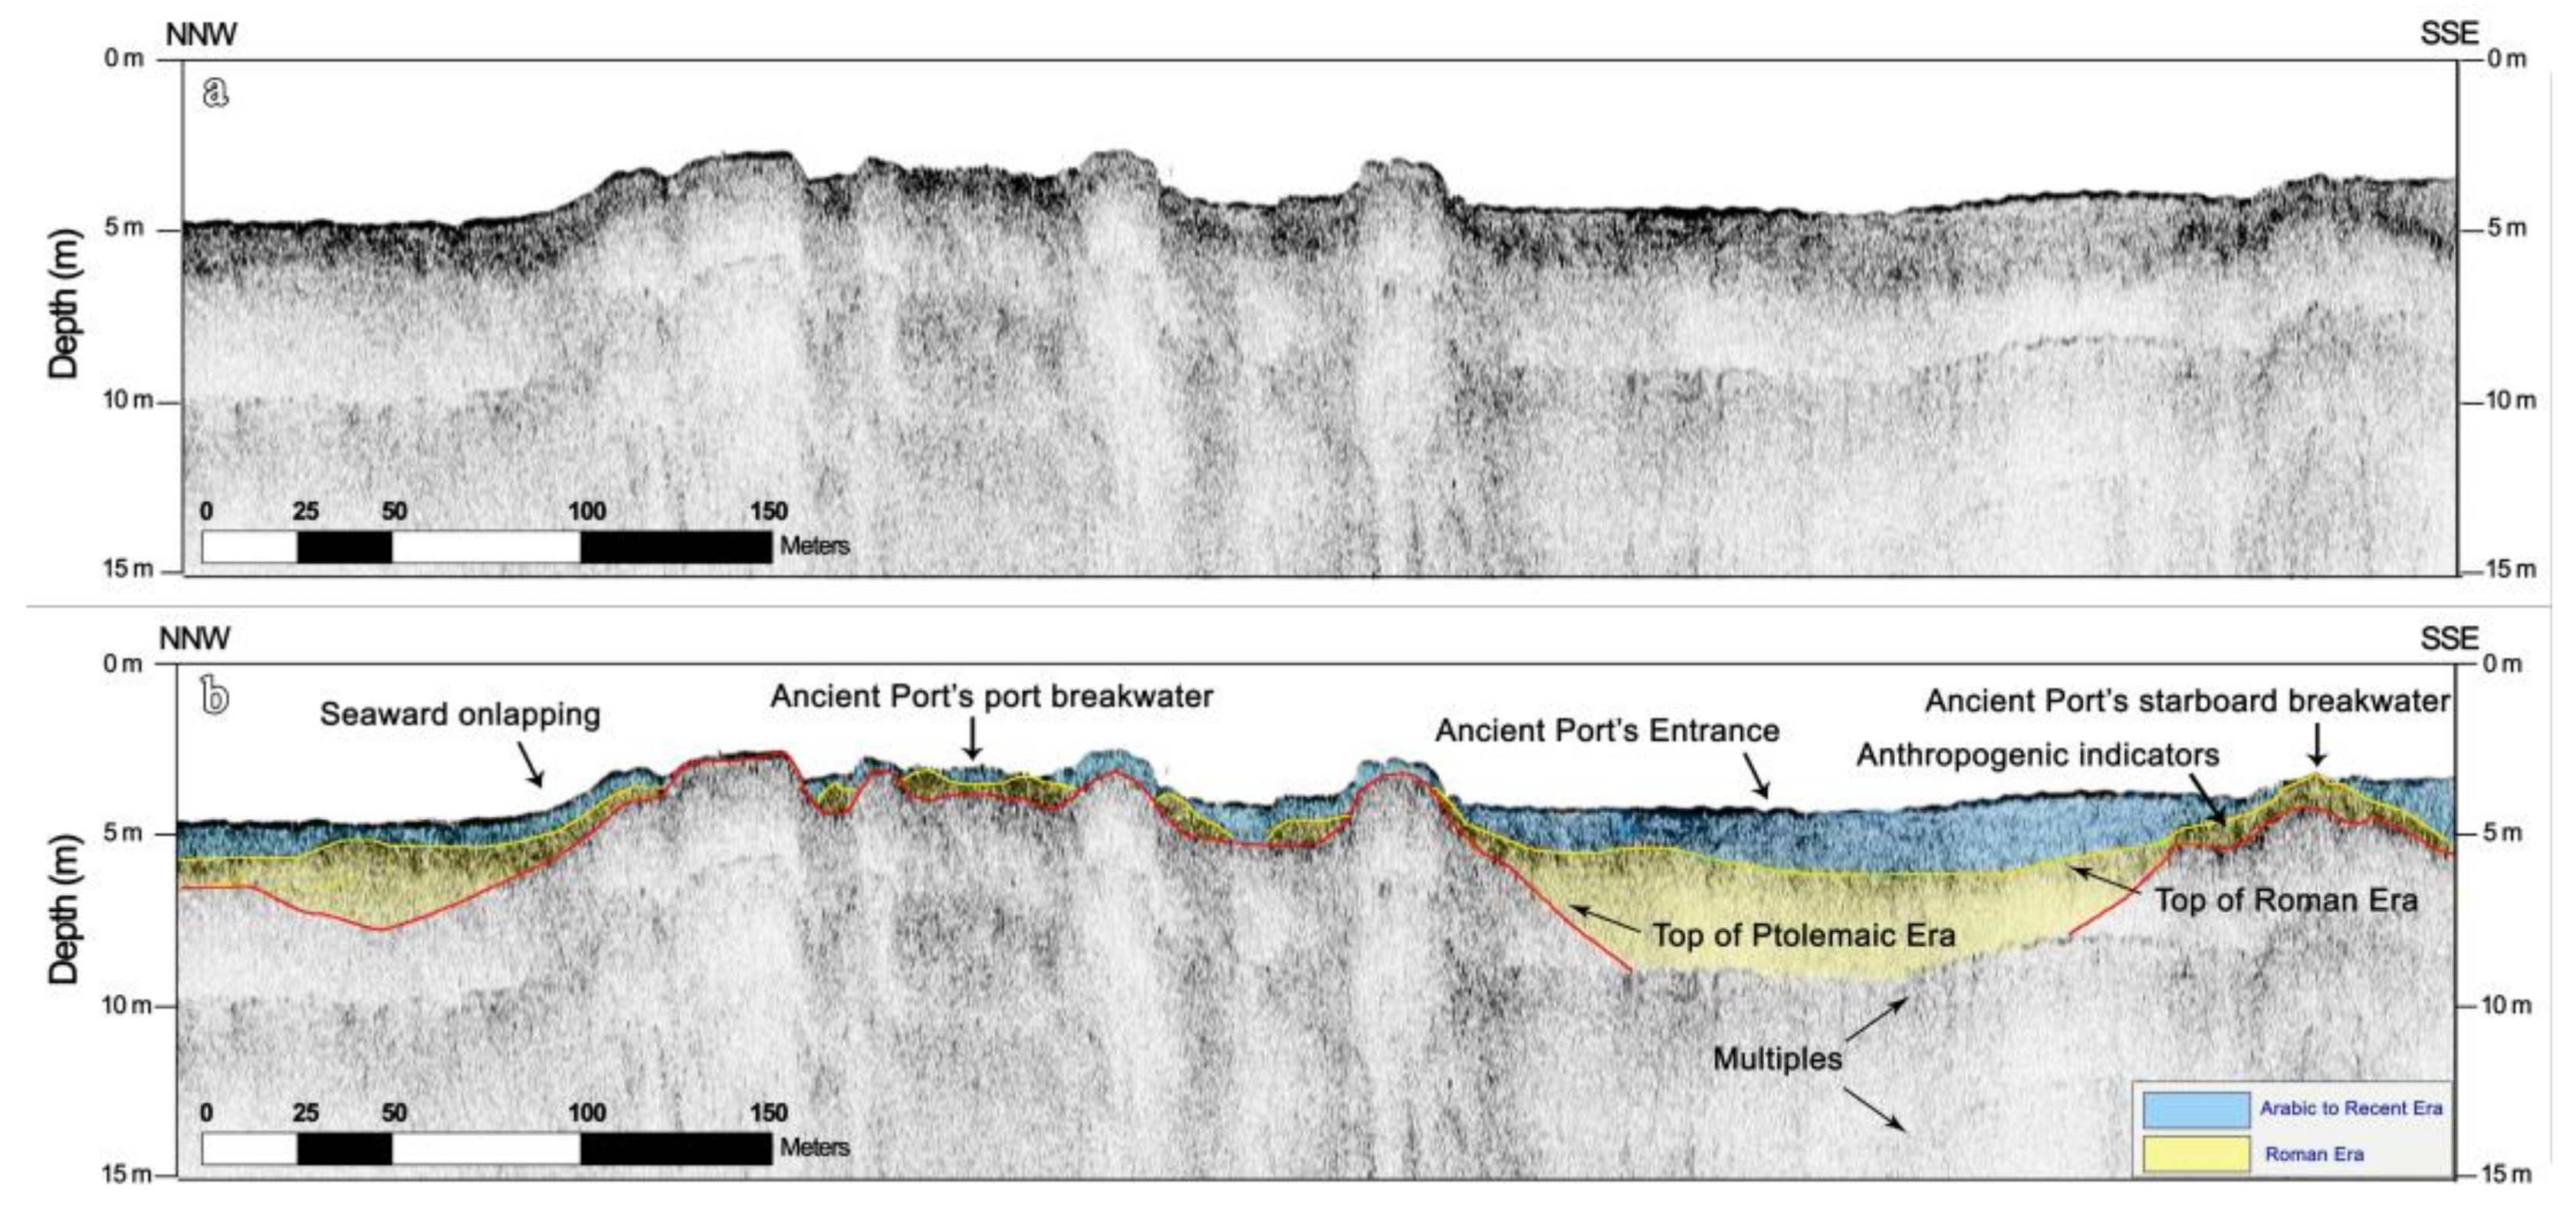
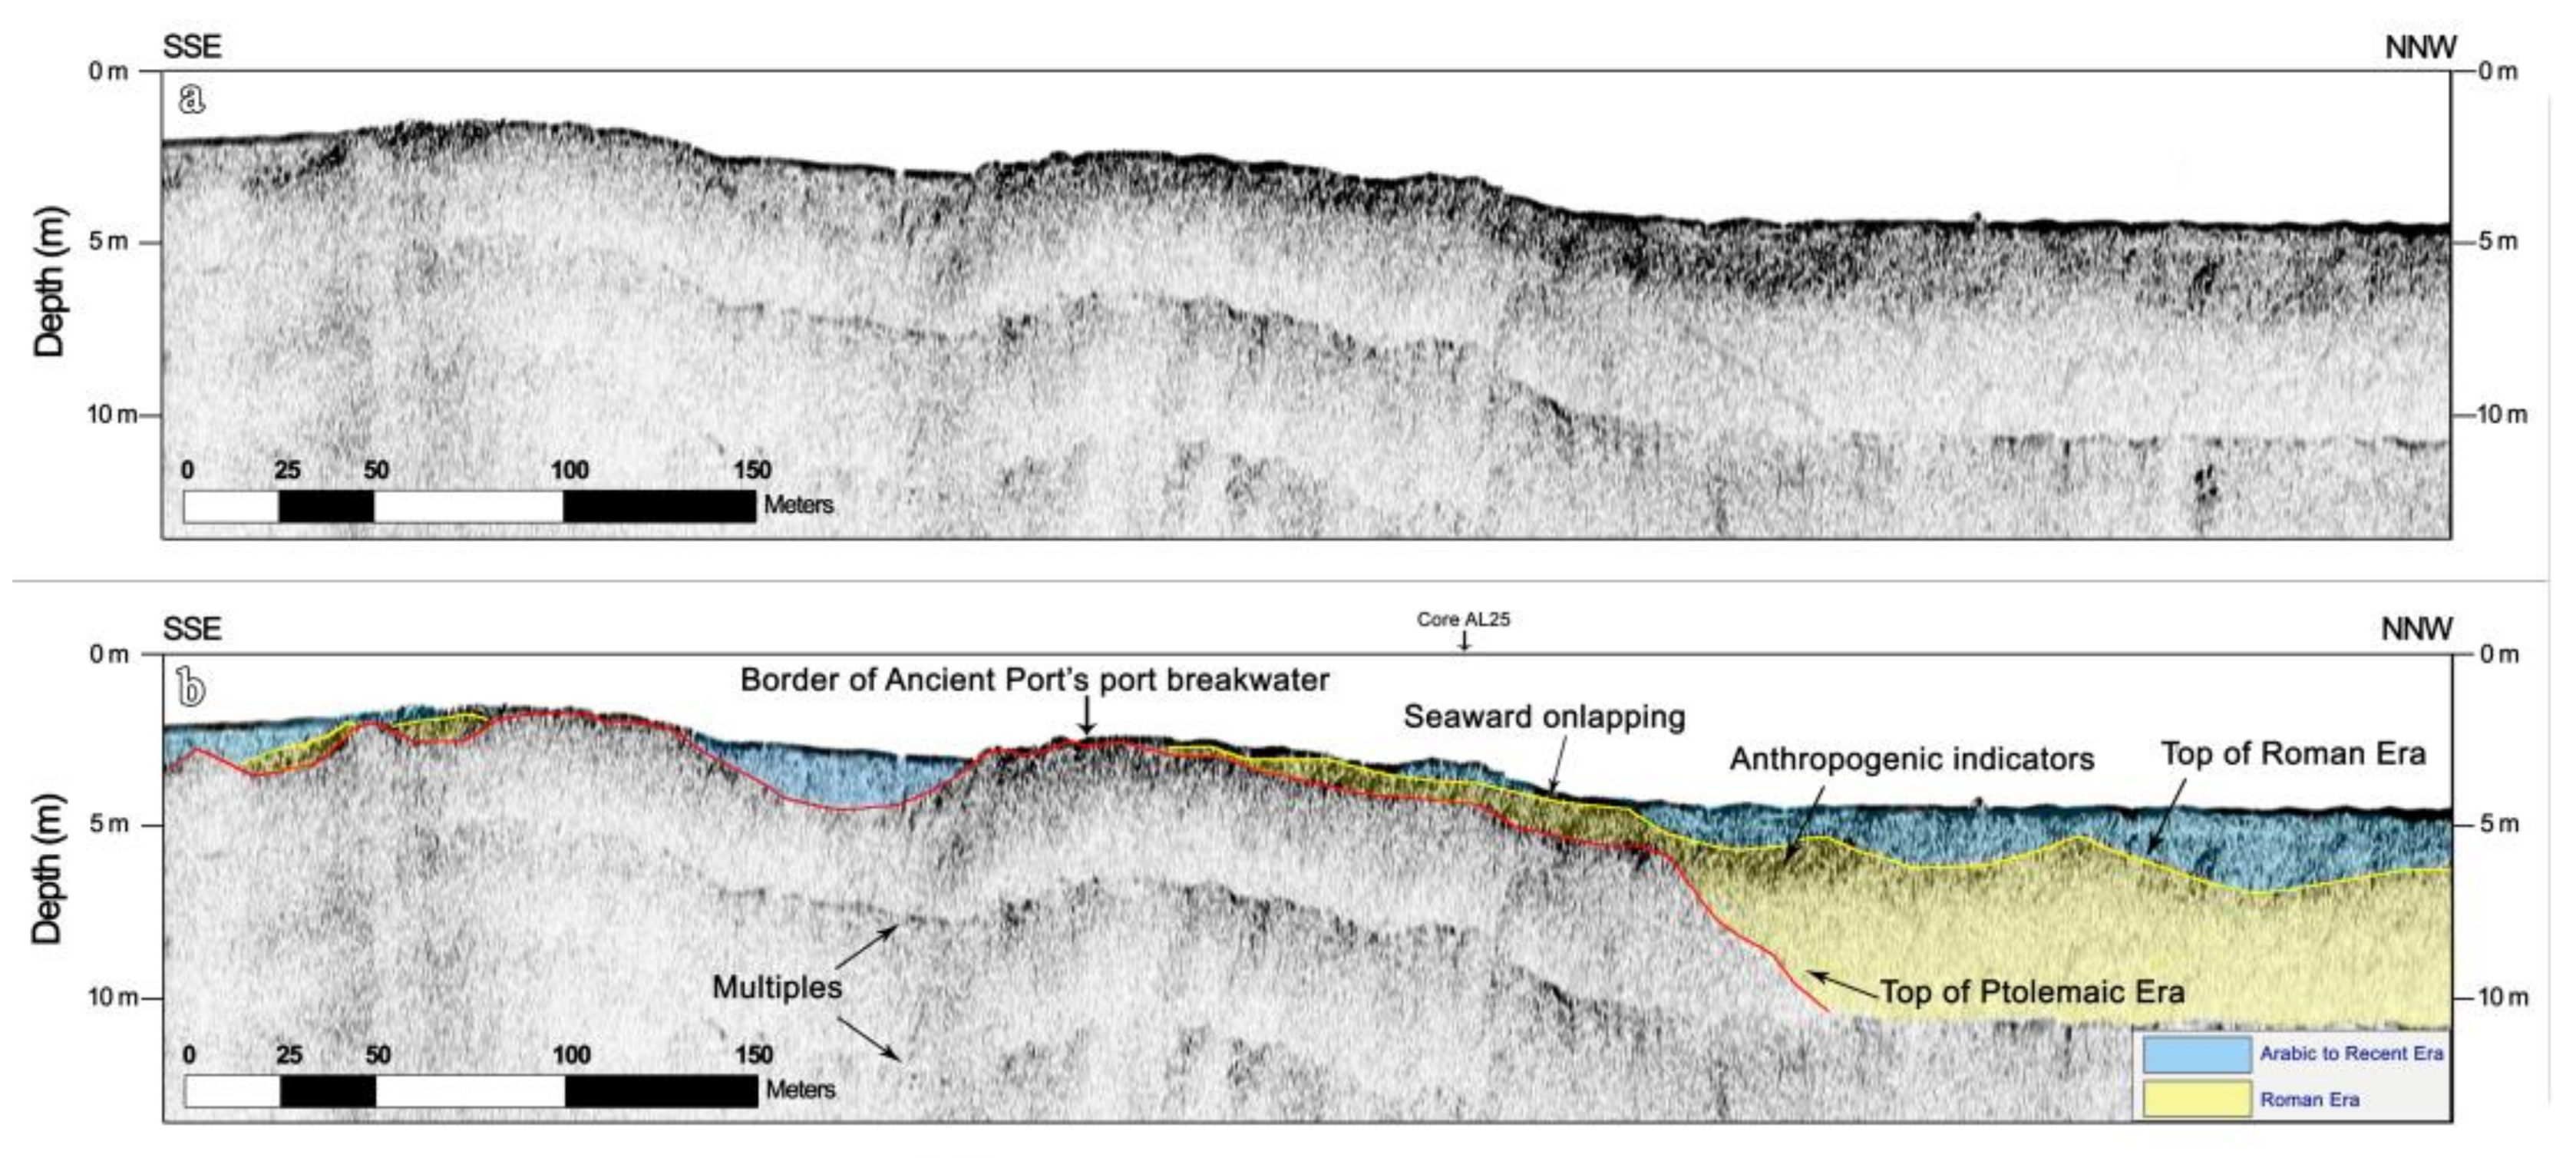
3.4. Sub-Bottom Profiling
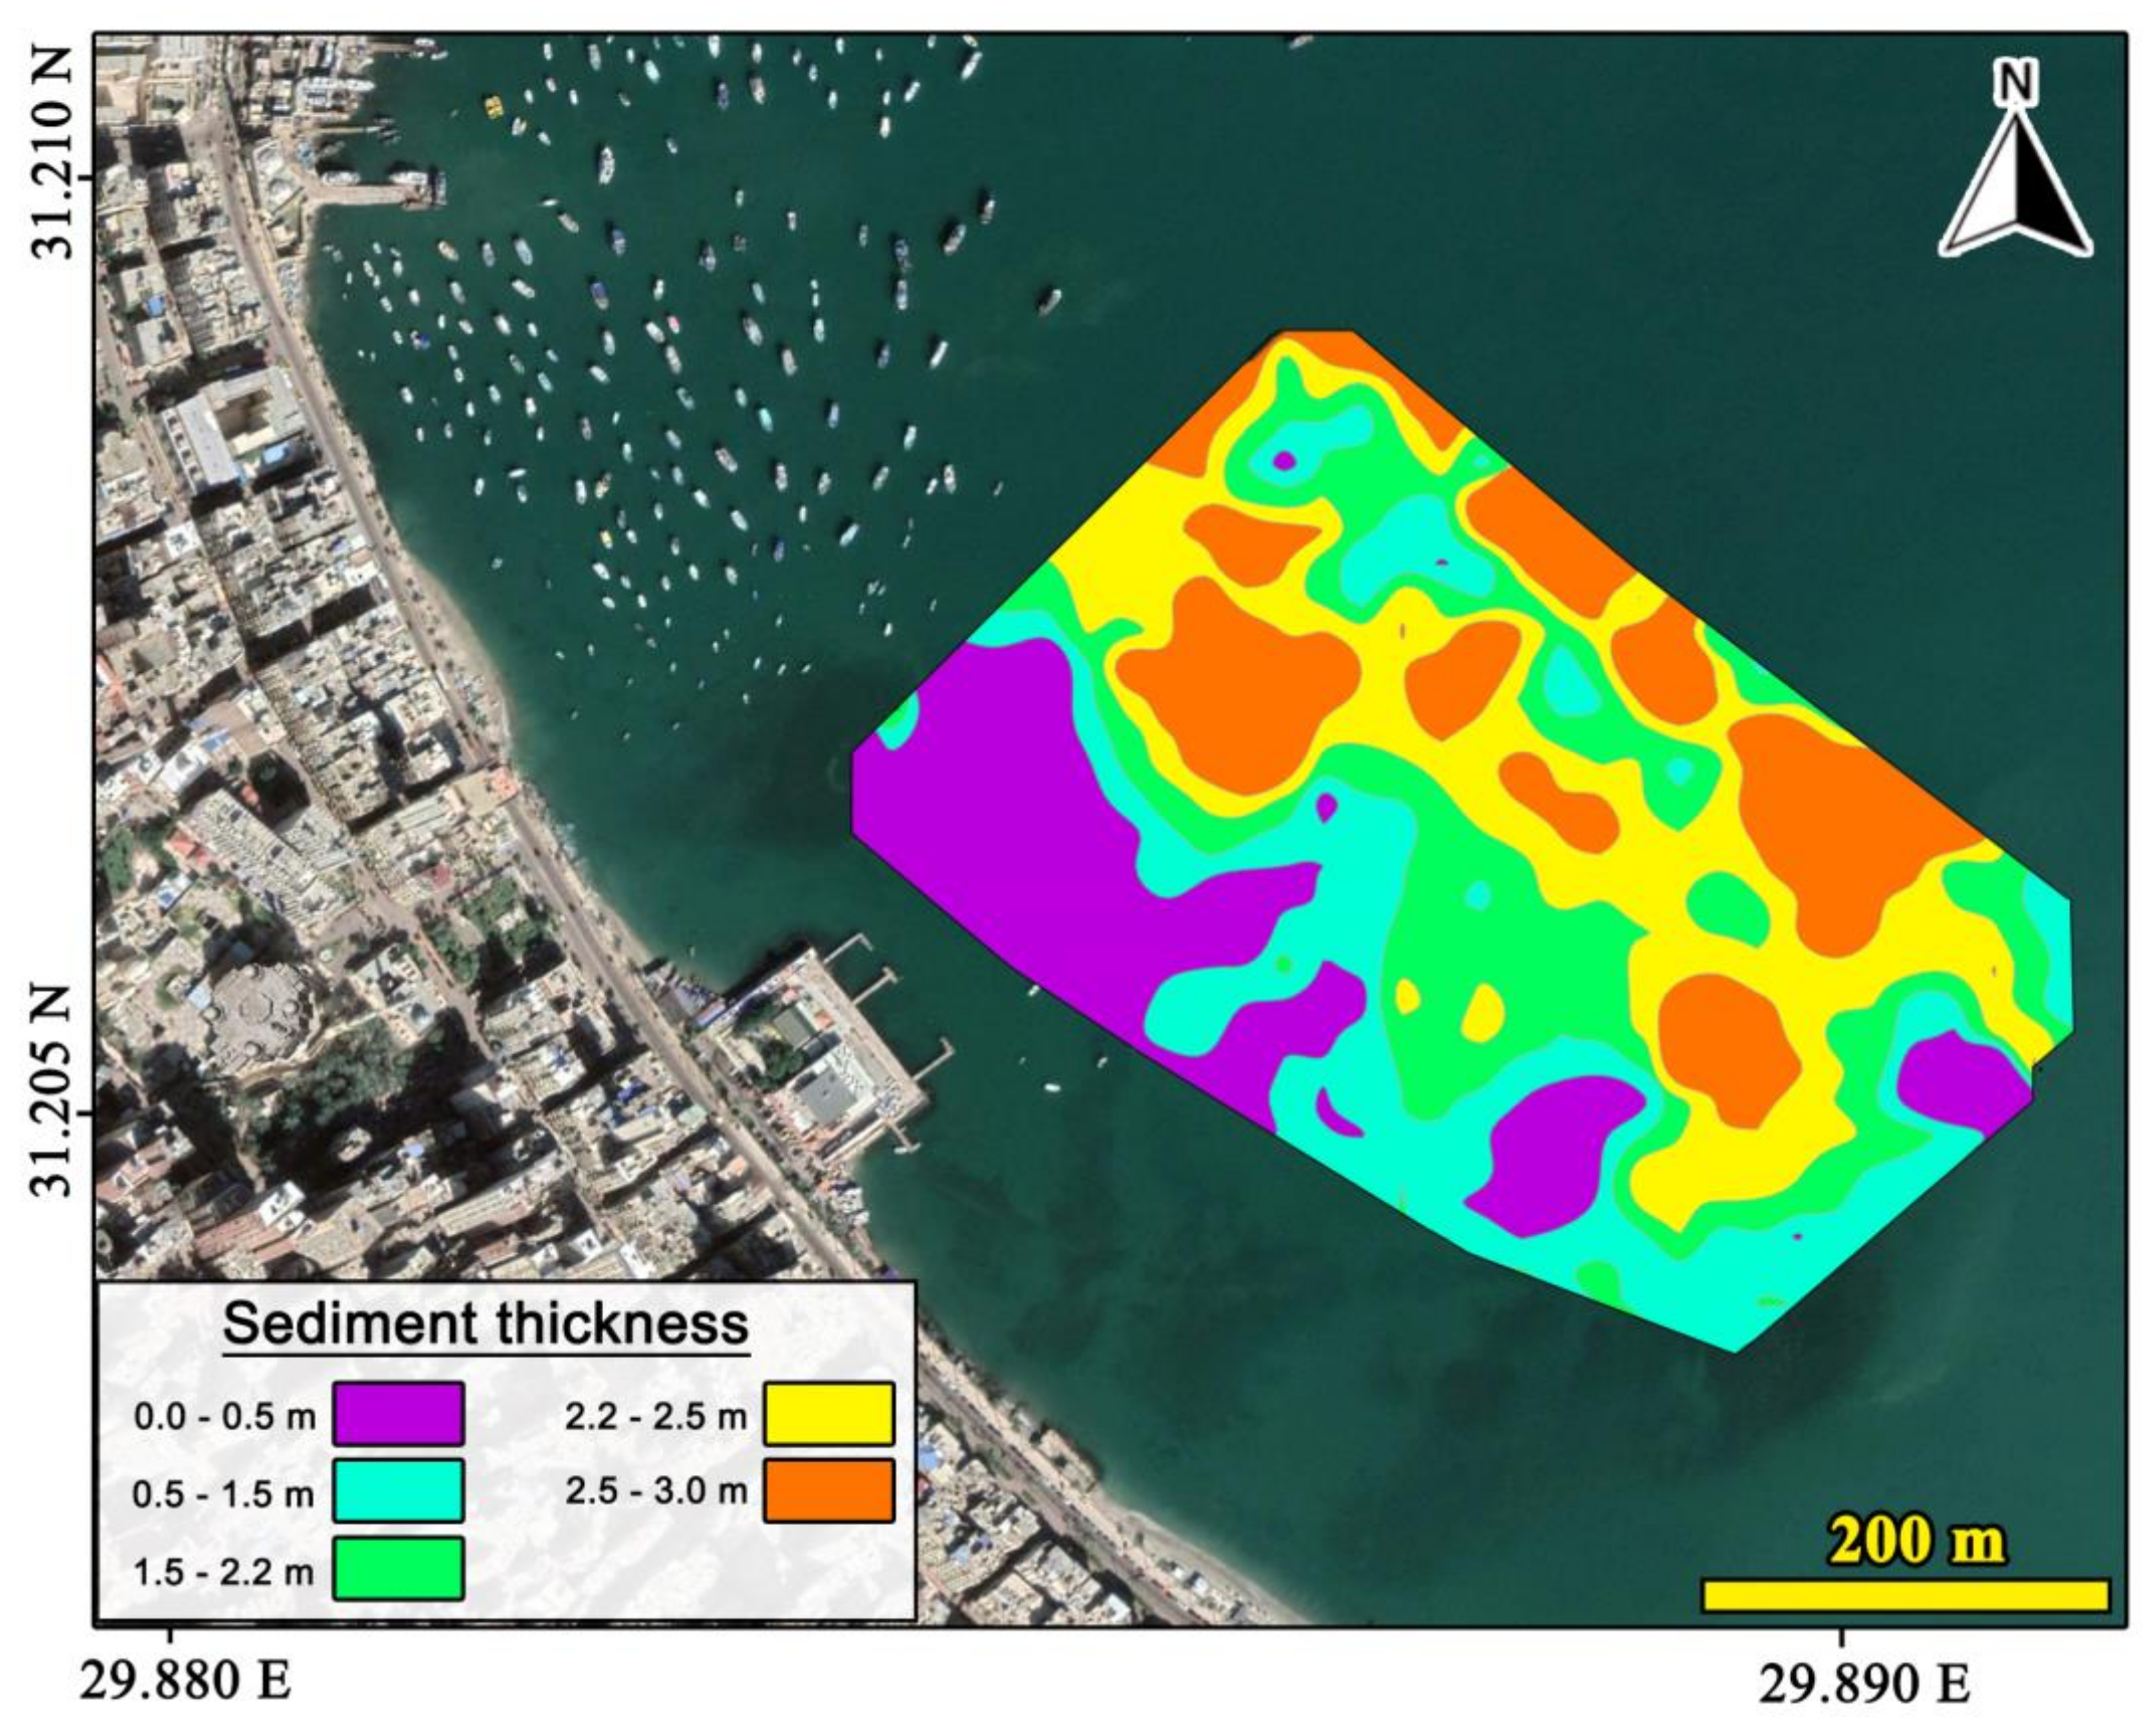
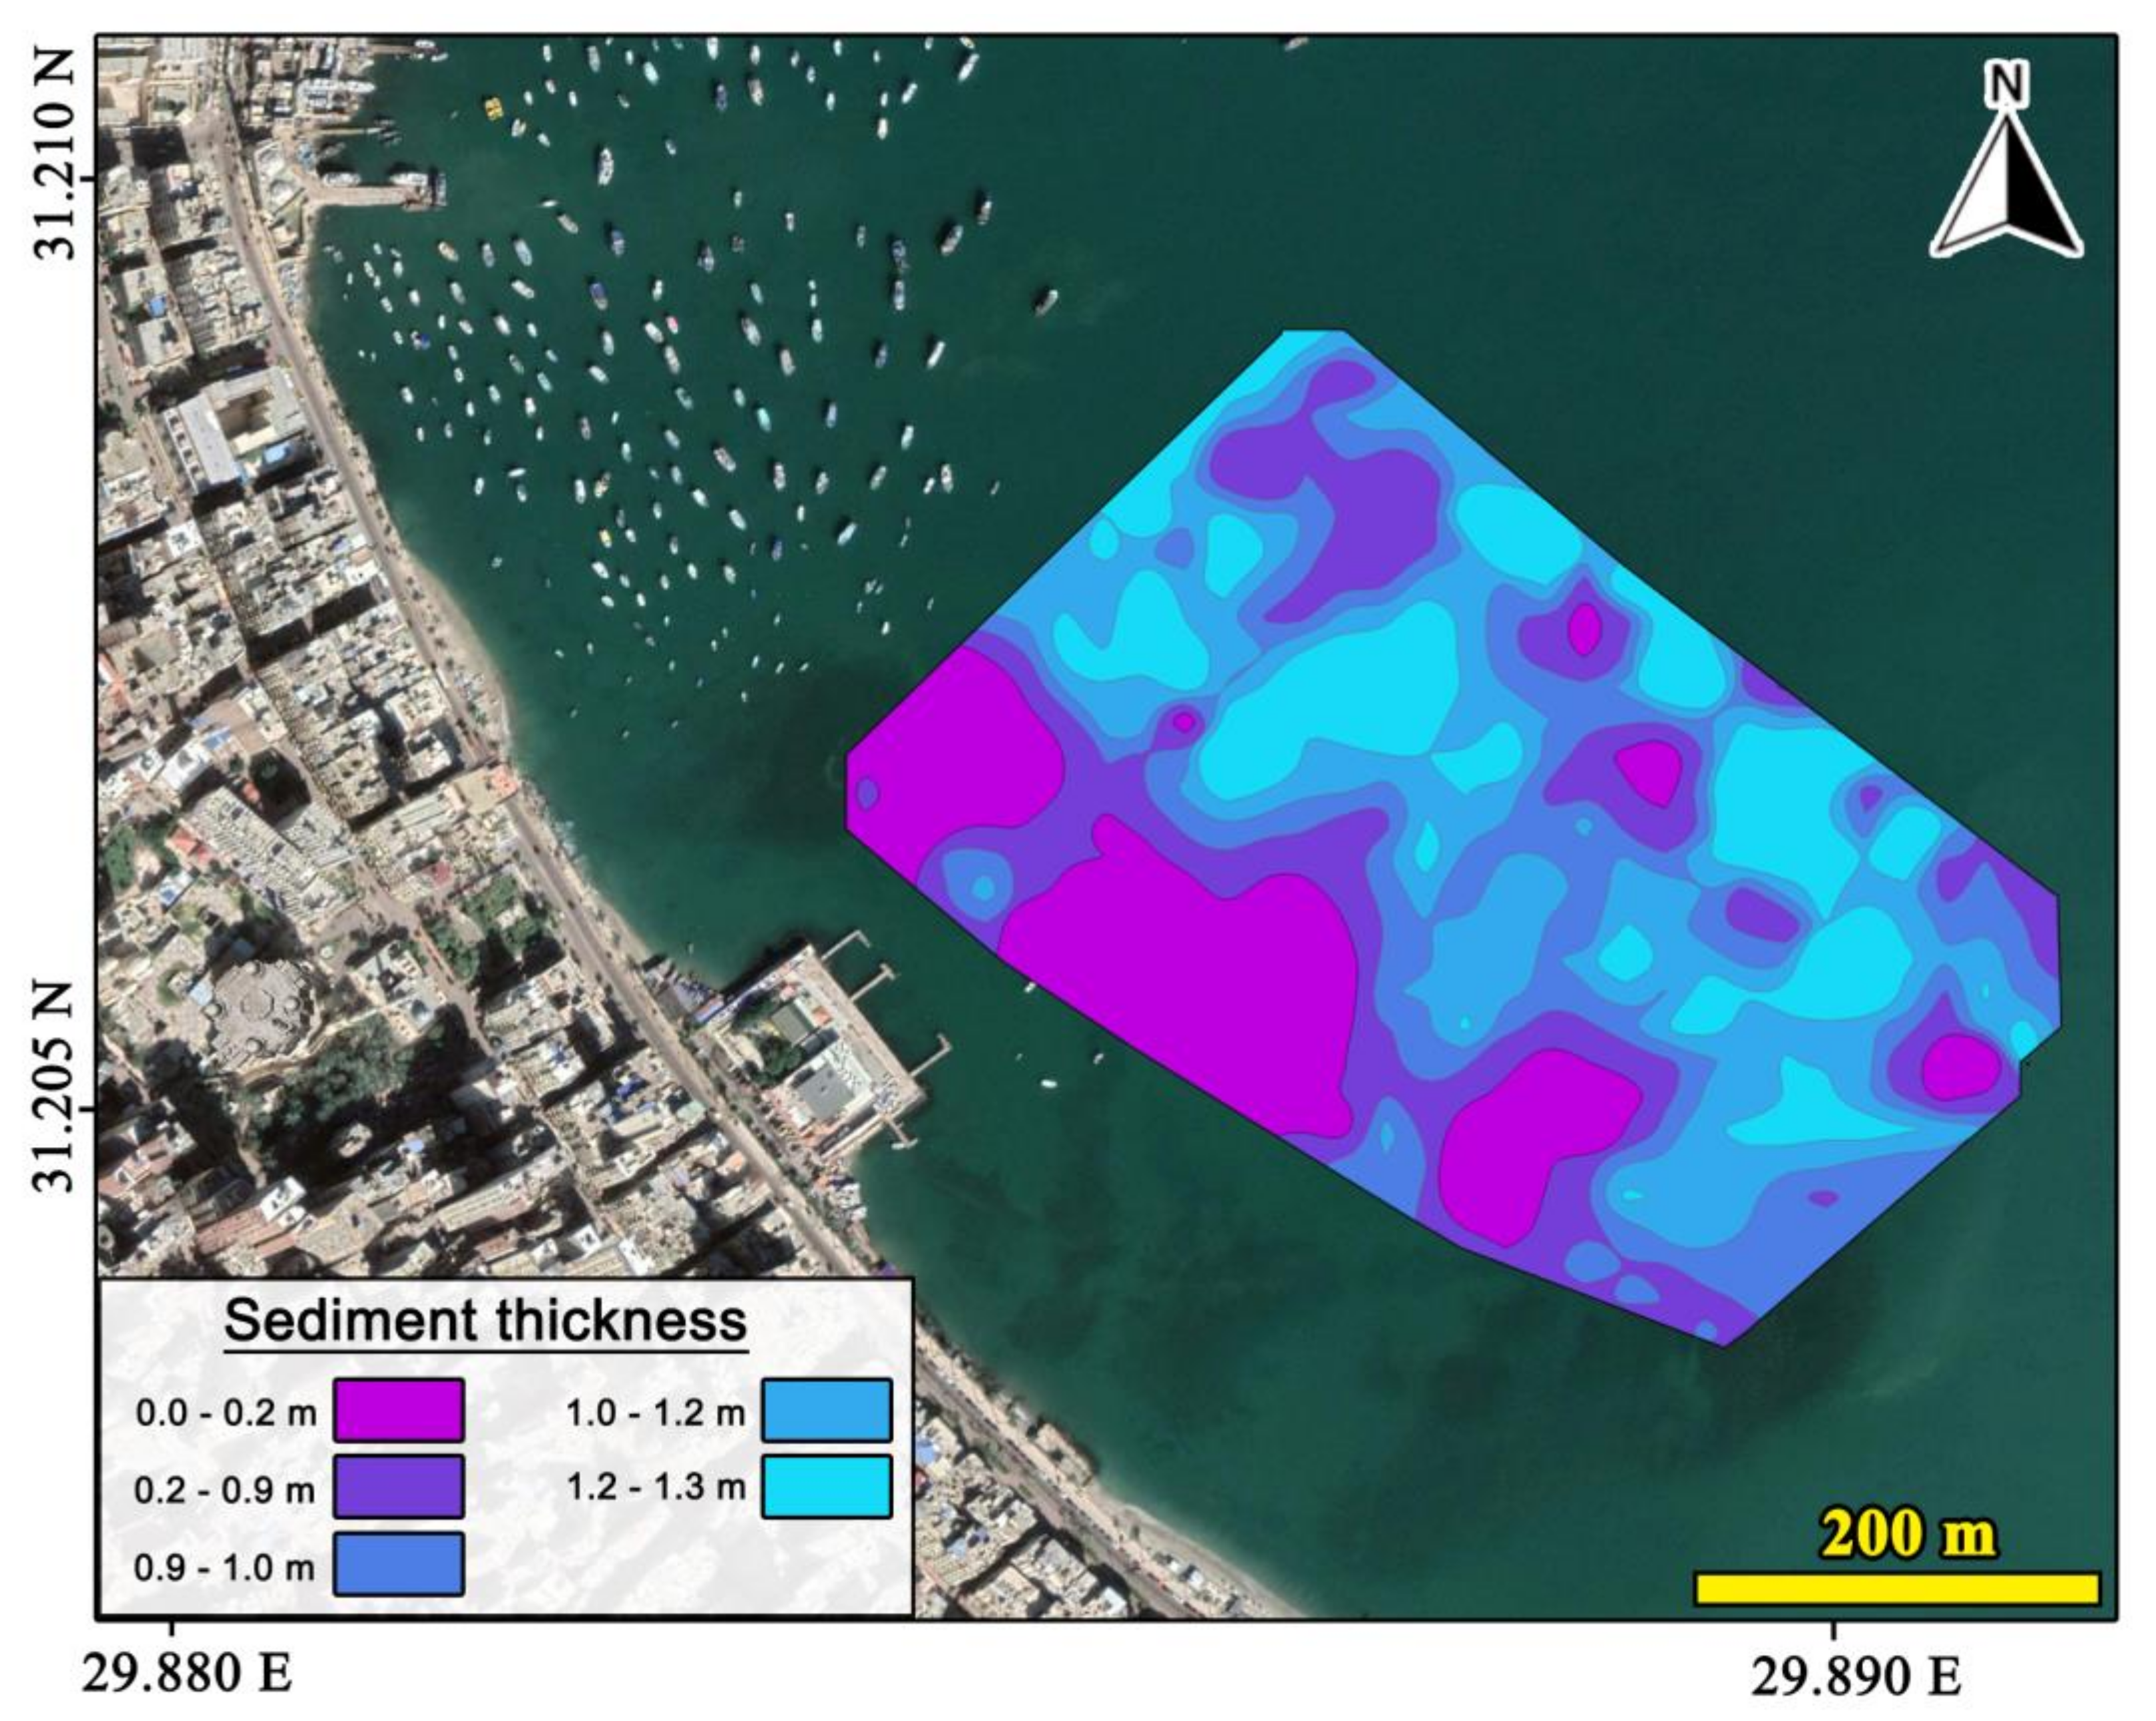
3.5. Sediment Thickness
4. Discussion
5. Conclusions
Author Contributions
Funding
Data Availability Statement
Acknowledgments
Conflicts of Interest
References
- Goddio, F.; Bernand, A.; Bernand, E.; Darwish, I.; Kiss, Z.; Yoyotte, J. Alexandria: The Submerged Royal Quarters; Periplus: London, UK, 1998; p. 274. [Google Scholar]
- Belov, A. Navigational Aspects of Calling to the Great Harbour of Alexandria. 2014; Halshs-00845524. Available online: https://halshs.archives-ouvertes.fr/halshs-00845524/file/Belov.A._forthcoming_Navigational_aspects_of_calling_to_the_Great_Harbour_of_Alexandria.pdf (accessed on 1 July 2021).
- Mahmoud-Bey, M. Mémoire sur l’Antique Alexandrie; Imprimerie de Bianco Luno: Copenhagen, Denmark, 1872; p. 132. [Google Scholar]
- Schwartz, S. A Preliminary Survey of the Eastern Harbor, Alexandria, Egypt Indicating a Comparison of Side Scan Sonar and Remote Viewing; Massachusetts Institute of Technology: Cambridge, MA, USA, 1980. [Google Scholar]
- Stanley, J.D.; Bernasconi, M. Holocene Depositional Patterns and Evolution in Alexandria’s Eastern Harbor, Egypt. J. Coast. Res. 2006, 22, 283–297. [Google Scholar] [CrossRef]
- Torab, M. Paleo-geomorphological map of Alexandria site, Egypt by using submerged archaeological and other evidences. In International Conference on Agriculture, Science and Engineering (ICASE2013); Federal College of Education: Umunze, Nigeria, 2013. [Google Scholar]
- Stanley, J.D.; Carlson, R.; Beek, G.; Jorstad, T.; Landau, E. Alexandria, Egypt, before Alexander the Great: A multidisciplinary approach yields rich discoveries. GSA Today 2007, 17, 4–10. [Google Scholar] [CrossRef]
- AbdelNaby, H. Problems and Challenges of Cultural Heritage in Alexandria, Egypt. Int. J. Cult. Hist. 2017, 3, 174–178. [Google Scholar] [CrossRef] [Green Version]
- Jondet, M.G. Les Ports Submergés de l’Ancienne île de Pharos; Mémoires de l’Institut d’Egypte: Cairo, Egypt, 1916; p. 101. [Google Scholar]
- Chen, Z.; Warne, A.G.; Stanley, J.D. Late quaternary evolution of the northwestern Nile Delta between the Rosetta promontory and Alexandria, Egypt. J. Coast. Res. 1992, 8, 527–561. [Google Scholar]
- Guidoboni, E.; Comastri, A.; Traina, G. Catalogue of Ancient Earthquakes in the Mediterranean Area up to the 10th Century; Instituto Nazionale di Geofisica: Bologna, Italy, 1994; p. 504. [Google Scholar]
- Stanley, J.D.; Bernhardt, C.E. Alexandria’s eastern harbour, Egypt: Pollen, microscopic charcoal, and the transition from natural to human-modified basin. J. Coast. Res. 2010, 26, 67–79. [Google Scholar] [CrossRef]
- Lambeck, K.; Esat, T.M.; Potter, E.-K. Links between climate and sea levels for the past three million years. Nature 2002, 419, 199–206. [Google Scholar] [CrossRef]
- Stanley, J.-D.; Landau, E.A. Early human activity (pre-332 BC) in Alexandria, Egypt: New findings in Eastern Harbor cores, Eos. Transactions. Am. Geophys. Union Fall Meet. Suppl. 2005, 86, F1252. [Google Scholar]
- Mitrovica, J.; Milne, G. On the origin of late Holocene sea-level highstands within equatorial ocean basins. Quat. Sci. Rev. 2002, 21, 2179–2190. [Google Scholar] [CrossRef]
- Pirazzoli, P.; Laborel, J.; Stiros, S. Earthquake clustering in the Eastern Mediterranean during historical times. J. Geophys. Res. 1996, 101, 6083–6097. [Google Scholar] [CrossRef]
- Kebeasy, R. Seismicity. In The Geology of Egypt; Said, R., Ed.; A.A. Balkema: Rotterdam, The Netherlands, 1990; pp. 51–59. [Google Scholar]
- Malaval, B.; Jondet, G. Le Port d’Alexandrie. Cairo: Administration des Ports et Phares; Imprimerie Nationale: Paris, France, 1912; p. 84. [Google Scholar]
- Stanley, J.-D.; Jorstad, T.F.; Goddio, F. Human impact on sediment mass movement and submergence of ancient sites in the two harbours of Alexandria, Egypt. Nor. J. Geol. 2006, 86, 337–350. [Google Scholar]
- El-Asmar, H.; Ahmed, M.; Taha, M.; Assal, E.M. Human Impacts on Geological and Cultural Heritage in the Coastal Zone West of Alexandria to Al-Alamein, Egypt. Geoheritage 2012, 4, 263–274. [Google Scholar] [CrossRef]
- Westley, K.; Quinn, R.; Forsythe, W.; Plets, R.; Bell, T.; Benetti, S.; McGrath, F.; Robinson, R. Mapping submerged landscapes using multibeam bathymetric data: A case study from the north coast of Ireland. Int. J. Naut. Archaeol. 2011, 40, 99–112. [Google Scholar] [CrossRef]
- Hamouda, A.Z.; EL-Gendy, N.; El-Gharabawy, S.; Salah, M. Acoustic Survey along Heraklieon and East Canopus Ancient Greek Cities, Abu Quir Bay, Alexandria, Egypt. J. Earth Sci. Clim. Chang. 2015, 6, 289. [Google Scholar]
- Quinn, R.; Forsythe, W.; Breen, C.; Boland, D.; Lane, P.; Omar, A.L. Process-based models for port evolution and wreck site formation at Mombasa, Kenya. J. Archaeol. Sci. 2007, 34, 1449–1460. [Google Scholar] [CrossRef]
- Chalari, A.; Papatheodorou, G.; Geraga, M.; Christodoulou, D.; Ferentinos, G. A marine geophysical survey illustrates Alexandria’s Hellenistic past. Zeitschrift Geomorphologie 2009, 53, 191–212. [Google Scholar] [CrossRef]
- Hamouda, A.Z.; EL-Gendy, N.; El-Gharabawy, S.; Fekry, A. Geological implications of acoustic imagery of the recent seabed textures in the Eastern Harbor, Alexandria. EJAR 2016, 42, 249–259. [Google Scholar] [CrossRef] [Green Version]
- Papatheodorou, G.; Geraga, M.; Ferentinos, G. The Navarino naval battle site, Greece–an integrated remote sensing survey and a rational management approach. Int. J. Naut. Archaeol. 2005, 34, 95–109. [Google Scholar] [CrossRef]
- Lee, G.H.; Kim, H.J.; Kim, D.C.; Yi, B.Y.; Nam, S.M.; Khim, B.K.; Lim, M.S. The acoustic diversity of the seabed based on the similarity index computed from Chirp seismic data. ICES J. Mar. Sci. 2009, 66, 227–236. [Google Scholar] [CrossRef] [Green Version]
- Geraga, M.; Papatheodorou, G.; Agouridis, C.; Kaberi, H.; Iatrou, M.; Christodoulou, D.; Fakiris, E.; Prevenios, M.; Kordella, S.; Ferentinos, G. Palaeoenvironmental implications of a marine geoarchaeological survey conducted in the SW Argosaronic gulf, Greece. J. Archaeol. Sci. Rep. 2017, 12, 805–818. [Google Scholar] [CrossRef] [Green Version]
- Vincenty, T. Direct and inverse solutions of geodesics on the ellipsoid with application of nested equations. Surv. Rev. 1975, 23, 88–93. [Google Scholar] [CrossRef]
- Folk, R.L. Petrology of Sedimentary Rocks; Hemphill Publishing Company: Austin, TX, USA, 1974. [Google Scholar]
- Fraser, P.M. Ptolemaic Alexandria; Oxford University Press: London, UK, 1972; p. 2136. [Google Scholar]
- Ruban, D.A.; Sallam, E.S.; Ermolaev, V.A.; Yashalova, N.N. Aesthetic Value of Colluvial Blocks in Geosite-Based Tourist Destinations: Evidence from SW Russia. Geosciences 2020, 10, 51. [Google Scholar] [CrossRef] [Green Version]
- Terry, J.; Goff, J. Megaclasts: Proposed Revised Nomenclature At the Coarse End of the Udden-Wentworth Grain-Size Scale for Sedimentary Particles. J. Sediment. Res. 2014, 84, 192–197. [Google Scholar] [CrossRef]
- Hamouda, A.Z.; El-Gharabawy, S.; Fekry, A.; Nassar, M.; Salah, M. Subsidence model of the ancient Alexandria Royal port linked to sea-level rise and natural hazards using integrated geophysical methods. EJAR 2021, in press. [Google Scholar]
- Goiran, J. Recherche Géomorphologique dans la Région Littorale d’Alexandrie, Egypte: Mobilité des Paysages à l’Holocène Récent et Évolutiondes Milieux Portuaires Antiques. Ph.D. Thesis, Université d’AixMarseille, I-Cerege, Marseille, France, 2001. [Google Scholar]
- Reinhardt, E.; Goodman-Tchernov, B.; Boyce, J.; Van, P.; Rink, W.J.; Mart, Y.; Raban, A.; López, G. The tsunami of 13 December A.D. 115 and the destruction of Herod the Great’s harbor at Caesarea Maritima, Israel. Geology 2006, 34, 1061–1064. [Google Scholar] [CrossRef]
- Torab, M.; Dalal, N. Natural hazards mapping of mega waves on the NW coast of Egypt. J. Afr. Earth Sci. 2015, 112, 353–357. [Google Scholar] [CrossRef]
- Véron, A.; Goiran, J.P.; Morhange, C.; Marriner, N.; Empereur, J.Y. Pollutant lead reveals the pre-Hellenistic occupation and ancient growth of Alexandria, Egypt. Geophys. Res. Lett. 2006, 33, L06409. [Google Scholar] [CrossRef] [Green Version]
- Hamouda, A.Z. A reanalysis of the AD 365 tsunami impact along the Egyptian Mediterranean coast. Acta Geophys. 2010, 58, 687–704. [Google Scholar] [CrossRef]


| Sample Number | Sample Depth (m) | Sediment Type/ Mean Size | Sediment Sorting |
|---|---|---|---|
| 1 | 3.3 | Coarse sand | Poorly sorted |
| 2 | 4.9 | Fine sand | Moderately well sorted |
| 3 | 3.4 | Medium sand | Poorly sorted |
| 4 | 4.1 | Fine sand | Moderately sorted |
| 5 | 4.3 | Very Fine sand | Moderately sorted |
| 6 | 3.2 | Very Fine sand | Moderately well sorted |
Publisher’s Note: MDPI stays neutral with regard to jurisdictional claims in published maps and institutional affiliations. |
© 2021 by the authors. Licensee MDPI, Basel, Switzerland. This article is an open access article distributed under the terms and conditions of the Creative Commons Attribution (CC BY) license (https://creativecommons.org/licenses/by/4.0/).
Share and Cite
Hamouda, A.; El-Gendy, N.; El-Shishtawy, A.; El-Gharabawy, S.; Fekry, A. Submergence of the Western Greco-Roman Archaeological Site at the Eastern Harbor of Alexandria: Emerged from High Resolution Geophysical Mapping. Quaternary 2021, 4, 22. https://0-doi-org.brum.beds.ac.uk/10.3390/quat4030022
Hamouda A, El-Gendy N, El-Shishtawy A, El-Gharabawy S, Fekry A. Submergence of the Western Greco-Roman Archaeological Site at the Eastern Harbor of Alexandria: Emerged from High Resolution Geophysical Mapping. Quaternary. 2021; 4(3):22. https://0-doi-org.brum.beds.ac.uk/10.3390/quat4030022
Chicago/Turabian StyleHamouda, Amr, Nader El-Gendy, Ahmed El-Shishtawy, Suzan El-Gharabawy, and Ahmed Fekry. 2021. "Submergence of the Western Greco-Roman Archaeological Site at the Eastern Harbor of Alexandria: Emerged from High Resolution Geophysical Mapping" Quaternary 4, no. 3: 22. https://0-doi-org.brum.beds.ac.uk/10.3390/quat4030022