
First Chronological Constraints for the High Terraces of the Upper Ebro Catchment
by
Josep M. Parés
1,*, 
Mathieu Duval
1,2,
Angel Soria-Jáuregui
3 and
María José González-Amuchástegui
3,4 1
Geocronology & Geology, CENIEH, Sierra de Atapuerca 3, 09002 Burgos, Spain
2
Australian Research Centre for Human Evolution (ARCHE), Environmental Futures Research Institute, Griffith University, Nathan, QLD 4111, Australia
3
G.I.R. “Pangea” Dpto. Geografía, Facultad de Filosofía y Letras, Universidad de Valladolid, Plaza del Campus Universitario s/n, 47011 Valladolid, Spain
4
Departamento de Geografía, Universidad Nacional de Educación a Distancia (UNED), Paseo de la Senda del Rey 7, 28040 Madrid, Spain
*
Author to whom correspondence should be addressed.
Quaternary 2021, 4(3), 25; https://0-doi-org.brum.beds.ac.uk/10.3390/quat4030025
Submission received: 27 April 2021
/
Revised: 7 June 2021
/
Accepted: 18 June 2021
/
Published: 5 August 2021
(This article belongs to the Special Issue Fluvial Archives: Climatic and Topographical Influences)
Abstract
:The Cenozoic sedimentary basins in the Iberian Peninsula show a change from long-term basin infill to incision, a transition that indicates a period of major drainage reorganization that culminated in the throughflow of the networks to the Atlantic and Mediterranean oceans. Both the cause of the transition from aggradation to degradation and the linkages to tectonic, climatic, and geomorphic events hinge on the chronology of the fluvial network incision and excavation of the basin’s sedimentary fills. In this paper, we describe the first chronologic data on the highest fluvial terraces of the upper area of the Ebro River, one of the largest fluvial systems in the Iberian Peninsula, to determine the onset of incision and excavation in the basin. For this purpose, we combine electron spin resonance (ESR) and paleomagnetism methods to date strath terraces found at 140, 90, and 85 m above the current river level. Our results show ages of ca. 1.2 and 1.5 Ma for the uppermost river terraces in the upper Ebro catchment, constraining the minimum age of the entrenchment of the upper Ebro River.
1. Introduction
The sedimentary records of the Tertiary basins in the Iberian Peninsula show a change from long-term basin infill to degradation, a transition that marks a period of major drainage reorganization culminating in the throughflow of the main river networks to the Atlantic Ocean and Mediterranean Sea (e.g., [1,2,3,4,5,6]). The timing of the change from endorheic to exorheic conditions and whether this was linked to tectonic, climatic, and geomorphic events hinge on the chronology of the fluvial network incision and excavation of the basin’s fill. Although river incisions of most of the basins in Iberia appear to have initiated in the Quaternary, the precise timing of their beginning is not fully understood (e.g., [4,7]), except for certain rivers, such as the Tagus [8] Fluvial terrace staircases provide direct records of both base-level and river incisions, and are known to be a result of the combination of climatic changes and tectonic uplift (e.g., [9,10,11,12]). Therefore, providing direct chronometric ages for such fluvial terraces will elucidate the switch from an endorheic to exorheic context in the Iberian fluvial basins.
One of the Iberian basins that experienced such evolution is the Ebro Basin. This basin became the South Pyrenean Foreland Basin, bounded by the Catalan Coastal Ranges to the east the Iberian Range to the south, and the Pyrenees to the north. The formation and development of the present-day Ebro River fluvial network was mainly controlled by the tectonic evolution of the Pyrenean orogenic belt during Tertiary times. The basin started as an endorheic system, isolated from the ocean for several million years, until it opened up to the Mediterranean (e.g., [13]). The timing and process(es) leading to the major drainage reorganization that eventually led to the basin’s opening are currently not well defined (e.g., [14,15,16,17,18,19,20]).
Magnetostratigraphic data suggest the Middle Miocene period as the age of the youngest preserved endorheic sediments in the Ebro Basin (from 12–11 Ma ago) ([18,21,22,23]). A conglomeratic unit near the Iberian Range (labelled unit T8 by [24]), which post-dates the Middle Miocene lacustrine carbonates, may reflect exorheic drainage conditions [22], but whether they alternatively correspond to an internal alluvial system cannot be ruled out. Additionally, clastic deposits, or a mantled pediment, of Pyrenean provenance that truncate the culminating lacustrine limestone in the center of the Ebro catchment [25] may also (although not necessarily) represent early exorheic drainage, although reliable numerical chronologies are still missing. Overall, there is no solid evidence of post-Middle Miocene endorheic sedimentation in the Ebro foreland basin, a fact that suggests the lower age limit for the beginning of the exorheism. Many fewer studies have been devoted to the timing and formation of the fluvial terraces formed by the progressive downcutting of the fluvial network that followed the aperture of the basin to the Mediterranean Sea (e.g., [26,27,28,29,30,31,32,33,34,35,36,37]). Even less data exist for the terraces of the trunk river [38,39,40,41].
The longest terrace sequence of the Ebro River is formed by 11 terrace levels [42,43], whereas the most complete terrace systems in the Ebro catchment are made up of 12 levels associated with the Gállego [27] and Huerva [44] rivers. So far, the oldest numerical age constraint available for a fluvial terrace in the Ebro catchment comes from the Alcanadre River, which provides an age of ca. 1.3 Ma [45]. In that river, terraces T1 and T2, at ca. +180 and +120 m, respectively, above the current river level, produce dominant reverse magnetization directions, indicating a Lower Pleistocene age. ESR dating of optically bleached quartz grains from those two terraces provided ages of 1276 ± 104 ka and 817 ± 68 ka for T1 and T2, respectively [46], which is consistent with the palaeomagnetic results. In the Gállego River, the highest terrace is at +150–175 m. 26 analyzed the terrace sequence and suggested that the Matuyama–Brunhes reversal (0.78 Ma) occurred between terraces at +85–90 m and +60–70 m near Gurrea. Finally, [38] presented further paleomagnetic data for a terrace level located at +210 m above the Ebro River, supporting a Lower Pleistocene age (pre-Matuyama–Brunhes boundary); however, it is worth mentioning that these last two studies did not yield any new numerical age results. The corollary is that a time gap exists between the youngest clear and dated evidence for endorheism in the Ebro foreland basin sector, of Middle Miocene age, and the oldest fluvial terraces, dated at about 1.3 Ma, at about 180 m above the present-day river.
In the mid-Ebro River, a number of localities show gravelly deposits that are higher than the studied terraces, and therefore presumably older. For example, the locality known as Loma Negra (Zaragoza) shows a glacis level at about 400 m above the present-day river [25], but has an unknown chronology. Additionally, a number of fluvial terraces east of Alfaro are found at about 200 above the Ebro River [47], which presumably may be older than the targeted deposits.
Data are scarce in the upper Ebro catchment. According to the existing geological maps, the youngest evidence for endorheism in the upper sector is given by the lacustrine limestones of Upper Miocene [48]. However, no ages are yet available for either the oldest fluvial terraces or the marginal alluvial fans in that area. The main goal of this paper is therefore to provide new data on the timing of formation of the highest river terraces preserved and generated by the Ebro River in the upper catchment [43]. This will allow further constraint of the timing of the highest preserved fluvial aggradation phases across the catchment following the findings of the studies mentioned above. Electron spin resonance (ESR) and paleomagnetism, when possible, were used to determine the chronology of the two fluvial terraces in the upper Ebro River.
2. Regional Setting
The Ebro River, located in northeastern Spain, is one of the longest rivers and drains the second largest fluvial catchment in the Iberian Peninsula. The Ebro River finds its source in the southern foothills of the Basque-Cantabrian Mountains and, running eastward, flows for over 970 km into the Mediterranean Sea, forming the Ebro delta. The formation and development of the present-day Ebro River fluvial network was mainly controlled by the tectonic evolution of the surrounding Pyrenean orogenic belt during Cenozoic times. The study area is located in the upper Ebro catchment, structurally separated from the Ebro foreland basin by the Sierra Cantabria–Montes Obarenes thrust, the continuation of the Southern Pyrenean thrust (Figure 1) [49]. Here, the morphostructure corresponds to a folded ejective relief, made up of a succession of wide synclines and narrow anticlines (Figure 1). The synclines constitute concordant negative reliefs (e.g., Villarcayo and Miranda–Treviño basins) [50], and the anticlines form positive reliefs (e.g., Sierra Cantabria–Montes Obarenes, Valderejo–Sobrón anticline).
The river terraces that we studied are located specifically in the Miranda–Treviño basin sector (MT Basin), a piggyback basin that developed at the back of the Sierra Cantabria–Obarenes Mountains thrust (Figure 1). In this area, the trace of the river is largely controlled by the local geologic structure, following synclines and forming canyons across anticlines. The mountainous edges are mainly made of Cretaceous marine deposits (limestones, marls, and sandstones), whereas the MT Basin is filled by Paleogene and Neogene continental deposits (conglomerates, sandstones, and lacustrine limestones). The southern limit of the MT Basin is the Sierra de Cantabria–Montes Obarenes thrust, which places the Mesozoic cover over the Ebro foreland basin toward the south. The trace of this thrust fault and the associated mountain range delineates the southern margin of the MT Basin, and hence of the upper Ebro catchment.
The Ebro River flows through a canyon incised in Mesozoic rocks just north of Haro (Figure 1), leaving the MT Basin and entering the Ebro foreland basin. On the hanging wall block of the thrust where the MT Basin is found, an endorheic drainage system developed during at least the Late Miocene, as suggested by a unit of lacustrine limestones [48]. A conglomeratic unit with limestone and quartz cobbles, unconformably overlying Oligocene sediments west of Miranda de Ebro, have been assigned to the Pliocene [48], although their age and significance have not yet been determined. The fact that they are tilted reveals some tectonic activity, which may correspond to the latest stages of the Sierra Cantabria–Obarenes Mountains thrust. In any event, sometime after that, but definitely after the Late Miocene, the Ebro River developed a sequence of 11 strath terrace levels over the Miocene sedimentary bedrock in the Miranda sector of the catchment [41,51,52]. Their distribution is rather heterogeneous; they are more abundant toward the Miranda basin, and the lowermost terraces are generally better preserved (Figure 1). The majority of river terraces are mainly composed of well-sorted, well-rounded limestone pebbles and cobbles, often imbricated, and embedded in a sandy matrix [41]. The river terraces that we studied are located in the upper Ebro catchment [41,43], in the upper area of the catchment (northern Spain), specifically in the Miranda basin (Figure 1 and Figure 2).
3. Material and Methods
The terrace sequence of the upper Ebro catchment was redefined and correlated using aerial photographs (scale 1:18,000), orthophotos (scales 1:50,000, 1:25,000, 1:10,000, and 1:5000), and geological maps (IGME, scale 1:50,000). This information was implemented by field data. Elevation data were obtained from 5 m cell size LiDAR-derived DEMs published by the Instituto Geográfico Nacional (IGN). Fluvial facies were described in suitable outcrops and further sampled for ESR dating and paleomagnetic studies.
3.1. Sampling
We sampled the highest identified fluvial terraces, T1 and T2, located at 140, 90, and 85 m above the present-day river and near the town of Miranda de Ebro (Figure 2, Table 1, Figures S1–S3). A total of 5 sediment samples were collected for ESR dating purposes (see Supplementary Material SM1). Sampling was performed by hammering PVC tubes into layers of fine to medium sand. Two samples (MIR1601 and MIR1602) were taken from T1 deposits (+140 m.a.p.r.l.) at the so-called Monte Miranda–Yarritu locality. Three samples were collected from the T2 deposits at two localities, Monte Miranda–Arinorsa (+90 m; samples MIR1603 and MIR1604) and Aeródromo Miranda (+85 m; MIR1605). In situ measurements of the gamma dose rate were performed at each sampling spot. Additional sediment samples were collected for laboratory analyses (radioelement and water content). With regard to samples for paleomagnetism, oriented specimens were taken at each locality sampled for ESR (see Figures S1–S3). We used standard cylindrical plastic containers (~10 cc) pushed onto the sediments where they were cohesive enough. Otherwise, unconsolidated sediments were hardened with a solution (1:1) of sodium silicate before or just after orienting and removed from the outcrop to obtain ~10 cc cubes. All samples were oriented in situ with a standard compass and clinometer. Specimens were stored in a mu-metal cylinder in the laboratory to prevent further viscous magnetization.
3.2. ESR Method
3.2.1. ESR Dosimetry
Sample preparation and ESR dose evaluation were performed at CENIEH (Burgos, Spain), using the same analytical procedure and experimental conditions as the previous work of [45]) on the Alcanadre deposits. Full details are provided in Supplementary Material. Quartz grains were dated via the multiple aliquots additive dose (MAAD) method and following the multiple center (MC) approach initially defined by [53]. The ESR signals of the aluminum (Al) and titanium (Ti) centers for each sample were acquired in separate spectra using specifically optimized parameters. Each aliquot (14 in total: 1 natural, 1 optically bleached, and 12 gamma-irradiated) was measured 3 times after ~120° rotation in the cavity for Al and Ti signals in order to consider angular dependence of the signal due to sample heterogeneity. To evaluate the repeatability of the DE values, measurements were repeated two to three times over several days.
The ESR intensity of the Al signal was extracted from peak-to-peak amplitude measurements between the top of the first peak (g = 2.0185) and the bottom of the 16th peak (g = 1.9928) [54]. The ESR intensity of the Ti centers was measured following options A, C, D, and E sensu [46]. Final dose response curves (DRCs) were obtained by pooling the mean ESR intensities and associated errors (1 standard deviation) derived from each repeated measurement, using either an exponential + linear function (EXP + LIN) for the Al center or the so-called Ti-2 function, as in [46]. A complete description of the analytical procedure can be found in Supplementary Material SM2. Fitting results are given in Table 2 and Table 3.
3.2.2. Dose Rate Evaluation
The total dose rate was obtained from a combination of in situ and laboratory measurements. In situ external gamma dose rates were obtained with a NaI or LaBr probe connected to a Canberra InSpector-1000 multichannel analyzer and calculated by the threshold technique [55]. In addition, the corresponding radioelement (U, Th, K) concentrations for each sample were determined by ICP-MS analysis of dry raw sediment following a four-acid digest preparation procedure (Table 4). External alpha and beta dose rate components were obtained using the dose rate conversion factors from [56] to derive the concentration values, while the gamma dose rate was taken from the in situ measurement. Dose rates were calculated assuming a mean grain size of 150 µm and a removed thickness by HF etching of 20 µm. The internal dose rate was assumed to be 30 ± 10 uGy/a, based on work by [57] and using an alpha efficiency of 0.07 ± 0.01 [58]. Values were corrected with beta and alpha attenuation values for spherical grains [59,60] and water attenuation formulae from [61]. Current water content was obtained in the laboratory by drying the sediment at 50 °C in an oven for 3 weeks. A water content of 15% (% wet weight) in the sediment was assumed for the age calculation. The cosmic dose rate was calculated using formulae from [62], with depth, altitude, and latitude corrections [63].
3.2.3. ESR Age Calculation
ESR age was calculated using non-commercial Scilab based software, with error calculations based on Monte Carlo simulation, with the following sources of uncertainty: concentration, depth, water content, gamma dose rate, beta dose attenuation, and DE value. ESR ages are given as 1σ (Table 5). Recently, [64] showed that this software typically provides dose rate values that are very close (within a few %) to those obtained by DRAC [65].
In accordance with the MC approach, ESR age results were calculated for the Al, Ti (option D), and Ti-H (option C) centers (Table 5). Indeed, recent works showed that option D can provide overall accurate results for Early to Late Middle Pleistocene fluvial deposits (e.g., [66,67,68,69,70,71]), while option C (Ti-H) is usually more appropriate over a younger time range, from the Late Middle to Late Pleistocene [58,72]. However, because we are aware of the existing variability within the community regarding how the ESR intensity of Ti centers is measured [73], we also provide the DE estimates of the Ti center derived from options A and E (Supplementary Table S1). If necessary, the reader can derive the corresponding ESR age estimates by using the total dose rate values given in Table 5.
3.3. Paleomagnetism
All measurements were made at the Archeomagnetism Laboratory of the Geochronology Facilities at CENIEH (Burgos, Spain). Natural remanent magnetization (NRM) and progressive demagnetization were measured in a 3-axis SQUID magnetometer (2G Enterprises) housed in a ~9 m3 shielded space of Helmholtz coils (residual field <3000 nT). The cryogenic magnetometer has a built-in system of three degaussing coils for alternating field demagnetization to 170 mT. Thermal demagnetization was performed on a TD48 furnace (ASC) placed in the Helmholtz cage. The direction of the remanence components was determined by principal component analysis line-fitted after visual inspection of the demagnetization using Zijderveld-type plots. Characteristic remanent magnetization (ChRM) directions were computed using standard software and plotted on a lower hemisphere using equal area stereographic projection (data summary in Table 6).
4. Results
4.1. Geomorphological and Sedimentological Characteristics
Terrace T1 is a topographically dominant feature of the landscape, located over the town of Miranda de Ebro (Figure 1). It is the only remnant of the culminating fluvial phase in the entire upper Ebro catchment. T1 elevation fluctuates between 600 and 594 m above sea level (+140 m above the Ebro River). The studied outcrop (Monte Miranda–Yarritu) shows a maximum visible thickness of approximately 32 m. The fluvial sediments linked to the outcrop are quite homogeneous, and are mainly made up of horizontally and cross-stratified well-rounded pebbles and cobbles organized into metric planar beds, indicating deposition in channels and gravel bars [74]. The coarse units are typically topped by massive sandy units, interpreted as the result of deposition during declining flooding events [75]. The recurrent vertical stacking of coarse horizontally stratified units is overlaid by fine beds, pointing toward an extended period of sediment deposition.
The presence of terrace T2 is also minimal. This level is composed of only two remnants, elevated between +90 and +85 m above the Ebro River, and both located within the Miranda basin. The remnant closer to terrace T1, known as Monte Miranda–Arinorsa, is located at an elevation of 540 m above sea level and shows an elongated shape from south to north, reaching an approximate length of 600 m (Figure 1 and Figure 2). The outcrop displays a maximum visible thickness of 37 m. From a sedimentological point of view, the fluvial sediments are composed of horizontally and cross-stratified well-rounded gravels organized into metric to decimetric beds bounded by concave-up and tabular erosive surfaces. These sediments are interpreted to indicate deposition in channels and gravel bars [74]. Finer units are also present, especially close to the surface, pointing toward the final stages of fluvial aggradation during the formation of the terrace. The second remnant of T2 is a small terrace flight located at the end of a cul-de-sac valley, topographically bounded to the north and separated from the main valley by a Cretaceous limestone and dolomite crest (Figure 1 and Figure 2). This terrace level occupies an area of 0.03 km2 and is located +85 m over the Ebro River. The main outcrop has a visible thickness of 13 m, and is completely made of fine sediments. The bottom half of the outcrop is composed of trough cross-bedded sands representing deposition of sand dunes at the channel bottom. The top half of the sequence consists of various units of laminated fine-grained sands, silts, and mud that show desiccation cracks and bioturbation features, indicating deposition from suspension in an overbank environment [74]. It is interpreted that this area functioned as a sediment trap during major flooding events and was subsequently abandoned by the progressive entrenchment of the fluvial valley.
4.2. ESR Data
ESR DRCs and fitting results obtained for the Al center are displayed in Figure 3 and Table 2, respectively. Bleaching coefficients vary within a very narrow range (49.1–50.6%), suggesting very similar bleaching conditions for the five samples. Repeatability of the ESR intensity is overall very good, with variation that does not exceed 2.5%. This results in excellent repeatability (variation of <6%) for four out of five samples, the only exception being MIR1605 (15.4%). Finally, three out of five samples show excellent goodness of fit, with adjusted r2 value >0.99, while the other two (MIR1602 and MIR1603) show lower values, between 0.98 and 0.99 (Table 2). These proxies highlight the overall robustness of the ESR dataset. The calculated DE values cluster into two main groups, one with values in the range of 1600–1850 Gy (MIR1601, MIR1602, MIR1603) and one with lower values between 1100 and 1400 Gy (MIR1604, MIR1605).
ESR data obtained from options D and C (sensu [46]) are displayed in Table 4 (fitting results) and Figure 4 and Figure 5. Fitting results derived from options A and E (sensu [46] are given in Supplementary Table S1 for comparison but will not be further discussed in this work. The variability of the ESR intensities obtained from the repeated measurements of the Ti center (option D) remains limited (<2%) for most of the samples, with the exception of MIR1601 (4.6%). This results in an overall slightly higher variability of the DE estimates compared with that achieved for the Al center (7.0 vs. 5.6% on average): repeatability is good (<10%) for four out of five samples, while MIR1605 shows a higher value (15.8%). Goodness of fit is excellent for most of the samples, with adjusted r2 values of >0.99, the only exception being, again, MIR1605. In summary, all proxies indicate good robustness of the ESR data collected for all samples, except for MIR1605, which shows relatively worse DE repeatability and goodness of fit. DE values vary within a relatively narrow range (890–1060 Gy) for samples MIR1601 to MIR1604, while MIR1605 shows a lower value of about 740 Gy.
ESR DRCs and fitting results obtained for the Ti-H center (option C) are displayed in Figure 5 and Table 3, respectively. ESR data show relatively high variability of the ESR intensities over repeated measurements, resulting in regular to poor repeatability of the DE estimates (variation between 7.1 and 38.1%). Additionally, they provide overall poor goodness of fit, with only two samples showing an adjusted r2 value above 0.95 (MIR1602 and MIR1604; Table 3). Together, these proxies suggest the limited reliability of the ESR data derived from the Ti-H center for these five samples, and especially for MIR1605, which displays very poor DE repeatability. Interestingly, DE estimates obtained for the five samples vary within a relatively narrow range between 520 and 630 Gy.
A comparison of the DE values derived from the Al and Ti centers for each sample is shown in Figure 6. All samples show the same DE pattern, with the Al center systematically providing the highest DE values and the Ti-H center (option C) the smallest ones. This may be interpreted at first glance as a typical bleaching pattern, and may simply reflect the differences in the bleaching kinetics of each center. Based on the principles of the MC approach, the DE pattern indicates that the Al signal was most likely not fully reset during sediment transport. Consequently, the Al center provides only a maximum possible estimate of the true burial dose.
Although we might initially assume that the differences observed between Ti DE values derived from options C and D are also the result of an incomplete signal reset of the latter, the data should be interpreted with extreme caution. First, the robustness of the ESR data collected for the Ti-H option C was questioned earlier. Second, previous studies showed the limited reliability of the center to provide DE estimates above 300 Gy (see [73] and references therein). One of the very few exceptions was the Cuesta de la Bajada site, where the Ti-H signal provided an apparently accurate DE result of around 600 Gy. However, this is likely a unique situation resulting from very peculiar quartz samples showing exceptionally high ESR intensities of the Ti-H signal (see [76]). Third, the fact that all DE values were consistent within an error around 500–600 Gy might suggest signal saturation. Taken together, these issues suggest that the Ti-H center most likely underestimates the true burial dose and should therefore be considered as providing a minimum dose constraint in the present study. However, we cannot reasonably exclude that the relatively low environmental dose rate (between 450 and 1100 µGy/a) might instead make the Ti-H signal suitable for dose evaluation in the present study (see [73] and references therein). This question will be further discussed in the next section. Finally, Ti center option D yields DE estimates of between 740 and 1060 Gy, which is the typical dose range in which this signal produces accurate dose results (see [73]). Consequently, it most likely provides the closest estimate to the true burial dose rate.
4.3. Dose Rate Considerations
ICP analyses of the raw sediment samples show relatively low radioelement concentrations, with 0.61–0.75 ppm of U, 1.67–3.11 ppm of Th, and 0.24–0.87% of K (Table 4). These resulted in laboratory gamma dose rates ranging from about 190 to 373 µGy/a. In comparison, in situ gamma dose rates were between 22% lower (MIR1602) and 14% higher (MIR1604) than the laboratory-derived values. These values are nevertheless consistent within error for all but one sample (MIR1602), suggesting that the unmediated environment around the sampling spots is overall relatively homogeneous, which is consistent with field observations (Supplementary Figures S1–S3). Regarding MIR1602, the difference observed between laboratory and in situ values may be the result of either a relatively heterogeneous environment in the vicinity of the sampling spot, a slight disequilibrium in the U-238 decay chain, or possibly a combination of both.
Total dose rate values (Table 5) show an overall relatively low dose rate environment: they do not exceed 900 µGy/a, except for one sample (MIR1601, ~1100 µGy/a). This is, to our knowledge, very uncommon in the Iberian Peninsula. Our previous ESR dating works performed on different Spanish fluvial systems systematically showed significantly higher dose rate environments, e.g., 1850–3300 µGy/a for various terrace deposits associated with the Arlanzón River (Duero Basin) located a few tens of km farther South of Miranda de Ebro [77], 950–1750 µGy/a for the highest terraces of the Alcanadre River (Ebro basin) [5], 1150–2250 µGy/a for the T4 terrace of the Alfambra River valley (Alfambra-Teruel depression) [78], 3250–3950 µGy/a for T4 terrace deposits associated with the Miño River (Galicia) (69), 3250–7250 µGy/a for various deposits of the Jarama and Manzanares Rivers (Madrid) [79], and 1700–4500 µGy/a for different fluvial terrace systems in the eastern Cantabrian margin [80].
4.4. Paleomagnetism
Only the specimens from site MI04 showed stable behavior upon alternating field demagnetization (Figure 7). Most of the remaining specimens showed spurious or uninterpretable magnetization directions. In one sample there is a clear indication of a strong overprint, which cannot be successfully removed by alternating fields (specimen MI01-6, Figure 6). This specimen reveals decayed NRM up to 40 mT, above which level the magnetization directions are scattered. Nevertheless, the linear regression of the remanence vectors upon demagnetization bypass the origin in the Zijderveld diagram, revealing a great circle on the stereographic projection. This circle passes by a southward and negative direction, suggesting the presence of a higher coercivity component (most likely hematite) of reverse magnetization. Only locality (MI04 (Aeródromo de Miranda) produced reliable, interpretable directions (Figure 8). Progressive AF demagnetization often reveals two components of remanence. A soft, low-coercivity component is eliminated at a maximum field of 10 mT, after which the demagnetization trend decays linearly toward the origin of the coordinates in the Zijderveld diagram. Some specimens (e.g., MI04-9, Figure 7) show a slight curvy demagnetization trend, which may reflect gyroremanent magnetization produced during the AF demagnetization in the magnetometer. All but one characteristic remanent magnetization (ChRM) direction were southward and negative (Figure 8), consistent with reverse polarity. Mean inclination was 67° (absolute value), indistinguishable from the expected geomagnetic axial dipole.
5. Discussion: ESR–Paleomagnetism Age Combined Results
5.1. Age Determination
All samples show the same pattern for the ESR age results (Table 5): the Al center yields the oldest estimates by far, between 1.7 and 2.4 Ma, while the Ti center (option D) provides ages that are consistent with the second part of the Early Pleistocene (between 0.8 and 1.5 Ma), and finally the Ti-H center gives the youngest results, with late Early to Early–Middle Pleistocene age estimates (between 0.5 and 1.1 Ma). Following the principle of the MC approach, ESR age results derived from the Al center should be regarded as maximum possible age constraints. In other words, the true burial age should be similar to or younger than the Al ESR estimates. In contrast, the Ti center (option D) is expected to provide the closest estimate to the true burial age, given the age and dose range considered in the present study. Previous works focused on either the second part of the Early Pleistocene (e.g., [5,66,67]) or on DE estimates ranging between 700 and 1100 Gy [69], showing that Ti (option D) provides accurate ESR ages. In particular, the closest analogue to these deposits in terms of environmental dose rate (800–1350 µGy/a) and chronology (1.1–1.5 Ma) is probably the fluvial system of the Moulouya River [66,67]. There, the late Early Pleistocene ESR ages derived from the Ti center (option D) were consistent with the independent age control provided by the luminescence and paleomagnetism methods. In contrast, for the same reasons, Ti-H is initially expected to yield underestimated age results, thus providing a minimum age constraint for the deposits.
The two samples collected from the T1 terrace deposits at +140 m, MIR1601 and MIR1602, yielded very scattered Ti ESR ages of 856 ± 83 and 1531 ± 155 ka, respectively. It is somewhat surprising that these samples, positioned in the highest (and therefore the oldest) terrace deposits, produced such an apparently young age, and we suspect that the age of MIR1601 is likely underestimated. Since the DE estimates are very similar for both samples, the cause of such discrepancy is likely to be related to the dose rate evaluation. MIR1601 returned the highest dose rate value of the dataset by far. Since the dosimetric data collected from the laboratory and in situ are consistent, we have no reason to question their reliability. The only possible explanation would be that the sediment experienced some remobilization of radioelements that may have locally impacted the radioactivity of the surrounding environment. Paleomagnetic data offer some perspective in this sense. The site under consideration, MI01, gives very poor results, as only three characteristic directions can be computed. All directions are downwards and north seeking, consistent with a normal polarity field. Both observations, poorly defined remanence directions and the appearance of north-seeking directions, might suggest a recent remagnetization of the sediments after the last major reversal (772 ka). To sum up, although we do not have empirical evidence to support the hypothesis of remobilization of radioelements, both ESR and paleomagnetic data seem to support the occurrence of post-depositional processes that would affect both the paleomagnetic signature and the underestimated ESR age. Consequently, the age of the formation of the T1 terrace is most likely better constrained by the ESR age of 1531 ± 155 ka obtained for MIR1602.
The two samples collected in the +90 m deposits, MIR1603 and MIR1604, yield very consistent Ti ESR ages of 1263 ± 123 and 1207 ± 106 ka, respectively. A weighted mean of 1231 ± 80 may be considered as the best age estimate for the T2 terrace. In contrast, sample MIR1605, collected from another outcrop, provides a much older Ti ESR age of 1579 ± 198 ka. Such ESR age is consistent with the reverse polarity revealed by the paleomagnetic analysis. The ESR result, nevertheless, seems to be strongly overestimated, because it is stratigraphically inconsistent with the other two obtained for T2. This may be partly due to the limited robustness of the ESR data collected for this sample, which creates significant uncertainty around the DE result (Table 3 and Figure 5). Moreover, sample MIR1605 displays the lowest dose rate of the dataset, and we cannot exclude that it may also play a role in the overestimation, since the ability of both Al and Ti (option D) signals to yield accurate estimates of small DE values at a maximum of a few hundreds of Gy may be reasonably questioned (e.g., [81]).
In contrast, the Ti-H center was found to be of particular interest in low-dose-rate environments (<1000 µGy/a) (see an overview in [73] and references therein) and in detecting small DE values (e.g., [71]). Therefore, we cannot reasonably rule out that it provides a reliable estimate of the burial dose for samples MIR1602 to MIR1605. However, the thermal lifetime of the signal is unknown, and if it has been demonstrated to be useful for Late Middle Pleistocene samples, its potential usefulness for older time ranges is simply unclear. In that regard, the Ti-H results obtained for the +140 m and +90 m deposits (samples 1601 to 1604) are stratigraphically inconsistent, and also in disagreement with the paleomagnetic results obtained for T2, although those are based on only two samples. Consequently, they should only be considered as minimum possible age estimates. In contrast, the Ti-H age of 1120 ± 163 ka (MIR1605) is consistent with the weighted mean age of 1231 ± 80 ka obtained for T2. This indirectly suggests that the Ti-H result obtained for this sample may be considered as a finite age rather than a minimum estimate. However, this age should be seen as purely indicative given the poor quality of the ESR data obtained for this sample. We consider that the formation age of terrace T2 remains better constrained by samples MIR1603 and MIR1604 and the resulting weighted mean age of 1231 ± 80 ka. In this regard, paleomagnetic data for such terrace at site MI04 (i.e., site MIR1605l; see Table 6) provides strong evidence for a reverse polarity chron, fully compatible with the proposed Matuyama age (>0.772 Ma) for terrace T2.
Our new results, as well as published reports on terraces in the lower Ebro, suggest that we can reasonably discard the idea that this unexpectedly young chronology resulted from a systematic age underestimation by the ESR method due to signal saturation or limited lifetime. Indeed, these samples (i) are found in a relatively low-dose-rate environment, and (ii) do not show exceptionally high DE values (<1000 Gy for Ti, option D). Moreover, previous studies have shown that ESR could provide accurate age constraints for samples of at least 2.0 Ma (e.g., [70]).
5.2. Lower Pleistocene Terraces
Both T1 and T2 terraces date back to the mid-Early Pleistocene (1531 ± 155 and 1231 ± 80 ka, respectively). The only existing numerical data on terrace formation within the Ebro catchment comes from the Alcanadre tributary. There, Qt1 terrace (+200–160 m) was formed during the Middle to Early Pleistocene (1276 ± 104 ka) [82], coeval with the T2 of our study. As for other fluvial chronological data elsewhere in Iberia, 77 reported an ESR age of 1.14 ± 0.13 Ma for terrace T3 (+78–70 m) in the Arlanzón River, located in the Duero catchment. This age should, however, be regarded as a maximum age constraint for the deposits, as only the Al signal was measured. 6 also suggested an Early Pleistocene age for the highest terrace levels in the Duero River based on 10Be-26Al cosmogenic isotope depth profiles. Available datasets support the idea that both the Ebro and Duero catchments experienced fluvial aggradation phases during the Early Pleistocene.
The profound change in base level after the opening of the upper Ebro Basin toward the Ebro foreland basin through the MT Basin sometime after the Upper Miocene, played a major role in the partial excavation of the upper catchment basin and the beginning of the strath terrace system formation [41,51,52]. In that sense, it has been suggested that the response time for a given fluvial system to recover equilibrium conditions after experiencing a major perturbation fluctuates between 1 and 5 Ma (e.g., [83,84]). The opening of a basin, a major perturbation, results in a new base level for the fluvial system that, in order to adjust to the new level, generates upstream-migrating knickpoints or a knickzone (e.g., [1,85,86]). As far as the Ebro catchment, it has been demonstrated that the Ebro River and some of its most important tributaries already adapted their courses to the Mediterranean base level and that the upper course of the river is also adapted to the local base level found in the foreland basin (e.g., [36,43,87]. Therefore, there must be other factors to explain the development of fluvial terraces during the Quaternary in the Ebro fluvial system.
Fluvial terrace staircases are known to be the result of alterations introduced within fluvial systems by the combination of climatic changes, tectonic uplift, and base-level changes (e.g., [10,11,12,88]). Previous studies in the upper Ebro catchment interpreted that fluvial activity was controlled by climatic factors which, in turn, were superimposed on a continuous valley entrenchment related to a long-term regional crustal uplift [41]. The rate of this erosional dynamic can be calculated by using the height of the terraces and their ages and can be interpreted as a proxy for uplift rates. Estimated incision rates are 0.09 m/ka for T1 and 0.07 m/ka for T2. These values are very similar to those estimated for the Arlanzón River (0.06 m/ka) [77] in the Duero catchment and the Tagus River (0.1–0.07 m/ka; Cunha et al., 2008), but much lower than those found in the Alcanadre River, Ebro catchment (0.16–0.12 m/ka) [82]. A number of uplift mechanisms affecting the Iberian Peninsula [89,90,91,92] may explain such contrast in uplift rates, but the scarcity of data does not allow definitive conclusions to be drawn about the uplift mechanisms affecting these Cenozoic basins. In the MT Basin in particular, estimated incision rates could be related to the crustal shortening happening since the Miocene in northern Iberia [93] and/or erosional isostatic adjustments taking place in the Ebro foreland basin [18].
Most studies link the formation of fluvial terraces to glacial–interglacial-driven changes in watershed hydrology and sediment flux (e.g., [94] and references therein). Under such premise, glacial–interglacial cycles are ultimately driving all or most of the incision/aggradation cycles. The sedimentological features of the resulting deposits in the MT Basin are very different, though; those deposited during cold stages are made up of coarse particles, whereas interglacial deposits seem to be composed of fine particles [41]. In the upper Ebro catchment, terraces formed during those cold stages were correlated with higher water discharge and higher sediment delivery linked with glacial advances in the headwaters and periglacial conditions in the bounding reliefs. In turn, interglacial conditions favored an overbank deposition thanks to the lower water discharge and sediment delivery related to the expansion of vegetation cover and hillslope stabilization [41,43,95,96,97,98]). In terms of paleoclimate, the timing of formation of T1 and T2 was around or at the onset of the so-called Early–Middle Pleistocene climate transition (EMPT). Several records (e.g., [99]) reveal a significant change in climate dynamics starting at 1.4 Ma, when eccentricity-dominated (125 kyr) cycles become dominant [100]. It has been reported that fluvial systems, at a global scale, experienced an increase in their incision rates, causing a deep entrenchment of their fluvial valleys around the EMPT [101].
6. Final Remarks and Conclusions
Our ESR study on quartz grains from fluvial sediments in the upper Ebro catchment within the MT Basin produces the first numerical age constraint for the highest terraces. Our best estimates for the ages of terraces T1 (+140 m) and T2 (+90–85 m) are 1531 ± 155 ka and 1231 ± 80 ka, respectively. Paleomagnetic results for terrace T2 furnish a clear reverse polarity in one site, fully consistent with the ESR results. ESR age underestimation in terrace T2 is observed at two localities, and is presumably related to post-depositional processes after the formation of the terrace. High porosity and permeability could definitely have favored such a process, which also could explain the presence of secondary magnetization directions in the deposit. Field observations show precipitates of Mn-oxides in some gravelly lenses within the terrace, which reveal that fluid circulation occurred at some point after gravel deposition.
At present, few chronometric age constraints exist for the oldest, highest Ebro fluvial terraces. Much farther east of the study area, in the central Ebro catchment, terraces T1 and T2 along the Alcanadre tributary, at ca. +180 and +120 m above the current river level, provided ESR ages of 1276 ± 104 ka and 817 ± 68 ka, respectively [5], so slightly younger yet not statistically different from our new ages for terrace T2 in the upper catchment. From a methodological point of view, these results are directly comparable with ours, as both are based on the exact same analytical procedure. The magnetic polarity in those terraces in the Alcanadre is reverse, showing altogether a Lower Pleistocene age, as in the Miranda area. The results described here, in the waterhead of the Ebro River, show ages almost coeval with the results in the mid-Ebro River, so fluvial terraces, from the geochronological point of view, could be coetaneous, as the ages are not statistically different. Be that as it may, the overall results indicate that the formation of the “modern” Ebro River and concomitant development of fluvial terraces were relatively recent.
Although it is beyond the scope of this paper, it worth pointing out that both the MT Basin and the Ebro foreland basin show evidence of internal drainage and lacustrine sedimentation until the Middle Miocene, so regardless of the timing of the present-day drainage network and the age of the connection between the upper and central Ebro River, the opening of the interior basin must have started at or after the mid-Miocene. In this regard, mantled piedmont truncating lacustrine carbonates in various locations in the Ebro Basin (e.g., [4,25]) indicate a major drainage change. Although such veneer of alluvium does not necessarily imply exorheic conditions, the deposits certainly predate the proper entrenchment into the bedrock. Therefore, the origin of the mantled piedmont could date back to the Pliocene or even Late Miocene. In this sense, our results are compatible with the conclusions by [14], in that the present-day Ebro River was not connected to the Mediterranean Sea before the Pliocene. The existence of a “proto Ebro”, as envisioned by [102], back in the Pliocene or even earlier is still compatible with an Early Pleistocene catchment of the center and upper Ebro Basin, as shown in this study. The Castellón Group, a well-known progradation detrital unit (Middle-Late Miocene) in the Valencia Trough ahead of the present-day Ebro delta [103], certainly represents a significant input of sediments from the continent. Yet, the formation of such a clastic unit could have resulted from a catchment restricted to the Catalan coastal ranges [104], and therefore not necessarily be an indication of the opening (= connectivity) of the Ebro Basin to the Mediterranean (e.g., [14]).
This study presents chronological results obtained from the highest terraces of the Ebro River in its upper catchment within the MT Basin. The basin, according to the available geological data, was not connected to the main trunk of the Ebro River before the Late Miocene. The analysis of both studied terraces indicates that their formation was related to the onset of a period characterized by pronounced paleoclimatic changes, when climatic oscillations changed from 41 to quasi-100 ka cycles and the duration of interglacials experienced a relative decrease (the EMPT) [100]. A general entrenchment of the river valleys took place around the onset of the EMPT. Incision rates ranging between 0.09 and 0.07 m/ka have been estimated, which are similar to values obtained in other Iberian fluvial systems but substantially lower than those calculated for some Pyrenean tributaries of the Ebro River.
At the scale of the Iberian Peninsula, although it is beyond the scope of this paper, it is worth noting that recent ESR data on fluvial terraces of the Tajo River also provided much older ages than anticipated (>1.8 Ma) [8]. Overall, and besides the fact that Tajo and Ebro drain to the Atlantic and Mediterranean, respectively, it seems that, as in the Ebro case, the Atlantic draining networks might have acted as an exorheic system much earlier than anticipated [105,106,107,108].
Finally, our results confirm the utility of combining multiple, independent dating techniques to chronologically constrain fluvial deposits, in line with previous works by [66,68]. As observed in the present study, this combination is essential to reliably date Lower Pleistocene sediment, as it is the only way to overcome some limitations that may exist with the use of a single method on a given sample. Future work will be focused on enlarging the number of samples, in particular from the higher terraces of the Ebro River, for ESR and paleomagnetic purposes in order to reinforce and complete the chronostratigraphic framework that is being established.
Supplementary Materials
The following are available online at https://0-www-mdpi-com.brum.beds.ac.uk/article/10.3390/quat4030025/s1, Figure S1: ESR samples MIR1601 and MIR1602, and PMAG samples MIR01 collected from the deposits associated to T1 (+140 m above current river channel) title, Figure S2: ESR samples MIR1603 and MIR1604, and PMAG samples MI03 collected from the deposits associated to T2 (+90 m above current river channel), Figure S3: ESR sample MIR1605 and PMAG sample MI05 collected from the deposits associated to T2 (+85 m above current river channel), Table S1: ESR data derived from the measurement of the Ti centres option A & E sensu [46].
Author Contributions
Conceptualization, J.M.P., M.D., A.S.-J. and M.J.G.-A.; methodology, J.M.P., M.D., A.S.-J., M.J.G.-A.; validation, J.M.P., M.D., A.S.-J. and M.J.G.-A.; formal analysis, J.M.P., M.D., A.S.-J. and M.J.G.-A.; resources, J.M.P., M.D., A.S.-J. and M.J.G.-A.; data curation, J.M.P., M.D.; writing—original draft preparation, J.M.P., M.D.; writing—review and editing, J.M.P., M.D., A.S.-J. and M.J.G.-A.; visualization, J.M.P., M.D., A.S.-J. and M.J.G.-A.; supervision, J.M.P.; project administration, J.M.P., M.D.; funding acquisition, J.M.P., M.D., A.S.-J. All authors have read and agreed to the published version of the manuscript.
Funding
Aspects of the ESR dating study were funded by Ramón y Cajal Fellowship RYC2018-025221-I granted to M.D. Partial support was provided by grant CGL2017-89603-R (J.M.P.).
Institutional Review Board Statement
Not applicable.
Acknowledgments
M.D. and J.M.P. are grateful to Verónica Guilarte Moreno, María Jesús Alonso Escarza, David Martínez Asturias, Claudia Álvarez, Javier Iglesias Cibanal, and Leticia Miguens Rodríguez at CENIEH for technical support throughout the sample preparation and analytical procedures. We thank two anonymous reviewers who made constructive comments on the manuscript and helped to improve this work.
Conflicts of Interest
The authors declare no conflict of interest.
References
- Antón, L.; De Vicente, G.; Muñoz-Martín, A.; Stokes, M. Using river long profiles and geomorphic indices to evaluate the geomorphological signature of continental scale drainage capture, Duero basin (NW Iberia). Geomorphology 2014, 206, 250–261. [Google Scholar] [CrossRef]
- Cunha, P.; Martins, A.A.; Gomes, A.; Stokes, M.; Cabral, J.; Lopes, F.C.; Pereira, D.; de Vicente, G.; Builaert, J.P.; Murray, A.S.; et al. Mechanism and age estimates of continental-scale endorheic to exorheic drainage transition: Douro River, Western Iberia. Glob. Planet. Chang. 2019, 181. [Google Scholar] [CrossRef]
- Friend, P.F.; Dabrio, C.J. (Eds.) Tertiary Basins of Spain; Cambridge University Press: Cambridge, UK, 1996; 400p. [Google Scholar]
- Gutiérrez Elorza, M.; García-Ruiz, J.M.; Goy, J.L.; Gracia, F.J.; Gutierrez-Santolalla, F.; Martí, C.; Martín Serrano, A.; Pérez-Gonzalez, A.; Zazo, C.; Aguirre, E. Quaternary. In The Geology of Spain; Gibbons, W., Moreno, T., Eds.; Geological Society: Bath, UK, 2002; pp. 335–366. [Google Scholar]
- Martín-Serrano, A. La definicion y el encajamiento de la red fluvial actual sobre el macizo hesperico en el marco de su geodinámica alpina. Rev. Soc. Geol. España 1991, 4, 337–351. [Google Scholar]
- Rodríguez-Rodríguez, L.; Antón, L.; Rodés, A.; Pallàs, R.; García-Castellanos, D.; Jiménez-Munt, I.; Struth, L.; Leanni, L.; Aumaître, G.; Bourlès, D.; et al. Dates and rates of endo-exorheic drainage development: Insights from fluvial terraces (Duero River, Iberian Peninsula). Glob. Planet. Chang. 2020, 193, 103271. [Google Scholar] [CrossRef]
- Santisteban, J.I.; Schulte, L. Fluvial networks of the Iberian Peninsula: A chronological framework. Quat. Sci. Rev. 2007, 26, 2738–2757. [Google Scholar] [CrossRef]
- Gouveia, M.P.; Cunha, P.P.; Falguères, C.; Voinchet, P.; Martins, A.A.; Bahain, J.-J.; Pereira, A. Electron spin resonance dating of the culminant allostratigraphic unit of the Mondego and Lower Tejo Cenozoic basins (W Iberia), which predates fluvial incision into the basin-fill sediments. Glob. Planet. Chang. 2020, 184, 103081. [Google Scholar] [CrossRef]
- Bridgland, D.R. River terrace systems in north-west Europe: An archive of environmental change, uplift and early human occupation. Quat. Sci. Rev. 2000, 19, 1293–1303. [Google Scholar] [CrossRef]
- Cunha, P.P.; Martins, A.; Buylaert, J.-P.; Murray, A.S.; Raposo, L.; Mozzi, P.; Stokes, M. New data on the chronology of the Vale do Forno sedimentary sequence (Lower Tejo River terrace staircase) and its relevance as a fluvial archive of the Middle Pleistocene in western Iberia. Quat. Sci. Rev. 2017, 166, 204–226. [Google Scholar] [CrossRef] [Green Version]
- Houtgast, R.F.; van Balen, R.T. Neotectonics of the Roer Valley Rift System, the Netherlands. Glob. Planet. Chang. 2000, 27, 131–146. [Google Scholar] [CrossRef]
- Vandenberghe, J. The relation between climate and river processes, landforms and deposits during the Quaternary. Quat. Int. 2002, 91, 17–23. [Google Scholar] [CrossRef]
- Calvo, J.P.; Daams, R.; Morales, J.; Lopez Martinez, N. Up-to-date Spanish continental Neogene synthesis and paleoclimatic interpretation. Revista de la Sociedad Geológica de España 1993, 6, 29–40. [Google Scholar]
- Babault, J.; Loget, N.; Driessche, J.V.D.; Castelltort, S.; Bonnet, S.; Davy, P. Did the Ebro basin connect to the Mediterranean before the Messinian salinity crisis? Geomorphology 2006, 81, 155–165. [Google Scholar] [CrossRef] [Green Version]
- Coney, P.J.; Muñoz, J.A.; McClay, K.R.; Evenchick, C.A. Syntectonic burial and post-tectonic exhumation of the southern Pyrenees foreland fold–thrust belt. J. Geol. Soc. 1996, 153, 9–16. [Google Scholar] [CrossRef]
- Evans, G.; Arche, A. The flux of siliciclastic sediment from the Iberian Peninsula, with particular reference to the Ebro. In Sediment Flux to Basins: Causes, Controls and Consequences; Jones, S.J., Frostick, L.E., Eds.; Geological Society, Special Publications: London, UK, 2002; pp. 199–208. [Google Scholar]
- Garcia-Castellanos, D.; Vergés, J.; Gaspar-Escribano, J.M.; Cloetingh, S. Interplay between tectonics, climate, and fluvial transport during the Cenozoic evolution of the Ebro Basin (NE Iberia). J. Geophys. Res. Space Phys. 2003, 108, 2347. [Google Scholar] [CrossRef]
- Garcia-Castellanos, D.; Larrasoaña, J.C. Quantifying the post-tectonic topographic evolution of closed basins: The Ebro basin (northeast Iberia). Geology 2015, 43, 663–666. [Google Scholar] [CrossRef] [Green Version]
- Krijgsman, W.; Langereis, C.; Zachariasse, W.; Boccaletti, M.; Moratti, G.; Gelati, R.; Iaccarino, S.; Papani, G.; Villa, G. Late Neogene evolution of the Taza–Guercif Basin (Rifian Corridor, Morocco) and implications for the Messinian salinity crisis. Mar. Geol. 1999, 153, 147–160. [Google Scholar] [CrossRef] [Green Version]
- Nelson, C.; Maldonado, A. Factors controlling late Cenozoic continental margin growth from the Ebro Delta to the western Mediterranean deep sea. Mar. Geol. 1990, 95, 419–440. [Google Scholar] [CrossRef]
- Larrasoaña, J.C.; Murelaga, X.; Garcés, M. Magnetobiochronology of Lower Miocene (Ramblian) continental sediments from the Tuleda Formation (western Ebro basin, Spain). Earth Planet. Soc. Lett. 2006, 243, 409–423. [Google Scholar] [CrossRef]
- Pérez-Rivarés, F.J.; Garcés, M.; Arenas, C.; Pardo, G. Magnetocronologia de la sucesion Miocena de la Sierra de Alcubierre (sector central de la cuenca del Ebro). Rev. Soc. Geol. España 2002, 15, 217–231. [Google Scholar]
- Pérez-Rivarés, F.J.; Garcés, M.; Arenas, C.; Pardo, G. Magnetostratigraphy of the Miocene continental deposits of the Montes de Castejon (central Ebro basin, Spain): Geochronological and paleoenvironmental implications. Geol. Acta 2004, 2, 221–234. [Google Scholar]
- Vazquez-Urbez, M.; Arenas, C.; Pardo, G.; Perez-Rivares, J.; Abad, C.A. The Effect of Drainage Reorganization and Climate On the Sedimentologic Evolution of Intermontane Lake Systems: The Final Fill Stage of the Tertiary Ebro Basin (Spain). J. Sediment. Res. 2013, 83, 562–590. [Google Scholar] [CrossRef]
- Gracia-Prieto, J.; Gutiérrez-Elorza, M.; Sancho-Marcén, C. Las etapas terminales del Neógeno-Cuaternario de la Depresión del Ebro en La Plana Negra (provs. De Zaragoza y Navarra). Consideraciones morfogenéticas. Actas L. Reun. Quat. Iber. Lisb. 1985, 367–379. Available online: https://www.researchgate.net/profile/F-Gracia/publication/324475757_Las_etapas_terminales_del_Neogeno_-_Cuaternario_de_la_Depresion_del_Ebro_en_la_Plana_Negra_provs_de_Zaragoza_y_Navarra/links/5acf08aa0f7e9b18965a8aa5/Las-etapas-terminales-del-Neogeno-Cuaternario-de-la-Depresion-del-Ebro-en-la-Plana-Negra-provs-de-Zaragoza-y-Navarra.pdf (accessed on 1 July 2021).
- Benito, G.; Pérez-González, A.; Gutiérrez, F.; Machado, M.J. River response to Quaternary large-scale subsidence due to evaporite solution (Gállego River, Ebro Basin, Spain). Geomorphology 1998, 22, 243–263. [Google Scholar] [CrossRef]
- Benito, G.; Sancho, C.; Peña, J.; Machado, M.J.; Rhodes, E. Large-scale karst subsidence and accelerated fluvial aggradation during MIS6 in NE Spain: Climatic and paleohydrological implications. Quat. Sci. Rev. 2010, 29, 2694–2704. [Google Scholar] [CrossRef]
- Fuller, I.C.; Macklin, M.G.; Lewin, J.; Passmore, D.G.; Wintle, A.G. River response to high-frequency climate oscillations in southern Europe over the past 200 k.y. Geology 1998, 26, 275–278. [Google Scholar] [CrossRef]
- Lewis, C.J.; McDonald, E.V.; Sancho, C.; Peña, J.L.; Rhodes, E.J. Climatic implications of correlated Upper Pleistocene glacial and fluvial deposits on the Cinca and Gállego Rivers (NE Spain) based on OSL dating and soil stratigraphy. Glob. Planet. Chang. 2009, 67, 141–152. [Google Scholar] [CrossRef]
- Macklin, M.G.; Passmore, D.G. Pleistocene environmental change in the Guadalope basin, northeast Spain: Fluvial and archaeological records. In Mediterranean Quaternary River Environments; Lewin, J., Mackin, M.G., Woodward, J.C., Eds.; Balkema: Rotterdam, The Netherlands, 1995; pp. 103–113. [Google Scholar]
- Macklin, M.G.; Passmore, D.G.; Stevenson, A.C.; Davis, B.A.; Benavente, J.A. Response of rivers and lakes to Holocene environmental changes in the Alcañz region, Teruel, North-East Spain. In Environmental Change in Drylands: Biogeographic and Geomorphological Perspectives; Millington, A.C., Pye, K., Eds.; Wiley: New York, NY, USA, 1994; pp. 113–130. [Google Scholar]
- Peña, J.L.; Sancho, C.; Lewis, C.; McDonald, E.; Rhodes, E. Datos cronológicos de las morrenas terminales del glaciar del Gállego y su relación con las terrazas fluvioglaciares (Pirineo de Huesca). In Geografía Física de Aragón: Aspectos generales y temáticos; Peña, J.L., Longares, L.A., Sánchez, M., Eds.; Universidad de Zaragoza-Instituto Fernando el Católico: Zaragoza, Spain, 2004; pp. 71–84. [Google Scholar]
- Peña, J.L.; Lewis, C.; McDonald, E.; Rhodes, E.; Sancho, C. Ensayo cronológico del Pleistoceno Medio-Superior en la Cuenca del río Cinca (Pirineos y Depresión del Ebro). In Contribuciones Recientes Sobre Geomorfología; Benito, G., Díez Herrero, A., Eds.; Sociedad Española de Geomorfología-Consejo Superior de Investigaciones Científicas: Madrid, Spain, 2004; pp. 165–170. [Google Scholar]
- Peña, J.L.; Julián, A.; Chueca, J.; Echeverría, M.T.; Angeles, G.R. Etapas de evolución Holocena en el valle del Río Huerva: Geomorfología y geoarqueología. In Geografía Física de Aragón. Aspectos generales y temáticos; Peña, J.L., Longares, L.A., Sánchez, M., Eds.; Universidad de Zaragoza-Instituto Fernando el Católico: Zaragoza, Spain, 2004; pp. 289–302. [Google Scholar]
- Sancho, C.; Peña, J.L.; Lewis, C.; McDonald, E.; Rhodes, E. Preliminary dating of glacial and fluvial deposits in the Cinca River valley (NE Spain): Chronological evidences for the Glacial Maximum in the Pyrenees? In Quaternary Climatic Changes and Environmental Crises in the Mediterranean Region; Ruiz-Zapata, M.B., Dorado, M., Valdeolmillos, A., Gil García, M.J., Bardají, T., de Bustamante, I., Martínez Mendizábal, I., Eds.; Univ. Alcalá/INQUA: Madrid, Spain, 2003; pp. 169–173. [Google Scholar]
- Stange, K.M.; Van Balen, R.; Garcia-Castellanos, D.; Cloetingh, S. Numerical modelling of Quaternary terrace staircase formation in the Ebro foreland basin, southern Pyrenees, NE Iberia. Basin Res. 2014, 28, 124–146. [Google Scholar] [CrossRef]
- Whitfield, R.G.; Macklin, M.G.; Brewer, P.; Lang, A.; Mauz, B.; Maher), E.W. (Née The nature, timing and controls of the Quaternary development of the Rio Bergantes, Ebro basin, northeast Spain. Geomorphology 2013, 196, 106–121. [Google Scholar] [CrossRef]
- Gil, H.; Luzón, A.; Soriano, M.; Casado, I.; Pérez, A.; Yuste, A.; Pueyo, E.L.; Pocoví, A. Stratigraphic architecture of alluvial–aeolian systems developed on active karst terrains: An Early Pleistocene example from the Ebro Basin (NE Spain). Sediment. Geol. 2013, 296, 122–141. [Google Scholar] [CrossRef]
- Luzón, A.; Pérez, A.; Soriano, M.; Pocoví, A. Sedimentary record of Pleistocene paleodoline evolution in the Ebro basin (NE Spain). Sediment. Geol. 2008, 205, 1–13. [Google Scholar] [CrossRef]
- Luzón, A.; Rodríguez-López, J.P.; Pérez, A.; Soriano, M.A.; Gil, H.; Pocoví, A. Karst subsidence as a control on the accumulation and preservation of aeolian deposits: A Pleistocene example from a proglacial outwash setting, Ebro Basin, Spain. Sedimentology 2012, 59, 2199–2225. [Google Scholar] [CrossRef]
- Soria-Jáuregui, Á.; Amuchastegui, M.J.G.; Mauz, B.; Lang, A. Dynamics of Mediterranean late Quaternary fluvial activity: An example from the River Ebro (north Iberian Peninsula). Geomorphology 2016, 268, 110–122. [Google Scholar] [CrossRef]
- Leránoz, B. Terrazas y glacis del río Ebro en Navarra. Cuatern. España Port. 1993, 1, 119–128. [Google Scholar]
- Soria-Jáuregui, Á.; Jiménez-Cantizano, F.; Antón, L. Geomorphic and tectonic implications of the endorheic to exorheic transition of the Ebro River system in northeast Iberia. Quat. Res. 2018, 91, 472–492. [Google Scholar] [CrossRef] [Green Version]
- Guerrero, J.; Gutiérrez, F.; Lucha, P. Impact of halite dissolution subsidence on Quaternary fluvial terrace development: Case study of the Huerva River, Ebro Basin, NE Spain. Geomophology 2008, 100, 164–179. [Google Scholar] [CrossRef]
- Duval, M.; Sancho, C.; Calle, M.; Guilarte, V.; Peña-Monné, J.L. On the interest of using the multiple center approach in ESR dating of optically bleached quartz grains: Some examples from the Early Pleistocene terraces of the Alcanadre River (Ebro basin, Spain). Quat. Geochronol. 2015, 29, 58–69. [Google Scholar] [CrossRef] [Green Version]
- Duval, M.; Guilarte, V. ESR dosimetry of optically bleached quartz grains extracted from Plio-Quaternary sediment: Evaluating some key aspects of the ESR signals associated to the Ti-centers. Radiat. Meas. 2015, 78, 28–41. [Google Scholar] [CrossRef] [Green Version]
- Beroiz, C.; Solé, J. Mapa Geológico de España a E. 1:50.000, 2nd Serie, 1st ed.; Instituto Geológico y Minero de España: Madrid, Spain, 1772; p. 244. [Google Scholar]
- Olivé Davó, A.; Ramírez del Pozo, J. Memoria del Mapa Geológico de España a Escala 1:50.000, Hoja de Miranda de Ebro; IGME: Madrid, Spain, 1979. [Google Scholar]
- Barnolas, A.; Pujalte, V. La Cordillera Pirenaica; Vera, J.A., Ed.; Instituto Geológico y Minero de España—Sociedad Geológica de España: Madrid, Spain, 2004; Available online: http://info.igme.es/cartografiadigital/geologica/Magna50.aspx (accessed on 1 July 2021).
- Alonso-Zarza, A.M.; Armenteros, I.; Braga, J.C.; Muñoz, A.; Pujalte, V.; Ramos, E.; Aguirre, J.; Alonso-Gavilán, G.; Arenas, C.; Baceta, J.I.; et al. Ebro basin (northeastern Spain). In The Geology of Spain; Gibbons, W., Moreno, T., Eds.; Geological Society: Bath, UK, 2002; pp. 301–309. [Google Scholar]
- Aranegui, P. Las terrazas cuaternarias de la Cuenca del Ebro entre Sobrón y Haro. Bol. Real. Soc. Hist. Nat. 1927, 27, 429–434. [Google Scholar]
- Gonzalo Moreno, A.N. La Rioja. Análisis de Geomorfología Estructural; Instituto de Estudios Riojanos: Logroño, Spain, 1979. [Google Scholar]
- Toyoda, S.; Voinchet, P.; Falgueres, C.; Dolo, J.M.; Laurent, M. Bleaching of ESR signals by the sunlight: A laboratory experiment for establishing the ESR dating of sediments. Appl. Radiat. Isot. 2000, 52, 1357–1362. [Google Scholar] [CrossRef]
- Toyoda, S.; Falguères, C. The method to represent the ESR signal intensity of the aluminium hole center in quartz for the purpose of dating. Adv. ESR Appl. 2003, 20, 7–10. [Google Scholar]
- Duval, M.; Arnold, L.J. “Field gamma dose-rate assessment in natural sedimentary contexts using LaBr3(Ce) and NaI(Tl) probes: A comparison between the “threshold” and “windows” techniques. Appl. Radiat. Isot. 2013, 74, 36–45. [Google Scholar] [CrossRef] [PubMed]
- Guérin, G.; Mercier, N.; Adamiec, G. Dose-rate conversion factors: Update. Ancient TL 2011, 29, 5–8. [Google Scholar]
- Vandenberghe, D.; De Corte, F.; Buylaert, J.-P.; Kučera, J.; Haute, P.V.D. On the internal radioactivity in quartz. Radiat. Meas. 2008, 43, 771–775. [Google Scholar] [CrossRef]
- Bartz, M.; Arnold, L.J.; Spooner, N.A.; Demuro, M.; Campaña, I.; Rixhon, G.; Brückner, H.; Duval, M. First experimental evaluation of the alpha efficiency in coarse-grained quartz for ESR dating purposes: Implications for dose rate evaluation. Sci. Rep. 2019, 9, 1–10. [Google Scholar] [CrossRef] [PubMed]
- Brennan, B.J.; Lyons, R.; Phillips, S. Attenuation of alpha particle track dose for spherical grains. Int. J. Radiat. Appl. Instrum. Part D. Nucl. Tracks Radiat. Meas. 1991, 18, 249–253. [Google Scholar] [CrossRef]
- Brennan, B.J. Beta doses to spherical grains. Radiat. Meas. 2003, 37, 299–303. [Google Scholar] [CrossRef]
- Grün, R. A cautionary note: Use of ‘water content’ and ‘depth for cosmic ray dose rate’ in AGE and DATA programs. Ancient TL 1994, 12, 50–51. [Google Scholar]
- Prescott, J.R.; Hutton, J.T. Cosmic ray contributions to dose rates for luminescence and ESR dating: Large depths and long-term time variations. Radiat. Meas. 1994, 23, 497–500. [Google Scholar] [CrossRef]
- Prescott, J.R.; Hutton, J.T. Cosmic ray and gamma ray dosimetry for TL and ESR. Int. J. Radiat. Appl. Instrum. Part D. Nucl. Tracks Radiat. Meas. 1988, 14, 223–227. [Google Scholar] [CrossRef]
- Kreutzer, S.; Duval, M.; Bartz, M.; Bertran, P.; Bosq, M.; Eynaud, F.; Verdin, F.; Mercier, N. Deciphering long-term coastal dynamics using IR-RF and ESR dating: A case study from Médoc, south-west France. Quat. Geochronol. 2018, 48, 108–120. [Google Scholar] [CrossRef]
- Durcan, J.A.; King, G.; Duller, G. DRAC: Dose Rate and Age Calculator for trapped charge dating. Quat. Geochronol. 2015, 28, 54–61. [Google Scholar] [CrossRef] [Green Version]
- Bartz, M.; Rixhon, G.; Duval, M.; King, G.E.; Álvarez-Posada, C.; Parés, J.M.; Brückner, H. Successful combination of electron spin resonance, luminescence and palaeomagnetic dating methods allows reconstruction of the Pleistocene evolution of the lower Moulouya river (NE Morocco). Quat. Sci. Rev. 2018, 185, 153–171. [Google Scholar] [CrossRef] [Green Version]
- Bartz, M.; Arnold, L.; DeMuro, M.; Duval, M.; King, G.; Rixhon, G.; Posada, C. Álvarez; Parés, J.; Brückner, H. Single-grain TT-OSL dating results confirm an Early Pleistocene age for the lower Moulouya River deposits (NE Morocco). Quat. Geochronol. 2019, 49, 138–145. [Google Scholar] [CrossRef] [Green Version]
- Duval, M.; Voinchet, P.; Arnold, L.J.; Parés, J.M.; Minnella, W.; Guilarte, V.; Demuro, M.; Falguères, C.; Bahain, J.-J.; Despriée, J. A multi-technique dating study of two Lower Palaeolithic sites from the Cher Valley (Middle Loire Catchment, France): Lunery-la Terre-des-Sablons and Brinay-la Noira. Quat. Int. 2020, 556, 79–95. [Google Scholar] [CrossRef]
- Méndez-Quintas, E.; Santonja, M.; Pérez-González, A.; Duval, M.; Demuro, M.; Arnold, L. First evidence of an extensive Acheulean large cutting tool accumulation in Europe from Porto Maior (Galicia, Spain). Sci. Rep. 2018, 8, 1–13. [Google Scholar] [CrossRef]
- Sahnouni, M.; Parés, J.M.; Duval, M.; Cáceres, I.; Harichane, Z.; Van Der Made, J.; Pérez-González, A.; Abdessadok, S.; Kandi, N.; Derradji, A.; et al. 1.9-million- and 2.4-million-year-old artifacts and stone tool–cutmarked bones from Ain Boucherit, Algeria. Science 2018, 362, 1297–1301. [Google Scholar] [CrossRef] [Green Version]
- Voinchet, P.; Pereira, A.; Nomade, S.; Falguères, C.; Biddittu, I.; Piperno, M.; Moncel, M.-H.; Bahain, J.-J. ESR dating applied to optically bleached quartz—A comparison with 40Ar/39Ar chronologies on Italian Middle Pleistocene sequences. Quat. Int. 2020, 556, 113–123. [Google Scholar] [CrossRef]
- Bahain, J.-J.; Duval, M.; Voinchet, P.; Tissoux, H.; Falguères, C.; Grün, R.; Moreno, D.; Shao, Q.; Tombret, O.; Jamet, G.; et al. ESR and ESR/U-series chronology of the Middle Pleistocene site of Tourville-la-Rivière (Normandy, France)—A multi-laboratory approach. Quat. Int. 2020, 556, 66–78. [Google Scholar] [CrossRef]
- Duval, M.; Arnold, L.J.; Rixhon, G. Electron spin resonance (ESR) dating in Quaternary studies: Evolution, recent advances and applications. Quat. Int. 2020, 556, 1–10. [Google Scholar] [CrossRef]
- Miall, A.D. The geology of fluvial deposits. In Sedimentary Facies, Basin Analysis, and Petroleum Geology; Springer: Berlin/Heidelberg, Germany, 1996; p. 582. [Google Scholar]
- Nemec, W.; Postma, G. Quaternary Alluvial Fans in Southwestern Crete: Sedimentation Processes and Geomorphic Evolution. Alluv. Sediment. 2009, 17, 235–276. [Google Scholar] [CrossRef]
- Demuro, M.; Duval, M.; Arnold, L.J.; Spooner, N.A.; Creighton, D.F.; Méndez-Quintas, E.; Santonja, M.; Pérez-González, A. Insights into the relationship between luminescence and ESR dating signals from Spanish sedimentary quartz samples of different geologic origins. Quat. Int. 2020, 556, 165–179. [Google Scholar] [CrossRef]
- Moreno, D.; Falgueres, C.; Pérez-González, A.; Duval, M.; Voinchet, P.; Benito-Calvo, A.; Ortega, A.I.; Bahain, J.-J.; Sala, R.; Carbonell, E.; et al. ESR chronology of alluvial deposits in the Arlanzón valley (Atapuerca, Spain): Contemporaneity with Atapuerca Gran Dolina site. Quat. Geochronol. 2012, 10, 418–423. [Google Scholar] [CrossRef]
- Duval, M.; Arnold, L.; Guilarte, V.; Demuro, M.; Santonja, M.; Pérez-González, A. Electron spin resonance dating of optically bleached quartz grains from the Middle Palaeolithic site of Cuesta de la Bajada (Spain) using the multiple centres approach. Quat. Geochronol. 2017, 37, 82–96. [Google Scholar] [CrossRef] [Green Version]
- Moreno, D.; Duval, M.; Rubio-Jara, S.; Panera, J.; Bahain, J.J.; Shao, Q.; Pérez-González, A.; Falguères, C. ESR dating of Middle Pleistocene archaeo-paleontological sites from the Manzanares and Jarama river valleys (Madrid basin, Spain). Quat. Int. 2019, 520, 23–38. [Google Scholar] [CrossRef]
- Del Val, M.; Duval, M.; Medialdea, A.; Bateman, M.; Moreno, D.; Arriolabengoa, M.; Aranburu, A.; Iriarte, E. First chronostratigraphic framework of fluvial valleys in the eastern Cantabrian margin of the Iberian Peninsula (Bay of Biscay, Spain). Quat. Geochronol. 2019, 49, 108–114. [Google Scholar] [CrossRef]
- Beerten, K.; Verbeeck, E.L.; Veerle, V.; Dimitri, V.; Marcus, C.; De Grave, J.; Laurent, W. Electron spin resonance (ESR), optically stimulated luminescence (OSL) and cosmogenic radionuclide (CRN) dating of quartz from a Plio-Pleistocene sandy formation in the Campine area, NE Belgium. Quat. Int. 2020, 556, 144–158. [Google Scholar] [CrossRef]
- Sancho, C.; Calle, M.; Peña-Monné, J.L.; Duval, M.; Oliva-Urcia, B.; Pueyo, E.L.; Benito, G.; Moreno, A. Dating the Earliest Pleistocene alluvial terrace of the Alcanadre River (Ebro Basin, NE Spain): Insights into the landscape evolution and involved processes. Quatern. Int. 2020, 407, 86–95. [Google Scholar] [CrossRef] [Green Version]
- Boulton, S.; Stokes, M.; Mather, A.; Boulton, S.; Stokes, M.; Mather, A. Transient fluvial incision as an indicator of active faulting and Plio-Quaternary uplift of the Moroccan High Atlas. Tectonophysics 2014, 633, 16–33. [Google Scholar] [CrossRef] [Green Version]
- Whittaker, A.C.; Boulton, S. Tectonic and climatic controls on knickpoint retreat rates and landscape response times. J. Geophys. Res. Space Phys. 2012, 117. [Google Scholar] [CrossRef] [Green Version]
- Bowman, D.; Shachnovich-Firtel, Y.; Devora, S. Stream channel convexity induced by continuous base level lowering, the Dead Sea, Israel. Geomorphology 2007, 92, 60–75. [Google Scholar] [CrossRef]
- Prince, P.S.; Spotila, J.A.; Henika, W.S. Stream capture as driver of transient landscape evolution in a tectonically quiescent setting. Geol. 2011, 39, 823–826. [Google Scholar] [CrossRef]
- Struth, L.; Garcia-Castellanos, D.; Viaplana-Muzas, M.; Vergés, J. Drainage network dynamics and knickpoint evolution in the Ebro and Duero basins: From endorheism to exorheism. Geomorphology 2019, 327, 554–571. [Google Scholar] [CrossRef]
- Bridgland, D.R.; Westaway, R. Climatically controlled river terrace staircases: A worldwide Quaternary phenomenon. Geomorphology 2008, 98, 285–315. [Google Scholar] [CrossRef] [Green Version]
- Casas-Sainz, A.M.; de Vicente, G. On the tectonic origin of Iberian topography. Tectonophysics 2009, 474, 214–235. [Google Scholar] [CrossRef] [Green Version]
- De Vicente, G.; Vegas, R. Large-scale distributed deformation controlled topography along the western Africa–Eurasia limit: Tectonic constraints. Tectonophysics 2009, 474, 124–143. [Google Scholar] [CrossRef] [Green Version]
- De Vicente, G.; Cloetingh, S.; Van Wees, J.; Cunha, P. Tectonic classification of Cenozoic Iberian foreland basins. Tectonophysics 2011, 502, 38–61. [Google Scholar] [CrossRef]
- De Vicente, G.; Cunha, P.; Martín, A.M.; Cloetingh, S.A.P.L.; Olaiz, A.; Vegas, R. The Spanish-Portuguese Central System: An Example of Intense Intraplate Deformation and Strain Partitioning. Tectonics 2018, 37, 4444–4469. [Google Scholar] [CrossRef] [Green Version]
- Gallastegui, J.; Pulgar, J.A.; Gallart, J. Initiation of an active margin at the North Iberian continent-ocean transition. Tectonics 2002, 21, 1033. [Google Scholar] [CrossRef] [Green Version]
- Pazzaglia, F.J.; Fluvial, T. Fluvial Geomorphology. In Treatise on Geomorphology; Shroder, J., Wohl, E., Eds.; Academic Press: San Diego, CA, USA, 2013; Volume 9, pp. 379–412. [Google Scholar]
- González-Amuchástegui, M.J.; Serrano Cañadas, E. Cartografía geomorfológica delvalle de Tobalina (Burgos). Cuadernos do Lab. Xeol. de Laxe. 1996, 21, 737–748. [Google Scholar]
- González-Amuchastegui, M.J.; Serrano Cañadas, E. Quaternary tufa buildup stages in Mediterranean-Cantabric transitional environment (High Ebro Basin, Nothern Spain). In Proceedings of the Sixth International Conference on Geomorphology, Zaragoza, Spain, 7–11 September 2005; p. 225. [Google Scholar]
- González-Amuchastegui, M.J.; Serrano, E. Acumulaciones tobáceas y evolución del paisaje: Cronología y fases morfogenéticas en el Alto Ebro (Burgos). Cuatern. Geomorfol. 2013, 27, 9–32. [Google Scholar]
- González-Amuchástegui, M.J.; Serrano Cañadas, E. Tufa buildups, landscape evolution and human impact during the Holocene in the Upper Ebro Basin. Quat. Int. 2015, 364, 54–64. [Google Scholar] [CrossRef]
- Lisiecki, L.E.; Raymo, M.E. Plio–Pleistocene climate evolution: Trends and transitions in glacial cycle dynamics. Quat. Sci. Rev. 2007, 26, 56–69. [Google Scholar] [CrossRef] [Green Version]
- Head, M.J.; Gibbard, P.L. Formal subdivision of the Quaternary System/Period: Past, present, and future. Quat. Int. 2015, 383, 4–35. [Google Scholar] [CrossRef] [Green Version]
- Westaway, R.; Bridgland, D.R.; Sinha, R.; Demir, T. Fluvial sequences as evidence for landscape and climatic evolution in the Late Cenozoic: A synthesis of data from IGCP 518. Glob. Planet. Chang. 2009, 68, 237–253. [Google Scholar] [CrossRef]
- Riba, O.; Reguant, S.Y.; Villena, J. Ensayo de síntesis estratigráfica y evolutiva de la Cuenca Terciaria del Ebro. In Libro Jubilar J.M. Ríos; Comba, J.A., Ed.; Instituto Geológico y Minero de España: Madrid, Spain, 1983; Volume 2, pp. 131–159. [Google Scholar]
- Martínez del Olmo, W. Depositional sequences in the Gulf of Valencia. In Tertiary Basins of Spain: The Stratigraphic Record of Crustal Kinematics; Friend, P.F., Dabrio, Y.C.J., Eds.; World and regional series XVI; Cambridge University Press: Cambridge, UK, 1996; pp. 55–67. [Google Scholar]
- Bartrina, M.T.; Cabrera, L.; Jurado, M.J.; Guimerà, J.; Roca, E. Evolution of the central Catalan margin of the Valencia trough (western Mediterranean). Tectonophysics 1992, 203, 219–247. [Google Scholar] [CrossRef]
- Cunha, P.P.; Martins, A.A.; Huot, S.; Murray, A.; Raposo, L. Dating the Tejo river lower terraces in the Ródão area (Portugal) to assess the role of tectonics and uplift. Geomorphology 2008, 102, 43–54. [Google Scholar] [CrossRef]
- Cunha, P.P.; Almeida, N.A.; Aubry, T.; Martins, A.A.; Murray, A.S.; Buylaert, J.-P.; Sohbati, R.; Raposo, L.; Rocha, L. Records of human occupation from Pleistocene river terrace and aeolian sediments in the Arneiro depression (Lower Tejo River, central eastern Portugal). Geomorphology 2012, 165–166, 78–90. [Google Scholar] [CrossRef]
- Cunha, P.P. Cenozoic Basins of Western Iberia: Mondego, Lower Tejo and Alvalade basins. In The Geology of Iberia: A Geodynamic Approach; Quesada, C., Oliveira, J.T., Eds.; Regional Geology Reviews; Springer International Publishing: Berlin, Germany, 2019; Volume 4, pp. 105–130, Chapter 4. [Google Scholar] [CrossRef]
- Silva, P.G.; Roquero, E.; López-Recio, M.; Huerta, P.; Martínez-Graña, A.M. Chronology of fluvial terrace sequences for large Atlantic rivers in the Iberian Peninsula (Upper Tagus and Duero drainage basins, Central Spain). Quat. Sci. Rev. 2017, 166, 188–203. [Google Scholar] [CrossRef]
Figure 1.
Geological map of Miranda basin and surroundings: (1) Miranda basin; (2) Miranda–Treviño syncline (uplifted central axis); (3) Ebro foreland basin; (4) Obarenes–Sierra Cantabria thrust; (5) Tobalina Valley; (6) Sobrón anticline. Bottom left inset shows location of study area within Ebro River catchment (gray zone), situated in the northern Iberian Peninsula. Below, cross-sections of the analyzed terraces: A, Monte Miranda–Yarritu; B, Monte Miranda–Arinorsa; C, Aeródromo.

Figure 2.
Map of terrace levels developed in Miranda Basin. Bottom left inset shows reconstructed river profile for each terrace level based on terrace surface points extracted from a 5 m resolution DEM (color range is the same as that used for terraces on the map; see legend). Below are field images of terrace deposits: A, Monte Miranda–Yarritu; B, Monte Miranda–Arinorsa; C Aeródromo. White capital letters refer to water laid deposits: channels (CH); gravel bars (GB); sandy bedforms (SB); floodplain fines (FF).

Figure 3.
ESR dose response curves (DRCs) of the Al center obtained for five samples dated in present work. All ESR intensities derived from repeated ESR measurements were pooled for fitting. Vertical error bars represent experimental errors associated with ESR intensities, corresponding to 1 standard deviation.

Figure 4.
ESR dose response curves (DRCs) of Ti centers (option D) obtained for five samples dated in present work. All ESR intensities derived from repeated ESR measurements were pooled for fitting. Vertical error bars represent experimental errors associated with ESR intensities, corresponding to 1 standard deviation.

Figure 5.
ESR dose response curves (DRCs) of Ti-H center (option C) obtained for five samples dated in present work. All ESR intensities derived from repeated ESR measurements were pooled for fitting. Vertical error bars represent experimental errors associated with ESR intensities, corresponding to 1 standard deviation.

Figure 6.
Multiple center approach. Comparison of DE results derived from measurements of Al and Ti centers.
Figure 6.
Multiple center approach. Comparison of DE results derived from measurements of Al and Ti centers.

Figure 7.
Progressive demagnetization diagrams of representative samples. Each data point represents the NRM end vector for individual demagnetization steps projected onto the horizontal (solid symbols) and vertical (open symbols) plane on the Zijderveld diagram. All samples were demagnetized with alternating field (steps shown in milliTesla). Natural remanent magnetization (NRM) shows initial magnetic intensity previous to AF procedure. Sample MIR01-6 shows a linear trend that bypass coordinate origin during AF demagnetization. On stereographic projection, a great circle is observed, which suggests the presence of a higher coercivity reverse magnetization component unresolved with AF. Specimens MI04-8 and MI04-6 show progressive decay after 10 mT, where a viscous component is erased.

Figure 8.
Lower hemisphere stereographic projection of paleomagnetic directions of site MI04. Stereonet on left shows characteristic remanent magnetization (ChRM) direction, high coercivity components. Stereonet on right shows viscous, low coercivity component. Open (closed) symbols represent vectors projected onto upper (lower) hemisphere.


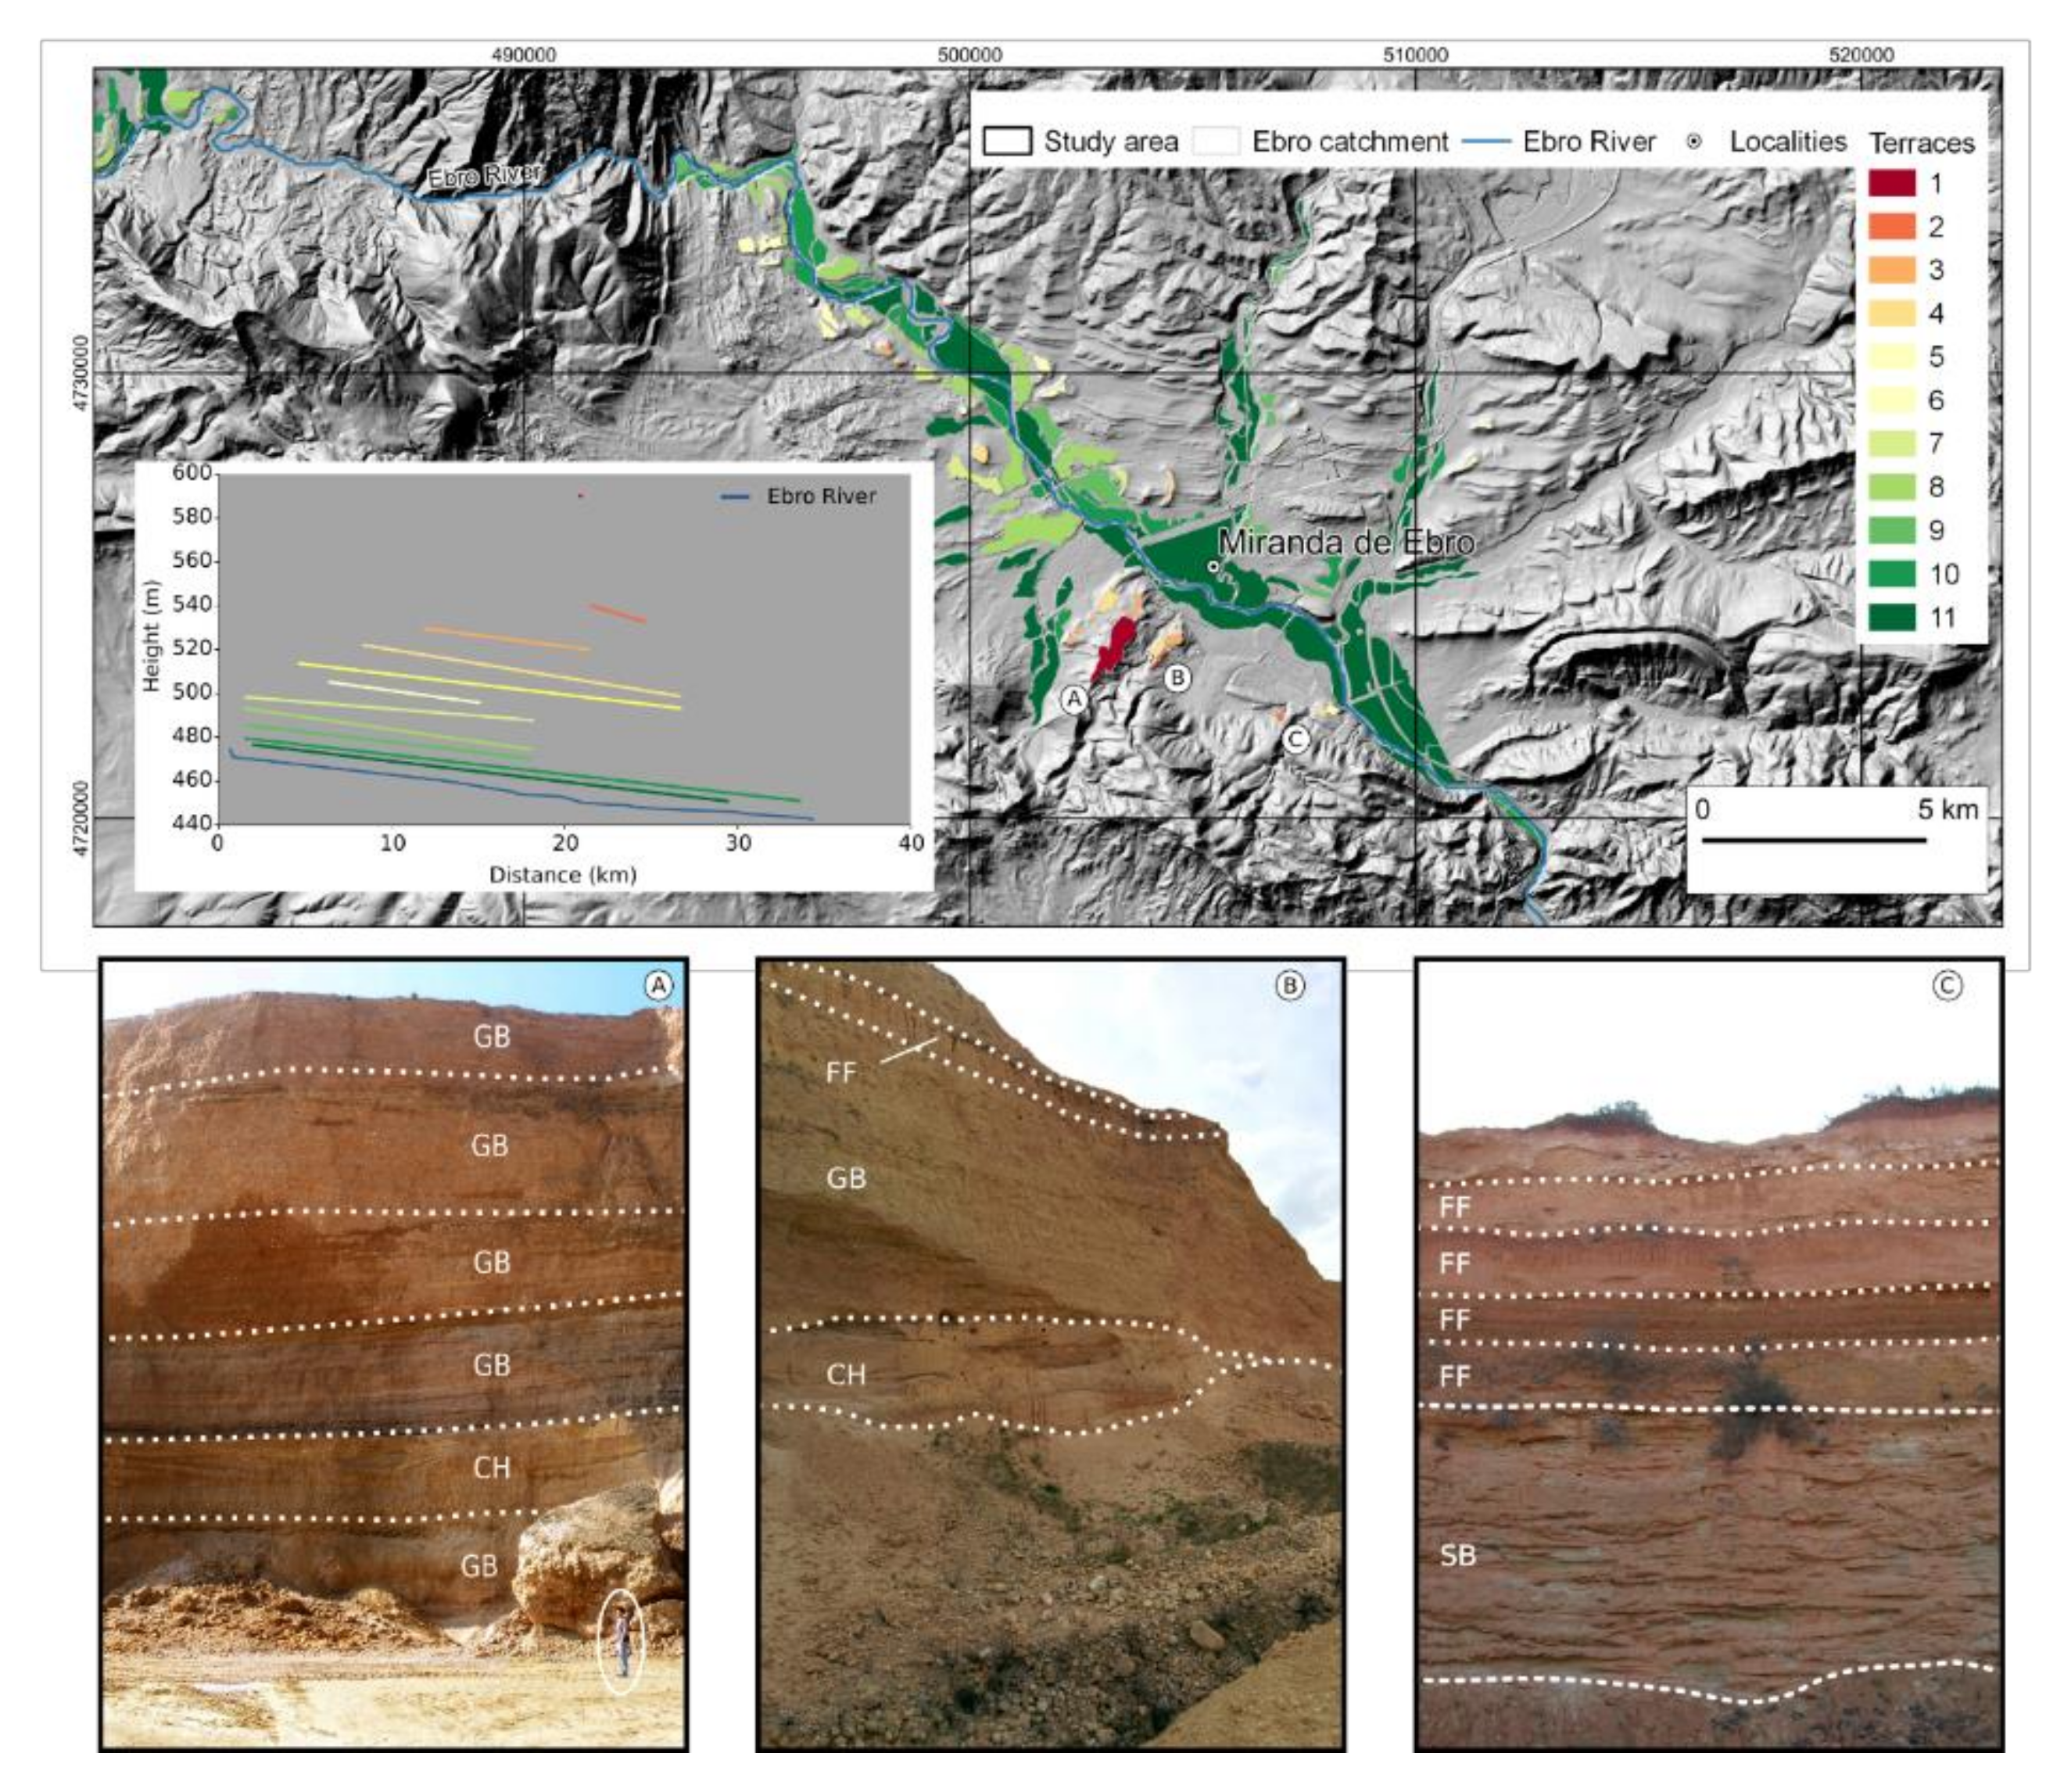
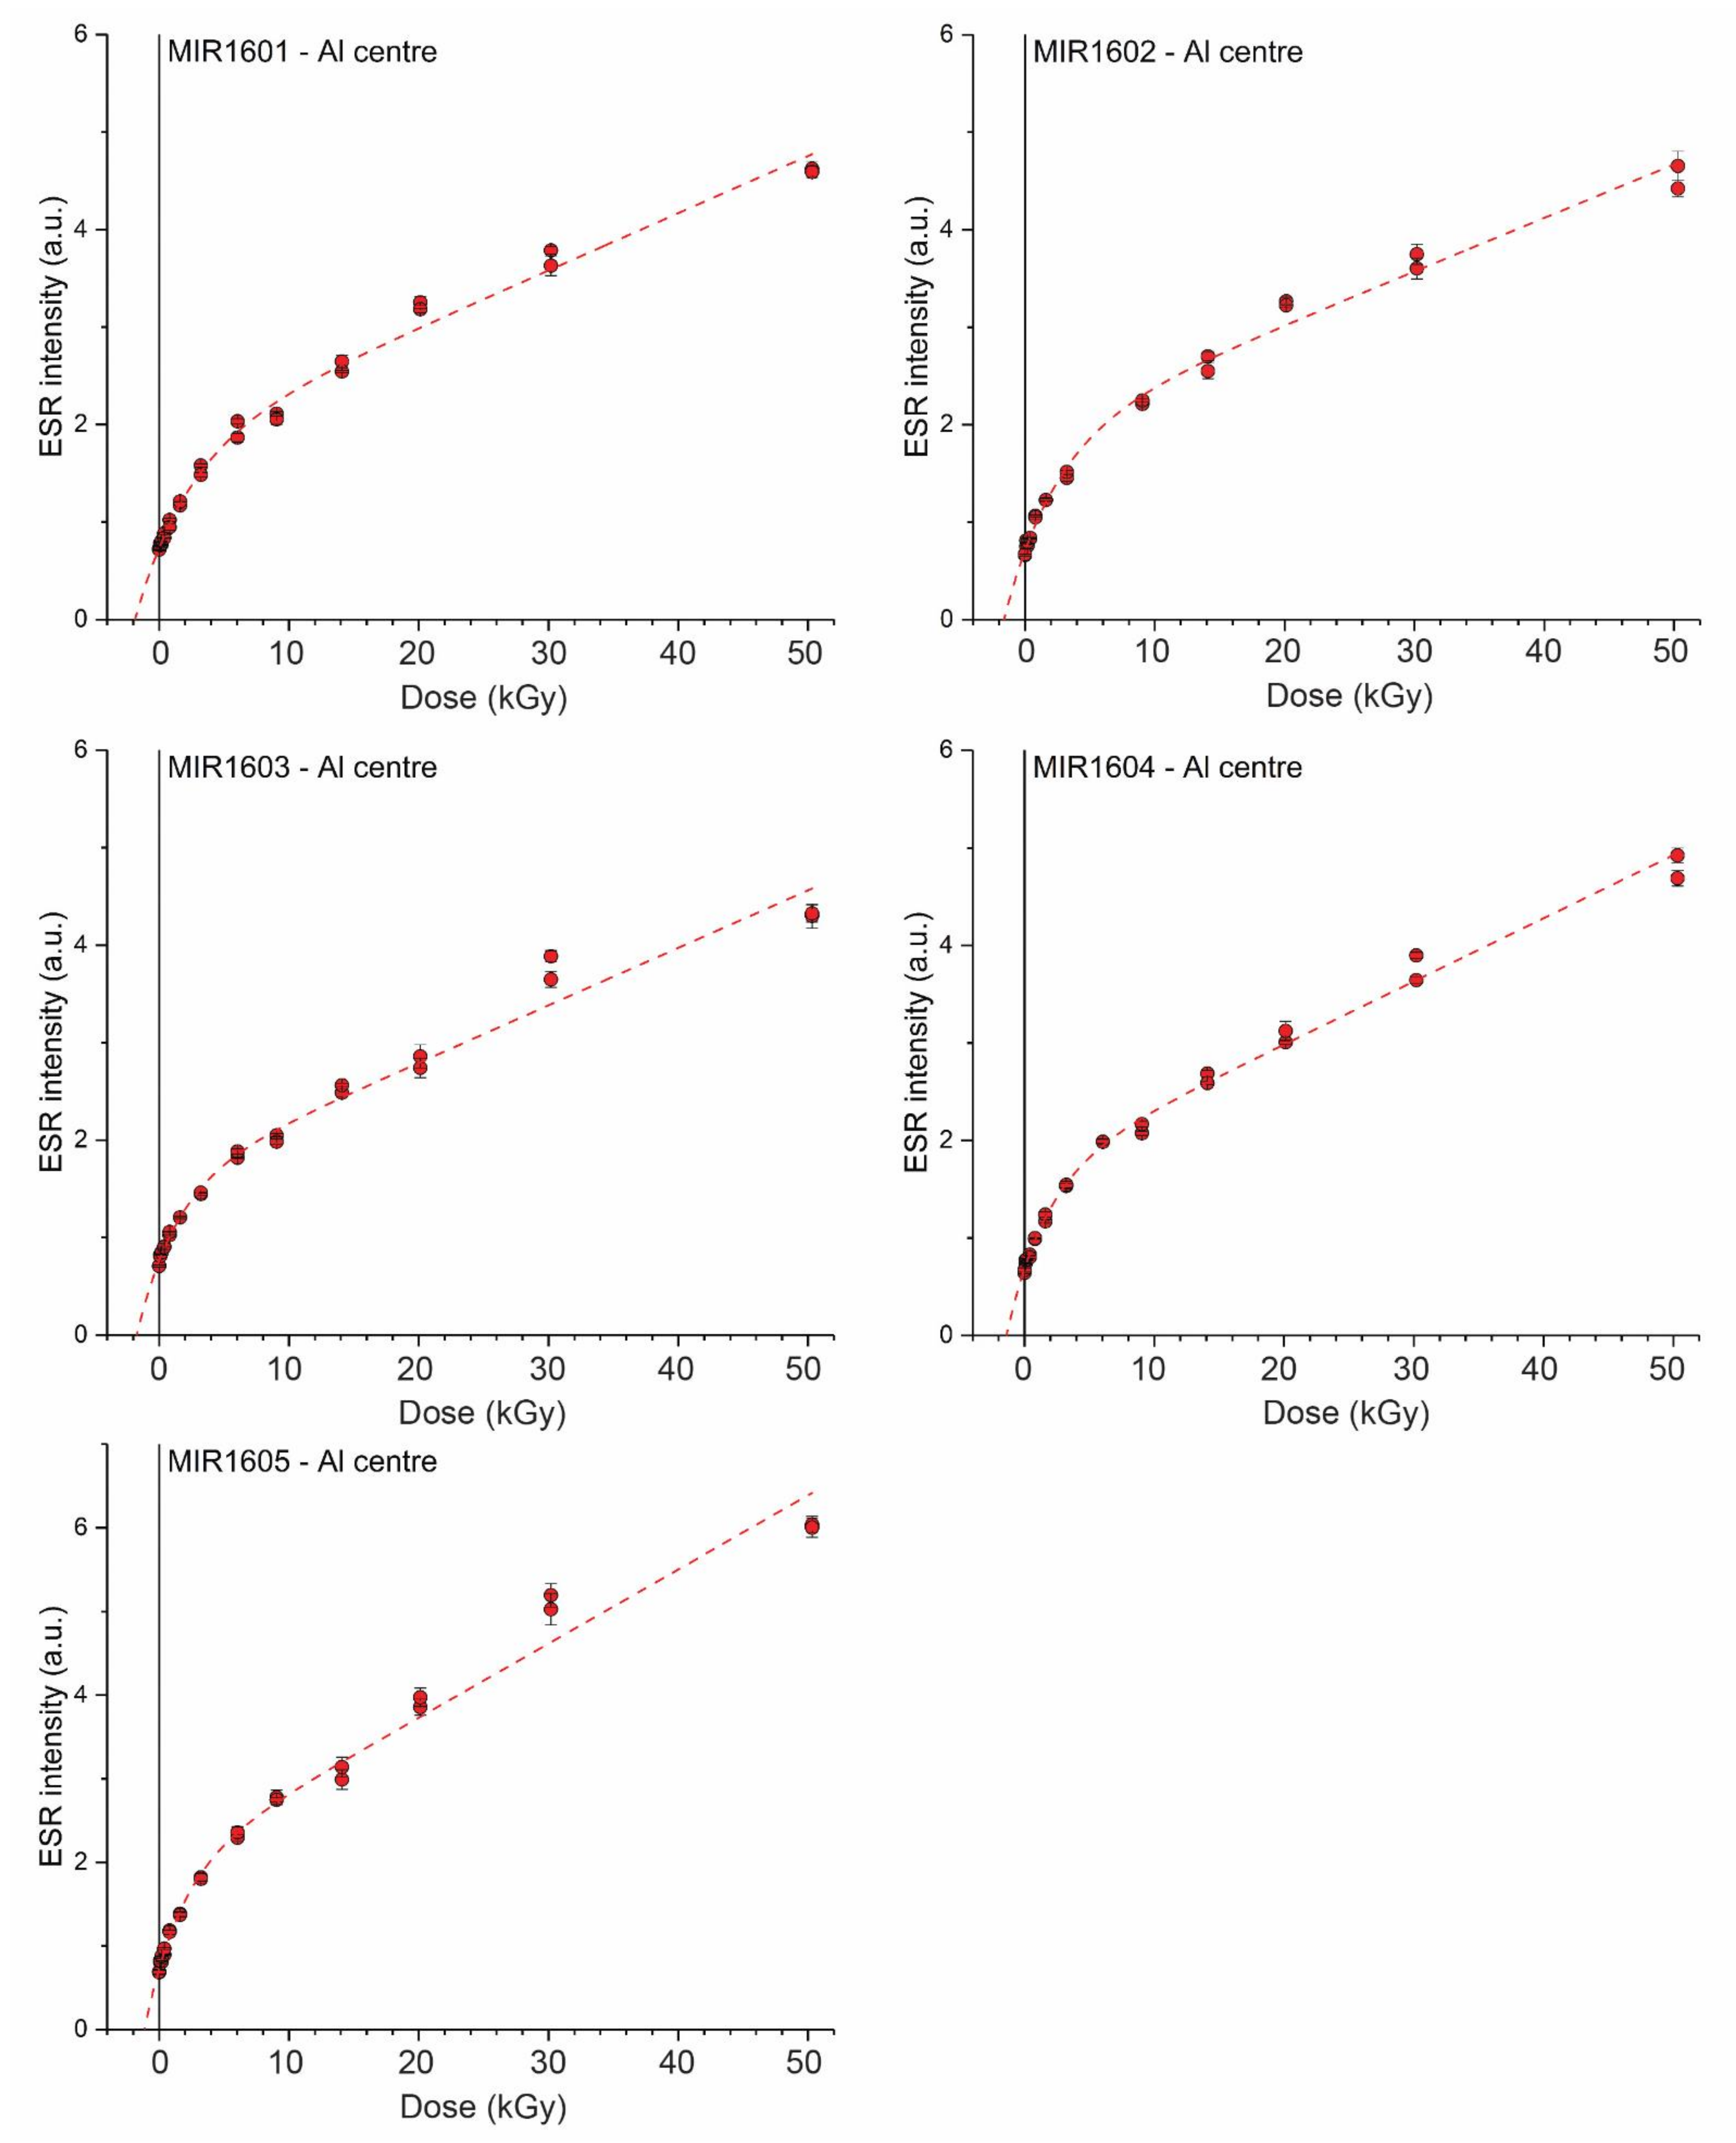
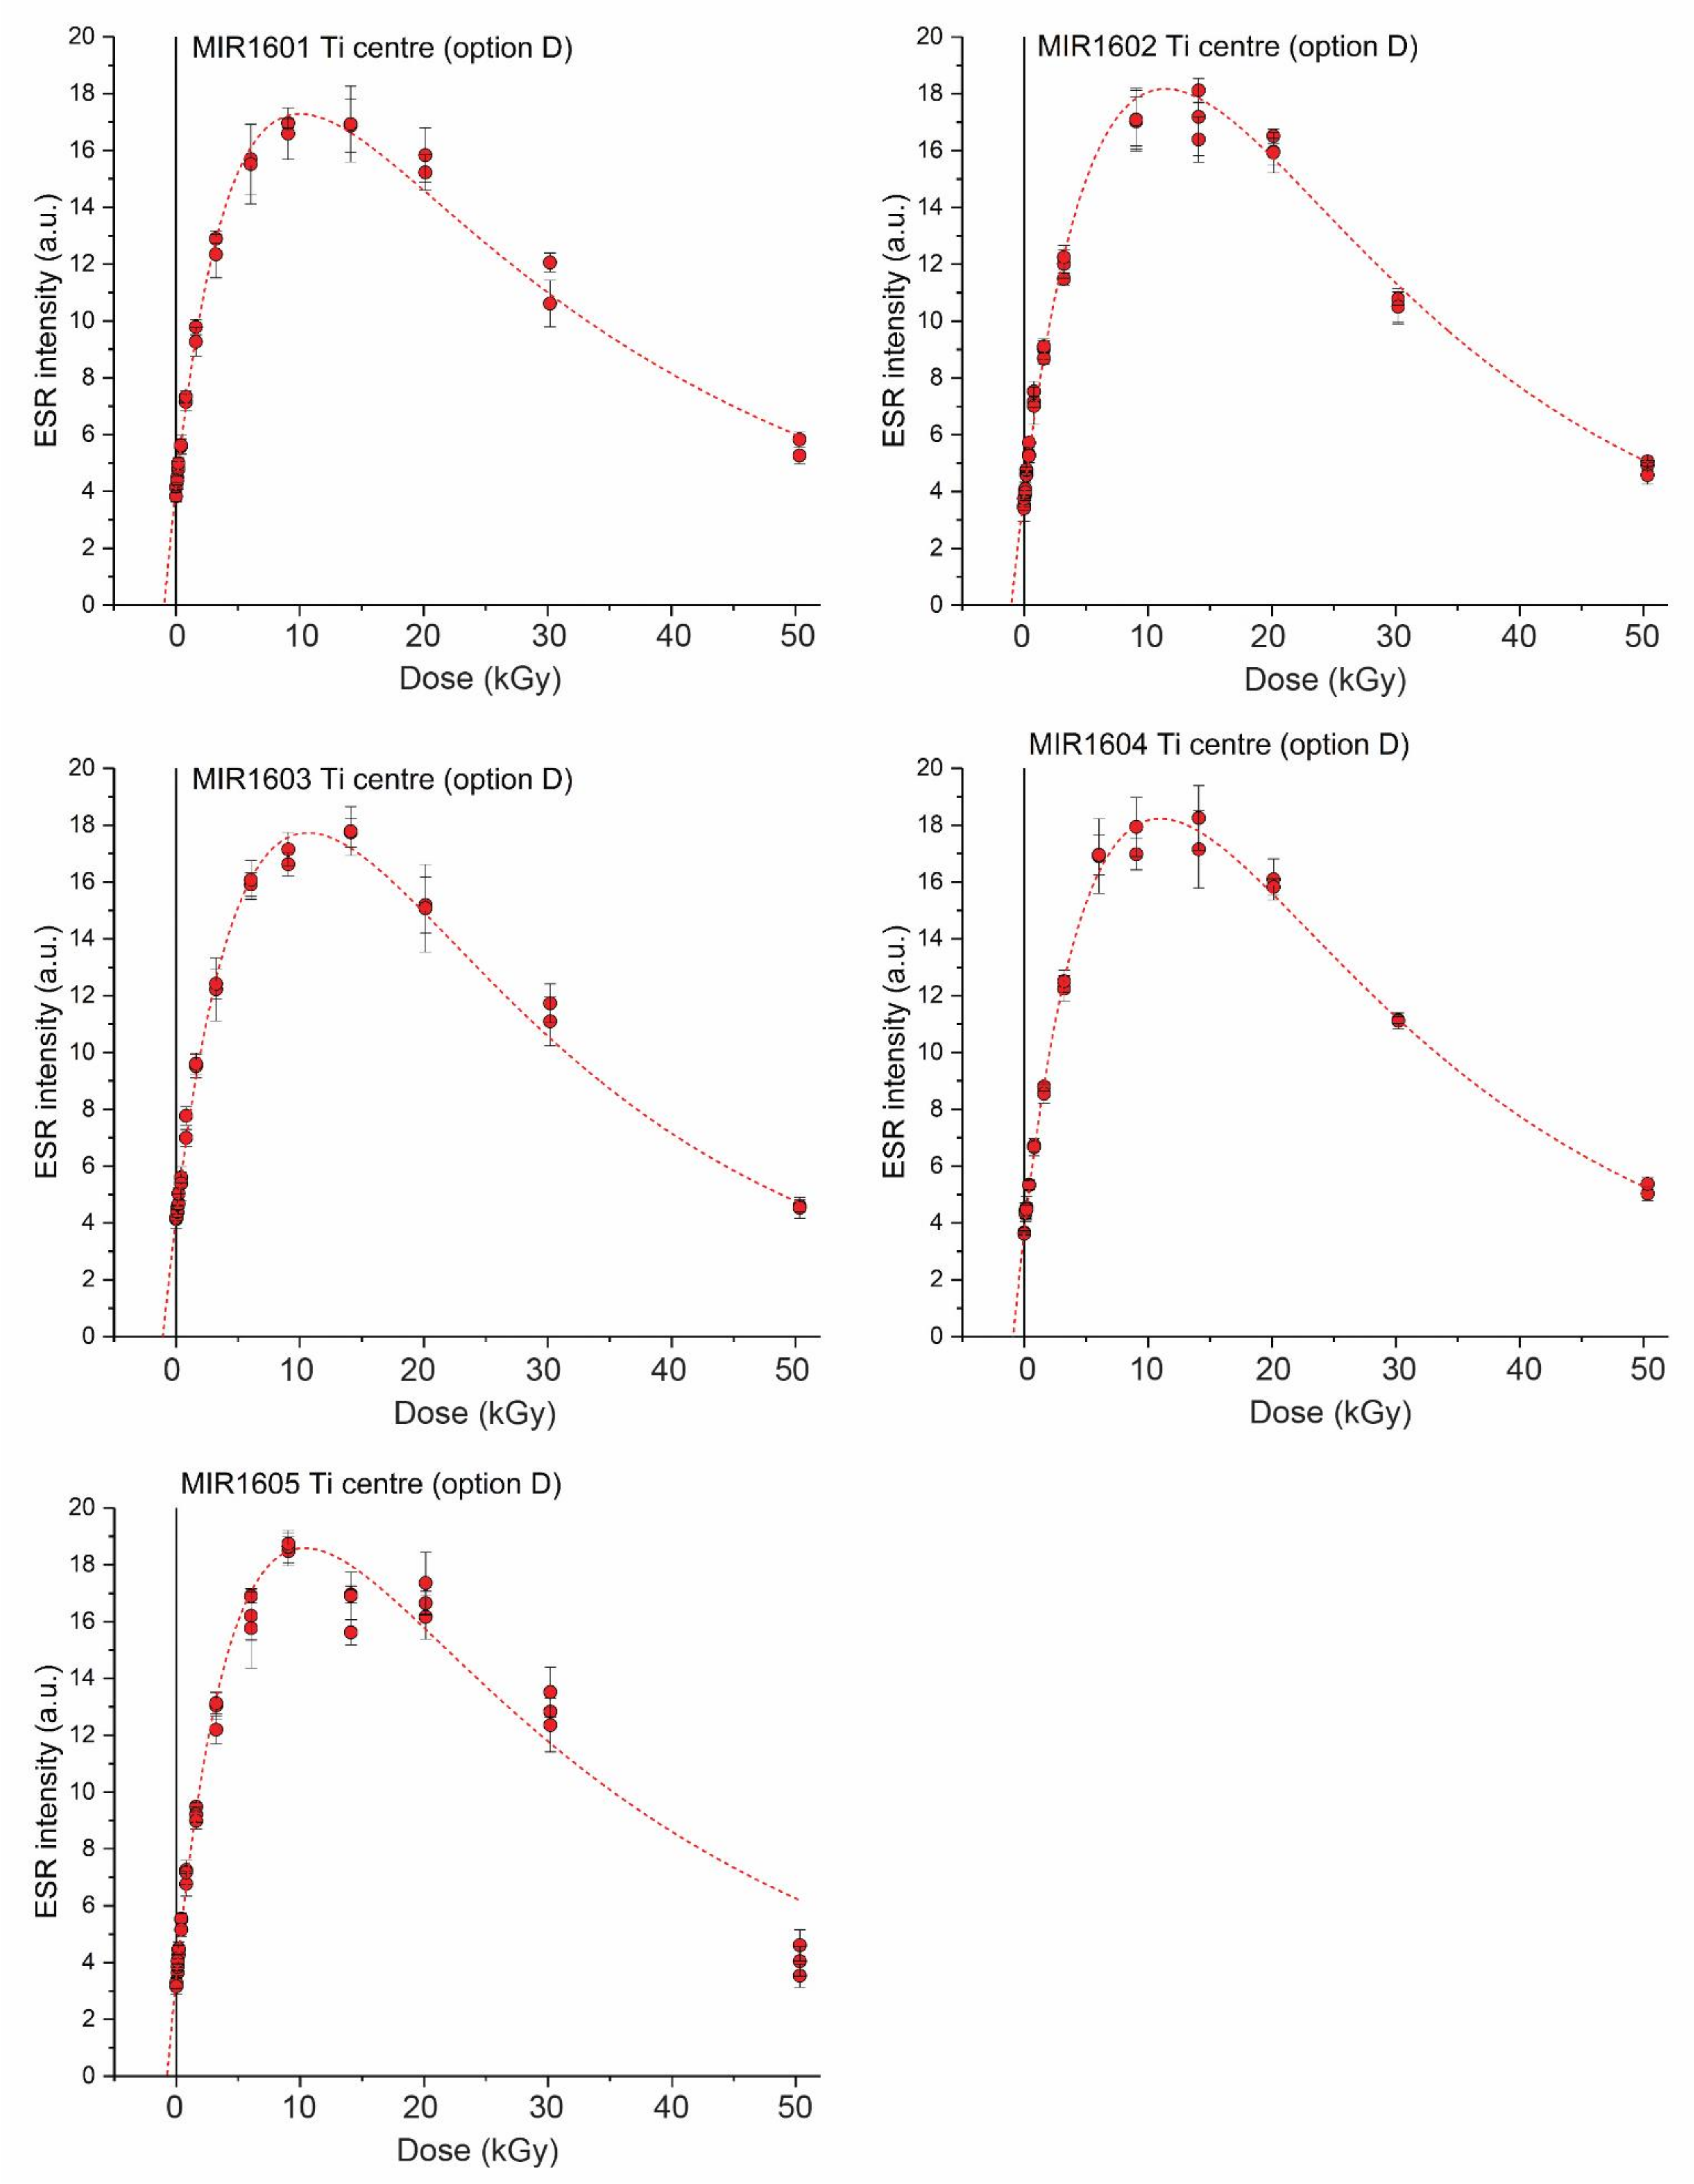
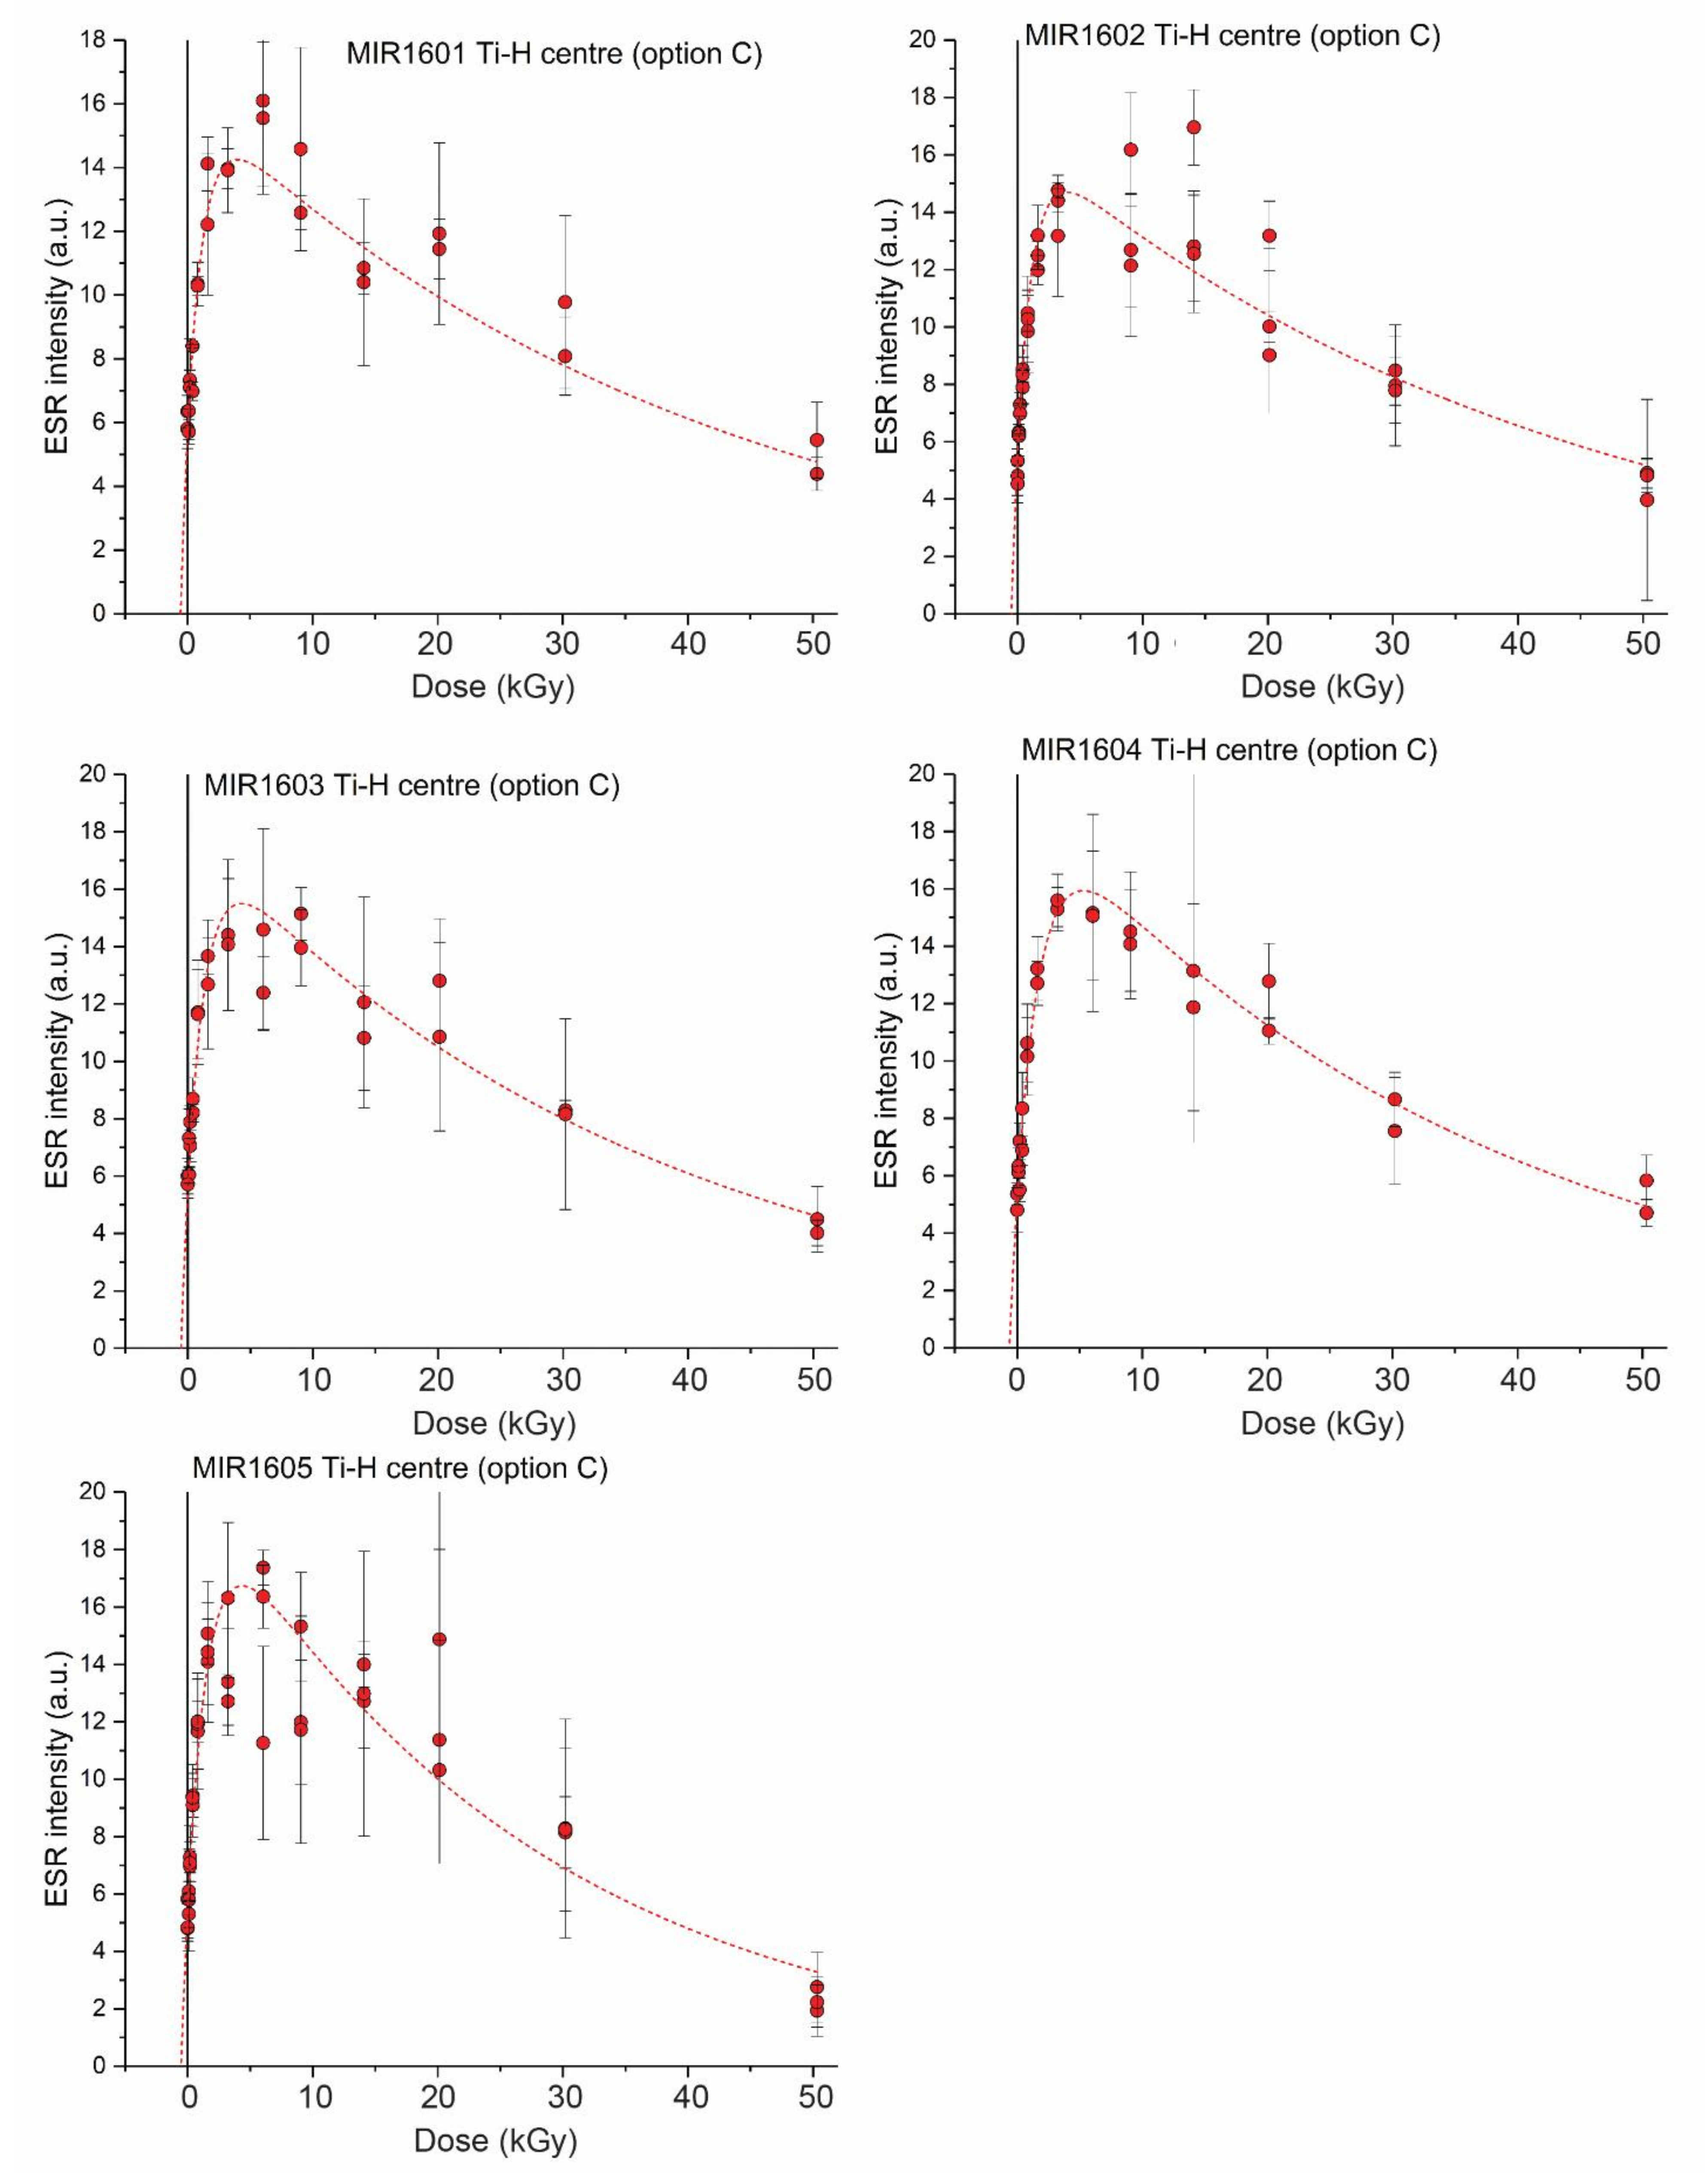
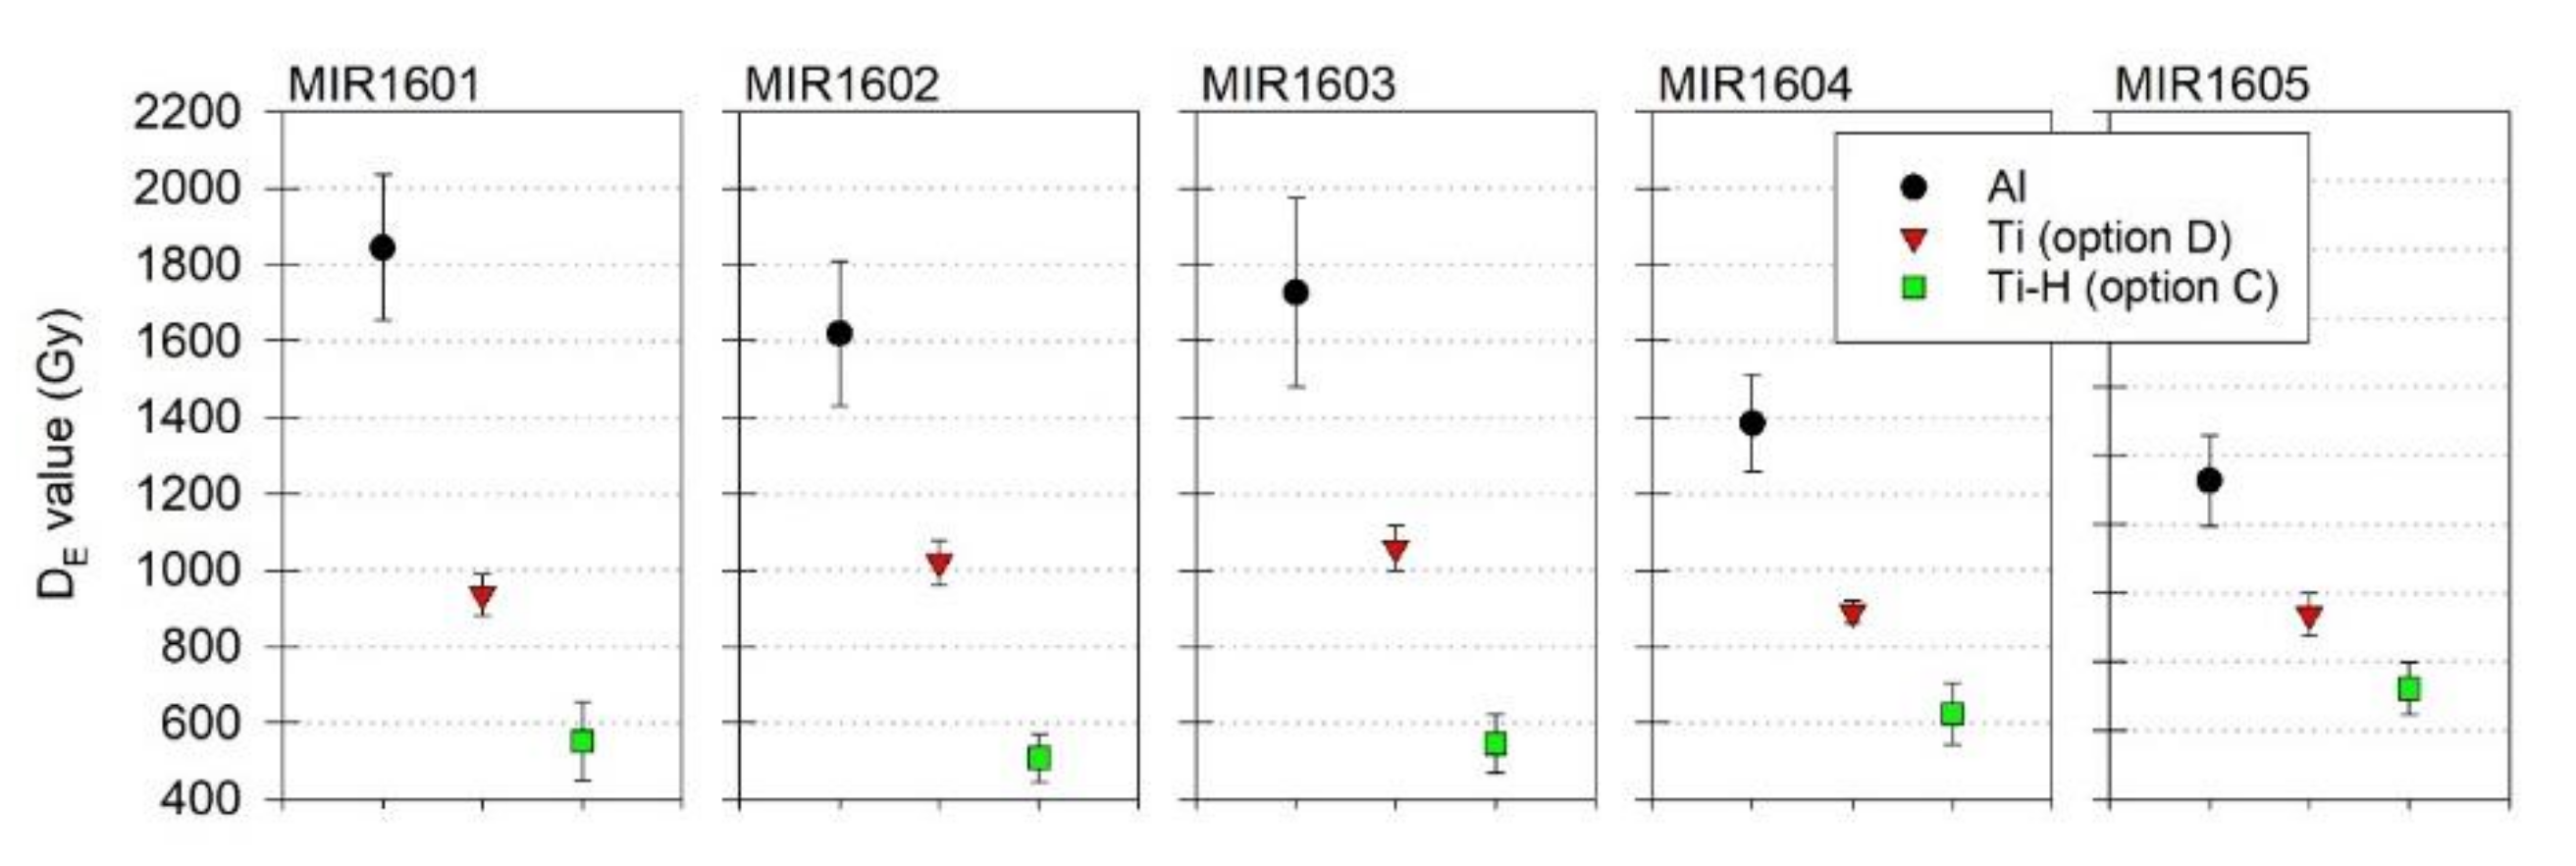
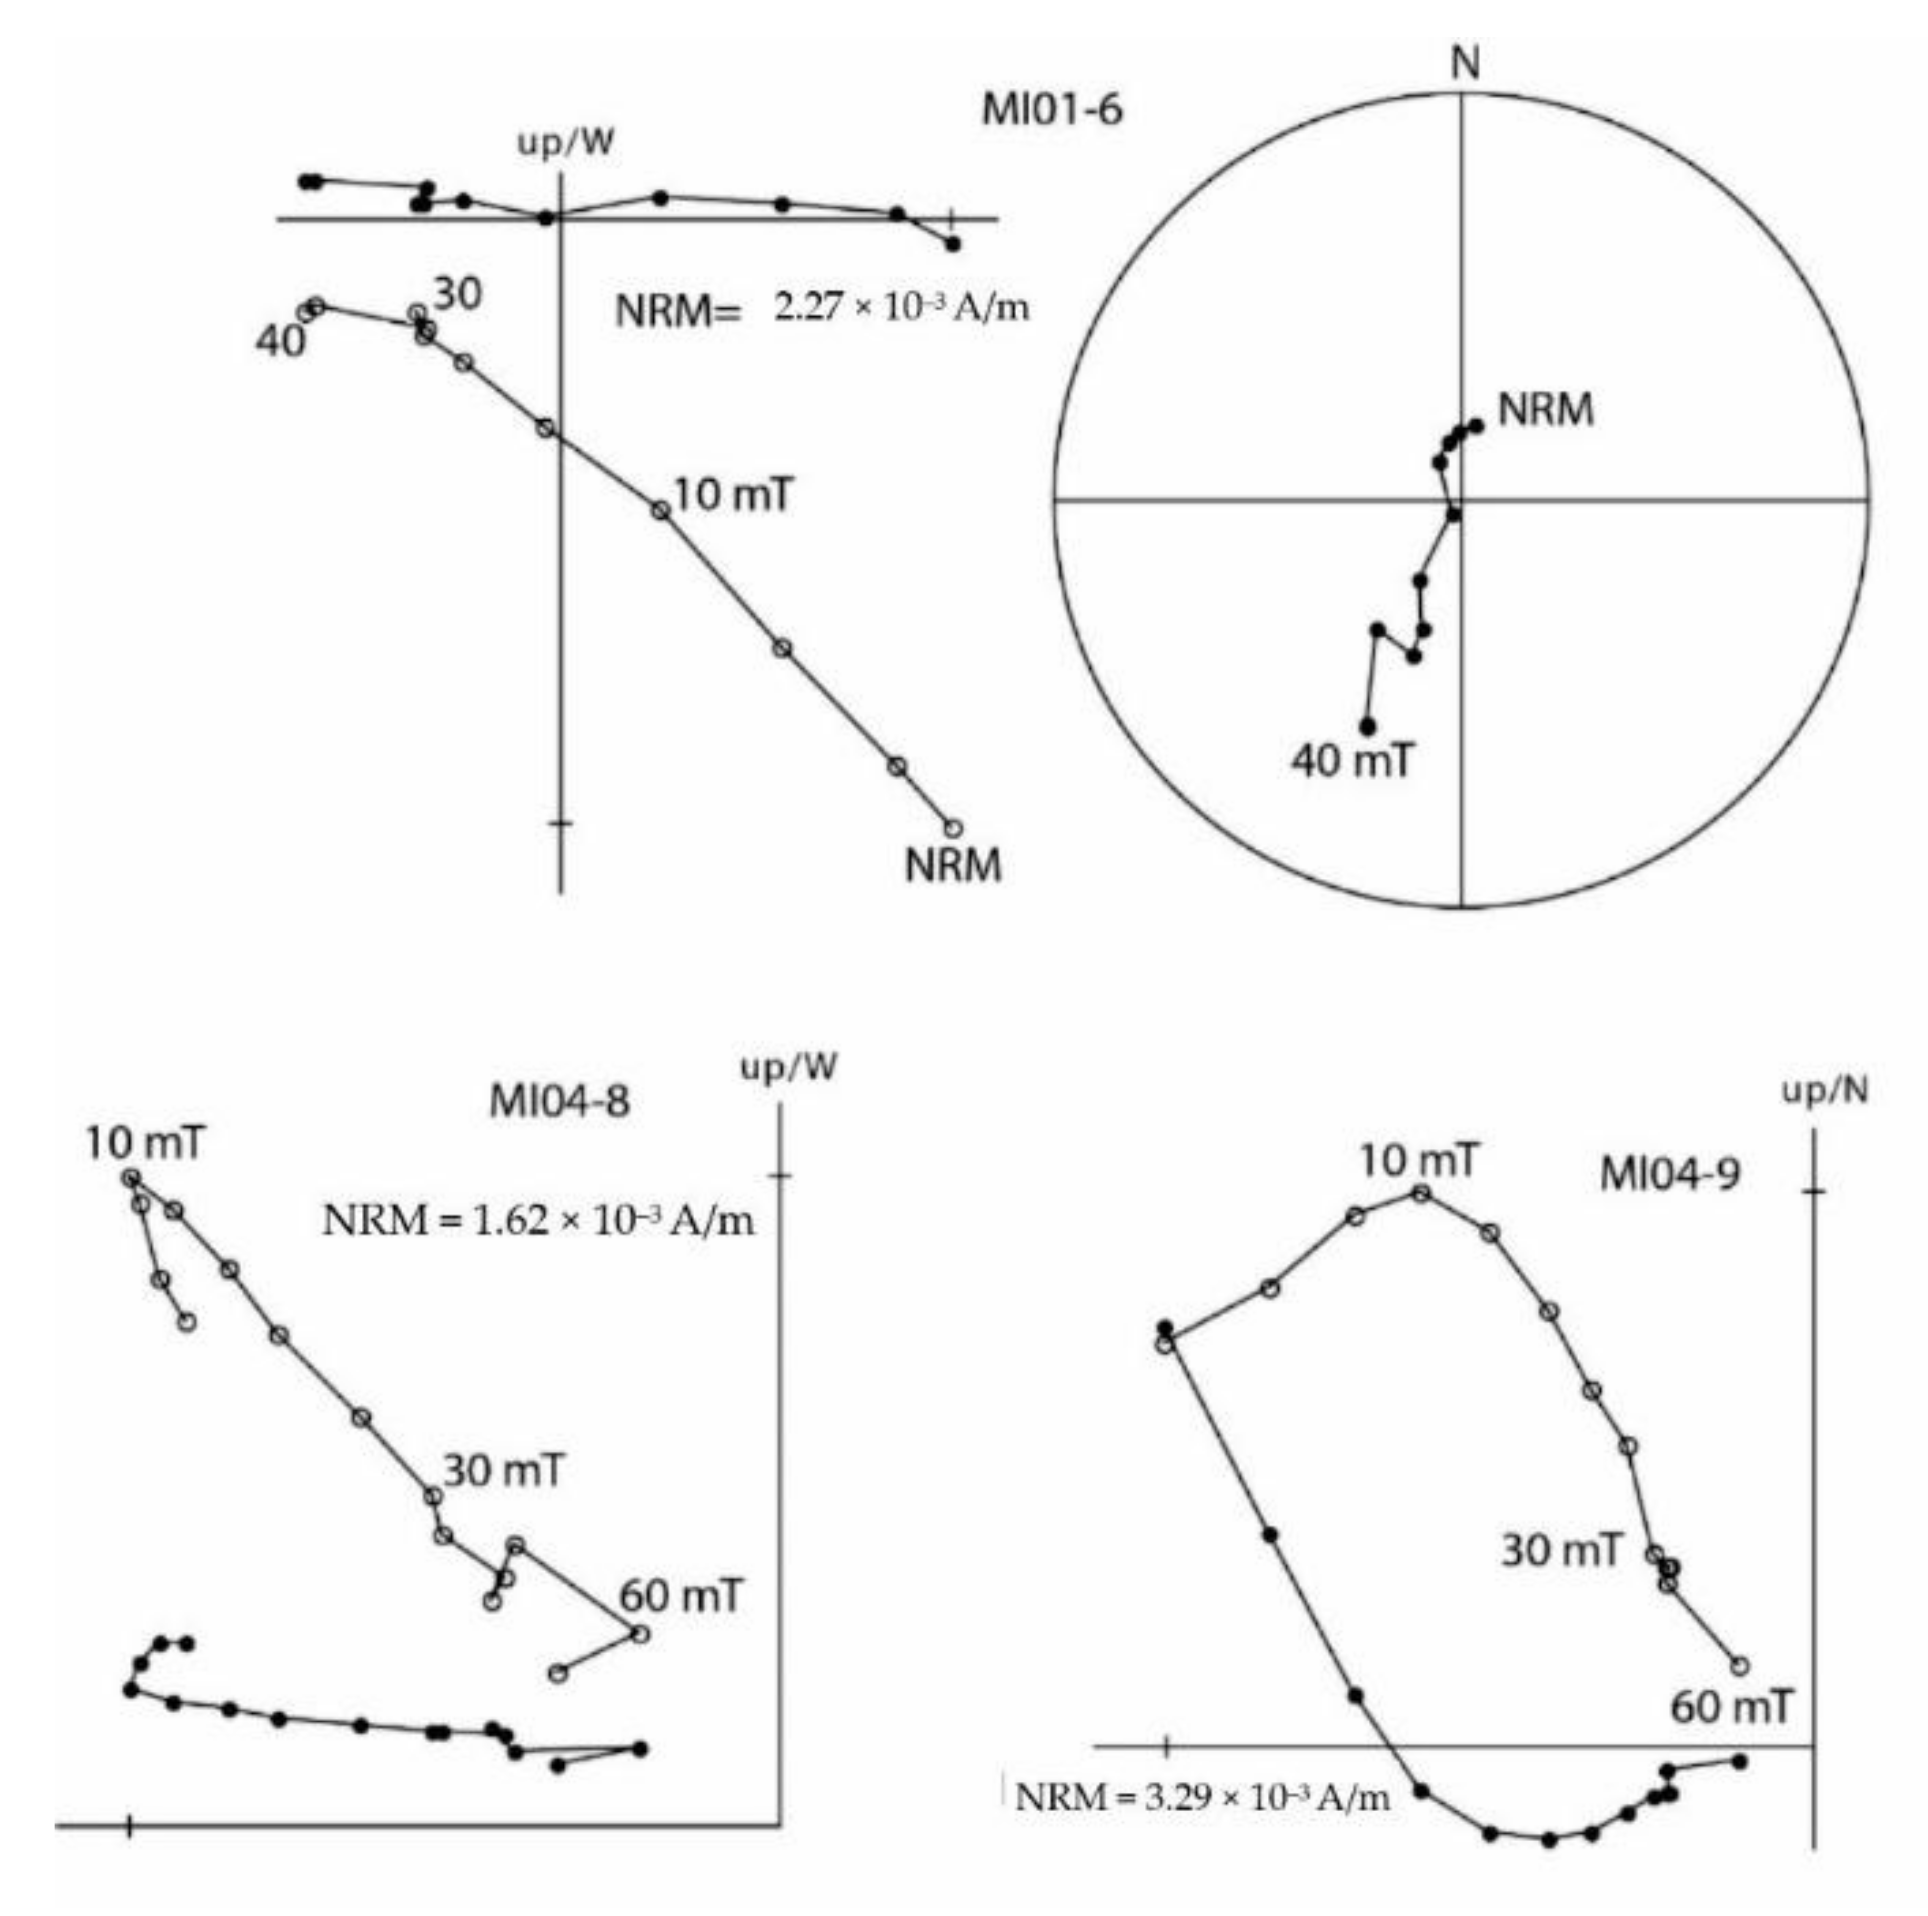
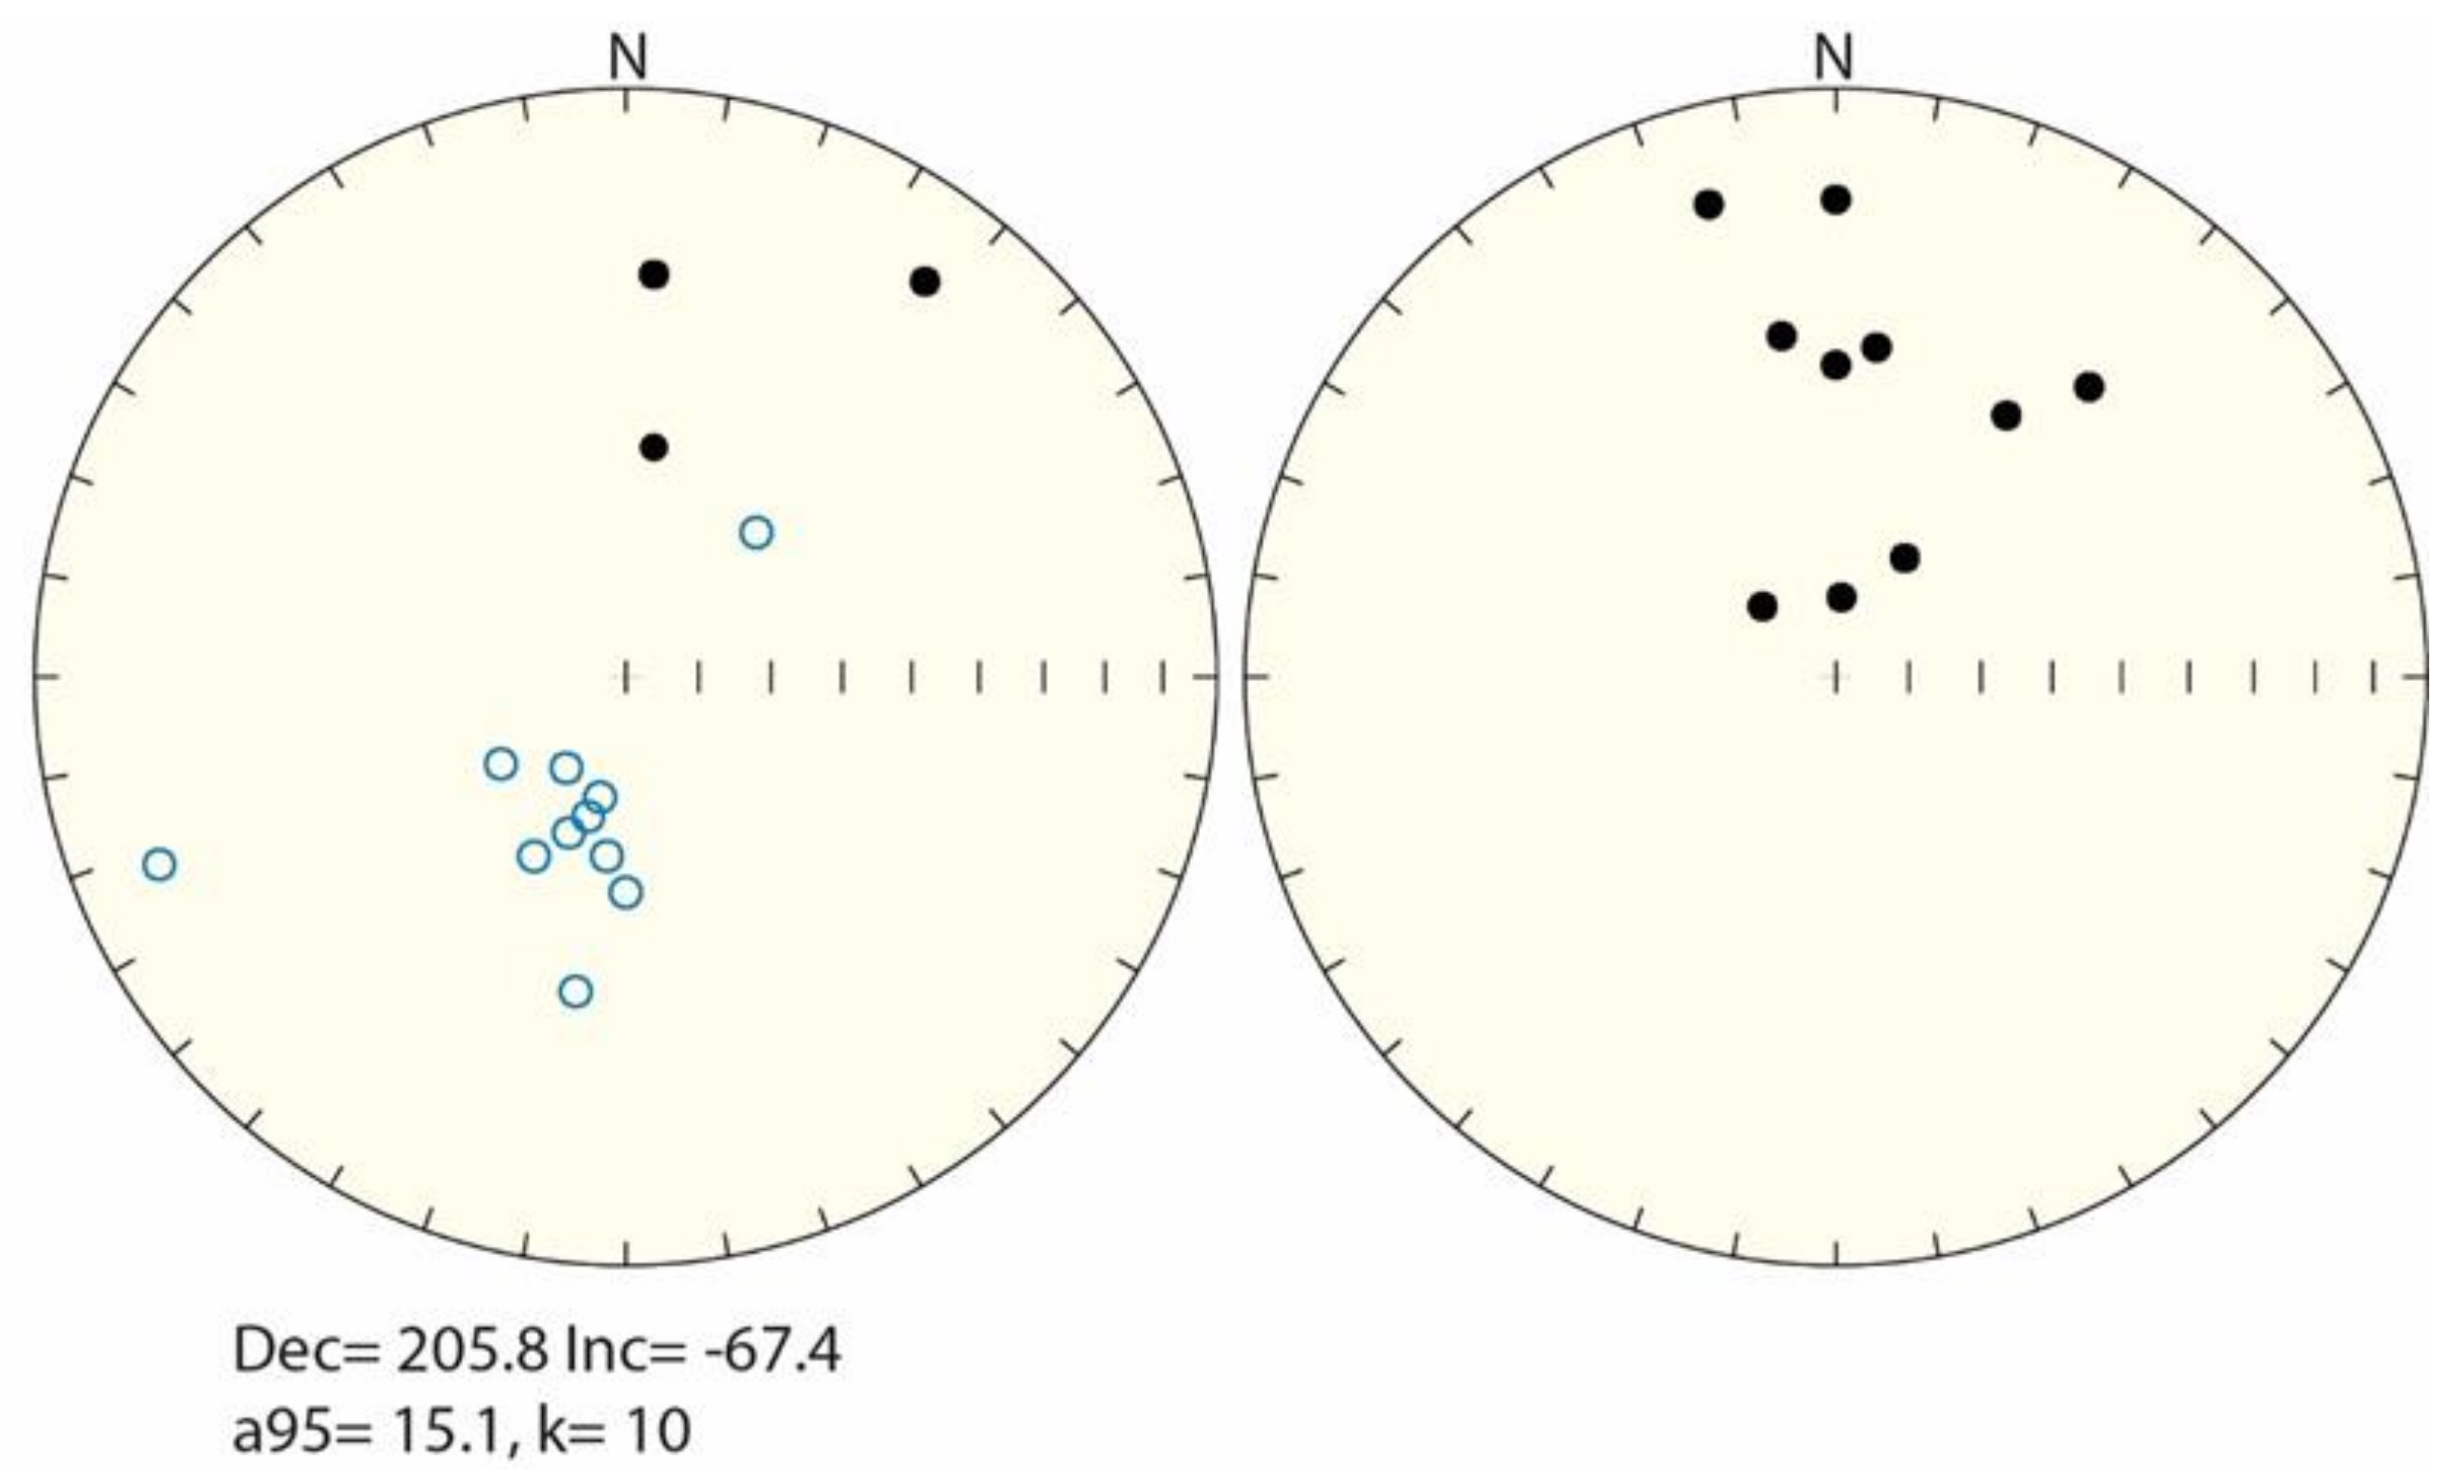
Table 1.
Sample location and details of studied fluvial terraces.
| Terrace | Reference | XUTM_ETRS89 | YUTM_ETRS89 | Locality Name |
|---|---|---|---|---|
| +140 | MIR1601 (ESR) | 503314.576 | 4723923.001 | Monte Miranda–Yarritu |
| +140 | MI01 (PALEOM) | 503316.091 | 4723925.376 | Monte Miranda–Yarritu |
| +140 | MIR1602 (ESR) | 503298.688 | 4723952.658 | Monte Miranda–Yarritu |
| +90 | MIR1603 (ESR) | 504231.436 | 4723688.093 | Monte Miranda–Arinorsa |
| +90 | MI03 (PALEOM) | 504174.357 | 4723586.316 | Monte Miranda–Arinorsa |
| +90 | MIR1604 (ESR) | 504015.477 | 4723457.004 | Monte Miranda–Arinorsa |
| +85 | MIR1605 (ESR) | 506873.260 | 4722368.272 | Aeródromo Miranda |
| +85 | MI05 (PALEOM) | 506875.053 | 4722368.512 | Aeródromo Miranda |
Table 2.
ESR data derived from measurement of Al center. Bleaching coefficient is expressed as relative difference between ESR intensities of natural and bleached aliquots. Repeatability of ESR intensities is assessed through variability (1 relative standard deviation) of mean ESR intensities obtained after each day of measurement. Similarly, repeatability of DE values corresponds to variability (1 relative standard deviation) of DE values calculated for each day of measurement.
| Sample | Repeated Measurements | Bleaching Coefficient (%) | Repeatability of ESR Intensities (%) | Repeatability of DE Estimates (%) | Adjusted r2 | DE Value (Gy) |
|---|---|---|---|---|---|---|
| MIR1601 | 2 | 49.1 ± 1.3 | 1.8% | 5.8% | 0.992 | 1844 ± 191 |
| MIR1602 | 2 | 50.9 ± 1.1 | 1.9% | 2.6% | 0.989 | 1620 ± 189 |
| MIR1603 | 2 | 50.6 ± 1.4 | 2.2% | 1.0% | 0.988 | 1727 ± 247 |
| MIR1604 | 2 | 49.4 ± 1.9 | 2.3% | 3.4% | 0.994 | 1385 ± 126 |
| MIR1605 | 2 | 50.0 ± 2.1 | 0.7% | 15.4% | 0.990 | 1127 ± 133 |
Table 3.
ESR data derived from measurement of Ti centers. Repeatability of ESR intensities is assessed through variability (1 relative standard deviation) of mean ESR intensities obtained after each day of measurement. Similarly, repeatability of DE values corresponds to variability (1 relative standard deviation) of DE values calculated for each day of measurement.
| Option D (Mixture of Ti-Li and Ti-H) | Option C (Pure Ti-H) | ||||||||
|---|---|---|---|---|---|---|---|---|---|
| Sample | Repeated Measurements | Repeatability of ESR Intensities (%) | Repeatability of DE Estimates (%) | Adjusted r2 | DE Value (Gy) | Repeatability of ESR Intensities (%) | Repeatability of DE Estimates (%) | Adjusted r2 | DE Value (Gy) |
| MIR1601 | 2 | 4.6 | 7.9 | 0.994 | 936 ± 51 | 0.7 | 14.9 | 0.908 | 553 ± 101 |
| MIR1602 | 3 | 1.1 | 8.3 | 0.987 | 1021 ± 54 | 3.0 | 15.7 | 0.973 | 508 ± 61 |
| MIR1603 | 2 | 0.1 | 0.3 | 0.993 | 1058 ± 54 | 11.1 | 7.1 | 0.947 | 546 ± 76 |
| MIR1604 | 2 | 0.6 | 2.5 | 0.997 | 890 ± 23 | 3.8 | 10.4 | 0.964 | 624 ± 78 |
| MIR1605 | 3 | 1.7 | 15.8 | 0.981 | 737 ± 61 | 4.1 | 38.1 | 0.929 | 523 ± 75 |
Table 4.
Radioelement concentrations measured from raw sediment by ICP-MS analysis. Laboratory gamma dose rate was calculated using dose rate conversion factors from [57], measured water content, and radioelement concentrations. In situ gamma dose rates are based on threshold approach. Probe employed indicated in parentheses.
| U (ppm) | Th (ppm) | K (%) | Measured Water Content (Wet Weight %) | Laboratory Gamma Dose Rate (µGy/a) | In Situ Gamma Dose Rate (µGy/a) | Laboratory/In Situ GDR Ratio | |
|---|---|---|---|---|---|---|---|
| MIR1601 | 0.75 ± 0.07 | 3.11 ± 0.14 | 0.87 ± 0.02 | 11.4 | 390 ± 43 | 373 ± 22 (NaI) | 1.05 |
| MIR1602 | 0.67 ± 0.07 | 2.26 ± 0.11 | 0.48 ± 0.01 | 7.3 | 276 ± 33 | 215 ± 13 (LaBr) | 1.28 |
| MIR1603 | 0.68 ± 0.07 | 2.40 ± 0.11 | 0.63 ± 0.02 | 4.2 | 329 ± 39 | 308 ± 18 (NaI) | 1.07 |
| MIR1604 | 0.71 ± 0.07 | 2.29 ± 0.11 | 0.45 ± 0.01 | 5.7 | 277 ± 32 | 315 ± 19 (NaI)/305 ± 18 (LaBr) | 0.88 |
| MIR1605 | 0.61 ± 0.07 | 1.67 ± 0.11 | 0.24 ± 0.01 | 2.9 | 197 ± 26 | 190 ± 11 (NaI) | 1.04 |
Table 5.
Detail of ESR age estimates and dose rate components. Errors are 1 sigma. Note that DE errors are a combination of fitting errors (from Table 1 and Table 2) and gamma source dose rate (2.3%).
| Sample | MIR1601 | MIR1602 | MIR1603 | MIR1604 | MIR1605 |
|---|---|---|---|---|---|
| Fluvial terrace (height above current channel) | T1 (+140 m) | T1 (+140 m) | +90 m | +90 m | +85 m |
| Depth (m) | 20 ± 2 | 20 ± 2 | 20 ± 2 | 20 ± 2 | 12 ± 2 |
| Measured water content (% wet weight) | 11.4 | 7.3 | 4.2 | 5.7 | 2.9 |
| Assumed water content (% wet weight) | 15 ± 5 | 15 ± 5 | 15 ± 5 | 15 ± 5 | 15 ± 5 |
| Internal dose rate (µGy/a) | 30 ± 10 | 30 ± 10 | 30 ± 10 | 30 ± 10 | 30 ± 10 |
| Alpha dose rate (µGy/a) | 16 ± 14 | 13 ± 11 | 13 ± 11 | 13 ± 11 | 10 ± 9 |
| Beta dose rate (µGy/a) | 667 ± 53 | 404 ± 32 | 500 ± 40 | 389 ± 31 | 238 ± 20 |
| Gamma dose rate (µGy/a) | 356 ± 31 | 195 ± 17 | 269 ± 24 | 281 ± 25 | 164 ± 14 |
| Cosmic dose rate (µGy/a) | 25 ± 3 | 25 ± 3 | 25 ± 3 | 25 ± 3 | 25 ± 3 |
| Total dose rate (µGy/a) | 1094 ± 86 | 667 ± 57 | 838 ± 58 | 737 ± 61 | 467 ± 44 |
| DE (Gy) Al center | 1844 ± 196 | 1620 ± 193 | 1727 ± 250 | 1385 ± 130 | 1127 ± 136 |
| DE (Gy) Ti center (option D) | 936 ± 55 | 1021 ± 59 | 1058 ± 59 | 890 ± 31 | 737 ± 63 |
| DE (Gy) Ti-H center (option C) | 553 ± 102 | 508 ± 62 | 546 ± 77 | 624 ± 79 | 523 ± 76 |
| Age (ka) Al center | 1686 ± 221 | 2430 ± 353 | 2061 ± 340 | 1878 ± 233 | 2414 ± 364 |
| Age (ka) Ti center (option D) | 856 ± 83 | 1531 ± 155 | 1263 ± 123 | 1207 ± 106 | 1579 ± 198 |
| Age (ka) Ti-H center (option C) | 506 ± 39 | 762 ± 63 | 652 ± 52 | 846 ± 68 | 1120 ± 163 |
Table 6.
Paleomagnetic data. Declination/inclination: mean characteristic remanent magnetization direction; A95: radius of cone of 95% confidence; kappa: Fisher dispersion parameter around the mean; N: number of samples used in statistics; HC/LC: high/low coercivity component of magnetization. Sites MI02 and MI03 did not provide any results.
| Sampling Site | Declination | Inclination | A95 | Kappa | N |
|---|---|---|---|---|---|
| MI01 | 18.0 | 38.0 | 44.3 | 9 | 3 |
| MI02 | |||||
| MI03 | |||||
| MI04 (HC) | 205.8 | -67.4 | 15.1 | 10 | 11 |
| MI04 (LC) | 5.0 | 54.7 | 18.5 | 7 | 11 |
Publisher’s Note: MDPI stays neutral with regard to jurisdictional claims in published maps and institutional affiliations. |
© 2021 by the authors. Licensee MDPI, Basel, Switzerland. This article is an open access article distributed under the terms and conditions of the Creative Commons Attribution (CC BY) license (https://creativecommons.org/licenses/by/4.0/).
Share and Cite
MDPI and ACS Style
Parés, J.M.; Duval, M.; Soria-Jáuregui, A.; González-Amuchástegui, M.J. First Chronological Constraints for the High Terraces of the Upper Ebro Catchment. Quaternary 2021, 4, 25. https://0-doi-org.brum.beds.ac.uk/10.3390/quat4030025
AMA Style
Parés JM, Duval M, Soria-Jáuregui A, González-Amuchástegui MJ. First Chronological Constraints for the High Terraces of the Upper Ebro Catchment. Quaternary. 2021; 4(3):25. https://0-doi-org.brum.beds.ac.uk/10.3390/quat4030025
Chicago/Turabian StyleParés, Josep M., Mathieu Duval, Angel Soria-Jáuregui, and María José González-Amuchástegui. 2021. "First Chronological Constraints for the High Terraces of the Upper Ebro Catchment" Quaternary 4, no. 3: 25. https://0-doi-org.brum.beds.ac.uk/10.3390/quat4030025