Systematic Innovation Based BPR Regime—A Factors Analysis


Graduate School, Tohoku University of Community Service and Science, Tsuruoka 997-0035, Japan
*
Author to whom correspondence should be addressed.
Appl. Syst. Innov. 2020, 3(4), 50; https://0-doi-org.brum.beds.ac.uk/10.3390/asi3040050
Submission received: 12 October 2020
/
Revised: 10 November 2020
/
Accepted: 11 November 2020
/
Published: 13 November 2020
(This article belongs to the Collection Feature Paper Collection in Applied System Innovation)
Abstract
:Sri Lankan public services have a lingering colonial legacy, and there have been several efforts since the country’s independence to break away from the restraints of the past to align them with modern times and expectations. The drive for modernization of public services passed through several phases of experimentation without much success in the past. A significant attempt at the modernization of public services was made in the first decade of this millennium; we now notice substantial changes in public service delivery (PSD) in the country. In this paper, we assess the impact of an inside-outside-inside (IOI)-based open system innovation-related business process reengineering (BPR) regime adapted for reforms in the organization and the delivery of public services in the country. We carried out an input and output analysis of the BPR regime, adopted by various departments and ministries of the government of Sri Lanka to improve the PSD infrastructure. A broad-based ground survey on a five-point Likert scale was carried out, and performance data were collected. We collected a total of 290 responses—each questionnaire was composed of 40 questions regarding the inputs and the outputs of the regime’s implementation. Applying an ordered multivariate logistic regression model, we have attempted to estimate correlations amongst inputs, results, and overall perception of success or failure of the BPR regime across 29 departments and ministries (D&M). We have tabulated summary statistics and regression results to assess the relative significance of various regime inputs and their impact on the corresponding outcomes. The outcomes suggest that while all inputs and outputs are significantly correlated, some inputs have a more significant effect on the results expected from the BPR regime. We have used original data acquired through a survey carried out directly through the PSD organizations in the country, and this study is the first of its kind in this regard. We expect this study will be of high utility to the personnel engaged in the planning and implementation of PSD through systematic innovation and BPR, not only in Sri Lanka but also for many other professionals and researchers who are engaged in designing and execution of similar service improvements and reengineering strategies in different countries around the world.
1. Introduction
Sri Lankan public services have a lingering colonial legacy, and there have been several efforts since the country’s independence to break away from the shackles of the past to align them with modern times and expectations. The drive for modernization of public services has been through several attempts in the past without much success. However, a significant effort was undertaken in the first decade of this millennium, resulting in noticeable changes in public service delivery (PSD) in the country. Delivering public services in Sri Lanka has been the domain of many organizations established before and after the independence of the country from British colonial rule. In 1972, Sri Lanka Administrative Services (SLAS) was formed, which was a replacement to an earlier entity, Ceylon Administrative Services (CAS). CAS was established in 1963 in place of a much older service organization, Ceylon Civil Services (CCS), which was established by the colonial powers during the second half of the 19th century to service its colonial rule objectives. PSD is not the domain of any single organization in the country. According to Jehan et al., SLAS is an essential public service provider in Sri Lanka [1]. Jehan et al. also found in another study that PSD functions are executed by multiple layers of offices and administrators across several D&M [2].
An acceptable and modern concept of PSD has been a great challenge for the governments over time, and plans and efforts have been made many times to bring change and improvement in this domain. A long and vicious civil war resulted in the lack of continuity and half-hearted nature of many such reform efforts undertaken in the 20th century. The end of the Sri Lankan civil war in 2008 created an opportunity for real and far-reaching reforms in PSD. As a result of this peacetime opportunity and growing calls for reforms, aided by several international players and donors, the country undertook several major governance reform initiatives in the first decade of the 21st century. One major initiative taken was the BPR of public services in Sri Lanka. Most departments and ministries of Sri Lanka underwent a major but phased business process-reengineering (BPR) regime aided by inside-outside-inside (IOI)-based systematic innovation. While the BPR regime covered many areas of public service efficiency, three areas of the BPR regime, i.e., (i) structural reforms, (ii) regulatory overhaul, and (iii) better performance control mechanisms are the cornerstones of this regime. Ten years have passed since the regime was first planned and executed. By 2010, the BPR regime took a noticeable profile in the form of policies and actions with a strategic outlook. These measures, in turn, resulted in the creation as well as the elimination of several D&M across Sri Lanka. The Reengineering Government Program (Re-Gov) started with a blueprint issued in 2004 and sketched a detailed BPR process of public services. The BPR process was outlined in a program named “Program D” with 24 initiatives (D1-D24) in various areas of governance targeted in Sri Lanka [3]. These measures were revealed in the eGovernment Strategy document prepared by Sri Lanka’s Information and Communication Technology Agency (ICTA) in 2013 [4]. Now, after ten years of the implementation of the BPR regime, it seems desirable to evaluate the outcome of the reform effort. No studies have been conducted on the input–output relationship to assess the suitability of this reform regime in the country, and none have used the analytical approach we use here. We analyze the correlations among the inputs, outputs, and overall perception of success or failure of the BPR regime across multiple ministries and departments of the Sri Lankan government. This study also allows us to test the efficacy of IOI-based systematic innovation ingrained in the regime. In order to do this, we need to address the primary research questions in this paper, as follows:
- What are the relationships amongst the various BPR measures (structure, rules, and control) and the outcomes (effectiveness) of the BPR regime?
- How are the outcomes perceived by employees, i.e., level of agreement/disagreement regarding the effectiveness of the BPR?
- What is the correlation amongst BPR measure per se, and how do they explain the inner structure of the BPR measures?
However, before we address these research questions, explain the analytical model, and discuss the results, it seems pertinent that we briefly discuss the concept of BPR in general and also, in the perspective of the country. In the next section, we do this, while taking a comprehensive stock of the literature on these topics.
2. Literature Review
As we stated earlier, the colonial heritage of the public service apparatus in Sri Lanka has historically been a significant impediment in the way of developing a more modern service. The country needed an overhaul of its administrative architecture in order to increase the effectiveness of the PSD system. As a prolonged civil war with Liberation Tigers of Tamil Eelam (LTTE) came to an end in 2008, the peacetime provided the country with an opportunity to push forward with a radical redesign of the administration, and align the system with the modern times and achieve better economic growth. Gyan noted that Sri Lanka’s economic “performance has been below its potential, and the unresolved civil conflict poses one of the greatest obstacles to its long terms growth prospects” [5]. Premachandra stated that the end of the ethnic conflict in Sri Lanka carried the great expectation of sustained economic gains in its wake; however, there are fears that a radical redesign and rethinking will not be put into place to address the issues [6]. It is evident that to analyze the BPR regime, we need to consider both the architecture as well as its utility. Resultingly, we must review the empirical literature that explains the design of a BPR regime as well the utility that it entails. Therefore, here first, we shall present empirical evidence regarding BPR design and then, the literature on the utility of BPR.
Ramasamy found that Sri Lankan public administration structure underwent three distinct reform waves [7]. The first wave, as explained in the report of the Administrative Reforms Committee (ARC), laid down detailed proposals with a significant focus on civil service size. Deshani et al. assert that the second wave’s direction was structural reform of the management units. Still, the target areas were not clear and thus, resulted in a mess and an enlarged public sector with little performance improvement [8]. The third wave has been the most significant one, as the country adopted a new approach towards governance in 2010 under the concept of ReGov 2020. The approach called for out-of-box solutions and for opening of almost all PSD areas for BPR and innovation. As a result, an IOI open innovation-based BPR regime was launched to reform the PSD mechanisms of the country. The concept of open innovation within the BPR regime was a relatively new concept at the time. Fernando states that “open innovation combines internal and external ideas into architectures and systems whose requirements are defined by a business model”. ReGov laid down an out-of-box reform process for the public service systems in Sri Lanka to bring efficiency and effectiveness in PSD [9]. Wijesinghe has found that managerial innovations result in alterations in existing working patterns, systems, procedures, and style, resulting in efficiency and effectiveness in the delivery of public services [10]. While open innovation serves as one of the core axioms of this reform, this paper mostly focuses on IOI-based BPR regime in the Sri Lankan public services.
From a conceptual as well as architectural perspective, at least two critical areas stand out as prime targets for a BPR regime. First is a fundamental rethinking of the definition of public service, and the second is a complete redesign of the structure of business processes to provide efficient public service. Hammer and Champy defined BPR as “the fundamental rethinking and radical redesign of business processes to achieve dramatic improvements in critical, contemporary measures of performance” [11]. Ezigbo argued that “business process reengineering involves a rethinking of the current theories of business. Remarkable improvements were made by breaking away from the old methods and adopting the newer ones” [12]. Ranasinghe agrees that the definition covers both factors, a fact that is important for our study, i.e., fundamental rethinking and radical redesign [13]. Jayawardena states that in Sri Lanka, PSD reforms did not happen overnight; instead, it is an outcome of many interrelated initiatives undertaken over many years [14]. Kittinger et al. explained the significance of incorporating information architecture (IA) within the BPR architecture and stated that BPR and IA are complementary to each other [15]. The concept of open innovation, i.e., IOI-based systematic innovation, fused within the BPR regime, has been found useful in improving performance. Ahmad et al. found a positive connection between open innovation and performance [16]. However, their findings are based on corporate data and do not directly explain public service performance and its association with the IOI-based systematic innovation. Bianchi et al. also did not cover the public service arena when they stated that “open innovation that focused on large firms found it a useful tool to enhance performance” [17]. Fernando noted that “open innovation combines internal and external ideas into architectures and systems whose requirements are defined by a business model” [9]. Hochleitner et al. also state that “Open innovation is a model … allowing for a two-way flow of knowledge from inside the firm out (outbound) and from outside in (inbound)” [18]. It was in a similar context in which ReGov laid down an out-of-box reform process and with an IOI-based BPR architecture of the PSD system in Sri Lanka.
Apart from the BPR architecture, we also need to assess the literature background of such reformative actions from an economics perspective. There is scant literature that deals with the economic utility and outcomes of BPR from the standpoint of the country. However, there is ample evidence as to the desirability of public service reform from a theoretical as well and practical point of view. Park et al. performed a detailed study on several developing economies in Asia and found strong evidence of the relationship between PSD reform and economic growth [19]. Their research does not cover Sri Lanka as a case study. The study by Thong et al. also found essential linkages between BPR and public sector performance [20]. Nukurinziza et al. found that to have a successful reform process, the organization must be responsive to BPR [21]. The literature review to this point reinforces our contention that understanding the dynamics and the results of BPR is very important to ensure that results conform to the stated objectives. With this study, we fill the empirical gaps, and also provide feedback to the implementers of the BPR regime in the country. In the next section, we explain our sources of the data employed and the methodology used to analyze the regime’s success and failure.
3. Materials and Methods
3.1. Data
Data were collected through a questionnaire-based field survey conducted across 29 departments and ministries of the Sri Lankan government. We distributed 600 questionnaires, and 290 respondents responded, meaning a response rate of 48.33%. The respondents were selected from D&M of the government of Sri Lanka directly affected by the introduction of the BPR. The respondents ranged from directors and managers to junior officers who understood the BPR regime and volunteered to respond to our questionnaire. The survey contained questions related to three categories of the BPR regime measures (after this, also referred to as independent variables) mentioned already in the introduction, i.e., structure, rules, and control. Additionally, the survey contained questions related to the outcomes (effectiveness) of the BPR regime. The outcome is a dependent variable in our analysis. While the first four are observed variables gathered via the survey, the last variable (agree/disagree) is a dependent binary variable transformed using the fourth original dependent variable of the outcome. The survey was conducted during February and March of 2020. In total, 290 respondents returned the completed questionnaire. The questionnaire was designed on a 5-point Likert-type scale with 5 for strongly agreed, 4—agreed, 3—neutral, 2—disagreed, and 1 for strongly disagreed. Input questions were categorized into three areas of the BPR regime, i.e., (i) Structure, (ii) Rules, and (iii) Control and compared with a set of questions related to their outcomes. The question items were deliberately planned per se to verify the inputs and the outputs of the BPR regime for PSD. The outcome was converted into a binary form of outcomes: 1 for general agreement and 0 for general disagreement. As a result, we had 3 independent input variables (structure, rules, and control) and 1 dependent output variable (outcome). Additionally, we had one more dependent variable of the outcome, i.e., binary notion of the outcome (overall agreement/overall disagreement). First, the data from the questionnaire from each input category and outcome were averaged. Secondly, the average response to each was used for processing and analysis using Stata analytical software. The questionnaire format is explained below in Table 1.
3.2. Methodology
There are 3 independent variables (structure, rules, and control), and one dependent variable is the outcome. We added another transformed binary dependent variable for which control is an independent variable. We established a threshold of 4 to convert outcome into a binary dependent variable (Agree/Disagree) of 1 (general agreement) and 0 (overall disagreement). The response data are ordered on a 5-point Likert scale with 5 for strongly agreed, 4—agreed, 3—neutral, 2—disagreed, and 1 for strongly disagreed; for response ≥ 4, we assigned a value of 1 to this additional variable and for all responses < 4, we set them as 0. In this way, we adopted a conservative approach towards our analysis in converting qualitative judgements into quantitative.
Further, we calculated the paired correlations of the variables. As they are survey data with ordinal characteristics, we also calculated Spearman and Kendall correlations to allow for the ordinal nature of the data. Kendall’s τ and Spearman’s ρ have been computed as a particular case of generally paired correlations.
Additionally, we produced multivariate ordered logistic regression results to deepen our understanding of the nature of the relationships that exist among various variables used in the analysis. As the response categories in our data are limited to 5, using a nonparametric ordered logistic regression model seems most appropriate for our analytical purpose [22,23,24]. We can describe our model as:
where j ∈ [1, J − 1] are the levels of the ordinal outcome variable Y; the proportional odds model assumes there is a common set of slope parameters, β, for the predictors. The ordinal outcomes are distinguished by the J − 1 intercepts αj. The benchmark level is J. For ordinal regression, we make certain assumptions about the underlying data, i.e., the response variable is ordinal, and that the explanatory variables are continuous or categorical (though they are ordinal too). Still, we treat them either as continuous or categorical. We also assume that there is no multicollinearity and the odds are proportional where each independent variable has an identical effect at each cumulative split of the ordinal dependent variable [25,26,27].
For the statistical analysis based on the methodology stated here, we used STATA 16.0 version to generate the results, which have been described in detail in the next section.
4. Results
4.1. Summary Statistics and Survey Results
We prepared descriptive statistics of our response data (n = 290). The summary statistics are presented in Table 2. The table contains summary statistics from our data gathered through the questionnaire. In total, the data represent 290 responses (n = 290). Mean values for all variables, including the transformed binary variable, indicate where the center of the responses is located. It can be seen that for most of our observed variables, the mean values are above 3 but below 4, i.e., mean response towards the BPR measures of structure, rules, and control lies between Neutral to Agree. This result shows not a very strong agreement towards the BPR measures, though there is not a total disagreement as well. The mean for the outcome is the highest, 3.879621, reflecting a comparatively better level of agreement amongst our surveyed population regarding the effectiveness of the BPR regime. This trend is also reflected as we observe the minimum and maximum range of response, with a minimum of 2.24 as compared to a minimum response for all other observed variables. Observation shows a more significant skewness in the case of rules, meaning that most of the respondents agree to the rules of BPR. The results also indicate a higher kurtosis in the case of structure, reflecting greater neutrality amongst the respondents regarding the effectiveness of the structural changes brought in by the BPR. This result is indicative of the confusion or lack of understanding or even lack of training necessitated by the structural reforms.
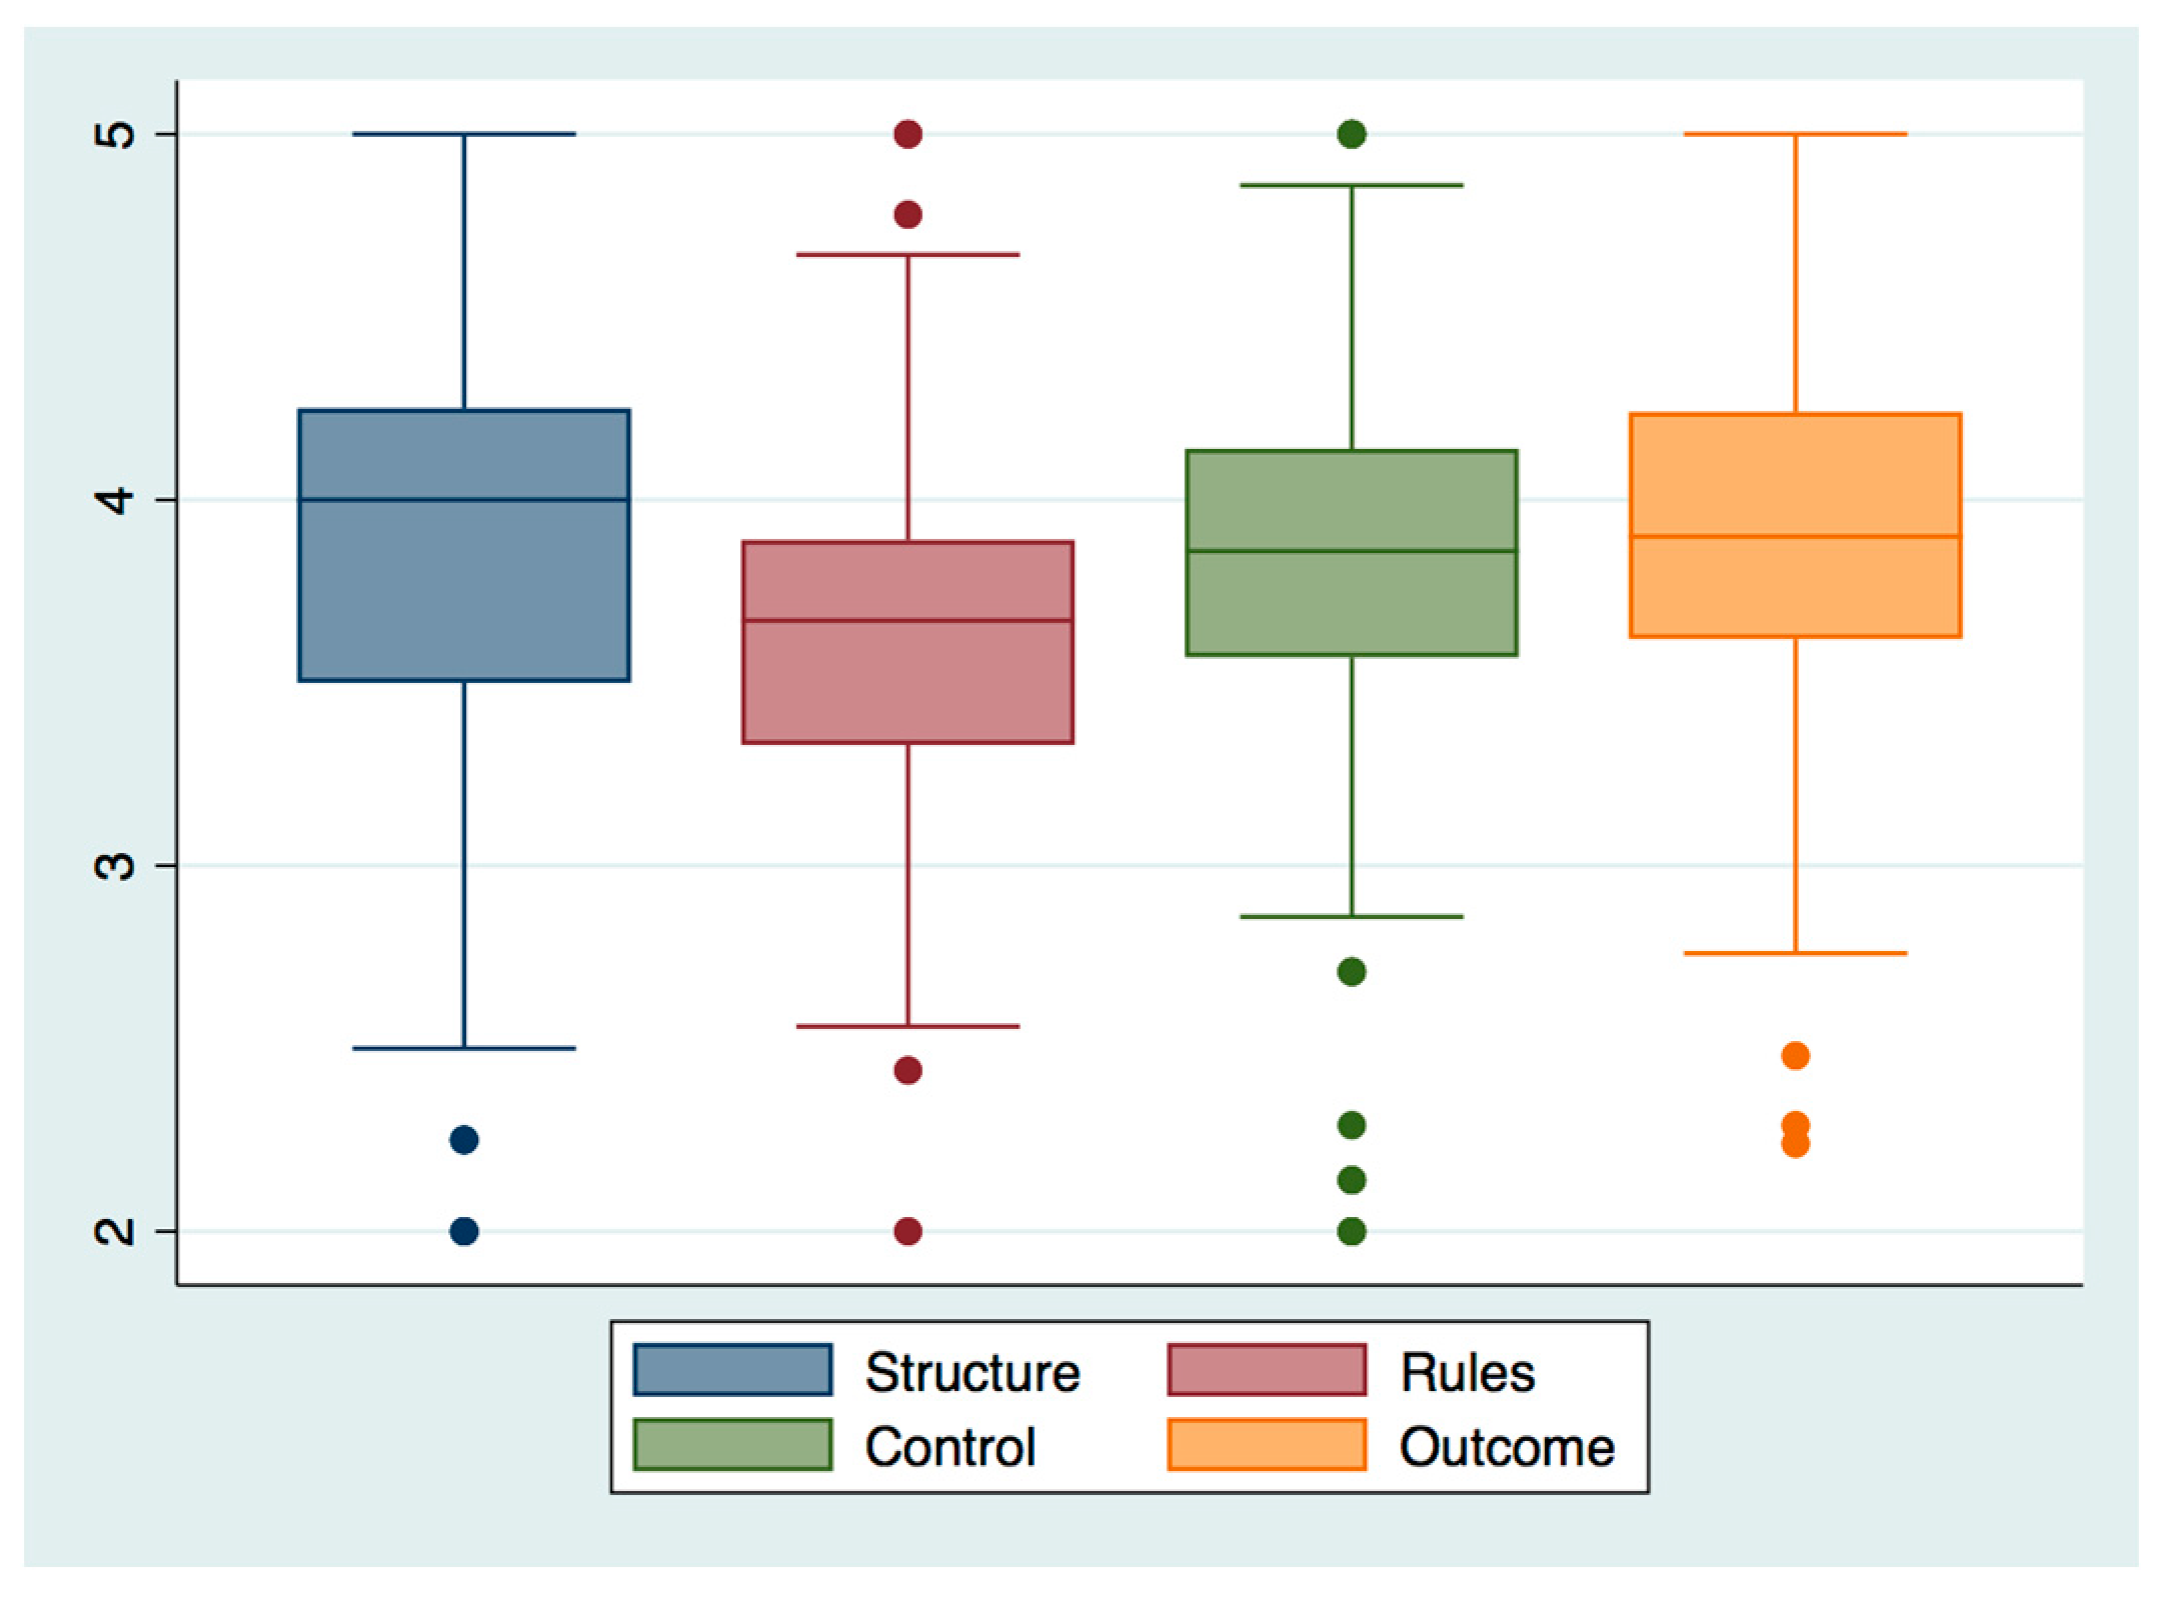
Figure 1 plots the summary of the location of responses on a Likert scale of 1 to 5, whereas Figure 2 gives individual variable response distribution on a comparable scale. We can observe a larger concentration of responses between neutral (3) to agree (4). This trend may be indicative of a lack of enthusiasm towards the changes brought in by the BPR, although it also shows lack of an active animosity towards the changes. We insist on the importance of inclusiveness and proper training to raise both awareness as well and eagerness towards the acceptance and implementation of the BPR.
4.2. Correlations
Table 3 gives details of the paired correlation among all four observed variables (n = 290) and one transformed variable of our data. We can observe that control has the strongest correlation with outcomes followed by structure and rules. On the other hand, outcomes have the strongest correlation with our transformed variable, followed by structure, control, and rules, respectively. The strong correlation of outcome with a transformed variable is understandable, as the latter is a transformation of the former.
It is evident from the results that control measures are most strongly correlated with outcomes, which means performance variances must be observed closely to increase the effectiveness of the BPR regime. The structure is also positively associated with outcomes, though we still found a lack of understanding regarding the structural changes (summary statistics). However, considering our binary variable (agree/disagree), most measures are moderately correlated.
As our data are Likert scale data gathered from a five-point questionnaire-based survey, we have further calculated Spearman correlations. Spearman correlations are a nonparametric measure of rank correlation and are used to explain the strength of the relationship between two variables. Here, we use a monotonic function, i.e., when the relationship between the variables is not linear. As it is evident from our earlier explanation of the data, it will be more insightful to calculate Spearman correlations than just simple paired correlations. Table 4 gives details of Spearman correlations among our variables. It is with this result that we can look deeper and find that structure (or structural reforms) has the strongest correlation with all independent as well as the dependent variable of the outcome, i.e., structural reforms are most closely related with the outcome. From amongst the independent variables, the structure is also more correlated with our transformed variable (agree/disagree). Finally, our transformed variable’s correlation has been heightened by using Spearman correlation. The general trend of correlations from both paired (Table 3) and Spearman (Table 4) is similar; this is because Spearman correlation is a particular case of general correlations. We shall now further strengthen our understanding of the outcomes by calculating Kendall correlations.
Because we have a transformed variable (agree/disagree) with a binary (0, 1) rank as against the ordinal ranking (1, 3, …, 5) of all other independent and dependent variables, it will be appropriate to further refine our results by calculating Kendall’s tau correlation coefficients (Table 5). This will allow for consideration of the disparity of ranking amongst the data variables (observed and transformed). Here again, we find that the structure has the strongest correlation with all independent as well as the dependent variable of the outcome, i.e., structural reforms are most closely related to the outcome. From amongst the independent variables, the structure is also more correlated with our transformed variable (agree/disagree). The comparative results of the correlation are not very different from the Spearman results, although Kendall results have dampened down the intensity of the relationship. Again, the overall correlations trend amongst all variables, i.e., reform measures and the outcomes have not altered in general.
4.3. Logistic Regression
The results of ordered logistic regression are presented in Table 6. The table contains correlation coefficients, standard errors, z values and the probability of z estimates, and confidence intervals at 95% confidence level. The number of observations is again 290 and as prob. > chi2 = 0.0000, i.e., < 0.05, it proves that our model is accurate, and the results generated thus have some statistical utility. Additionally, note that all z values are significant at 95% confidence and hence, appear to have a significant influence upon the dependent variable, which is the outcome, in this case. Further, all P > |z| values are less than 0.05 (for a 95% confidence), again pointing towards our independent variables having a strong bearing on the outcome. In Table 6, /cut1~/cut49 are ancillary parameters to define change among the categories. The logistic regression results indicate two crucial conclusions: First, the various measures adopted in the BPR have a considerable bearing upon the outcomes or stated objectives of the regime. Second, the correlations measured in earlier sections do reflect semi-strong relationships which can mean inadequacy of the measures both in the design as well as in implementation.
5. Discussion
We had three research questions to be replied to with the help of the analysis carried out in this paper. Those questions were related to effectiveness, perception, and correlations of the BPR measures. While the results indicate the architectural leanings of the BPR regime, we also obtain a good indication of how various BPR measures have contributed towards the overall perception of the effectiveness of the regime. Being the only study of its nature for the BPR regime in Sri Lanka, we consider the findings of this study of immense practical and academic value. The results of this study can indicate how future adjustment in the architecture, as well as various accompanying measures such as leadership training, change management training, and inclusiveness, can enhance the fruits of such reforms. Bringing PSD systems up to the levels of the modern age is an inevitable requirement in the present time. PSD in many countries has been a contentious issue, and governments are always under public pressure to come up with a measure to improve the delivery of services. While many developed countries have improved their PSD systems to a great extent, developing countries have plenty to do before they can achieve a service level acceptable to their public. The Sri Lankan situation has been affected by a protracted civil war that ended only in 2008. Since then, as Deshani et al. also noted, a concerted effort has been made to ensure streamlining and efficiency in the delivery of public services in the country [8]. The PSD infrastructure needed a significant remake; hence, a BPR regime was designed and put into place with three primary focus areas (structural reforms, rules, and control measures) to improve the efficiency of the system. BPR regime, as adapted in Sri Lanka, has several aspects of open innovation with an IOI mechanism to allow feedback to the PSD administrators.Gassmann et al. define open innovation as a bidirectional information process that leads to process improvement, thus making open innovation a necessary corollary to BPR [28]. A recent paper by Alahakoon et al. also deals with PSD, but their focus is deployment of ICT in Sri Lanka [29].
We took this opportunity to study the effectiveness of such regime measures (structure, rules, and control) in producing the desired results. For this purpose, an original on-the-ground Likert scale survey was carried out (n = 290), and questions regarding the inputs and outcomes were asked.
To analyze the results, we resorted to a nonparametric order logistic approach of statistical analysis. Analyzing survey data beyond descriptive statistics always come with certain uncertainty as to which analytical approach will offer the best analysis of the data. While some would suggest using a logistic regression model, there are multiple other options which need to be carefully considered because of the nature of the data. The problem becomes more acute as the responses to the question do contain a certain level of subjective evaluation. As our questionnaire asked respondents to answer the questions on a 5-point Likert scale (5 strongly agreed and 1 for strongly disagreed), we needed to use a regression approach that could take care of the ordinal nature of the data. Finally, we decided to use ordinal logistic regression to analyze our data. This approach allowed us a deeper understanding of the interrelationships amongst our independent and dependent variables, while attending to most issues with the nature of the data. In this paper, we did not present the performance efficiencies of each D&M per se; this could have been possible to estimate from the same survey using data envelopment technique. However, that would represent a limitation imposed by the scope of our analysis in this paper. We plan to do that in a separate report shortly.
6. Conclusions
In conclusion, our study has analyzed the effectiveness and the acceptability of the IOI systematic innovation-based BPR regime in Sri Lanka. We analyzed the situation from the perspective of all three primary focus areas, and the results have shown that all three focus inputs of the regime significantly contribute to the success of the program. We found that while the association of all three focus areas with the outcomes of systematic innovation-based BPR outcomes varies, there is sufficient evidence for continuing to pursue the IOI model of BPR to achieve a high-performance PSD system in the country. However, we suggest that BPR awareness and inclusiveness at all levels must be enhanced via effective and targeted training. This would result in greater effectiveness of the BPR regime. The uniqueness and the originality of our data make the study the first of its kind, and it can be of enormous use to both PSD operators as well researchers who plan to build upon our results and find other perspectives to this analysis. One such inquiry may be the exploration of factor efficiencies per se by applying other techniques of investigation. The authors plan to expand the scope of research in the future by examining factor efficiencies too. We started with the summary statistics, and for most of our observed variables, the mean values are above 3. Still, below 4, i.e., mean response towards the BPR measures of structure, rules, and control, lies between Neutral to Agree. The mean for outcome reflected a comparatively better level of agreement amongst our surveyed population about the expected performance of the regime. Our results related to paired correlations reflect a positive correlation between the independent and the dependent variables. This means that the BPR regime’s reform initiatives explain the efficiency of the PSD. Spearman and Kendall’s correlations reemphasize the similar nature of the connection between the reforms and the efficiency of the regime. Finally, we conducted an ordinal logistic regression analysis to understand the heart of the relationship between our variables. We ran the test of the model and found that the model fits with our data and can lead us to some meaningful conclusions. The results show that various measures (structure, rules, and control measures) adopted in the BPR have a considerable bearing upon the outcomes or stated objectives of the regime. Correlation results sections do reflect semi-strong relationships, which can also mean inadequacy of the measures both in the design as well as in implementation.
Author Contributions
Conceptualization, S.N.J. and V.W.E.; methodology, S.N.J. and V.W.E.; formal analysis, S.N.J. and V.W.E.; resources, S.N.J. and V.W.E.; data curating, V.W.E.; writing—original draft preparation, S.N.J. and V.W.E.; writing—review and editing, S.N.J. and V.W.E.; visualization, S.N.J. and V.W.E.; supervision, S.N.J. All authors have read and agreed to the published version of the manuscript.
Funding
This research received no external funding.
Acknowledgments
Authors are deeply thankful to the functionaries of various departments and ministries of the government of Sri Lanka who assisted in dissemination and collection of the questionnaire.
Conflicts of Interest
The authors declare no conflict of interest.
References
- Elapatha, V.W.; Jehan, S.N. An Analysis of the Implementation of Business Process Re-engineering in Public Services. J. Open Innov. Technol. Mark. Complex. 2020, 6, 114. [Google Scholar] [CrossRef]
- Jehan, S.N.; Nishantha, G.G.D.; Jehan, S.Q. E-governance initiative in Sri Lankan public service delivery. In Proceedings of the 12th International Conference on Advanced Communication Technology (ICACT), Phoenix Park, Korea, 7–10 February 2010; pp. 1625–1629. [Google Scholar]
- Information and Communication Technology Agency of Sri Lanka, Detailed Study of the Lanka eGovernment Strategy Project, ICTA/AFC/IC/IC03/58. Available online: https://www.gov.lk/elaws/wordpress/wp-content/uploads/2015/08/GOSL-Integrated-eGovernment-Strategy-Final-Submitted-17-Aug-2014-vcio-1.pdf (accessed on 31 October 2020).
- ICTA. Government Organizations Visitors’ Survey, Information Communication Technology Agency of Colombo, Sri Lanka. 2008. Available online: www.icta.lk/ (accessed on 25 October 2020).
- Gyan, P. Economic cost of Sri Lanka’s ethnic conflict. J. Contemp. Asia 2001, 31, 375–384. [Google Scholar] [CrossRef]
- Prema-chandra, A. Sri Lanka’s post-civil war development challenge: Learning from the past. Contemp. South Asia 2016, 24, 19–35. [Google Scholar] [CrossRef]
- Ramasamy, R. Governance and administration in Sri Lanka: Trends, tensions, and prospects. Public Adm. Policy Asia-Pac. J. 2020, 23, 187–198. [Google Scholar] [CrossRef]
- Deshani, A.L.; Weerasinghe, R.N. Public Entrepreneurship and Delivering Public Services Effectively: A Study in Public Organizations in Galle District. In Proceedings of the 12th International Conference on Business Management, Nugegoda, Sri Lanka, 7 December 2015. [Google Scholar]
- Fernando, R.L.S. Managerial Innovation in Service Delivery in Public Sector Organizations in Sri Lanka, Governance and Development; Shrabon Printing Press: Dhaka, Bangladesh, 2006; pp. 221–237. [Google Scholar]
- Wijesinghe, D. Administrative Reforms: International Perspectives and the Case of Sri Lanka; Government of Sri Lanka: Colombo, Sri Lanka, 1997.
- Hammer, M.; Champy, J. Reengineering the corporation: A manifesto for business revolution. Bus. Horiz. 1993, 36, 90–91. [Google Scholar] [CrossRef]
- Ezigbo, C.A. Advanced Management Theory and Applications; Immaculate Publication Ltd.: Enugu, Nigeria, 2011; pp. 83–90. [Google Scholar]
- Ranasinghe, S. Breaking the mindsets: Issues of learning and innovation in Sri Lankan organizations. Sri Lankan J. Manag. 2010, 7, 3–4. [Google Scholar]
- Jayawardena, L. Sri Lanka: Reforming Public Administration; Paper Presented at ADB Seminar; National Development Council: Colombo, Sri Lanka, 1997.
- Kettinger, W.; Teng, J.; Guha, S. Information architectural design in business process reengineering. J. Inf. Technol. 1996, 11, 27–37. [Google Scholar] [CrossRef]
- Ahmed, S.; Halim, H.A.; Ahmad, N.H. Open and Closed Innovation and Enhanced Performance of SME Hospitals—A Conceptual Model. Bus. Perspect. Res. 2018, 6, 1–12. [Google Scholar] [CrossRef]
- Bianchi, M.; Campodall’Orto, S.; Frattini, F.; Vercesi, P. Enabling open innovation in small- and medium-sized enterprises: How to find alternative applications for your technologies. R&D Manag. 2010, 40, 414–431. [Google Scholar]
- Hochleitner, F.P.; Arbussà, A.; Coenders, G. Inbound open innovation in SMEs: Indicators, non-financial outcomes and entry-timing. Technol. Anal. Strateg. Manag. 2017, 29, 204–218. [Google Scholar] [CrossRef]
- Park, D.; Noland, M. Developing the Service Sector as an Engine of Growth for Asia; Asian Development Bank: Mandaluyong City, Philippines, 2013. [Google Scholar]
- Thong, J.Y.; Yap, C.S.; Seah, K.L. Business Process Reengineering in the Public Sector: The Case of the Housing Development Board in Singapore. J. Manag. Inf. Syst. 2000, 17, 245–270. [Google Scholar] [CrossRef]
- Nkurunziza, G.; Munene, J.; Ntayi, J.; Kaberuka, W. Business process reengineering in developing economies: Lessons from microfinance institutions in Uganda. Innov. Manag. Rev. 2019, 16, 118–142. [Google Scholar] [CrossRef]
- Liu, X.; Koirala, H. Ordinal Regression Analysis: Using Generalized Ordinal Logistic Regression Models to Estimate Educational Data. J. Mod. Appl. Stat. Methods 2012, 11, 21. [Google Scholar] [CrossRef] [Green Version]
- De Leeuw, J. Models and methods for the analysis of correlation coefficients. J. Econom. 1983, 22, 113–137. [Google Scholar] [CrossRef]
- Li, G. Application of Finite Mixture of Logistic Regression for Heterogeneous Merging Behavior Analysis. J. Adv. Transp. 2018, 2018, 1436521. [Google Scholar] [CrossRef]
- Daniel, W.W. Kendall’s tau. In Applied Nonparametric Statistics, 2nd ed.; PWS-Kent: Boston, MA, USA, 1990; pp. 365–377. [Google Scholar]
- Fu, V.K. Estimating generalized ordered logit models. Stata Tech. Bull. 1999, 8, 27–30. [Google Scholar]
- Williams, R. Generalized ordered logit/partial proportional odds models for ordinal dependent variables. Stata J. 2006, 6, 58–82. [Google Scholar] [CrossRef] [Green Version]
- Gassmann, O.; Enkel, E. Towards a Theory of Open Innovation: Three Core Process Archetypes. In Proceedings of the R&D Management Conference (RADMA), Lisbon, Portugal, 7 July 2004; pp. 6–7. [Google Scholar]
- Alahakoon, M.U.I.; Jehan, S.N. Efficiency of Public Service Delivery—A Post-ICT Deployment Analysis. Economies 2020, 8, 97. [Google Scholar] [CrossRef]
Figure 1.
Summary data plot.

Figure 2.
Variables response plot.


Table 1.
Survey questionnaire.
| Questions | Response | ||||
|---|---|---|---|---|---|
| Strongly Agree | Agree | Neutral | Disagree | Strongly Disagree | |
| Input Questions (1, 2, 3…20) Structure | 5 | 4 | 3 | 2 | 1 |
| Rules | 5 | 4 | 3 | 2 | 1 |
| Control | 5 | 4 | 3 | 2 | 1 |
| Outcome Questions (1, 2, 3…20) | 5 | 4 | 3 | 2 | 1 |
| Total Questions 40 | Total responses 290 | ||||
Table 2.
Summary statistics.
| Variable | Obs | Mean | Std. Dev. | Min | Max | Skewness | Kurtosis |
|---|---|---|---|---|---|---|---|
| Structure | 290 | 3.799138 | 0.5947791 | 2.00 | 5 | 0.0019 | 0.8938 |
| Rules | 290 | 3.618897 | 0.4649688 | 2.00 | 5 | 0.7775 | 0.0904 |
| Control | 290 | 3.864207 | 0.5393584 | 2.00 | 5 | 0.0003 | 0.0021 |
| Outcome | 290 | 3.879621 | 0.4971332 | 2.24 | 5 | 0.0106 | 0.3805 |
| Agree/Disagree | 290 | 0.4310345 | 0.496077 | 0.00 | 1 | 0.0512 | - |
Table 3.
Correlations (paired) (Obs. = 290).
| Variable | Structure | Rules | Control | Outcome | Agree/Disagree |
|---|---|---|---|---|---|
| Structure | 1.0000 | ||||
| Rules | 0.6458 | 1.0000 | |||
| Control | 0.5985 | 0.6131 | 1.0000 | ||
| Outcome | 0.7306 | 0.6985 | 0.7563 | 1.0000 | |
| Agree/Disagree | 0.5231 | 0.4748 | 0.4963 | 0.7500 | 1.0000 |
Table 4.
Spearman correlations (Obs. = 290).
| Variable | Structure | Rules | Control | Outcome | Agree/Disagree |
|---|---|---|---|---|---|
| Structure | 1.0000 | - | - | - | - |
| Rules | 0.5969 | 1.0000 | - | - | - |
| Control | 0.5793 | 0.5207 | 1.0000 | - | - |
| Outcome | 0.7058 | 0.6428 | 0.7000 | 1.0000 | - |
| Agree/Disagree | 0.5475 | 0.4722 | 0.5153 | 0.8266 | 1.0000 |
Table 5.
Kendall correlations (Obs. = 290).
| Variable | Structure | Rules | Control | Outcome | Agree/Disagree |
|---|---|---|---|---|---|
| Structure | 0.8763 | - | - | - | - |
| Rules | 0.4268 | 0.9291 | - | - | - |
| Control | 0.4062 | 0.3701 | 0.9158 | - | - |
| Outcome | 0.5195 | 0.4735 | 0.5187 | 0.9714 | - |
| Agree/Disagree | 0.3112 | 0.2701 | 0.2943 | 0.4717 | 0.4922 |
Table 6.
Ordered Logistic Regression.
| Number of obs = 290 | Wald Chi2(3) = 262.35 | |||||
| Log likelihood = −863.67747 | Prob > Chi2 = 0.0000 | |||||
| Outcome | Coef. | Std. Err. | z | P > |z| | [95% Conf. Interval] | |
| Structure | 1.8583 | 0.2666 | 6.9700 | 0.0000 | 1.3357 | 2.3809 |
| Rules | 1.9982 | 0.3377 | 5.9200 | 0.0000 | 1.3364 | 2.6601 |
| Control | 2.5551 | 0.3073 | 8.3200 | 0.0000 | 1.9528 | 3.1573 |
| /cut1 | 13.40531 | 1.656139 | - | - | 10.15934 | 16.65129 |
| /cut1 | 13.40531 | 1.656139 | - | - | 10.15934 | 16.65129 |
| /cut2 | 14.87814 | 1.417973 | - | - | 12.09896 | 17.65731 |
| /cut3 | 15.63847 | 1.358482 | - | - | 12.97589 | 18.30104 |
| /cut4 | 16.16512 | 1.336847 | - | - | 13.54495 | 18.78529 |
| /cut5 | 17.06923 | 1.314283 | - | - | 14.49328 | 19.64517 |
| /cut6 | 18.11891 | 1.310828 | - | - | 15.54973 | 20.68808 |
| /cut7 | 18.25003 | 1.311447 | - | - | 15.67964 | 20.82042 |
| /cut8 | 18.49522 | 1.314649 | - | - | 15.91856 | 21.07189 |
| /cut9 | 18.72486 | 1.320107 | - | - | 16.1375 | 21.31223 |
| /cut10 | 18.93202 | 1.325664 | - | - | 16.33377 | 21.53028 |
| /cut11 | 19.12068 | 1.330937 | - | - | 16.51209 | 21.72926 |
| /cut12 | 19.30477 | 1.336429 | - | - | 16.68541 | 21.92412 |
| /cut13 | 19.83114 | 1.354473 | - | - | 17.17642 | 22.48585 |
| /cut14 | 19.91182 | 1.357339 | - | - | 17.25149 | 22.57216 |
| /cut15 | 20.2132 | 1.368673 | - | - | 17.53065 | 22.89575 |
| /cut16 | 20.60584 | 1.383726 | - | - | 17.89379 | 23.31789 |
| /cut17 | 21.02133 | 1.401334 | - | - | 18.27476 | 23.76789 |
| /cut18 | 21.19159 | 1.409093 | - | - | 18.42982 | 23.95336 |
| /cut19 | 21.24613 | 1.41151 | - | - | 18.47962 | 24.01264 |
| /cut20 | 21.70997 | 1.43283 | - | - | 18.90167 | 24.51826 |
| /cut21 | 22.01864 | 1.445582 | - | - | 19.18535 | 24.85193 |
| /cut22 | 22.53678 | 1.464571 | - | - | 19.66627 | 25.40728 |
| /cut23 | 22.80591 | 1.474291 | - | - | 19.91635 | 25.69547 |
| /cut24 | 23.31572 | 1.493697 | - | - | 20.38813 | 26.24332 |
| /cut25 | 23.72787 | 1.50927 | - | - | 20.76975 | 26.68598 |
| /cut26 | 24.0499 | 1.520242 | - | - | 21.07028 | 27.02952 |
| /cut27 | 24.35072 | 1.529764 | - | - | 21.35244 | 27.34901 |
| /cut28 | 24.7221 | 1.541698 | - | - | 21.70043 | 27.74377 |
| /cut29 | 25.00258 | 1.551207 | - | - | 21.96226 | 28.04289 |
| /cut30 | 25.26747 | 1.560774 | - | - | 22.20841 | 28.32653 |
| /cut31 | 25.43046 | 1.56675 | - | - | 22.35969 | 28.50123 |
| /cut32 | 25.71086 | 1.577178 | - | - | 22.61965 | 28.80208 |
| /cut33 | 26.0731 | 1.591712 | - | - | 22.95341 | 29.1928 |
| /cut34 | 26.33998 | 1.60333 | - | - | 23.19751 | 29.48245 |
| /cut35 | 26.51996 | 1.61153 | - | - | 23.36142 | 29.67851 |
| /cut36 | 26.66856 | 1.618294 | - | - | 23.49676 | 29.84036 |
| /cut37 | 27.19584 | 1.643026 | - | - | 23.97557 | 30.41612 |
| /cut38 | 27.51848 | 1.658189 | - | - | 24.26849 | 30.76847 |
| /cut39 | 28.18122 | 1.690424 | - | - | 24.86805 | 31.49439 |
| /cut40 | 28.67198 | 1.716068 | - | - | 25.30854 | 32.03541 |
| /cut41 | 28.83115 | 1.724473 | - | - | 25.45125 | 32.21106 |
| /cut42 | 29.08434 | 1.737156 | - | - | 25.67958 | 32.4891 |
| /cut43 | 29.73969 | 1.766063 | - | - | 26.27827 | 33.20111 |
| /cut44 | 29.95152 | 1.773901 | - | - | 26.47474 | 33.4283 |
| /cut45 | 30.32985 | 1.78893 | - | - | 26.82361 | 33.83608 |
| /cut46 | 30.48683 | 1.796527 | - | - | 26.9657 | 34.00795 |
| /cut47 | 31.11141 | 1.835709 | - | - | 27.51349 | 34.70933 |
| /cut48 | 31.85123 | 1.909361 | - | - | 28.10895 | 35.59351 |
| /cut49 | 32.50504 | 1.996658 | - | - | 28.59166 | 36.41841 |
Publisher’s Note: MDPI stays neutral with regard to jurisdictional claims in published maps and institutional affiliations. |
© 2020 by the authors. Licensee MDPI, Basel, Switzerland. This article is an open access article distributed under the terms and conditions of the Creative Commons Attribution (CC BY) license (http://creativecommons.org/licenses/by/4.0/).
Share and Cite
MDPI and ACS Style
Jehan, S.N.; Elapatha, V.W. Systematic Innovation Based BPR Regime—A Factors Analysis. Appl. Syst. Innov. 2020, 3, 50. https://0-doi-org.brum.beds.ac.uk/10.3390/asi3040050
AMA Style
Jehan SN, Elapatha VW. Systematic Innovation Based BPR Regime—A Factors Analysis. Applied System Innovation. 2020; 3(4):50. https://0-doi-org.brum.beds.ac.uk/10.3390/asi3040050
Chicago/Turabian StyleJehan, Shahzadah Nayyar, and Vishakha Wijeratne Elapatha. 2020. "Systematic Innovation Based BPR Regime—A Factors Analysis" Applied System Innovation 3, no. 4: 50. https://0-doi-org.brum.beds.ac.uk/10.3390/asi3040050