Quality Properties of Execution Tracing, an Empirical Study


1
Institute of Artificial Intelligence (IAI), Faculty of Computing, Engineering and Media, De Montfort University, Leicester LE1 9BH, UK
2
Andalusian Research Institute on Data Science and Computational Intelligence (DaSCI), University of Granada, 18071 Granada, Spain
3
Software Technology Research Laboratory (STRL), Faculty of Computing, Engineering and Media, De Montfort University, Leicester LE1 9BH, UK
*
Author to whom correspondence should be addressed.
Appl. Syst. Innov. 2021, 4(1), 20; https://0-doi-org.brum.beds.ac.uk/10.3390/asi4010020
Submission received: 27 December 2020
/
Revised: 19 February 2021
/
Accepted: 1 March 2021
/
Published: 8 March 2021
(This article belongs to the Collection Feature Paper Collection in Applied System Innovation)
Abstract
:The quality of execution tracing impacts the time to a great extent to locate errors in software components; moreover, execution tracing is the most suitable tool, in the majority of the cases, for doing postmortem analysis of failures in the field. Nevertheless, software product quality models do not adequately consider execution tracing quality at present neither do they define the quality properties of this important entity in an acceptable manner. Defining these quality properties would be the first step towards creating a quality model for execution tracing. The current research fills this gap by identifying and defining the variables, i.e., the quality properties, on the basis of which the quality of execution tracing can be judged. The present study analyses the experiences of software professionals in focus groups at multinational companies, and also scrutinises the literature to elicit the mentioned quality properties. Moreover, the present study also contributes to knowledge with the combination of methods while computing the saturation point for determining the number of the necessary focus groups. Furthermore, to pay special attention to validity, in addition to the the indicators of qualitative research: credibility, transferability, dependability, and confirmability, the authors also considered content, construct, internal and external validity.
1. Introduction
In this paper, the terms execution tracing and logging are used interchangeably. In a strict sense, execution tracing refers to a mechanism which primarily collects information for software developers, software maintainers to locate the sources of errors in software systems, while logging refers to a mechanism to collect information for system administrators or operators to support the normal operation of the same system. Thus, execution tracing dumps data about the internal state changes and threads of execution in the application. Both logging and execution tracing require that the application be operational and be executed, through which they belong to the dynamic analysis techniques; moreover, they form integral part of the software maintenance [1,2,3].
The increasing size, the distributed nature of software systems implicate increasing complexity, which make localising errors in the application code more difficult. The quality of logging, including whether log entries stem from the key places in the application code, has a drastic impact on the time spent on error analysis [4]. The popular integrated development environments and debuggers do not offer adequate solution in case (1) performance issues need to be analysed in deployment, (2) errors in real-time, embedded systems need to be localised, where the reproduction can cause serious damages or injuries, (3) the issues are concurrency-related or (4) the systems are distributed and actions have to be matched in each application part [4,5,6,7,8]. In addition, the mechanism of execution tracing can be localized in separate modules and does not need to be tightly coupled to the application code [6,9,10,11].
Karahasanovic and Thomas identified understanding the program logic as the primary source of impediments while assessing the difficulties with regard to the maintainability of object-oriented applications [12]. Logging contributes to understanding the program logic to a great extent [3,4]. It indicates that the quality of logging has an essential impact on the analysability property of software systems, through which it has a direct impact on the development and maintenance costs. Thus, assessing the quality of a software product needs to include the assessment of its analysability with regard to the quality of logging.
Yuan et al. investigated five large software systems with their 250 randomly selected failure reports and the relating source code [13]. They found that failure analysis based of existing log data caused problems in 57 % of the cases. Moreover, Yuan et al. conducted a different research about four large, open-source, C++ projects to understand how pervasive logging is and how it influences failure diagnosis time [14]. The study found that log messages can speed up the failure diagnosis on average by 2.2 times; moreover, each 30 lines of source code includes a log statement which establishes a rate to state logging is pervasive [14]. Chen and Jiang replicated the previous study to examine whether its statements also hold for Java [15]. While their research yielded similar results about pervasiveness of logging, they found that error reports with logs were resolved slower than those without logs [15]. Nevertheless, Chen and Jiang states that further research is required to elicit the impact of logging on error resolution time, which also considers whether the error can be reproduced by the developers or logs are necessary to identify them [15].
In addition, several publications state that no industrial standard and very limited or no guidelines are available to support developers to create logging in an application [16,17,18,19,20]. If concrete guidelines existed with regard to each aspect of quality including internal, external and quality-in-use [21,22], then it would make possible to compare the properties of an existing logging mechanism and output to a desired target, which would facilitate quality assessment. However, such guidelines are not available. The present research has set the goal to identify the quality properties of execution tracing, which forms a foundation for the next steps: to define overall guidelines and to define a quality model to make quality assessments possible in the problem domain.
Chen and Jiang elicit the intentions behind the log code changes in source code repositories of six open-source Java projects [18]. Furthermore, they articulate six antipatterns for logging in [19]. Nevertheless, Chen and Jiang do not form overall guidelines for logging [18,19] which could be used for quality assessment. A summary of studies on logging improvements is given in Section 2.
In conclusion, the quality of execution tracing drastically influences the time spent on error-analysis, through which its has a direct impact on the software maintenance costs. In addition, execution tracing quality and its quality properties are not adequately defined in any of the software product quality models as described in Section 2; moreover, no empiric research is known at present that would have elicited the quality properties of execution tracing. Thus, determining the quality properties of execution tracing and modelling execution tracing quality is of extreme importance with regard to the analysability of software systems. In this paper, an empiric research conducted to elicit the quality properties of execution tracing is published. Section 2 gives account of related studies, while Section 3 delineates the research design and methods used, in Section 4 the outcome of the research is summarized, and finally Section 5 shows the conclusions including an outlook to the future.
2. Related Works
In this section, account is given of the works related to the present study. For discovering the related works, traditional literature review was applied. In addition, the references of the works identified in the scope of the review were also analysed to discover further research on the area.
As stressed in Section 1, the related works explicitly state the need for overall guidelines for preparing execution tracing; moreover, they confirm the absence of such directives [16,17,18,19,20]. Chen and Jiang analyse the reasons for log code changes and articulate six antipatterns for logging but do not form overall guidelines [18,19].
The majority of the publications with regard to the problem they address can be classified in three groups: (1) where to insert log statements in the source code [13,20,23,24,25,26,27,28], (2) what to log to provide sufficient information for failure analysis [13,17,27,29], and (3) how to log [13,19,27]. Tool support for selecting the appropriate places in the source code for inserting log statements consistently or for achieving optimal performance by the trade-off in the amount of information logged and the speed of execution usually involve more than one group mentioned above [13,17,25,26,27,28,29].
Li et al. investigate where to insert log statements in the code what are the benefits and costs; moreover, they list the tools for supporting the automatic insertion of log messages also from performance monitoring aspects [23]. Fu et al. deal with the questions where to log and what amount of information to log so that it would not be too little and too much. Zhu et al. construct a tool based on machine learning that processes changes between the versions in source code repositories and make suggestions where to insert log statements [25]. Chen and Jiang in [15] and Yuan et al. in [14] investigate whether error reports with logs are resolved quicker than those without logs. In addition, Chen and Jiang define five different anti-patterns in the logging code and develop a tool to detect them [19]:
- Nullable object: While constructing the log message, an object that should deliver data to the log message is also null, which causes NullPointerException. Resolution: Checking the objects contributing to the log messages.
- Explicit cast: An explicit cast can throw exception during the runtime conversion. Resolution: Removing the explicit cast.
- Wrong severity level in the log message: Wrong severity level can cause serious overhead in the log data or lack of information in the necessary analysis. Resolution: Using the appropriate severity level.
- Logging code smells: Retrieving the necessary information might result in long logging code with chained method calls like a.b.c.d.getSmg(). This causes maintenance overhead and deteriorates understanding. Resolution: Using a local variable or a method to provide the necessary information to the logging code.
- Malformed output: The output cannot be read by humans. Resolution: Formatting it appropriately.
The Apache Common Best Practices document describes points to consider for creating consistent severity levels in the logging code statements but the description does not contain overall guidelines for logging [30].
Zeng et al. investigated logging practices in 1444 open-source Android applications and drew the conclusion that mobile applications deviate from desktop and server applications [31]. They explicitly state that the usefulness of logging depends on the quality of logs and support is needed for logging decisions with respect to (1) severity level, (2) logging code location, (3) text in the log message, and (4) when to update the log statements [31].
Hassani et al. analysed log related issues in Jira reports and in the corresponding code changes as missing or outdated information can have considerable impact causing extra overhead with the analysis carried out by developers or wrong decisions made by system operators [17]. Hassani et al. also identified the root causes of the log-related issues, some of which are trivial to correct [17]:
- Inappropriate log messages Log message is incorrectly formed including missing or incorrect variables. Majority of the log-related issues belong to this category.
- Missing logging statements Not enough information is logged. Each Jira ticket belongs to this category where further logging was added to help with the problem analysis.
- Inappropriate severity level An important message is logged with lower severity level or a less important message with a higher severity level.
- Log library configuration issues Different logging APIs require different configuration files. Issues related to the configuration files or their existence belong to this category.
- Runtime issues If logging statements produce a runtime failure including NullPointerException.
- Overwhelming logs Issues with redundant and useless log messages fall into this category which make the log output noisy and difficult to read.
- Log library changes Changes required due to changes in the logging API.
Li et al. investigates the possibility of computing logging topics automatically as the logging frequency for different topics deviates; thus, having the topic could guide developers where to insert log statements in the code [20]. Their study revealed the most intensively logged topics which are related to communications between machines and to thread interactions [20].
Kabinna et al. conducted a study to examine whether the logging statements remain unchanged in the source code, which is important for the tools to process the logs; moreover, they create a classification model to predict whether a log statement in the source code is likely to change [32]. They found (1) the experience of developers, who created the log statements, has an impact on determining whether it will change or not; (2) log statements introduced by the owner of the file are less likely to change in the future; (3) log statements in files with lower log density are more likely to change than log statements in files with higher log density [32].
Yuan et al. and Zhao et al. confirm that log messages are frequently the only tools to analyse system failures in the field in a postmortem way [13,27]. Yuan et al. study the efficiency of logging practices in five large software systems, with randomly selected 250 failure reports, and the corresponding source code; moreover, they report that postmortem analysis caused problems in 57% of the cases based on the provided log data [13]. In addition, Yuan et al. discover frequent, repetitive patterns among the logging failures which motivates tool support [13,29]. A study with 20 programmers showed that improved logging resulted in reducing the failure diagnosis time by 60.7% [13]. One important finding of the study is that 39% of the error manifestations were not logged at all [13]. Yuan et al. formulate recommendations what to log [13]:
- Log detected errors regardless whether there is code to handle the error
- Log errors of system calls
- Log CPU, memory usage and stack frames in the case of signals as SIGSEGV, SIGTERM
- Log switch-case default branches
- Log exceptions including input validation and resource leaks
- Log the branches of unusual input or environment effects that might not be covered by testing
Zhao et al. implemented tool support for placing log statements in the code without human intervention and without the need of domain knowledge [27]. Their tool collects execution path information with a low-overhead logging library and does an evaluation about the frequencies of different execution paths to compute the optimal places for log statements for the developer to be able to distinguish between those paths [27].
Ding et al. design and implement a cost-aware logging system which also considers the performance degradation caused by logging to decide which useful log messages to keep and which less useful ones to discard [28].
Kabbina et al. analyse log library migration projects at Apache Software Foundation (ASF) and base their investigation on Jira ticket reports and git commit history [33]. They found that (1) 33 of 223 ASF projects underwent log library migration, (2) log library migration is not a trivial task as the median number of days to complete the migration at the 33 projects took 26 days, (3) flexibility (57%) and performance (37%) are the main drivers for the log library migrations performed, (4) log library migration is error-prone: more than 70% of the projects had post-migration bugs, on average 2 issues per project including missing dependencies, configuration, interactions between old and new libraries, (5) the performance improvement achieved by the log library migration is usually negligible [33].
Shang et al. examines the possible ways for operators and administrators to elicit and understand the meaning, and impact of the log lines; moreover, to identify a solution for resolving them [34].
Shang et al. found that log-related metrics, including log density, defined in their study can also be effective predictors for post-release defects [35]. The correlation measured between the defined log-related metrics and post-release defects are as strong as the correlation between the pre-release defects and the post-release defects, which is known to be the strongest predictor at present [35]. The reason of the high correlation can be explained by the attitude of the developers, who tend to add more logs to the code about which they have concerns [35]. Consequently, decreasing solely the number of log statements in a source file does not implicate improvement in the source code quality.
Galli et al. analysed all the software product quality models defined and published in the past 20 years; moreover, the investigation was extended to the application of such models including their tailoring [36]. The partial software product quality models were ruled out from the analysis, as these models give up the aim to define quality properties to cover the whole set of software product quality. On the other hand, quality models, which aim to consider each aspect of software product quality are designated in the present paper as complete software product quality models even if completeness means an elusive target in a precise sense. The models identified in this manner were classified and assigned to software product quality model families to indicate whether a new software product quality model was born or merely enhancements of a previous model were published [36]. If the model published built on previous models but introduced new concepts, then it was regarded as a new software product quality model. This way, 23 software product quality model families were identified as Table 1 shows.
None of the identified 23 software product quality model families handle logging quality adequately. Solely the SQUALE model [37] addresses the quality of execution tracing explicitly to assess whether log messages on three severity levels are traced: (1) errors, (2) warnings and (3) infos; however, having severity levels is only one possible aspect of execution tracing quality. In addition, the ISO/IEC 25010 standard family [21,38] defines quality measure elements (QMEs) which use the word “log” in their naming but their meanings deviate from execution tracing or software logging. Furthermore, the quality model of ISO/IEC 25010 [21] standard family does not consider execution tracing but defines measures which show similarities or overlap with execution tracing quality to some extent even if they are different [38]: (1) user audit trail completeness (ID: SAc-1-G), (2) system log retention (ID: SAc-2-S), (3) system log completeness (ID: MAn-1-G), (4) diagnosis function effectiveness (ID: MAn-2-S), (5) diagnosis function sufficiency (ID: MAn-3-S). Moreover, the predecessor standard ISO/IEC 9126 [22] encompasses metrics which differ from execution tracing quality but which are related to it to some degree [39,40]: (1) activity recording, (2) readiness of diagnostic functions, (3) audit trail capability, (4) diagnostic function support, (5) failure analysis capability, (6) failure analysis efficiency, and (7) status monitoring capability. The defined metrics and measures are vague and difficult or impossible to compute in industrial applications. More information is provided on the listed metrics, measures and QMEs on page 18 in Appendix A.

Table 1.
Software Product Quality Model Families Defined, Tailored or Referenced in the Last 20 Years [36].
Table 1.
Software Product Quality Model Families Defined, Tailored or Referenced in the Last 20 Years [36].
| No. | Software Product Quality Model Families, Names in Alphabetic Order |
|---|---|
| 1 | 2D Model [41] |
| 2 | ADEQUATE [42,43] |
| 3 | Boehm et al. [44] |
| 4 | COQUALMO [45,46] |
| 5 | Dromey [47] |
| 6 | EMISQ [48,49,50] |
| 7 | FURPS [51,52,53] |
| 8 | GEQUAMO [54] |
| 9 | GQM [55] |
| 10 | IEEE Metrics Framework Reaffirmed in 2009 [56] |
| 11 | ISO25010 [21,57,58,59,60,61,62,63] |
| 12 | ISO9126 [22,64,65,66,67,68,69,70,71] |
| 13 | Kim and Lee [72] |
| 14 | McCall et al. [73,74] |
| 15 | Metrics Framework for Mobile Apps [75] |
| 16 | Quamoco [76,77,78,79] |
| 17 | SATC [80] |
| 18 | SQAE [81] |
| 19 | SQAE and ISO9126 combination [82] |
| 20 | SQALE [83,84,85,86,87,88,89,90] |
| 21 | SQUALE [37,91,92,93] |
| 22 | SQUID [94] |
| 23 | Ulan et al. [95] |
3. Methods
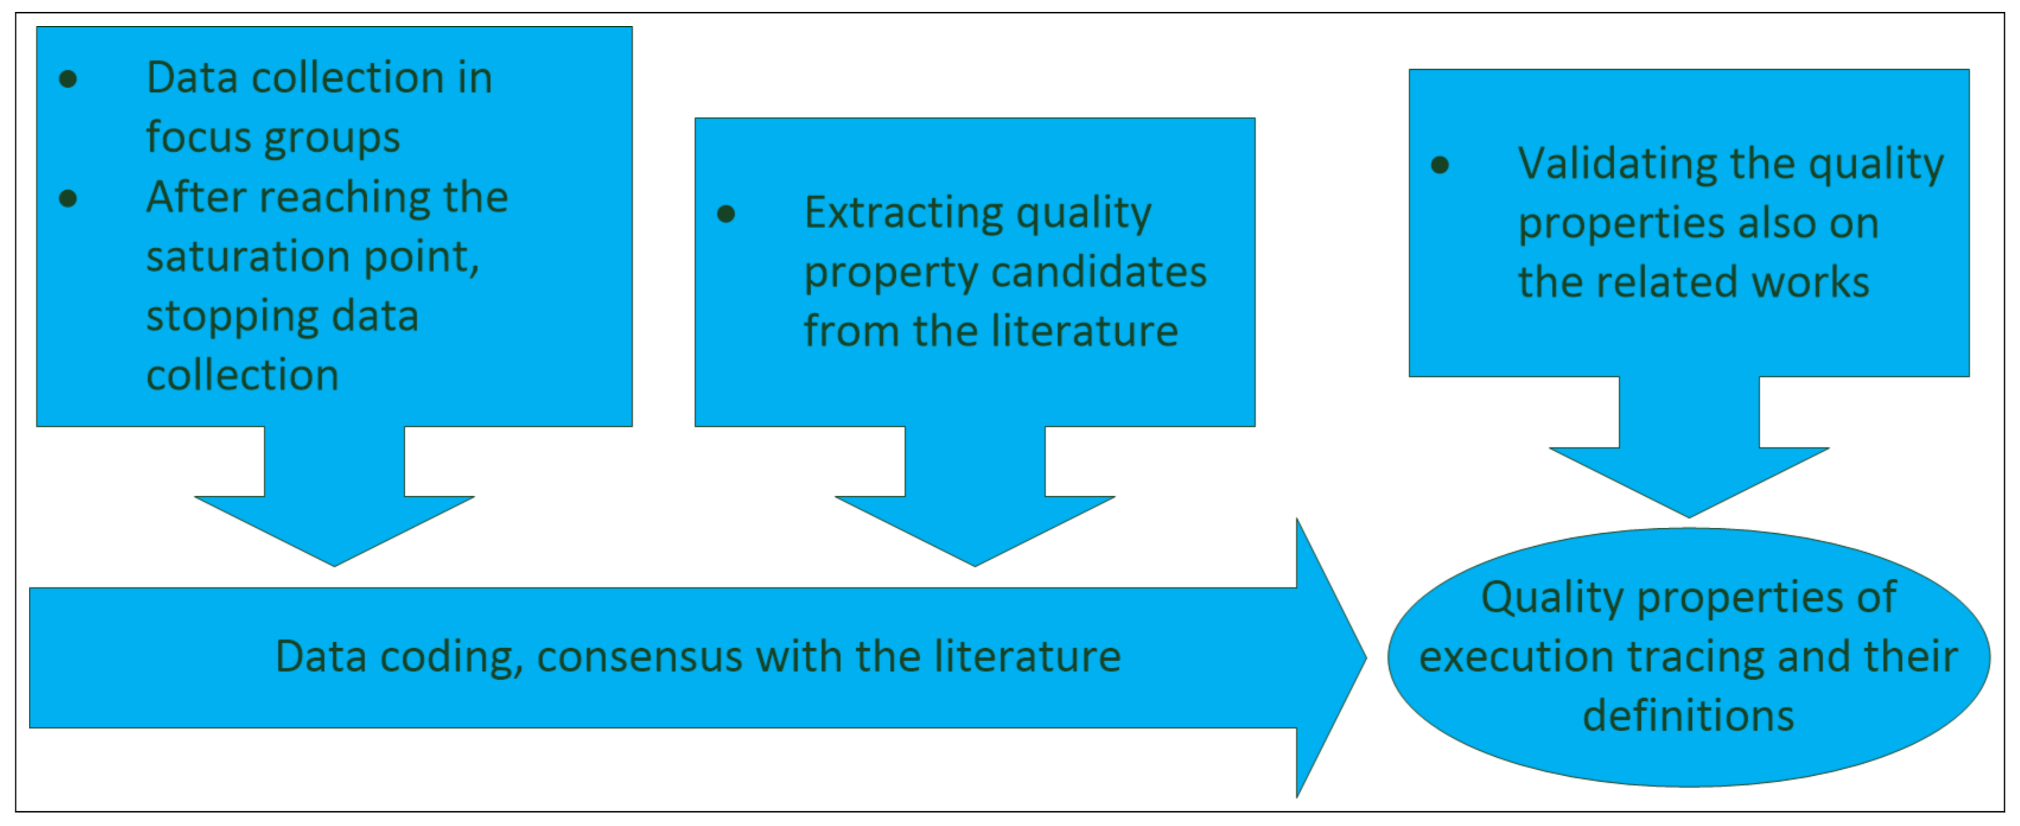
Related works do not identify the properties that determine the quality of logging. Instead, specific aspects of the problem domain are investigated with a focus on what to do and what to avoid, without forming complete guidelines. In contrast, the methodology applied in this study aims to elicit all possible properties that influence execution tracing quality. To achieve this goal, the study investigates data from three different sources: (1) publications that explicitly or implicitly express wishes in connection with logging or execution tracing, these works were identified by defined search queries in different scientific document databases and by reference searches as introduced in Section 3.1; (2) direct experiences of software professionals as described in Section 3.2; and (3) the works related to this study as presented in Section 2, which were discovered by traditional literature review. A separate Section 4.5 is devoted to the validity of the research.
After the data collection, the data corpus was coded [96], and the variables, i.e., the quality properties of execution tracing, defined. The data coding was performed separately from the data based on the publications identified in (1) above related to execution tracing and from the data stemming from the experiences of software professionals. The outcomes were compared, deviations resolved and the variables defined were also validated on the publications identified in (3) above.
3.1. Data Collection from the Literature
The data collection with regard to the literature encompassed the following steps:
- Publications were identified that involve in execution tracing or software logging or in a related area. Logical query issued in the scientific document databases: (“execution tracing” OR logging) AND quality AND maintainability AND software AND (model OR framework). The concrete queries performed in each scientific document database is documented in the Appendix C.1.
- The identified publications were scrutinised whether they articulate any quality property candidate for execution tracing
- (a)
- explicitly, by naming it directly;
- (b)
- implicitly, by a longer description or by proposed actions to avoid negative consequences;
- The data coding steps were performed to define the quality properties of execution tracing, i.e., the variables on which execution tracing depends, based on the literature.
The scientific document databases used:
- ACM Digital Library
- IEEE
- EBSCO Academic Search Premier
- SCOPUS
- Science Direct
- Web of Science
Inclusion criteria: Every identified publication is included unless the exclusion criteria apply.
Exclusion criteria:
- If the publication identified is not related to execution tracing, or auditing, then it is excluded.
- If the publication is not a primary source, then it is excluded. Books are not considered as primary source.
3.2. Data Collection from Software Professionals
Software professionals including software architects, software developers, software maintainers, and software testers possess experiences from which the quality properties of execution tracing can be extracted. Thus, determining these quality properties implicates research that is empiric and qualitative in nature as human experiences need to be collected and processed. The data collection was carried out in focus groups by means of brainstorming as explained below.
The empiric study comprised of the following steps:
- Sampling the study population to construct focus groups;
- Collecting ideas and experiences of software professionals related to execution tracing quality in the focus groups;
- Analysing and coding the collected data to form the quality properties on which execution tracing quality depends, i.e., defining variables;
- Comparing the identified quality properties based on the focus groups with those extracted from the literature and resolving potential contradictions.
Figure 1 on page 8 illustrates the above process which results in defining the quality properties of execution tracing.
3.2.1. Sampling Method
Non-random sampling was selected to choose individuals from the study population as it offers extremely useful techniques for collecting data on phenomena known only to a limited extent [97]. The study population was defined by the international software companies located in Hungary, the employee count of which exceeds 1.000 and the main activity of which belongs to the IT service delivery sector (TEAOR code 620x at the Hungarian Central Statistical Office). Large international software houses possess internationally defined style guides, development principles; consequently, the geographical localisation imposes no significant risk to the study from the point of view of the accumulated experiences of the software professionals involved into the research.
3.2.2. Data Collection in the Focus Groups and Data Coding
Experiences of the sampled individuals were collected in moderated focus groups in the following manner:
- Ideation phase: The question was introduced to each group “What properties influence execution tracing/logging quality?” and the participants had a short time to think over the question individually in silence in the group.
- Idea collection phase: The participants could freely express their ideas in a couple of words which were recorded. No idea collected was allowed to be exposed to critic in the group at this stage.
- Evaluation phase after no more ideas appeared:
- (a)
- The same items in the collected list of ideas were merged to one;
- (b)
- Each group member received the same amount of score which had to be distributed among the collected items, i.e., constant sum scaling was applied [98], to show which ideas represent the most important entities in the sight of the participants;
- After concluding a focus group, the moderator summed the scores assigned by the participants for each item collected in the given group. Thus, each focus group produced a raw list of ideas, i.e., quality property candidates, with a score of importance in the sight of the group.
The technique used for collecting the ideas in the above manner is named brainstorming, which was developed by Osborn and later sophisticated by Clark to create, collect and express ideas on a topic [99]. The main principle of the method is constituted by the elements [100]: (1) group members must have the possibility to express ideas while criticism is ruled out, (2) the ideas recorded can be developed and combined by other group members; this way the presented ideas generate new ones. Before and after the idea generation phase, a phase called ideation must take place, which includes thinking over the starting question and evaluating the collected ideas [99]. The authors combined brainstorming [99] with constant sum scaling [98] during the evaluation phase for measuring the importance of each collected item in the sight of the group, which also represents a novelty.
Data coding is applied to gain structured information from unstructured data; moreover, it aids to explore or verify relationships between entities in the data corpus [96]. Brainstorming produces semi-structured data. As we adapted the process with importance score assignment, a list of quality property candidates for execution tracing were formed, in our case, with a score value assigned to each quality property candidate. The preparation for data coding started in the focus groups when the participants looked for the identical items in the produced list and while they assigned scores of importance to each item.
After having a scored list of quality property candidates from the focus groups, the produced data were compared to all the data produced by all the previous focus groups and the same or very similar items were matched (1) to determine the stop condition for conducting further focus groups, and (2) to progress with the data coding. The activities included:
- Determining how many quality property candidates a focus group identified;
- Determining how many new quality property candidates a focus group identified, which the previous focus groups have not yet discovered;
- Determining how much score of importance to the new quality property candidates was assigned;
- Normalising the number of items identified and their scores of importance to be able to compare these values as the number of the participants slightly deviated in the focus groups;
- When the score of importance of the newly identified items in the focus group approximated zero, i.e., a saturation point was reached, the data collection was ceased;
By the comparison of the list of quality property candidates collected in each focus group, a common list was created where the same or very similar items produced by the different focus groups were matched and their score values cumulated after the above preparation steps for further data coding, which included:
- Each item in this list was labelled with a matching word possibly from the merged description of the item;
- Similar labels were associated including the items in the list they pointed at while keeping the separation with the distant labels;
The categories created by associating the similar labels in the above manner form the quality properties of execution tracing based on the focus groups. The data coding was performed by one of the authors while the other authors examined the coding process and checked the results. The quality properties, i.e., the variables on which execution tracing quality depends, were compared to the variables extracted from the literature.
3.3. Data Collection from Related Works
In contrast to the literature for the data collection identified by the automatic searches as introduced in Section 3.1, the related works were determined by traditional manual literature review. These works related to our study were scrutinised, the quality aspects, patterns, anti-patterns and mechanisms they mention were extracted, which is briefly presented in Section 2.
The quality properties synthesized from the focus groups and the variables synthesized from the literature were compared to figure out whether there are contradictions to resolve, and deviations to address. The final variables, on which execution tracing quality depends, were established by reaching a consensus between the two sources: (1) the empiric research with the focus groups and (2) the data collected from the literature. In addition, the final variables were also validated on the data extracted from the related works. The literature identified by the automatic and manual searches has roots in several, different countries; thus, the geographical localisation of the focus groups imposes no risk to the validity of the study.
4. Results and Discussion
In this section, the data collection and data coding is presented which stem from (1) the focus groups, and (2) from the literature. While presenting the results from the literature, the consensus with the focus groups results is also investigated. The validation on the related works is documented in separate Section 2 and Section 4.5.
4.1. Data Collection from Software Professionals
The data collection was conducted in seven focus groups which involved 49 participants, software architects, software developers, software maintainers, and software testers who are affected by the use of execution tracing in the course of their work. During the evaluation phase in a given focus group, each participant received 20 scores which had to be distributed among the quality property candidates identified. After concluding the focus groups, collected items were compared to the results of the previous focus groups, number and score value of newly identified items were computed.
The normalised importance score value of the identified new quality property candidates dropped below a threshold score 2, which was defined as 10% of the individual score to distribute, in the last two focus groups; thus, the importance score of the new items identified approximated zero. Consequently, the new items identified were not any more important in the sight of the focus group; therefore, no further focus groups were organised. The distribution of the quality property candidates identified, the new quality property candidates identified, the importance score assigned, the number of participants and the normalised importance score per focus group are highlighted in Table 2 on page 10.
The collected execution tracing quality property candidates were analysed and the same items identified in more focus groups were matched; moreover, their score values were summed as described in Section 3. This way, a common list of 42 items was produced with cumulated score values for each item after the data collection was completed. The data coding process had three stages: (1) each item was labelled with a short term possibly contained in the item description, (2) the similar labels were grouped in one cluster, and (3) the clusters created including their scores of importance were analysed, the similar ones merged while the dissimilar ones kept. The last stage was repeated in three cycles. The clusters, based on the output of the focus groups, constitute the quality properties of execution tracing, which are the variables on which execution tracing quality depends. The common list of the execution quality property candidates with the importance scores, the labels assigned and the clusters, in which the items were grouped at the end of data coding cycle two, we added to Table A1 in Appendix B; moreover, we presented the merged item descriptions by the clusters in Table A2 in Appendix B. The quality properties of execution tracing based on the output of the focus groups, we summarised after data coding cycle three in Table A3 in Appendix B and listed all the items assigned to the the given cluster.
In summary, the research in the focus groups delivered the variables below, on which execution tracing quality depends. We indicate the score of importance for each variable beside its definition; moreover, we ordered the variables by their importance score values in descending order. In the sight of the focus groups by far the quality property accuracy and consistency is the most important, while the quality property security possesses the least importance, which is understandable from the point of view of the goal of execution tracing: localise errors in the application.
- Accuracy and Consistency, Importance score: 521 The variable defines the quality of the execution tracing output with regard to its content but not how the output appears and how legible it is. It shows how accurate and consistent the output of execution tracing is, which includes but is not limited to whether the trace output contains (1) the appropriate details in a concise, non-redundant manner, (2) whether the origin of the trace entry can definitely be identified in the source files, (3) whether date and time including the fractals of the second, (4) the host, (5) the process, (6) the thread id are traced for each entry, (7) whether exceptions are traced once with full stack trace, (8) whether all important information is traced, (9) whether the build date and (10) the software version are traced, (11) whether environment variables are traced, (12) whether higher level actions, business processes can definitely be identified based on the trace entries, (13) whether the flow control is identifiable over component boundaries, (14) whether the transactions can definitely be identified and followed over component boundaries, (15) whether the sequence of the trace entries are kept in chronological order, (16) whether there are different severity levels, (17) whether the severity levels are consistently used across the application, (18) whether the same error is traced with the same message across the application in a unified manner, including error codes with defined messages.
- Legibility, Importance score: 232 The variable defines the quality of the appearance of the execution tracing output but not the content itself. It shows how legible and user-friendly the output of execution tracing is, which includes but is not limited to whether (1) the trace output is well-structured, (2) whether the trace is appropriately segmented in the case of multi-threaded and and multi-component applications, (3) whether the necessary variable values are traced not just object or function references, (4) whether the formatting is appropriate, (5) whether the trace output is searchable with ease in a performant manner, (6) whether the trace output is legible in text format possibly without an external tool, (7) whether the language of the trace output is unified (e.g., English).
- Design and Implementation, Importance score: 187 The variable defines the quality of the design and implementation. It shows how well the execution tracing mechanism is designed and implemented, which includes but is not limited to (1) whether the trace output is accessible and processable even in the case of a critical system error, (2) whether the trace output is centrally available, (3) whether the trace mechanism is designed and not ad hoc also with regard to the data to be traced, (4) whether the trace size is manageable, (5) if the trace is written to several files whether these files can be joined, (6) whether the tracing mechanism is error-free and reliable, (7) whether configuration is easy and user-friendly, (8) whether event-driven tracing is possible, i.e., where and when needed, more events are automatically traced, where and when not needed, then less events, (9) whether the performance of the trace is appropriate with regard to the storage, (10) whether the structure of the trace output is the same at the different components or applications in the same application domain, (11) whether the trace analysis can be automated, (12) whether standard trace implementations are used.
- Security, Importance score: 40 The variable defines the quality of security with regard to the execution tracing mechanism and its output. It shows how secure the execution tracing mechanism is including the trace output, (1) whether the trace mechanism is trustworthy from audit point of view in the case of auditing, (2) whether data tampering can be ruled out, (3) whether sensitive information is appropriately traced and its accessibility is regulated, (4) whether personal information is protected including the compliance with the GDPR regulations.
4.2. Consensus with the Literature
As presented in Section 3.1, a literature review was performed to discover publications which formulate requirements or express wishes in explicit or implicit form with regard to execution tracing. In the course of the query design and test for the different scientific document databases, the less specific queries, from the point of view of the investigation, returned unmanageably large data sets with many false positives while specific queries reduced the returned documents drastically. For this reason, a relatively specific logical query was selected Appendix C.1: (“execution tracing” OR logging) AND quality AND maintainability AND software AND (model OR framework). In addition, the automatic search was complemented by reference search and traditional key-word search to enhance the number of publications in the result set.
The search identified 58 publications in the documented scientific databases with high number of duplicates. The result set reduced to 39 publications without duplicates, which included 15 sources that contained relevant data for execution tracing. In addition, no research was identified that would have been explicitly dealing with the elicitation of the quality properties of execution tracing.
4.2.1. Recording and Extracting Data
The data extracted from the publications underwent data coding [96] to identify the quality properties of execution tracing based on the literature.
4.2.2. Data Coding from the Literature
Each publication with execution tracing related data was scrutinised; furthermore, the data with regard to any potential quality property of execution tracing were extracted and recorded. Distinction was made in the recording between explicitly and implicitly defined quality properties, i.e., if a quality property directly appeared in the text, e.g., “accurate”, then it is an explicitly defined property; however, if solely its negative appeared as something to avoid or a wish was articulated in longer text to achieve, then it was considered as an implicitly defined property. In this latter case, the text was recorded and transcribed to a short explicit term which was equivalent to the implicitly described quality property. The final transcribed list of properties were further processed, the similar items were grouped in one clusters, while the dissimilar ones kept separate as also illustrated in Section 4.1. The transcription of the identified publications is presented in Appendix C.2 in Table A4 while clustering is presented in Appendix C.3.
In summary, the clusters delineate four quality properties based on the literature:
- Design and Implementation: The variable shows how well the execution tracing mechanism is designed and implemented. The relevant quality property candidates from the literature the cluster encompasses are listed in Table A5.
- Accuracy: The variable shows how accurate the output of execution tracing is with regard to its content. The relevant quality property candidates from the literature the cluster encompasses are listed in Table A6.
- Performance: The variable shows how performant the implementation of the execution tracing mechanism is. The relevant quality property candidates from the literature the cluster encompasses are listed in Table A7.
- Legibility and Interpretation: The variable shows how legible the output of execution tracing is and how well it can be interpreted. Thus, this variable illustrates the quality of the appearance of the content of the trace output. The relevant quality property candidates from the literature the cluster encompasses are listed in Table A8.
The literature identified by the search documented above did not show any empiric research at present that would have dealt with the discovery of the variables on which execution tracing quality depends. Nevertheless, 15 publications could be identified which involve in execution tracing or in a related area such as monitoring or forensic log data analysis. After extracting and data coding the relevant information from these publication with regard to execution tracing, an agreement can be seen between the variables which stem from the literature and the variables synthesised from the output of the focus groups. The variables (1) accuracy, (2) legibility, (3) design and implementation appear both in the focus groups and in the literature; however, performance rather constitutes a separate variable based on the literature in which this property is more in the scope of interest than in the output of the focus groups. On the other hand, security forms a variable on its own based on the output of the focus groups. Nevertheless, security also appeared in the literature with less emphasis and rather related to cloud infrastructures [101,102,103]. For this reason it was data coded as part of the variable design and implementation. In summary, the defined variables based on the literature show no contradictions with the variables based on the focus groups. The slight deviations between the two sources may stem form the lack of empiric research in the identified literature on the field. Moreover, not all of the analysed publications involved in execution tracing but in related areas such as cloud data centre monitoring or log forensic analysis.
4.3. Defining the Quality Properties of Execution Tracing
The final variables, on which execution tracing quality depends, are summarised in this section. The variables based on the analysed literature and the variables based on the empiric research conducted with the focus groups show no contradictions only different emphases. While defining the final variables with a consensus based on the focus groups and on the identified literature, the sizes and the relevance of the data clusters in the course of data coding process were also considered. In addition, a final cleaning of the data clusters was also done. The final variable definitions are provided below with a scale definition which supports possible measurements along these dimensions. The definition of ratio scale was selected as it supports all kinds of mathematical operations in contrast to interval and ordinal scale types. It is important to stress that the below four variables do not form a quality model, yet, but they offer a foundation on which a quality model can be built.
The scale range is [0, 100] in the case of each variable. The zero value expresses the complete absence of the property while the maximum value expresses the complete presence.
- Variable: AccuracyRange: [0, 100]Scale type: RatioDefinition: The variable defines the quality of the execution tracing output with regard to its content, to what extent it trustworthily and consistently helps to identify the cause, the date, the time, and the location of the issue in the source code but not how legible the trace output is.It might include depending on the context but is not limited to whether the trace output contains (1) the appropriate details in a concise, non-redundant manner, (2) whether the origin of the trace entry can definitely be identified in the source files, (3) whether date and time with appropriate granularity, in the case of several nodes with clocks synchronised, are traced for each entry, (4) whether the host, (5) the process, (6) the thread id are traced for each entry, (7) whether exceptions are traced once with full stack trace, (8) whether all important information is traced, (9) whether the build date and (10) the software version are traced, (11) whether environment variables are traced, (12) whether higher level actions, business processes can definitely be identified based on the trace entries, (13) whether the flow control is identifiable over component boundaries, (14) whether the transactions can definitely be identified and followed over component boundaries, (15) whether the sequence of the trace entries are kept in chronological order, (16) whether there are different severity levels, (17) whether the severity levels are consistently used across the application, (18) whether the same error is traced with the same message across the application in a unified manner, including error codes, (19) whether data sources and data destinations can definitely be identified, (20) whether metadata of the file system including time for modified, and accessed attributes are traced, (21) whether metadata of backups and recoveries are traced, (22) whether the necessary variable values are traced not just object or function references.
- Variable name: LegibilityRange: [0, 100]Scale type: RatioDefinition: The variable defines the quality of the appearance of the execution tracing output but not the content itself. It shows how legible and user-friendly the output of execution tracing is.It might include how legible and user-friendly the output of execution tracing is, which might include depending on the context but is not limited to whether (1) the trace output is well-structured, (2) whether the trace is appropriately segmented in the case of multi-threaded and and multi-component applications, (3) whether the formatting is appropriate, (4) whether the trace output is searchable with ease in a performant manner, (5) whether the trace output is legible in text format without conversion, (6) whether the language of the trace output is unified (e.g., English).
- Variable name: Design and Implementation of the Trace MechanismRange: [0, 100]Scale type: RatioDefinition: The variable defines the quality of the design and implementation of the execution tracing mechanism with regard to how reliable, stable and sophisticated it is, to what extent and how easy it can be configured, activated and deactivated, whether sophisticated mechanisms for measuring performance are implemented, which produce lower impact on the application to reduce interference with the actions of execution.It might include depending on the context but is not limited to (1) whether the trace output is accessible and processable even in the case of a critical system error, (2) whether the trace output is centrally available, (3) whether the trace mechanism is designed and not ad hoc also with regard to the data to be traced, (4) whether the trace size is manageable, (5) if the trace is written to several files whether these files can be joined, (6) whether the tracing mechanism is error-free and reliable, (7) whether the trace configuration is easy, user-friendly and configuration changes do not implicate a restart, (8) whether event-driven tracing is possible, i.e., where and when needed, more events are automatically traced, where and when not needed, then less events, (9) whether the performance of the trace is appropriate with regard to the storage, (10) whether the structure of the trace output is the same at the different components and applications in the same application domain, (11) whether the trace mechanism offers automation feature such as filtering duplicate entries, (12) whether standard trace implementations are used (e.g., log4j), (13) whether the trace mechanism can deal with increasing data volume, (14) whether the trace mechanism is capable of dealing with parallel execution, (15) whether the trace mechanism is capable of measuring performance (a) at different levels of the architecture (b) with different granularities and (c) not only the response time but also the quality of data returned can be investigated based on the trace, (16) whether the trace mechanism offers the possibility to make queries on timestamps, (17) whether the trace mechanism is capable of making a prediction about the system’s availability based on the traces, (18) whether the trace mechanism is capable of generating usage statistics, (19) whether the trace mechanism is capable of measuring quality of service metrics for SLAs, (20) whether the trace code insertion can be done automatically in the application, (21) whether the trace mechanism is capable of replaying and simulating sequence of actions based on the traces, (22) whether the trace data are available as the events occur not only after the trace session is finished, (23) whether the trace data are available also through APIs, (24) whether the output format of the trace can be changed including DB and text file formats, (25) whether the trace code can be located in separate modules and not intermingled into the application code, (26) whether the trace mechanism is capable of correlating actions on different nodes in the case of distributed application, (27) whether the tracing mechanism is capable of keeping its perturbations on a possible minimum level with regard to the application, (28) whether the CPU usage can be traced, (29) the memory usage can be traced, (30) whether the trace mechanism is capable of tracing the following properties in the case of real-time applications: (a) task switches, which task, when, (b) interrupts, (c) tick rate, (d) CPU usage, (e) memory usage, (f) network utilisation, (g) states of the real-time kernel, which tasks are waiting to execute (waiting queue), which tasks are running, which tasks are blocked.
- Variable name: SecurityRange: [0, 100]Scale type: RatioDefinition: The variable defines how secure the execution tracing mechanism and its outputs are, i.e., it shows to what extent the execution tracing mechanism and its outputs are exposed to vulnerabilities and how likely it is that sensitive information leaks out through them.It might include depending on the context but is not limited to (1) whether the trace mechanism is trustworthy from audit point of view in the case of auditing, (2) whether data tampering and tracing fake actions can be ruled out, (3) whether sensitive information is appropriately traced and its accessibility is appropriately regulated, (4) whether personal information is protected including the compliance with the GDPR regulations.
4.4. Reflections on Related Works
All the investigations and results of the related works, summarised in Section 2, can be placed in a four dimensional space determined by the variables defined in our study: (1) accuracy, (2) legibility, (3) design and implementation, and (4) security. The majority of the studies listed in Section 2 deal with three dimensions at most. None of the related studies provided information that would have required a change in the defined dimensions. Consequently, the related works confirm the quality properties of execution tracing defined in this paper.
4.5. Validation
In the course of the validation, content, construct, internal, and external validity are considered. In addition, the usual indicators for validity in qualitative research: credibility, transferability, dependability, confirmability are also scrutinised [97].
Content validity [104] in the context of our study refers to the extent to which the universe of all possible items were considered while the possible variable candidates were being collected. While identifying the potential variable candidates, which influence execution tracing quality, (1) the literature was considered, and (2) a sample, drawn from the study population of software professionals to process explicit personal experiences. Search strings in the scientific document databases were recorded and the queries were complemented with reference searches. Explicit and implicit variable candidates were extracted and the latter was also transcribed as introduced in Section 4.2. In addition, the variable candidates collected from focus groups of software professionals were recorded and the data collection process was ceased only when the number of the newly identified items dropped below a defined threshold. After constructing the variables from the data collected, they were verified based on data of the related works on logging as listed in Section 2.
Construct validity shows the extent to which the findings reflect the content of the constructs in the phenomenon investigated [104]. Quality assessment examines to which extent concrete quality requirements are satisfied. This activity is performed along defined variables, i.e., quality properties, in all the identified quality models in [36]. Moreover, variables are necessary to define to be able to capture a manageable part of quality. Consequently, variables from the universe of the identified potential quality property candidates were defined. The variables were formed (1) from the data extracted from the publications, and (2) from the data collected from the sample of software professionals. Both sets of data were processed and data coded separately. The data coding yielded the same results with minimal deviations. The final variables were defined with the data from both sources and also validated on the findings of the related works.
Internal validity ensures that the study conducted represents the truth with regard the phenomenon investigated [105]. The data collection process was extended to all reasonably possible items to ensure content validity. The data coding process to form the variables was performed by one of the authors and the two other authors also checked the results, the outcome of which was discussed to reach a consensus to ensure intercoder reliability. In addition, construct validity was also considered in the scope of the study.
External validity refers to generalizability of the research. The variable definitions stem from data from two different sources: (1) the literature identified as documented in Section 3.1, and (2) from empiric research with focus groups at large international software houses with employees located in Hungary as introduced in Section 3.2. The results were also validated on the related works in Section 2. Both sources of data: (1) literature identified for data collection and (2) the literature identified with related works stem from different parts of the world. Thus, the geographical localisation of the focus group research does not impose a limitation to the present study.
Credibility refers to the judgement whether the research manages to express the feelings, and opinions of the participants [97]. This indicator is satisfied with the data collection in the moderated focus groups as the collected quality property candidates are examined in the course of the evaluation phase by the whole group and a score value is assigned to each item which represents the importance in the sight of the group. Moreover, the data collection phase in each group was moderated so that no critic or long monologues could be expressed during this phase which would have retarded or suppressed certain opinions.
Transferability refers to the extent to which the achievements of the research can be transferred to other contexts or can be generalized [97]. In the scope of the study being conducted, transferability can be interpreted as the indicator of the question whether the same quality properties could be established as the quality properties of execution tracing in general, regardless of geographical localisation or software companies involved in the research. The variables were defined from data based on two different sources: (1)identified international publications and (2) empiric research with focus groups located in Hungary. In addition, the defined variables were validated on the related works which also stem from international context. Moreover, the sample for the empiric research with the focus groups contains companies with premises spanning over the boundaries of Hungary and having international coding guidelines. Consequently, the geographical localisation of the focus groups does not impose a restriction to the research with regard to the studied phenomenon.
Dependability describes whether the same results would be achieved if the research process was applied more times [97]. The research process was extensively documented; moreover, the validity indicators as introduced above were also satisfied. The data collection with the focus groups was ceased only when a saturation point was reached in identifying the collected items.
Confirmability shows whether the achievements can be confirmed by others [97]. Two expert software professionals with many years of experience in the software industry were asked whether the defined variables in their opinion are able to cover all necessary aspects of execution tracing quality. The experts affirmed the results.
5. Conclusions
In summary, no framework exists that would offer basis to describe execution tracing quality in a quantitative manner. Recent publications state the necessity of creating guidelines to assist developers with logging implementations [16,17,18,19,20], some of which attempt to formalise concrete guidelines for specific parts of logging but not for the whole. Moreover, many of the previous studies solely perform an analysis of source code changes in version control systems. Consequently, they can only address the manifestation of internal quality as they consider source code artefacts. Nevertheless, addressing quality requires the examination of logging while it is in operation and the evaluation of human experience is inevitable to decide how the running implementation relates to its environment, how the users, in this case the software developers, software maintainers, software testers, perceive execution tracing quality as a whole instead of focusing only on its individual properties such as performance or informativeness.
In the present study, the variables were determined, along which the quality properties of execution tracing can be measured. The authors also considered the experiences on the field from the literature and from groups of software professionals. Thus, the variables defined make possible to address internal, external and quality-in-use aspects of software product quality with regard to execution tracing. In conclusion, the definition of concrete guidelines for logging with regard to these variables would make possible to articulate rules that enable the comparison of defined quality targets and the actual state.
The research conducted can be viewed as a first step towards creating a quality model for logging. Such a quality model would form a foundation where each individual study for logging improvement finds its place. It is very timely to link the present endeavours, which aim to improve logging through addressing questions such as what, where and how to log to a quality model to be able to see the overall picture.
In the scope of future research, the authors aim to define a quality model by formalising the experiences of software developers, software maintainers and software testers in a quantitative manner, and to consider the uncertainty inherently present in the quality measurement process. For this reason fuzzy set theory and fuzzy logic are considered appropriate. The quality model to be planned makes possible to extract the fuzzy rules, i.e., linguistic rules, to describe the quality of logging in an interpretable manner, which facilitates defining concrete guidelines for designing, and implementing logging in a concrete application with the consideration of internal, external and quality-in-use quality aspects as stated above.
The variables identified in the present study can be defined as ratio, interval or ordinal scale variables with guidelines for the values they can take. The authors selected ratio scale because it allows to perform the most mathematical operations, which is suitable for modelling. On the other hand, the definition of a ratio scale type determines that the zero value expresses the complete absence of the property measured while the maximum value expresses the full presence of the property measured.
Author Contributions
Conceptualization, T.G.; methodology, T.G.; validation, F.C. and F.S.; formal analysis, T.G.; investigation, T.G.; resources, T.G.; data curation, T.G.; writing—original draft preparation, T.G.; writing—review and editing, F.C., and F.S.; visualization, T.G.; supervision, F.C., and F.S.; project administration, T.G. All authors have read and agreed to the published version of the manuscript.
Funding
This research received no external funding.
Institutional Review Board Statement
The study was conducted according to the guidelines of the Declaration of Helsinki, and approved by the Institutional Review Board of the De Montfort University, ethical approval code: 1718/453, date of approval: 31 May 2018.
Informed Consent Statement
Informed consent was obtained from all subjects involved in the study.
Data Availability Statement
Data are made available in the appendix including the results of the data coding process.
Acknowledgments
The authors are grateful to all the professionals who participated in the focus groups; moreover, they also express special thanks to the management of the companies involved for making the organisation of the focus groups possible.
Conflicts of Interest
The authors declare no conflict of interest.
Appendix A. Similar but Different Quality Properties to Execution Tracing in the Software Product Quality Models Identified
As stated in the paper, none of the 23 identified software product quality model families addresses the quality of execution tracing in an adequate manner. In this section, we give a brief summary about the entities in the identified software product quality model families which are similar to or show overlap with execution tracing quality. In addition, homonyms are also included which do not address execution tracing or software logging but use these terms in their definition or naming for different purposes.
Appendix A.1. SQUALE
Explicitly only the SQUALE model [37] considers the quality of execution tracing but with regard to the severity levels. SQUALE [37] names and defines a practice: Tracing Standard to assess whether log messages are traced on three levels: (1) errors, (2) warnings and (3) infos. In the concept and terminology of SQUALE, practices represent an intermediary level in the quality model hierarchy between subcharacteristics and attributes. The practice Tracing Standard does not identify the quality properties on which execution tracing quality depends; moreover, it leaves room for many interpretations including what needs to count as error, as warning, and as info level.
Appendix A.2. ISO/IEC Standard Families
The ISO/IEC 9126 [22] and ISO/IEC 25010 [21] software product quality models do not consider the quality of execution tracing but define metrics and measures which show similarities or overlap with execution tracing quality; however, they are different [38]. Below we give a brief summary about these similarities in detail from the standards.
Appendix A.2.1. Similarities or Overlaps
- ISO/IEC 25010 Standard Family, Characteristic Security, Accountability measures, Section 8.7.4. in [38]:“Accountability measures are used to assess the degree to which the actions of an entity can be traced uniquely to the entity.”
- (a)
- User audit trail completeness (ID: SAc-1-G):Definition: “How complete is the audit trail concerning the user access to the system or data?”Measurement Function:
- A:
- Number of access recorded in all logs.
- B:
- Number of access to system or data actually tested.
- (b)
- System log retention (ID: SAc-2-S):Definition: “For what percent of the required system retention period is the system log retained in a stable storage?”Measurement function:A: Duration for which the system log is actually retained in stable storage.B: Retention period specified for keeping the system log in a stable storage.Stable storage: “A stable storage is a classification of computer data storage technology that guarantees atomicity for any given write operation and allows software to be written that is robust against some hardware and power failures. Most often, stable storage functionality is achieved by mirroring data on separate disks via RAID technology.”
- ISO/IEC 25010 Standard Family, Characteristic Maintainability, Analysability Measures, Section 8.8.3. in [38]:“Analysability measures are used to assess the degree of effectiveness and efficiency with which it is possible to assess the impact on a product or system of an intended change to one or more of its parts, or to diagnose a product for deficiencies or cause of failure or to identify parts to be modified.”
- (a)
- System log completeness (ID: MAn-1-G):Definition: To what extent does the system record its operations in logs so that they are to be traceable?Measurement function:A: Number of logs that are actually recorded in the system.B: Number of logs for which audit trails are required during operation.
- (b)
- Diagnosis function effectiveness (ID: MAn-2-S):Definition: What proportion of diagnosis functions meets the requirements of casual analysis?Measurement function:A: Number of diagnostic functions used for casual analysis.B: Number of diagnostic functions implemented.
- (c)
- Diagnosis function sufficiency (ID: MAn-3-S):Definition: What proportion of the required diagnosis functions has been implemented?Measurement function:A: Number of diagnostic functions implemented.B: Number of diagnostic functions required.
- (a)
- Audit trail capabilityPurpose: Can the user identify specific operations which caused failure? Can the maintainer easily find specific operations which caused failure?Measurement function:A: Number of data actually recorded during operation;B: Number of data planned to be recorded, which is enough to monitor status of the software in operationMethod of application: Observe behaviour of users or maintainers who are trying to resolve failures.
- (b)
- Diagnostic function supportPurpose: How capable are the diagnostic functions to support causal analysis? Can the user identify the specific operation which caused failure? (The user may be able to avoid encountering the same failure with alternative operations.) Can the maintainer easily find the cause of failure?Measurement function:A: Number of failures which maintainers can diagnose using diagnostic functions to understand cause-effect relationshipB: Total number of registered failuresMethod of application: Observe behaviour of users or maintainers who are trying to resolve failures using diagnostic functions.
- (c)
- Failure analysis capabilityPurpose: Can the user identify specific operations which caused the failures? Can the maintainer easily find the cause of failure?Measurement function:A: Number of failures the causes of which are still not found;B: Total number of registered failuresMethod of application: Observe behaviour of users or maintainers who are trying to resolve failures.
- (d)
- Failure analysis efficiencyPurpose: Can the user efficiently analyse the cause of failure? (Users sometimes perform maintenance by setting parameters.) Can the maintainer easily find the cause of failure?Measurement function: Remark: The standard provides recommendations regarding the time and number of failures to be considered.T: TimeN: Number of failuresMethod of application: Observe behaviour of users or maintainers who are trying to resolve failures.
- (e)
- Status monitoring capabilityPurpose: Can the user identify specific operations which caused failure by getting monitored data during operation?Measurement function:A: Number of cases for which maintainers or users failed to get monitored dataB: Number of cases for which maintainers or users attempted to get monitored data recording status of software during operationMethod of application: Observe behaviour of users or maintainers who are trying to get monitored data recording status of software during operation.
- (f)
- Activity recordingPurpose: How thorough is the recording of the system status?Measurement function:A: Number of implemented data logging items as specified and confirmed in reviewsB: Number of data items to be logged defined in the specificationsMethod of application: Count the number of items logged in the activity log as specified and compare it to the number of items to be logged.
- (g)
- Readiness of diagnostic functionsPurpose: How thorough is the provision of diagnostic functions?Measurement function:A: Number of diagnostic functions as specified and confirmed in reviewsB: Number of diagnostic functions requiredMethod of application: Count the number of the diagnostic functions specified and compare it to the number of the diagnostic functions required in the specifications.
Appendix A.2.2. Homonyms
QMEs, related to the log in a general sense, are defined in [106], the definitions of which make it clear that not execution tracing or software logging is addressed:
- Expansion set of QMEs, No. 12: QME: Size of logs (number of logs).Definition: “Log: a document used to record, describe or denote selected items identified during execution of a process or activity. Usually used with a modifier, such as issue, quality control, or defect. (PMBOK Guide 4th Ed.)”
- Expansion Set of QMEs, No. 13: QME: Number of Document (including log records).Definition: “Document: (1) uniquely identified unit of information for human use, such as report, specification, manual or book, in printed or in electronic from [...] (2) equivalent to an item of documentation.”
The ISO/IEC 25010 standard [21] also defines quality measure elements (QME) which are used by the quality measures. Some of these QMEs lean on the logs as input but not necessarily on software logging [106]:
- QME: (No.1) Number of Failures, input for the QME: Log of failures within an organisation
- QME: (No.2) Number of faults, input for the QME: Log of failures within an organisation
- QME: (No.3) Number of interruptions, input for the QME: Log of operations
Appendix B. List of the Execution Tracing Quality Property Candidates Based on the Focus Groups with Labels and Clusters Assigned
The collected quality property candidates represent the output of the seven focus groups held. They are presented in descending order according to their score of importance in Table A1. Item 40, 41, and 42 were assigned zero importance score by the focus groups; thus, they are included in the list but they were excluded from the data coding process.
Table A1.
List of the Execution Tracing Quality Property Candidates, Data Coding.
| No. | Merged Description | Importance Score | Label | Matching Cluster |
|---|---|---|---|---|
| 1 | no superfluous redundancies; be the log messages definite, concise with appropriate details; be it detailed; conciseness; Appropriate amount of information, conciseness; how detailed the log is;how repetitive the log is; the call stack could be seen;coverage, be it detailed; | 136 | appropriate details in a concise manner | accuracy |
| 2 | location in the code; the source of the log message could definitely be identified; accuracy, the log should precisely point at the location of the error; error could be localized in the source file, line number; | 127 | accurate location in the source code | accuracy |
| 3 | information content; be the information density of the log data good; it should contain important information; the real information content; information content could be interpreted; | 122 | appropriate details in a concise manner | accuracy |
| 4 | well-structured; be well-structured, and clear; be it clear and well-arranged; be it well structured; be the log appropriately segmented in the case of multithreaded, multi-component applications;format of the log; | 104 | well-structured | legibility |
| 5 | be it easily legible, user-friendly; legibility; be it easily legible; be the variable values logged, be it in a legible manner not just object references, the same for functions; good legibility, formatting (e.g., not a full xml file in one line); | 76 | legibility | legibility |
| 6 | search the log with ease; searchability; be it easy to search in the log; searchability; | 37 | easy search | legibility |
| 7 | be it designed, not ad hoc; be it designed what data are logged (it is frequently inadequate on newly developed software parts); | 29 | design | design and implementation |
| 8 | be the host, process, time, etc. identifiable based on the log; be the date of the event logged; be the timestamp logged, also the fractals of the seconds; | 29 | appropriate details in a concise manner | accuracy |
| 9 | data safety regulation satisfied; GDPR (protecting personal data); conformance with data protection regulations, protection of data, be the passwords not logged; | 27 | security | security |
| 10 | consequent log-level all over the application; be there log levels, and be they consistent; | 26 | consistency | consistency |
| 11 | be the size of the log file not too big; be the size of the log file manageable; size of the log; be the log written possibly in one file or the different log files could be joined; | 25 | log size | design and implementation |
| 12 | be the log categorized (e.g., Info, error); be the severity of the error logged; | 22 | log levels | accuracy |
| 13 | be the flow control identifiable, transaction could be followed over the component boundaries; be context information logged to identify higher-level actions; | 21 | ability to identify high level actions | accuracy |
| 14 | Error-free logging of information content; | 16 | log implementation reliability | design and implementation |
| 15 | define the data to be contained in the log; | 15 | design | design and implementation |
| 16 | easy configuration; | 14 | configuration | design and implementation |
| 17 | logging exceptions appropriately; tracing exceptions only once, be it concise but be there stack trace; | 13 | exception logging | accuracy |
| 18 | be the logging trustworthy from technical point of view; | 13 | log implementation reliability | design and implementation |
| 19 | performance (time behaviour); | 13 | performance | performance |
| 20 | be the logs accessible and processable even in the case of critical system errors; | 12 | access to logs | access to logs |
| 21 | performance with regard to storage; performance with regard to storage and space utilization; | 10 | performance | performance |
| 22 | event driven logging, where needed, there more logs, where not needed less logs; | 10 | design | design and implementation |
| 23 | be the version of the software logged; | 8 | appropriate details in a concise manner | accuracy |
| 24 | be the logging unified, the same error be logged with the same message each time, e.g., error code with a defined error message; consistent (the same log entry at the same error); | 8 | consistency | consistency |
| 25 | be the logging trustworthy from audit point of view, no data tempering; tampering could be ruled out; | 7 | security | security |
| 26 | be it readable in text format, possibly without an external tool; | 7 | legibility | legibility |
| 27 | log processing could be automatized; | 7 | design | design and implementation |
| 28 | be the structure of log the same at different applications belonging to the same application domain; | 6 | design | design and implementation |
| 29 | the language of logging be unified, e.g., English; | 6 | legibility | legibility |
| 30 | Error-free implementation of logging (not the errors of logs be logged); | 6 | log implementation reliability | design and implementation |
| 31 | protection of personal data; | 5 | security | security |
| 32 | standard implementation for logging and using log frameworks; | 5 | design | design and implementation |
| 33 | be it centrally available; | 4 | access to logs | access to logs |
| 34 | logging environment variables; | 4 | appropriate details in a concise manner | accuracy |
| 35 | keeping the chronology in the sequence of the log events; | 3 | sequential accuracy | accuracy |
| 36 | performance of the search in the log; | 2 | easy search | legibility |
| 37 | be the build date logged; | 2 | appropriate details in a concise manner | accuracy |
| 38 | performance of automatic parsing; | 2 | design | design and implementation |
| 39 | authentication for the logging, so that one could see who contributed the log entry; | |||
| 40 | be access rights logged; | 0 | zero score of importance not coded | zero score of importance not coded |
| 41 | structure and text of log messages should remain constant in time; | 0 | zero score of importance not coded | zero score of importance not coded |
| 42 | the complexity of the software has an impact on the logging; | 0 | zero score of importance not coded | zero score of importance not coded |
In addition, we present the merged item descriptions by clusters on page 24 in Table A2. The original item descriptions are listed for each cluster and separated by a semicolon in the column “Description”. This is a different view of Table A1.
The final clusters, i.e., quality properties, based on the output of the focus groups are introduced on page 25 in Table A3. The original item descriptions are listed for each cluster and separated by a semicolon in the column “Description”.
Table A2.
Output of Data Coding Cycle Two, Merged Descriptions by Clusters.
| Clusters | Items in the Cluster | Score of Importance | Description |
|---|---|---|---|
| Access to logs | 2 | 16 | be the logs accessible and processable even in the case of critical system errors; be it centrally available; |
| Accuracy | 11 | 487 | no superfluous redundancies; be the log messages definite, concise with appropriate details; be it detailed; conciseness; Appropriate amount of information, conciseness; how detailed the log is; how repetitive the log is; the call stack could be seen; coverage, be it detailed; location in the code; the source of the log message could definitely be identified; accuracy, the log should precisely point at the location of the error; error could be localized in the source file, line number; information content; be the information density of the log data good; it should contain important information; the real information content; information content could be interpreted; be the host, process, time, etc. identifiable based on the log; be the date of the event logged; be the timestamp logged, also the fractals of the seconds; be the log categorized (e.g., Info, error); be the severity of the error logged; be the flow control identifiable, transaction could be followed over the component boundaries; be context information logged to identify higher-level actions; logging exceptions appropriately; tracing exceptions only once, be it concise but be there stack trace; be the version of the software logged; logging environment variables; keeping the chronology in the sequence of the log events; be the build date logged; |
| Consistency | 2 | 34 | consequent log-level all over the application; be there log levels, and be they consistent; be the logging unified, the same error be logged with the same message each time, e.g., error code with a defined error message; consistent (the same log entry at the same error); |
| Design and Implementation | 12 | 148 | be it designed, not ad hoc; be it designed what data are logged (it is frequently inadequate on newly developed software parts); be the size of the log file not too big; be the size of the log file manageable; size of the log; be the log written possibly in one file or the different log files could be joined; Error-free logging of information content; define the data to be contained in the log; easy configuration; be the logging trustworthy from technical point of view; event driven logging, where needed, there more logs, where not needed less logs; log processing could be automatized; be the structure of log the same at different applications belonging to the same application domain; Error-free implementation of logging (not the errors of logs be logged); standard implementation for logging and using log frameworks; performance of automatic parsing; |
| Legibility | 6 | 232 | well-structured; be well-structured, and clear; be it clear and well-arranged; be it well structured; be the log appropriately segmented in the case of multithreaded, multi-component applications; format of the log; be it easily legible, user-friendly; legibility; be it easily legible; be the variable values logged, be it in a legible manner not just object references, the same for functions; good legibility, formatting (e.g., not a full xml file in one line); search the log with ease; searchability; be it easy to search in the log; searchability; be it readable in text format, possibly without an external tool; the language of logging be unified, e.g., English; performance of the search in the log; |
| Performance | 2 | 23 | performance (time behaviour); performance with regard to storage; performance with regard to storage and space utilization; |
| Security | 4 | 40 | data safety regulation satisfied; GDPR (protecting personal data); conformance with data protection regulations, protection of data, be the passwords not logged; be the logging trustworthy from audit point of view, no data tempering; tampering could be ruled out; authentication for the logging, so that one could see who contributed the log entry; protection of personal data; |
Table A3.
Output of Data Coding Cycle, Final Clusters.
| Clusters | Items in the Cluster | Score of Importance | Description |
|---|---|---|---|
| Accuracy | 13 | 521 | no superfluous redundancies; be the log messages definite, concise with appropriate details; be it detailed; conciseness; Appropriate amount of information, conciseness; how detailed the log is; how repetitive the log is; the call stack could be seen; coverage, be it detailed; location in the code; the source of the log message could definitely be identified; accuracy, the log should precisely point at the location of the error; error could be localized in the source file, line number; information content; be the information density of the log data good; it should contain important information; the real information content; information content could be interpreted; be the host, process, time, etc. identifiable based on the log; be the date of the event logged; be the timestamp logged, also the fractals of the seconds; be the log categorized (e.g., Info, error); be the severity of the error logged; be the flow control identifiable, transaction could be followed over the component boundaries; be context information logged to identify higher-level actions; logging exceptions appropriately; tracing exceptions only once, be it concise but be there stack trace; be the version of the software logged; logging environment variables; keeping the chronology in the sequence of the log events; be the build date logged; consequent log-level all over the application; be there log levels, and be they consistent; be the logging unified, the same error be logged with the same message each time, e.g., error code with a defined error message; consistent (the same log entry at the same error); |
| Legibility | 6 | 232 | well-structured; be well-structured, and clear; be it clear and well-arranged; be it well structured; be the log appropriately segmented in the case of multithreaded, multi-component applications; format of the log; be it easily legible, user-friendly; legibility; be it easily legible; be the variable values logged, be it in a legible manner not just object references, the same for functions; good legibility, formatting (e.g., not a full xml file in one line); search the log with ease; searchability; be it easy to search in the log; searchability; be it readable in text format, possibly without an external tool; the language of logging be unified, e.g., English; performance of the search in the log; |
| Design and Implementation | 16 | 187 | be the logs accessible and processable even in the case of critical system errors; be it centrally available; be it designed, not ad hoc; be it designed what data are logged (it is frequently inadequate on newly developed software parts); be the size of the log file not too big; be the size of the log file manageable; size of the log; be the log written possibly in one file or the different log files could be joined; Error-free logging of information content; define the data to be contained in the log; easy configuration; be the logging trustworthy from technical point of view; event driven logging, where needed, there more logs, where not needed less logs; log processing could be automatized; be the structure of log the same at different applications belonging to the same application domain; Error-free implementation of logging (not the errors of logs be logged); standard implementation for logging and using log frameworks; performance of automatic parsing; performance (time behaviour); performance with regard to storage; performance with regard to storage and space utilization; |
| Security | 4 | 40 | data safety regulation satisfied; GDPR (protecting personal data); conformance with data protection regulations, protection of data, be the passwords not logged; be the logging trustworthy from audit point of view, no data tempering; tampering could be ruled out; authentication for the logging, so that one could see who contributed the log entry; protection of personal data; |
Appendix C. Execution Tracing Quality Property Candidates Extracted from the Literature
Appendix C.1. Queries Issued in the Scientific Archives
The logical query: (“execution tracing” OR logging) AND quality AND maintainability AND software AND (model OR framework) was formed in the different specific databases as shown below:
- ACM
- (a)
- Search term: recordAbstract:(+(“execution tracing” logging) +quality +maintainability +software +(model framework))
- (b)
- Search term: (+(“execution tracing” logging) +quality +maintainability +software +(model framework))Database: Full-text, hosted
- (c)
- Search term: (+(“execution tracing” logging) +quality +maintainability +software +(model framework))Database: Full-text, ACM Guide
- EBSCOSearch term: (“execution tracing” OR logging) AND quality AND maintainability AND software AND (model OR framework)Searching: Academic Search Premier DBJournal type: Peer-reviewed
- IEEESearch term: (“execution tracing” OR logging) AND quality AND maintainability AND software AND (model OR framework)Search Type: Abstract search
- Science DirectSearch term: (“execution tracing” OR logging) AND quality AND maintainability AND software AND (model OR framework) AND (measure OR measurement))Subject: Computer ScienceFields: title-abstr-key
- ScopusSearch term: (“execution tracing” OR logging) AND quality AND maintainability AND software AND (model OR framework)Metadata: title, keyword, abstract
- Web of ScienceSearch term: TS=((“execution tracing” OR logging) AND quality AND maintainability AND software AND (model OR framework))Language: EnglishDatabases: (1) Science Citation Index Expanded (SCI-EXPANDED), (2) Conference Proceedings Citation Index- Science (CPCI-S)
Appendix C.2. Transcription
As a first step, in the course of data coding we take the explicitly named quality properties and the properties that are not directly named just paraphrased. These implicitly named quality properties we transcribe to explicit quality properties. E.g.: A wish articulated in the text: “[…] Each of these [log] fields are separated by the |(pipe) symbol. […]” [102] requires the quality properties: legibility and structure of the execution trace file.
Appendix C.3. Clustering
As a further step in the data coding, we list all the identified text parts from the publications related to the quality property candidates and group the similar ones in one cluster while we keep the distant ones in separate clusters. This way four clusters could be constructed as shown below.
Appendix C.3.1. Quality Property Cluster: Design and Implementation
The cluster contains all implementation related quality property candidates identified. This cluster possesses the highest variance with regard to its items in comparison to the other clusters introduced.
Table A4.
Data Coding, Transcription: Quality Properties from the Literature.
| ID | Quality Property Related Text Extracted, Transcribed | Reference |
|---|---|---|
| 1 | -performant -flexible to extend -reliable -scalable to deal with increasing data volume -capable to deal with synchronisation | [101] |
| 2 | -capable to measure performance at different levels of the architecture -reliable not to loose any log entries | [107] |
| 3 | -not to impact application performance -monitoring use: be it adaptive to determine the sampling frequency to monitor a resource | [108] |
| 4 | -a logging mechanism be present -log files be legible -timestamps be logged, in the case of more nodes, the clocks be synchronized -logging be performant -different severity levels -unique identifier for actions -being able to process the log files automatically (e.g., filtering duplicate entries) -dashboard with the most important statistics -capability of performing queries on timestamps -prediction of the system availability based on logs | [102] |
| 5 | -timestamp be logged -user id be logged -location information be logged -file system metadata (modified, accessed, changed times), file recovery be logged -log file could not be tempered | [103] |
| 6 | -accurate -secure (no fake actions, no log violation, avoid being compromised) -performant | [109] |
| 7 | -performance -no negative impact on the performance of the application -capability of fine-grained performance measurements across application component boundaries -capability to be changed by configuration -capability to determine the user actions based on the log | [110] |
| 8 | -trace code insertion be automatic, manual is error-prone | [111] |
| 9 | -capability for both analysis of errors and auditing -capability of usage statistic creation -capability of performance analysis -capability to measure quality of service metrics for Service-Level License Agreements (SLA) -capability of replaying and simulating a sequence of actions based on the log -providing enough information, if an error is logged | [112] |
| 10 | -locate the logging mechanism in separate modules, do not mix it into the code of the application -the design needs to consider the logging mechanism | [113] |
| 11 | -capability to identify components -capability to identify actions -capability to identify the global business flows based on the trace data -capability to identify the time of the action -usability for (1) mode of activation possibly with or without restarting the application, (2) access mode to the trace data through APIs, log files or a separate monitoring system, (3) data availability as the things happen or only after the trace session is finished | [114] |
| 12 | -low performance impact on the application -multi-level severity: warning error, fatal, unhandled exception -capability to measure memory consumption and process time -capability for configuration, disable or enable tracing -capability to configure the output format: txt, db etc. | [115] |
| 13 | -precision to log enough information -consistent naming, no misleading entries in the log files | [116] |
| 14 | -capability for configuration -capability to log at different levels of severity -capability to measure performance with different granularities (not only response time but the quality of data returned during this time) -low performance impact on the application | [117] |
| 15 | -performance -capability to log enough information -capability to correlate actions on different nodes (distributed applications) -keep the perturbations minimal the tracing causes in the application -capability to identify the inputs and outputs where the data come from and where they go to -capability to identify task switches, which task when (real-time) -capability to log interrupts (real-time) -capability to log tick rate -capability to log CPU usage -capability to log memory usage -capability to log network utilisation -capability to log the state of the real-time kernel and answer questions such as: Which tasks are waiting for their turn to execute (waiting queue, list, or table)? Which task is running? Which tasks are blocked? | [8] |
Table A5.
Quality Property Cluster: Design and Implementation.
| Cluster Name: Design and Implementation | |
|---|---|
| Publication ID | Quality Property Related Text Extracted, Transcribed |
| 1 | flexible to extend |
| 1 | reliable |
| 1 | scalable to deal with increasing data volume |
| 1 | capable to deal with synchronisation |
| 2 | capable to measure performance at different levels of the architecture |
| 2 | reliable not to loose any log entries |
| 3 | monitoring use: be it adaptive to determine the sampling frequency to monitor a resource |
| 4 | a logging mechanism be present |
| 4 | being able to process the log files automatically (e.g., filtering duplicate entries) |
| 4 | capability of performing queries on timestamps |
| 4 | prediction of the system availability based on logs |
| 5 | log file could not be tempered |
| 6 | secure (no fake actions, no log violation, avoid being compromised) |
| 7 | capability of fine-grained performance measurements across application component boundaries |
| 7 | capability to be changed by configuration |
| 8 | trace code insertion be automatic, manual is error-prone |
| 9 | capability of usage statistic creation |
| 9 | capability of performance analysis |
| 9 | capability to measure quality of service metrics for Service-Level License Agreements (SLA) |
| 9 | capability of replaying and simulating a sequence of actions based on the log |
| 10 | locate the logging mechanism in separate modules, do nor mix it into the code of the application |
| 10 | the design needs to consider the logging mechanism |
| 11 | usability for (1) mode of activation possibly with or without restarting the application, (2) access mode to the trace data through APIs, log files or a separate monitoring system, (3) data availability as the things happen or only after the trace session is finished |
| 12 | capability to measure memory consumption and process time |
| 12 | capability for configuration, disable or enable tracing |
| 12 | capability to configure the output format: txt, db etc. |
| 14 | capability for configuration |
| 14 | capability to measure performance with different granularities (not only response time but the quality of data returned during this time) |
| 15 | capability to correlate actions on different nodes (distributed applications) |
| 15 | keep the perturbations minimal the tracing causes in the application |
| 15 | capability to identify task switches, which task when (real-time) |
| 15 | capability to log interrupts (real-time) |
| 15 | capability to log tick rate |
| 15 | capability to log CPU usage |
| 15 | capability to log memory usage |
| 15 | capability to log network utilisation |
| 15 | capability to log the state of the real-time kernel: Which tasks are waiting for their turn to execute (waiting queue, list, or table)? Which task is running? Which tasks are blocked? |
Appendix C.3.2. Quality Property Cluster: Accuracy
The cluster contains all accuracy related quality property candidates identified. This cluster possesses higher variance than the cluster performance but it is relatively homogeneous.
Table A6.
Quality Property Cluster: Accuracy.
| Cluster Name: Accuracy | |
|---|---|
| Publication ID | Quality Property Related Text Extracted, Transcribed |
| 4 | timestamps be logged, in the case of more nodes, the clocks be synchronized |
| 4 | different severity levels |
| 4 | unique identifier for actions |
| 5 | timestamp be logged |
| 5 | user id be logged |
| 5 | location information be logged |
| 5 | file system metadata (modified, accessed, changed times), file recovery be logged |
| 6 | accurate |
| 7 | capability to determine the user actions based on the log |
| 9 | capability for both analysis of errors and auditing |
| 9 | providing enough information, if an error is logged |
| 11 | capability to identify components |
| 11 | capability to identify actions |
| 11 | capability to identify the global business flows based on the trace data |
| 11 | capability to identify the time of the action |
| 12 | multi-level severity: warning error, fatal, unhandled exception |
| 13 | precision to log enough information |
| 13 | consistent naming, no misleading entries in the log files |
| 14 | capability to log at different levels of severity |
| 15 | capability to log enough information |
| 15 | capability to identify the inputs and outputs where the data come from and where they go to |
Appendix C.3.3. Quality Property Cluster: Performance
The cluster contains all performance related quality property candidates identified. It homogeneous as the word “performance” or “performant” occurs in each extracted item.
Table A7.
Quality Property Cluster: Performance.
| Cluster Name: Performance | |
|---|---|
| Publication ID | Quality Property Related Text Extracted, Transcribed |
| 1 | performant |
| 3 | not to impact application performance |
| 4 | logging be performant |
| 6 | performant |
| 7 | performance |
| 7 | no negative impact on the performance of the application |
| 12 | low performance impact on the application |
| 14 | low performance impact on the application |
| 15 | performance |
Appendix C.3.4. Quality Property Cluster: Legibility and Interpretation
This cluster of items require that the trace output be legible and the most important data could be interpreted also in an aggregated manner. This group is relatively small in comparison to the previous clusters.
Table A8.
Quality Property Cluster: Legibility and Interpretation.
| Cluster Name: Legibility and Interpretation | |
|---|---|
| Publication ID | Quality Property |
| 4 | log files be legible |
| 4 | dashboard with the most important statistics |
References
- Galli, T.; Chiclana, F.; Carter, J.; Janicke, H. Modelling Execution Tracing Quality by Type-1 Fuzzy Logic. Acta Polytech. Hung. 2013, 8, 49–67. [Google Scholar] [CrossRef]
- Galli, T.; Chiclana, F.; Carter, J.; Janicke, H. Towards Introducing Execution Tracing to Software Product Quality Frameworks. Acta Polytech. Hung. 2014, 11, 5–24. [Google Scholar] [CrossRef]
- Galli, T. Fuzzy Logic Based Software Product Quality Model for Execution Tracing. Master’s Thesis, Centre for Computational Intelligence, De Montfort University, Leicester, UK, 2013. [Google Scholar]
- Park, I.; Buch, R. Improve Debugging and Performance Tuning with ETW. 2007. Available online: https://docs.microsoft.com/en-us/archive/msdn-magazine/2007/april/event-tracing-improve-debugging-and-performance-tuning-with-etw (accessed on 6 March 2021).
- Uzelac, V.; Milenkovic, A.; Burtscher, M.; Milenkovic, M. Real-time Unobtrusive Program Execution Trace Compression Using Branch Predictor Events. In Proceedings of the 2010 international conference on Compilers, Architectures and Synthesis for Embedded Systems (CASES 2010), Scottsdale, AZ, USA, 24–29 October 2010; ISBN 978-1-60558-903-9. [Google Scholar]
- Laddad, R. AspectJ in Action, 2nd ed.; Manning: Shelter Island, NY, USA, 2009. [Google Scholar]
- Godefroid, P.; Nagappan, N. Concurrency at Microsoft—An Exploratory Survey. 2007. Available online: https://patricegodefroid.github.io/publicpsfiles/ec2.pdf (accessed on 12 March 2019).
- Thane, H. Monitoring, Testing, and Debugging of Distributed Real-Time System. Ph.D. Thesis, Royal Institute of Technology, Stockholm, Sweden, 2002. Available online: http://www.mrtc.mdh.se/publications/0242.pdf (accessed on 20 February 2018).
- Galli, T.; Chiclana, F.; Siewe, F. Performance of Execution Tracing with Aspect-Oriented and Conventional Approaches. In Research and Evidence in Software Engineering, From Empirical Studies to Open Source Artifacts; Gupta, V., Gupta, C., Eds.; Taylor and Francis Group: Oxford, UK, 2021; pp. 1–40. [Google Scholar]
- Spinczyk, O.; Lehmann, D.; Urban, M. AspectC++: An AOP Extension for C++. Softw. Dev. J. 2005, 5, 68–74. [Google Scholar]
- Spring. Spring AOP APIs. Available online: https://docs.spring.io/spring/docs/current/spring-framework-reference/core.html#aop-api (accessed on 7 March 2020).
- Karahasanovic, A.; Thomas, R. Difficulties Experienced by Students in Maintaining Object-oriented Systems: An Empirical Study. In Proceedings of the 9th Australasian Conference on Computing Education, Australian Computer Society, Ballarat, Australia, 19–23 January 2007; pp. 81–87. [Google Scholar]
- Yuan, D.; Park, S.; Huang, P.; Liu, Y.; Lee, M.M.; Tang, X.; Zhou, Y.; Savage, S. Be Conservative: Enhancing Failure Diagnosis with Proactive Logging. In Proceedings of the 10th USENIX Symposium on Operating Systems Design and Implementation (OSDI 12), Hollywood, CA, USA, 8–10 October 2012; pp. 293–306. [Google Scholar]
- Yuan, D.; Park, S.; Zhou, Y. Characterizing Logging Practices in Open-Source Software. In Proceedings of the 34th International Conference on Software Engineering, ICSE ’12, Zurich, Switzerland, 2–9 June 2012; pp. 102–112. [Google Scholar]
- Chen, B.; Jiang, Z.M.J. Characterizing Logging Practices in Java-Based Open Source Software Projects—A Replication Study in Apache Software Foundation. Empir. Softw. Eng. 2017, 22, 330–374. [Google Scholar] [CrossRef]
- Li, Z.; Chen, T.H.P.; Yang, J.; Shang, W. Dlfinder: Characterizing and Detecting Duplicate Logging Code Smells. In Proceedings of the 41st International Conference on Software Engineering, ICSE ’19, Montréal, QC, Canada, 22–30 May 2019; pp. 152–163. [Google Scholar] [CrossRef]
- Hassani, M.; Shang, W.; Shihab, E.; Tsantalis, N. Studying and Detecting Log-Related Issues. Empir. Softw. Eng. 2018, 23, 3248–3280. [Google Scholar] [CrossRef] [Green Version]
- Chen, B.; Jiang, Z.M. Extracting and Studying the Logging-Code-Issue-Introducing Changes in Java-Based Large-Scale Open Source Software Systems. Empir. Softw. Eng. 2019, 24, 2285–2322. [Google Scholar] [CrossRef]
- Chen, B.; Jiang, Z.M.J. Characterizing and Detecting Anti-Patterns in the Logging Code. In Proceedings of the 39th International Conference on Software Engineering, ICSE ’17, Buenos Aires, Argentina, 22–30 May 2017; pp. 71–81. [Google Scholar] [CrossRef]
- Li, H.; Chen, T.H.P.; Shang, W.; Hassan, A.E. Studying Software Logging Using Topic Models. Empir. Softw. Engg. 2018, 23, 2655–2694. [Google Scholar] [CrossRef]
- International Organization for Standardization. ISO/IEC 25010:2011. Systems and Software Engineering–Systems and Software Quality Requirements and Evaluation (SQuaRE)–System and Software Quality Models; ISO: Geneva, Switzerland, 2011. [Google Scholar]
- International Organization for Standardization. ISO/IEC 9126-1:2001. Software Engineering–Product Quality–Part 1: Quality Model; ISO: Geneva, Switzerland, 2001. [Google Scholar]
- Li, H.; Shang, W.; Adams, B.; Sayagh, M.; Hassan, A.E. A Qualitative Study of the Benefits and Costs of Logging from Developers’ Perspectives. IEEE Trans. Softw. Eng. 2020. [Google Scholar] [CrossRef]
- Fu, Q.; Zhu, J.; Hu, W.; Lou, J.G.; Ding, R.; Lin, Q.; Zhang, D.; Xie, T. Where Do Developers Log? An Empirical Study on Logging Practices in Industry. In Proceedings of the 36th International Conference on Software Engineering, ICSE Companion2014, Hyderabad, India, 31 May–7 June 2014; Association for Computing Machinery: New York, NY, USA, 2014; pp. 24–33. [Google Scholar] [CrossRef]
- Zhu, J.; He, P.; Fu, Q.; Zhang, H.; Lyu, M.R.; Zhang, D. Learning to Log: Helping Developers Make Informed Logging Decisions. In Proceedings of the 37th International Conference on Software Engineering-Volume 1, ICSE ’15, Florence, Italy, 22–30 May 2015; pp. 415–425. [Google Scholar]
- Yao, K.; de Pádua, G.B.; Shang, W.; Sporea, C.; Toma, A.; Sajedi, S. Log4Perf: Suggesting and updating logging locations for web-based systems’ performance monitoring. Empir. Softw. Eng. 2020, 25, 488–531. [Google Scholar] [CrossRef]
- Zhao, X.; Rodrigues, K.; Luo, Y.; Stumm, M.; Yuan, D.; Zhou, Y. Log20: Fully Automated Optimal Placement of Log Printing Statements under Specified Overhead Threshold. In Proceedings of the 26th Symposium on Operating Systems Principles, SOSP ’17, Shanghai, China, 28 October 2017; Association for Computing Machinery: New York, NY, USA, 2017; pp. 565–581. [Google Scholar] [CrossRef] [Green Version]
- Ding, R.; Zhou, H.; Lou, J.G.; Zhang, H.; Lin, Q.; Fu, Q.; Zhang, D.; Xie, T. Log2: A Cost-Aware Logging Mechanism for Performance Diagnosis. In Proceedings of the 2015 USENIX Annual Technical Conference (USENIX ATC 15), Santa Clara, CA, USA, 8–10 July 2015; pp. 139–150. [Google Scholar]
- Yuan, D.; Zheng, J.; Park, S.; Zhou, Y.; Savage, S. Improving Software Diagnosability via Log Enhancement. In Proceedings of the Sixteenth International Conference on Architectural Support for Programming Languages and Operating Systems (ASPLOS XVI), Newport Beach, CA, USA, 5–11 March 2011; Association for Computing Machinery: New York, NY, USA, 2011; pp. 3–14. [Google Scholar] [CrossRef] [Green Version]
- Apache Software Foundation. Apache Commons Logging, Best Practices. 2014. Available online: http://commons.apache.org/proper/commons-logging/guide.html#JCL_Best_Practices (accessed on 4 September 2012).
- Zeng, Y.; Chen, J.; Shang, W.; Chen, T.H. Studying the characteristics of logging practices in mobile apps: A case study on F-Droid. Empir. Softw. Eng. 2019, 24, 3394–3434. [Google Scholar] [CrossRef]
- Kabinna, S.; Bezemer, C.P.; Shang, W.; Syer, M.D.; Hassan, A.E. Examining the Stability of Logging Statements. Empir. Softw. Eng. 2018, 23, 290–333. [Google Scholar] [CrossRef]
- Kabinna, S.; Bezemer, C.; Shang, W.; Hassan, A.E. Logging Library Migrations: A Case Study for the Apache Software Foundation Projects. In Proceedings of the 2016 IEEE/ACM 13th Working Conference on Mining Software Repositories (MSR), Austin, TX, USA, 14–15 May 2016; pp. 154–164. [Google Scholar]
- Shang, W.; Nagappan, M.; Hassan, A.E.; Jiang, Z.M. Understanding Log Lines Using Development Knowledge. In Proceedings of the 2014 IEEE International Conference on Software Maintenance and Evolution, Victoria, BC, Canada, 29 September–3 October 2014; pp. 21–30. [Google Scholar]
- Shang, W.; Nagappan, M.; Hassan, A.E. Studying the Relationship between Logging Characteristics and the Code Quality of Platform Software. Empir. Softw. Eng. 2015, 20, 1–27. [Google Scholar] [CrossRef]
- Galli, T.; Chiclana, F.; Siewe, F. Software Product Quality Models, Developments, Trends and Evaluation. SN Comput. Sci. 2020. [Google Scholar] [CrossRef]
- Balmas, F.; Bellingard, F.; Denier, S.; Ducasse, S.; Franchet, B.; Laval, J.; Mordal-Manet, K.; Vaillergues, P. Practices in the Squale Quality Model (Squale Deliverable 1.3). 2010. Available online: http://www.squale.org/quality-models-site/research-deliverables/WP1.3Practices-in-the-Squale-Quality-Modelv2.pdf (accessed on 16 November 2017).
- International Organization for Standardization. ISO/IEC 25023:2016. Systems and Software Engineering–Systems and Software Quality Requirements and Evaluation (SQuaRE)—Measurement of System and Software Product Quality; ISO: Geneva, Switzerland, 2016. [Google Scholar]
- International Organization for Standardization. ISO/IEC TR 9126-2:2003. Software Engineering–Product Quality–Part 2: External Metrics; ISO: Geneva, Switzerland, 2003. [Google Scholar]
- International Organization for Standardization. ISO/IEC TR 9126-3:2003. Software Engineering–Product Quality–Part 3: Internal Metrics; ISO: Geneva, Switzerland, 2003. [Google Scholar]
- Zhang, L.; Li, L.; Gao, H. 2-D Software Quality Model and Case Study in Software Flexibility Research. In Proceedings of the 2008 International Conference on Computational Intelligence for Modelling Control and Automation (CIMCA ’08), Vienna, Austria, 10–12 December 2008; IEEE Computer Society: Washington, DC, USA, 2008; pp. 1147–1152. [Google Scholar] [CrossRef]
- Khaddaj, S.; Horgan, G. A Proposed Adaptable Quality Model for Software Quality Assurance. J. Comput. Sci. 2005, 1, 482–487. [Google Scholar] [CrossRef] [Green Version]
- Horgan, G.; Khaddaj, S. Use of an adaptable quality model approach in a production support environment. J. Syst. Softw. 2009, 82, 730–738. [Google Scholar] [CrossRef]
- Boehm, B.W.; Brown, J.R.; Lipow, M. Quantitative Evaluation of Software Quality. In Proceedings of the 2nd International Conference on Software Engineering, San Francisco, CA, USA, 13–15 October 1976. [Google Scholar]
- Boehm, B.; Chulani, S. Modeling Software Defect Introduction and Removal—COQUALMO (Constructive QUALity Model); Technical Report, USC-CSE Technical Report; UCS Viterbi: Los Angeles, CA, USA, 1999. [Google Scholar]
- Madachy, R.; Boehm, B. Assessing Quality Processes with ODC COQUALMO. In Making Globally Distributed Software Development a Success Story; Springer: Berlin/Heidelberg, Germany, 2008; Volume 5007, pp. 198–209. [Google Scholar] [CrossRef]
- Dromey, R. A Model for Software Product Quality. IEEE Trans. Softw. Eng. 1995, 21, 146–162. [Google Scholar] [CrossRef] [Green Version]
- Kothapalli, C.; Ganesh, S.G.; Singh, H.K.; Radhika, D.V.; Rajaram, T.; Ravikanth, K.; Gupta, S.; Rao, K. Continual monitoring of Code Quality. In Proceedings of the 4th India Software Engineering Conference 2011, ISEC’11, Kerala, India, 23–27 February 2011; pp. 175–184. [Google Scholar] [CrossRef]
- Plösch, R.; Gruber, H.; Hentschel, A.; Körner, C.; Pomberger, G.; Schiffer, S.; Saft, M.; Storck, S. The EMISQ method and its tool support-expert-based evaluation of internal software quality. Innov. Syst. Softw. Eng. 2008, 4, 3–15. [Google Scholar] [CrossRef]
- Plösch, R.; Gruber, H.; Körner, C.; Saft, M. A Method for Continuous Code Quality Management Using Static Analysis. In Proceedings of the 2010 Seventh International Conference on the Quality of Information and Communications Technology, Porto, Portugal, 29 September–2 October 2010; pp. 370–375. [Google Scholar] [CrossRef]
- Grady, R.B.; Caswell, D.L. Software Metrics: Establishing a Company-Wide Program; Prentice-Hall: Upper Saddle River, NJ, USA, 1987. [Google Scholar]
- Grady, R.B. Practical Software Metrics for Project Management and Process Improvement; Prentice Hall: Upper Saddle River, NJ, USA, 1992. [Google Scholar]
- Eeles, P. Capturing Architectural Requirements. 2005. Available online: https://www.ibm.com/developerworks/rational/library/4706-pdf.pdf (accessed on 19 April 2018).
- Georgiadou, E. GEQUAMO—A Generic, Multilayered, Customisable, Software Quality Model. Softw. Qual. J. 2003, 11, 313–323. [Google Scholar] [CrossRef]
- van Solingen, R.; Berghout, E. The Goal/Question/Metric Method a Practical Guide for Quality Improvement of Software Development; McGraw Hill Publishing: London, UK, 1999. [Google Scholar]
- IEEE Computer Society. IEEE Stdandard 1061-1998: IEEE Standard for a Software Quality Metrics Methodology; IEEE: Piscataway, NJ, USA, 1998. [Google Scholar]
- Ouhbi, S.; Idri, A.; Fernández-Alemán, J.L.; Toval, A.; Benjelloun, H. Applying ISO/IEC 25010 on mobile personal health records. In Proceedings of the HEALTHINF 2015-8th International Conference on Health Informatics, Part of 8th International Joint Conference on Biomedical Engineering Systems and Technologies, (BIOSTEC 2015), Lisbon, Portugal, 12–15 January 2015; SciTePress: Groningen, The Netherlands, 2015; pp. 405–412. [Google Scholar]
- Idri, A.; Bachiri, M.; Fernández-Alemán, J.L. A Framework for Evaluating the Software Product Quality of Pregnancy Monitoring Mobile Personal Health Records. J. Med Syst. 2016, 40, 1–17. [Google Scholar] [CrossRef]
- Forouzani, S.; Chiam, Y.K.; Forouzani, S. Method for assessing software quality using source code analysis. In Proceedings of the ACM International Conference Proceeding Series, Kyoto, Japan, 17–21 December 2016; Association for Computing Machinery: New York, NY, USA; pp. 166–170. [Google Scholar] [CrossRef]
- Domínguez-Mayo, F.J.; Escalona, M.J.; Mejías, M.; Ross, M.; Staples, G. Quality evaluation for Model-Driven Web Engineering methodologies. Inf. Softw. Technol. 2012, 54, 1265–1282. [Google Scholar] [CrossRef]
- Idri, A.; Bachiri, M.; Fernandez-Aleman, J.L.; Toval, A. Experiment design of free pregnancy monitoring mobile personal health records quality evaluation. In Proceedings of the 2016 IEEE 18th International Conference on e-Health Networking, Applications and Services (Healthcom), Munich, Germany, 14–16 September 2016; pp. 1–6. [Google Scholar] [CrossRef]
- Shen, P.; Ding, X.; Ren, W.; Yang, C. Research on Software Quality Assurance Based on Software Quality Standards and Technology Management. In Proceedings of the 2018 19th IEEE/ACIS International Conference on Software Engineering, Artificial Intelligence, Networking and Parallel/Distributed Computing (SNPD), Busan, Korea, 27–29 June 2018; pp. 385–390. [Google Scholar] [CrossRef]
- Liu, X.; Zhang, Y.; Yu, X.; Liu, Z. A Software Quality Quantifying Method Based on Preference and Benchmark Data. In Proceedings of the 2018 19th IEEE/ACIS International Conference on Software Engineering, Artificial Intelligence, Networking and Parallel/Distributed Computing (SNPD), Busan, Korea, 27–29 June 2018; pp. 375–379. [Google Scholar] [CrossRef]
- Kanellopoulos, Y.; Tjortjis, C.; Heitlager, I.; Visser, J. Interpretation of source code clusters in terms of the ISO/IEC-9126 maintainability characteristics. In Proceedings of the European Conference on Software Maintenance and Reengineering, CSMR, Athens, Greece, 1–4 April 2008; pp. 63–72. [Google Scholar] [CrossRef]
- Vetro, A.; Zazworka, N.; Seaman, C.; Shull, F. Using the ISO/IEC 9126 product quality model to classify defects: A controlled experiment. In Proceedings of the 16th International Conference on Evaluation Assessment in Software Engineering (EASE 2012), Ciudad Real, Spain, 14–15 May 2012; pp. 187–196. [Google Scholar] [CrossRef] [Green Version]
- Parthasarathy, S.; Sharma, S. Impact of customization over software quality in ERP projects: An empirical study. Softw. Qual. J. 2017, 25, 581–598. [Google Scholar] [CrossRef]
- Li, Y.; Man, Z. A Fuzzy Comprehensive Quality Evaluation for the Digitizing Software of Ethnic Antiquarian Resources. In Proceedings of the 2008 International Conference on Computer Science and Software Engineering, Wuhan, China, 12–14 December 2008; Volume 5, pp. 1271–1274. [Google Scholar] [CrossRef]
- Hu, W.; Loeffler, T.; Wegener, J. Quality model based on ISO/IEC 9126 for internal quality of MATLAB/Simulink/Stateflow models. In Proceedings of the 2012 IEEE International Conference on Industrial Technology, Athens, Greece, 19–21 March 2012; pp. 325–330. [Google Scholar] [CrossRef]
- Liang, S.K.; Lien, C.T. Selecting the Optimal ERP Software by Combining the ISO 9126 Standard and Fuzzy AHP Approach. Contemp. Manag. Res. 2006, 3, 23. [Google Scholar] [CrossRef] [Green Version]
- Correia, J.; Visser, J. Certification of Technical Quality of Software Products. In Proceedings of the International Workshop on Foundations and Techniques for Open Source Software Certification, Milan, Italy, 10 September 2008; pp. 35–51. [Google Scholar]
- Andreou, A.S.; Tziakouris, M. A quality framework for developing and evaluating original software components. Inf. Softw. Technol. 2007, 49, 122–141. [Google Scholar] [CrossRef]
- Kim, C.; Lee, K. Software Quality Model for Consumer Electronics Product. In Proceedings of the 9th International Conference on Quality Software, Jeju, Korea, 24–25 August 2009; pp. 390–395. [Google Scholar]
- Benedicenti, L.; Wang, V.W.; Paranjape, R. A quality assessment model for Java code. In Proceedings of the Canadian Conference on Electrical and Computer Engineering, Winnipeg, MB, Canada, 12–15 May 2002; Volume 2, pp. 687–690. [Google Scholar]
- McCall, J.A.; Richards, P.K.; Walters, G.F. Factors in Software Quality, Concept and Definitions of Software Quality. 1977. Available online: http://www.dtic.mil/dtic/tr/fulltext/u2/a049014.pdf (accessed on 6 March 2018).
- Franke, D.; Weise, C. Providing a software quality framework for testing of mobile applications. In Proceedings of the 4th IEEE International Conference on Software Testing, Verification, and Validation, ICST 2011, Berlin, Germany, 21–25 March 2011; pp. 431–434. [Google Scholar] [CrossRef]
- Gleirscher, M.; Golubitskiy, D.; Irlbeck, M.; Wagner, S. Introduction of static quality analysis in small- and medium-sized software enterprises: Experiences from technology transfer. Softw. Qual. J. 2014, 22, 499–542. [Google Scholar] [CrossRef] [Green Version]
- Wagner, S.; Lochmann, K.; Heinemann, L.; as, M.K.; Trendowicz, A.; Plösch, R.; Seidl, A.; Goeb, A.; Streit, J. The Quamoco Product Quality Modelling and Assessment Approach. In Proceedings of the 34th International Conference on Software Engineering (ICSE ’12), Zurich, Switzerland, 2–9 June 2012; IEEE Press: Piscataway, NJ, USA, 2012; pp. 1133–1142. [Google Scholar]
- Wagner, S.; Lochmann, K.; Winter, S.; Deissenboeck, F.; Juergens, E.; Herrmannsdoerfer, M.; Heinemann, L.; Kläs, M.; Trendowicz, A.; Heidrich, J.; et al. The Quamoco Quality Meta-Model. 2012. Available online: https://mediatum.ub.tum.de/attfile/1110600/hd2/incoming/2012-Jul/517198.pdf (accessed on 18 November 2017).
- Wagner, S.; Goeb, A.; Heinemann, L.; Kläs, M.; Lampasona, C.; Lochmann, K.; Mayr, A.; Plösch, R.; Seidl, A.; Streit, J.; et al. Operationalised product quality models and assessment: The Quamoco approach. Inf. Softw. Technol. 2015, 62, 101–123. [Google Scholar] [CrossRef] [Green Version]
- Hyatt, L.E.; Rosenberg, L.H. A Software Quality Model and Metrics for Identifying Project Risks and Assessing Software Quality. In Proceedings of the Product Assurance Symposium and Software Product Assurance Workshop, EAS SP-377, Noordwijk, The Netherlands, 19–21 March 1996. [Google Scholar]
- Martin, R.A.; Shafer, L.H. Providing a Framework for effective software quality assessment—A first step in automating assessments. In Proceedings of the First Annual Software Engineering and Economics Conference, McLean, VA, USA, 2–3 April 1996. [Google Scholar]
- Côté, M.A.; Suryn, W.; Martin, R.A.; Laporte, C.Y. Evolving a Corporate Software Quality Assessment Exercise: A Migration Path to ISO/IEC 9126. Softw. Qual. Prof. 2004, 6, 4–17. [Google Scholar]
- Letouzey, J.L.; Coq, T. The SQALE Analysis Model: An Analysis Model Compliant with the Representation Condition for Assessing the Quality of Software Source Code. In Proceedings of the 2010 Second International Conference on Advances in System Testing and Validation Lifecycle, Nice, France, 22–27 August 2010; pp. 43–48. [Google Scholar]
- Letouzey, J.L. Managing Large Application Portfolio with Technical Debt Related Measures. In Proceedings of the Joint Conference of the International Workshop on Software Measurement and the International Conference on Software Process and Product Measurement (IWSM-MENSURA), Berlin, Germany, 5–7 October 2016; p. 181. [Google Scholar] [CrossRef]
- Letouzey, J.L. The SQALE method for evaluating Technical Debt. In Proceedings of the Third International Workshop on Managing Technical Debt (MTD), Zurich, Switzerland, 5 June 2012; pp. 31–36. [Google Scholar] [CrossRef]
- Letouzey, J.; Coq, T. The SQALE Models for Assessing the Quality of Real Time Source Code. 2010. Available online: https://pdfs.semanticscholar.org/4dd3/a72d79eb2f62fe04410106dc9fcc27835ce5.pdf?ga=2.24224186.1861301954.1500303973-1157276278.1497961025 (accessed on 17 July 2017).
- Letouzey, J.L.; Ilkiewicz, M. Managing Technical Debt with the SQALE Method. IEEE Softw. 2012, 29, 44–51. [Google Scholar] [CrossRef]
- Letouzey, J.L.; Coq, T. The SQALE Quality and Analysis Models for Assessing the Quality of Ada Source Code. 2009. Available online: http://www.adalog.fr/publicat/sqale.pdf (accessed on 17 July 2017).
- Hegeman, J.H. On the Quality of Quality Models. Master’s Thesis, University Twente, Enschede, The Netherlands, 2011. [Google Scholar]
- Letouzey, J.L. The SQALE Method for Managing Technical Debt, Definition Document V1.1. 2016. Available online: http://www.sqale.org/wp-content/uploads//08/SQALE-Method-EN-V1-1.pdf (accessed on 2 August 2017).
- Mordal-Manet, K.; Balmas, F.; Denier, S.; Ducasse, S.; Wertz, H.; Laval, J.; Bellingard, F.; Vaillergues, P. The Squale Model—A Practice-Based Industrial Quality Model. 2009. Available online: https://hal.inria.fr/inria-00637364 (accessed on 6 March 2018).
- Laval, J.; Bergel, A.; Ducasse, S. Assessing the Quality of your Software with MoQam. 2008. Available online: https://hal.inria.fr/inria-00498482 (accessed on 6 March 2018).
- INRIA RMoD, Paris 8, Qualixo. Technical Model for Remediation (Workpackage 2.2). 2010. Available online: http://www.squale.org/quality-models-site/research-deliverables/WP2.2Technical-Model-for-Remediationv1.pdf (accessed on 16 November 2017).
- Kitchenham, B.; Linkman, S.; Pasquini, A.; Nanni, V. The SQUID approach to defining a quality model. Softw. Qual. J. 1997, 6, 211–233. [Google Scholar] [CrossRef]
- Ulan, M.; Hönel, S.; Martins, R.M.; Ericsson, M.; Löwe, W.; Wingkvist, A.; Kerren, A. Quality Models Inside Out: Interactive Visualization of Software Metrics by Means of Joint Probabilities. In Proceedings of the 2018 IEEE Working Conference on Software Visualization (VISSOFT), Madrid, Spain, 24–25 September 2018; pp. 65–75. [Google Scholar] [CrossRef]
- Saldana, J. The Coding Manual for Qualitative Researchers; Sage: Southend Oaks, CA, USA, 2009. [Google Scholar]
- Kumar, R. Research Methodology, A Step-by-step Guide for Beginners; Sage: Southend Oaks, CA, USA, 2011. [Google Scholar]
- Malhotra, N.H. Marketingkutatas (Translated title: Marketing Research); Akademia Kiado: Budapest, Hungary, 2009. [Google Scholar]
- University of Cologne. Methodenpool: Brainstorming. Available online: http://methodenpool.uni-koeln.de/brainstorming/framesetbrainstorming.html (accessed on 16 March 2019).
- Isaksen, S.G.; Gaulin, J.P. A Reexamination of Brainstorming Research: Implications for Research and Practice. Gift. Chiled Q. 2005, 49, 315–329. [Google Scholar] [CrossRef]
- Tovarnak, D.; Pitner, T. Continuous Queries over Distributed Streams of Heterogeneous Monitoring Data in Cloud Datacenters. In Proceedings of the 9th International Conference on Software Engineering and Applications, Vienna, Austria, 29–31 August 2014. [Google Scholar]
- Nagappan, M.; Peeler, A.; Vouk, M. Modeling Cloud Failure Data: A Case Study of the Virtual Computing Lab. In Proceedings of the 2Nd International Workshop on Software Engineering for Cloud Computing (SECLOUD’11), Waikiki, HI, USA, 22 May 2011; ACM: New York, NY, USA, 2011; pp. 8–14. [Google Scholar] [CrossRef]
- Thorpe, S.; Ray, I.; Grandison, T.; Barbir, A. Cloud Log Forensics Metadata Analysis. In Proceedings of the 2012 IEEE 36th Annual Computer Software and Applications Conference Workshops, Izmir, Turkey, 16–20 July 2012; pp. 194–199. [Google Scholar] [CrossRef]
- Salkind, N.J. Exploring Research; Pearson, Prentice-Hall: Upper Saddle River, NJ, USA, 2009. [Google Scholar]
- Patino, C.M.; Ferreira, J.C. Internal and external validity: Can you apply research study results to your patients? J. Bras Pneumol. 2018, 44, 183. [Google Scholar] [CrossRef] [PubMed] [Green Version]
- International Organization for Sandardization. ISO/IEC 25021:2012. Software Engineerin-Software Product Quality Requirements and Evaluation (SQauRE)-Quality Measure Elements; ISO: Geneva, Switzerland, 2012. [Google Scholar]
- Apostol, G.C.; Pop, F. MICE: Monitoring high-level events in cloud environments. In Proceedings of the 2016 IEEE 11th International Symposium on Applied Computational Intelligence and Informatics (SACI), Timisoara, Romania, 12–14 May 2016; pp. 377–380. [Google Scholar] [CrossRef]
- Andreolini, M.; Colajanni, M.; Pietri, M.; Tosi, S. Real-time adaptive algorithm for resource monitoring. In Proceedings of the 9th International Conference on Network and Service Management (CNSM 2013), Zurich, Switzerland, 14–18 October 2013; pp. 67–74. [Google Scholar] [CrossRef]
- Khosravifar, B.; Bentahar, J.; Moazin, A.; Thiran, P. Analyzing Communities of Web Services Using Incentives. Int. J. Web Serv. Res. 2010, 7, 30–51. [Google Scholar] [CrossRef] [Green Version]
- Schmid, M.; Thoss, M.; Termin, T.; Kroeger, R. A Generic Application-Oriented Performance Instrumentation for Multi-Tier Environments. In Proceedings of the 10th IFIP/IEEE International Symposium on Integrated Network Management, Munich, Germany, 21–25 May 2007; pp. 304–313. [Google Scholar]
- Schmid, M.; Stein, T.; Thoss, M.; Kroeger, R. An Eclipse IDE Extension for Pattern-based Software Instrumentation. In Proceedings of the 14th GI/ITG Conference-Measurement, Modelling and Evalutation of Computer and Communication Systems, Dortmund, Germany, 31 March–2 April 2008; pp. 1–3. [Google Scholar]
- Vaculin, R.; Sycara, K. Semantic Web Services Monitoring: An OWL-S Based Approach. In Proceedings of the 41st Annual Hawaii International Conference on System Sciences, Waikoloa, HI, USA, 7–10 January 2008; p. 313. [Google Scholar] [CrossRef] [Green Version]
- Chang, C.K.; Tae-hyung, K. Distributed Systems Design Using Function-Class Decomposition with Aspects. In Proceedings of the 10th IEEE International Workshop on Future Trends of Distributed Computing Systems, Suzhou, China, 28 May 2004; pp. 148–153. [Google Scholar] [CrossRef]
- Karim, F.; Thanneer, H. A Classification Scheme for Evaluating Management Instrumentation in Distributed Middleware Infrastructure. In Proceedings of the 4th IEEE/IFIP Workshop on End-to-End Monitoring Techniques and Services, held in conjunction with 10th IEEE/IFIP Network Operations and Management Symposium, Vancouver, BC, Canada, 3 April 2006. [Google Scholar]
- Karim, F.; Thanneer, H. Automated Health-Assessment of Software Components Using Management Instrumentation. In Proceedings of the 30th Annual International Computer Software and Applications Conference, Chicaco, IL, USA, 17–21 September 2006; pp. 177–182. [Google Scholar] [CrossRef]
- Terada, N.; Kawai, E.; Sunahara, H. Extracting client-side streaming QoS information from server logs. In Proceedings of the IEEE Pacific Rim Conference on Communications, Computers and signal Processing, Victoria, BC, Canada, 24–26 August 2005; pp. 621–624. [Google Scholar] [CrossRef]
- Agarwala, S.; Chen, Y.; Milojicic, D.; Schwan, K. QMON: QoS- and Utility-Aware Monitoring in Enterprise Systems. In Proceedings of the IEEE International Conference on Autonomic Computing, Dublin, Ireland, 12–16 June 2006; pp. 124–133. [Google Scholar] [CrossRef] [Green Version]
Figure 1.
Identification of the Quality Properties of Execution Tracing.

Table 2.
Number of Items and Distribution of Importance Score in the Focus Groups.
| Group | Number of Items Identified | Number New Items Identified | Score Value Assigned to New Items | Number of Participants | Normalized Scrore Value of New Items for One Participant |
|---|---|---|---|---|---|
| 1. | 15 | 15 | 160 | 8 | 20 |
| 2. | 14 | 9 | 76 | 5 | 15.2 |
| 3. | 19 | 12 | 62 | 7 | 8.86 |
| 4. | 8 | 1 | 0 | 8 | 0 |
| 5. | 11 | 4 | 30 | 8 | 3.75 |
| 6. | 6 | 0 | 0 | 6 | 0 |
| 7. | 7 | 1 | 7 | 7 | 1 |
Publisher’s Note: MDPI stays neutral with regard to jurisdictional claims in published maps and institutional affiliations. |
© 2021 by the authors. Licensee MDPI, Basel, Switzerland. This article is an open access article distributed under the terms and conditions of the Creative Commons Attribution (CC BY) license (http://creativecommons.org/licenses/by/4.0/).
Share and Cite
MDPI and ACS Style
Galli, T.; Chiclana, F.; Siewe, F. Quality Properties of Execution Tracing, an Empirical Study. Appl. Syst. Innov. 2021, 4, 20. https://0-doi-org.brum.beds.ac.uk/10.3390/asi4010020
AMA Style
Galli T, Chiclana F, Siewe F. Quality Properties of Execution Tracing, an Empirical Study. Applied System Innovation. 2021; 4(1):20. https://0-doi-org.brum.beds.ac.uk/10.3390/asi4010020
Chicago/Turabian StyleGalli, Tamas, Francisco Chiclana, and Francois Siewe. 2021. "Quality Properties of Execution Tracing, an Empirical Study" Applied System Innovation 4, no. 1: 20. https://0-doi-org.brum.beds.ac.uk/10.3390/asi4010020