Article

Flexure Strength and Fracture Propagation in Zirconia Ceramic Composites with Exfoliated Graphene Nanoplatelets

by
Ángela Gallardo-López
1,*,
Javier Castillo-Seoane
1,2,
Carmen Muñoz-Ferreiro
1,
Cristina López-Pernía
1,
Ana Morales-Rodríguez
1 and
Rosalía Poyato
2
1
Departamento de Física de la Materia Condensada, ICMS, CSIC-Universidad de Sevilla, Avda. Reina Mercedes s/n, 41012 Sevilla, Spain
2
Instituto de Ciencia de Materiales de Sevilla, ICMS, CSIC-Universidad de Sevilla, Avda. Américo Vespucio 49, 41092 Sevilla, Spain
*
Author to whom correspondence should be addressed.
Submission received: 17 December 2019 / Revised: 19 February 2020 / Accepted: 28 February 2020 / Published: 5 March 2020
(This article belongs to the Special Issue Advances in Structural Ceramic Materials)

Abstract

:
In this work, the flexure strength and fracture propagation mechanisms in yttria tetragonal zirconia (3YTZP) dense composites with 1 and 5 vol.% exfoliated graphene nanoplatelets (e-GNP) were assessed. The composite powders were processed by dry planetary ball milling to exfoliate the as-received GNP, and then densified by spark plasma sintering (SPS). The hardness and Young’s modulus were measured by Vickers indentation and the impulse-echo technique, respectively. Flexural strength and modulus were estimated by four-point bending tests. Finally, cracks originated by Vickers indentations were analyzed by scanning electron microscopy (SEM). The Raman spectra and SEM observations showed a reduction in the number of graphene layers and most remarkably in the lateral size of the e-GNP, achieving a very homogeneous distribution in the ceramic matrix. The hardness, elastic modulus, and flexural strength of the 3YTZP matrix did not vary significantly with the addition of 1 vol.% e-GNP, but they decreased when the content increased to 5 vol.%. The addition of e-GNP to 3YTZP increased its reliability under bending, and the small lateral size of the e-GNP produced isotropic fracture propagation. However, the energy dissipation mechanisms conventionally attributed to the larger GNP such as fracture deflection or blocking were limited.

1. Introduction

Ceramics are intrinsically fragile, but they possess unique properties such as hardness, thermal stability, resistance to corrosion, etc. that make them very attractive for structural applications; thus, the search for possible reinforcements is always interesting. The use of secondary phases to reinforce ceramics has been extensively studied; however, only in the last few decades, the possibility of using nano-sized reinforcements as an alternative to fibers, whiskers, and conventional second phases has been considered. Among these nano-sized reinforcements, two-dimensional graphene-based nanomaterials (GBNs) are particularly interesting, not only because of the high surface area of graphene (~2600 m2∙g−1) [1], but also because of its extremely high tensile strength (130 GPa) and Young’s modulus (1 TPa) [2]. Furthermore, its extraordinary electrical and thermal conductivities can be useful for functional composites. The GBNs typically used as fillers in composites include multilayer graphene (up to 10 layers), few-layer graphene (n < 5) and cost-effective stacking of n > 10 graphene layers, known as graphene nanoplatelets (GNPs) [3,4,5].
The filler distribution in the matrix and the nature of the interfaces have a great influence on the properties of the GBN–ceramic composites. The interfaces depend on the ceramic matrix, the type of GBN, and the sintering conditions, and they are responsible for the load transfer between the matrix and the disperse phase; thus, they condition the fracture mode of the composite and the effectiveness of reinforcement mechanisms. The size and distribution of the filler in the matrix also plays a major role since disperse filler aggregates in a continuous matrix can act as stress concentrators [6]. Achieving a homogeneous dispersion of the filler in the ceramic matrix is one of the major issues in the fabrication of ceramic composites with GBN, which show a strong tendency to agglomerate due to their high surface area [5]. The use of high-energy planetary milling on thick and cost-effective GNP can exfoliate and reduce their lateral size [7,8], leading to a more homogeneous dispersion of the filler in the ceramic matrix and to an improved electrical conductivity of the composites [8]. However, the mechanical behavior (Young’s modulus, hardness, bending strength, fracture toughness, etc.) of composites with these exfoliated GNPs and improved homogeneity is yet to be assessed.
The literature on mechanical properties of ceramic composites with GBN reports a decrease in hardness and Young’s modulus with increasing GBN content [9,10,11,12,13,14,15], while the results on fracture toughness and flexural strength vary in a large range. Many authors estimated fracture toughness of ceramic GBN composites from direct crack measurement (DCM) after indentation tests (a quite simple and easy technique), but this method fails to provide reliable results with carbonaceous phases such as carbon nanotubes or graphite as fillers [16]. As an example, for Si3N4, DCM provides a fracture toughness value [17], which is 100% higher than that obtained by three-point bending tests [11].
Yttria tetragonal zirconia (3YTZP) matrix composites are very interesting for potential structural and biomedical applications due to the excellent toughness [18] and the high biocompatibility of tetragonal zirconia [19]. Different percentage increases in fracture toughness were measured in 3YTZP composites depending on the testing method and the type of GBN used. Fracture toughness enhancements up to 61% were reported for very low additions (0.01 wt.%) of few layered graphene [20] while more modest enhancements were reported for 4.1 vol.% reduced graphene oxide (rGO) addition [12] and 1 wt.% graphene oxide (GO) [21]. Recently, Obradovic and Kern [9] found only a slight increase (~2%) in fracture toughness in 3YTZP composites with 1–2 vol.% GNP content and a decrease for higher GNP contents, using indentation strength in bending (ISB). These authors compared DCM and ISB methods and concluded that DCM results fluctuated randomly; thus, this method is not reliable to test fracture toughness in 3YTZP–GNP composites.
With respect to the flexural strength, the best results reported are just modest increases in ceramic composites with small amounts of GBN [10,11]. The studies of flexural strength in 3YTZP composites are very recent and scarce. Li et al. [22] found no increase in flexural strength in three-point bending with addition of 0.5 to 1.5 wt.% GNP, although fracture toughness increased by 10% in single edge v-notched beam (SEVNB) for 1 wt.% GNP. Obradovic and Kern [9] tested composites with 1–4 vol.% GNP in four-point bending and found an exponential decrease in flexural strength with GNP addition, which was attributed to porosity and structural defects introduced by the GNP.
The microscopic toughening mechanisms also need to be examined to obtain a complete picture of the effect of graphene-based nanostructures on crack propagation. Energy dissipation mechanisms such as bridging, crack deflection, microcracking or secondary crack formation, interfacial friction, and crack tip blocking were observed in some ceramic matrices such as Si–O–C glass ceramics [23], SiAlON [24], or Al2O3 [25]. However, the effect of GBN on the crack propagation of composites with equiaxed matrix grains, such as the zirconia matrix, was not systematically assessed.
In this work, the reinforcement effect of exfoliated and well-dispersed GNP in spark plasma-sintered composites with a 3YTZP matrix was assessed based on a flexural strength evaluation and microstructural observation of the crack hindering mechanisms after Vickers indentation. The raw GNPs used in this work were different than those used by previous authors since they were thicker and more cost-effective, and the processing techniques and conditions were much more energetic and aggressive than previously reported. To optimize the microstructural homogeneity of the sintered composites, the composite powders with 1 and 5 vol.% GNP were prepared using a high-energy mixing technique in dry conditions to exfoliate and disperse the GNP in the ceramic powder. Other mechanical properties such as hardness and elastic modulus were also estimated and compared to those of a reference monolithic 3YTZP ceramic sintered in the same conditions.

2. Materials and Methods

2.1. Powder Processing and Sintering

The commercial 3YTZP powders (ref. TZ-3YB-E, Tosoh Europe B.V., Amsterdam, The Netherlands), with 40 nm particle size, were annealed at 850 °C for 30 min in air. The GNPs with lateral dimension <5 μm and 10–20 nm thickness (ref. N006-P), were acquired from Angstrong Materials (Dayton, OH, USA).
The composite powders with 1 and 5 vol.% GNP were prepared using a planetary ball mill (Pulverisette 7 classic line, Fritsch, Idar-Oberstein, Germany ICMS, CSIC-US) with a 45-mL zirconia jar and seven 15-mm-diameter zirconia balls. The milling process was carried out on the dry composite powders for 4 h at 350 rpm with a powder-to-ball weight ratio of 1:20. To check the actual C content in the composite powders, a TruSpec CHNS micro LECO elemental micro-analyzer was used as in previous works [26] (Centro de Investigación, Tecnología e Innovación de la Universidad de Sevilla, CITIUS). Samples consisting of 10 mg of composite powder were burned in pure oxygen at 100–1000 °C. This technique was not used for the composite powders with 1 vol.% GNP because this content was lower than the threshold detection limit of the equipment.
Sintering of the composites and of the monolithic reference 3YTZP was performed in an SPS equipment model 515 S, Dr. Sinter, Inc. (Kanagawa, Japan, CITIUS) with the conditions optimized in a previous work [26]. Basically, the conditions were 1250 °C for 5 min, at 75 MPa, with a 300 °C/min heating ramp and 50 °C/min cooling ramp. Cylindrical samples with 15 mm diameter and 3 mm thickness were obtained. The samples were lapped to remove the graphite paper adhered to their surface, and their bases were made parallel by a diamond grinding tool (Discoplan TS, Struers Suc. Spain, Madrid, Spain). A precision scale (Mettler Toledo H10, Columbus, OH, USA) with a special accessory for density determination using the Archimedes method was used to measure the experimental density of the sintered composites. To estimate their relative density, the theoretical density was calculated by the rule of mixtures, using the values given by the suppliers: 2.2 g/cm3 and 6.05 g/cm3 for GNP and 3YTZP, respectively. The sintered discs were cut with a low-speed precision saw (ISOMET 11-1180, Buehler LTD, Lake Bluff, IL, USA) to perform different characterization approaches in different test specimens.

2.2. Microstructural Characterization

To account for the structural integrity of the graphene nanostructures after powder processing and sintering, six to eight Raman spectra were acquired on the as-received GNP, the obtained powders after processing, and the fracture surface of the sintered composites. A dispersive microscope Raman Horiba Jobin Yvon LabRam HR800 (Horiba, Tokyo, Japan, ICMS) was used, with accessories and conditions specified elsewhere [26]. The first-order (from 1000 to 2000 cm−1) Raman spectra were fitted to a sum of five functions (two Gaussian functions and three pseudo-Voigt functions). In the second-order spectra (from 2550 to 2850 cm−1), two or three Lorentzian functions (depending on the sample) were used. The fits were carried out using OriginLab software.
The fracture surfaces of the composites were observed with a high-resolution SEM (HRSEM, S5200 HITACHI, Tokyo, Japan CITIUS), while the homogenization degree of the second phases on the zirconia matrix was assessed with a TENEO (FEI, Thermo Fisher, Cambridge, MA, USA) SEM (CITIUS), with two in-lens detectors which allow obtaining high-resolution images at short work distances. To account for any structural anisotropy of the composites due to the two-dimensional character of the fillers and the uniaxial pressure applied during sintering, the top surface and cross-section of each composite (perpendicular and parallel to the SPS pressure axis, respectively) were polished and observed with backscattered electrons (BSE) after receiving gold sputtering.
The grain size was measured on polished cross-sectional surfaces after annealing at 1150 °C for 15 min in air to reveal the grain boundaries. ImageJ and OriginLab were used to determine the relevant parameters. The planar equivalent diameter was taken as a measure of the grain size, averaging 200 to 300 grains for each composite, according to the UNE-EN ISO 13383-1:2016 standard.

2.3. Mechanical Characterization

Hardness was estimated from standard Vickers micro-indentations (Vickers Duramin indenter, Struers) performed on the mirror-polished surfaces of the composites. Two orientations were evaluated for each composition, top surface, and cross-section, to account for possible anisotropy effects. Ten indentations were performed on each surface with a 1.96 N applied load for 10 to 30 s. The hardness values were calculated using the equation HV (GPa) = 1854.4 P/D2, where P is the applied load (in N), and D the average diagonal of the imprint (in μm).
To observe the interaction between the graphene-based filler and the cracks propagating in the composites, Vickers indentations at 9.087 N (10 kp) were performed with a Wilson VH 1150 (Buehler) indenter on the two main surfaces, parallel and perpendicular to the SPS pressing axis. The indentations and induced cracks were examined by scanning electron microscopy (TENEO) and programs such as HDview (for high-resolution images) and MAPS (to combine images and describe large surfaces). Fracture toughness was estimated by the DCM method using the Anstis model [27] to have a rough approach. The models by Niihara [28], and Shetty [29] were also used for comparison.
Young’s modulus of the composites and the reference 3YTZP ceramic was estimated by the impulse excitation technique, measuring the acoustical response of disc-shaped samples to a short mechanical pulse, with Sonelastic® equipment and software (ATCP Physical Engineering, Ribeirão Preto, Brazil).
The flexural resistance of the monolithic 3YTZP and the composites was estimated from four-point bending tests performed on squared bars of 15 × 2 × 1 mm3. A minimum of four bars were tested for each composition to get a rough first overview of the behavior of the composites compared to the ceramic matrix. The surface in tension was polished up to 1 µm, and the edges were also chamfered with 10-µm and 2-µm diamond paste. Since the standards require 20-mm-long bars, and the maximum diameter allowed to fully densify the samples in our SPS unit is 15 mm, a special miniature assembly with 10 mm span was designed to adapt to the small size of the specimens [30]. This assembly was attached to a universal 1165 INSTRON (Norwood, MA, USA) machine. The tests were performed at room temperature with 0.5 mm/min scan speed.

3. Results and Discussions

3.1. Microstructural Characterization

The elemental microanalysis measured a C content of 5.07 ± 0.21 vol.% for the samples with 5 vol.% e-GNP nominal content, which means that no losses of ceramic or GNP took place during the powder processing.
The Raman spectra of the processed composite powders (after planetary ball milling) were normalized to the characteristic G band (Figure 1).
All the spectra present characteristic D and G peaks centered at ~1350 and ~1580 cm−1, respectively, as well as the splitting of 2D Raman-active bands centered at ~2700 cm−1. However, there were remarkable differences between the spectrum of the as-received GNP and the spectra of the composite powders after high-energy planetary ball milling. A significant increase in the D band can be observed in the spectra of the powders. Moreover, other peaks previously described in literature [31,32] as related to defects in graphene and carbon-based materials can be detected. These bands, referred to as D* (~1100–1200 cm−1), D” (~1500–1550 cm−1), and D’ (~1610–1620 cm−1) were almost impossible to detect in the spectrum of the as-received GNP, but were clearly visible in the spectra of the powders. Accordingly, all the first-order spectra were fitted to two Gaussian (D* and D”) and three pseudo-Voigt (D, G, and D’) functions.
A significant increase in the intensity (integrated area) ratios of all the defect-related peaks with respect to the G band was observed for the composites powders when compared to the as-received GNP (Table 1). Nevertheless, the increase was more remarkable for the composite with 1 vol.% e-GNP in all the cases. The drastic increase in the ID/IG ratio may indicate a reduction in the e-GNP lateral size due to the fracture of the nanoplatelets provoked by the planetary milling, although it is not possible to discard the promotion of structural defects in the GNP during milling. Moreover, the increase in the ID’/IG ratio would point to an exfoliation process resulting in a lower thickness of the GNP after milling. The D and D’ bands are related in the literature to defects related to graphene layer edges and surface graphene layers, respectively [33,34]. A drastic lateral size reduction effect in the GNP due to processing with planetary ball milling was also observed in a previous work for composites with 10 vol.% e-GNP [8]. The variation in the ID/IG ratio for the powders with different e-GNP content is also meaningful. The composite powders with 1 vol.% e-GNP exhibited the highest ID/IG ratio, which may indicate that ball milling is more effective in lateral size reduction of the GNP with a higher ceramic/GBN ratio. Milling of compositions with higher GNP content was less aggressive since the GNPs possess a lubricating effect [7,9].
Regarding the D” and D* peaks, which were previously related to the presence of amorphous carbon and sp2sp3 bonds, respectively [33,35], an increase in the intensity ratios was observed for both powders, being more significant for the composite powders with 1 vol.% e-GNP. This confirms that structural damage was introduced in the GNP during high-energy milling.
When analyzing the second-order spectra, a change in the shape of the 2D band was clearly observed on the spectra of the composites powders when compared to that of the as-received GNP. A fitting of the 2D band using two Lorentzian functions could be performed for the spectra of the as-received GNP (Figure A1a, Appendix A), which reveals that the nanoplatelets were formed by stacking of more than 10 graphene layers that present a 2D band similar to the one of graphite [34,36]. After milling of the powders, the shape of the 2D band was modified and did not correspond to the sum of two peaks. However, the altered shape of the spectra (probably related to the presence of structural defects) did not allow the deconvolution of peaks in order to establish the number of graphene layers in the nanoplatelets after the composite powder processing.
The measured density of the composite with 1 vol.% e-GNP was 5.97 ± 0.05 g/cm3 (99% relative density), while a similar density of 5.81 ± 0.10 g/cm3 (100% relative density) was obtained for the composite with 5 vol.% e-GNP. These values correspond to fully dense composites, and they are analogous to the densities measured in composites densified by the same SPS technique but obtained using milder powder processing techniques [26].
The Raman spectra of the sintered ceramic composites are presented in Figure 2. The intensity ratios obtained after fitting the first-order spectra to the five functions previously described (Table 1) reveal that, after sintering, the values for the two composites were very similar to each other. For the D* and D” peaks, the intensity ratios were also very close to those obtained for the as-received GNP. This reveals a recovery of the structural damage that was induced during milling of the powders, since it was reported that the ID”/IG ratio decreases as the crystallinity increases [35]. It was also found that the restoration of the graphene structure above 1000 °C is related to the smoothing of the ripples and roughness of the flakes, producing a drastic peak width decrease and 2D intensity enhancement [37]. On the other hand, the ID/IG and ID’/IG ratios were again higher than for the as-received GNP, confirming that the milling of the powders promotes a decrease of the lateral size and an exfoliation of the nanoplatelets. For the composite with 1 vol.% e-GNP, a decrease in ID/IG until reaching the same value as for the composite with 5 vol.% e-GNP was observed. The former had higher structural damage after milling, which was recovered during sintering of the composite.
The decrease in the number of structural defects also had an effect on the shape of the second-order spectra, which allowed the fitting of this part of the spectra for the sintered composites. The 2D band could be fitted to three Lorentzian functions (Figure A1b,c, Appendix A), revealing that the e-GNP filler presented a number of layers lower than 10 [34,36] in both sintered composites. Thus, it was confirmed that the high-energy milling provoked an exfoliation of the GNP during the powder processing, turning the nanoplatelets into multi-layered graphene.
The SEM micrographs of the composite polished surfaces annealed in air (Figure 3) show the presence of small voids dispersed next to the ceramic grains, in a higher number for the composite with the highest e-GNP content. These voids were probably produced by the combustion of the e-GNP during annealing in the presence of oxygen, explaining the greater number of voids in the composite with 5 vol.% e-GNP. However, some of them could also correspond to ceramic grains that were removed by pull-out during the grinding and polishing steps prior to the annealing.
A slight grain refinement can be observed in the composites (0.25 ± 0.11 and 0.20 ± 0.08 μm for 1 and 5 vol.% e-GNP, respectively), compared to the monolithic 3YTZP [26,38], in agreement with the ceramic grain growth inhibition effect of GNP reported in the literature [26]. The ceramic grains were in both cases almost equiaxed.
The low-magnification SEM micrographs of the polished cross-sections of the composites acquired using BSE (Figure 4) show a continuous light-gray area, corresponding to the 3YTZP matrix, and a discontinuous dark area, corresponding to the e-GNP. The e-GNP distribution achieved was quite homogeneous, and the planetary milling effect was very strong on the GNP size (Figure 4). Only some GNP aggregates with micrometric lateral size can be seen (Figure 4a), while the rest were broken and reduced to submicrometric size. In the composites with higher e-GNP content (5 vol.%; Figure 4b), we can observe a higher number of platelet-like e-GNPs, in agreement with the Raman results, which points to a less aggressive milling due to the lubricating effect of the GNPs. In this composite, the e-GNPs surround the ceramic grains creating a contouring effect. These e-GNPs, therefore, adopt the random orientation of the grain boundaries, as reported for higher e-GNP content [8], in contrast with the GNP preferential orientation (perpendicular to the pressing axis of the SPS) typically reported for ceramic composites prepared from powders not subjected to high-energy milling [26]. These observations indicate a microstructural isotropy of the composites from powders processed by planetary ball milling, with the e-GNPs surrounding the ceramic grains.

3.2. Mechanical Characterization

The results of the flexural strength of the tested materials are displayed in Table 2. The maximum flexural strength value was measured in a monolithic 3YTZP test specimen. However, considering the average performance, the composite with 1 vol.% e-GNP showed slightly superior results, exhibiting a 7% flexural strength increase with respect to the monolithic ceramic. The scarce agglomerates observed did not seem to have a negative effect on the flexural strength of the material reinforced with 1 vol.% GNP. The flexural strength decreased abruptly (~50% decrease) when the e-GNP content increased from 1 to 5 vol.%. Another remarkable fact is that the scatter of the data was lower in the composites compared to the monolithic ceramic, indicating a more reliable behavior in the composites. This is in agreement with the uncertainties observed in the data of flexural strength of similar composites by other authors [9], and it can be interpreted as a decrease in the brittleness of the 3YTZP ceramic as a consequence of the e-GNP addition. Our results of flexural strength for the monolithic 3YTZP are lower than previously reported ones [9,22]. For the composites, the absolute values of flexural strength are slightly higher than those reported by Obradovic and Kern [9] and coincident with those reported by Li et al. [22]. A decrease in flexural strength upon increasing the GNP content similar to our results was reported for 3YTZP [9,11], as well as for a Si3N4 matrix [11]. However, for this last matrix and rGO filler, a different trend was reported, with an increase in flexural strength with filler content up to 4 vol.% rGO [11].
The flexural modulus of the 3YTZP ceramic matrix, estimated from the slope of the first portion of the flexural stress–strain curves as described in ASTM D-790, increased by about 10% with the addition of 1 vol.% e-GNP (see Table 2). In contrast, the addition of 5 vol.% e-GNP resulted in a decrease in the flexural modulus. A remarkable fact is that the experimental uncertainty was much lower (an order of magnitude) in the composite with 1 vol.% e-GNP compared to the monolithic 3YTZP and to the 5 vol.% e-GNP composite. The low uncertainty value indicates a high reproducibility of the flexural modulus results and, therefore, an increased reliability of the composite with 1 vol.% e-GNP in bending conditions, in agreement with the results of flexural strength.
Although the elastic modulus under uniaxial stress conditions is equivalent to the flexural elastic modulus, our results show systematically higher values for the Young’s modulus measured by the acoustic technique (Figure 5). The behavior of the flexure modulus also differed from the Young’s modulus for low e-GNP contents. The Young’s modulus, E, decreased continuously with increasing e-GNP content (Table 3). The decrease in the elastic modulus with increasing GBN content was already reported for 3YTZP composites with GBN in our previous studies [39], and it can be attributed to the effect of adding a more elastic phase (GBN filler) to a rigid matrix (3YTZP ceramic in this case).
The hardness in the composites decreased with increasing e-GNP content, which is a well-known effect in these ceramic composites and a direct consequence of introducing a soft phase into a harder ceramic matrix. No mechanical anisotropy was detected for the composite with 5 vol.% e-GNP. The hardness values in this composite were identical to those reported for composites prepared without high-energy milling [26], but the composite with 1 vol.% e-GNP exhibited a slightly lower average hardness than the correspondent composite processed with ultrasonic mixing [26]. This decrease in hardness for the composite with a low content of exfoliated graphene nanoplatelets could be due to the more aggressive milling in this composite, as previously described in the Raman analysis.
The Vickers indentation imprints were well defined on the top surface of the studied composites (Figure 6), although some isolated cases of spalling were observed in composites with 5 vol.% e-GNP (not shown). The cracks arising from the corners of the imprints were quite straight, due to the small size of the e-GNP, which minimized deflection or deviation of the cracks. The crack length diminished in composites with increasing e-GNP content (see Table 4), and crack tortuosity increased slightly (Figure 6b,d), suggesting that a certain small crack propagation inhibition effect was exerted by the e-GNP.
The same crack behavior (shape and length) was observed when indentation was applied on the cross-sections of the composites (see Figure 6 and Table 4). This indicates an isotropic response to the crack propagation of these composites. The effect of increasing the e-GNP content was again a slight decrease in the crack length. This decrease was mainly caused by toughness enhancement mechanisms such as crack deflection by the e-GNP (Figure 7), which relieved the stress on the crack tip, thereby reducing the effective crack length. This mechanism was more effective with higher e-GNP content; thus, it was responsible for the increased tortuosity of the cracks observed in the composite with 5 vol.% e-GNP (Figure 7). The fracture toughness estimated by DCM using the Anstis model did not follow a clear trend with the e-GNP content. The Anstis equation was chosen since it was the most restrictive model, giving the lowest values for fracture toughness. Niihara’s equation gave higher values, showing a similar evolution of the fracture toughness with the GNP content. Shetty’s equation gave values between those for Anstis and Niihara with similar fracture toughness for both composites, slightly lower than the monolithic 3YTZP. Although these estimations of fracture toughness by DCM should not be taken as accurate values, they can give us a rough approach.
Additional cracks around the indentation imprints, just outside the plastic deformation zone, could be observed at high magnification in all the indented specimens (insets in Figure 6a,b). They correspond to shallow lateral cracks [40], a variant secondary crack system which has been reported in ceramic coatings on soft substrates. While lateral cracks in homogeneous materials develop typically well below the surface during unloading at high indentation loads, in non-homogeneous specimens with a surface hardened layer, the lateral crack may initiate much closer to the surface [41]. We may consider our composites as arrays of hard ceramic layers on top of softer GNP substrates. Since lateral cracks can cause chipping (when they nucleate and divert toward the surface), a shallower lateral crack formation would reduce the material removal rate during wear, increasing wear resistance [41]. Future studies will be carried out to check the tribological response and the fracture toughness of these composites.

4. Conclusions

Although the exfoliation and considerable lateral size reduction of GNPs by high-energy milling during powder processing in ceramic composites greatly increased their microstructural homogeneity and isotropy, the e-GNPs did not provide effective crack inhibition mechanisms to the studied 3YTZP composites. Few energy dissipation mechanisms were observed (only crack deflection), and only a weak isotropic inhibition effect on crack propagation was detected.
Both hardness and Young’s modulus decreased continuously upon increasing e-GNP content, as typically reported for ceramic composites with GBN.
The addition of 1 vol.% e-GNP slightly enhanced the flexural strength and flexural modulus of 3YTZP, while a remarkable decrease in both properties was measured for the composite with 5 vol.% e-GNP. However, the scatter of the flexural-strength results in the composites was considerably smaller than in 3YTZP, which points to a decrease in brittleness and a higher reliability of these composites when subjected to flexure stresses. Future work will be carried out to determine the adequate vol.% for an optimum resistance to flexure in these composites.

Author Contributions

Conceptualization, Á.G.-L. and R.P.; funding acquisition, Á.G.-L. and R.P.; investigation, J.C.-S., C.M.-F., C.L.-P., A.M.-R., R.P., and Á.G.-L.; methodology, J.C.-S., C.M.-F., C.L.-P., Á.G.-L., A.M.-R., and R.P.; supervision, Á.G.-L., A.M.-R., and R.P.; validation, Á.G.-L., A.M.-R., and R.P.; writing—original draft, Á.G.-L.; writing—review and editing, A.M.-R. and R.P. All authors read and agreed to the published version of the manuscript.

Funding

This research was funded by projects MAT 2015-67889-P (MINECO) and PGC 2018–101377–B-100 (MCIU/AEI/FEDER, UE). C. López-Pernía acknowledges the financial support of MCIU through the FPI contract ref: BES-2016-078711.

Acknowledgments

F. Gotor and J.M. Córdoba are also gratefully acknowledged for providing access to the planetary ball milling and their helpful advice.

Conflicts of Interest

The authors declare no conflicts of interest. The funders had no role in the design of the study; in the collection, analyses, or interpretation of data; in the writing of the manuscript, or in the decision to publish the results.

Appendix A

Supplementary data regarding the 2D band deconvolution of the Raman spectra are shown in Figure A1.
Figure A1. 2D band deconvolution for the (a) as-received GNP, (b) 1 vol.% e-GNP, and (c) 5 vol.% e-GNP sintered composites.
Ceramics 03 00009 g0a1

References

  1. Wang, X.; Dai, H. Etching and narrowing of graphene from the edges. Nat. Chem. 2010, 2, 661–665. [Google Scholar] [CrossRef] [PubMed]
  2. Lee, C.; Wei, X.; Kysar, J.W.; Hone, J. Measurement of the elastic properties and intrinsic strength of monolayer graphene. Science 2008, 321, 385–388. [Google Scholar] [CrossRef] [PubMed]
  3. Allen, M.J.; Tung, V.C.; Kaner, R.B. Honeycomb carbon: A review of graphene. Chem. Rev. 2010, 110, 132–145. [Google Scholar] [CrossRef] [PubMed]
  4. Geim, A.K.; Novoselov, K.S. The rise of graphene. Nat. Mater. 2007, 6, 183–191. [Google Scholar] [CrossRef]
  5. Singh, V.; Joung, D.; Zhai, L.; Das, S.; Khondaker, S.I.; Seal, S. Graphene based materials: Past, present and future. Prog. Mater. Sci. 2011, 56, 1178–1271. [Google Scholar] [CrossRef]
  6. París, F.; Cañas, J.; Marín, J.C.; Barroso, A. Introducción al análisis y diseño con materiales compuestos. Ed. Univ. Sevilla 2006. [Google Scholar]
  7. Michálková, M.; Kašiarová, M.; Tatarko, P.; Dusza, J.; Šajgalík, P. Effect of homogenization treatment on the fracture behaviour of silicon nitride/graphene nanoplatelets composites. J. Eur. Ceram. Soc. 2014, 34, 3291–3299. [Google Scholar] [CrossRef]
  8. López-Pernía, C.; Muñoz-Ferreiro, C.; González-Orellana, C.; Morales-Rodríguez, A.; Gallardo-López, Á.; Poyato, R. Optimizing the homogenization technique for graphene nanoplatelet/yttria tetragonal zirconia composites: Influence on the microstructure and the electrical conductivity. J. Alloys Compd. 2018, 767, 994–1002. [Google Scholar] [CrossRef]
  9. Obradović, N.; Kern, F. Properties of 3Y-TZP zirconia ceramics with graphene addition obtained by spark plasma sintering. Ceram. Int. 2018, 44, 16931–16936. [Google Scholar] [CrossRef]
  10. Rutkowski, P.; Klimczyk, P.; Jaworska, L.; Stobierski, L.; Zientara, D.; Tran, K. Mechanical properties of pressure sintered alumina-graphene composites. Mater. Ceram. 2016, 68, 168–175. [Google Scholar]
  11. Ramirez, C.; Miranzo, P.; Belmonte, M.; Isabel Osendi, M.; Poza, P.; Vega-Diaz, S.M.; Terrones, M. Extraordinary toughening enhancement and flexural strength in Si3N4 composites using graphene sheets. J. Eur. Ceram. Soc. 2014, 34, 161–169. [Google Scholar] [CrossRef]
  12. Shin, J.-H.; Hong, S.-H. Fabrication and properties of reduced graphene oxide reinforced yttria-stabilized zirconia composite ceramics. J. Eur. Ceram. Soc. 2014, 34, 1297–1302. [Google Scholar] [CrossRef]
  13. Kwon, S.-M.; Lee, S.-J.; Shon, I.-J. Enhanced properties of nanostructured ZrO2–graphene composites rapidly sintered via high-frequency induction heating. Ceram. Int. 2015, 41, 835–842. [Google Scholar] [CrossRef]
  14. Gómez-Gómez, A.; Ramírez, C.; Llorente, J.; Garcia, A.; Moreno, P.; Reveron, H.; Chevalier, J.; Osendi, M.I.; Belmonte, M.; Miranzo, P. Improved crack resistance and thermal conductivity of cubic zirconia containing graphene nanoplatelets. J. Eur. Ceram. Soc. 2020, 40, 1557–1565. [Google Scholar] [CrossRef] [Green Version]
  15. Balazsi, K.; Furkó, M.; Klimczyk, P.; Balázsi, C. Influence of Graphene and Graphene Oxide on Properties of Spark Plasma Sintered Si3N4 Ceramic Matrix. Ceramics 2020, 3, 40–50. [Google Scholar] [CrossRef] [Green Version]
  16. Wang, X.; Padture, N.P.; Tanaka, H. Contact-damage-resistant ceramic/single-wall carbon nanotubes and ceramic/graphite composites. Nat. Mater. 2004, 3, 539–544. [Google Scholar] [CrossRef]
  17. Walker, L.S.; Marotto, V.R.; Rafiee, M.A.; Koratkar, N.; Corral, E.L. Toughening in graphene ceramic composites. ACS Nano 2011, 5, 3182–3190. [Google Scholar] [CrossRef]
  18. Garvie, R.C.; Hannink, R.H.; Pascoe, R.T. Ceramic steel? Nature 1975, 258, 703–704. [Google Scholar] [CrossRef]
  19. Piconi, C.; Maccauro, G. Zirconia as a ceramic biomaterial. Biomaterials 1999, 20, 1–25. [Google Scholar] [CrossRef]
  20. Chen, F.; Jin, D.; Tyeb, K.; Wang, B.; Han, Y.-H.; Kim, S.; Schoenung, J.M.; Shen, Q.; Zhang, L. Field assisted sintering of graphene reinforced zirconia ceramics. Ceram. Int. 2015, 41, 6113–6116. [Google Scholar] [CrossRef]
  21. Ramesh, S.; Khan, M.M.; Chee, H.C.A.; Wong, Y.H.; Ganesan, P.; Kutty, M.G.; Sutharsini, U.; Chew, W.J.K.; Niakan, A. Sintering behaviour and properties of graphene oxide-doped Y-TZP ceramics. Ceram. Int. 2016, 42, 17620–17625. [Google Scholar] [CrossRef]
  22. Li, S.; Xie, Z.; Zhang, Y.; Zhou, Y. Enhanced toughness of zirconia ceramics with graphene platelets consolidated by spark plasma sintering. Int. J. Appl. Ceram. Technol. 2017, 14, 1062–1068. [Google Scholar] [CrossRef]
  23. Picot, O.T.; Rocha, V.G.; Ferraro, C.; Ni, N.; D’elia, E.; Meille, S.; Chevalier, J.; Saunders, T.; Peijs, T.; Reece, M.J. Using graphene networks to build bioinspired self-monitoring ceramics. Nat. Commun. 2017, 8, 14425. [Google Scholar] [CrossRef] [PubMed]
  24. Baskut, S.; Cinar, A.; Seyhan, A.T.; Turan, S. Tailoring the properties of spark plasma sintered SiAlON containing graphene nanoplatelets by using different exfoliation and size reduction techniques: Anisotropic electrical properties. J. Eur. Ceram. Soc. 2018, 38, 3787–3792. [Google Scholar] [CrossRef]
  25. Wang, Q.; Ramírez, C.; Watts, C.S.; Borrero-López, O.; Ortiz, A.L.; Sheldon, B.W.; Padture, N.P. Fracture, fatigue, and sliding-wear behavior of nanocomposites of alumina and reduced graphene-oxide. Acta Mater. 2020, 186, 29–39. [Google Scholar] [CrossRef]
  26. Gallardo-López, A.; Márquez-Abril, I.; Morales-Rodríguez, A.; Muñoz, A.; Poyato, R. Dense graphene nanoplatelet/yttria tetragonal zirconia composites: Processing, hardness and electrical conductivity. Ceram. Int. 2017, 43, 11743–11752. [Google Scholar] [CrossRef] [Green Version]
  27. Anstis, G.R.; Chantikul, P.; Lawn, B.R.; Marshall, D.B. A critical evaluation of indentation techniques for measuring fracture toughness: I, direct crack measurements. J. Am. Ceram. Soc. 1981, 64, 533–538. [Google Scholar] [CrossRef]
  28. Niihara, K. A fracture mechanics analysis of indentation-induced Palmqvist crack in ceramics. J. Mater. Sci. Lett. 1983, 2, 221–223. [Google Scholar] [CrossRef]
  29. Shetty, D.K.; Wright, I.G.; Mincer, P.N.; Clauer, A.H. Indentation fracture of WC-Co cermets. J. Mater. Sci. 1985, 20, 1873–1882. [Google Scholar] [CrossRef]
  30. Gallardo-López, A.; Poyato, R.; Morales-Rodríguez, A.; Fernández-Serrano, A.; Muñoz, A.; Domínguez-Rodríguez, A. Hardness and flexural strength of single-walled carbon nanotube/alumina composites. J. Mater. Sci. 2014, 49, 7116–7123. [Google Scholar] [CrossRef] [Green Version]
  31. Venezuela, P.; Lazzeri, M.; Mauri, F. Theory of double-resonant Raman spectra in graphene: Intensity and line shape of defect-induced and two-phonon bands. Phys. Rev. B-Condens. Matter Mater. Phys. 2011, 84, 1–25. [Google Scholar] [CrossRef] [Green Version]
  32. Pimenta, M.A.; Dresselhaus, G.; Dresselhaus, M.S.; Cançado, L.G.; Jorio, A.; Saito, R. Studying disorder in graphite-based systems by Raman spectroscopy. Phys. Chem. Chem. Phys. 2007, 9, 1276–1291. [Google Scholar] [CrossRef] [PubMed]
  33. Sadezky, A.; Muckenhuber, H.; Grothe, H.; Niessner, R.; Pöschl, U. Raman microspectroscopy of soot and related carbonaceous materials: Spectral analysis and structural information. Carbon N. Y. 2005, 43, 1731–1742. [Google Scholar] [CrossRef]
  34. Ferrari, A.C.; Basko, D.M. Raman spectroscopy as a versatile tool for studying the properties of graphene. Nat. Nanotechnol. 2013, 8, 235–246. [Google Scholar] [CrossRef] [PubMed] [Green Version]
  35. Claramunt, S.; Varea, A.; López-Díaz, D.; Velázquez, M.M.; Cornet, A.; Cirera, A. The importance of interbands on the interpretation of the raman spectrum of graphene oxide. J. Phys. Chem. C 2015, 119, 10123–10129. [Google Scholar] [CrossRef]
  36. Malard, L.M.; Pimenta, M.A.; Dresselhaus, G.; Dresselhaus, M.S. Raman spectroscopy in graphene. Phys. Rep. 2009, 473, 51–87. [Google Scholar] [CrossRef]
  37. Díez-Betriu, X.; Álvarez-García, S.; Botas, C.; Álvarez, P.; Sánchez-Marcos, J.; Prieto, C.; Menéndez, R.; De Andrés, A. Raman spectroscopy for the study of reduction mechanisms and optimization of conductivity in graphene oxide thin films. J. Mater. Chem. C 2013, 1, 6905–6912. [Google Scholar] [CrossRef]
  38. Gutiérrez-Mora, F.; Morales-Rodríguez, A.; Gallardo-López, A.; Poyato, R. Tribological behavior of graphene nanoplatelet reinforced 3YTZP composites. J. Eur. Ceram. Soc. 2019, 39, 1381–1388. [Google Scholar] [CrossRef]
  39. Muñoz-Ferreiro, C.; Morales-Rodríguez, A.; Rojas, T.C.; Jiménez-Piqué, E.; López-Pernía, C.; Poyato, R.; Gallardo-López, A. Microstructure, interfaces and properties of 3YTZP ceramic composites with 10 and 20 vol% different graphene-based nanostructures as fillers. J. Alloys Compd. 2019, 777, 213–224. [Google Scholar] [CrossRef]
  40. Muchtar, A.; Lim, L.C.; Lee, K.H. Finite element analysis of vickers indentation cracking processes in brittle solids using elements exhibiting cohesive post-failure behaviour. J. Mater. Sci. 2003, 38, 235–243. [Google Scholar] [CrossRef]
  41. Yonezu, A.; Xu, B.; Chen, X. Indentation induced lateral crack in ceramics with surface hardening. Mater. Sci. Eng. A 2009, 507, 226–235. [Google Scholar] [CrossRef]
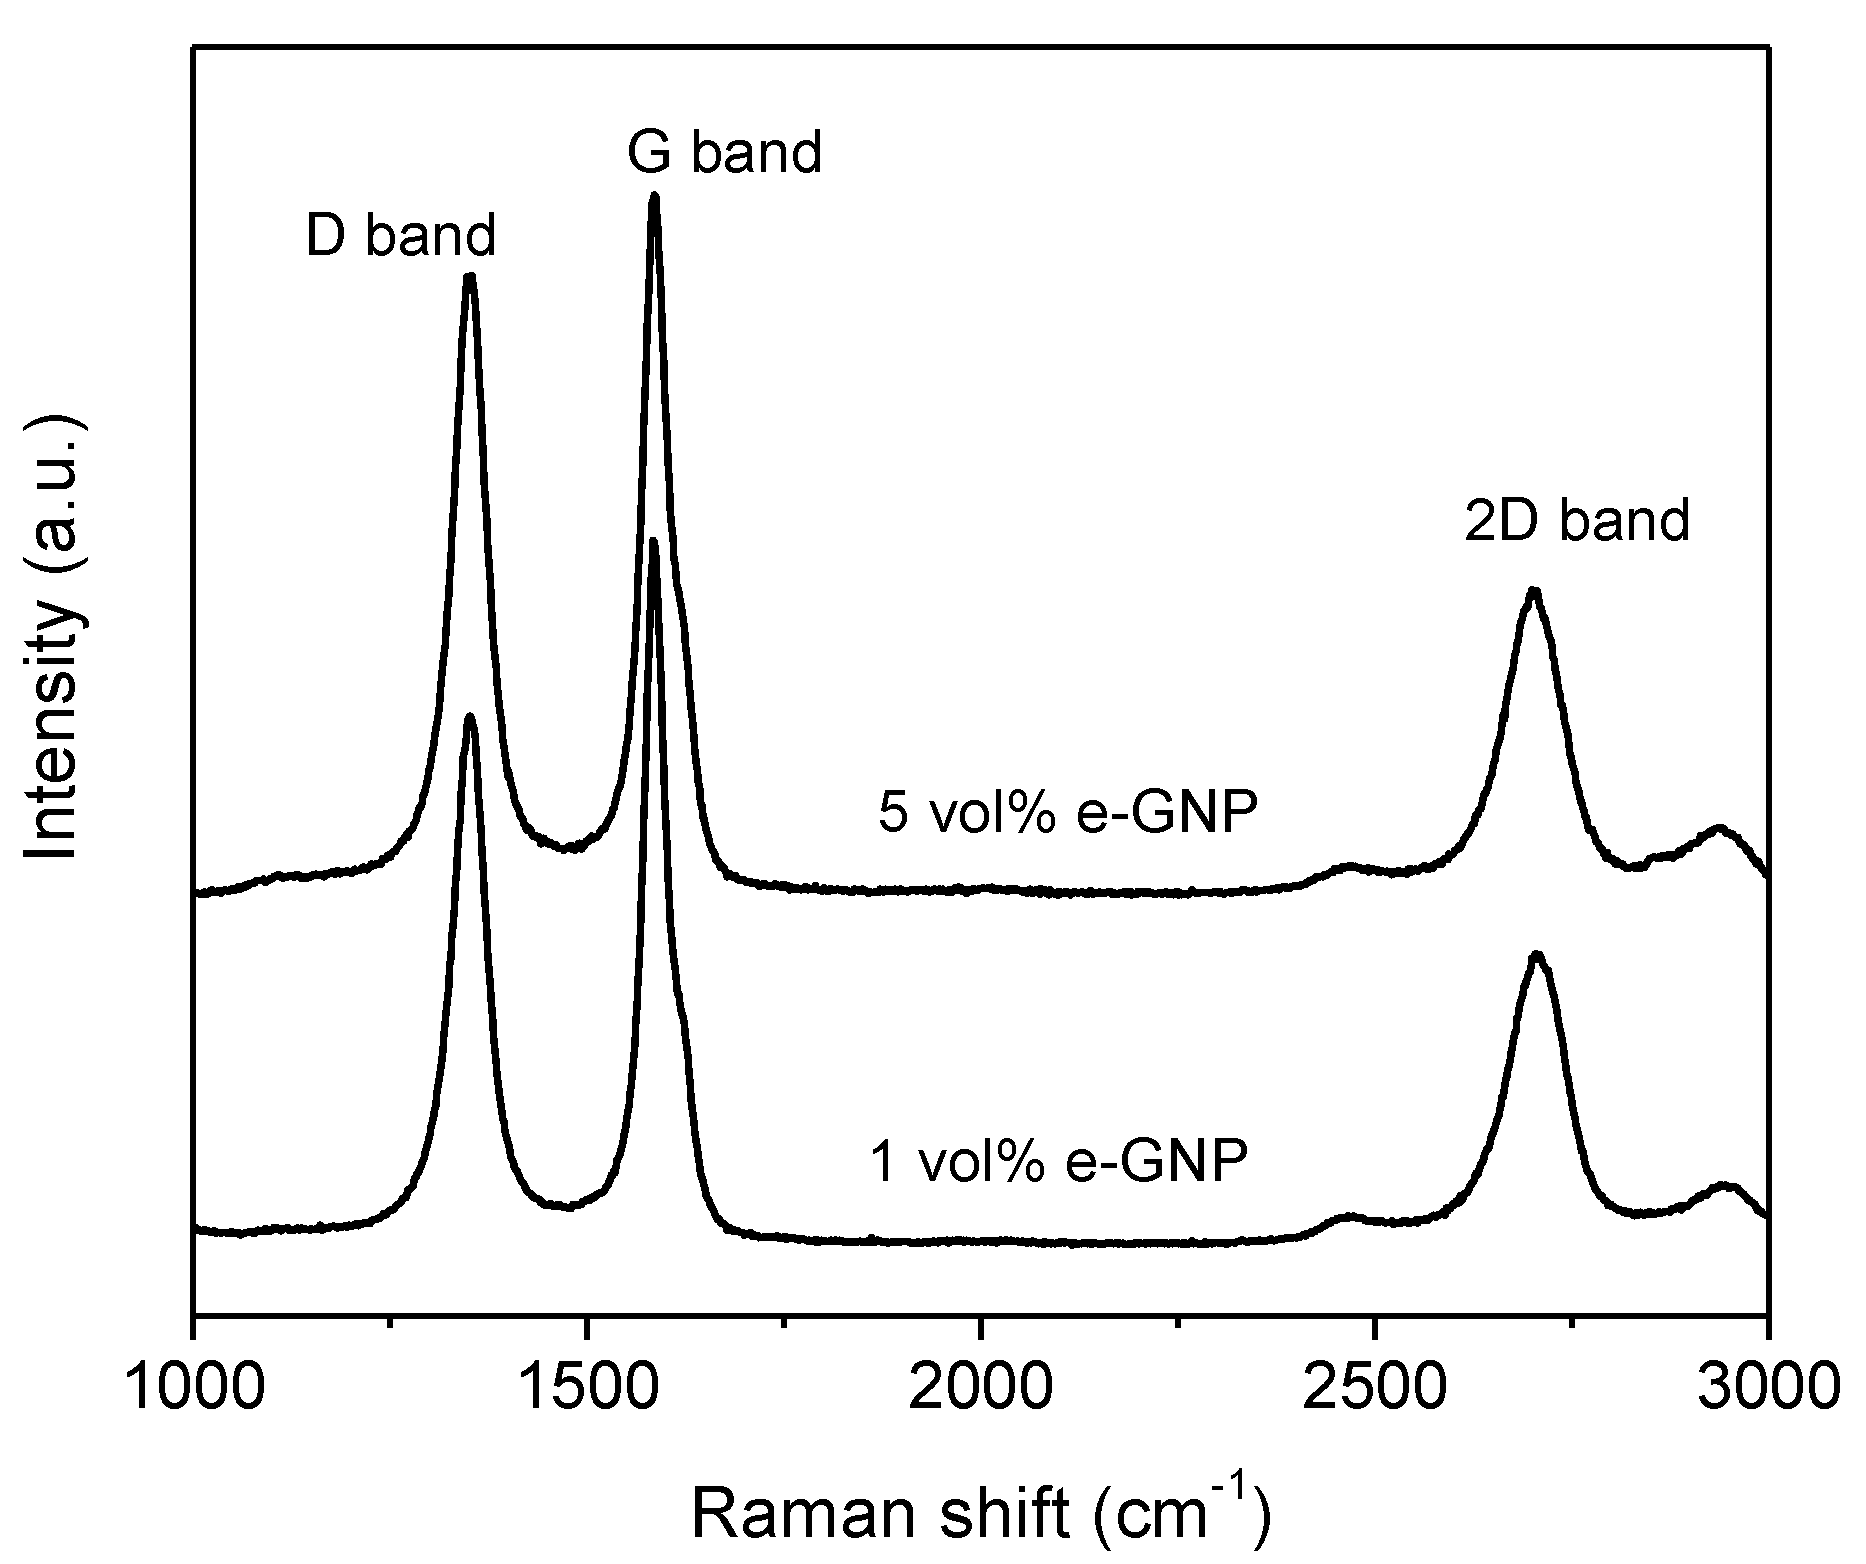
Figure 1. Raman spectra of the yttria tetragonal zirconia (3YTZP) composite powders with 1 and 5 vol.% exfoliated graphene nanoplatelets (e-GNP). The spectrum of the as-received GNP powder is plotted for comparison.
Ceramics 03 00009 g001
Figure 2. Raman spectra of the fracture surface of the sintered 3YTZP composites with 1 and 5 vol.% e-GNP.
Ceramics 03 00009 g002
Figure 3. Polished cross-section of the 3YTZP composites with (a) 1 vol.% e-GNP and (b) 5 vol.% e-GNP annealed in air.
Ceramics 03 00009 g003
Figure 4. Backscattered electron (BSE) SEM micrographs of the polished cross-sections of the composites with (a) 1 vol.% e-GNP and (b) 5 vol.% e-GNP.
Ceramics 03 00009 g004
Figure 5. Flexural strength and elastic modulus of the composites with 1 and 5 vol.% e-GNP compared to the reference 3YTZP matrix.
Ceramics 03 00009 g005
Figure 6. SEM micrographs of Vickers indentations at high loads on the polished top surface of the 3YTZP composites with (a) 1 and (b) 5 vol.% e-GNP (insets with enlarged areas showing cracks around the imprint) and on the polished cross-sections of the composites with (c) 1 and (d) 5 vol.% e-GNP.
Ceramics 03 00009 g006
Figure 7. SEM images showing horizontal indentation-induced cracks on the cross-section of the composites with (a) 1 vol.% and (b) 5 vol.% e-GNP.
Ceramics 03 00009 g007
Table 1. Intensity ratios of the D*, D, D”, and D’ peaks with respect to the G peak, obtained after fitting to two Gaussian (D* and D”) and three pseudo-Voigt (D, G, and D’) functions.
SampleID*/IGID/IGID”/IGID’/IG
As-received GNP0.04 ± 0.020.33 ± 0.090.014 ± 0.0060.028 ± 0.012
1 vol.% e-GNP powder0.15 ± 0.041.84 ± 0.110.07 ± 0.050.25 ± 0.04
5 vol.% e-GNP powder0.060 ± 0.0151.3 ± 0.40.036 ± 0.0080.18 ± 0.03
1 vol.% e-GNP sintered0.05 ± 0.031.24 ± 0.060.012 ± 0.0040.140 ± 0.004
5 vol.% e-GNP sintered0.052 ± 0.0111.25 ± 0.120.015 ± 0.0100.144 ± 0.020
Table 2. Flexural strength and flexural modulus of the reference monolithic 3YTZP and the composites with 1 and 5 vol.% e-GNP.
3YTZP1 vol.% e-GNP5 vol.% e-GNP
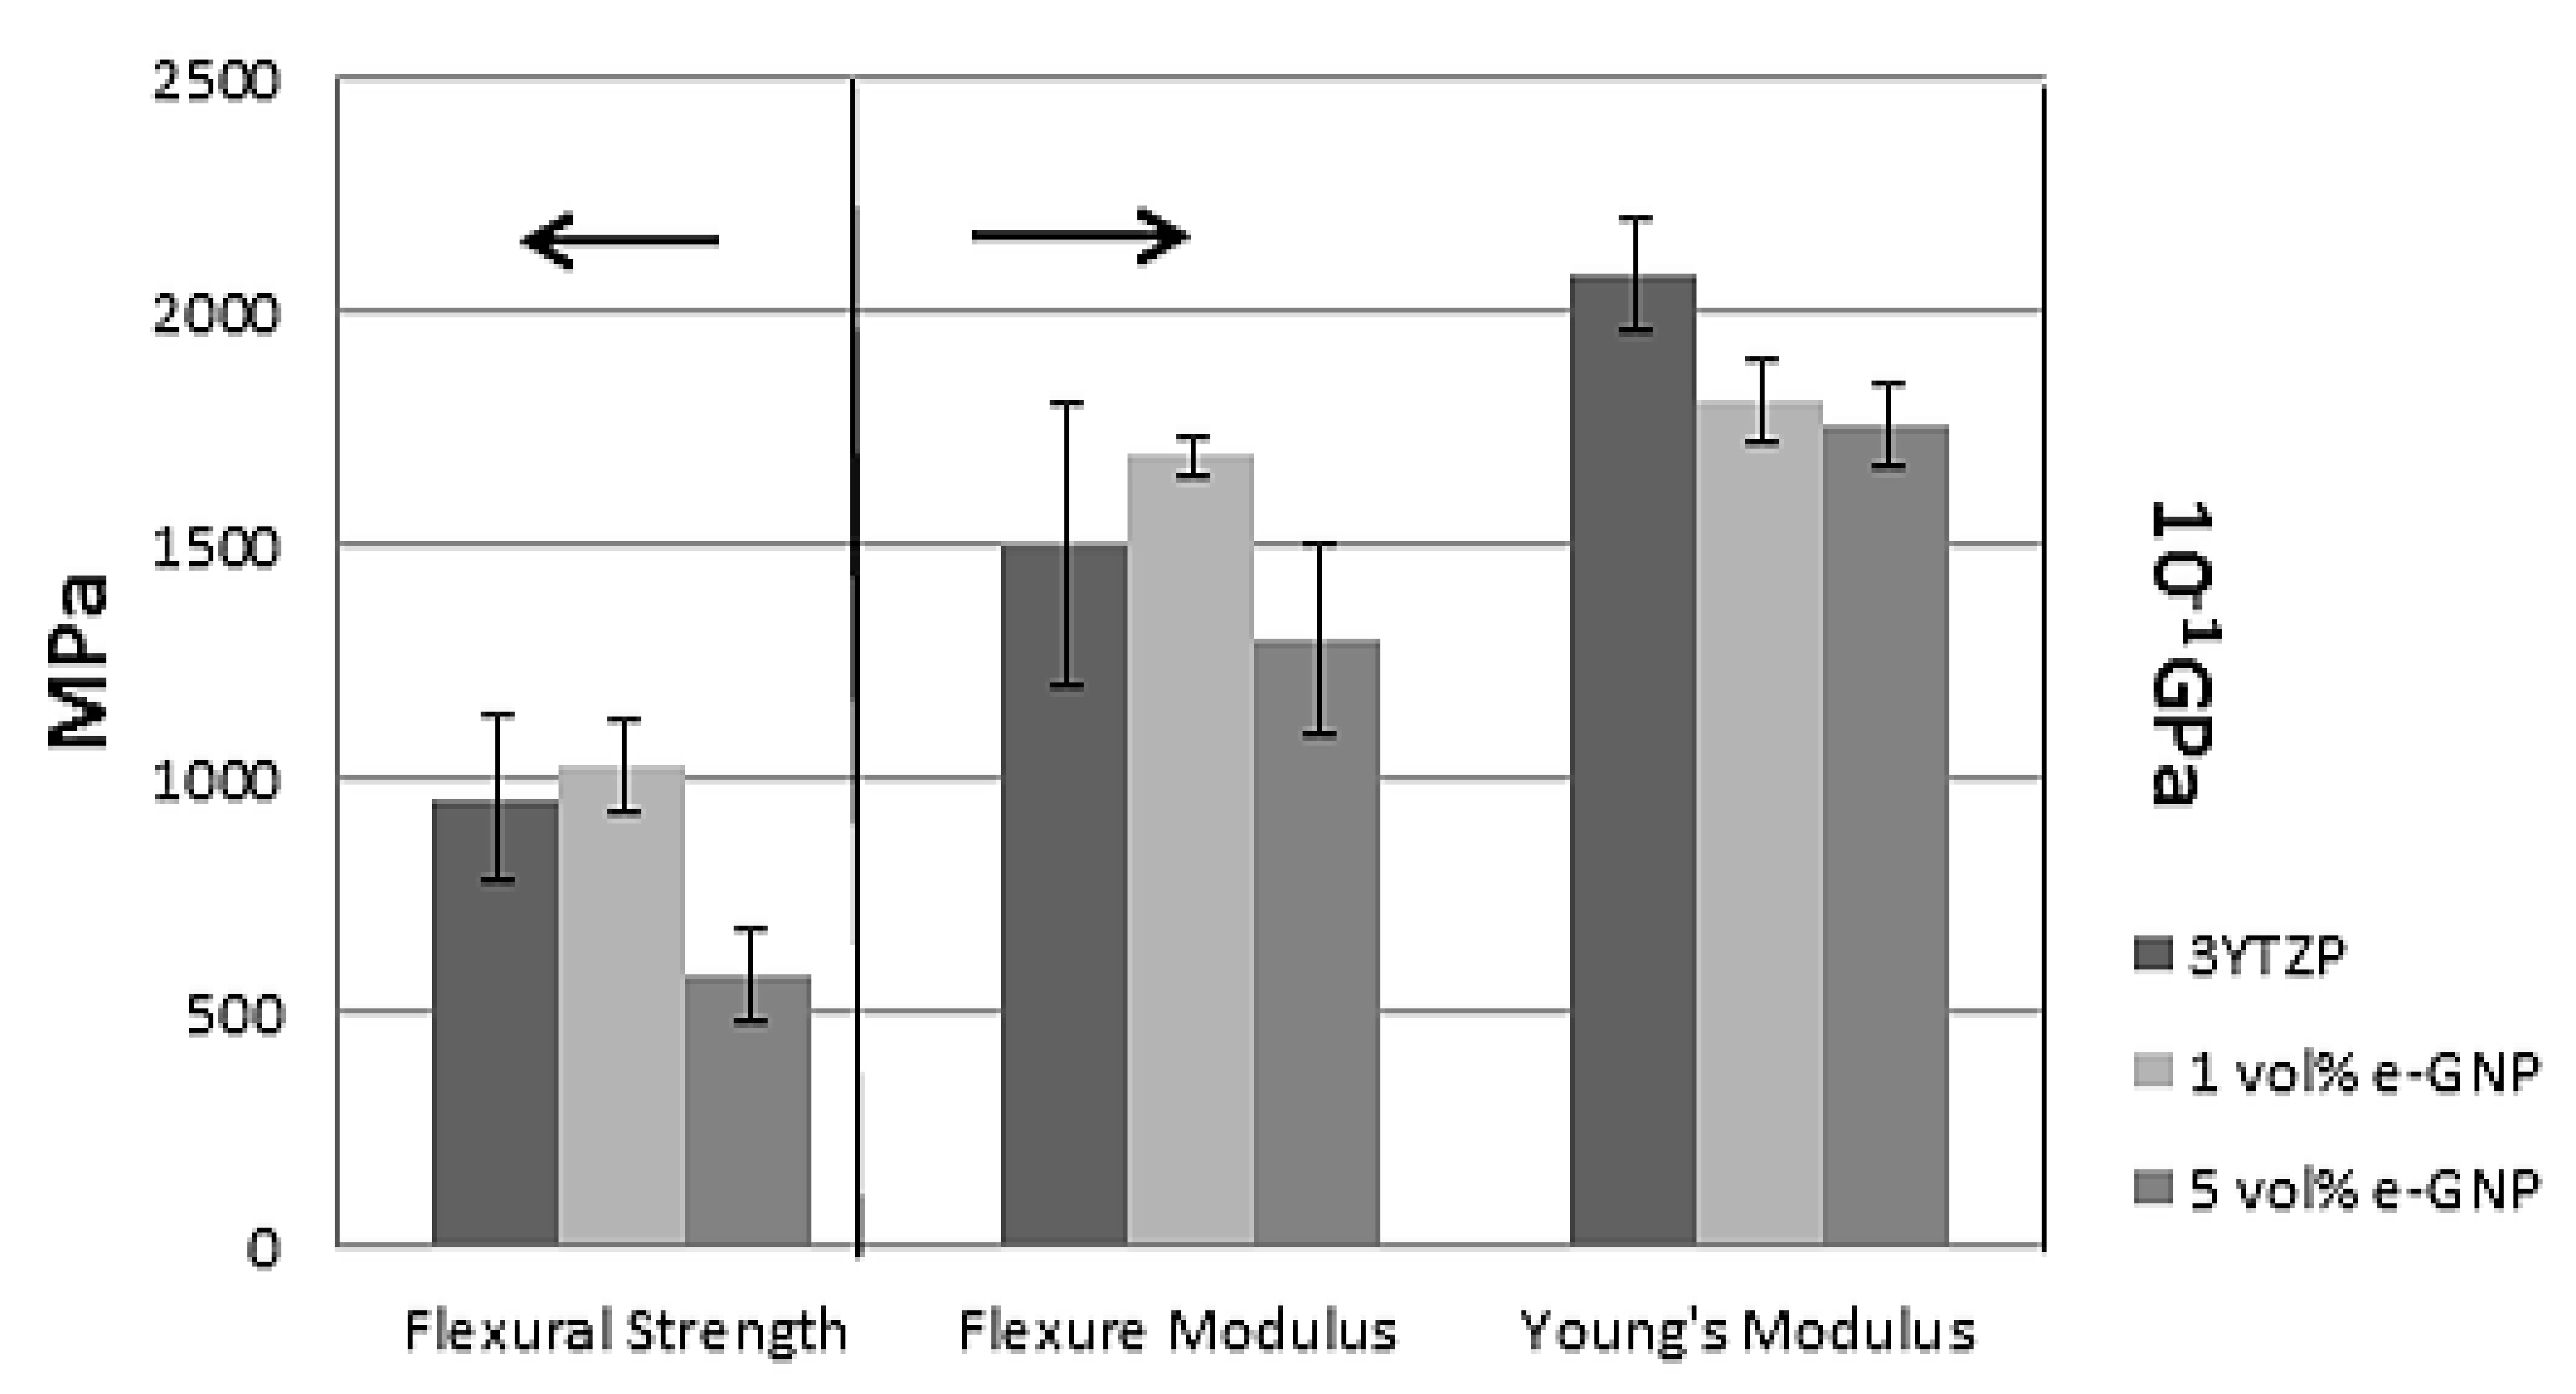
Flexural strength (MPa)
7801137 *662 *
8881055644
1147 *943455
1041972545
960 ± 1801030 ± 100580 ± 100
Flexural modulus (GPa)
170.0172.3153.1
149.1165.3122.1
176.2170.7131.6
110.1168.4112.8
150 ± 30169 ± 4130 ± 20
* Maximum value of each series.
Table 3. Young’s modulus and Vickers hardness (HV) for the materials in this study.
3YTZP1 vol.% e-GNP5 vol.% e-GNP
Young’s modulus, E (GPa)208 ± 12181 ± 9176 ± 9
Hardness HV (GPa)Top surface13.9 ± 0.513.6 ± 0.811.9 ± 0.2
Cross-section13.9 ± 0.512.7 ± 0.711.5 ± 0.6
Table 4. Vickers radial crack lengths for the materials in this study and direct crack measurement (DCM) fracture toughness.
3YTZP1 vol.% e-GNP5 vol.% e-GNP
Crack length (μm)Top surface134 ± 7143 ± 6139 ± 7
Cross-section *H-155 ± 4141 ± 3
V-145 ± 1134 ± 4
KIC (MPa∙m−0.5) 3.9 ± 0.33.4 ± 0.33.8 ± 0.4
* “H” stands for horizontal direction (perpendicular to the pressing axis during sintering), and “V” stands for vertical direction (parallel to the pressing axis during spark plasma sintering (SPS)).

