Mechanical Properties and Electrical Discharge Machinability of Alumina-10 vol% Zirconia-28 vol% Titanium Nitride Composites


Institute for Manufacturing Technologies of Ceramic Components and Composites (IFKB), University of Stuttgart, Allmandring 7b, D-70569 Stuttgart, Germany
*
Author to whom correspondence should be addressed.
Ceramics 2020, 3(2), 199-209; https://0-doi-org.brum.beds.ac.uk/10.3390/ceramics3020018
Submission received: 31 March 2020
/
Revised: 8 April 2020
/
Accepted: 16 April 2020
/
Published: 18 April 2020
(This article belongs to the Special Issue Advances in Structural Ceramic Materials)
Abstract
:Electrical discharge machinable ceramics provide an alternative machining route independent on the material hardness which enables manufacturing of customized ceramic components. In this study a composite material based on an alumina/zirconia matrix and an electrically conductive titanium nitride dispersion was manufactured by hot pressing and characterized with respect to microstructure, mechanical properties and ED-machinability by die sinking. The composites show a combination of high strength of 700 MPa, hardness of 17–18 GPa and moderate fracture resistance of 4.5–5 MPa√m. With 40 kS/m the electrical conductivity is sufficiently high to ensure ED-machinability.
1. Introduction
Zirconia toughened alumina materials (ZTA) are ceramics with alumina as a majority phase and zirconia as a homogeneously dispersed secondary phase. This results in mechanical properties combining high hardness provided by the alumina matrix and enhanced toughness and strength introduced by the zirconia dispersion [1]. Toughening mechanisms are typically transformation toughening, microcracking and residual stress [2]. The enhanced mechanical properties qualify ZTA materials for mechanically and tribologically loaded applications in mechanical engineering or biomedical applications [3,4]. However, the same properties limit the machinability of sintered ZTA so that net-shape or at least near-net-shape processing cycles (injection molding or pressing/green machining) should be designed to limit machining effort to the minimum. For customized components with complex geometries and filigree structure this approach is very often not possible. Component manufacturing may then be either impossible or uneconomical. Non-conventional machining operations such as laser machining or electrical discharge machining (EDM) could fill this gap as here the machining speed is independent on material hardness and toughness. The application of these processes requires purpose-made ceramic materials.
Oxide ceramics can be made electrically conductive by addition of a conducting third phase such as transition metal carbides, nitrides or borides or by nanocarbon compounds such as nanotubes or graphene [5,6]. Rak investigated alumina–titanium nitride ceramics with 5–25 vol% conductive dispersion and obtained materials which were electrically conductive and ED-machinable at a TiN content of 25 vol% [7]. Landfried carried out a screening study on ZTA materials with different conductive phases and ended up with the assumption that ZTA-TiC was the composite with the best combination of mechanical properties and machinability [5]. The latest results of Schmitt-Radloff on ZTA-NbC materials led the authors to the conclusion that the ZTA-TiN system should be revisited and characterized in more detail [8]. Especially as the initial study was carried out with respect to limitation due intellectual property which restricted the compositional range to TiN contents below 25 vol.% [9]. In the present study, a very simple ZTA-system with 10 vol% unstabilized zirconia was selected in order to circumvent the stabilization issue which was known to inflate the set of experiments. With regard to the latest results, a fine grain TiN-dispersion of 28 vol% was chosen to ensure sufficient electrical conductivity. Processing by hot-pressing ensures full densification, sintering temperatures were varied in order to ensure a certain robustness of the composition which is required for the scale up of the hot-pressing process to make larger blanks.
2. Materials and Methods
The starting powders for the study were submicron-size α-alumina (APA0.5, Ceralox, USA; SBET = 8 m2/g, d50 = 300 nm), nanoscale monoclinic zirconia (UEP, DKKK, Japan, SBET = 5–20 m2/g) and fine titanium nitride (Höganäs, Germany, d50 = 1.5 µm). A 300 g powder batch containing 10 vol.% zirconia (calculated as tetragonal ρ = 6.1 g/cm3), 28 vol% TiN and 62 vol.% alumina was dispersed in 200 ml 1-propanol and attrition milled for 2h at 799 rpm using 3Y-TZP milling balls of 2 mm diameter. The milling media were separated, and the slurry was dried overnight at 60 °C in flowing air. The dried powder was subsequently screened through a 250 µm mesh. Hot pressing was carried out in cylindrical graphite dies of 45 mm diameter clad with hexagonal boron nitride suspension. For mechanical testing two disks of 18 g powder separated by a graphite spacer were hot pressed in vacuum simultaneously. Heating to final temperatures (1475 °C–1550 °C in 25 K increments) under a pre-load of 3 kN (~2 MPa) was carried out at 30 K/min. The pressure was then increased within 5 min to 63 kN = 40 MPa. Temperature and pressure were kept for 2h dwell. Then the load was released the compartment was filled with argon up to ambient pressure and the sample was left to cool in the press (cooling rate ~5–10 K/min). For ED-machining experiments two disks of 4 mm thickness were sintered under identical conditions at 1525 °C/2h/40 MPa.
The sintered disks were then machined. Disks for mechanical testing were lapped with 15 µm diamond suspension on one side and lapped and polished with diamond suspension of 15–1 µm grain size to a mirror like-finish on the second side. The final thickness of the disks was ~2.2 mm. Disks for EDM were lapped on both sides. Prior to sample cutting the density ρ was determined by buoyancy measurement and the Young’s modulus E was determined by acoustic emission measurement (IMCE, Belgium). The Vickers hardness HV10 (five indents) was measured 8 mm from the edge of the disk on the polished side, the wing cracks of the indents were measured in order to calculate fracture resistance by direct crack length measurement (DCM). Disks were the cut into bending bars of 4 mm width with a diamond wheel. The cutting grooves were then removed by lapping, finally the edges were beveled carefully with a 40 µm diamond grinding disk.
Electrical conductivity of the bending bars was measured by 4-point measurement (4 samples each, self-built equipment). Four bending bars were indented with 98.1 N load on the polished side with cracks parallel and perpendicular to the sides. The residual strength of these notched bars was measured immediately after notching in 4-point setup with 20 mm outer and 10 mm inner span at a crosshead speed of 2.5 mm/min. 4-point bending strength σ4pt was measured on the remaining 10 bars at a crosshead speed of 0.5 mm/min in the same setup (Zwick, Ulm, Germany). Considering measured hardness and Young modulus values, indent size and wing crack length (DCM) the indentation fracture resistance KDCM was calculated using the model of Evans [10]. Based on residual strength data the fracture resistance KISB (ISB = indentation strength in bending) was calculated according to the model of Chantikul [11].
The phase composition of polished surfaces and fracture surfaces after ISB-test was measured by X-ray by integrating the intensity of the tetragonal and monoclinic peaks in the 27–33° 2θ range (X’Pert MPD, Panalytical, NL, Bragg-Brentano-Setup, CuKα1, Ge-monochromator). The fractions of tetragonal and monoclinic phase were calculated according to the calibration curve of Toraya [12]. Transformation zone sizes were calculated based on X-ray data according to Kosmac [13]. The transformation toughness increments were estimated according to McMeeking [14] assuming a transformation efficiency of 0.49 (dilatation and shear).
The microstructure of polished and thermally etched (hydrogen atmosphere, 1250 °C, 5 min) samples was investigated by SEM to evaluate the homogeneity of phase distribution and the grain sizes.
EDM die sinking experiments were carried out in oil based dielectric fluid (IonoPlus IME-MH, Oelheld, Germany) using copper electrodes of 5 × 5 mm2 cross-section and proven parameter sets (Elotherm Typ 400, AEG, Germany). The machining speed and electrode wear were determined by weighing the samples and electrodes before and after the machining experiments (3 × 15 min). The following table shows the machine parameters used. The workpiece was set as cathode (−) and the electrode was set as anode (+). The machine allows no direct adjustment of electrical parameters, so that the actual currents were measured inductively and displayed on an oscilloscope and listed in Table 1. The machined substrates were cleaned. The surface structure was studied by SEM, cross sections through the machined areas were polished and studied by optical microscopy and SEM. The surface quality was measured by white light interferometry. The compositional changes in pristine and machined surfaces were checked by X-ray.
3. Results
3.1. Microstructure
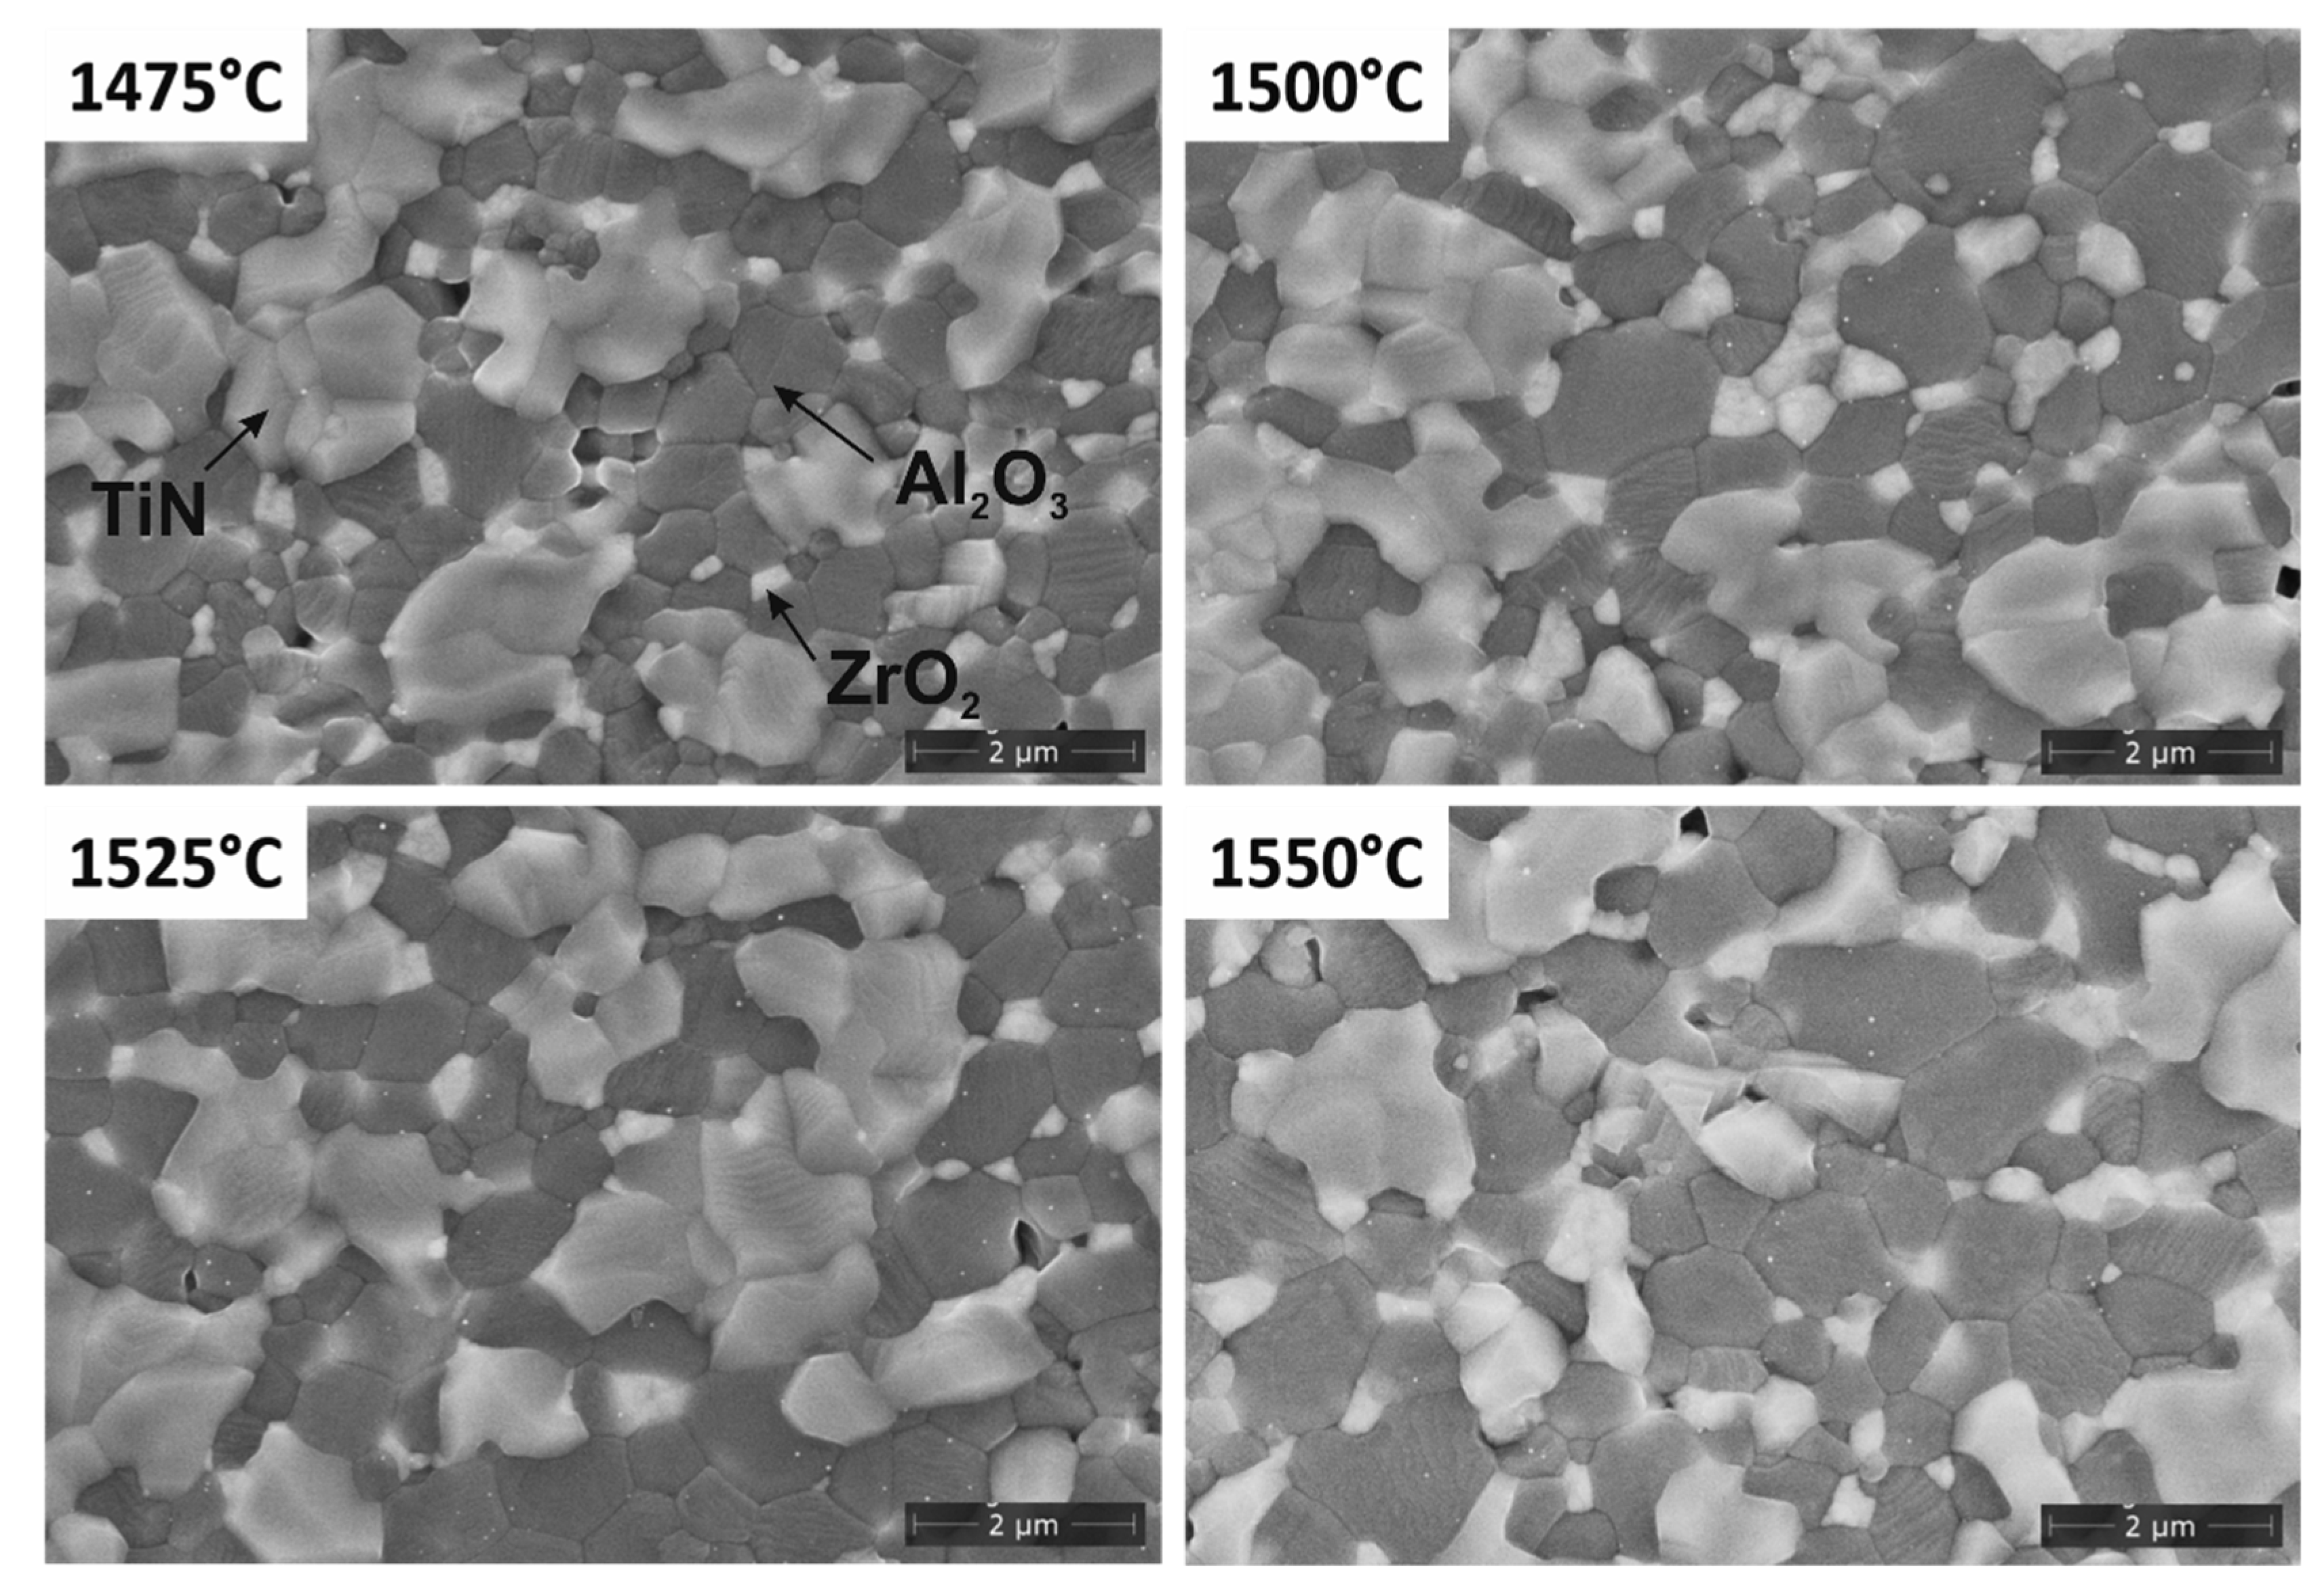
Figure 1 shows SEM images of thermally etched ZTA-TiN materials sintered at the four different temperatures. Evidently the etching process in hydrogen is very efficient to reveal the grain boundaries in the oxide matrix.
However, the etching also leads to significant re-crystallization of the titanium nitride, thus the titanium nitride grains appear to protrude from the surface. The alumina tends to coarsen progressively at higher sintering temperatures. Grain sizes increase from ~0.8 µm at 1475 °C to ~1.5 µm at 1550 °C. The zirconia initially occupies the 4-junctions between the larger grains. With progressive coarsening of the alumina grains some migration and coalescence of zirconia can be observed which lead to a visible coarsening effect.
At 1475 °C the zirconia grains typically have a size of ~200 nm, which is too small to be transformable. At 1525 °C and 1550 °C the zirconia grain size rises to a range of 400–500 nm, which according to Heuer is ideal for stress induced transformation [15]. At the same time the larger zirconia grains are no longer numerous enough to block all 4-junctions and prevent matrix grain growth. The primary titanium nitride grains are larger than the grains of the oxide phases. Moreover, they tend to form aggregates of 2–4 µm size. Nevertheless, the volume fraction is sufficient to form a percolation electrically conducting network. The size and shape of the titanium nitride does not differ with changes in sintering temperature.
3.2. Mechanical Properties
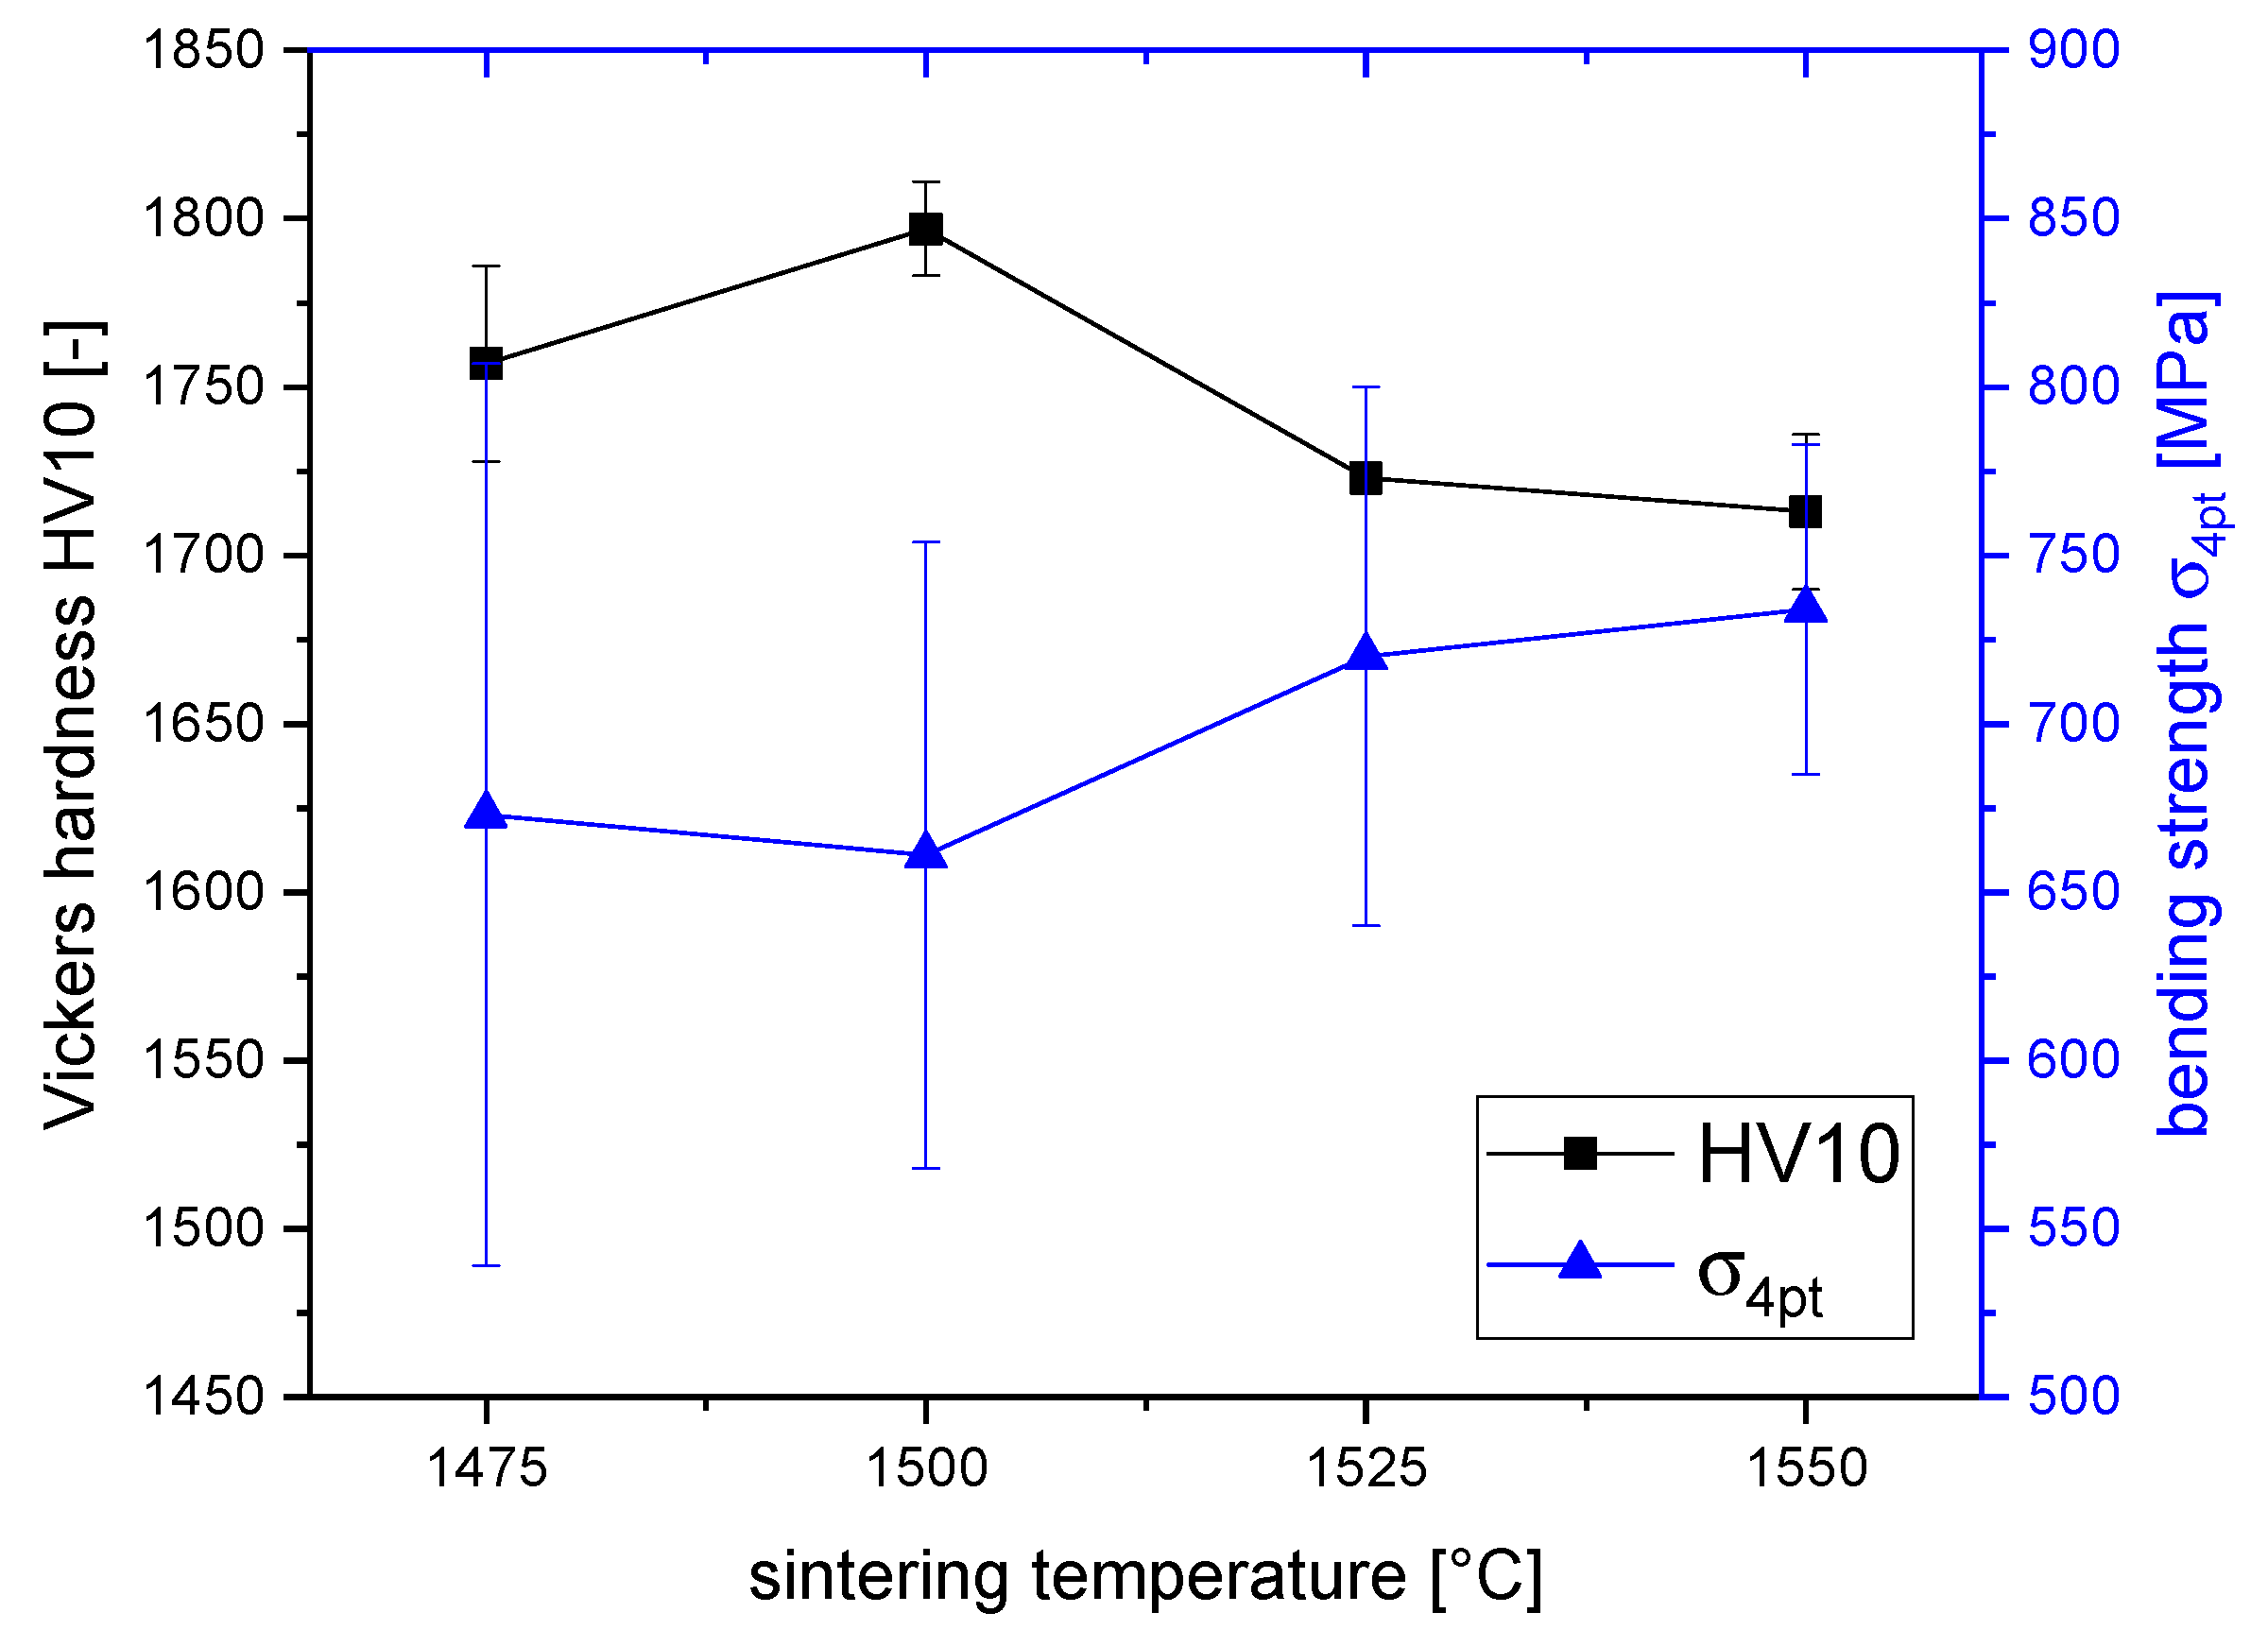
The density of all samples reaches values between 99.5–99.7% of theoretical (not shown in detail). As the theoretical density was calculated assuming a tetragonal phase content of 100% in the zirconia dispersion, the materials can be considered fully dense. The small density increments are probably closely related to the changes in monoclinic content (see Section 3.3). The Young’s modulus of all materials is almost identical, it ranges between 383–387 GPa with a scattering of ±2 MPa (not shown in detail). Figure 2 shows the Vickers hardness HV10 and the bending strength of ZTA-TiN materials vs. sintering temperature. The Vickers hardness shows a maximum at 1800 HV10 at 1500 °C. Further rising sintering temperatures lead to a continuous reduction of hardness to 1710 HV10 at 1550 °C. Such a decrease of hardness is an indication of coarsening of the microstructure. The bending strength increases slightly with increasing sintering temperature. At 1550 °C the maximum average strength amounts to 734 MPa with a small standard deviation of 49 MPa. At 1475 °C–1525 °C individual samples somewhat reach higher strength than for 1550 °C, the scattering of the data is, however, much larger. This indicates the existence of larger defects and a broader defect size distribution at lower sintering temperatures.
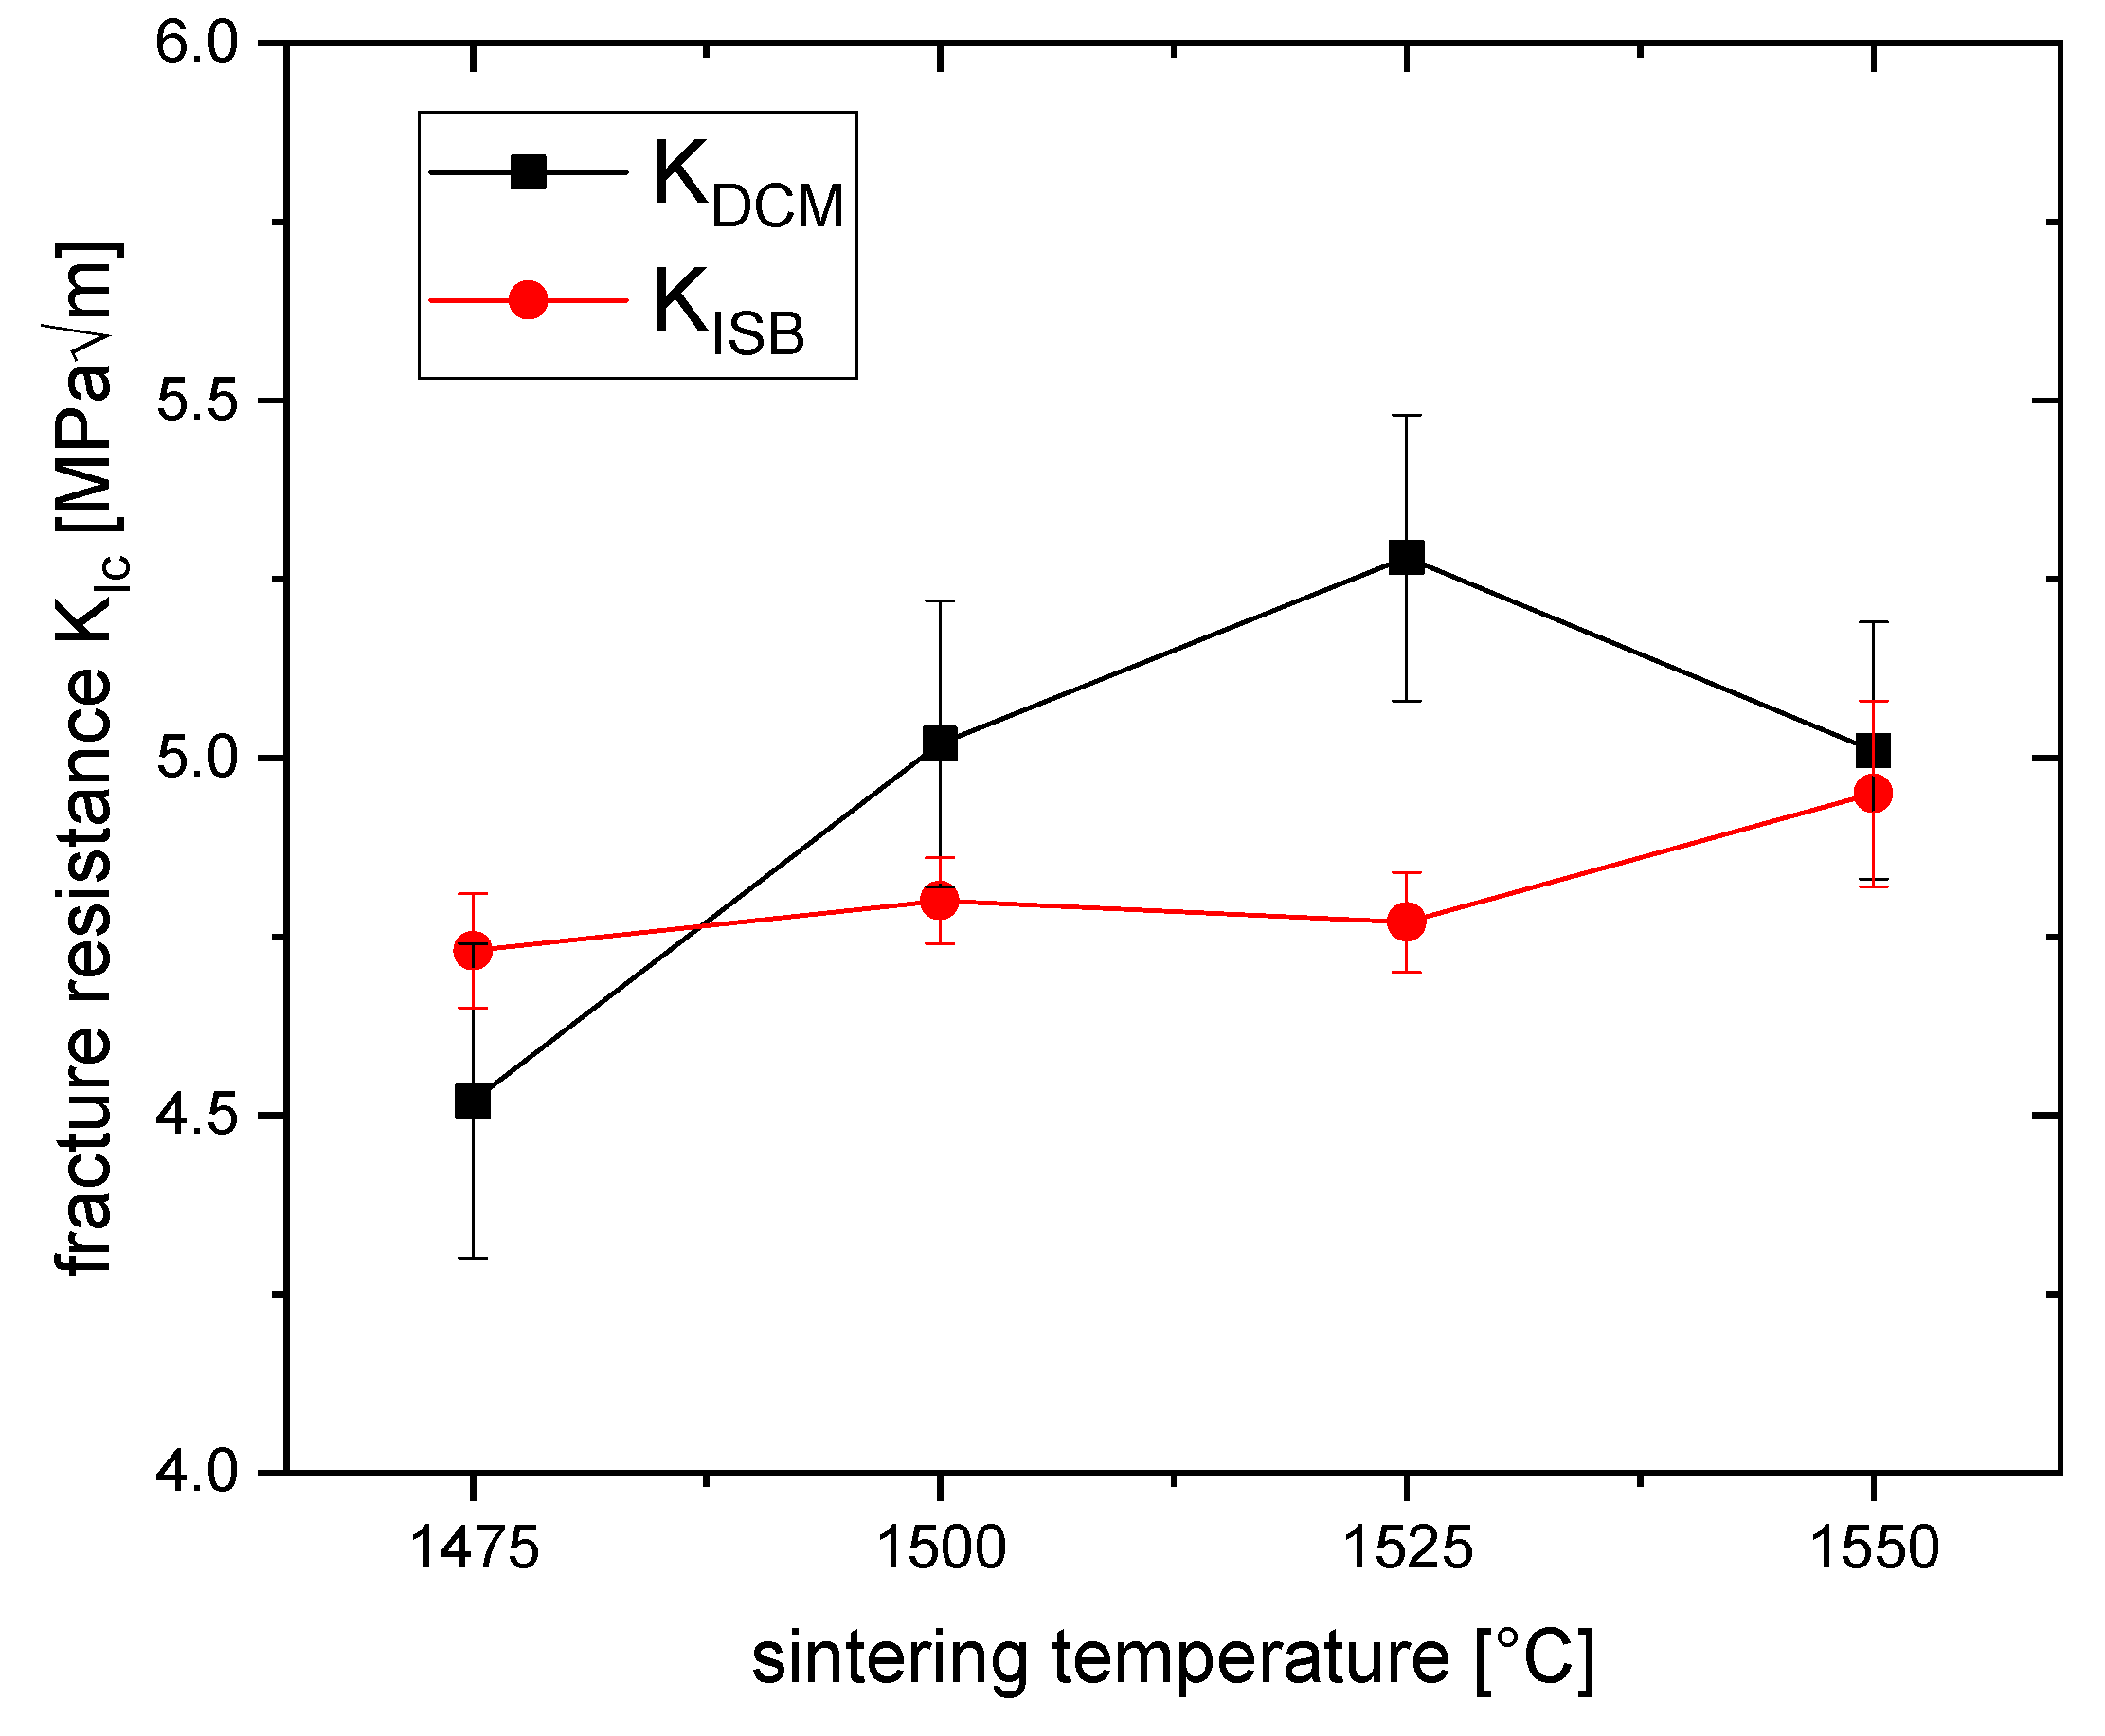
Figure 3 shows the fracture toughness KDCM determined by direct crack length measurement evaluated with the Evans’ model [10] and the fracture toughness KISB calculated from residual strength measurements using the model of Chantikul [11]. Both methods show very similar results in the toughness range between 4.5–5.3 MPa√m. The ISB-toughness probably provides more objective evidence than the DCM method as the material was difficult to polish and crack length measurements may be subject to individual errors. According to the ISB-values there is a very moderate rise in toughness with sintering temperature (and grain size). The DCM-values show an intermediate toughness maximum at 1525 °C. A tentative interpretation on the different response of the methods is given in the discussion section.
3.3. Phase Composition and Transformation Toughness
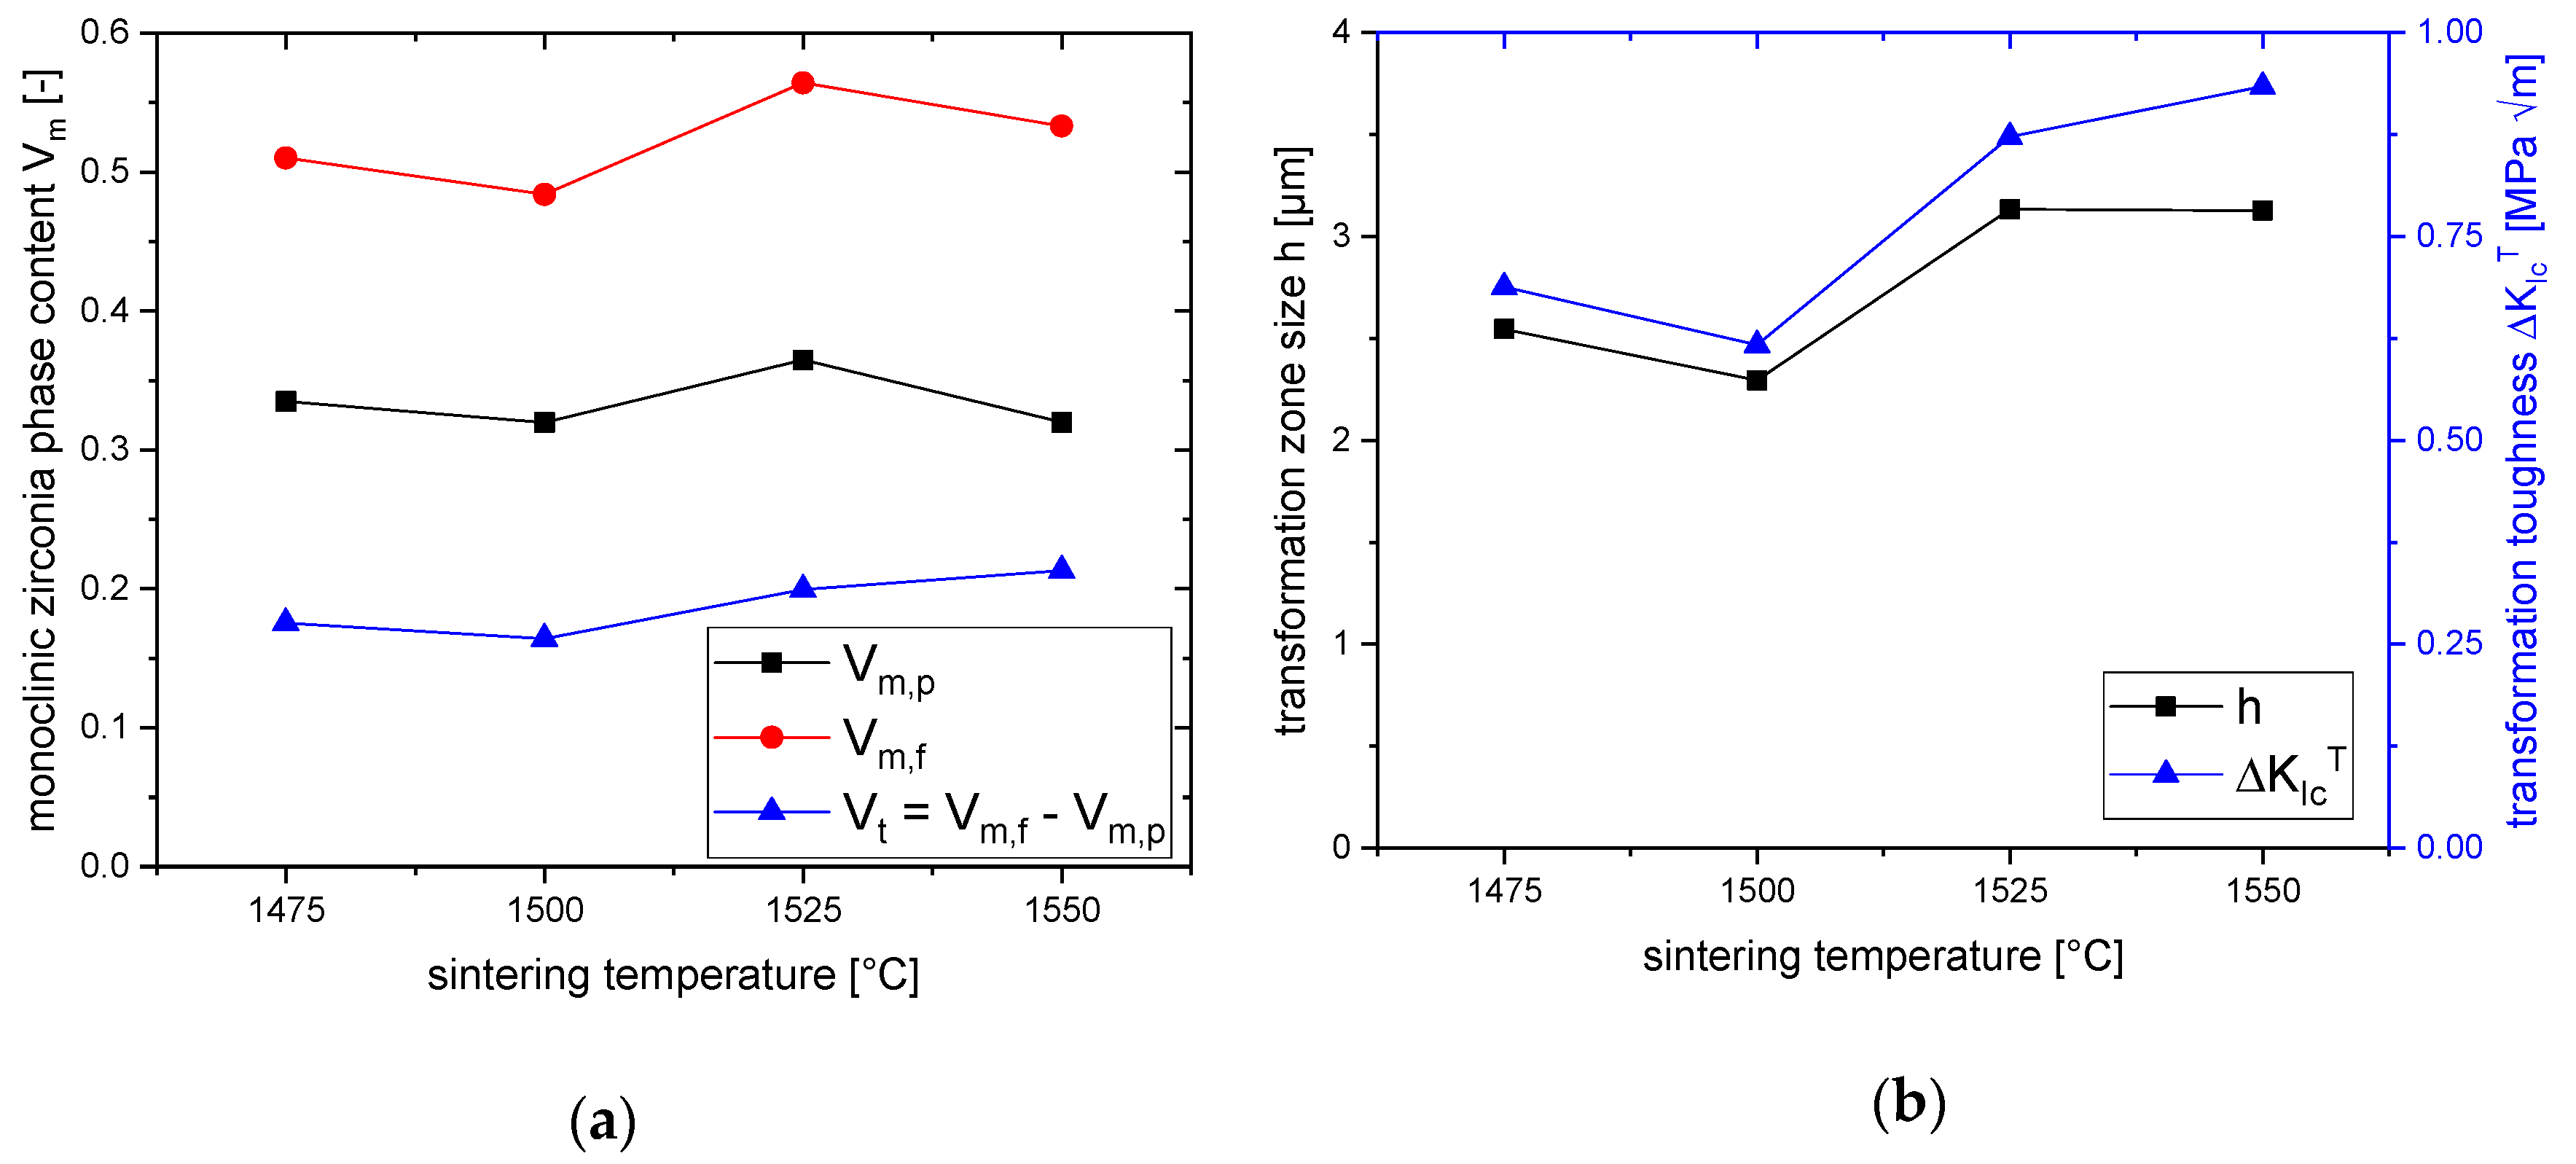
The monoclinic phase content of the zirconia fraction in polished surfaces and fracture phases of ZTA-TiN sintered at different temperatures is shown in Figure 4a. The calculated transformation zone sizes and values of transformation toughness are plotted in Figure 4b.
In the polished surfaces the monoclinic zirconia phase content Vm,p range between 32–36%, the maximum at 1525 °C sintering temperature is not very pronounced. This monoclinic content in the polished state indicates that the alumina and titanium nitride phases are already under slight hydrostatic tension [16].
In the fracture surfaces the monoclinic zirconia phase contents Vm,f range between 48–56%, the maximum value is again observed at 1525 °C. The transformability Vf, which is the difference between Vm,f and Vm,p, shows an increase at higher temperatures from 17% at 1475–1500 °C to 21% at 1550 °C. transformability values show a good correlation to the ISB toughness (see Figure 3). Based on the phase composition the transformation zone size h and the transformation toughness increments ΔKICT were calculated. As ΔKICT correlates to the product of Vf and √h an identical trend is evident. It can be stated that transformation toughening provides a significant toughness increment of 0.6–0.9 MPa√m despite the low zirconia content in the composites of only 10 vol%.
3.4. Electrical Conductivity and EDM Characteristics
The electrical conductivity of the samples (not shown in detail) shows only very small changes with variation in sintering temperature. The conductivity values vary between 39–41 kS/m with a standard deviation of ±600 S/m. This level of electrical conductivity is several orders of magnitude higher than the threshold of 1 S/m for EDM defined by Iwanek [17].
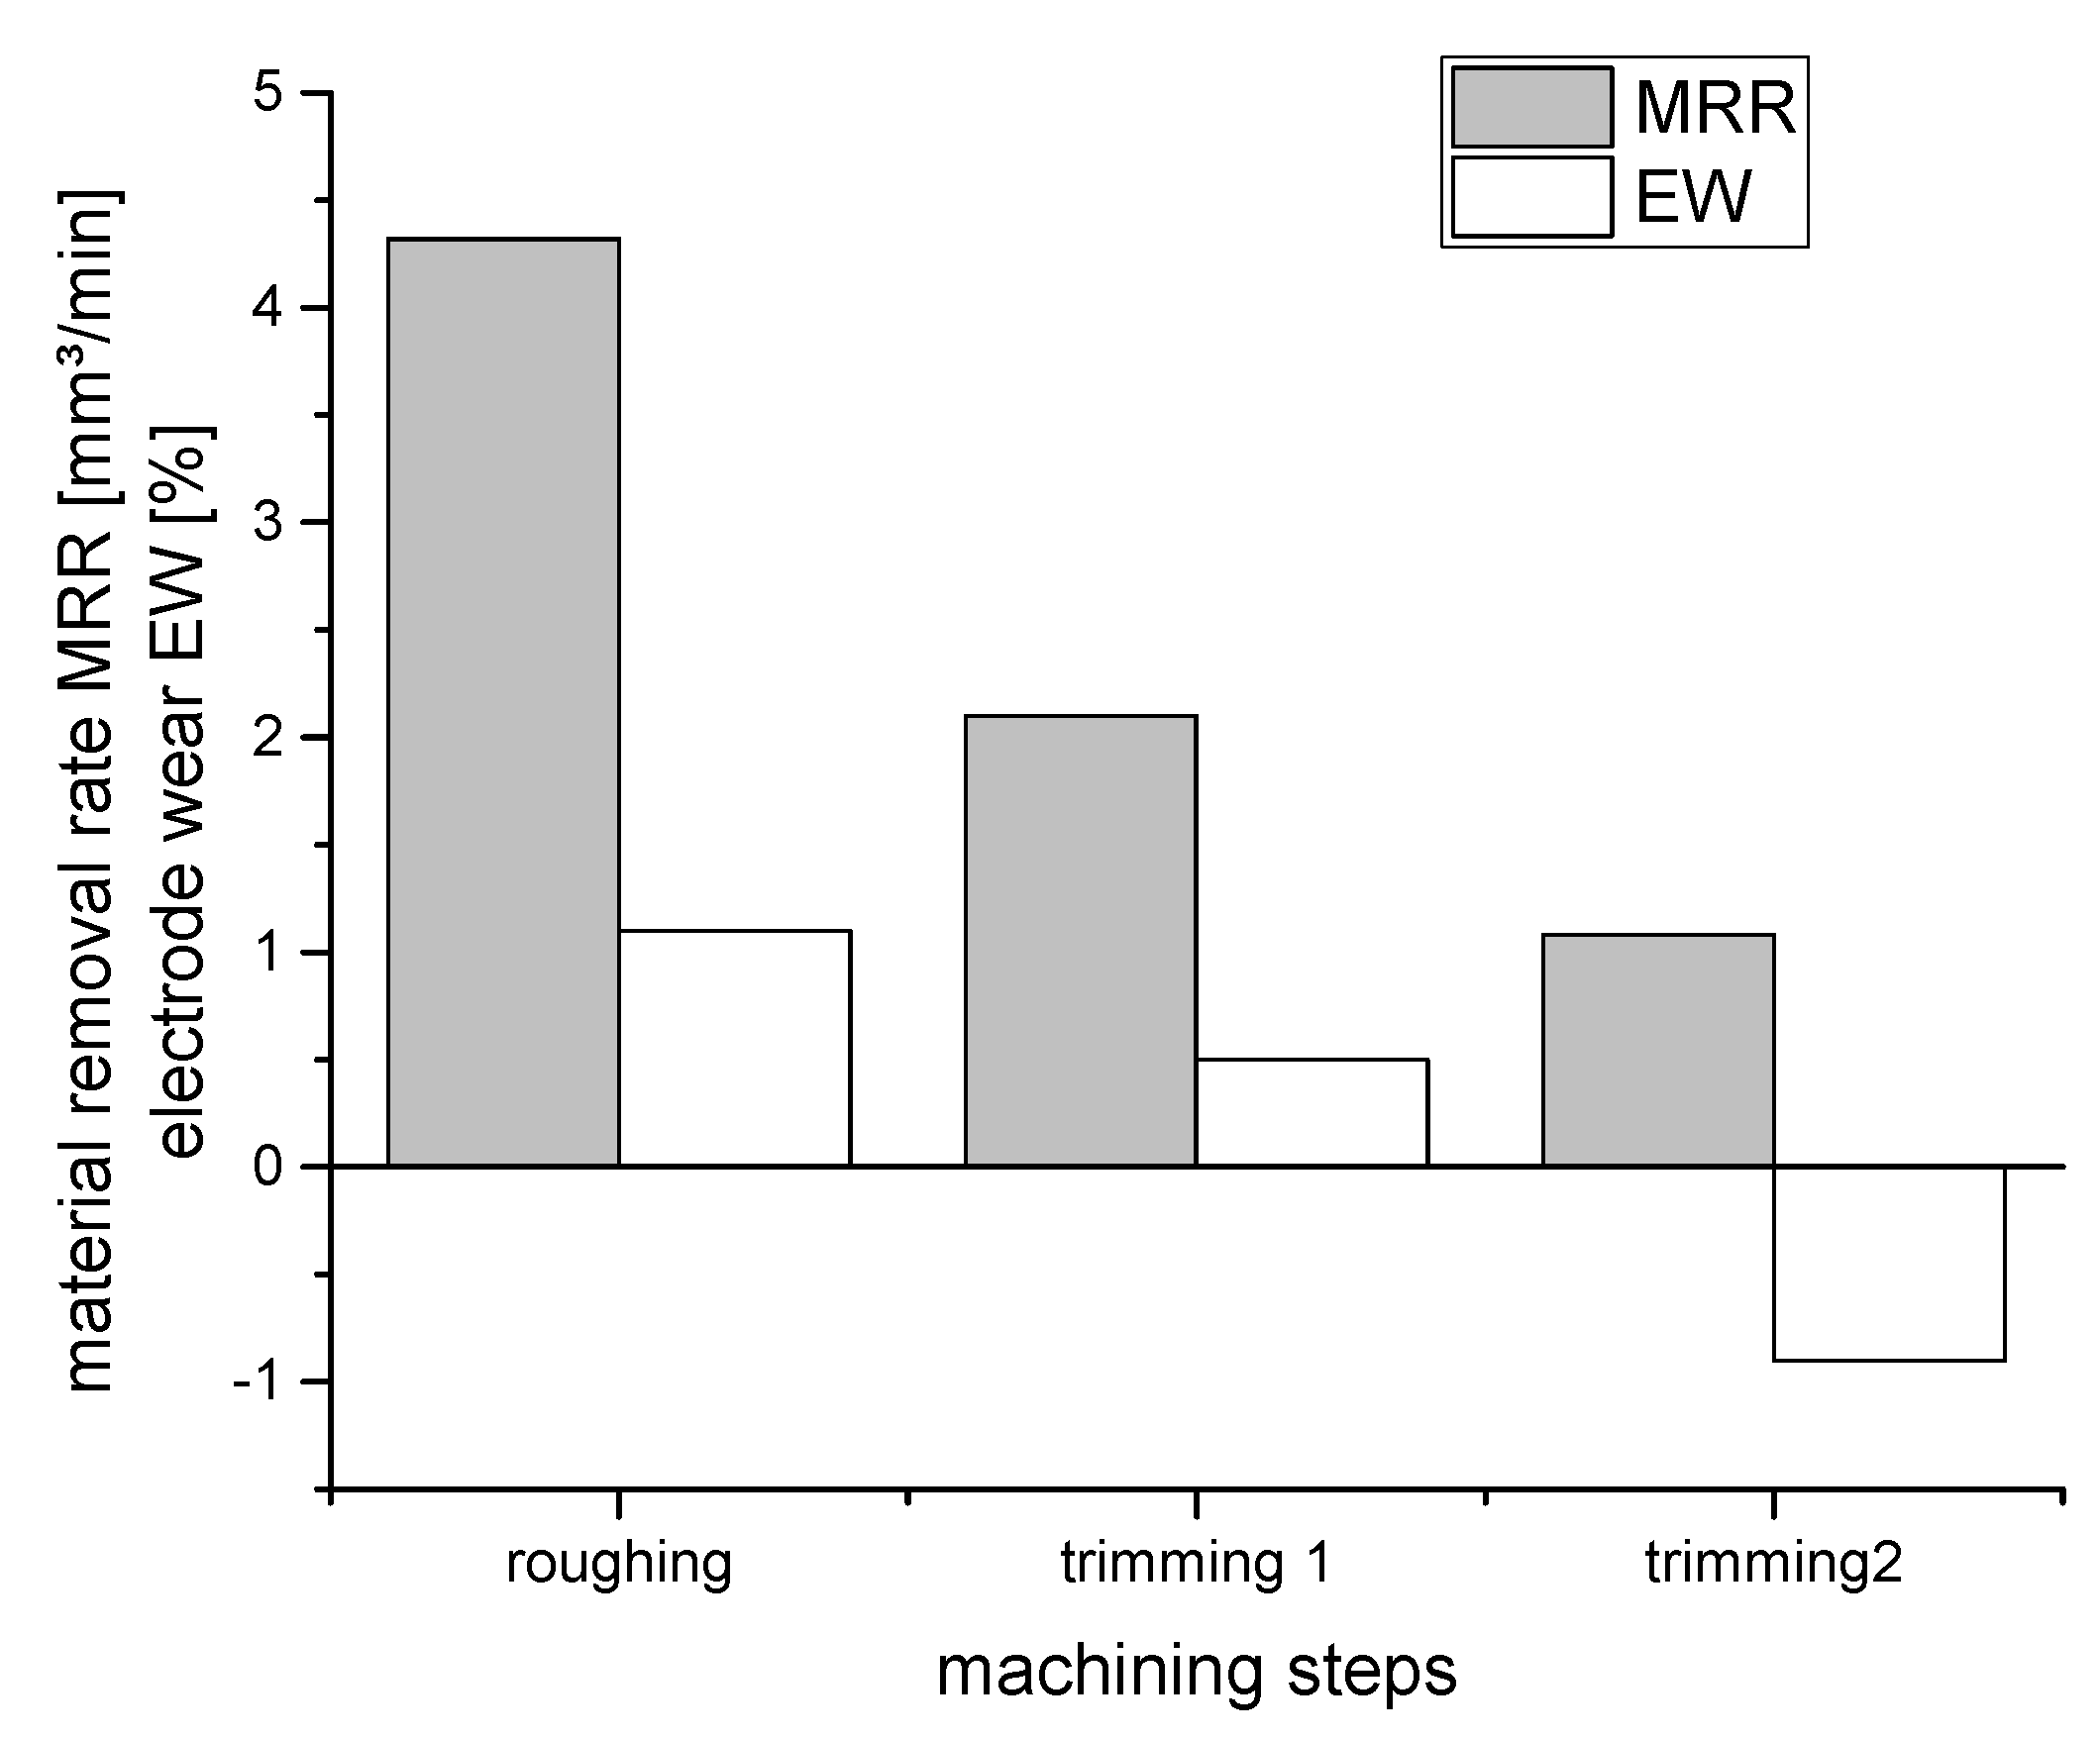
Electrical discharge machining experiments of the material sintered at 1525 °C showed an excellent machinability of the materials. Material removal rates and electrode wear ratios for the roughing and trimming steps are plotted in Figure 5. As expected, the MRR scales with the discharge current level (i.e., the energy input/time). In the roughing step the MRR of >4 mm3/min is extremely high compared to earlier studies on ZTA-TiC materials (0.5–2 mm3/min) [18]. Even the trimming steps at reduced energy input show attractive MRR. The relative electrode wear (weight loss of the electrode/weight loss of the workpiece–EW) of <1% is very low. Landfried already reported material transfer to the copper electrode [18]. Still, weight gain of the working electrode in the slow trimming step should not be overstressed as here the relative measuring error is considerably higher.
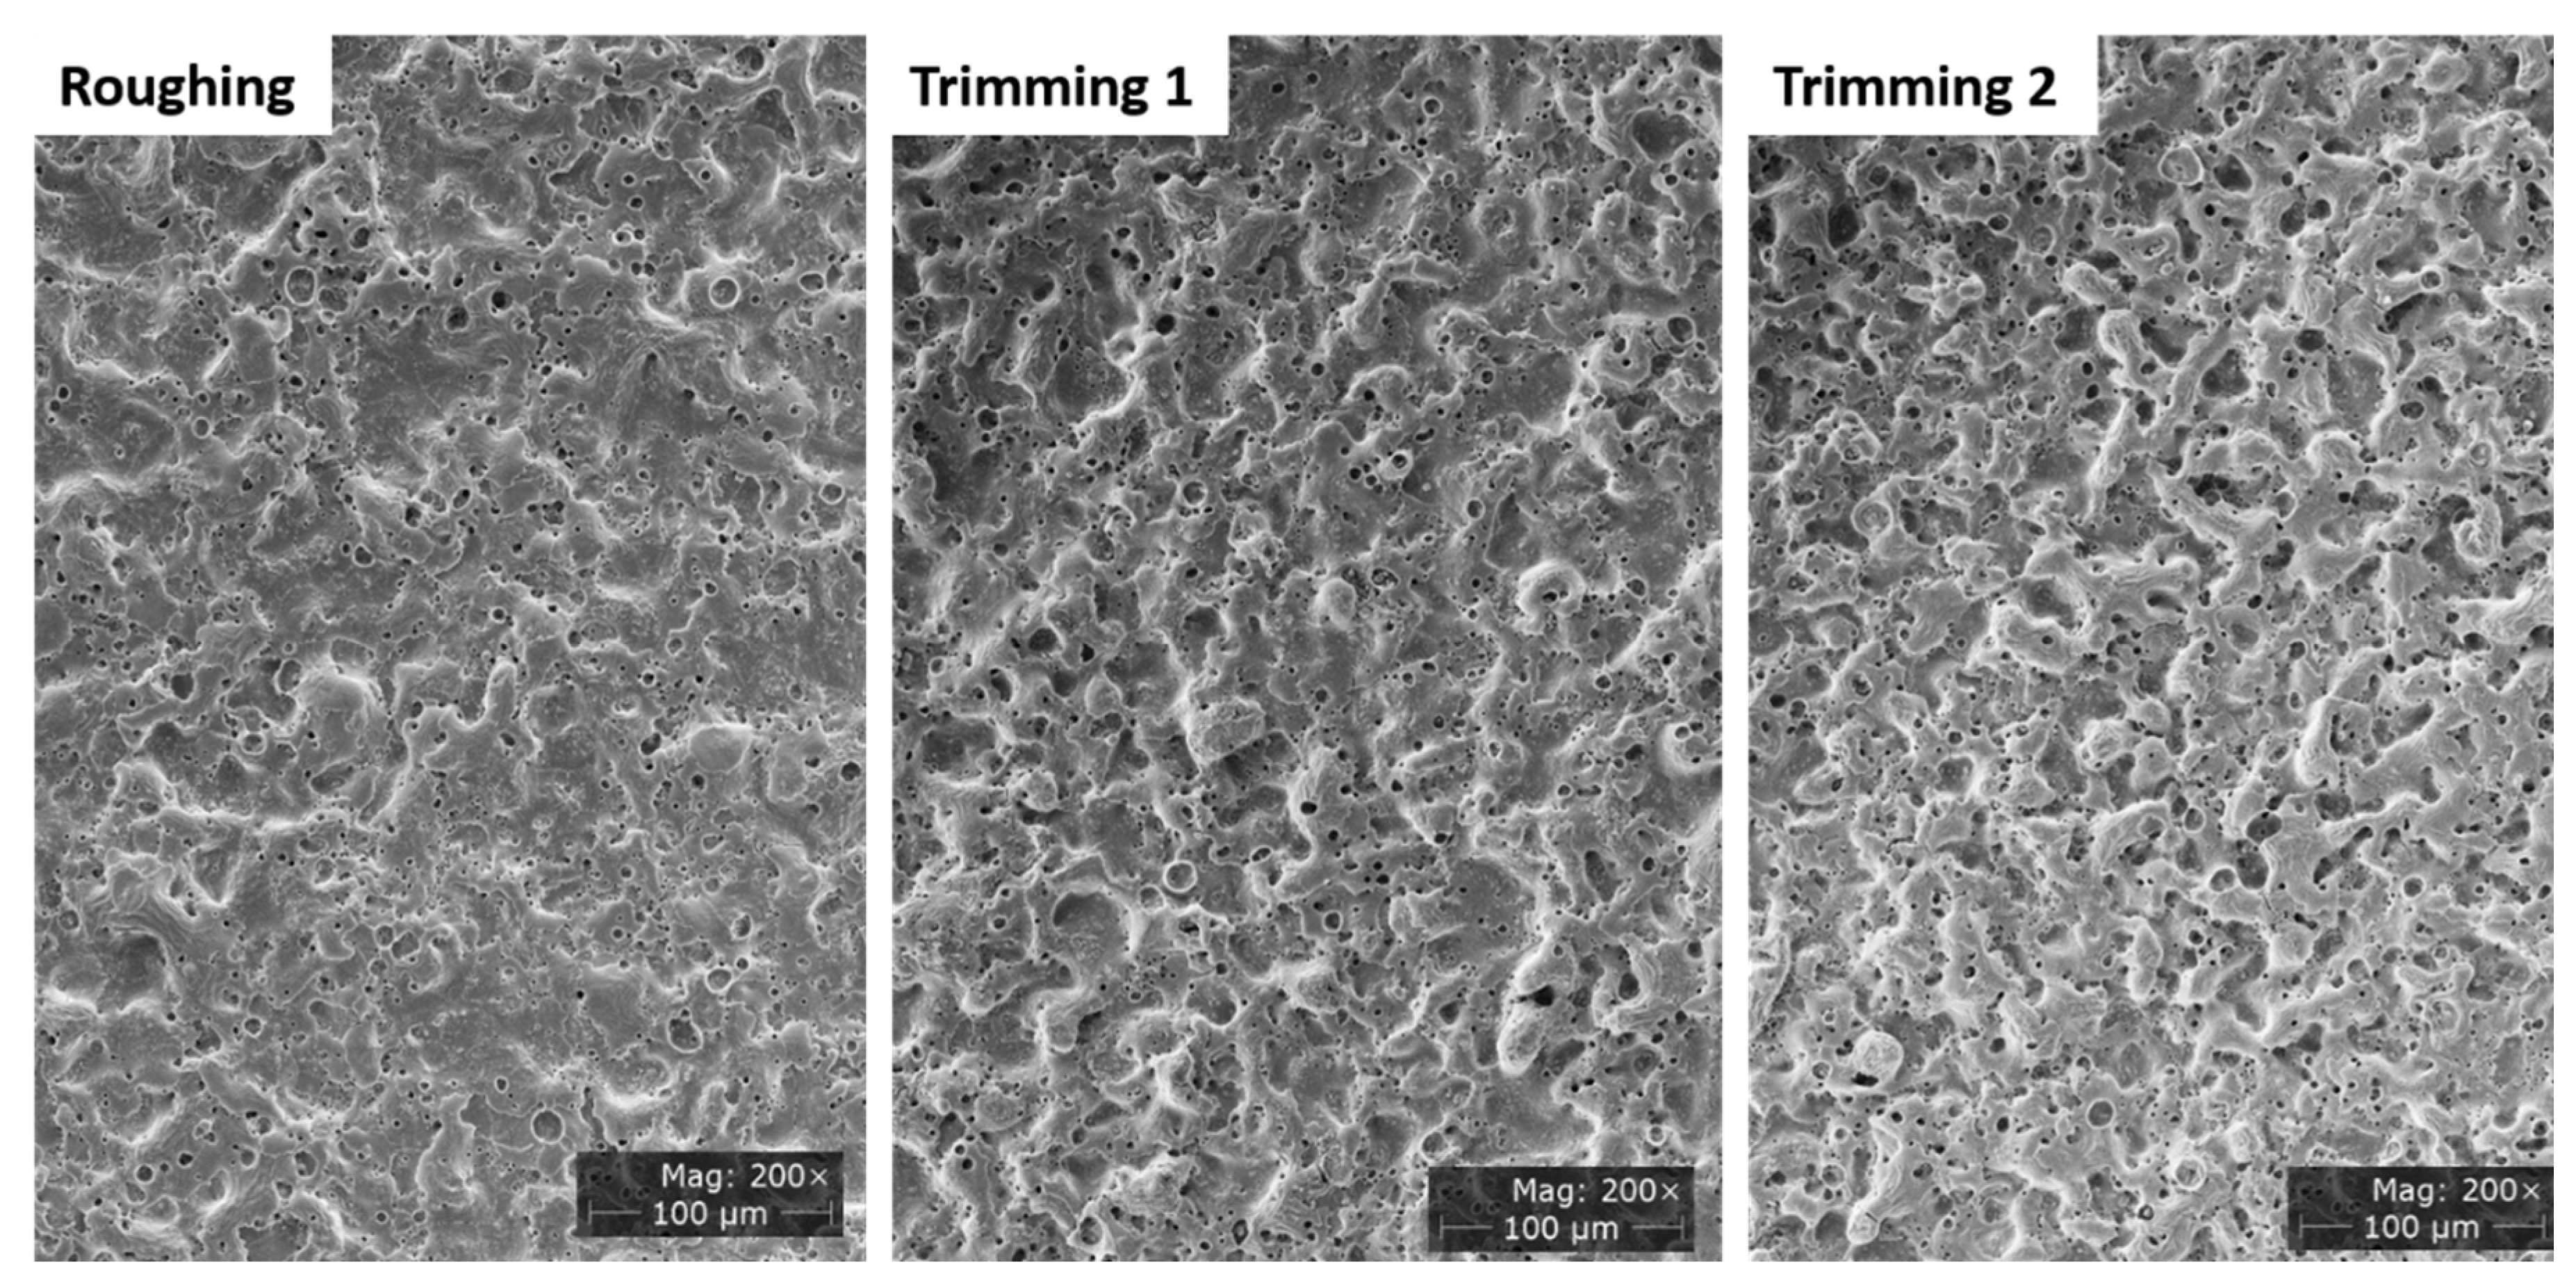
Figure 6 shows overview top view on machined surfaces in the roughing and trimming steps. Evidently the dominant material removal mechanism is melting. The surface is covered with a very thin glass-like layer. Materials machined at very high energy input (roughing) are extremely smooth, while the trimming operations with lower energy input lead to rougher surfaces (see Table 2).
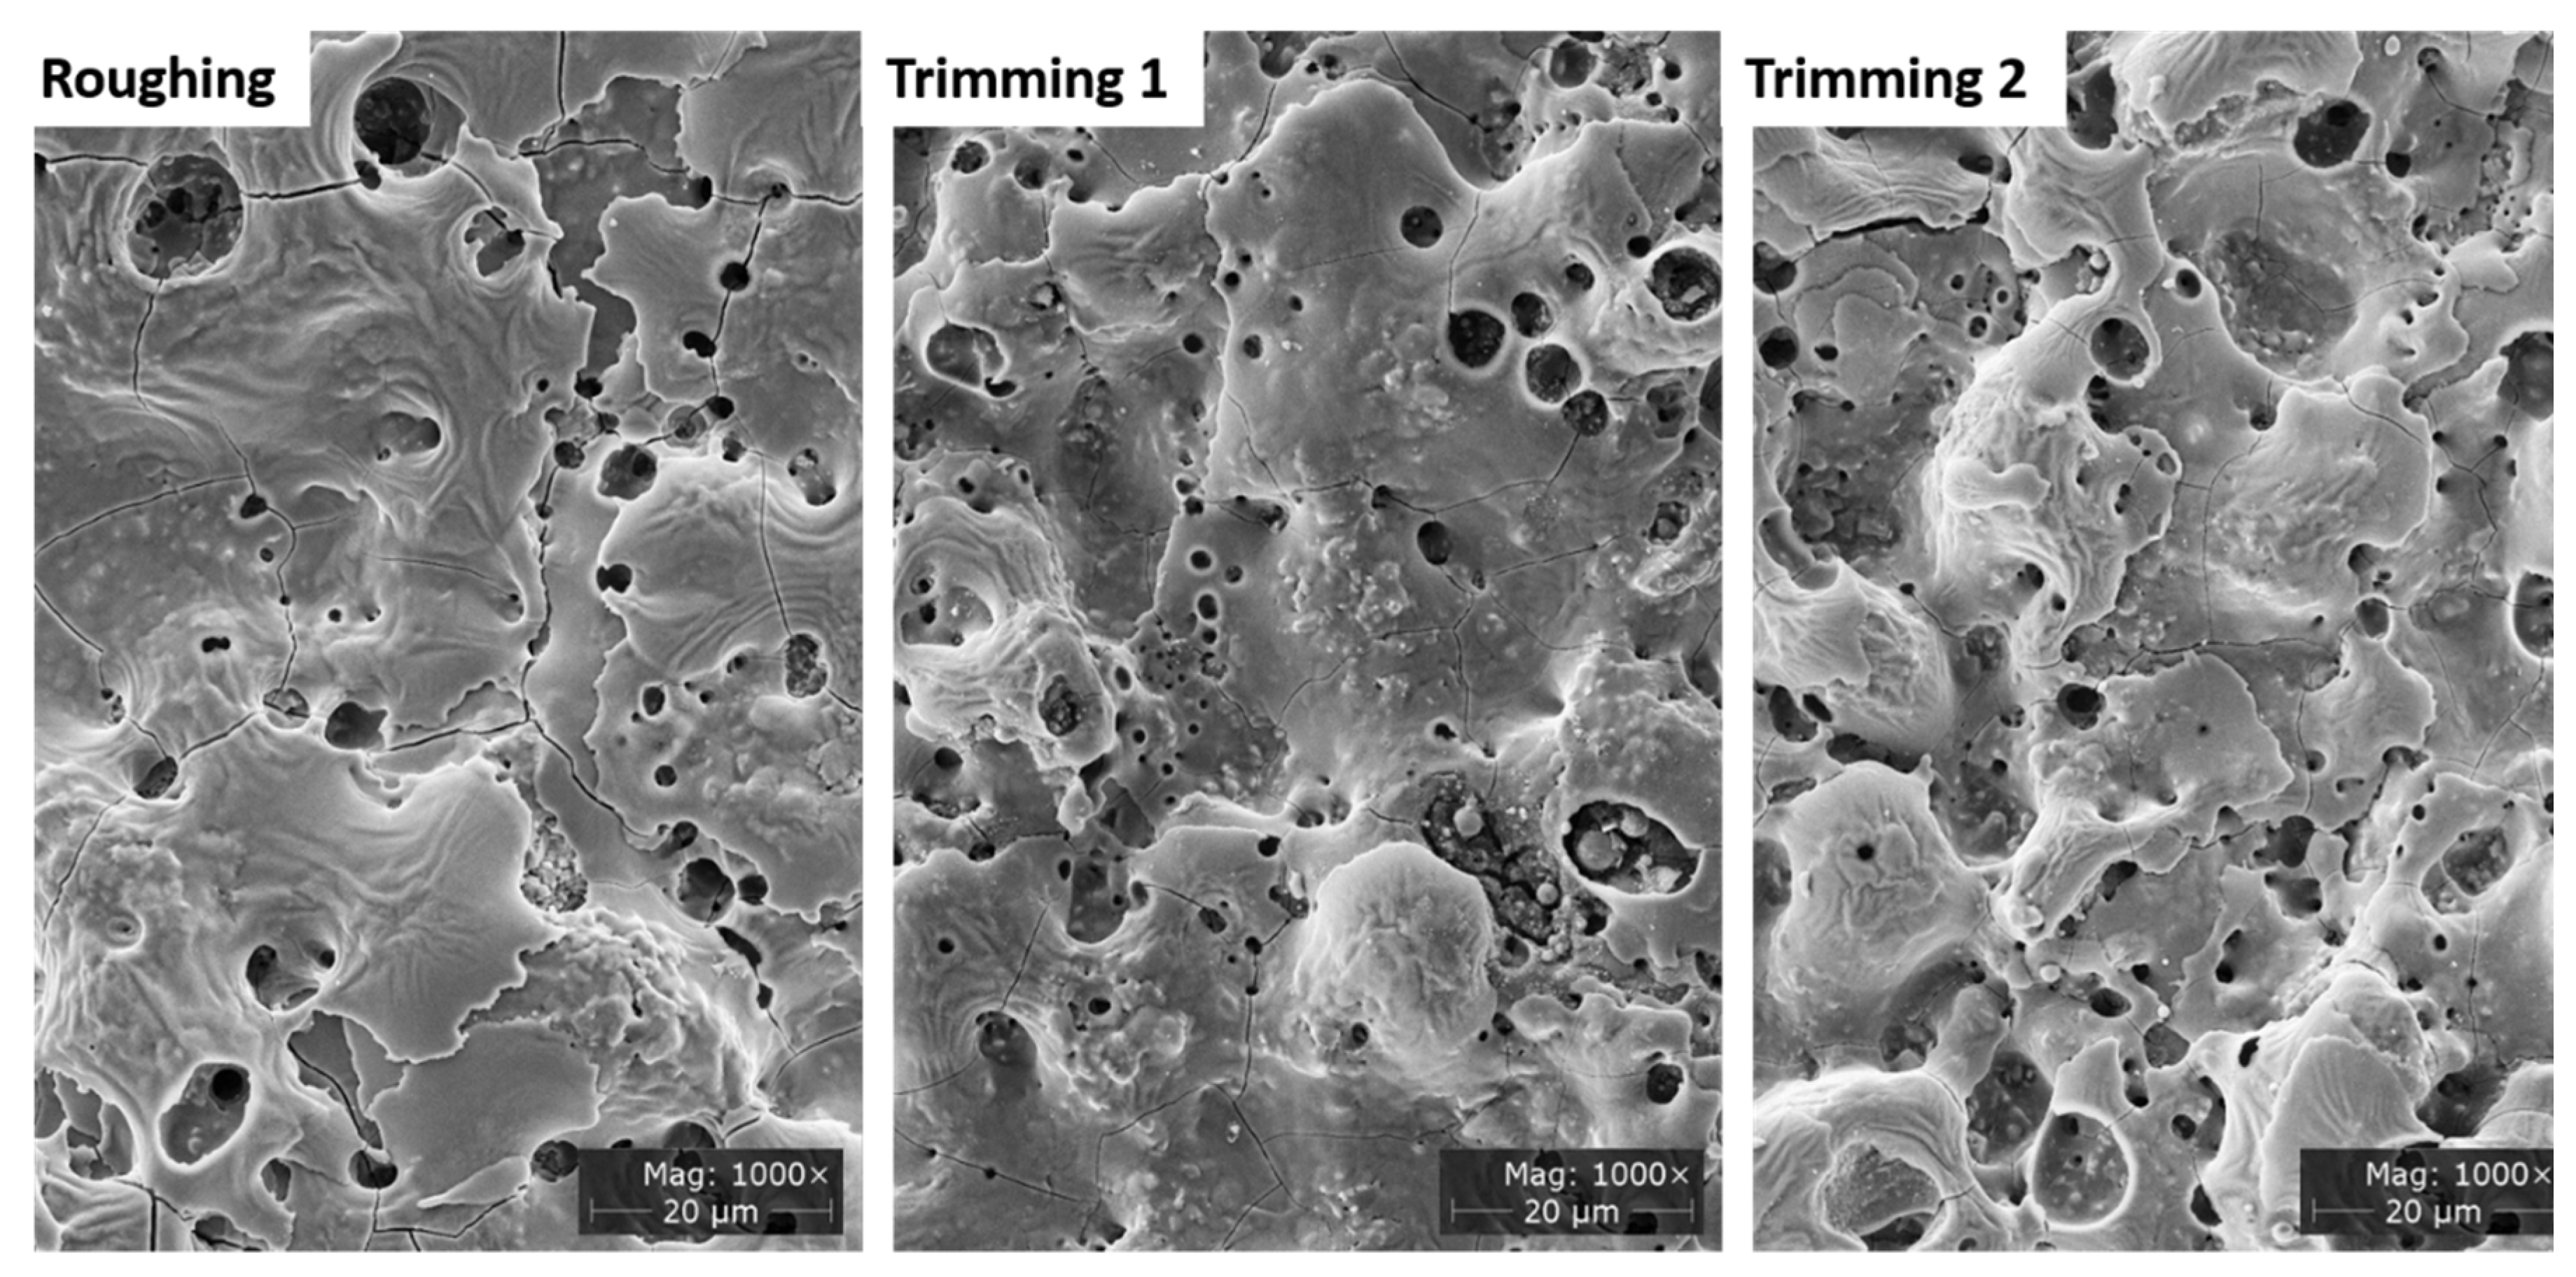
At higher magnification more interesting details are revealed (Figure 7). The crack network is somewhat more pronounced at higher energy input as can be expected. The glassy layer resulting from the roughing steps shows wavy patterns which are less pronounced in the trimming steps. Holes resulting from discharge of gaseous decomposition products are smaller and more evenly distributed in the surfaces derived from the roughing operation. The trimming operations especially at the lowest energy input have a foamy aspect. Moreover, in the trimming surfaces some larger particles seems to be embedded into the glassy layer and some globular machining debris is loosely attached to the surface.
The observation of an increasing surface roughness with decreasing discharge energy coincides with the integral values of surface roughness determined by white light interferometry shown in Table 2.
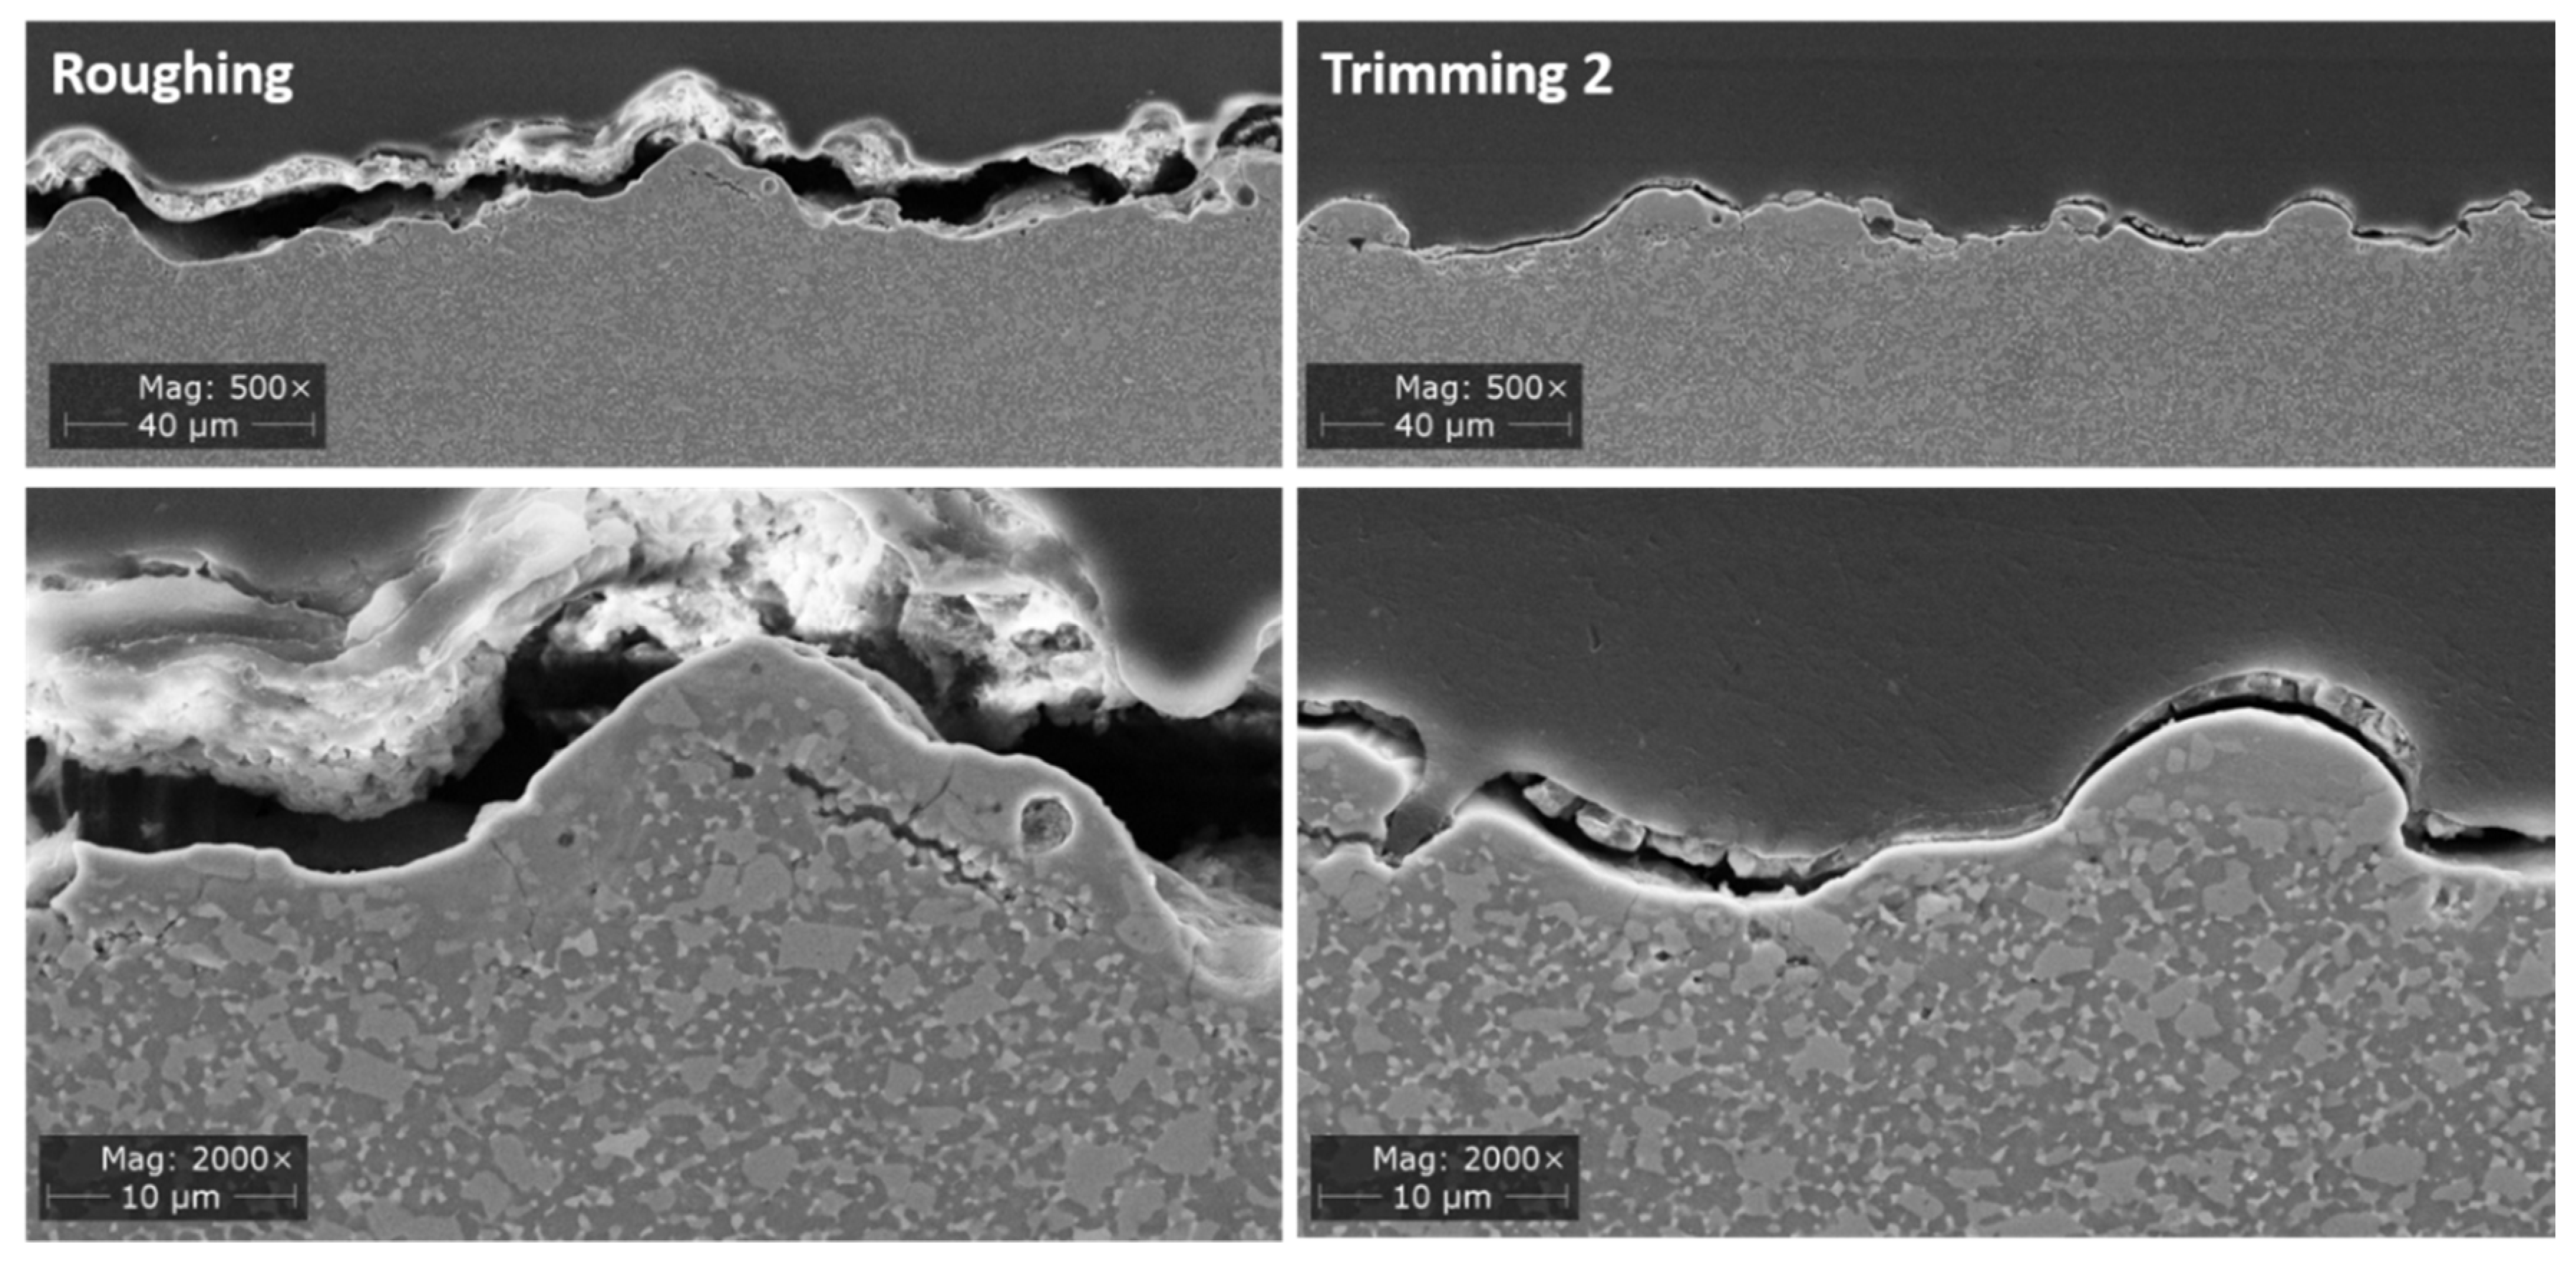
Figure 8 shows cross-sections of machined ZTA-TiN ceramics. The images of the cross-section confirm the previous observations. Both samples from roughing and trimming operations show a wavy surface with a glass-like layer on the surface of variable thickness. In case of the roughing step the glassy layer has a thickness of ~5–6 µm. Some vertical cracks are stopped at the interface been boundary layer and unaffected substate material. However, some lateral cracks are formed which indicates a considerable level of residual stress in the surface layer. In case of the trimming operation the process zone is thinner in average (1–2 µm). An accumulation of glassy material is found at the bumps of the surface, here the layer may be 5 µm thick. Evidently, the larger bright particles embedded into the glassy surface layers are titanium nitride grains. Vertical as well as lateral cracks are shorter. Delamination of the outer shell, as foreshadowed in the case of the boundary layer of the roughing step, cannot be observed. The structure of non-etched substrate material is very homogeneous and confirms the observations in Section 3.1.
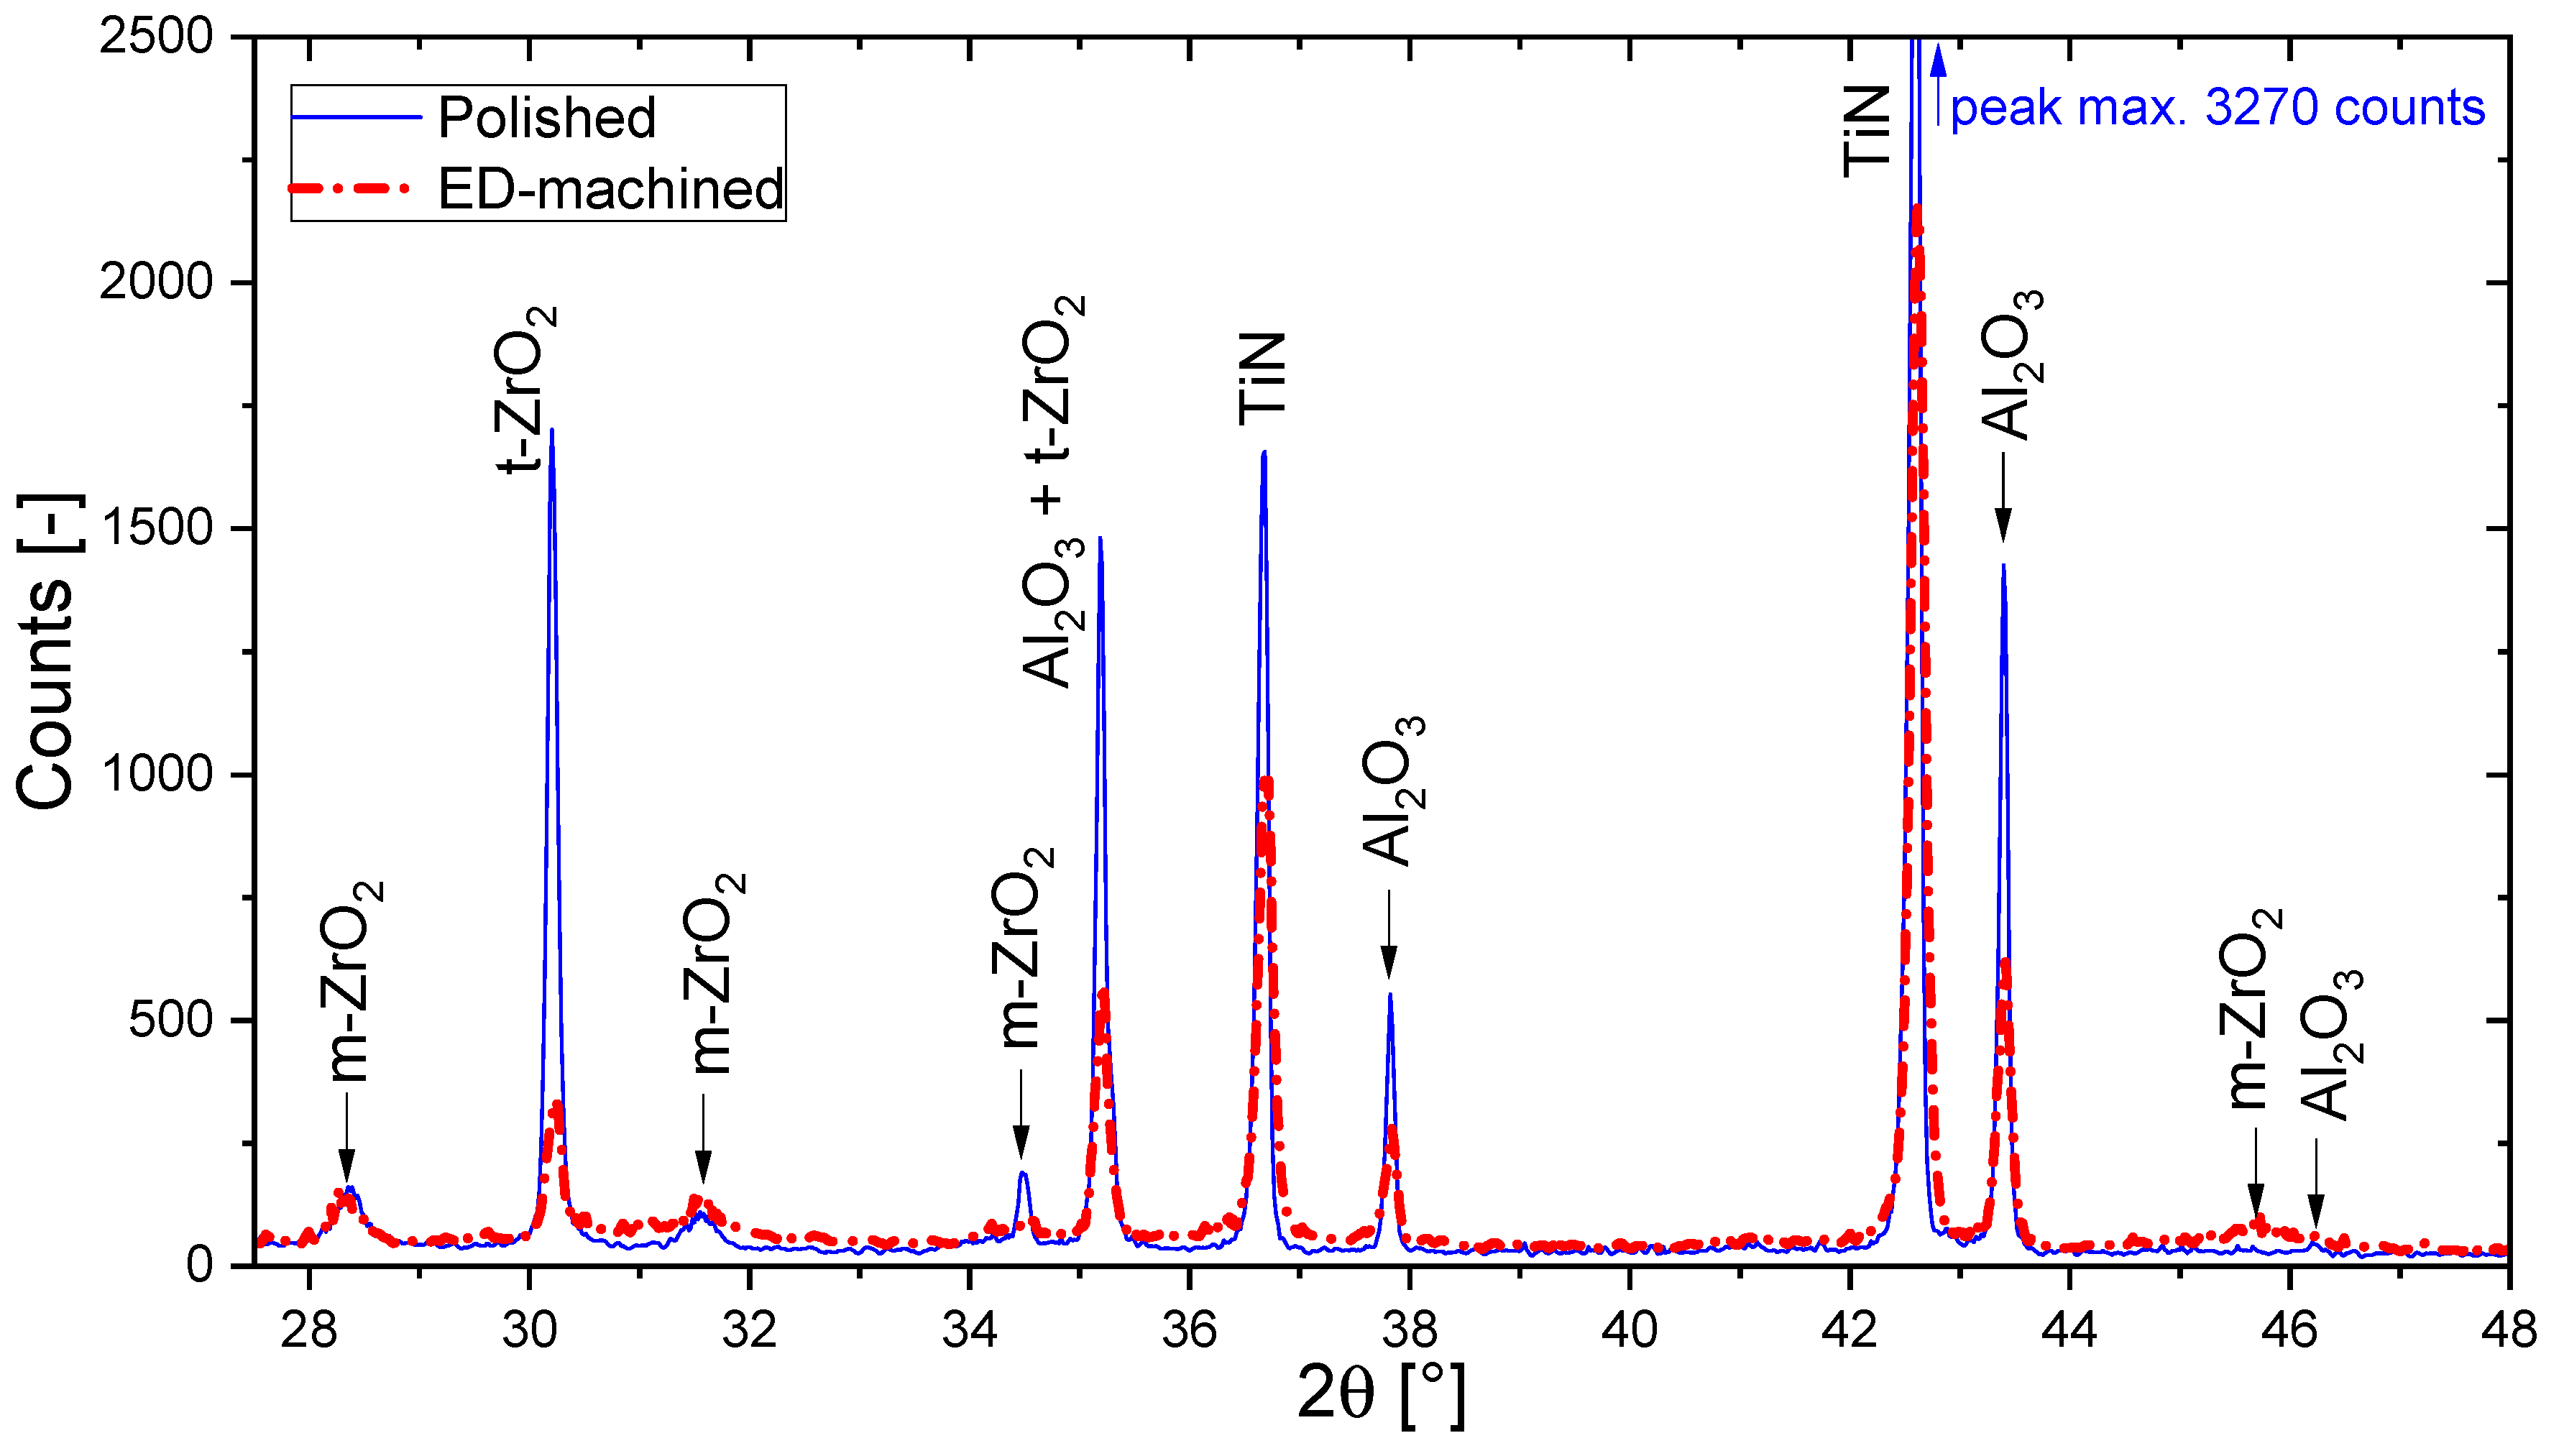
It was tried to identify the composition of the boundary layer by X-ray. Figure 9 shows the spectra of the pristine surface and of the surface after the roughing step. As the thickness of the process zone is very low (5–6 µm) the spectrum is dominated by the substrate. Still, some interesting changes can be found. The intensity of tetragonal zirconia is reduced radically in machined surfaces which can be either a hint of selective removal of this phase or – which is more likely – that the remaining zirconia on the surface transforms into monoclinic zirconia during ED-machining. Furthermore, the alumina and zirconia phases seem to be removed faster than titanium nitride (see differences in peak altitudes). On the diffractogram of the ED-machined surface the peaks are broader. It can be expected that any new formed peaks are very broad as the crystalline phases within the re-solidified layers are nanoscale and/or poorly crystallized (see e.g., m-ZrO2-peak at 2θ = 45.7°).
4. Discussion
ZTA-TiN materials with 10 vol% zirconia reinforcement and 28 vol% titanium nitride as conductive phase show attractive mechanical properties comparable to ZTA-TiC and ZTA-NbC materials studied previously [8,19]. Moreover, a far superior machining speed compared to these materials was observed. The attractive strength may be attributed to the fully dense microstructure and high homogeneity. Replacement of the brittle carbides by the tougher nitride [20,21] seems to be beneficial to both strength and toughness. Compared to other investigations on alumina-TiN composites the addition of zirconia enhances the toughness and enables lower sintering temperatures so that the microstructure remains fine grained [7]. Transformation toughening seems to be the dominant reinforcement mechanism. Transformability values of up to 21% are only slightly below the value of 25% reported for plain 10ZTA made from zirconia coated powders reported by Naglieri [22]. The powder choice and compounding procedure, therefore, seems to provide a very homogeneous distribution with a significant size fraction in the “correct” grain size range between ~400–500 nm. As the monoclinic content in the polished samples is above ~25% the alumina and TiN fractions are under tensile hydrostatic stress [16]. As tensile stress in the matrix weakens the grain boundaries, microcracking may also provide a certain toughness increment. This assumption is supported by the observation that the materials were difficult to polish due to grain breakout. The maximum monoclinic content at an intermediate sintering temperature—though not very pronounced – is an interesting detail. A priori, we would expect a rise in monoclinic content with an increase of sintering temperature and grain size. As the materials are sintered under reducing conditions, we may expect a higher amount of thermal oxygen vacancies at higher temperature [23,24]. Moreover, it is known that interdiffusion of oxygen and nitrogen in zirconium and titanium compounds may lead to stabilization via the anion lattice of zirconia [25]. Replacing of oxygen by nitrogen results oxygen vacancies for charge neutrality and in the same stabilizing effect as addition of yttria [26]. These combined effects seem to offset the effect of grain growth. The nitride fraction is obviously sufficient to form a percolating network which provides high electrical conductivity of ≈40 kS/m.
The machining results are at first sight very surprising as the roughing step provides the smoothest surface. Typically, in machining of steel or other ceramics the roughness is reduced by subsequent machining steps with lower energy input. In the present case trimming steps therefore seem inefficient to increase the surface quality. However, the investigation of the sub-surface structure indicates that the lower energy input of the trimming operations leads to a thinner boundary layer, shorter cracks and to a reduction of residual stress. The reduction of the energy input leads to a shift in material removal mechanisms. At high energy input the predominant mechanism is melting and gas bubbles indicate a contribution by evaporation. The ripples on the surface are apparently frozen structures resulting from Rayleigh surface waves propagating through the molten surface layer. The melt therefore seems to have a very low viscosity especially at high energy input. The low viscosity of the melt provides a smooth surface and facilitates material removal. A reduction of the energy input leads to rougher and foamier surfaces as molten material re-solidifies. The detail images (see Figure 7) indicate that the alumina and zirconia fraction as well as the smaller titanium nitride particles are completely molten while larger titanium nitride particle do not melt completely and are incorporated into the re-solidified surface layer.
5. Conclusions
The investigated ZTA-TiN materials with a moderate amount of 10 vol% unstabilized zirconia reinforcement and 28 vol.% commercially available fine grain titanium nitride show a combination of good mechanical properties in terms of strength, toughness and hardness. This qualifies these materials for many mechanically demanding engineering applications. The excellent machinability, especially the higher material removal rate compared to previously studied ED-machinable ZTA-TiC and ZTA-NbC materials offers a large economic benefit as roughing operations can be significantly accelerated. The effect of the material removal process and resulting surface properties on mechanical properties are yet to be determined. The fact that only short cracks are produced and that these cracks are terminated in the interface between boundary layer and substrate hint at a moderate strength reduction by machining operations.
Author Contributions
Conceptualization and methodology, F.K.; sample manufacturing and mechanical testing, F.K.; X-ray and EDM-experiments, A.G. writing, F.K. and A.G. All authors have read and agreed to the published version of the manuscript.
Funding
This research received no external funding.
Acknowledgments
The authors would like to thank Willi Schwan for sample preparation and SEM-images.
Conflicts of Interest
The authors declare no conflict of interest.
References
- Wang, J.; Stevens, R. Zirconia-toughened alumina (ZTA) ceramics. J. Mater. Sci. 1989, 24, 3421–3440. [Google Scholar] [CrossRef]
- Lange, F.F. Transformation toughening: Part 4 Fabrication, fracture toughness and strength of Al2O3-ZrO2 composites. J. Mater. Sci. 1982, 17, 247–254. [Google Scholar] [CrossRef]
- Marinescu, I.D.; Hitchiner, M.; Uhlmann, E.; Rowe, W.B.; Inasaki, I. Handbook of Machining with Grinding Wheels; CRC Press: Boca Raton, FL, USA, 2006; ISBN 9780429171055. [Google Scholar]
- Kurtz, S.M.; Kocagöz, S.; Arnholt, C.; Huet, R.; Ueno, M.; Walter, W.L. Advances in zirconia toughened alumina biomaterials for total joint replacement. J. Mech. Behav. Biomed. Mater. 2014, 31, 107–116. [Google Scholar] [CrossRef] [PubMed] [Green Version]
- Landfried, R.; Kern, F.; Burger, W.; Leonhardt, W.; Gadow, R. Development of Electrical Discharge Machinable ZTA Ceramics with 24 vol% of TiC, TiN, TiCN, TiB2 and WC as Electrically Conductive Phase. Int. J. Appl. Ceram. Technol. 2013, 10, 509–518. [Google Scholar] [CrossRef]
- Echeberria, J.; Rodríguez, N.; Vleugels, J.; Vanmeensel, K.; Reyes-Rojas, A.; Garcia-Reyes, A.; Domínguez-Rios, C.; Aguilar-Elguézabal, A.; Bocanegra-Bernal, M.H. Hard and tough carbon nanotube-reinforced zirconia-toughened alumina composites prepared by spark plasma sintering. Carbon 2012, 50, 706–717. [Google Scholar] [CrossRef]
- Rak, Z.S.; Czechowski, J. Manufacture and properties of Al2O3–TiN particulate composites. J. Eur. Ceram. Soc. 1998, 18, 373–380. [Google Scholar] [CrossRef]
- Schmitt-Radloff, U.; Kern, F.; Gadow, R. Spark plasma sintering and hot pressing of ZTA-NbC materials—A comparison of mechanical and electrical properties. J. Eur. Ceram. Soc. 2018, 38, 4003–4013. [Google Scholar] [CrossRef]
- Suzuki, K.; Morishita, T.; Yogo, T. Sintered Ceramic Bodies and Ceramic Metal Working Tools. U.S. Patent 09/112,456, 7 November 1995. [Google Scholar]
- Evans, A.G.; Charles, E.A. Fracture Toughness Determinations by Indentation. J. Am. Ceram. Soc. 1976, 59, 371–372. [Google Scholar] [CrossRef]
- Chantikul, P.; Anstis, G.R.; Lawn, B.R.; Marshall, D.B. A Critical Evaluation of Indentation Techniques for Measuring Fracture Toughness: II, Strength Method. J. Am. Ceram. Soc. 1981, 64, 539–543. [Google Scholar] [CrossRef]
- Toraya, H.; Yoshimura, M.; Somiya, S. Calibration Curve for Quantitative Analysis of the Monoclinic-Tetragonal ZrO2 System by X-Ray Diffraction. J. Am. Ceram. Soc. 1984, 67, C119–C121. [Google Scholar] [CrossRef]
- Kosmać, T.; Wagner, R.; Claussen, N. X-Ray Determination of Transformation Depths in Ceramics Containing Tetragonal ZrO2. J. Am. Ceram. Soc. 1981, 64, C72–C73. [Google Scholar] [CrossRef]
- McMeeking, R.M.; Evans, A.G. Mechanics of Transformation-Toughening in Brittle Materials. J. Am. Ceram. Soc. 1982, 65, 242–246. [Google Scholar] [CrossRef]
- Heuer, A.H. Transformation Toughening in ZrO2-Containing Ceramics. J. Am. Ceram. Soc. 1987, 70, 689–698. [Google Scholar] [CrossRef]
- Gregori, G.; Burger, W.; Sergo, V. Piezo-spectroscopic analysis of the residual stresses in zirconia-toughened alumina ceramics: The influence of the tetragonal-to-monoclinic transformation. Mater. Sci. Eng. 1999, 271, 401–406. [Google Scholar] [CrossRef]
- Iwanek, H.; Grathwohl, G.; Hamminger, R.; Brugger, N. Machining of ceramics by different methods. In Ceramic Materials and Components for Engines: Proceedings of the 2nd International Symposium, Lübeck, Germany, 14–17 April 1986; Bunk, W., Ed.; Deutsche Keramische Gesellschaft: Cologne, Germany, 1986; pp. 417–423. ISBN 3-925543-01-5. [Google Scholar]
- Landfried, R.; Kern, F.; Gadow, R. Electrical Discharge Machining of Alumina-Zirconia-TiC Composites with Varying Zirconia Content. Key Eng. Mater. 2013, 554, 1916–1921. [Google Scholar] [CrossRef]
- Schmitt-Radloff, U.; Gommeringer, A.; Assmuth, P.; Kern, F.; Klocke, F.; Holsten, M.; Schneider, S. Effects of Composition on Mechanical and ED-machining Characteristics of Zirconia toughened Alumina—Titanium Carbide (ZTA-TiC) Composite Ceramics. Procedia CIRP 2018, 68, 17–21. [Google Scholar] [CrossRef]
- Carbide, Nitride and Boride Materials Synthesis and Processing, 1st ed.; Weimer, A.W. (Ed.) Chapman & Hall: London, UK, 1997; ISBN 978-94-010-65251-4. [Google Scholar]
- Kuwahara, H.; Mazaki, N.; Takahashi, M.; Watanabe, T.; Yang, X.; Aizawa, T. Mechanical properties of bulk sintered titanium nitride ceramics. Mater. Sci. Eng. A 2001, 319, 687–691. [Google Scholar] [CrossRef]
- Naglieri, V.; Palmero, P.; Montanaro, L.; Chevalier, J. Elaboration of Alumina-Zirconia Composites: Role of the Zirconia Content on the Microstructure and Mechanical Properties. Materials 2013, 6, 2090–2102. [Google Scholar] [CrossRef] [Green Version]
- Hillert, M. Thermodynamic Model of the Cubic—Tetragonal Transition in Nonstoichiometric Zirconia. J. Am. Ceram. Soc. 1991, 74, 2005–2006. [Google Scholar] [CrossRef]
- Bartolome, J.F.; Montero, I.; Diaz, M.; Lopez-Esteban, S.; Moya, J.S.; Deville, S.; Gremillard, L.; Chevalier, J.; Fantozzi, G. Accelerated Aging in 3-mol%-Yttria-Stabilized Tetragonal Zirconia Ceramics Sintered in Reducing Conditions. J. Am. Ceram. Soc. 2004, 87, 2282–2285. [Google Scholar] [CrossRef]
- Vleugels, J.; van der Biest, O. Development and Characterization of Y2O3-Stabilized ZrO2 (Y-TZP) Composites with TiB2, TiN, TiC and TiC0.5N0.5. J. Am. Ceram. Soc. 1999, 82, 2717–2720. [Google Scholar] [CrossRef]
- Cheng, Y.-B.; Thompson, D.P. Role of Anion Vacancies in Nitrogen-Stabilized Zirconia. J. Am. Ceram. Soc. 1993, 76, 683–688. [Google Scholar] [CrossRef]
Figure 1.
SEM images of polished and thermally etched ZTA-TiN composites sintered at different temperatures, dark grains are Al2O3, small light grains are ZrO2 and medium grey is TiN.
Figure 1.
SEM images of polished and thermally etched ZTA-TiN composites sintered at different temperatures, dark grains are Al2O3, small light grains are ZrO2 and medium grey is TiN.

Figure 2.
Vickers hardness HV10 and 4-point bending strength σ4pt of ZTA-TiN depending on sintering temperature.
Figure 2.
Vickers hardness HV10 and 4-point bending strength σ4pt of ZTA-TiN depending on sintering temperature.

Figure 3.
Fracture resistance KDCM (Evans model) and KISB of ZTA-TiN vs. sintering temperature.

Figure 4.
(a) monoclinic zirconia phase contents in polished surfaces Vm,p, in fracture surfaces Vm,f and transformability Vf , (b) transformation zone size h and transformation toughness increment ΔKICT.
Figure 4.
(a) monoclinic zirconia phase contents in polished surfaces Vm,p, in fracture surfaces Vm,f and transformability Vf , (b) transformation zone size h and transformation toughness increment ΔKICT.

Figure 5.
Material removal rates MRR and electrode wear ratios EW of different machining steps.

Figure 6.
SEM images showing an overview of ZTA-TiN surfaces ED-machined with different parameter set.
Figure 6.
SEM images showing an overview of ZTA-TiN surfaces ED-machined with different parameter set.

Figure 7.
SEM images showing details of ZTA-TiN surfaces ED-machined with different parameter sets.

Figure 8.
SEM images showing cross sections of ZTA-TiN surfaces ED-machined with different parameter sets (left roughing, right trimming 2).
Figure 8.
SEM images showing cross sections of ZTA-TiN surfaces ED-machined with different parameter sets (left roughing, right trimming 2).

Figure 9.
X-ray diffractogram of polished and ED-machined surfaces.


Table 1.
EDM characteristics for die sinking experiments.
| Process | Discharge Current [A] | Impulse Duration [µs] | Off Time [µs] |
|---|---|---|---|
| Roughing | 10.0 | 9.9 | 34.8 |
| Trimming 1 | 7.0 | 7.8 | 44.2 |
| Trimming 2 | 3.5 | 5.0 | 46.5 |
Table 2.
Roughness values for ED-machined surfaces.
| Process | Average Roughness Ra [µm] | Average Roughness Depth Rz [µm] |
|---|---|---|
| Roughing | 1.86 ± 0.28 | 8.61 ± 1.29 |
| Trimming 1 | 2.21 ± 0.30 | 10.1 ± 1.36 |
| Trimming 2 | 2.25 ± 0.33 | 10.3 ± 1.46 |
© 2020 by the authors. Licensee MDPI, Basel, Switzerland. This article is an open access article distributed under the terms and conditions of the Creative Commons Attribution (CC BY) license (http://creativecommons.org/licenses/by/4.0/).
Share and Cite
MDPI and ACS Style
Gommeringer, A.; Kern, F. Mechanical Properties and Electrical Discharge Machinability of Alumina-10 vol% Zirconia-28 vol% Titanium Nitride Composites. Ceramics 2020, 3, 199-209. https://0-doi-org.brum.beds.ac.uk/10.3390/ceramics3020018
AMA Style
Gommeringer A, Kern F. Mechanical Properties and Electrical Discharge Machinability of Alumina-10 vol% Zirconia-28 vol% Titanium Nitride Composites. Ceramics. 2020; 3(2):199-209. https://0-doi-org.brum.beds.ac.uk/10.3390/ceramics3020018
Chicago/Turabian StyleGommeringer, Andrea, and Frank Kern. 2020. "Mechanical Properties and Electrical Discharge Machinability of Alumina-10 vol% Zirconia-28 vol% Titanium Nitride Composites" Ceramics 3, no. 2: 199-209. https://0-doi-org.brum.beds.ac.uk/10.3390/ceramics3020018