Mechanical Properties of 2Y-TZP Fabricated from Detonation Synthesized Powder


Institute for Manufacturing Technologies of Ceramic Components and Composites (IFKB), University of Stuttgart, Allmandring 7b, D-70569 Stuttgart, Germany
*
Author to whom correspondence should be addressed.
Ceramics 2020, 3(4), 440-452; https://0-doi-org.brum.beds.ac.uk/10.3390/ceramics3040037
Submission received: 25 September 2020
/
Revised: 27 October 2020
/
Accepted: 30 October 2020
/
Published: 2 November 2020
(This article belongs to the Special Issue Biomedical Ceramics and Glasses)
Abstract
:Yttria stabilized zirconia (Y-TZP) is frequently used in dental and engineering applications due to its high strength and fracture resistance. In this study, 2Y-TZP samples were manufactured from commercially available powder produced by detonation synthesis. Tests of the mechanical properties exhibited an unusual combination of both very high strength and toughness. The materials show a very weak correlation between toughness and grain size. The transformability, measurable by XRD, cannot explain the high toughness. Fractographic analysis revealed a broad transformation affected zone with secondary cracks and shear bands on the tensile side of bending bars which can be made responsible for the high toughness and non-linear stress–strain curves.
1. Introduction
Yttria stabilized zirconia ceramics are commodities used in various applications such as biomedical, mechanical, sensors, solid oxide fuel cells, and thermal barrier coatings [1,2,3,4,5]. For structural applications zirconia materials stabilized in the tetragonal phase by addition of 2–3 mol % Y2O3 (2-3Y-TZP) are relevant. These materials show a combination of high strength and fracture resistance due to transformation toughening, a stress induced martensitic transformation from metastable tetragonal to stable monoclinic phase. The phase transition comes along with a volume expansion ε = 4–5% and shear of ≈16% [6]. The volume expansion puts the crack under compressive stress and thereby reduces the stress intensity at the crack tip. Starting powders of 3Y-TZP are today typically made by coprecipitation of oxides or hydroxides from yttrium and zirconium salts (typically chlorides) and a subsequent washing (chloride removal) and heat treatment procedures. In coprecipitated Y-TZP the constituents are homogeneously mixed at atomic level [7]. The phase diagram shows that the typical composition 3Y-TZP is in the t + c field at sintering temperature (1300–1500 °C). The composition is supersaturated in yttria. Sintered at low temperature the material is, however, fully tetragonal segregation of yttria to the grain boundaries is responsible for solute drag and fine grain microstructure [8,9]. Formation of cubic phase is typically observed at high temperature and long dwell. Reducing the stabilizer content leads to an improved toughness. A reduction of yttrium content to 2 mol % Y2O3 moderately enhances the toughness from 4–5 MPa√m for 3Y-TZP to 5–7 MPa√m depending on measuring protocol [10,11]. Binner has shown, however, that a significant toughness boost occurs at <2 mol % Y2O3 [12]. Understabilized (<2.5 mol % Y2O3) fully tetragonal materials are, however, very sensitive to sintering conditions, overfiring leads to grain growth and decomposition of the tetragonal phase [13].
Alternative stabilization methods are coating or high energy milling of zirconia and yttria in appropriate ratio. These “coated“ TZP materials sintered at low temperature show higher toughness at somewhat lower strength due to the existence of a stabilizer gradient [14,15,16]. Another method to produce stabilized and co-stabilized zirconia is the hydrothermal synthesis [17,18].
Detonation synthesis at first sight seems just a variation of the coprecipitation technology. The zirconia and yttria precursors are mixed with explosives and detonated [19,20]. Stabilized zirconia is thereby formed within an extremely short time increment at high temperature and pressure. In an earlier study, 3Y-TZP made from detonation synthesis powder was tested with respect to mechanical properties and low temperature degradation resistance [21]. The material exhibited slightly increased toughness and threshold toughness coupled with a two-stage ageing behavior resembling a ‘mixture’ of coprecipitated and coated TZP. Recently a 2Y-TZP material based on detonation synthesized powder was tested which showed both extremely high strength and high toughness and a surprisingly low tendency to low temperature degradation (LTD) for a material of low stabilizer content [22]. This study aims at finding the clue to this uncommon combination of properties by carrying out a detailed mechanical microstructure and phase composition analysis. A critical assessment of the methods was carried out in order to appraise whether the standard methods and calculation models can be safely applied when analyzing very tough Y-TZP materials.
2. Materials and Methods
Nanoscale 2Y-TZP starting powder manufactured by detonation synthesis was supplied by Innovnano, Portugal. The powder was processed as-received without any further compounding procedures. Cylindrical samples of 45 mm diameter and 2.2 mm thickness were produced by hot pressing (FCT Anlagenbau, Sonneberg, Germany) in boron nitride clad graphite dies. The furnace chamber was evacuated to <1 mbar then the die was heated up at a pre-load of 3 kN (≈2 MPa) to 1150 °C at 50 K/min. Between 1150 °C and the final sintering temperature the heating rate was reduced to 15 K/min and the axial pressure was increased linearly to 50 MPa. Final temperatures were varied between 1250–1450 °C in 50 K increments. The dwell at final temperature and maximum pressure was 1 h. Then the heater was shut off, the load was reduced to zero within 3 min and the die was cooled in the press. Four disks per sintering temperature were produced to obtain a sufficient quantity of samples for analysis. The disks were first manually ground to remove the surrounding grit and subsequently glued on sample holders. The samples were machined by lapping with 15 µm diamond suspension and polishing with 15 µm, 6 µm, 3 µm, and 1 µm on an automatic machine (Struers Rotopol, Copenhagen, Denmark). Density by buoyancy method, Youngs’s modulus, and Poisson’s ratio (by resonance frequency method, IMCE, Genk, Belgium) were measured on entire disks. The disks were then cut into bending bars of 4 mm width on a diamond wheel (Struers Accutom, Denmark). The sides of the as-cut bending bars were lapped with 15 µm suspension to remove the cutting affected zone, the edges of the bending bars were carefully beveled with a blunt 20 µm diamond disk. Vickers hardness HV10 tests were carried out with the remaining pieces (Bareiss, Baiersbronn, Germany, five indents each).
Bending strength σ4pt measurements were carried out using a four point setup with 20 mm outer and 10 mm inner span. The crosshead speed was 0.5 mm/min. 11 samples (cross section ≈2 × 3.8 mm²) per batch were tested. The fracture resistance was determined by three indentation based techniques. Direct crack length measurement (DCM) of HV10 was carried out and evaluated according to the Niihara Palmqvist crack model [23]. Indentation strength in bending (ISB) tests were carried out on four bending bars per batch. The bars were notched with a HV10 indent in the middle of the tensile side with cracks parallel and perpendicular to the sides. The residual strength was measured immediately afterwards in the same four point setup with a crosshead speed of 2.5 mm/min. Toughness was calculated according to Chantikul [24]. The third method was stable indentation crack growth in bending (SIGB) [25]. Here two bars were notched with 4 HV10 indents each. Indents were placed at a distance of 2 mm and aligned along the middle axis of the tensile side. Here the samples were exposed to a multistage loading process. The initial loading was carried out with one-third of the residual strength in the ISB test, the load was then increased in 10% increments of the residual strength until fracture occurred. The length of the cracks was determined with the microscope of the hardness machine after each loading step. The resulting SIGB plot of Ψ∙σ∙√c versus P∙c−1.5 shows three relevant stress intensities (Ψ = crack geometry coefficient, σ = bending stress, c = crack length, P = indentation load = 98.1 N). For the crack geometry coefficient, which is Ψ = 1.27 for a halfpenny crack, a value of Ψ = 1 was assumed to account for the flat profile of the Palmqvist cracks [26]. The ordinate intercept represents KIC. The kink in the curve which occurs at the stress intensity Kapp,0 when the cracks start to grow represents the R-curve related toughness increment. The threshold toughness is the difference KIC − Kapp,0 = KI0.
The phase composition of the zirconia material and its tetragonality was determined by XRD (X’Pert MPD, Malvern Panalytical, GB, CuKα1, Bragg–Brentano setup). In the fingerprint range between 27–33° 2Θ the areas of the monoclinic 111 and -111 peaks and of the 101 tetragonal peak were integrated and the monoclinic content was calculated according to the calibration curve of Toraya [27]. Integration was carried out using HighScore software (Malvern Panalytical, GB). Monoclinic contents of polished material Vm,p and in fracture faces of ISB tests Vm,f were measured and the transformability Vf was calculated as the difference Vf = Vm,f − Vm,p. In the 72–75° 2Θ range the tetragonality and cell volume were calculated based on the position of the tetragonal 400 and 004 peaks [28]. Based on XRD data values for transformation zone size h were calculated according to Kosmac [29]. Transformation toughness increments ΔKICT were calculated according to McMeeking with data for transformation zone size h, transformability Vf, Youngs’s modulus E and Poisson’s ratio ν [30]. Transformation toughness values were calculated assuming different transformation efficiencies X (from X = 0.27 predominantly dilatoric and typical for Y-TZP to X = 0.48 for fully developed dilatation and shear contribution such as in Mg-PSZ).
The starting powder was investigated by XRD as received and in annealed state (600 °C/1 h) to identify the phase composition and estimate the particle size by Scherrer analysis [31].
The microstructure of the materials was investigated by studying thermally etched samples (1150 °C/10 min hydrogen atmosphere), the grain size was determined by line intercept method using Mendelson’s correction factor of 1.58 [32].
Moreover, the structure of the tensile surfaces of bars fractured in ISB and in regular four-point bending tests were inspected by optical microscopy using differential interference contrast (DIC) in order to identify transformation zones indicating transformation related fracture.
3. Results
3.1. Mechanical Testing
Density and Young’s modulus values (not shown in detail) were measured for all materials. Density values vary between 6.08–6.082 g/cm³, Young’ modulus values were also very similar (208–211 GPa) so that the material can be considered fully densified at all sintering temperatures. Poisson’s ratios measured were in a narrow range of 0.318–0.322.
Figure 1 shows the bending strength σ4pt and the hardness HV10. The hardness HV10 shows only negligible changes in the order of the standard deviation with changing sintering temperature (HV10 = 1264–1286). The strength shows an initial increase from 1380 MPa to 1600 MPa between 1250 °C and 1300 °C. A further increase of sintering temperature leads to a continuous decline to 1410 MPa at 1450 °C. The standard deviation of strength is considerable as e.g., at 1350 °C maximum values of 1850 MPa and minimum values of 1130 MPa were determined. The lowest strength of all samples measured was, however, 952 MPa at 1250 °C sintering temperature, fractography revealed that sample contained a very large (230 µm) slot-shaped defect oriented parallel to the sample surface which initiated the failure (not shown). Taking into account that the dental standard EN 6872:2015 requests an average of 800 MPa the material despite the high standard deviation can be considered safe for such an application [33]. A reduction of strength with increase of sintering temperature and grain size is in-line with expectations. Another important fact worth mentioning in connection to the strength measurements is the slight non-linearity of stress–strain curves at very high stress. The peak strength samples show a deviation from elastic behavior at stress levels above 1500 MPa.
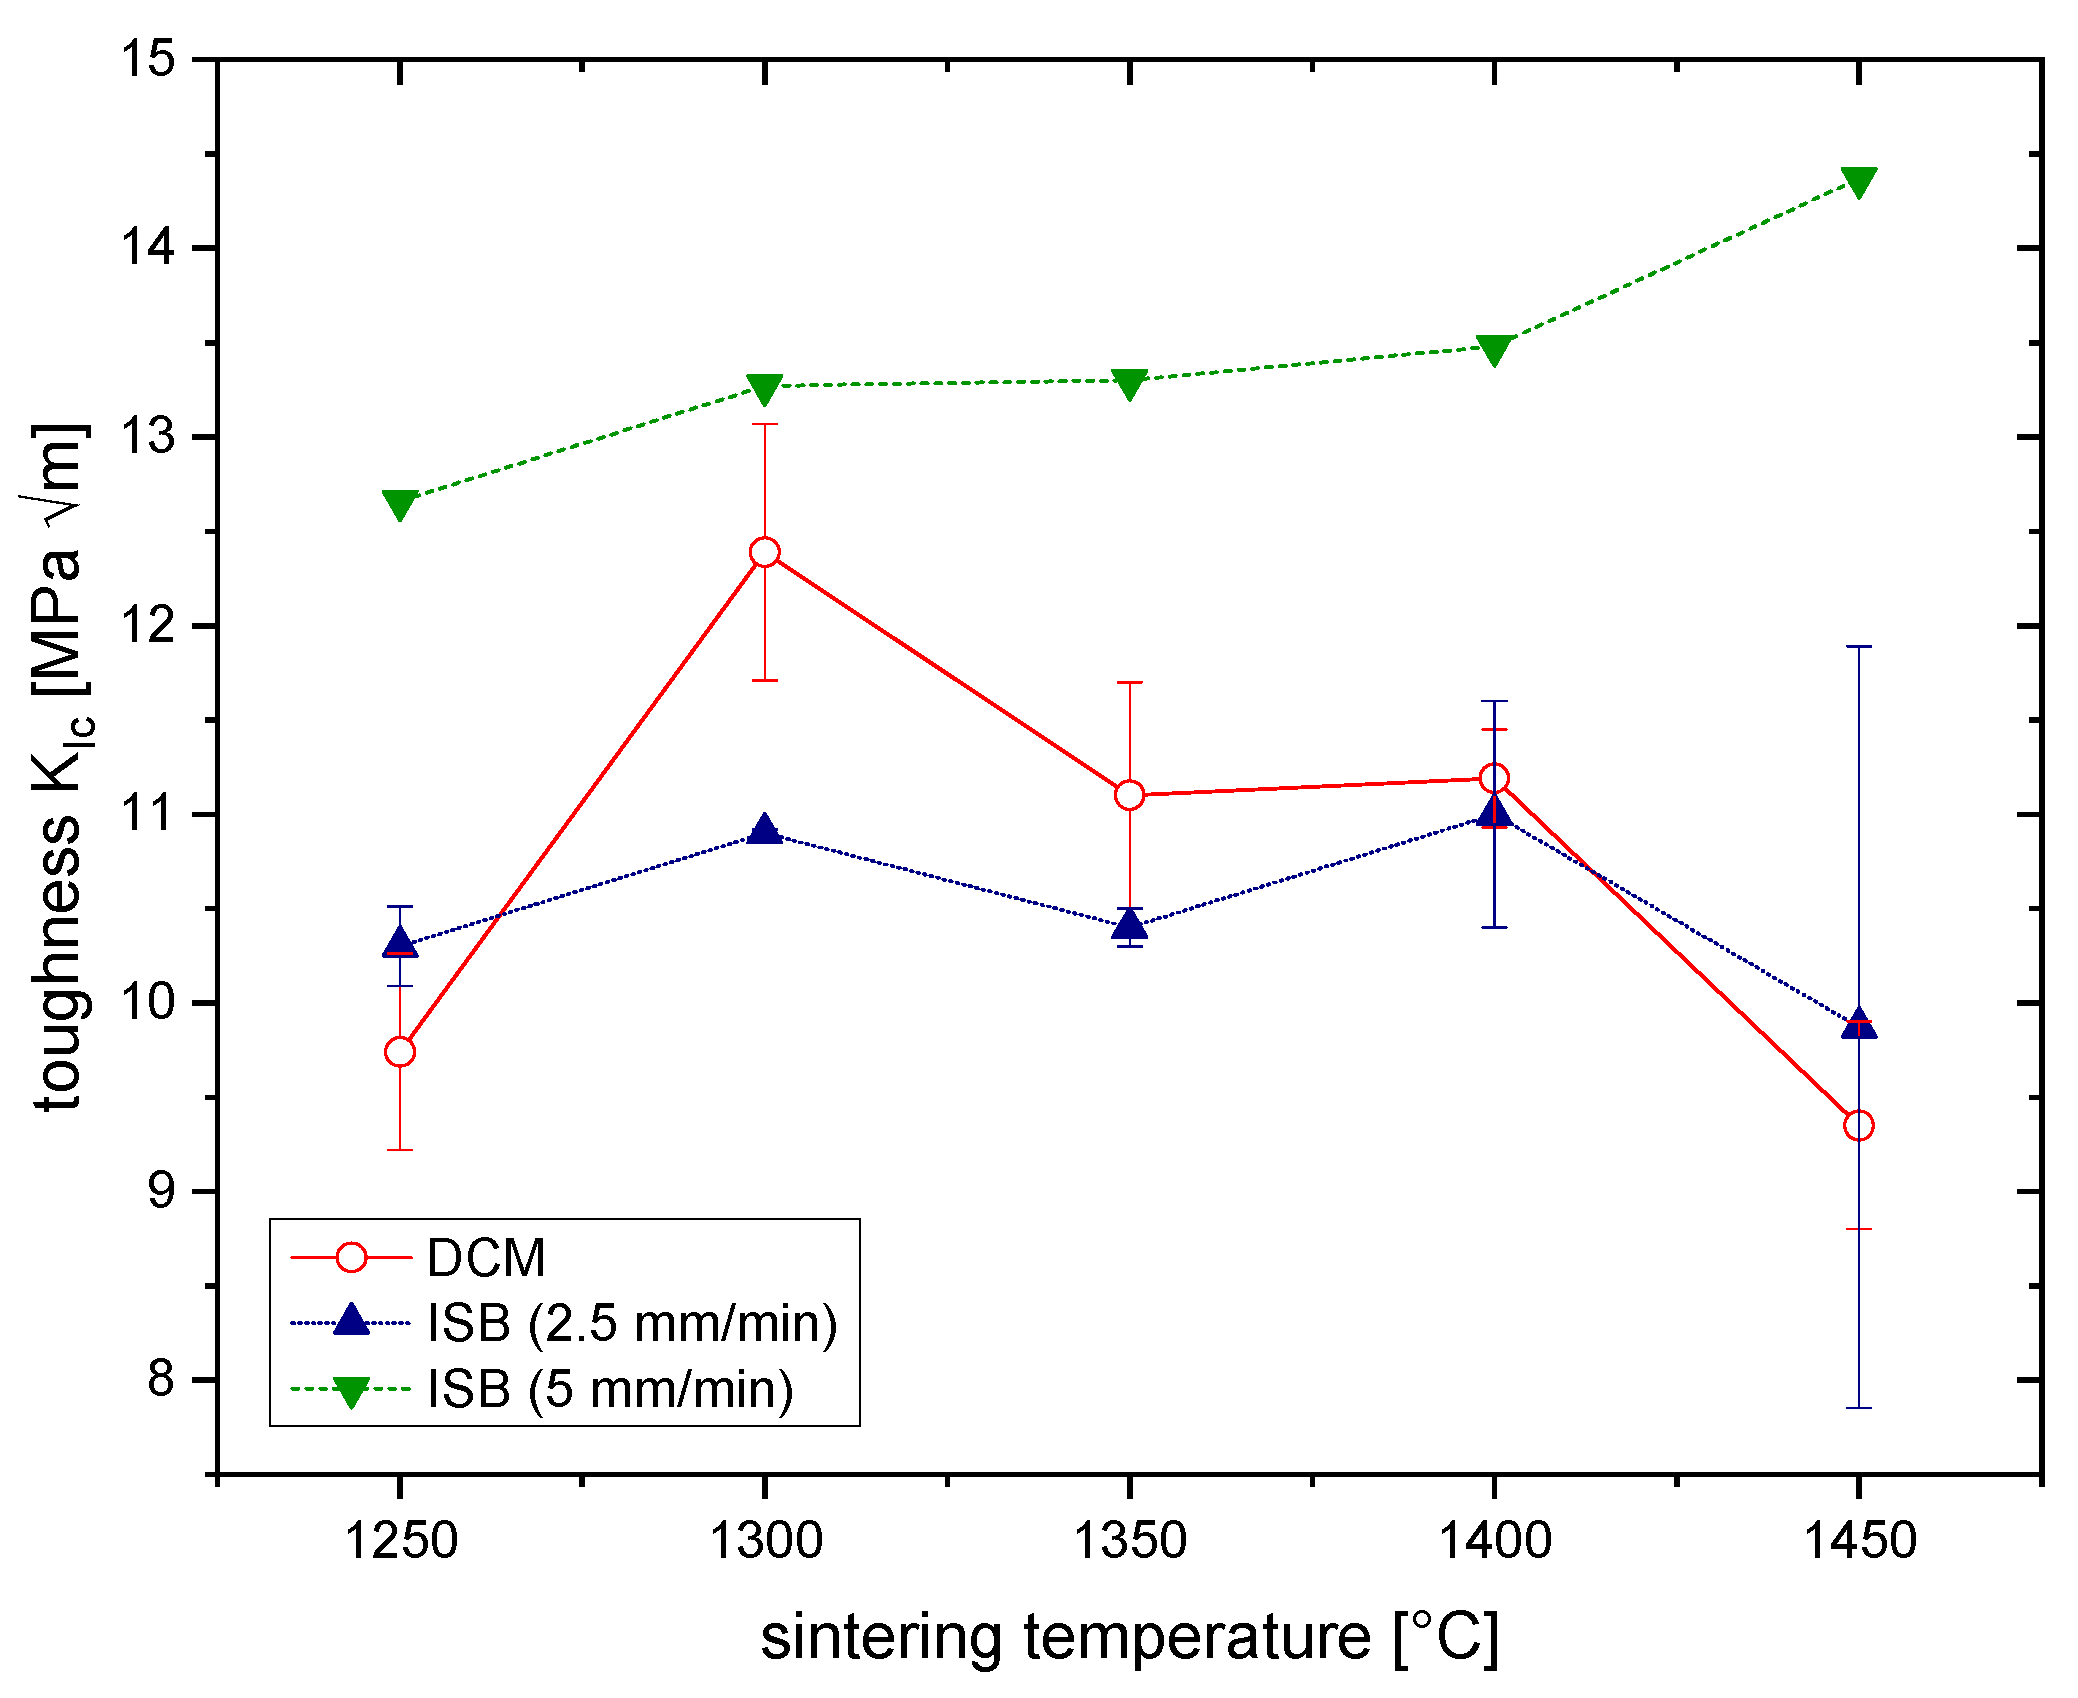
Figure 2 shows the fracture resistance values determined by DCM [23] and by ISB [24] at two crosshead speeds (5 mm/min from SIGB measurement [25]).
Toughness values in the range between 9.3–12.5 MPa√m in general are very high compared to a standard 3Y-TZP (KIC ≈ 5 MPa√m [1]). One would expect that toughness increases with rising sintering temperature (and grain size). It can be seen that the toughness measured by ISB shows a quite flat trend considering the standard deviations and that the DCM toughness features a toughness maximum at 1300 °C. The DCM method has recently been scathed anyway [34]. It is known that the formation of a large transformation zone may lead to trapping of the cracks [35,36]. The crack patterns produced (Figure 3) showed short cracks but were otherwise regular with fully developed wing cracks. In the materials sintered at 1250 °C and 1450 °C, the wing cracks reach the outer rim of the uplifted area/transformation zone in case of the TZP sintered at 1250 °C the crack is stopped inside this zone which may explain the extremely high toughness value. In principle, the ISB measurements which do not involve a somehow subjective measurement of crack length seem more reliable; however, the values measured for the TZP sintered at 1450 °C show extreme scattering. Moreover, it should be taken into account that trapping effects may also impair residual strength measurements. Another ISB toughness value was calculated using the residual strength level measurement in the SIGB test at 5 mm/min. Fracture toughness levels are considerably higher and the expected rising trend of toughness with sintering temperature becomes visible.
The results of the SIGB measurements are shown in Figure 4. Threshold toughness values KI0 vary in a narrow range between 3.8–4.7 MPa√m. They are only slightly higher than for coprecipitated 3Y-TZP as reported by Chevalier [37]. Kapp,0 values are in the range of 5.9–6.6 MPa√m and very similar for all materials.
Figure 5 shows a typical SIGB plot for a 2Y-TZP sintered at 1350 °C the kink representing the onset of crack growth is well developed allowing to read Kapp,0 properly from the graph. The increase of the stress intensity leads, however, only to a moderate crack growth (maximum crack length c = 0.215 mm) so that the extrapolation to the ordinate may lead to overestimated values even more so as cracks of infinite length do not exist and therefore the extrapolated value has no practical relevance [38]. Moreover, it was found in previous investigations that the slope Χ (residual stress coefficient) may be non-linear as the crack shapes change with increasing crack extension. The calculation of KI0 in Figure 4 was therefore not performed using the extrapolated value for KIC but more conservatively using the ISB toughness (KI0 = KISB − Kapp,0).
The residual strength levels in SIGB samples fractured at 5 mm/min (up to 960 MPa) were considerably higher than in the case of ISB samples fractured at 2.5 mm/min (up to 800 MPa) despite the fact that four notches were placed which implies somewhat higher failure probability.
3.2. Microstructure
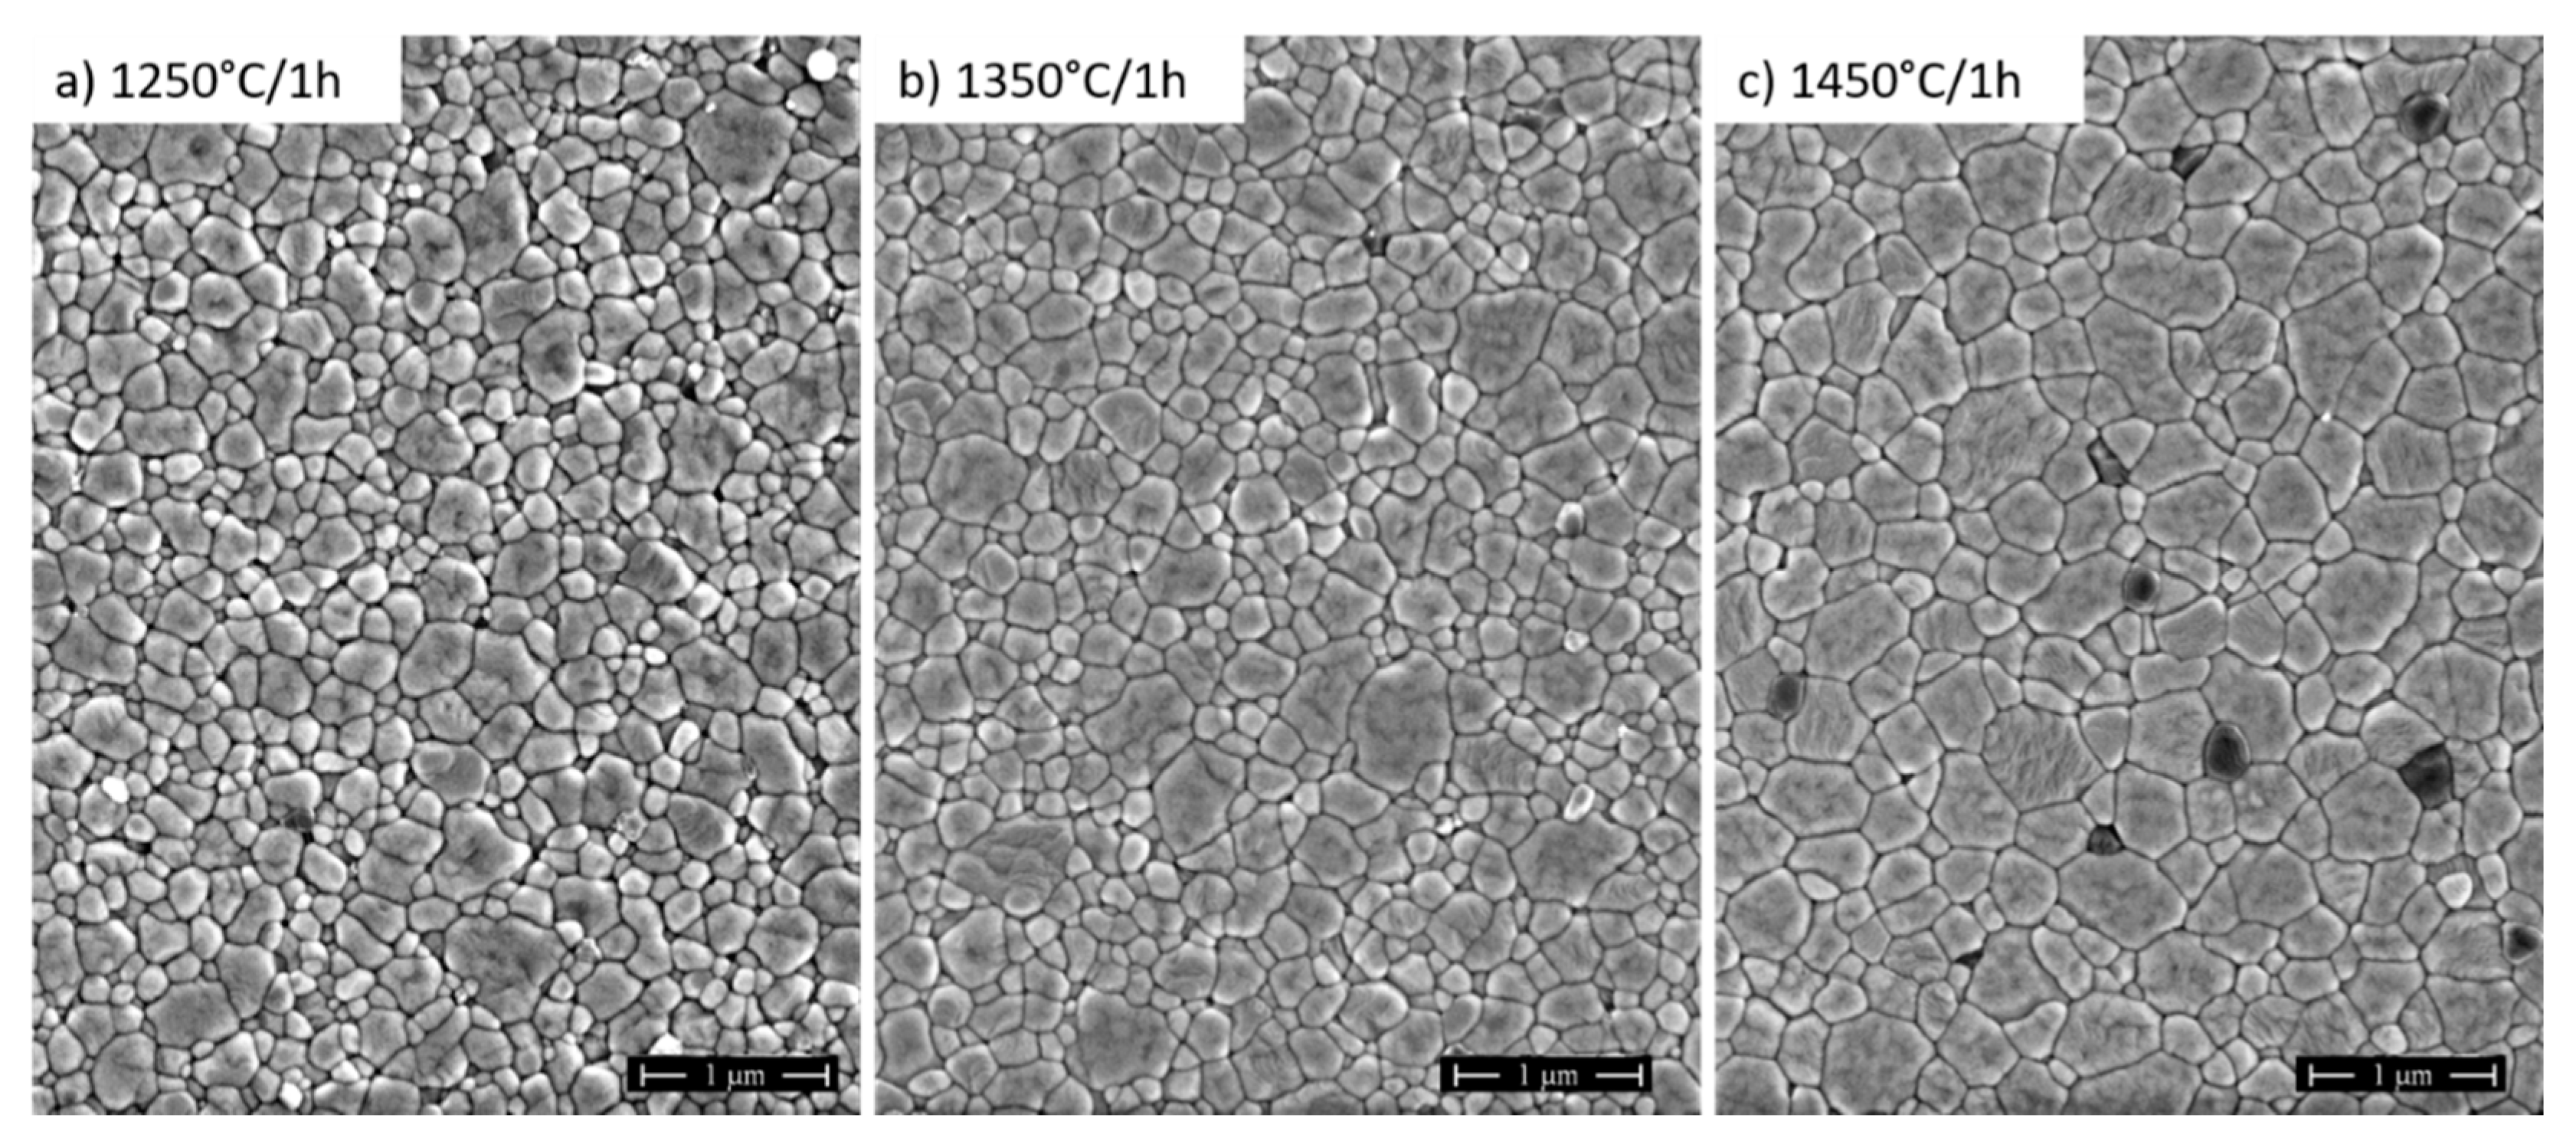
Figure 6 shows SEM images of 2Y-TZP sintered at 1250 °C, 1350 °C, and 1450 °C. All materials show a homogeneous and fully dense microstructure, the alumina dopant is visible as small black grains. As expected, the average grain size growth with increasing sintering temperature from 260 nm at 1250 °C to 460 nm at 1450 °C. The size distribution is narrow; large grains which could indicate cubic phase cannot be detected. Due to low stabilizer content, formation of cubic phase in 2Y-TZP is not expected anyway [8].
3.3. Phase Composition
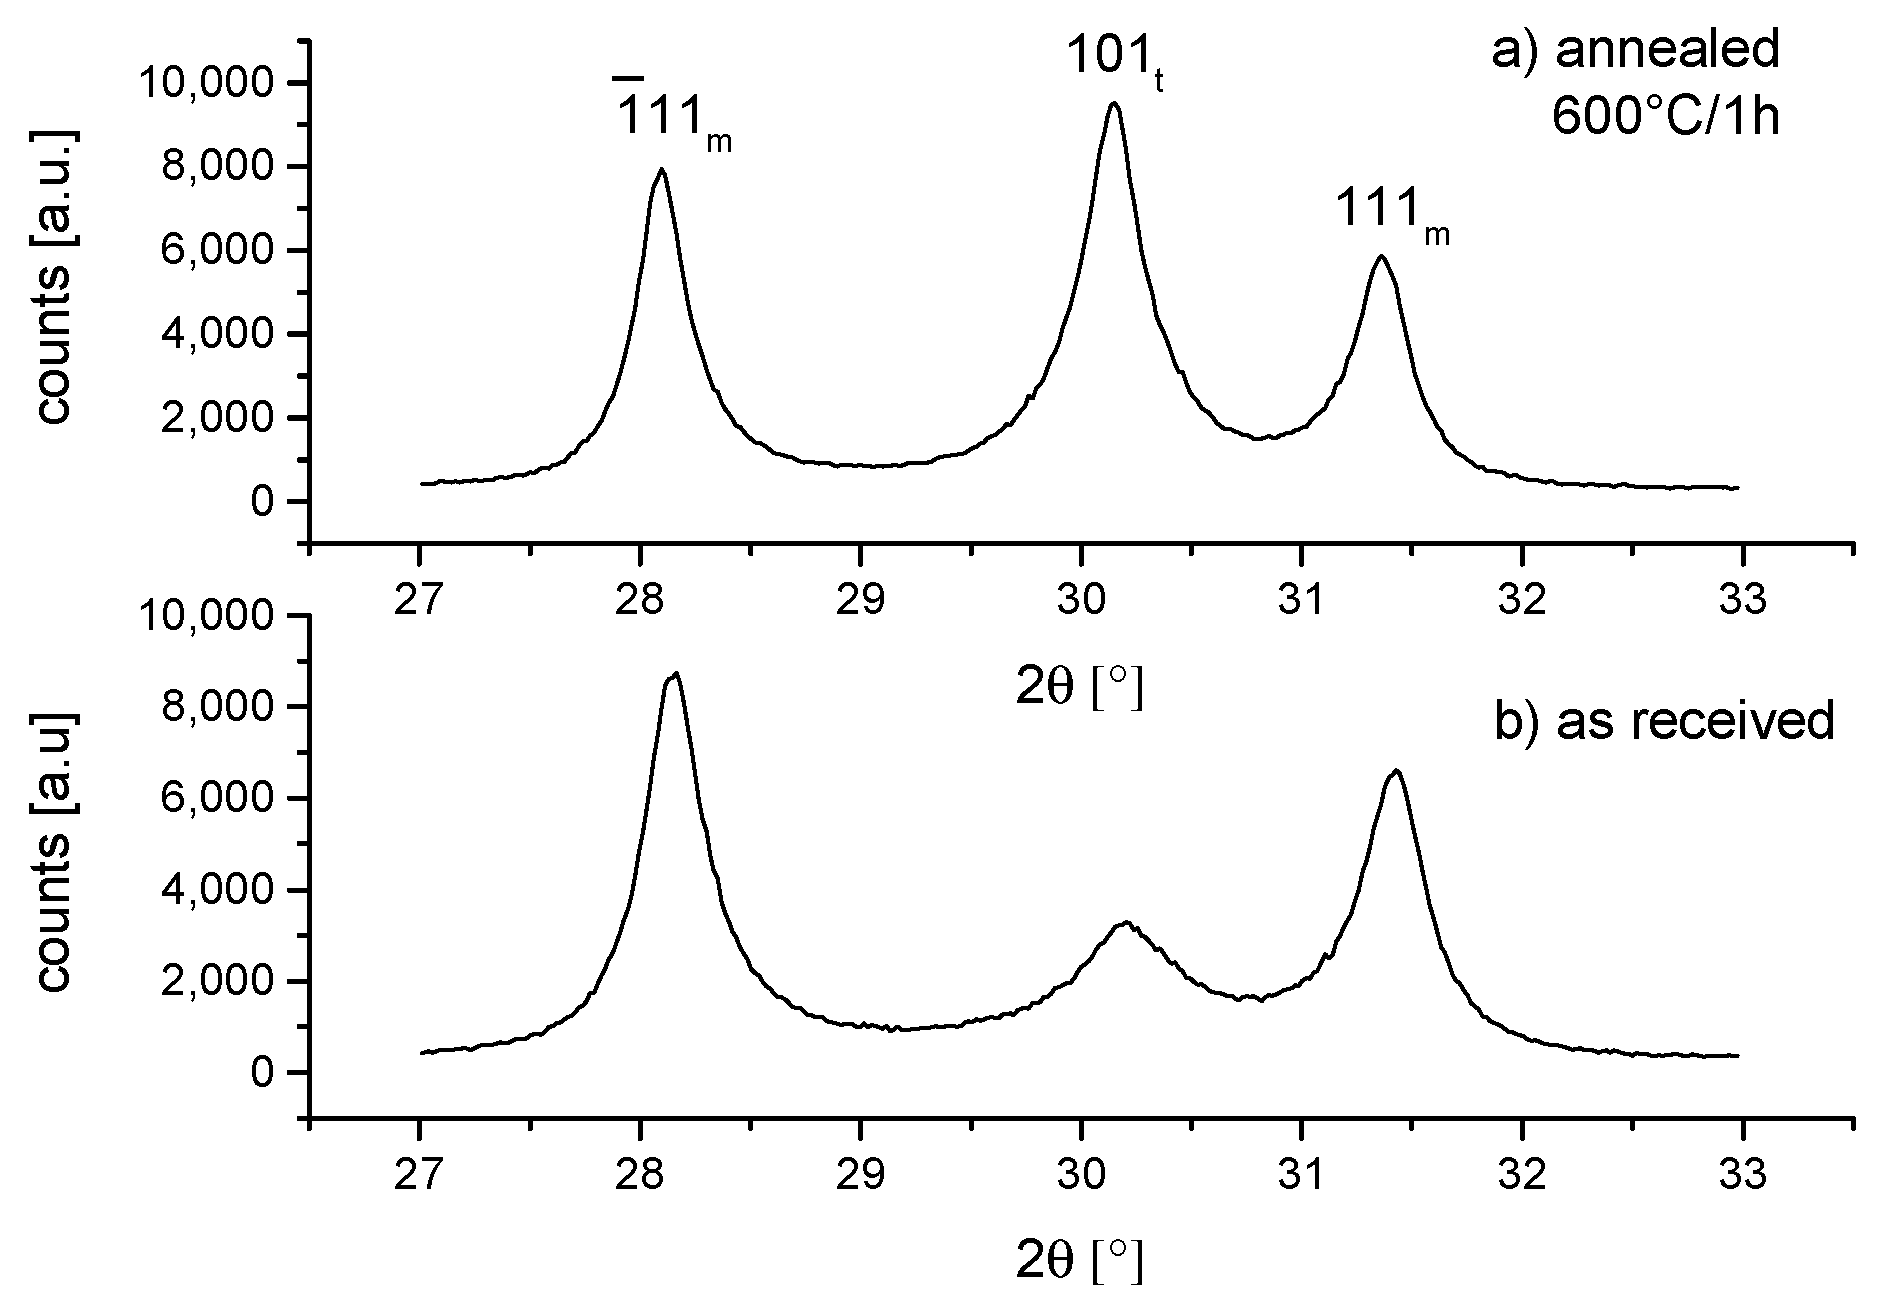
Figure 7 shows the XRD traces with the three characteristic peaks in the 27–33° 2Θ fingerprint range for starting powder in as received and annealed condition. The as-received powder consists of 80 vol.% monoclinic and 20 vol % tetragonal phase. By annealing treatment at 600 °C 40 vol.% tetragonal and 60 vol.% monoclinic are obtained.
Calculation of crystallite sizes from the measured peak widths leads to values of 10 nm for the tetragonal and 18 nm for the monoclinic. The annealing treatment leads to a slight coarsening with 17 nm for the tetragonal and 23 nm for the monoclinic phase.
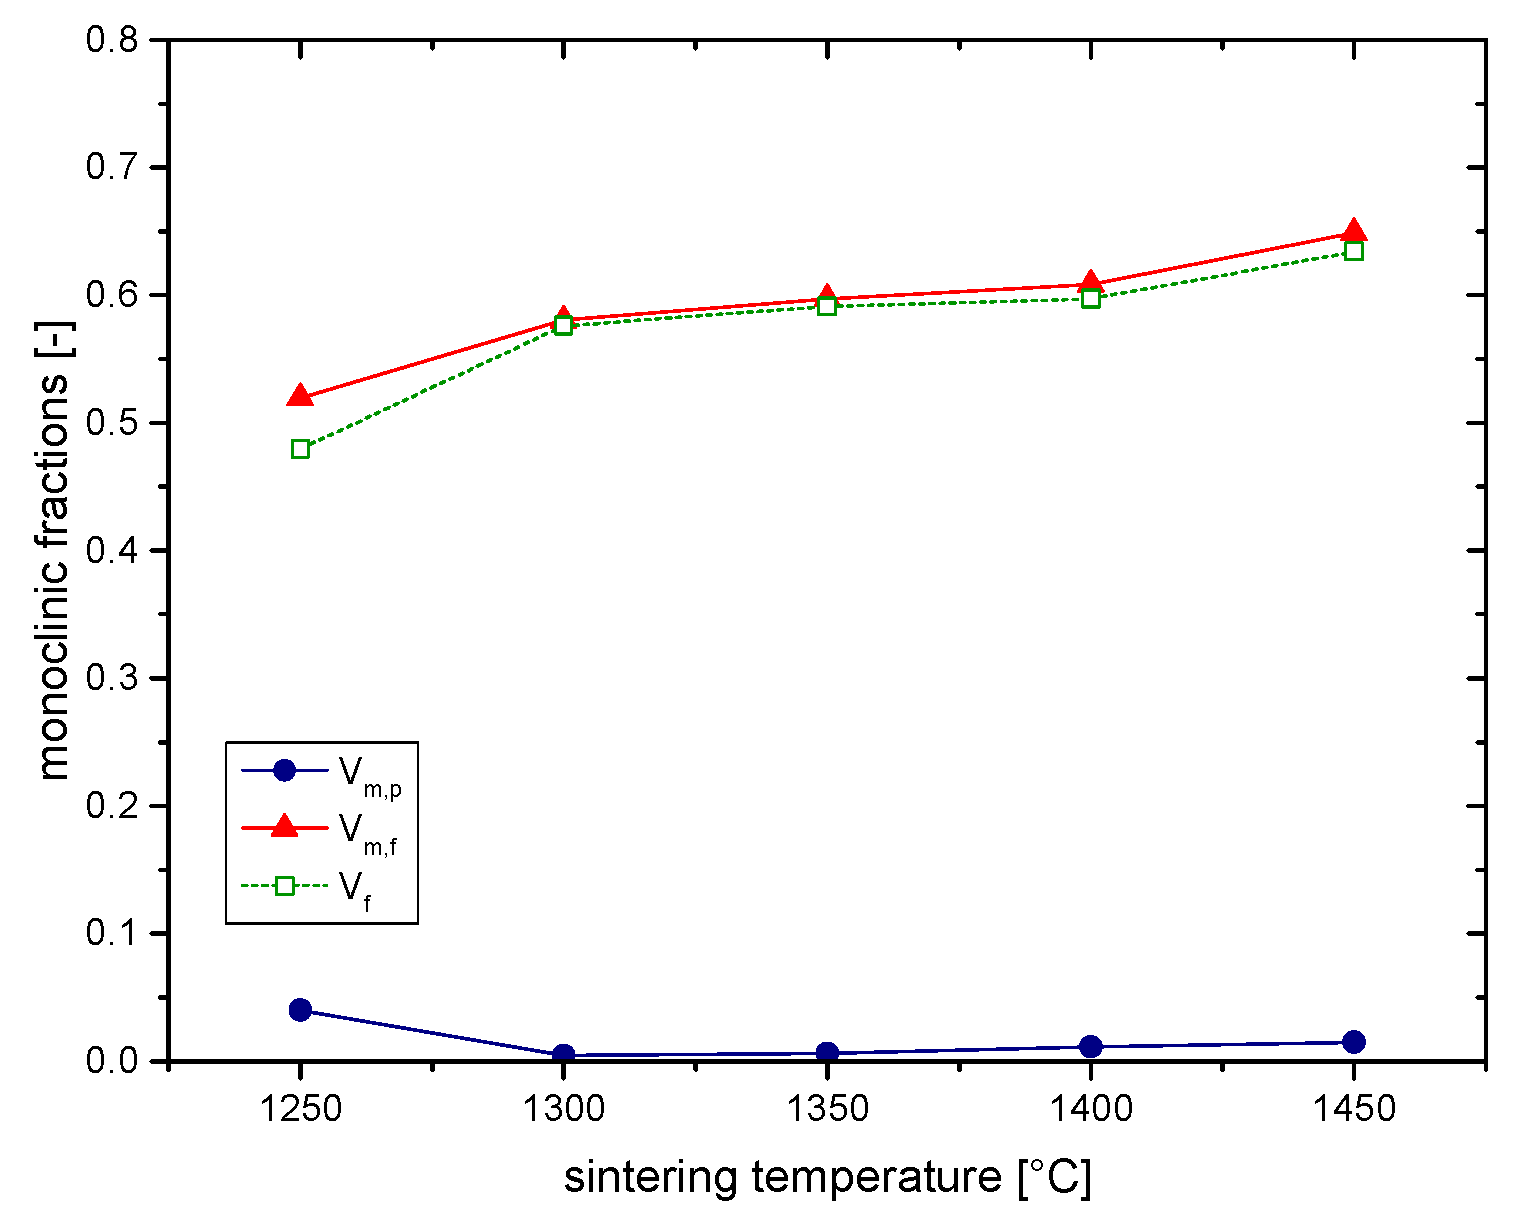
The results of the phase analysis of polished surfaces and ISB-test derived fracture surfaces is shown in Figure 8. Evidently, with exception of the material sintered at 1250 °C which has 4% monoclinic in as-fired state, the other materials are either entirely tetragonal or contain a monoclinic amount of ≈1% which is close to the detection limit. The fracture surfaces show steadily increasing amounts of monoclinic in the range of 52% (1250 °C) to a maximum of 65% (1450 °C).
The investigation of the 400 and 004 peaks in the 72–75°2Θ range shows no indication of cubic phase. The calculated tetragonality (c/a ratio) is in a narrow range between 1.0166–1.0168 in all cases. This value corresponds well to the expected value for a 2Y-TZP [39]. Another value that was monitored was the width of the tetragonal 004 and 101 peaks in polished samples. The crystallite sizes calculated from full width at half height were almost constant at 0.2 ± 0.02 µm for all sintering temperatures.
3.4. Transformation Zones
Figure 9 shows the transformation zone size h calculated according to Kosmac [29] and the corresponding transformation toughness increments ΔKICT calculated according to McMeeking and Evans using transformation efficiencies of X = 0.27 and X = 0.48 [30].
The transformation zone sizes determined by XRD are relatively moderate considering the high toughness. Assuming exclusively transformation toughness as a source of R-curve dependent toughness effects shows that only assumption of dilation and shear (X = 0.48) leads to similar values for ΔKICT and Kapp,0 (Figure 4).
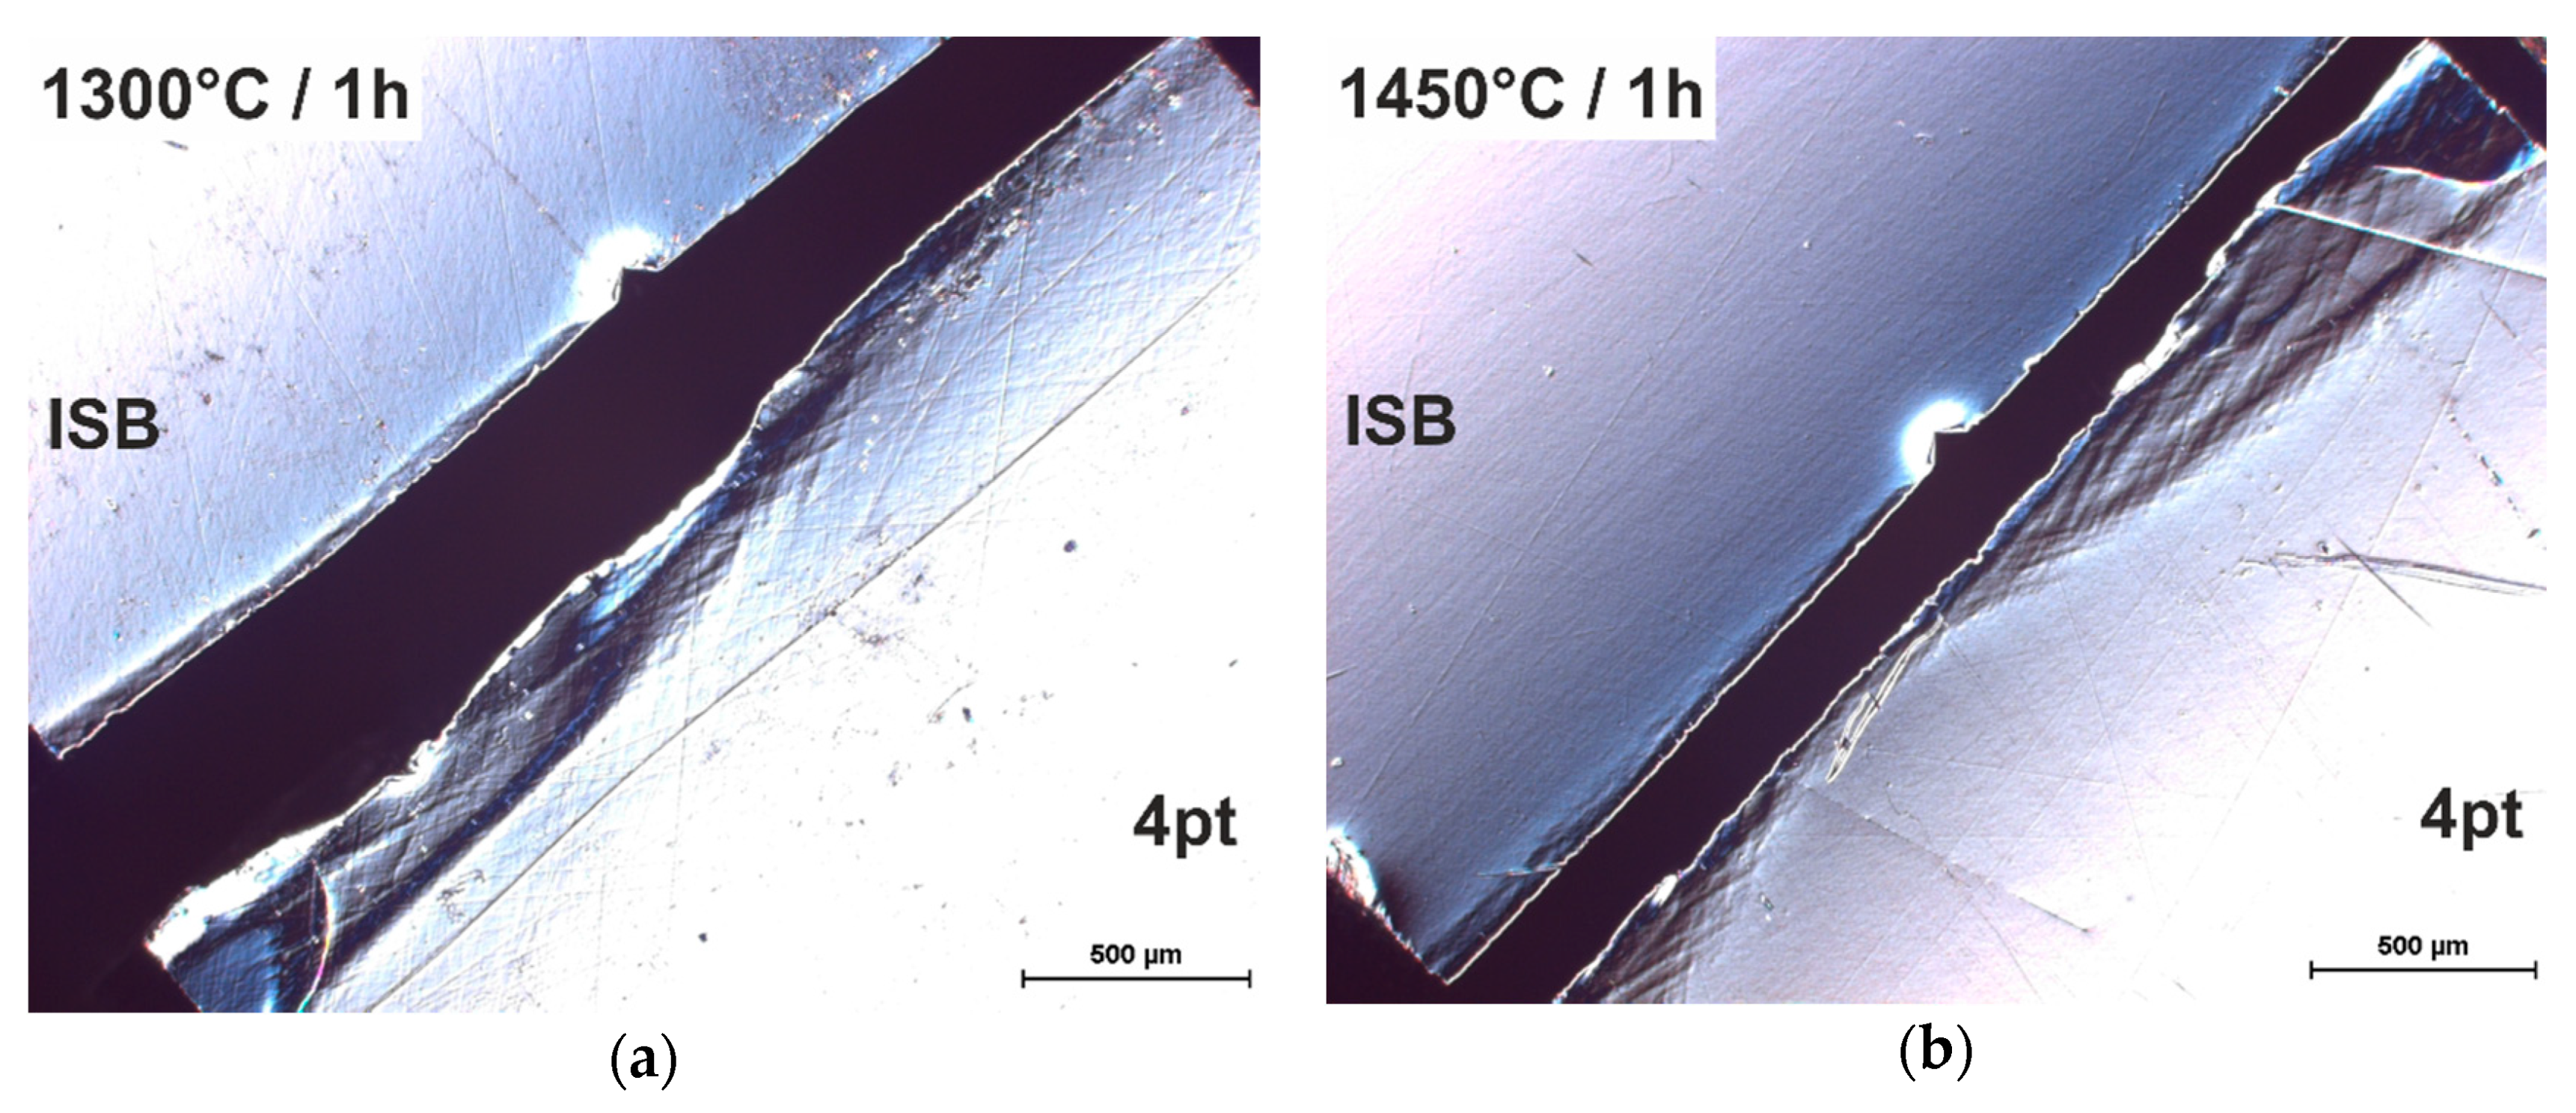
Figure 10a,b show transformation zones observed at the tensile surfaces of bending bars after fracture by four-point bending tests and ISB tests. The ISB sample can be seen on the upper left and the four-point bending test sample from the lower right side. Evidently, besides the split HV10 indentation, which together with its wing cracks acted as the starter notch a transformation zone close to the crack plane is visible. This zone is wider at the edges than close to the indent. The bending test samples show very pronounced transformation areas with shear bands and secondary cracks. These transformation zones are also more distinct at the edges than the middle. While the zone associated to the ISB fracture surface is approximately 50–100 µm wide the transformed zone after four-point bending test may as large as 400–500 µm. The transformation zones are more pronounced in materials sintered at high temperature.
4. Discussion
As shown in the previous chapter 2Y-TZP materials derived from detonation synthesis powder show a unique combination of strength and fracture resistance. Fracture resistance values are not as high as claimed by the powder producer (15 MPa√m). Still a combination of 1500 MPa strength and >10 MPa√m toughness is considerable and comes close or even exceeds the limits defined by Swain and Rose [40] based on compiled data (which were moreover mainly three-point bending strength and indentation toughness data [41]).
Putting the results from mechanical testing phase analysis and microstructure together leads to significant discrepancies between the toughness measured and the toughness expected from phase composition data. As shown above the threshold toughness of ≈4.5 MPa√m determined by SIGB is only slightly higher than for other Y-TZP materials made from coprecipitated powders [42]. Assuming only transformation toughness as a relevant process zone effect the high toughness can only be explained if an outstandingly high transformation efficiency is assumed. This is, however, unlikely and in contrast to existing literature [40]. Y-TZP materials from stabilizer coated powder may have much higher threshold toughness [43], indications for a stabilizer gradient which may be associated with the very off-equilibrium powder production process by detonation were not detected by XRD [15,16]. 400 and 004 tetragonal peaks were single peaks appearing at identical 2Θ values no matter which sintering temperature was applied.
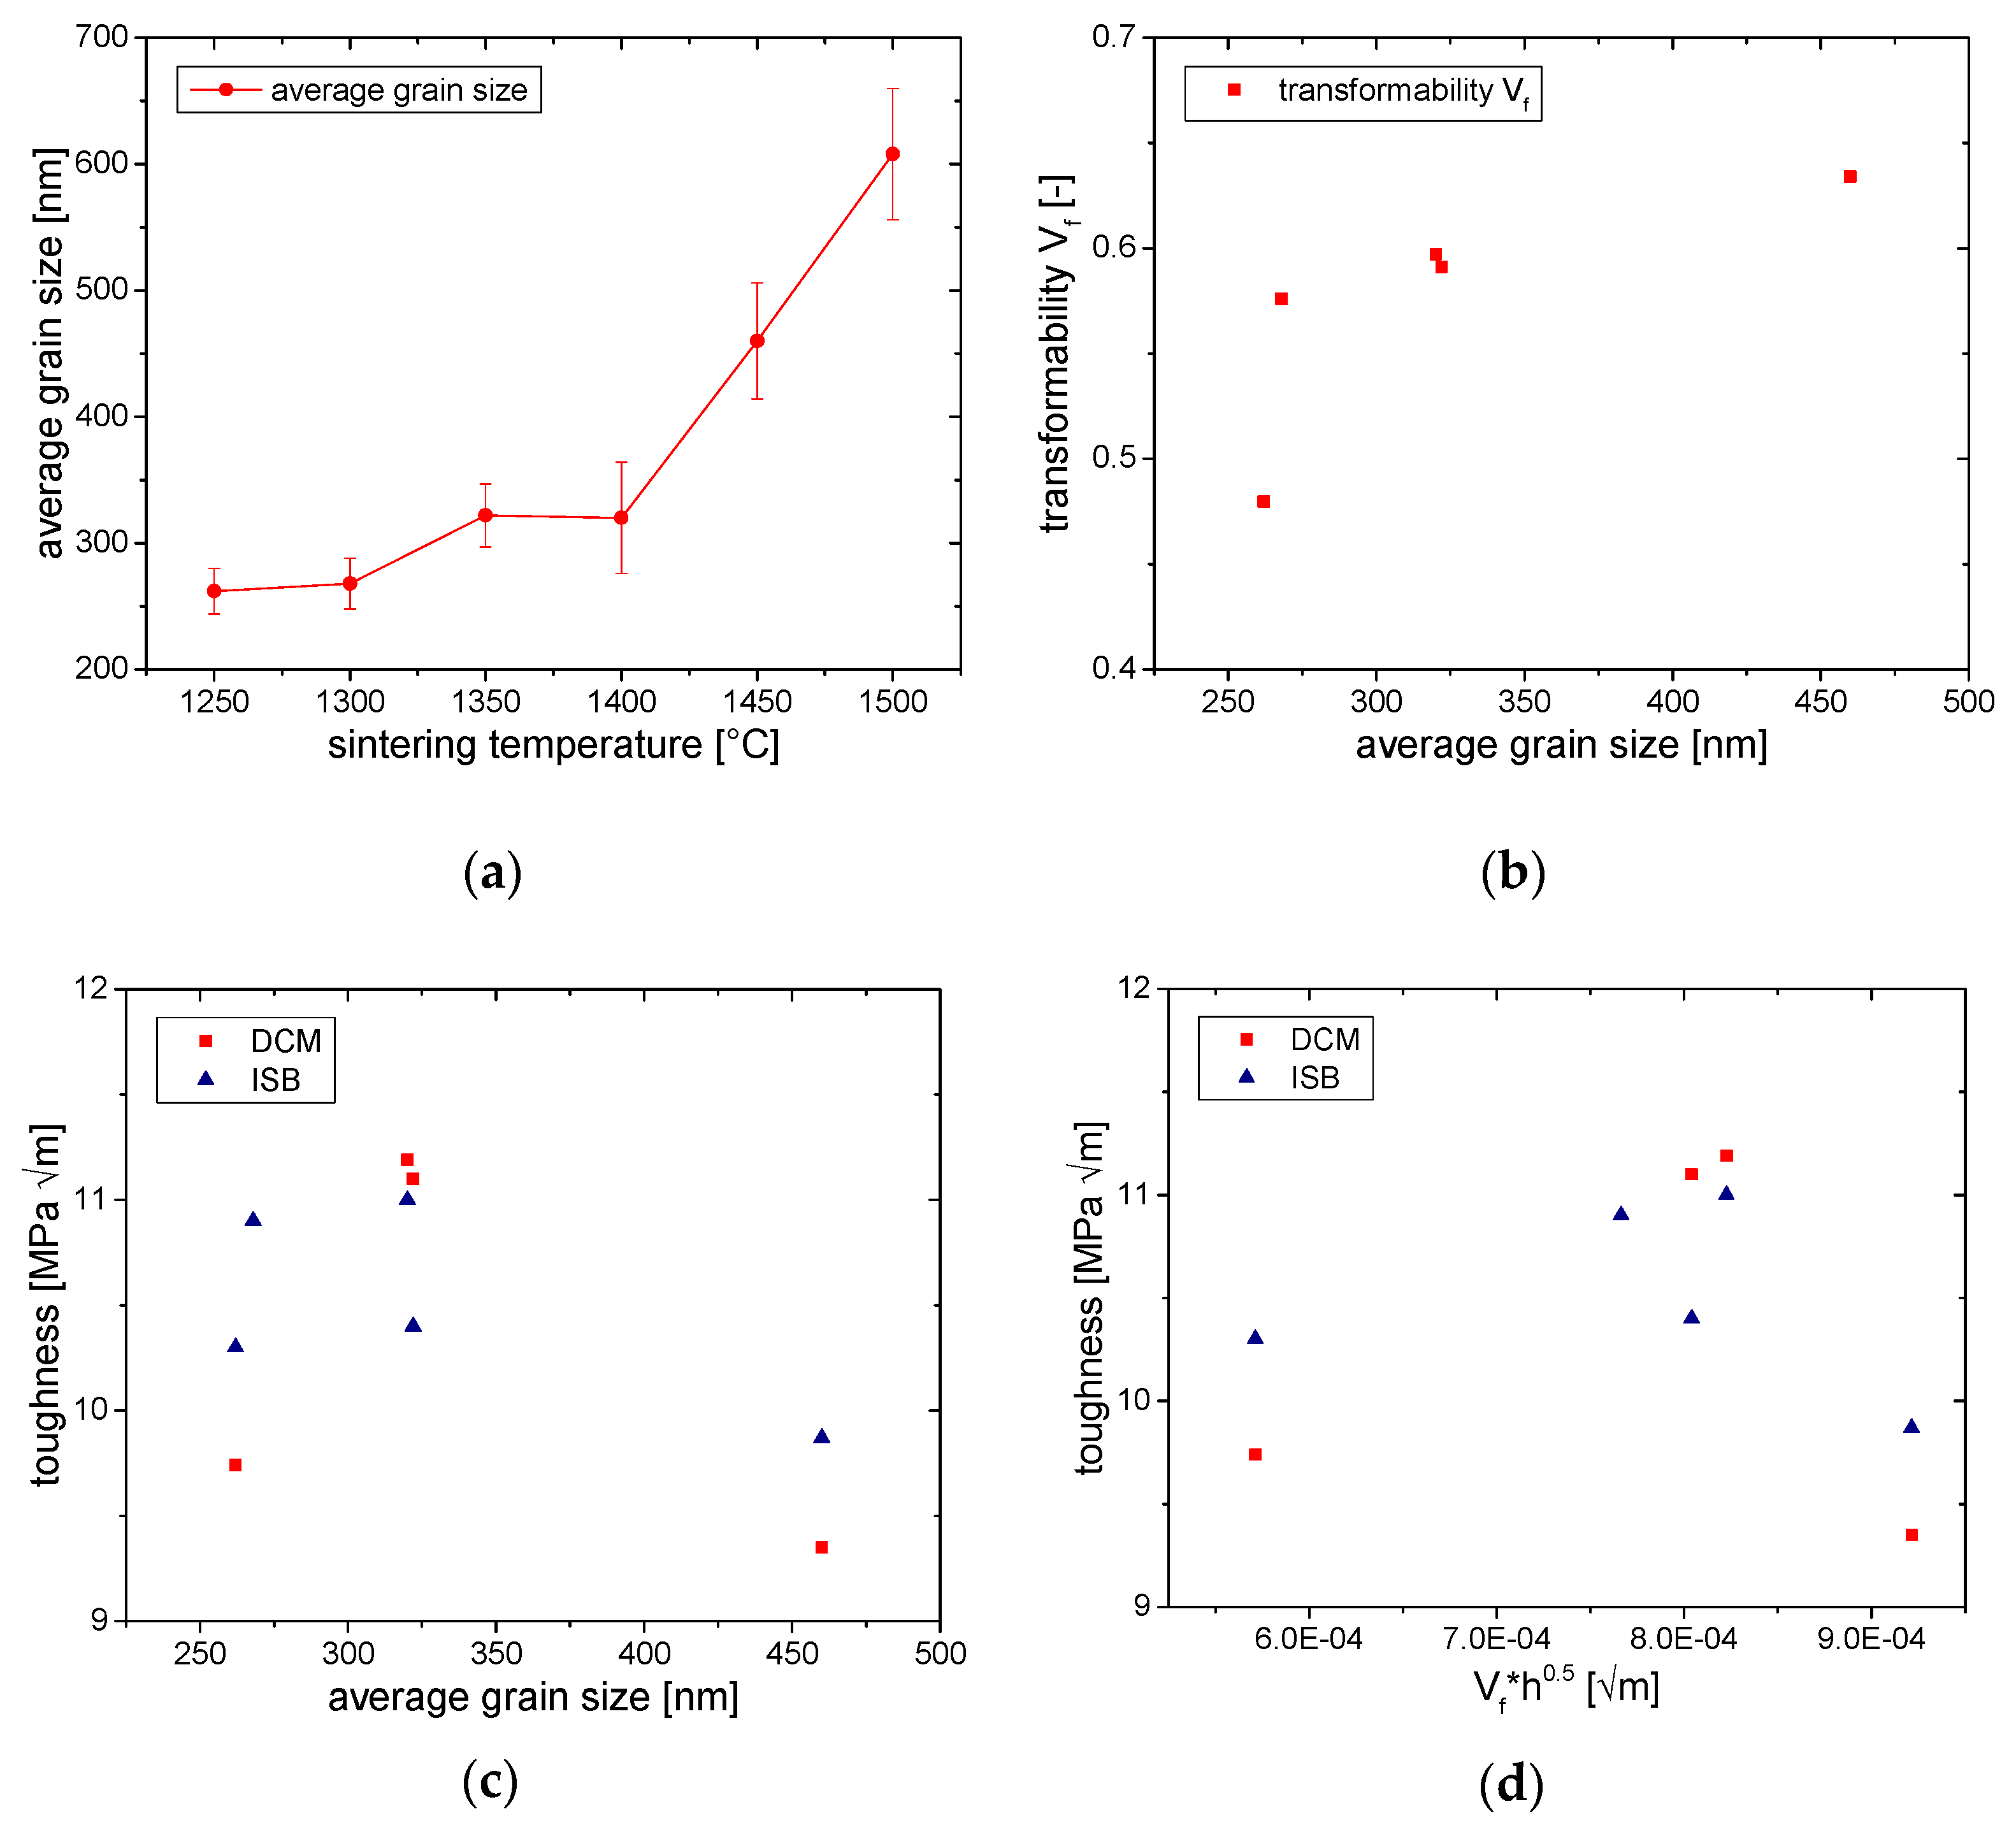
Another surprising correlation was the lack of a strict coupling of transformability and grain size. Figure 11a–d show the evolution of grain size with sintering temperature, the evolution of transformability and toughness with grain size and the correlation between toughness and the relevant parameters Vf∙√h in the McMeeking formula [30].
The observed grain sizes with changing sintering temperature are quite identical to the values determined by Lange [13], the material here completely retains the tetragonal phase up to grain sizes of 460 nm while Lange reports a monoclinic content exceeding 10 vol.% above a grain size of ≈230 nm. The 2Y-TZP in this study seems thus surprisingly stable. According to Swain, we would expect the maximum toughness in 2Y-TZP of ≈9 MPa√m at grain sizes above 1 µm and under formation of transformation zones with h = 8 µm [44]. For such materials the critical stress is 1300 MPa. In the present case, the transformation zone sizes determined by XRD at comparable toughness levels are considerably smaller and the critical stress is significantly higher. Transformability shows a steep increase between 1250–1300 °C sintering temperature. Then a linear dependency follows at higher sintering temperatures. Toughness, however, does not follow grain size, but forms an intermediate maximum. The same is true for the correlation of toughness vs. Vf∙√h which actually shows an adverse trend at higher grain sizes. Toughness values obtained by ISB tests at very high crosshead speed do show a direct correlation to transformability, at lower test speed a part of the toughening effect seems to be lost due to subcritical crack growth.
All these correlations raise some doubts about the correctness of the methodology chosen and/or if there is something special in the studied material that has yet to be discovered.
The images of the transformation zones observed close to the crack front on the tensile side of ISB and bending test bars show that the transformed region—at least at the tensile surface—is far larger than the observable maximum transformation zone size (≈10 µm). As Sergo has shown, these transformation bands are wedge shaped so that the thickness of the transformed region varies from the tensile surface into the bulk [45]. The XRD measurement measures an average value, however, transformed regions going deeper than 10 µm will be figured in with a capped value of 10 µm.
ISB bars showed a much more controlled fracture behavior due to the large defect introduced by indentation from which the crack propagates (the straight crack plane makes XRD measurements very convenient). The regular bending test samples fractured starting from some random defect of sufficient size. As in the case of ISB these samples either fail at lower stress exhibiting linear stress–strain behavior or they show transformation dominated failure at very high stress (>1500 MPa) with a nonlinear stress–strain behavior. In the latter case the transformation should occur prior to fracture. A closer look at the edges of fractured bending test bars also shows some secondary cracks oriented in ≈30° to the primary crack plane. These side cracks also have transformation zones which contribute to toughness (however less efficient) but cannot be measured by XRD. As the crack energy seems to be dissipated in a much larger volume than in the transformation zone adjacent to the primary crack it is not necessary to assume an overly high transformation efficiency. However, it seems that for materials with such extended transformation areas no convenient analytic method to calculate the transformation toughness increment based on XRD data is available.
Another point is the discrepancy between the measured grain sizes and the measured peak width which—at first sight—implies a constant domain size. The observed grain sizes in the microstructure, however, do not support this interpretation. Another reason for the broad peaks could be a certain variation of stabilizer distribution in the grains. In an earlier investigation, some indications were identified which would support this interpretation [21]. The powder producers mentioned that the powder is collected in the detonation reactor at different locations so that in fact a certain scattering in powder properties may be present which is not fully equilibrated during sintering. Basu found higher toughness in mixed 2Y-TZP (made from 3Y + 0Y) than in coprecipitated 2Y-TZP and attributed this to larger grain size, broader grain size distribution and broader variation of stabilizer content [11]. The as-received starting powder is predominantly monoclinic and seems very poorly crystallized. In as-received state the tetragonal phase is probably not stabilized by yttria content but rather by fine grain size [45]. Therefore, it seems that in the initial powder zirconia and yttria are not yet present as a solid solution. A very moderate annealing process at only 600 °C is capable of partially converting the monoclinic to tetragonal phase. Hence, it seems that the reaction conditions in the detonation process are sufficient to precipitate and mix yttria and zirconia very intimately—but probably not homogeneously. However, the conditions seem not to provide sufficient thermal energy to form a proper solid solution.
The fact that residual strength values determined at different testing speed are distinctly different can be explained. Static and cyclic fatigue tests by Chevalier [42] clearly show that the measurable toughness of 3Y-TZP strongly depends on crack velocity. Faster crack growth comes along with suppression of subcritical crack growth induced by hydrolysis of bonds at the crack tip, measurements in air typically show three stages. It is very likely that the doubling of the testing speed shifted the position in the V–KI curve.
5. Conclusions
The combination of high toughness and strength in 2Y-TZP manufactured from detonation synthesized powder was confirmed. The material exhibits a slightly enhanced threshold toughness of 4–4.5 MPa√m compared to ‘regular’ coprecipitated material (3.5 MPa√m). The critical transformation stress of the material amounts to approximately 1500 MPa, above this stress the material tends to transform as indicated by non-linearity of the stress–strain curves and formation of visible transformation zones on the tensile side of bending bars. The transformation related stress intensity increment is high (≈6 MPa√m) and cannot be sufficiently explained by assuming a transformed layer of height h as can be determined by XRD. Evidently, the material is very strong due to the fine grain size and very high stress is required to trigger the full-fledged transformation. Then the energy is dissipated over a larger volume which may explain the high toughness without taking the influence of shear into account.
The reason for the enhanced toughness of this special material compared to coprecipitated 2Y-TZP (which requires much higher sintering temperature and grain sizes than the detonation synthesized TZP to reach the same toughness level) is yet not completely understood. The powder is produced under extreme non-equilibrium conditions, it is very fine and predominantly monoclinic. Partial incorporation of yttria into the lattice resulting in formation of more tetragonal phase is, however, already triggered under relatively moderate annealing conditions. It can be assumed that there is a certain inhomogeneity of yttria distribution and/or crystalline disorder. This argument is supported by the broad XRD peaks indicating domain sizes which are in contrast to grain sizes determined by SEM. Crystalline disorder of smaller domains may also be the reason for the high stress required to trigger the transformation. Once the transformation is triggered, large transformation zones typically known from Ce-TZP are formed. Deeper insight into the diffusion and ordering processes during sintering could be delivered by detailed TEM studies of materials sintered at different temperatures.
Author Contributions
Conceptualization and methodology, F.K.; Sample manufacturing and mechanical testing, F.K.; X-ray measurements, A.G.; Writing—F.K. and A.G.; visualization, A.G. All authors have read and agreed to the published version of the manuscript.
Funding
This research received no external funding.
Acknowledgments
The author would like to thank Innovnano, Portugal for providing a large sample of detonation synthesized 2Y-TZP powder and F.P. at MPI-FKF Stuttgart for SEM images.
Conflicts of Interest
The authors declare no conflict of interest.
References
- Hannink, R.H.J.; Kelly, P.M.; Muddle, B.C. Transformation Toughening in Zirconia-Containing Ceramics. J. Am. Ceram. Soc. 2000, 83, 461–487. [Google Scholar] [CrossRef]
- Chevalier, J.; Gremillard, L. Ceramics for medical applications: A picture for the next 20 years. J. Eur. Ceram. Soc. 2009, 29, 1245–1255. [Google Scholar] [CrossRef]
- Rahaman, M.N.; Yao, A.; Bal, B.S.; Garino, J.P.; Ries, M.D. Ceramics for Prosthetic Hip and Knee Joint Replacement. J Am. Ceram. Soc. 2007, 90, 1965–1988. [Google Scholar] [CrossRef]
- Sun, C.; Hui, R.; Roller, J. Cathode materials for solid oxide fuel cells: A review. J Solid State Electrochem. 2010, 14, 1125–1144. [Google Scholar] [CrossRef]
- Cao, X.Q.; Vassen, R.; Stoever, D. Ceramic materials for thermal barrier coatings. J. Eur. Ceram. Soc. 2004, 24, 1–10. [Google Scholar] [CrossRef]
- Kelly, P.M.; Rose, L.R.F. The martensitic transformation in ceramics—Its role in transformation toughening. Prog. Mater. Sci. 2002, 47, 463–557. [Google Scholar] [CrossRef]
- Kim, J.H.; Hwang, K.H.; Lee, J.K. Effect of calcination temperature on the properties of Y-TZP powders prepared by co-precipitation. J. Nanosci. Nanotechnol. 2017, 17, 4368–4371. [Google Scholar] [CrossRef]
- Chen, M.; Hallstedt, B.; Gauckler, L.J. Thermodynamic modeling of the ZrO2–YO1.5 system. Solid State Ion. 2004, 170, 255–274. [Google Scholar] [CrossRef]
- Matsui, K.; Horikoshi, H.; Ohmichi, N.; Ohgai, M.; Yoshida, H.; Ikuhara, Y. Cubic-Formation and Grain-Growth Mechanisms in Tetragonal Zirconia Polycrystal. J. Am. Ceram. Soc. 2003, 86, 1401–1408. [Google Scholar] [CrossRef]
- Swain, M.V. Grain-size dependence of toughness and transformability of 2mol % Y-TZP ceramics. J. Mater. Sci. Lett. 1986, 5, 1159–1162. [Google Scholar] [CrossRef]
- Basu, B.; Vleugels, J.; van der Biest, O. Toughness tailoring of yttria-doped zirconia ceramics. Mater. Sci. Eng. A 2004, 380, 215–221. [Google Scholar] [CrossRef]
- Binner, J.; Vaidhyanathan, B.; Paul, A.; Annaporani, K.; Raghupathy, B. Compositional Effects in Nanostructured Yttria Partially Stabilized Zirconia. Int. J. Appl. Ceram. Technol. 2011, 8, 766–782. [Google Scholar] [CrossRef] [Green Version]
- Lange, F.F. Transformation toughening: Part 3 Experimental observations in the ZrO2- Y203 system. J. Mater. Sci. 1982, 17, 240–246. [Google Scholar] [CrossRef]
- Singh, R.; Gill, C.; Lawson, S.; Dransfield, G.P. Sintering, microstructure and mechanical properties of commercial Y-TZPs. J. Mater. Sci. 1996, 31, 6055–6062. [Google Scholar] [CrossRef]
- Kern, F.; Strumberger, H.; Gadow, R. Effects of Stabilizer Content and Sintering Conditions on Y-TZP Ceramics made from Stabilizer-Coated Nanopowders. J. Ceram. Sci. Technol. 2017, 8, 7–18. [Google Scholar] [CrossRef]
- Kern, F. Evidence of Phase Transitions and Their Role in the Transient Behavior of Mechanical Properties and Low Temperature Degradation of 3Y-TZP Made from Stabilizer-Coated Powder. Ceram. 2019, 2, 271–285. [Google Scholar] [CrossRef] [Green Version]
- Bondioli, F.; Leonelli, C.; Manfredini, T.; Ferrari, A.M.; Caracoche, M.C.; Rivas, P.C.; Rodriguez, A.M. Microwave-Hydrothermal Synthesis and Hyperfine Characterization of Praseodymium-Doped Nanometric Zirconia Powders. J Am. Ceram. Soc. 2005, 88, 633–638. [Google Scholar] [CrossRef]
- Piticescu, R.R.; Monty, C.; Taloi, D.; Motoc, A.; Axinte, S. Hydrothermal synthesis of zirconia nanomaterials. J. Eur. Ceram. Soc. 2001, 21, 2057–2060. [Google Scholar] [CrossRef]
- Calado, J. Ceramic Powder Production with Emulsion Detonation Synthesis. CFI/Ber. DKG 2016, 93, E32–E34. [Google Scholar]
- Da Silva, J.M.C.; Antunes, E.M.D.S. Nanocrystalline Spherical Ceramic Oxides, Process for the Synthesis and Use Thereof. U.S. Patent 9,249,020, 2 February 2016. [Google Scholar]
- Kern, F.; Lindner, V.; Gadow, R. Low-Temperature Degradation Behaviour and Mechanical Properties of a 3Y-TZP Manufactured from Detonation-Synthesized Powder. J. Ceram. Sci. Technol. 2016, 07, 313–322. [Google Scholar] [CrossRef]
- Kern, F.; Reveron, H.; Chevalier, J.; Gadow, R. Mechanical behaviour of extremely tough TZP bioceramics. J. Mech. Behav. Biomed. Mater. 2019, 90, 395–403. [Google Scholar] [CrossRef]
- Niihara, K.; Morena, R.; Hasselman, D.P.H. Evaluation of KIc of brittle solids by the indentation method with low crack-to-indent ratios. J. Mater. Sci. Lett. 1982, 1, 13–16. [Google Scholar] [CrossRef]
- Chantikul, P.; Anstis, G.R.; Lawn, B.R.; Marshall, D.B. A Critical Evaluation of Indentation Techniques for Measuring Fracture Toughness: II, Strength Method. J. Am. Ceram. Soc. 1981, 64, 539–543. [Google Scholar] [CrossRef]
- Dransmann, G.W.; Steinbrech, R.W.; Pajares, A.; Guiberteau, F.; Dominguez-Rodriguez, A.; Heuer, A.H. Indentation Studies on Y2O3-Stabilized ZrO2: II, Toughness Determination from Stable Growth of Indentation-Induced Cracks. J Am. Ceram. Soc. 1994, 77, 1194–1201. [Google Scholar] [CrossRef]
- Newman, J.C.; Raju, I.S. Analyses of Surface Cracks in Finite Plates Unter Tension or Bending Loads. Nasa Tech. Pap. 1979, 1578, 1–43. [Google Scholar]
- Toraya, H.; Yoshimura, M.; Somiya, S. Calibration Curve for Quantitative Analysis of the Monoclinic-Tetragonal ZrO2 System by X-Ray Diffraction. J. Am. Ceram. Soc. 1984, 67, C119–C121. [Google Scholar] [CrossRef]
- Nakayama, S.; Maekawa, S.; Sato, T.; Masuda, Y.; Imai, S.; Sakamoto, M. Mechanical properties of ytterbia stabilized zirconia ceramics (Yb-TZP) fabricated from powders prepared by co-precipitation method. Ceram. Int. 2000, 26, 207–211. [Google Scholar] [CrossRef]
- Kosmać, T.; Wagner, R.; Claussen, N. X-Ray Determination of Transformation Depths in Ceramics Containing Tetragonal ZrO2. J. Am. Ceram. Soc. 1981, 64, C-72–C-73. [Google Scholar] [CrossRef]
- McMeeking, R.M.; Evans, A.G. Mechanics of Transformation-Toughening in Brittle Materials. J. Am. Ceram. Soc. 1982, 65, 242–246. [Google Scholar] [CrossRef]
- Patterson, A.L. The Scherrer Formula for X-Ray Particle Size Determination. Phys. Rev. 1939, 56, 978–982. [Google Scholar] [CrossRef]
- Mendelson, M.I. Average Grain Size in Polycrystalline Ceramics. J. Am. Ceram. Soc. 1969, 52, 443–446. [Google Scholar] [CrossRef]
- DIN. Dentistry—Ceramic Materials; The National Standards Authority of Ireland (NSAI): Dublin, Ireland, 2015. [Google Scholar]
- Quinn, G.D.; Bradt, R.C. On the Vickers Indentation Fracture Toughness Test. J. Am. Ceram. Soc. 2007, 90, 673–680. [Google Scholar] [CrossRef]
- Cook, R.F.; Braun, L.M.; Cannon, W.R. Trapped cracks at indentations: Part I: Experiments on yttria-tetragonal zirconia polycrystals. J. Mater. Sci. 1994, 29, 2133–2142. [Google Scholar] [CrossRef]
- Cook, R.F.; Braun, L.M. Trapped cracks at indentations: Part II: Fracture mechanics model. J. Mater. Sci. 1994, 29, 2192–2204. [Google Scholar] [CrossRef]
- Chevalier, J.; Saadaoui, M.; Olagnon, C.; Fantozzi, G. Double-torsion testing a 3Y-TZP ceramic. Ceram. Int. 1996, 22, 171–177. [Google Scholar] [CrossRef]
- Lube, T.; Fett, T. A threshold stress intensity factor at the onset of stable crack extension of Knoop indentation cracks. Eng. Fract. Mech. 2004, 71, 2263–2269. [Google Scholar] [CrossRef]
- Scott, H.G. Phase relationships in the zirconia-yttria system. J. Mater. Sci. 1975, 10, 1527–1535. [Google Scholar] [CrossRef]
- Swain, M.V.; Rose, L.R.F. Strength Limitations of Transformation-Toughened Zirconia Alloys. J. Am. Ceram. Soc. 1986, 69, 511–518. [Google Scholar] [CrossRef]
- Tsukuma, K. Thermal and Mechanical Properties of Y2O3-Stabilized Tetragonal Zirconia Polycrystals, Science and Technology of Zirconia II. Adv. Ceram. 1984, 12, 382–390. [Google Scholar]
- Chevalier, J.; Olagnon, C.; Fantozzi, G.; Cales, B. Subcritical Crack Growth and Thresholds in a 3Y-TZP Ceramic Under Static and Cyclic Loading Conditions. Ceram. Int. 1997, 23, 263–266. [Google Scholar] [CrossRef]
- Kern, F. 2.5Y-TZP from Yttria-Coated Pyrogenic Zirconia Nanopowder. J. Ceram. Sci. Technol. 2010, 01, 21–26. [Google Scholar] [CrossRef]
- Swain, M.V. Limitation of Maximum Strength of Zirconia-Toughened Ceramics by Transformation Toughening Increment. J. Am. Ceram. Soc. 1985, 68, C-97–C-99. [Google Scholar] [CrossRef]
- Sergo, V.; Clarke, D.R.; Pompe, W. Deformation Bands in Ceria-Stabilized Tetragonal Zirconia/Alumina: I, Measurement of Internal Stresses. J. Am. Ceram. Soc. 1995, 78, 633–640. [Google Scholar] [CrossRef]
Figure 1.
Bending strength σ4pt and hardness HV10 of 2Y-TZP depending on sintering temperature.
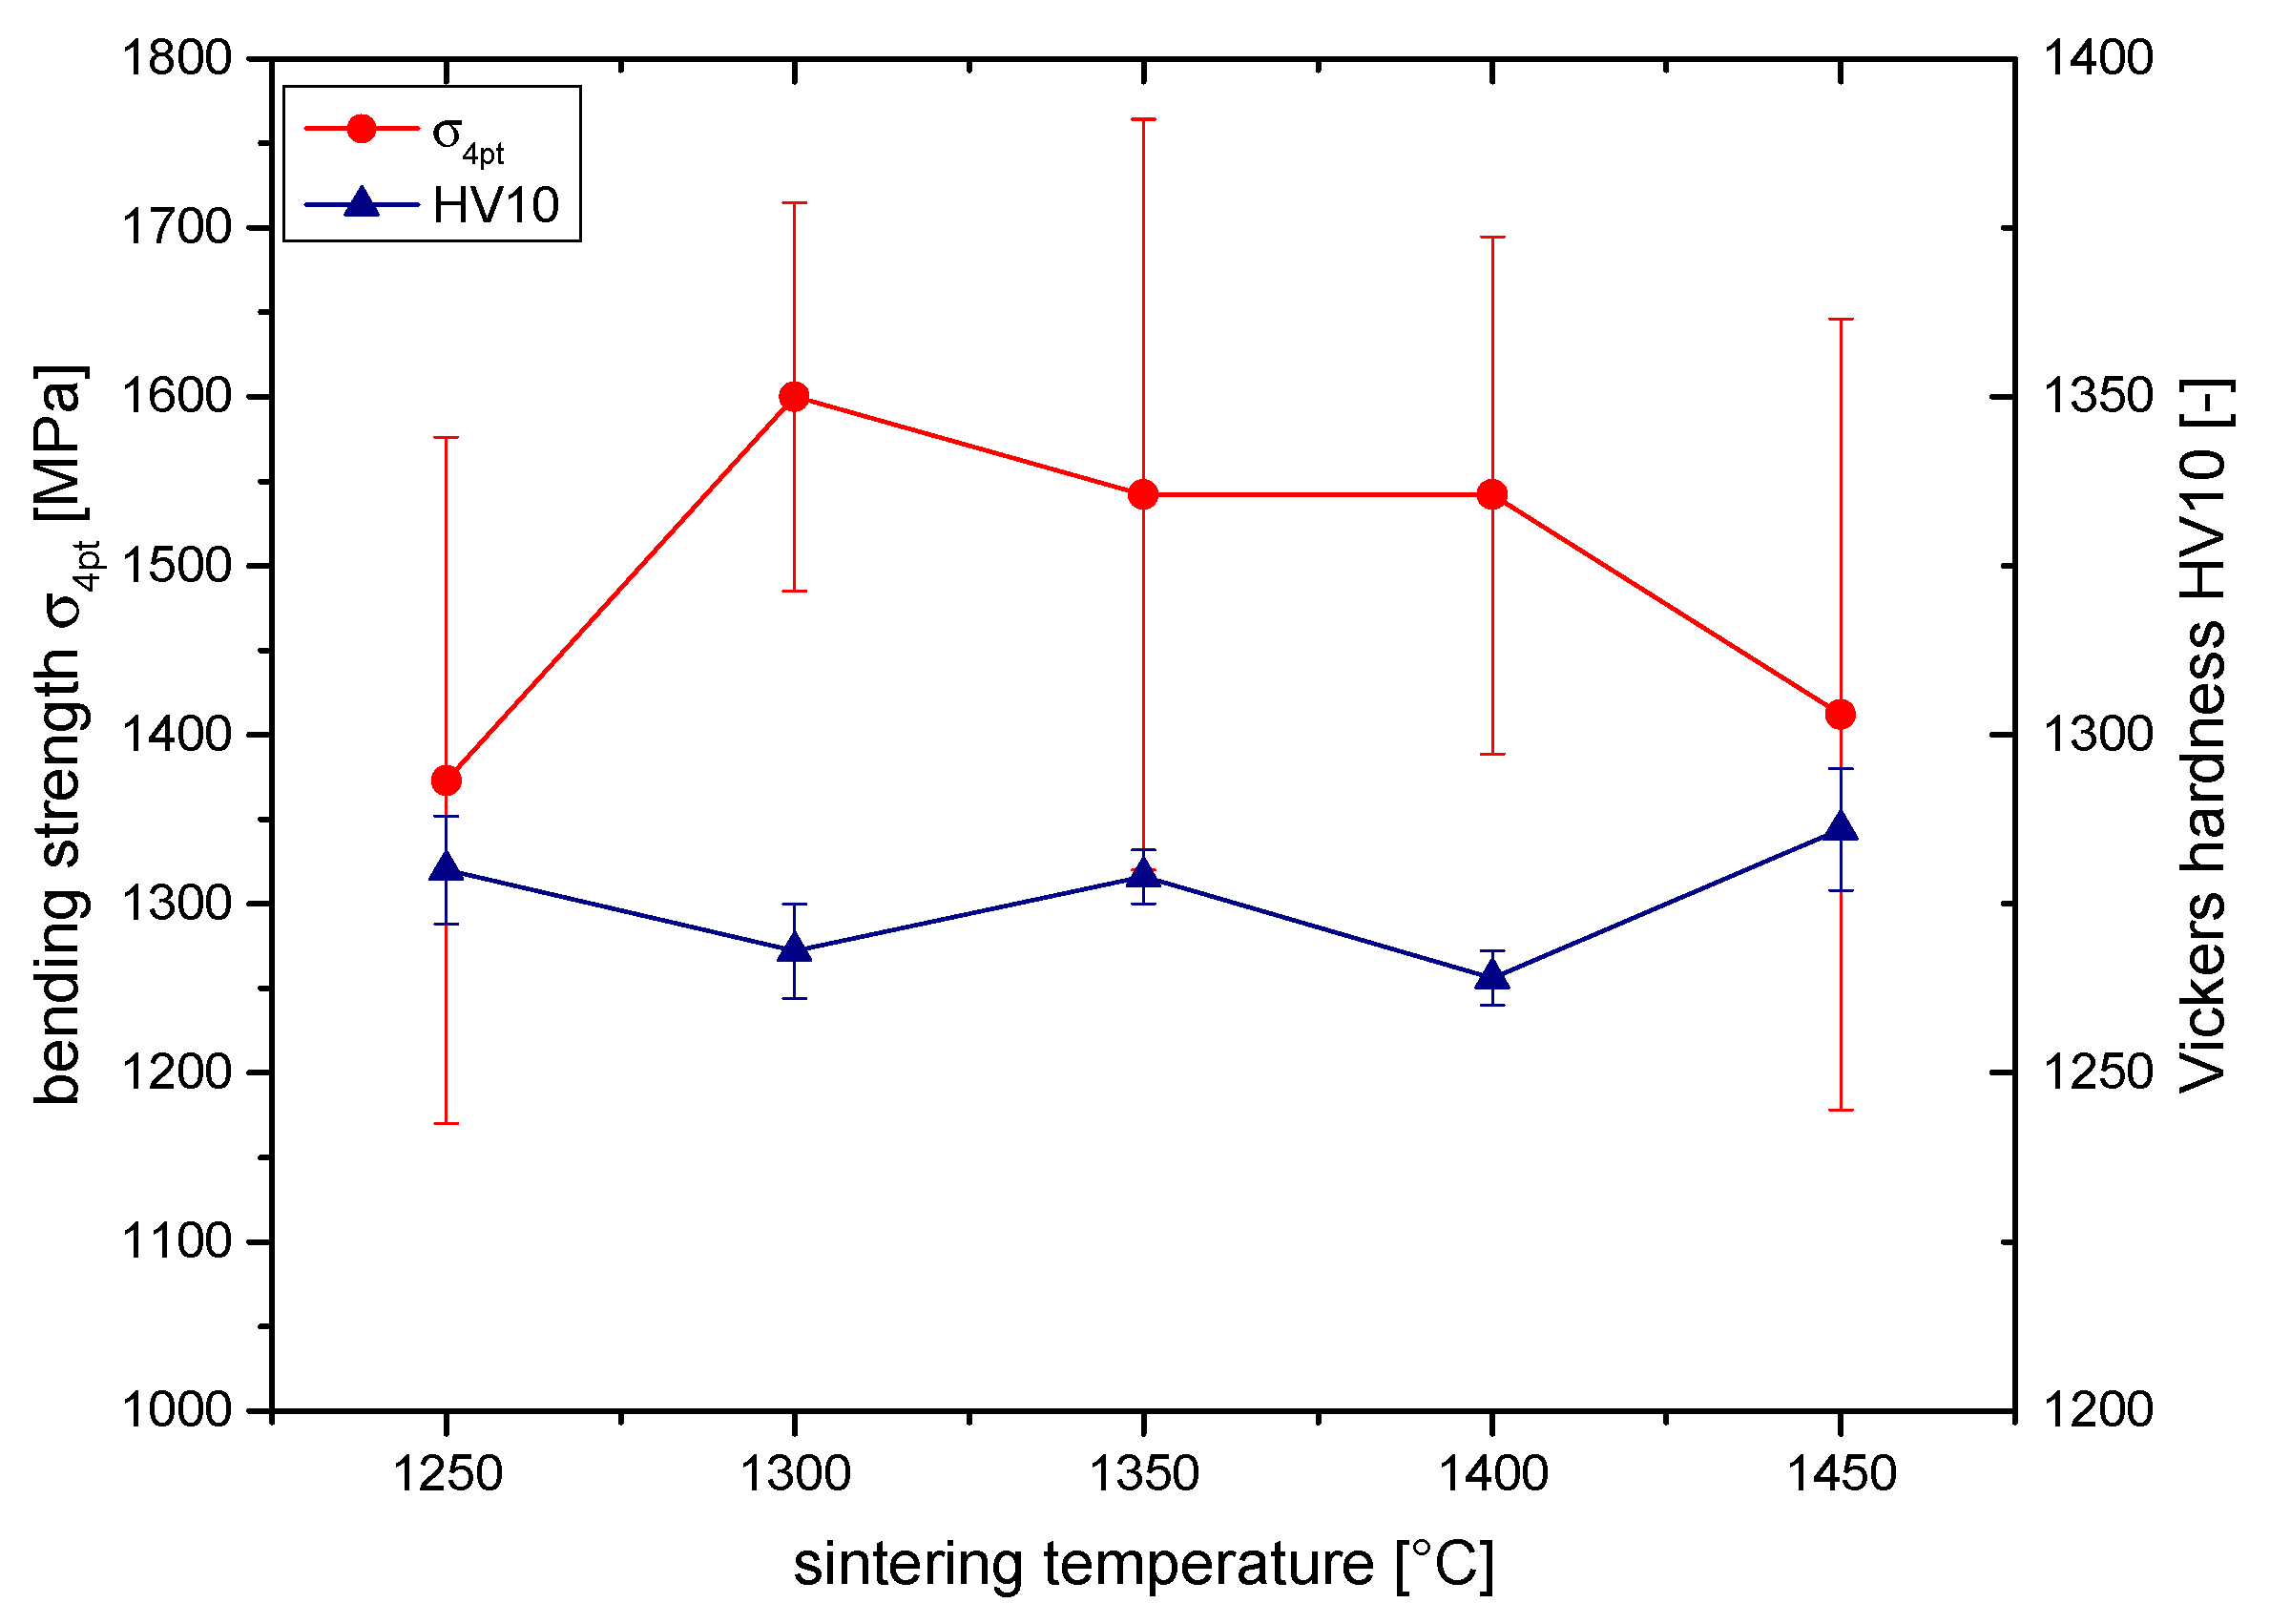
Figure 2.
Fracture resistance values KDCM and KISB of 2Y-TZP depending on sintering temperature.

Figure 3.
HV10 Vickers hardness indents with crack profile and uplifted zones of 2Y-TZP sintered at (a) 1250 °C, (b) 1350 °C, and (c) 1450 °C.
Figure 3.
HV10 Vickers hardness indents with crack profile and uplifted zones of 2Y-TZP sintered at (a) 1250 °C, (b) 1350 °C, and (c) 1450 °C.
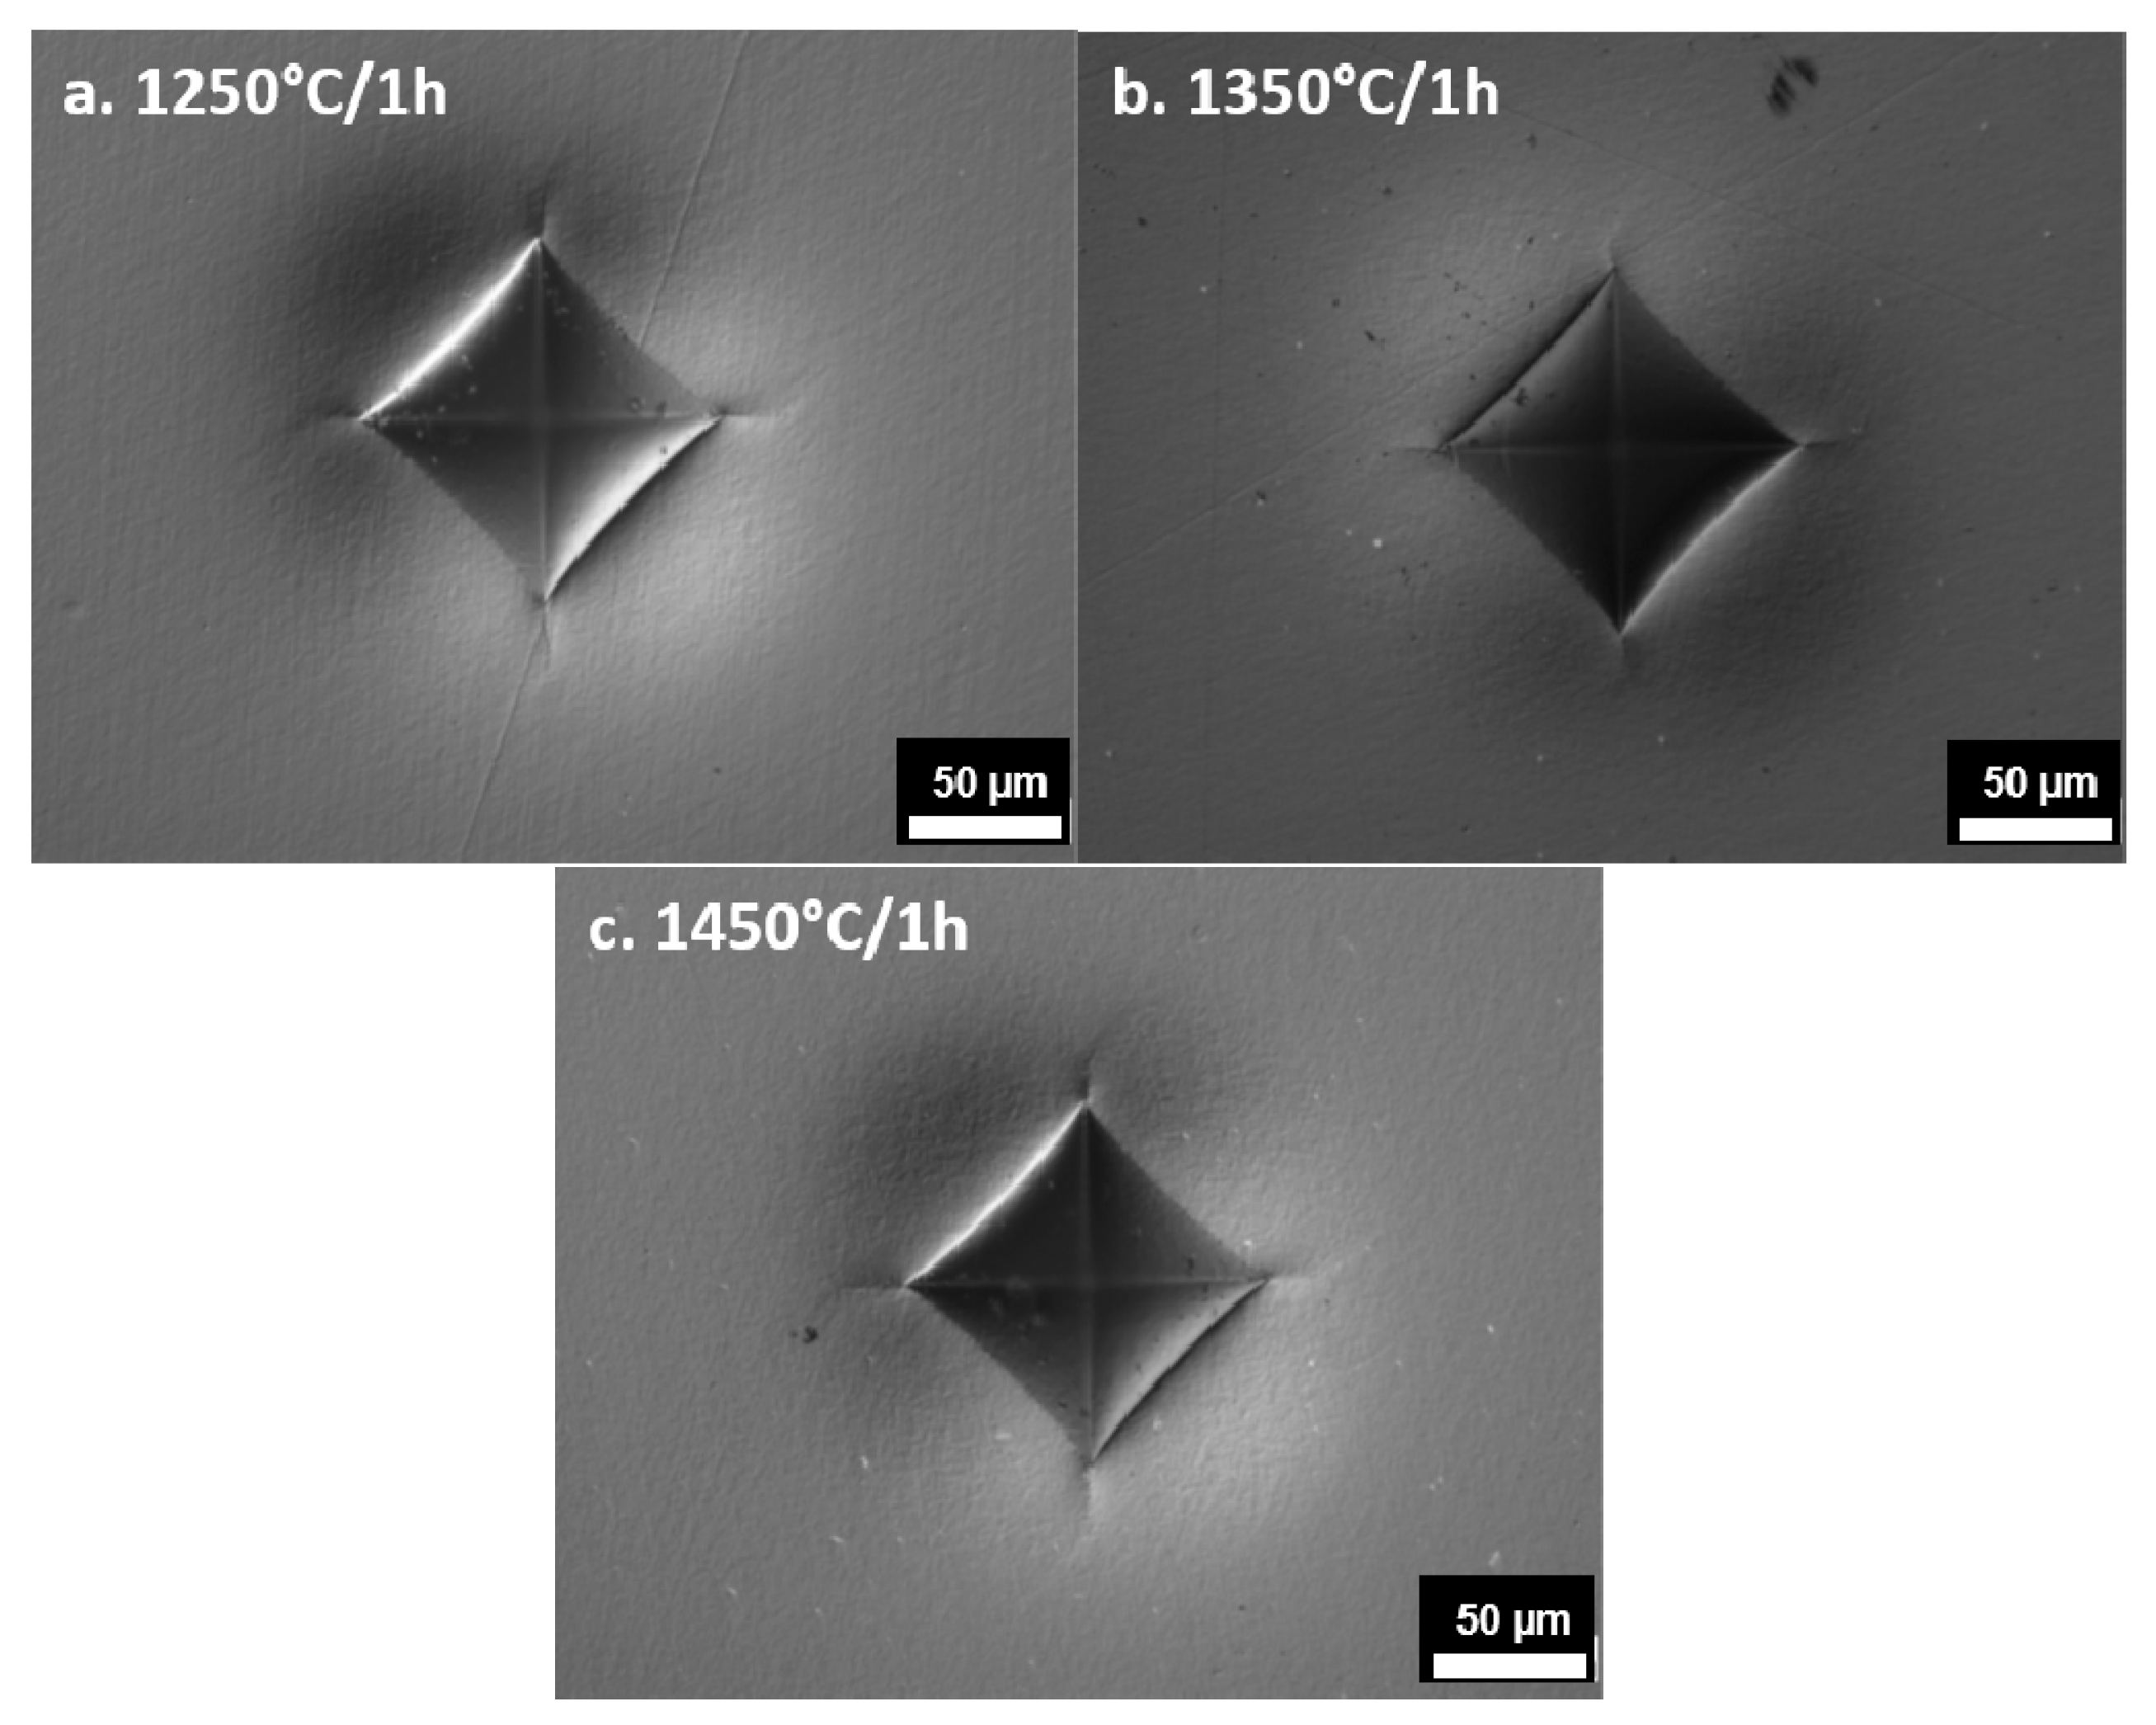
Figure 4.
Stress intensity values Kapp,0 and KI0 of 2Y-TZP determined by SIGB test.
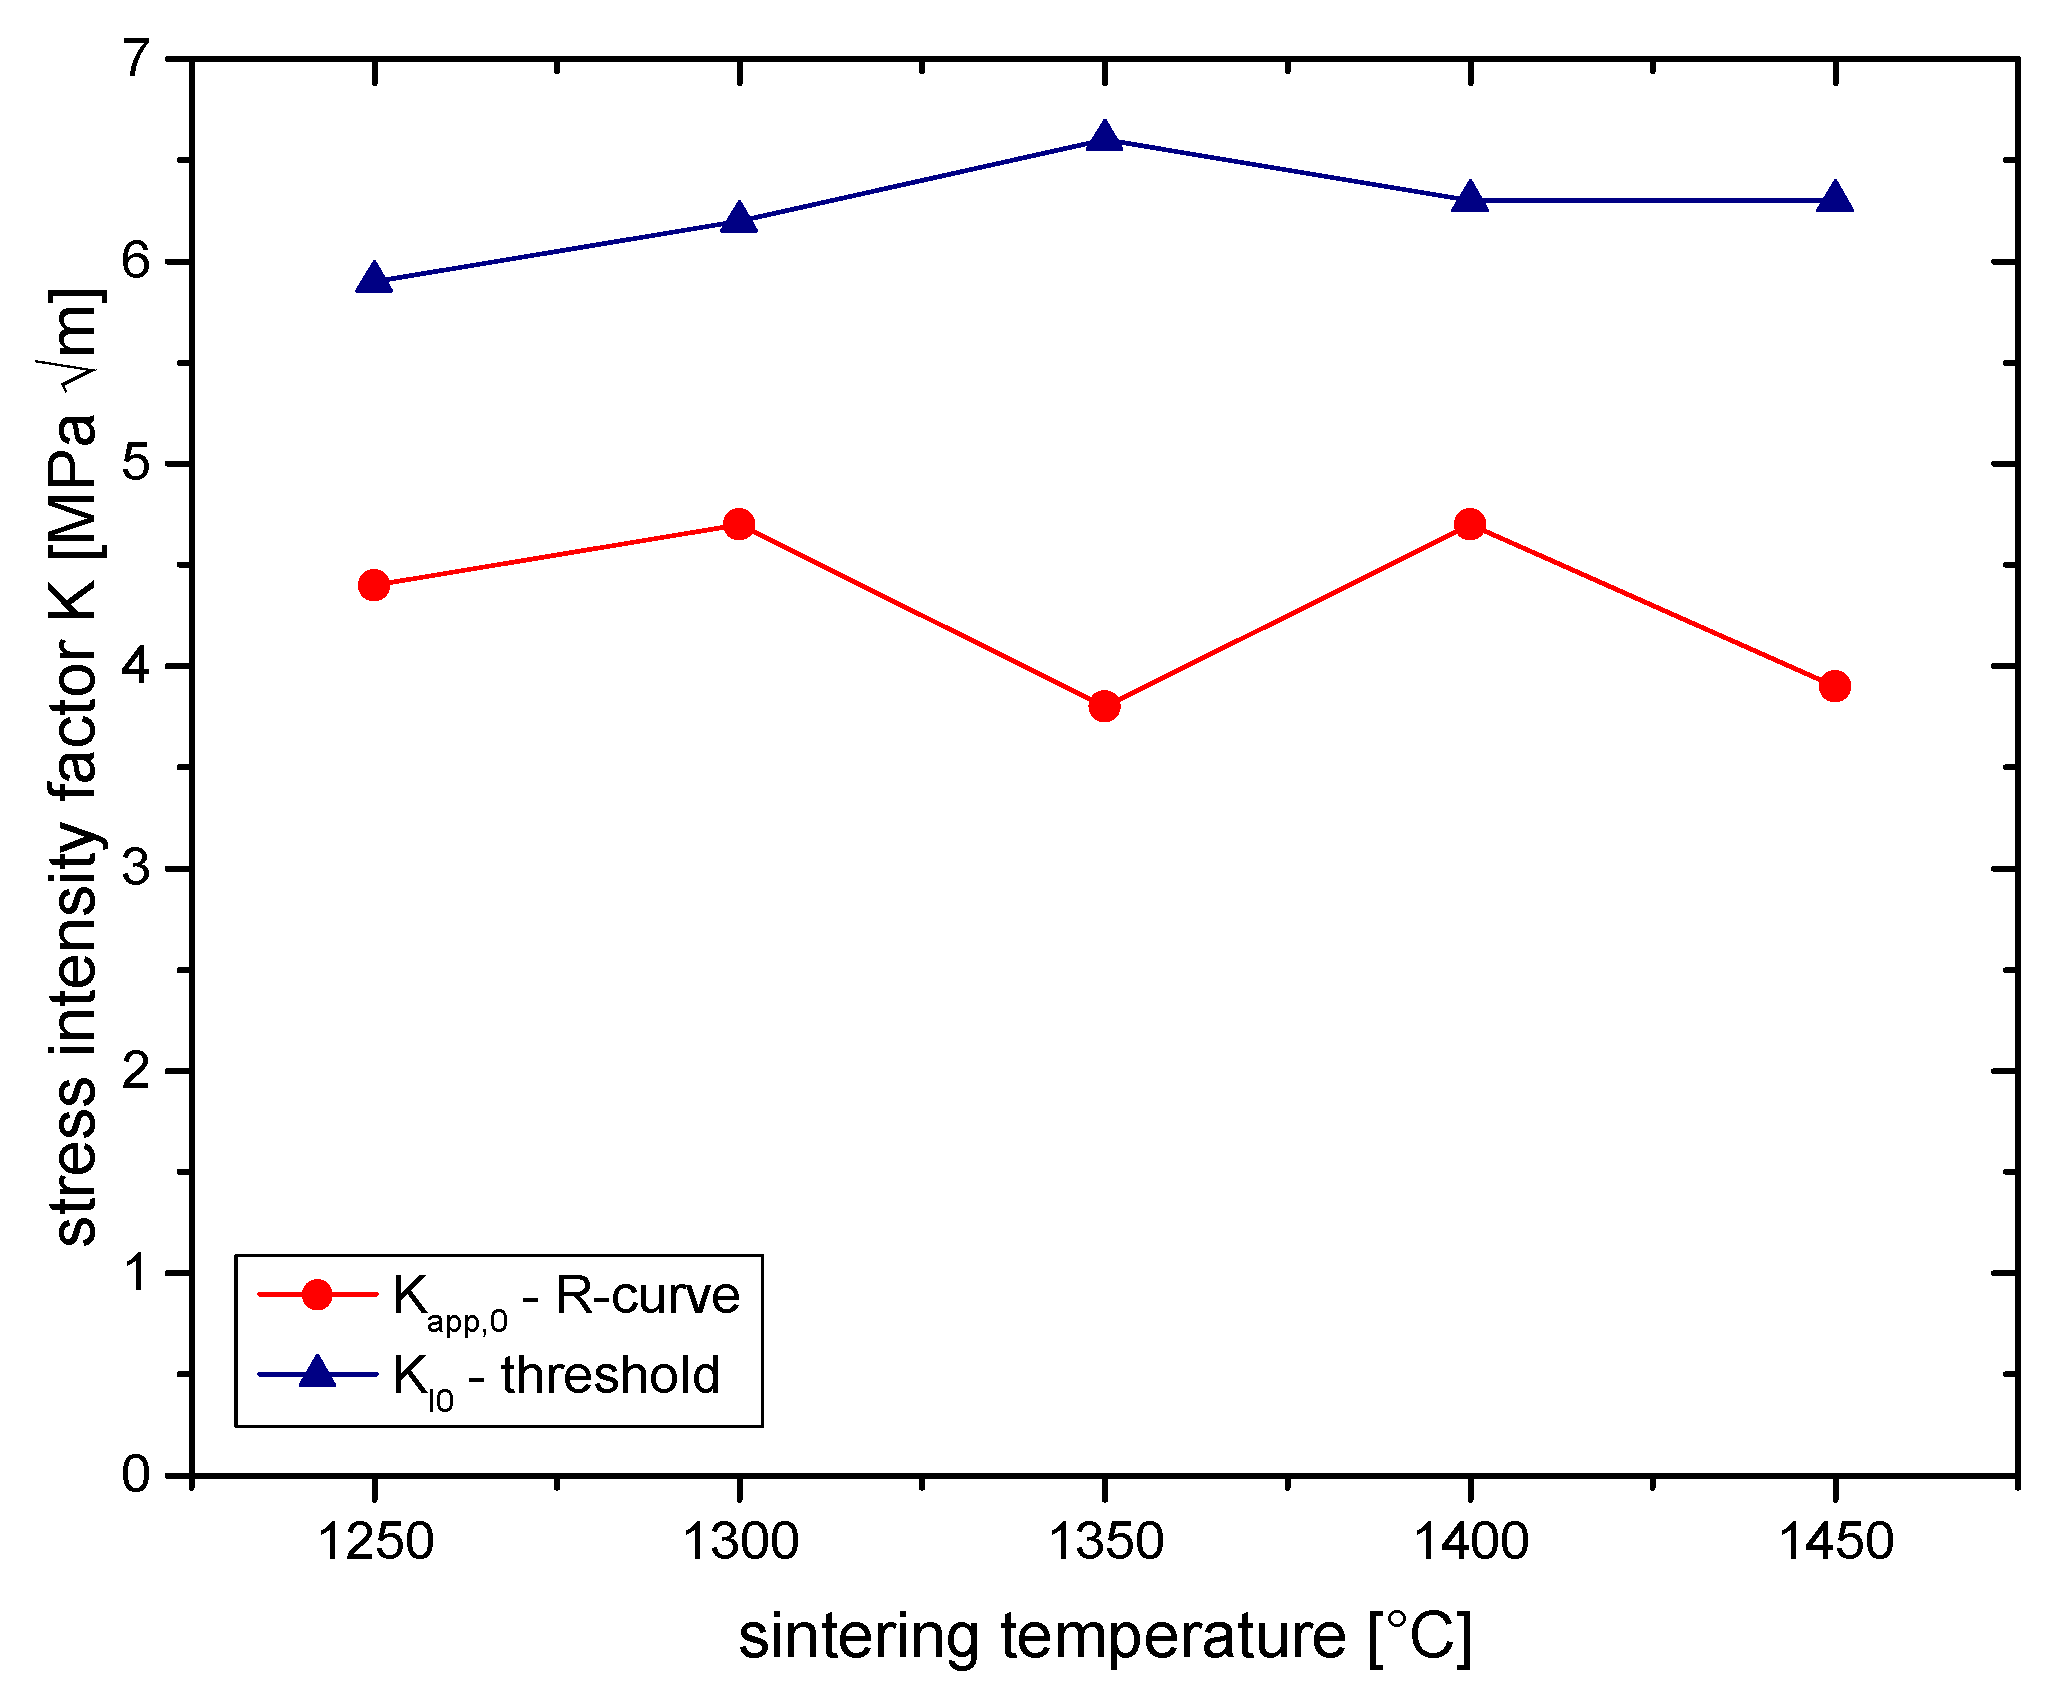
Figure 5.
SIGB plot showing the determination of stress intensities KIC, Kapp,0 and KI0 of 2Y-TZP sintered at 1350 °C.
Figure 5.
SIGB plot showing the determination of stress intensities KIC, Kapp,0 and KI0 of 2Y-TZP sintered at 1350 °C.
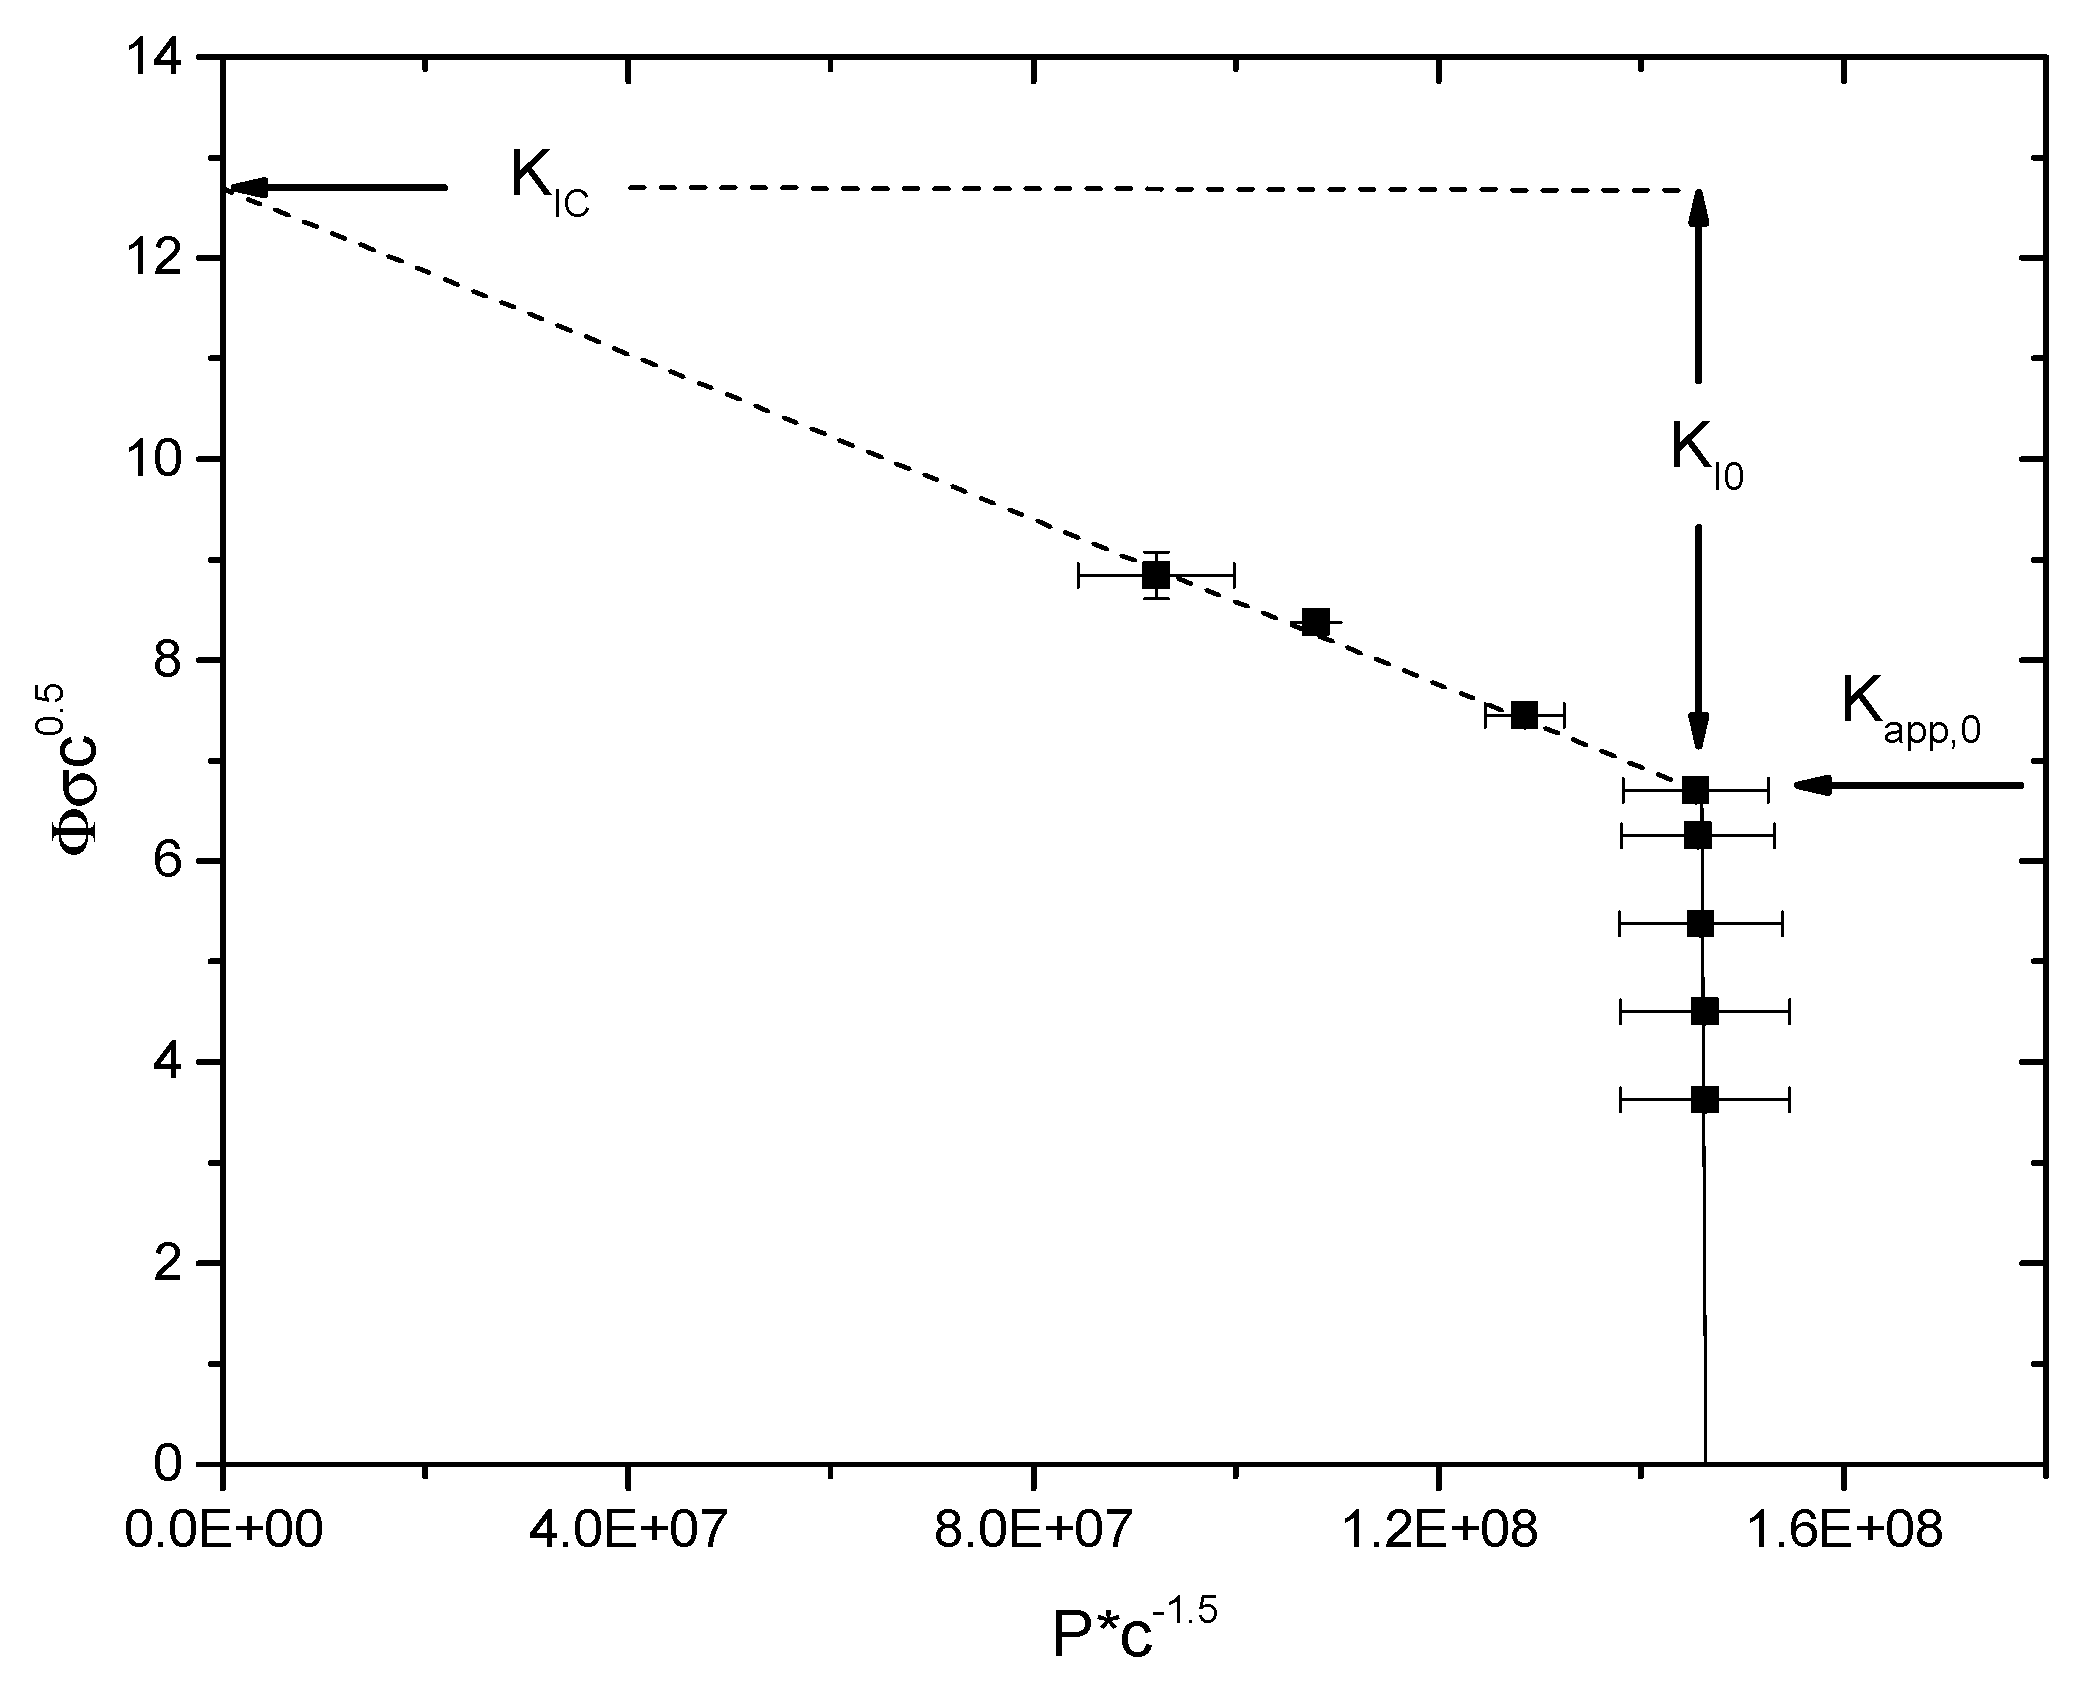
Figure 6.
SEM images of thermally etched 2Y-TZP sintered at (a) 1250 °C, (b) 1350 °C, and (c) 1450 °C.
Figure 6.
SEM images of thermally etched 2Y-TZP sintered at (a) 1250 °C, (b) 1350 °C, and (c) 1450 °C.

Figure 7.
XRD traces of (a) annealed and (b) as-received 2Y-TZP starting powder.

Figure 8.
Monoclinic contents in polished/fractured surface and transformability determined by XRD.

Figure 9.
Transformation zone size h, transformation toughness increments ΔKICT.
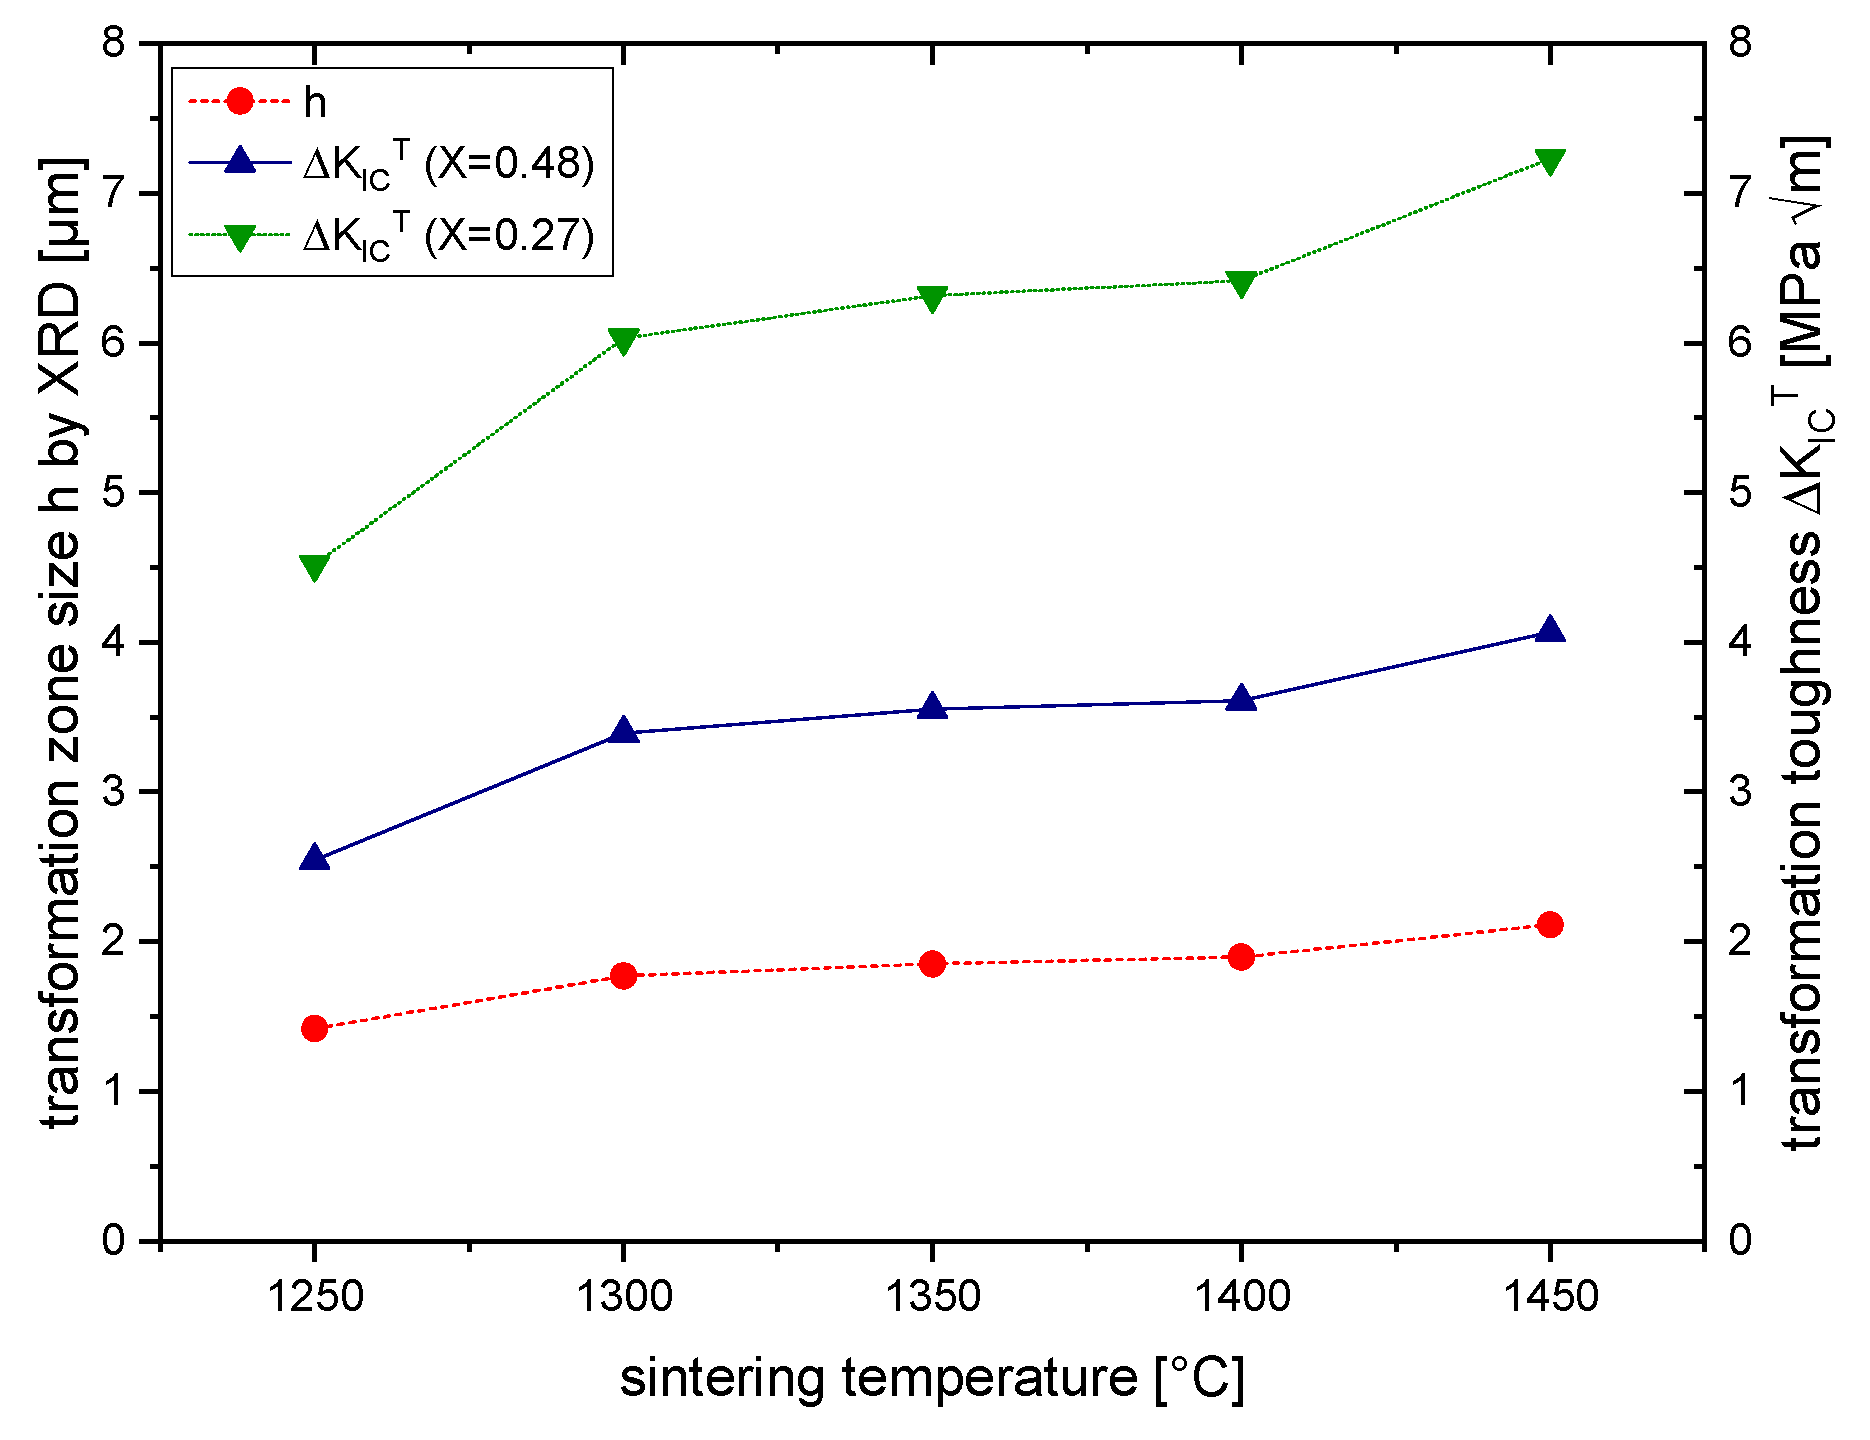
Figure 10.
Transformation zones on the tensile side of TZP fractured by ISB test and four-point bending test, (a) sintered at 1300 °C/1 h, (b) sintered at 1450 °C/1 h.
Figure 10.
Transformation zones on the tensile side of TZP fractured by ISB test and four-point bending test, (a) sintered at 1300 °C/1 h, (b) sintered at 1450 °C/1 h.

Figure 11.
Some correlations between measured and calculated parameters: (a) grain size vs. sintering temperature, (b) transformability Vf vs. grain size, (c) toughness vs. grain size, and (d) toughness vs. Vf∙√h.
Figure 11.
Some correlations between measured and calculated parameters: (a) grain size vs. sintering temperature, (b) transformability Vf vs. grain size, (c) toughness vs. grain size, and (d) toughness vs. Vf∙√h.

Publisher’s Note: MDPI stays neutral with regard to jurisdictional claims in published maps and institutional affiliations. |
© 2020 by the authors. Licensee MDPI, Basel, Switzerland. This article is an open access article distributed under the terms and conditions of the Creative Commons Attribution (CC BY) license (http://creativecommons.org/licenses/by/4.0/).
Share and Cite
MDPI and ACS Style
Kern, F.; Gommeringer, A. Mechanical Properties of 2Y-TZP Fabricated from Detonation Synthesized Powder. Ceramics 2020, 3, 440-452. https://0-doi-org.brum.beds.ac.uk/10.3390/ceramics3040037
AMA Style
Kern F, Gommeringer A. Mechanical Properties of 2Y-TZP Fabricated from Detonation Synthesized Powder. Ceramics. 2020; 3(4):440-452. https://0-doi-org.brum.beds.ac.uk/10.3390/ceramics3040037
Chicago/Turabian StyleKern, Frank, and Andrea Gommeringer. 2020. "Mechanical Properties of 2Y-TZP Fabricated from Detonation Synthesized Powder" Ceramics 3, no. 4: 440-452. https://0-doi-org.brum.beds.ac.uk/10.3390/ceramics3040037