Article

Effect of the Heating Rate on the Spark-Plasma-Sintering (SPS) of Transparent Y2O3 Ceramics: Microstructural Evolution, Mechanical and Optical Properties

1
Sialon Group, Research Center for Functional Materials, National Institute for Materials Science, Tsukuba, Ibaraki 305-0047, Japan
2
Ceramics Processing Group, Research Center for Functional Materials, National Institute for Materials Science, Tsukuba, Ibaraki 305-0047, Japan
3
Field-Assisted Sintering Group, Research Center for Functional Materials, National Institute for Materials Science, Tsukuba, Ibaraki 305-0047, Japan
*
Author to whom correspondence should be addressed.
Submission received: 7 December 2020 / Revised: 22 January 2021 / Accepted: 16 February 2021 / Published: 17 February 2021
(This article belongs to the Special Issue Spark Plasma Sintering Technology)

Abstract

:
High strength transparent Y2O3 ceramics were fabricated from commercial powders using spark plasma sintering (SPS) technique by optimizing the heating rate. The heating rate significantly influenced the microstructures and the optical/mechanical properties of the Y2O3 ceramics. Grain growth was limited accordingly with increasing the heating rate. The ball milling process of the commercial Y2O3 powders is likely to further enhance the sinterability during the SPS processing. The dense Y2O3 ceramics, which were sintered by SPS with 100 °C/min, showed good transmittance range from visible to near infrared (IR). For a high heating rate of 100 °C/min, the in-line transmittance at a visible wavelength of 700 nm was 66%, whereas for a slow heating rate of 10 °C/min, it reduced to 46%. The hardness Hv tends to increase with increasing the heating rate and rigorously followed the Hall–Petch relationship; that is, it is enhanced with a reduction of the grain size. The toughness KIC, on the other hand, is less sensitive to both the heating rate and the grain size, and takes a similar value. This research highlighted that the high heating rate SPS processing can fabricate fully dense fine-grained Y2O3 ceramics with the excellent optical and mechanical properties.

1. Introduction

Transparent polycrystalline Y2O3 ceramics are known as promising optical materials in various applications such as high intensity discharge lamps, missile domes, heat resistive windows, and host material in ceramic lasers and scintillators owing to their significant physical and chemical properties of low thermal expansion, high thermal conductivity, a broad transparency range from violet to infrared light, and high corrosion resistance [1,2,3,4,5,6]. However, the fabrication of transparent Y2O3 ceramics is quite challenging work because the Y2O3 ceramics are known to be difficult to sinter, due to the high melting point of Y2O3 (2430 °C). Normally, the typical and conventional preparation methods of the transparent polycrystalline Y2O3 ceramics are hot pressing, hot isostatic pressing, and pressureless sintering at high temperatures [7,8,9]. Although such high-temperature sintering processes can attain transmittance, those usually cause intense grain growth, and hence, result in the poor mechanical properties, which make it difficult to use in industrial applications.
To restrain the grain growth, spark plasma sintering (SPS) technique has recently attracted many attentions as an alternative method to obtain dense and fine-grained ceramics at low temperatures and short processing time [10,11,12,13,14]. The SPS method is an advanced sintering technology that combines uniaxial pressure and high heating rate by applying an electrical pulsed current directly to the sintering dies. In addition, the SPS has been regarded as a new field-activated sintering technique, which is related to the current enhanced thermal processes at the free surfaces of the particles, especially in nanopowders [10]. This suggests that the nanocrystalline ceramic powders can be recognized as the best candidates for the densification by SPS. Recently, fine-grained transparent ceramics such as Al2O3 [15], Y3Al5O12 [16], MgO [17], MgAl2O4 [18] and ZrO2 [19] have successfully been fabricated by the SPS technique.
In the last decade, SPS has also been successfully applied to produce dense Y2O3 materials at relatively lower sintering temperatures with a shorter sintering time [20,21,22,23]. For example, Chaim et al. [5] reported the fabrication of Y2O3 ceramics with a relative density higher than 98% using SPS at 1400 °C for 5 min. Zhang et al. [24] prepared transparent Y2O3 with an in-line transmission Tin of 68% at a wavelength λ of 700 nm by using high pressure SPS technique at 1050 °C under an uniaxial pressure of 300 MPa. Yoshida et al. [25] have reported the fabrication of the translucent polycrystalline Y2O3 ceramics at a relatively lower temperature of 950 °C with a slow heating rate of 2 °C/min by SPS. Ahmadi et al. [26] reported the fabrication of transparent Y2O3 ceramics with Tin ≈ 11–54% at λ = 400–800 nm and Tin ≈ 80% at λ = 3–5 mm by the SPS technique at 1500 °C from commercial powders. Most of the works, however, are mainly focused on the densification, microstructure and mid-infrared transmission spectra behavior of the Y2O3 ceramics fabricated by the SPS technique under the low heating rates and the long sintering times. The systemic study on the effects of heating rates on the microstructure, optical and mechanical properties are highly limited.
In this work, therefore, transparent Y2O3 ceramics are fabricated by the SPS technique at 1250 °C under 70 MPa with the heating rate range of 10–100 °C/min. The effect of the heating rate on the microstructural evolution, optical and mechanical properties of the Y2O3 ceramics sintered by SPS was systematically examined.

2. Materials and Methods

2.1. Preparation and Processing of Y2O3 Powders

Commercially available Y2O3 nanopowder (BB-type, Shin-Etsu Chemical Co., Ltd., Tokyo, Japan, purity: 99.9%) was used as a starting material. The as-received powders were deagglomerated by a ball milling technique in non-aqueous solvent using zirconia grinding media for 72h, and dried at 60 °C in a dry oven for 8h. The dried powders were ground and then sieved through a 200-mesh sieve for granulation.
The obtained Y2O3 nanopowders were densified with a SPS machine (LABOX, Sinter Land Inc., Niigata, Japan). The powders were loaded into a graphite mold with an inner diameter of 10 mm. The interior of the graphite mold was covered with graphite papers. The outside of the mold was covered with a thermal insulator carbon felt to suppress any heat losses from the mold surface. The SPS process was carried out at 1250 °C with various heating rates and a dwelling time of 10 min under a uniaxial pressure of 70 MPa. During the sintering, the surface temperature of the graphite mold was measured using an optical pyrometer (IR-AH, Chino Corp., Tokyo, Japan) through a hole made in the carbon felt. Since the as-sintered samples showed dark gray color, those were post-annealed at 1000 °C for 10 h in air to eliminate oxygen vacancies, residual carbon impurities and strains. For the visible and near IR light transmittance measurements, both surfaces of the annealed composites were polished with diamond pastes to ∼1.0 mm in thickness.

2.2. Characterization Techniques

X-ray diffraction (XRD) analysis of the Y2O3 powders and the sintered ceramics were performed with RINT-2500 diffractometer (Rigaku Co., Ltd., Tokyo, Japan) using Cu Kα radiation and operated at 40 kV and 300 mA. Microstructures of the ceramics were observed by a field emission scanning electron microscopy (FE-SEM, model SU-8000, Hitachi Ltd., Tokyo, Japan). For transmission electron microscopy (TEM) observations, the as-received and ball milled Y2O3 powders were uniformly dispersed into ethanol by applying ultrasonic. The solution dispersed with the powders was dropped on a carbon-coated Cu grid. TEM observation was performed with a JEOL 2010F microscope (200 kV) equipped with dispersive X-ray analysis (EDS) detector. The transmission in the wavelength range of λ = 0.25–1.6 μm was measured by using a double-beam spectrophotometer (SolidSpec-3700DUV, Shimadzu) equipped with an integrating sphere.
Hardness (Hv) and toughness (KIC) of the ceramics were examined using a Vickers hardness tester (MVK-E, Akashi Seisakusho, Ltd., Toda, Japan). The ceramic surfaces were carefully polished by using diamond slurries with 9, 3, and 1 μm diameter. After thermal annealing at 1000 °C for 10 h to remove residual stresses, the hardness (Hv) and toughness (KIC) measurements were conducted at a load of 2 N for 15 sec. Hv and KIC were evaluated using the following Equation (1) [27] and Equation (2) [28], respectively.
H v = 0.1891 ( F 4 a 2 )
K I C = 0.16 ( c / a ) 1.5 ( H v a 1 / 2 )
where F is the test load, a is the half average diagonal length of the indentation, c is the average length of the cracks obtained from the center of the indentation to the crack tip.

3. Results and Discussion

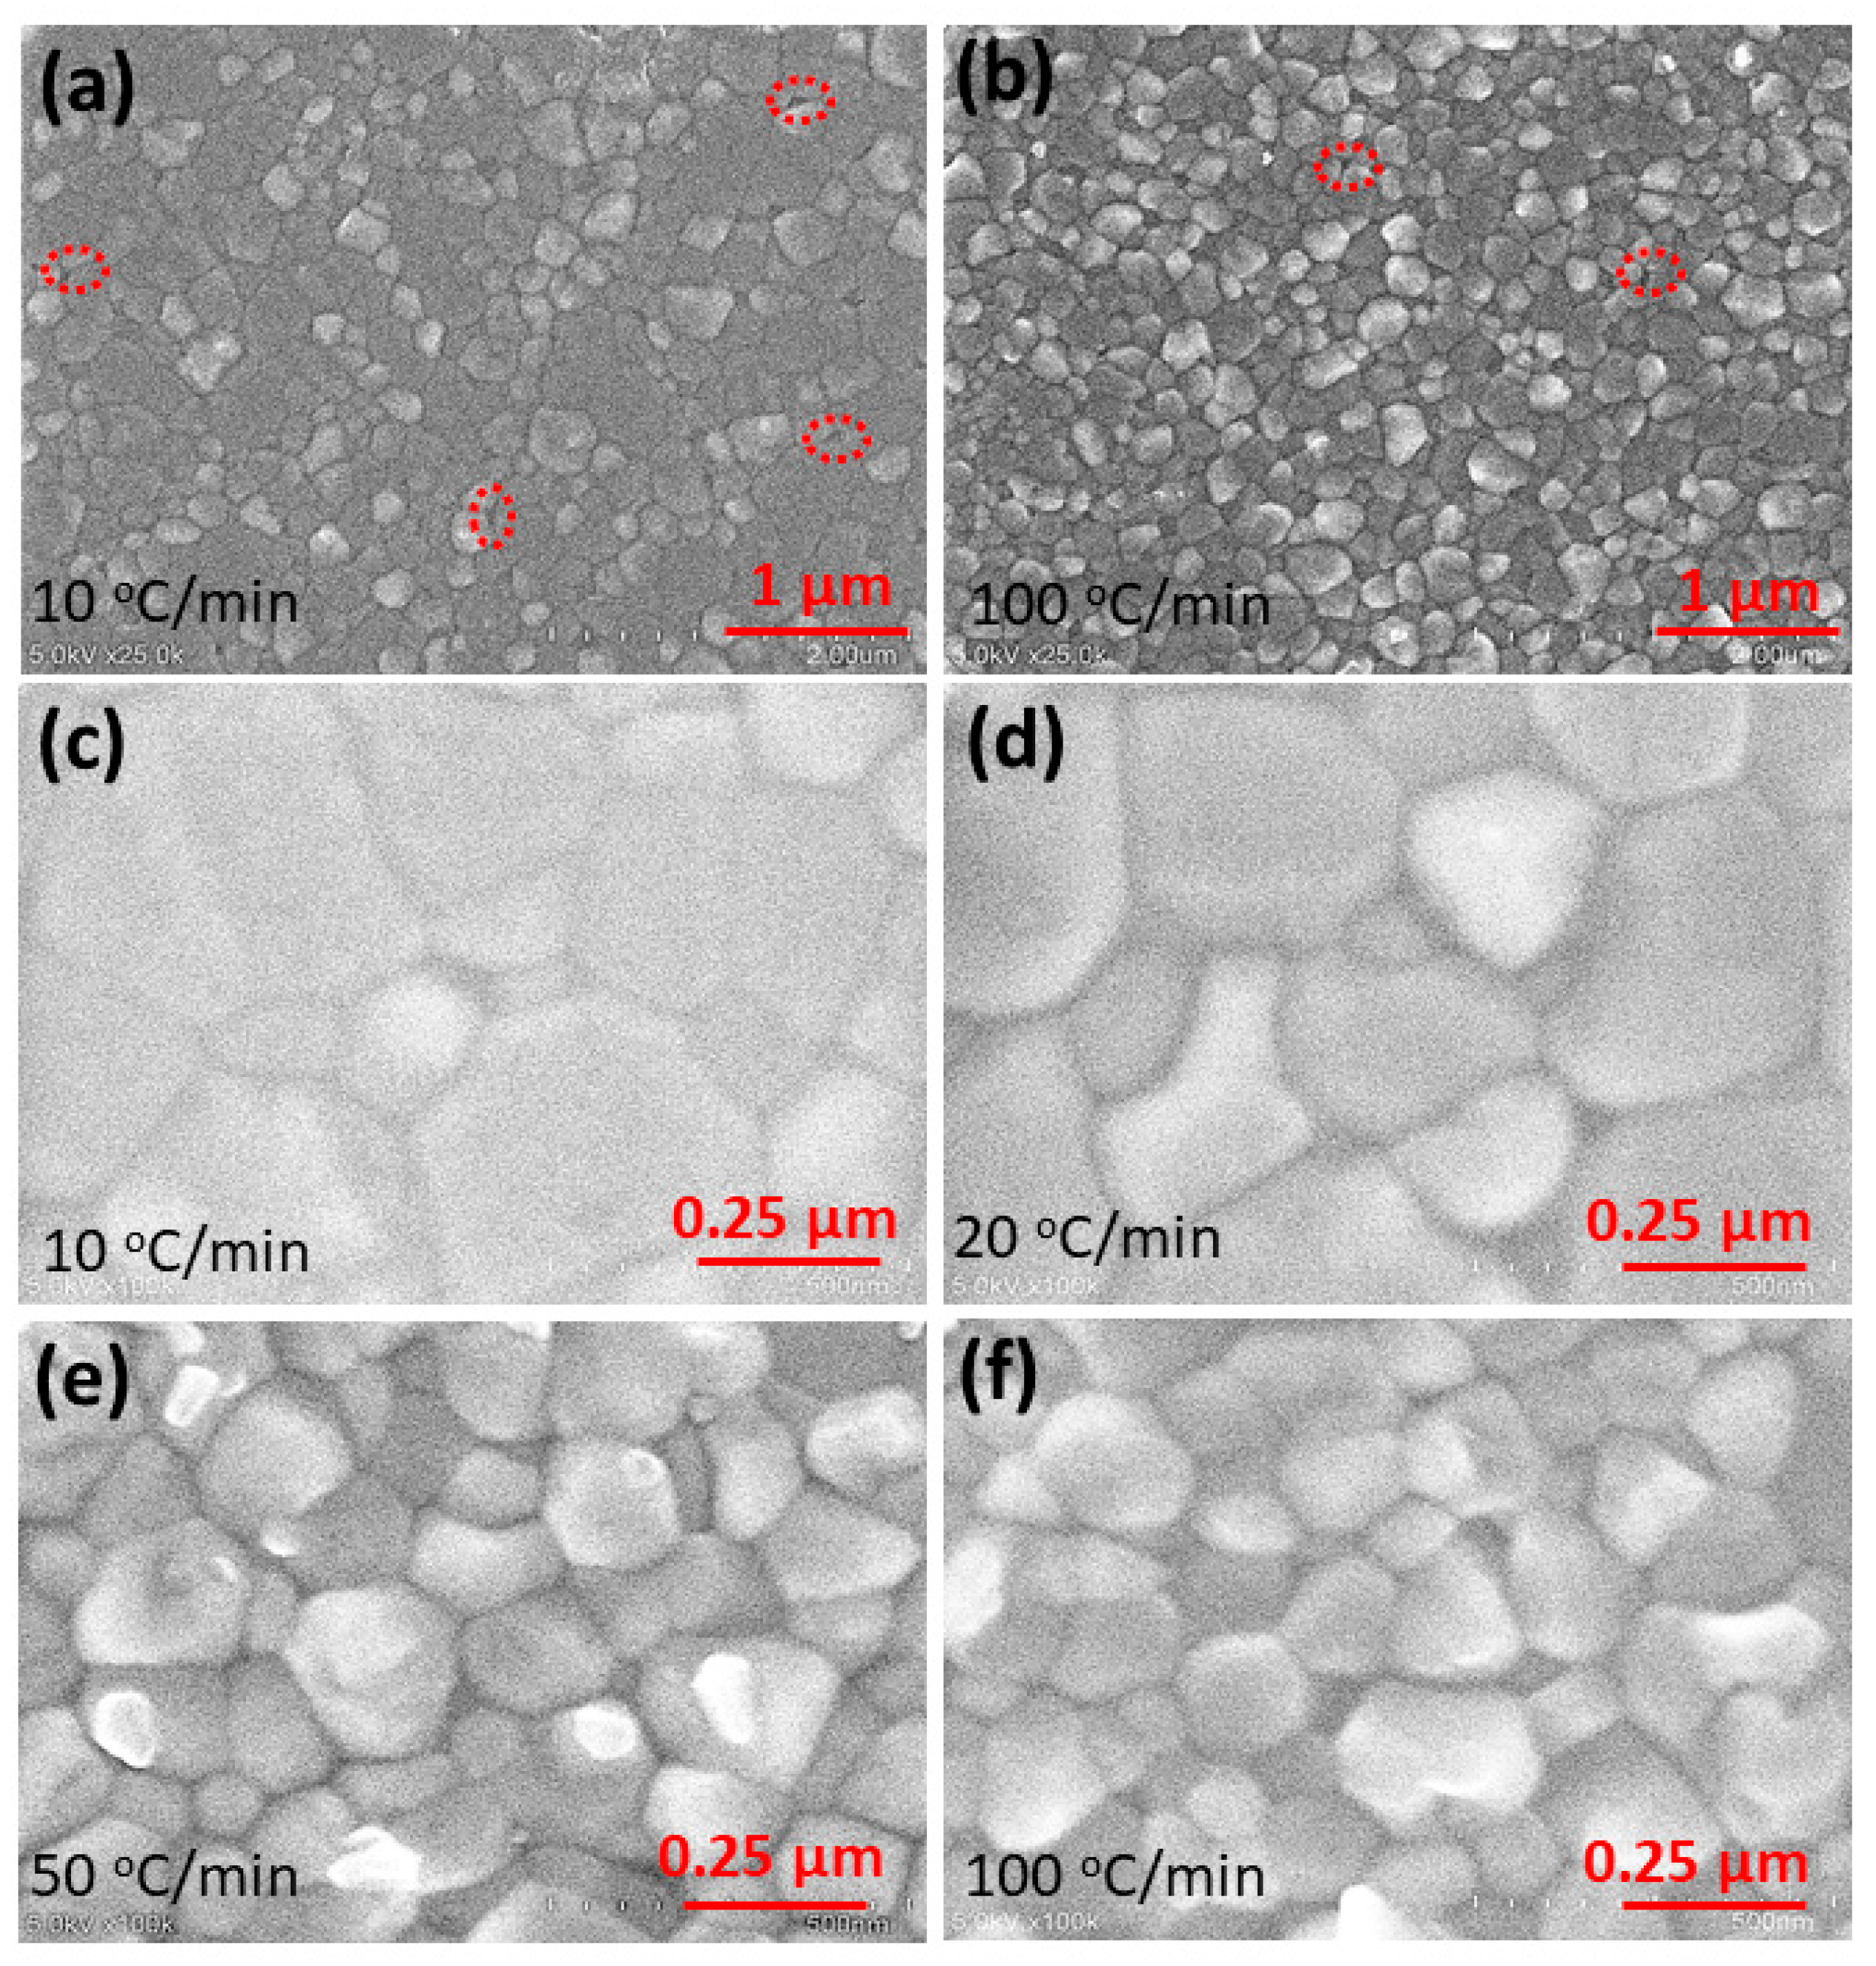
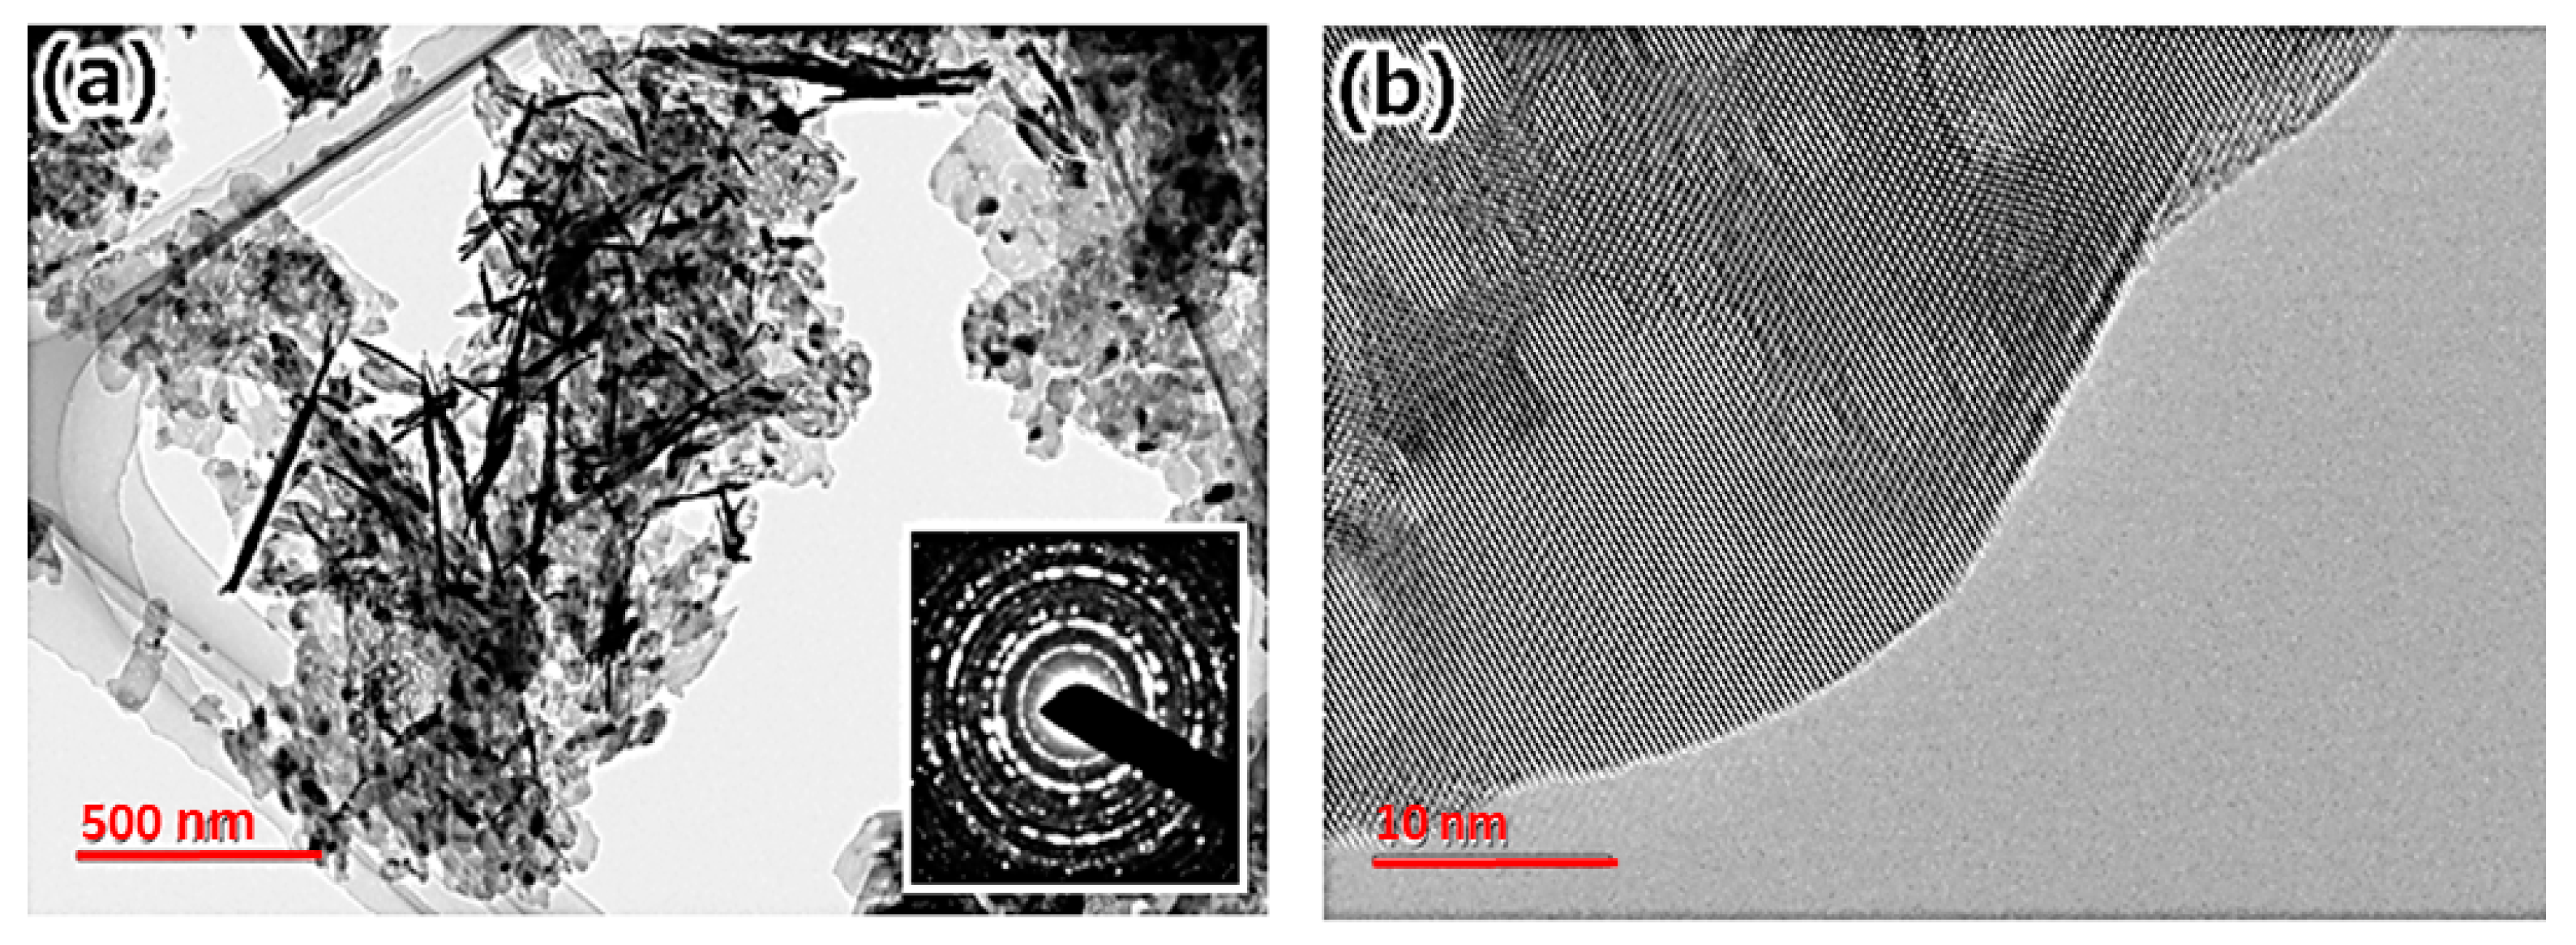
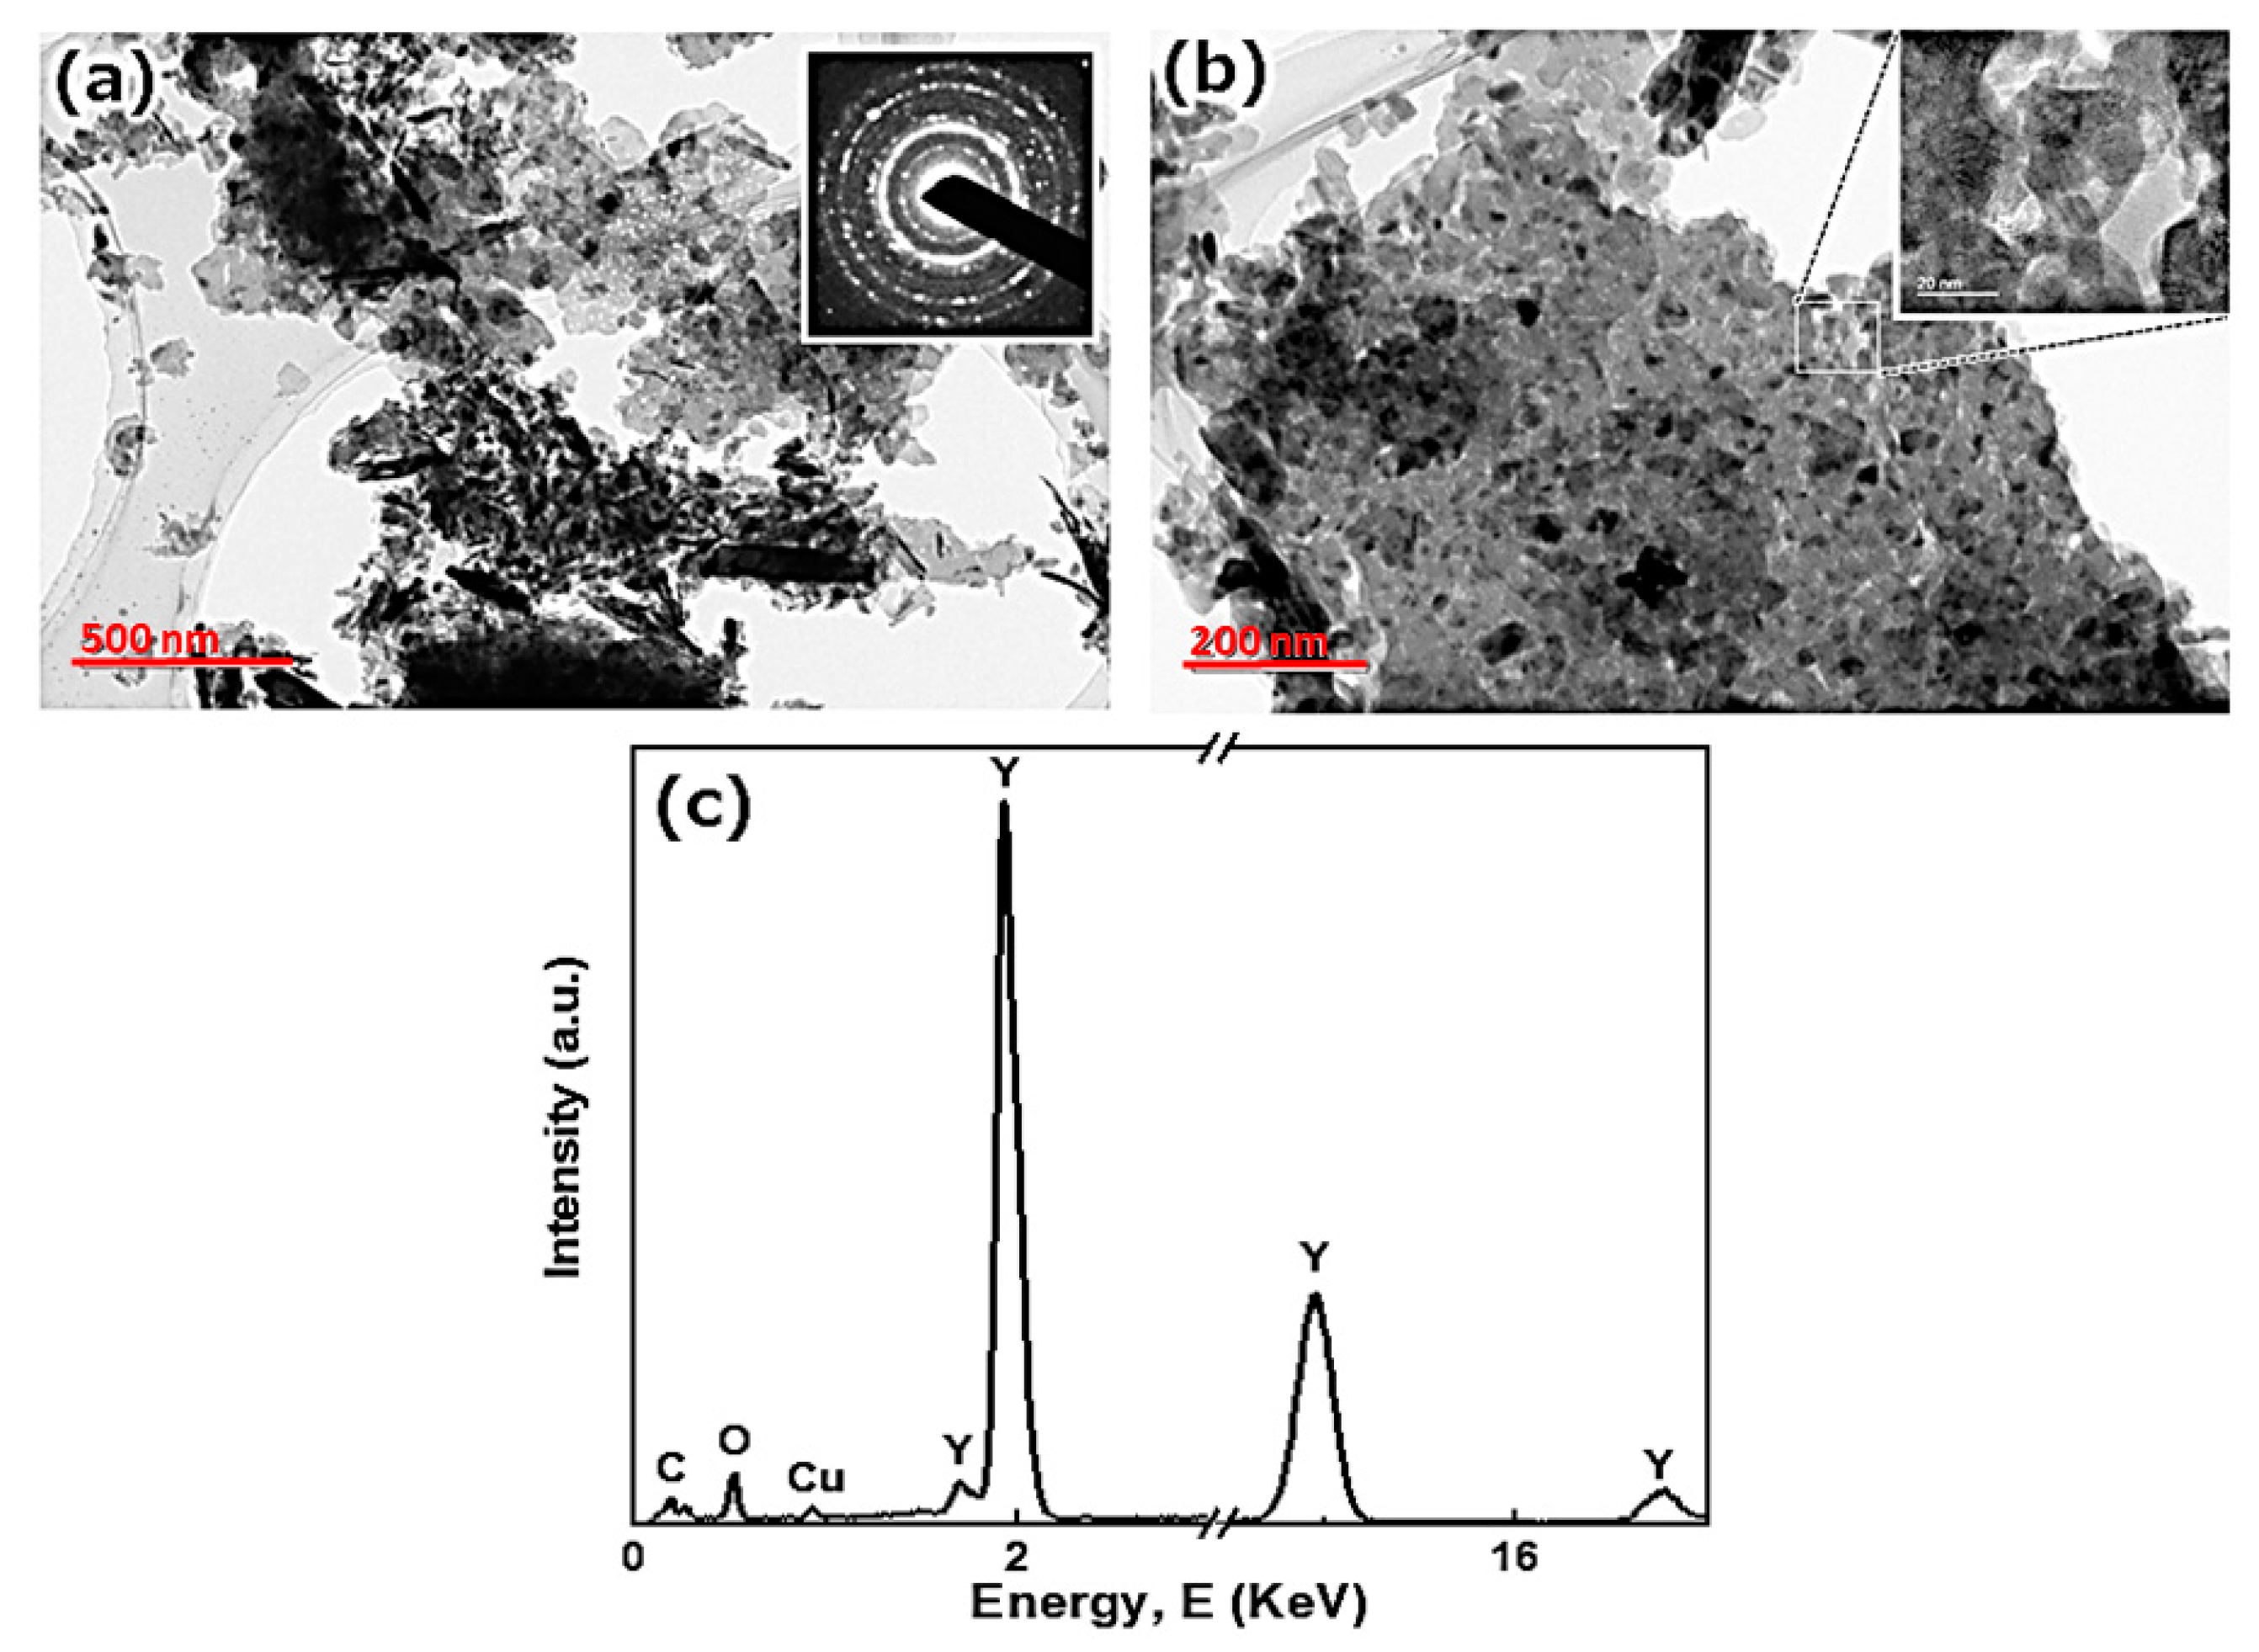
3.1. Microstructure Evaluation

Figure 1 shows the XRD patterns of the Y2O3 nanopowders before and after the ball milling, and the Y2O3 ceramic after the SPS processing at 1250 °C. The XRD patterns of both the nanopowders and the ceramic can be indexed only by cubic Y2O3 phase (PDF No.: 01-075-3096) and no any ZrO2 impurity second phase is observed.
Heating rate dependent microstructure of the Y2O3 ceramics, which were fabricated at 1250 °C under 70 MPa, is shown in Figure 2a–f. All the ceramics show highly dense microstructures, irrespective of the heating rate condition. Although a few hundreds of nanometer-sized residual pores are observed at multiple grain junctions, those tends to decrease with increasing the heating rate, as shown in the low magnification SEM images by the circles in Figure 2a,b. The grain growth, however, was limited accordingly with increasing the heating rate; it was ~499 nm at a heating rate of 10 °C/min but was reduced to ~164 nm at 100 °C/min. This heating rate dependent grain size conflicts with the results reported by Yoshida et al. [25] They have fabricated the Y2O3 ceramics by using SPS with the sintering temperature range of 850–1050 °C at the various heating rates between 2 and 50 °C/min, and reported that dense Y2O3 with the finest grain size of 190 nm was fabricated at 950 °C for a slower heating rate of 2 °C/min. The reason of the conflicting results has been unclear. Nevertheless, the different powder conditions caused by the ball milling process may play a main role for the conflicting sintering results of the Y2O3 ceramics between the present and the previous works.
Figure 3 shows the photographs of the Y2O3 ceramics fabricated from the as-received and the ball milled powders under the same sintering conditions of 1250 °C and 70 MPa with 100 °C/min, respectively. The sample fabricated from the as-received powders is opaque in the center area and translucent in the outside area. On the other hand, the sample fabricated from the ball milled powders shows uniform and high transparence. This result suggests that despite the same sintering conditions, such as sintering temperature, heating rate, loading pressure, and holding time, etc., the powder condition might play an important role in the sintering behavior, resulting in the lower porosity (Figure 2) and the transmittance (Figure 3) in the ball milled powders.
The transparent Y2O3 ceramic indicates that the powders after the ball milling can be accelerated the densification behavior during the SPS processing. Two possible reasons may contribute to the sintering phenomenon. First, the defects formed on the powder surfaces may enhance the current effect during the SPS processing. For the ball milled powder, large amounts of defects will be introduced on the powder surface during the milling process and act as a preferential electric flow channel to enhance the conductivity of Y2O3, thereby, the sintering kinetic enhanced by electric current can be realized during the SPS sintering. Second, the powder size reduced by the milling process may be related to the current effect during the SPS processing. According to Chaim [10], surface current flow is proportional to the surface area of the particle, whereas the current flow through the bulk of the particle is proportional to the particle volume. The ratio of these currents is then proportional to the particle’s radius of curvature according to the following equation: [10]
I s u r . I b u l k π d 2 π / 6 d 3 = 6 d
where Isur. is the surface current, Ibulk is the volume current, d is the particle’s radius of curvature. Therefore, according to the equation, as the particle size decreases, the relative contribution of the surface current significantly increases. This will enhance homogeneous accumulation of the charge over the particles, and in turn, leads to the initiation of the surface dielectric breakdown at the smaller particles, finally results in the accelerated densification even at lower temperatures.
To examine the microstructure of the powders, TEM observations were performed before and after the ball milling process in Figure 4 and Figure 5. The microstructures suggest that the surface dielectric breakdown might also be the case of Y2O3 in our work, because the particle size of the ball milled powder is much smaller than that of the as-received powders. Before the ball milling process, the as-received Y2O3 powder, which consists of the plate- and fiber-like particles (Figure 4a), shows a sharp spot ring SAD pattern. This suggests that the as-received powders have relatively good crystallinity as typically shown in the high-resolution (HR-) TEM image in Figure 4b. In contrast, after the ball milling process, the fiber-like particles become shorter and the plate-like particles consist of several tens nanometer scale crystals, as typically shown in Figure 5a,b, respectively. Irrespective of the high energy ball milling processes by the ZrO2 media, no detectable Zr impurity can be found in EDS spectra, except for minor Cu signal of the grid (Figure 5c). Since SAD of the ball milled powder becomes diffuse rather than that of the as-received powder, large strains might be generated in the Y2O3 powders during the ball milling processing, resulting in the fine particles. These factors might increase the accumulation of the charge over the particles to accelerate the surface breakdown.
Furthermore, in order to examine the speculation above, the ball milled powders were sintered under the conductive and insulative SPS set-up conditions. The ball milled powders were loaded into the graphite die. For the conductive set-up, the both sides of the loaded powders were sandwiched by the electrically conductive graphite papers, whereas for the insulative set-up, those were sandwiched by the electrical insulator BN coating. The shrinkage behavior during the SPS processing apparently change with the set-up conditions, as shown in Figure 6a, irrespective of the same heating condition.
Figure 6b gives a comparison of the shrinkage rate (dL/dt) evaluated from the punch displacement L of the graphite dies shown in Figure 6a. The sintering behavior is clearly related to the SPS set-up of the powders. The conductive set-up shows a little bit larger shrinkage slope between 800 °C and 900 °C than the insulative set-up and the maximum (dL/dt)-value at around 920 °C. For the insulative SPS set-up, on the other hand, the maximum (dL/dt)-value shifts to higher temperature of 1080 °C. Beyond the maximum values, (dL/dt) gradually decreases with increasing the temperature and changes from shrinkage to expansion. The (dL/dt)-values become almost zero at around 1250 and 1350 °C for the conductive and insulative set-ups, respectively, as indicated by the arrows in Figure 6a,b. This result suggests that for the conductive set-up, the ball milled powders may be affected from the pulsed DC power during the SPS sintering, resulting in the accelerated densification process. This would be another reason why the effect of the heating rate obtained in this work does not correspond to those of the previous works [25].
For the Y2O3 ceramic, the accelerated densification behavior in the high heating rate is likely to be related to the applied power during the SPS processing. Figure 7 shows the applied power during the SPS processing of the Y2O3 ceramics at the high and slow heating rates. As shown in Figure 7, the power during the sintering is apparently higher in the high heating rate of 100 °C/min than in the slow heating rate of 10 °C/min. In order to fully understand the power effect on the SPS processing, additional experiments are necessary. Nevertheless, since Y2O3 ceramics show electrical conductivities depending on the temperature, defects, impurities and atmosphere [29,30], the heating rate dependent power would influence the sintering kinetic of the Y2O3 ceramics and accelerate the sintering behavior as shown in Figure 6.

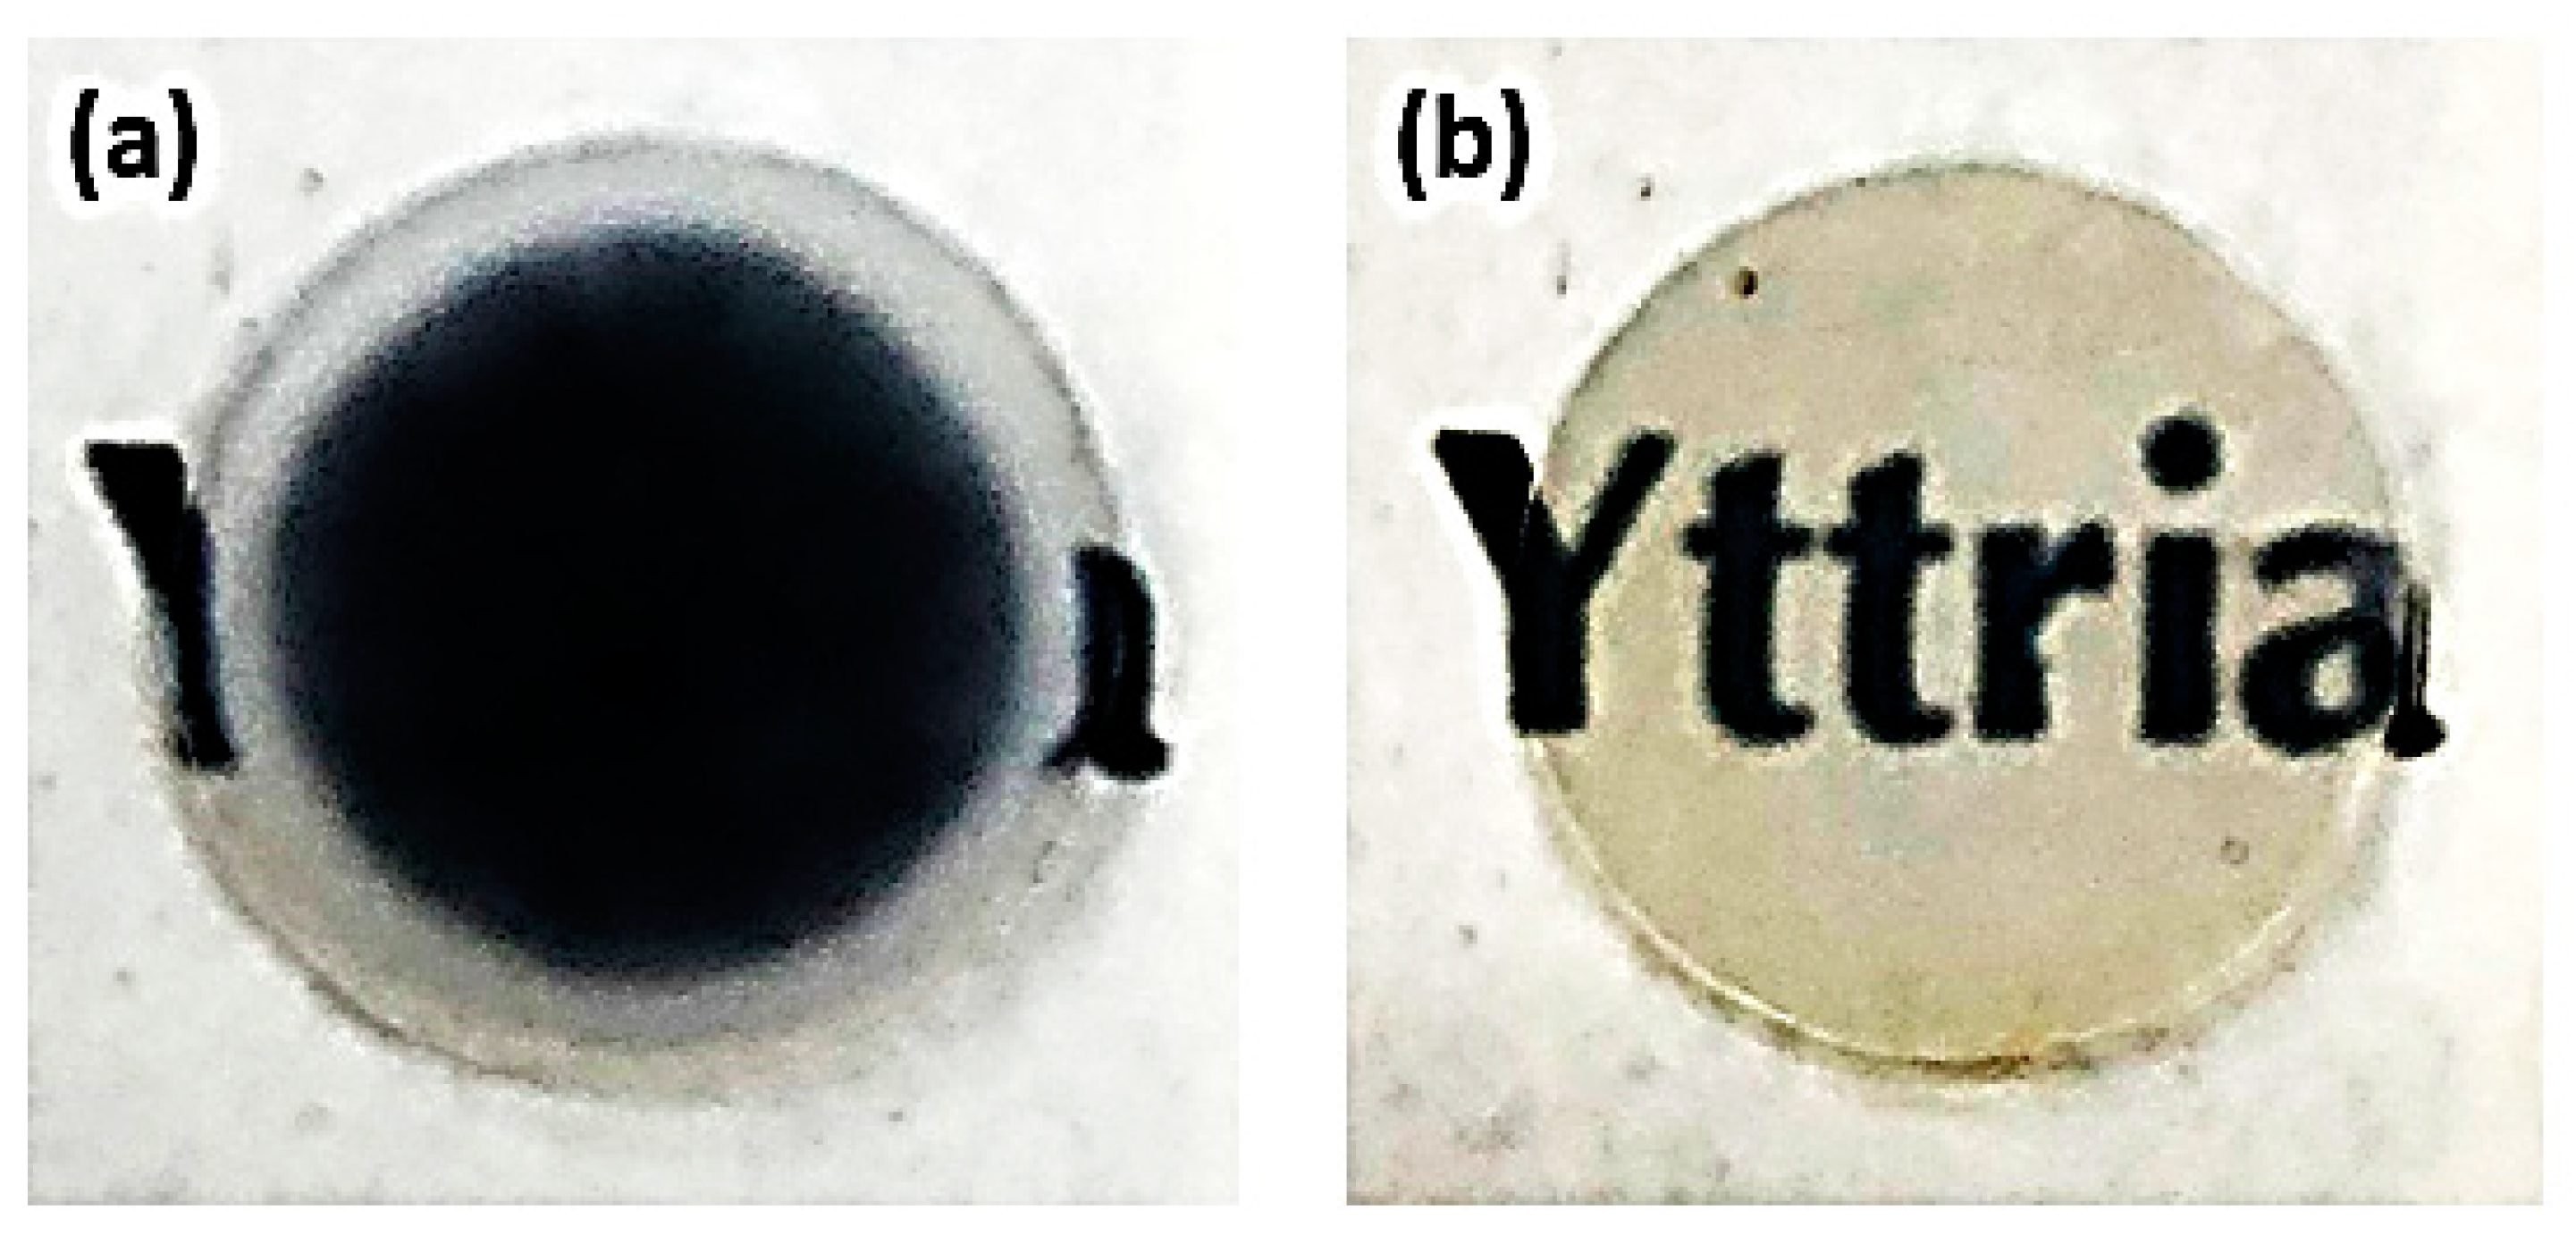
3.2. Optical Properties

Figure 8 gives the optical properties of the Y2O3 ceramics fabricated with various heating rates; the transmittance data were measured after the post-annealing at 1000 °C for 10 h. The Y2O3 ceramics sintered by SPS showed discoloration caused by oxygen vacancy formation, which is a common phenomenon after the SPS processing in vacuum. By the post-annealing, the in-line transmittance efficiencies (Tin) improved from 30% to 66% for the Y2O3 ceramic sintered by SPS at 100 °C/min.
With increasing the heating rate, the Tin-value increase at the whole wavelength from the visible to near-IR ranges (Figure 8a). At a wavelength of λ = 700 nm, the Tin-value gradually increases with the heating rate and exhibits about 46, 49, 64, 66% for each sample fabricated at the heating rates of 10, 20, 50, 100 °C/min, respectively. The Tin-value obtained at the higher heating rate of 100 °C/min is comparable to the value (68%) reported by Zhang et al., [24] in which the Tin-value of 68% was fabricated by using expensively high-pressure method (300 MPa). In contrast to the previous work, the present work can attain the high Tin-value of 66% using the conventional pressure of 70 MPa at the high heating rate.
Figure 8b shows the total transmittance efficiencies (Ttotal) of the same samples shown in Figure 8a. In contrast to Tin, the Ttotal-value takes almost the similar higher values of ≈80% in all the samples, independent of the heating rates. Since Ttotal is the whole summation of the transmitted light in all directions and is less sensitive to the porosity and microstructure, it would take the similarly high value of ≈80%.
To understand the heating rate dependent optical properties, the Tin- and Ttotal-values of the samples sintered at 10 and 100 °C/min were illustrated in Figure 8c for comparison. The difference between the Tin- and Ttotal-values is smaller in the high heating rate of 100 °C/min than in the slower heating rate of 10 °C/min. The difference between the Tin- and Ttotal-values can be ascribed to the light scattering factors. Normally, the optical transmittance of the sintered polycrystalline materials is influenced by the light scattering caused by the residual pores, grain/interface boundaries and second/amorphous phases. Figure 8c suggests that the heating rate dependent optical property is likely to be caused by the difference of the density of the light sources formed in the materials. In particular, the residual pores seem to be the main scattering source of the present Y2O3 ceramics, as discussed below.
The scattering coefficient γ s c a can be roughly calculated from the Tin- and Ttotal-values by the following equation: [31]
γ s c a   =   ln T in T total t ,
where t is the sample thickness. According to the formula, the wavelength dependent scattering coefficient γ s c a can be evaluated under Tin > 0 as shown in Figure 9a. With increasing the heating rates from 10 to 100 °C/min, the γ s c a -values of the Y2O3 reduce from ~35 to 15 cm−1 at the wavelength of λ = 300 nm, and then, monotonously decrease to less than 5, 4, 2 and 2 cm−1 at λ = 300–600 nm, respectively. For the heating rates higher than 50 °C/min, the γ s c a -values finally become negligibly small at λ > 600 nm.
For Y2O3 with the isotropic cubic crystal structure, since the birefringent scattering at the grain boundaries is negligible, other microstructural factors, such as the pores, are likely to be the main scattering source. It is well known that when the wavelength of the incident light became of a scale similar to that of the residual pores, the light scattering factor arising from the pores become significant [32]. As shown in Figure 2a,b, a few hundreds of nanometer-sized residual pores were observed at the multiple grain junctions and tend to decrease with increasing the heating rate. As compared to Tin of the pore-free Y2O3 single crystal (~80%) [33], Tin of the sintered Y2O3 polycrystals exhibits similar values at the longer wavelength of > 1200 nm, but it decreases with approximately 20% lower at the shorter wavelength (600 nm), which is comparable values of the observed pores. Thus, the residual pores having the hundreds of nanometer size (Figure 2a,b) can be regarded as a main light scattering source at the wavelength range of λ < 0.6 μm. Furthermore, the relationship between the scattering coefficient and the wavelength to the minus fifth power (λ−4) shows almost linear relation as shown in Figure 9b, indicating that Rayleigh scattering caused by the pores is the main factor responsible for the reduced transmittance as well. Therefore, the different scattering coefficients caused by the different residual pore size and the porosity formed in the samples (Figure 2a,b) would be the main reason for the heating rate dependent transmittance efficiency of each sample.

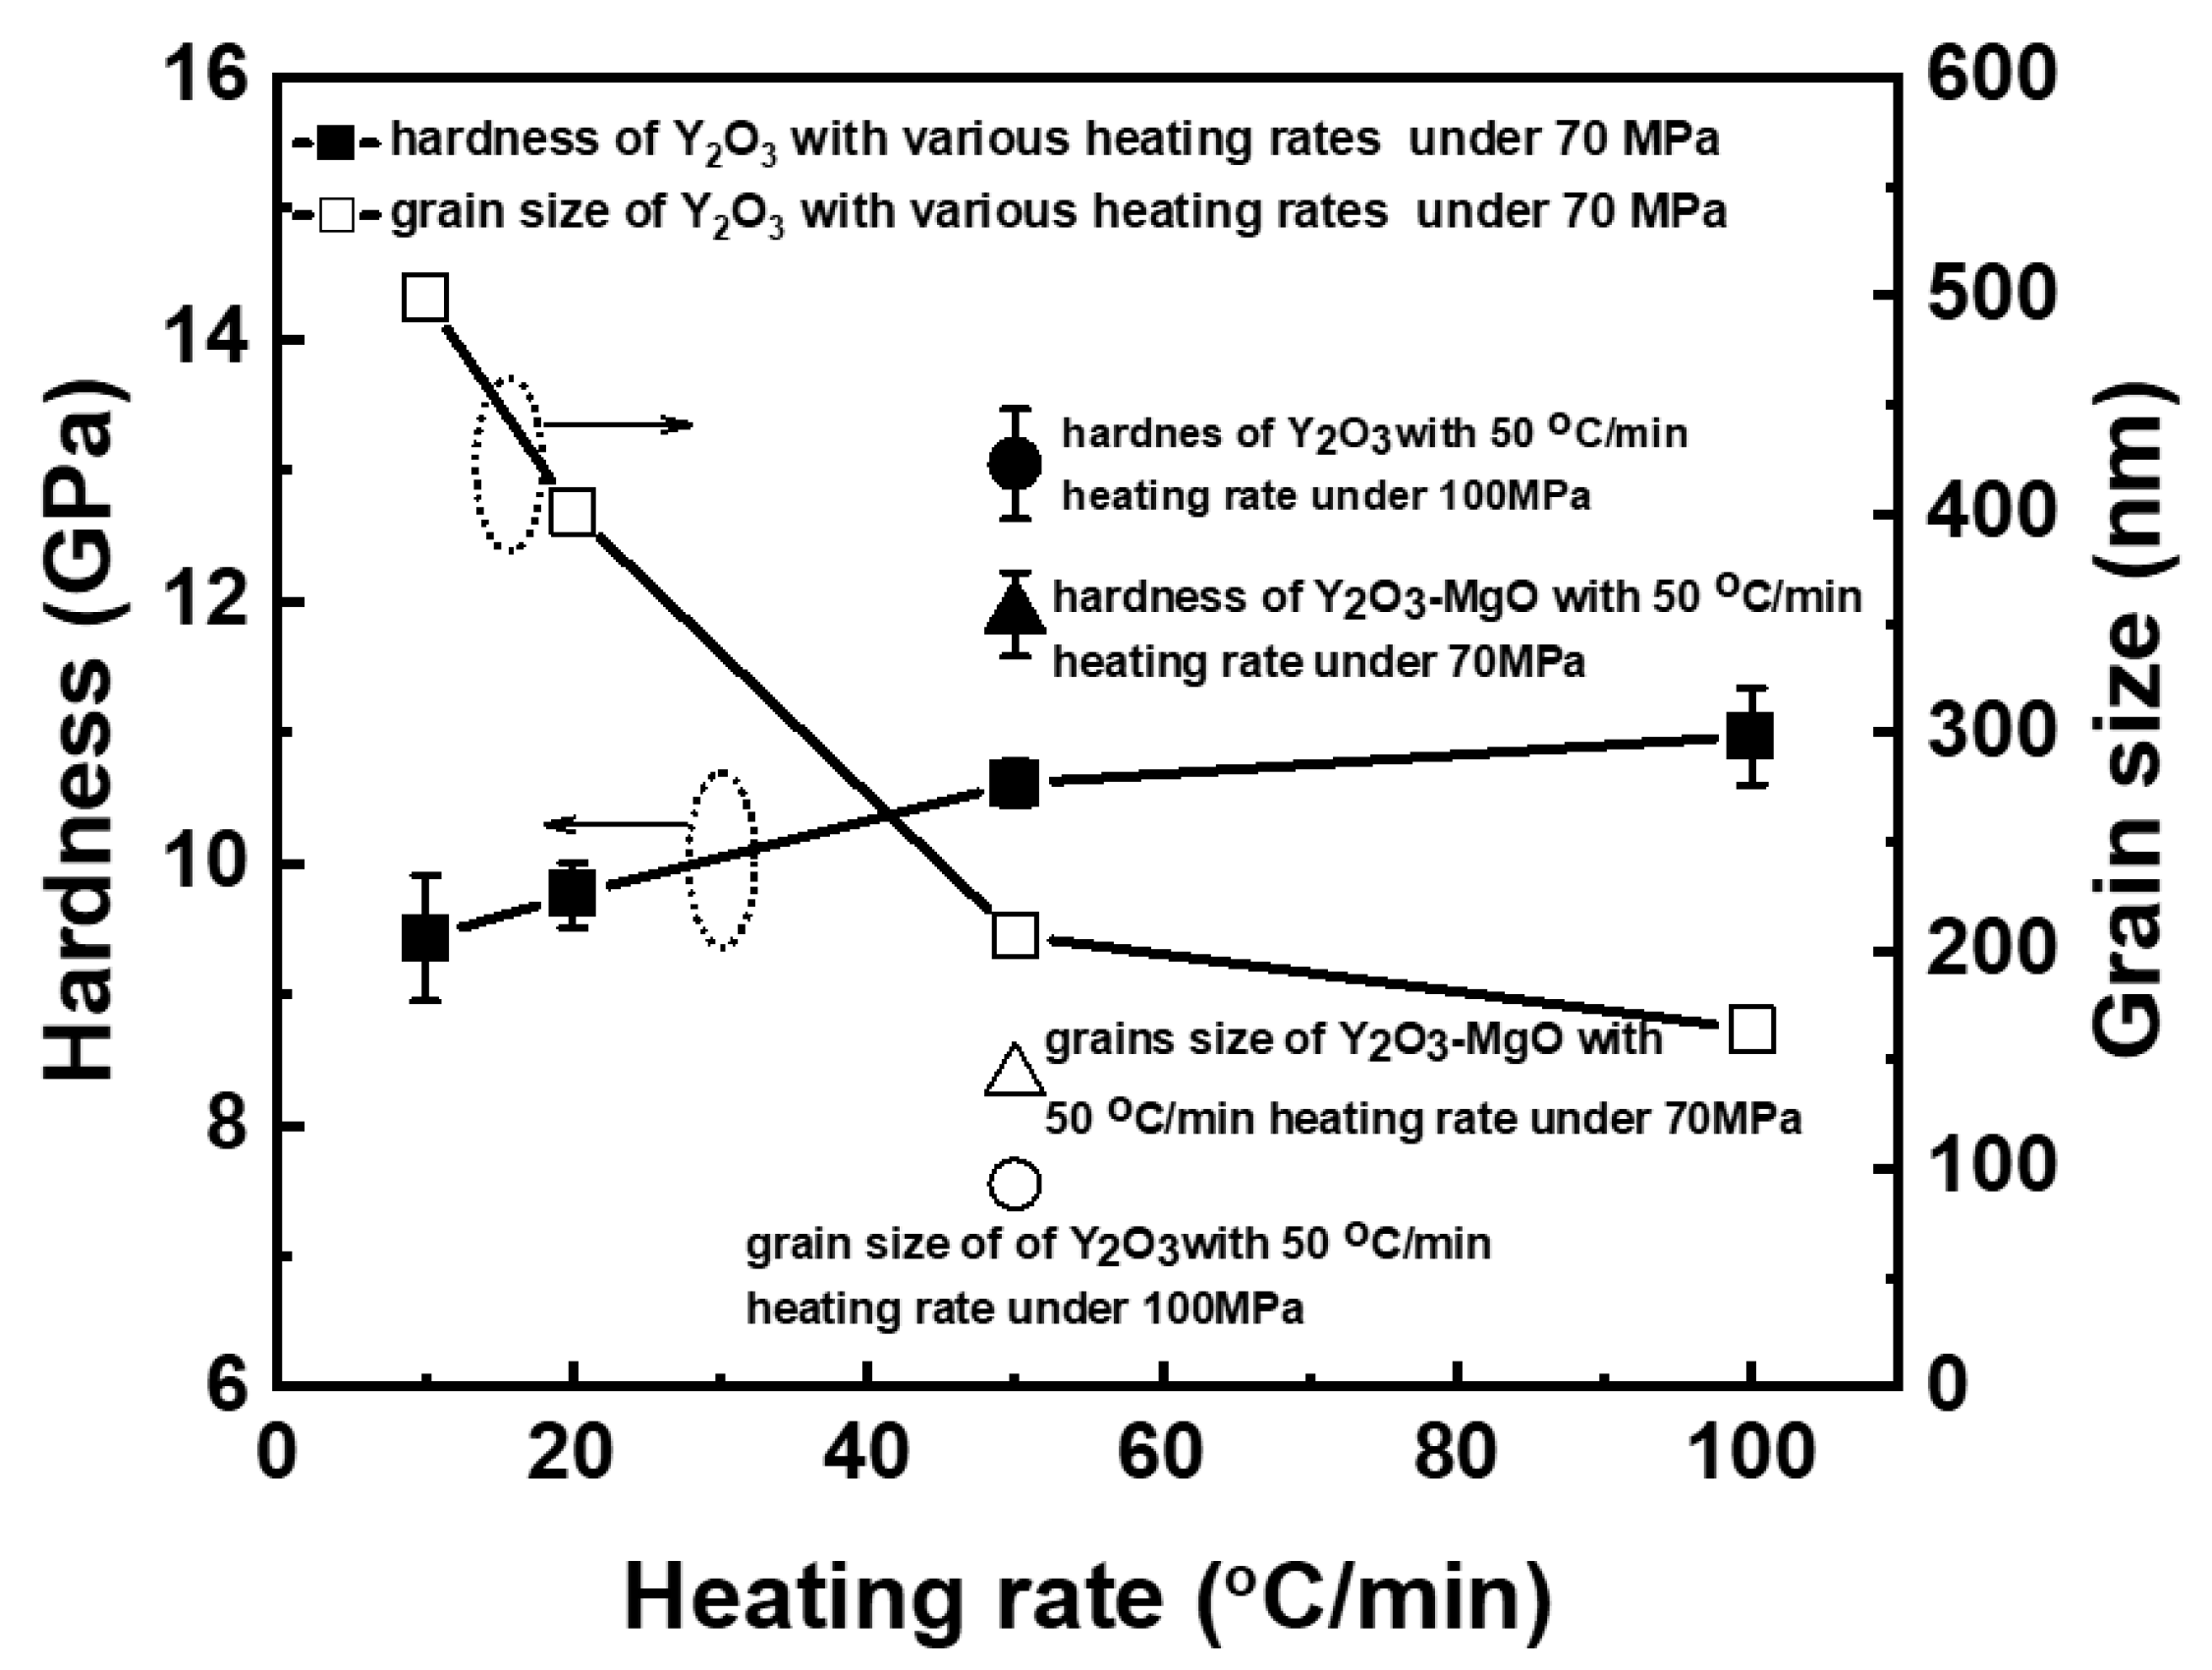
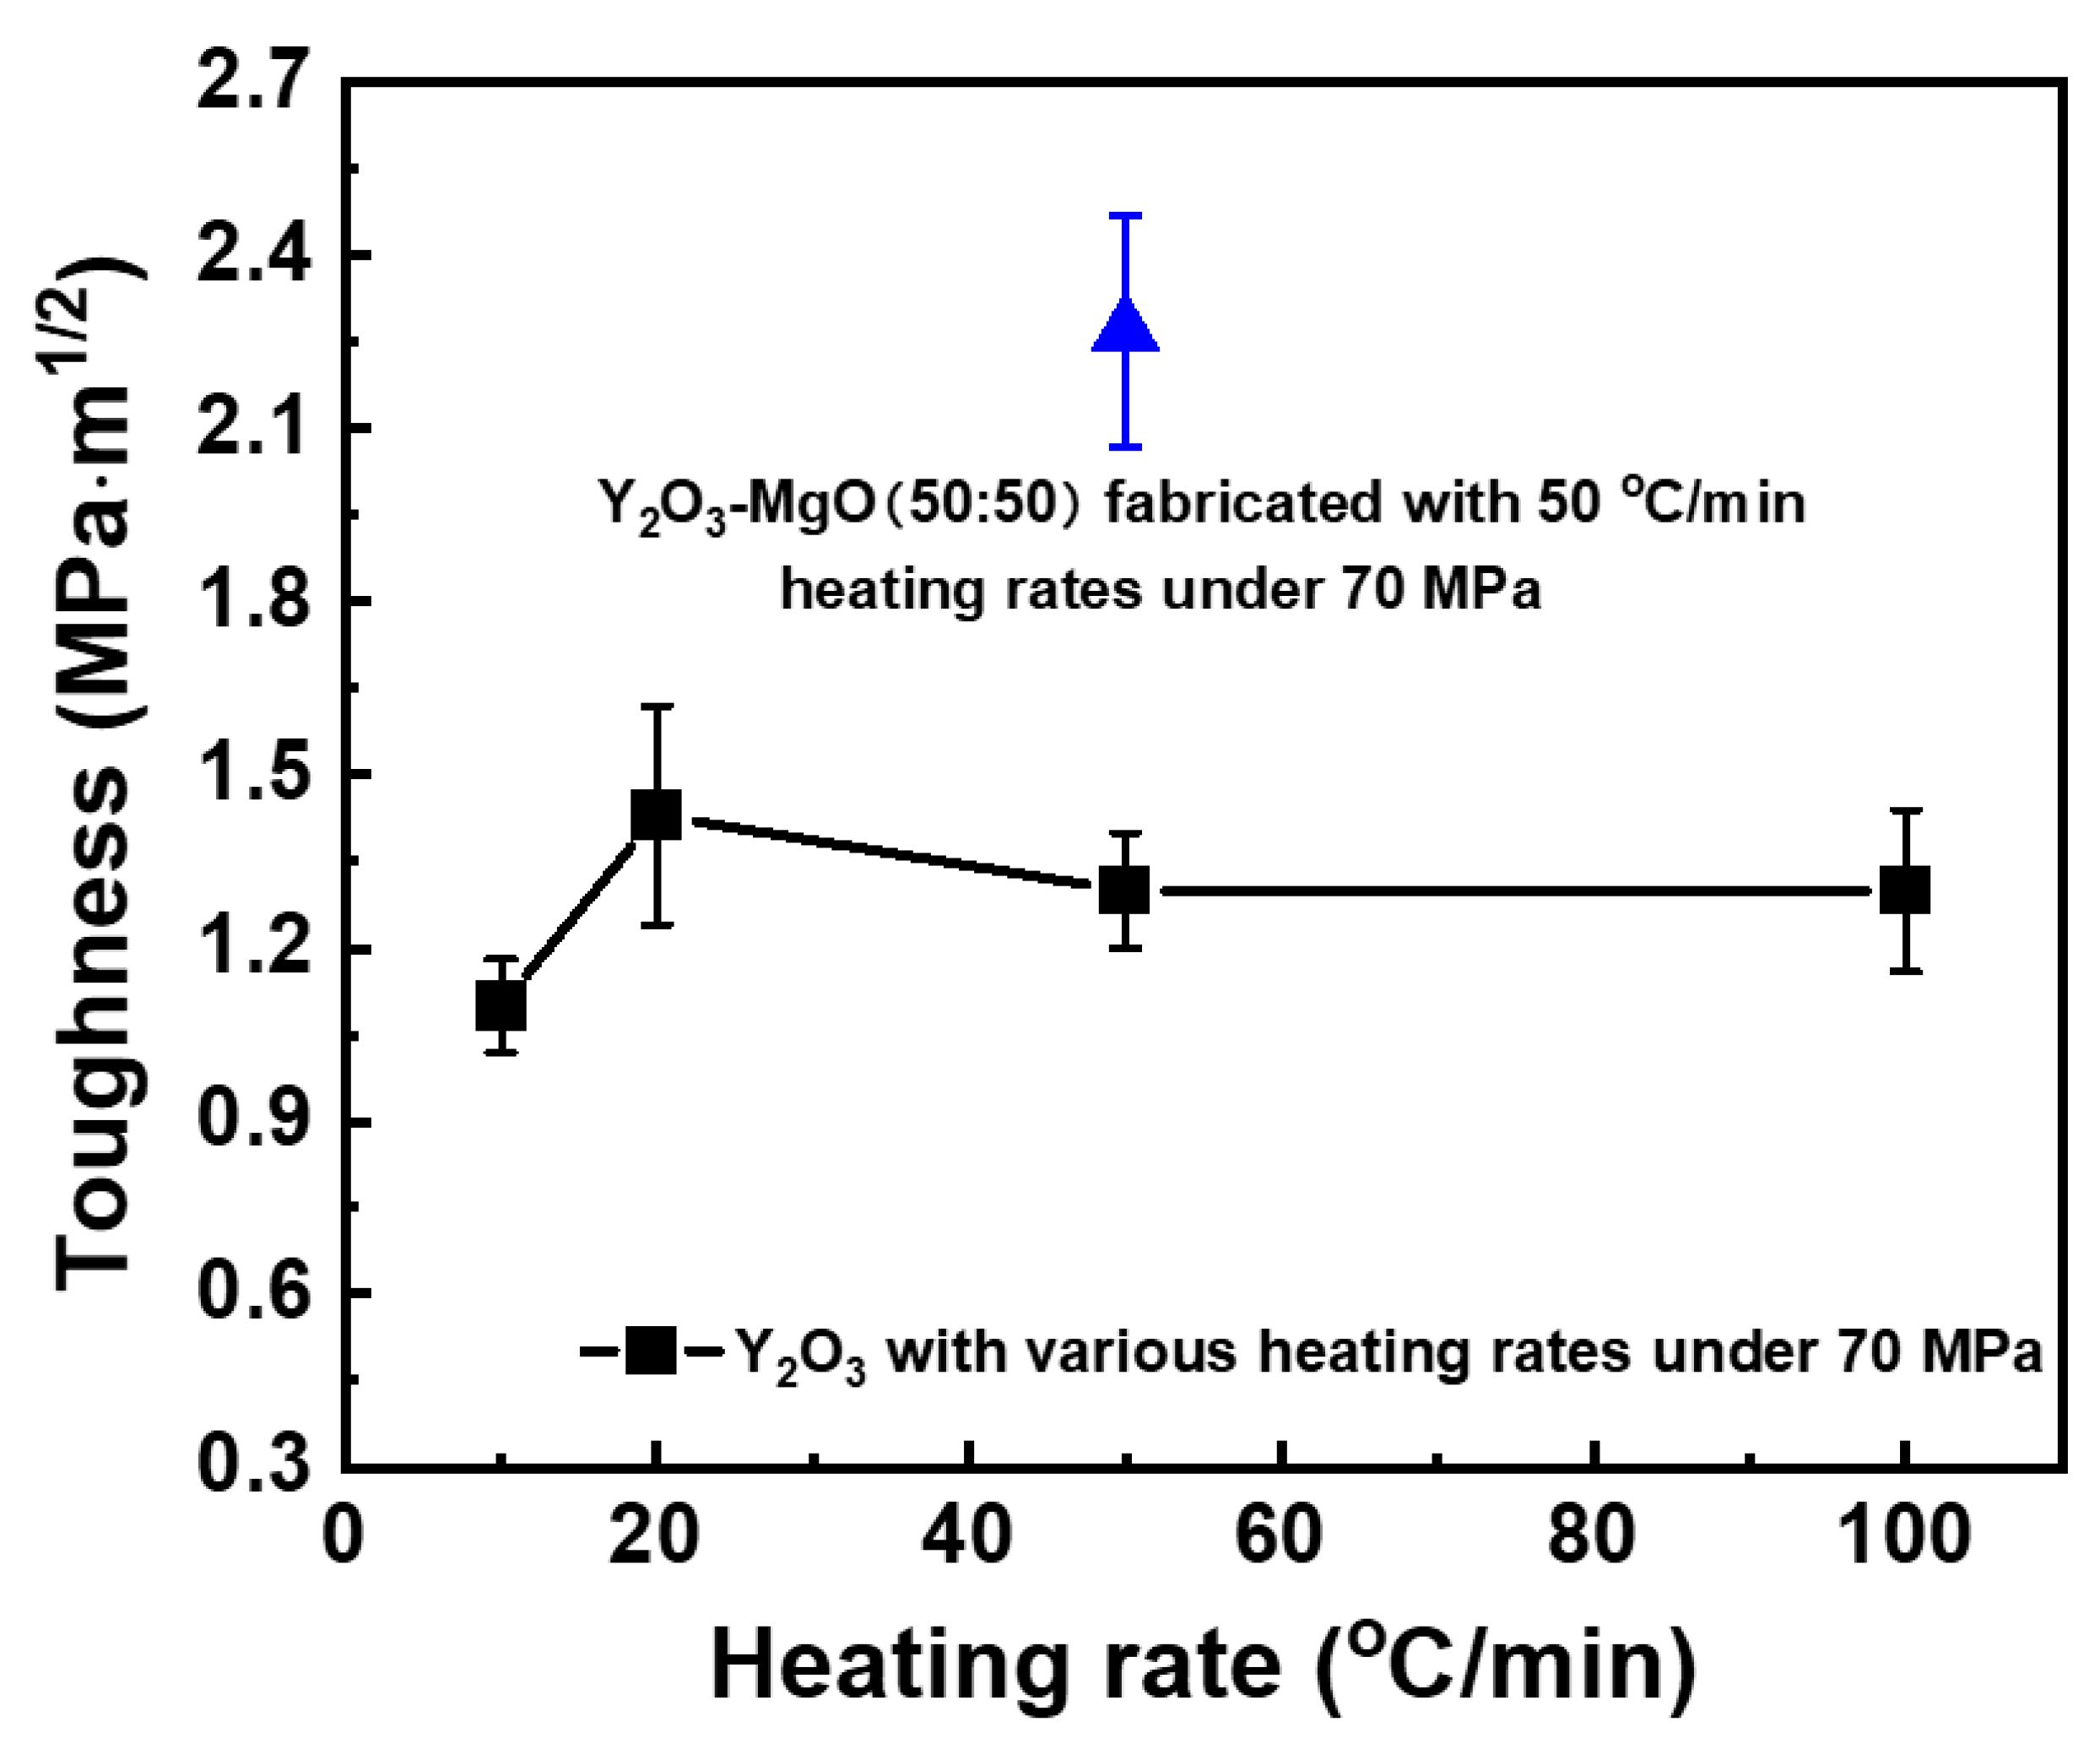
3.3. Mechanical Properties

The Vickers hardness Hv and the grain size of the Y2O3 ceramics are presented in Figure 10 as a function of the heating rate. For comparison, Hv and the grain sizes of the Y2O3-MgO nanocomposite sintered at 1250 °C under 70 MPa [34] and Y2O3 ceramic fabricated at 1130 °C under 100 MPa are also shown by the triangles and the circles in Figure 10, respectively. The measurement results show that as the heating rate increases, the hardness increases and the grain size tends to decrease; Hv increases from 9.4 GPa to 11.0 GPa accompanied with the decrease in the grain size from 499 nm at 10 °C/min to 164 nm at 100 °C/min. For the Y2O3 ceramic sintered at a higher pressure of 100 MPa, the hardness (13.1GPa) is much higher than that (11.0 GPa) of the sample sintered at the low pressure of 70 MPa owing to its smaller grain size of 74 nm. These results suggest that the hardness is relating closely to the microstructure of the materials; that is, the increasing hardness would be related to the reduction of the grain size. On the other hand, it shows a slightly higher hardness of 11.9 GPa for the Y2O3-MgO composite sample fabricated at the same temperature of 1250 °C and the pressure of 70 MPa, suggesting that the hardness is likely to follow the mixture rule at the sub-micro grain range as well.
Recently, the grain size dependent hardness has been reported in the nano-grained monolithic ceramics and nanocomposite, such as MgAl2O4, ZrO2, Al2O3 and Y2O3-MgO [34,35,36,37]. Reducing the grain size of these ceramics can significantly increase strength and hardness and this phenomenon can be described by the Hall-Petch relationship [35,38,39,40,41,42]. The hardness value of the Y2O3 obtained in this work are replotted in Figure 11 following the Hall–Petch formula,
H v = H 0 + k d
where H0 is the intrinsic hardness dependent on frictional lattice resistance to dislocation motion, k is the material-specific strengthening coefficient and d is the average grain size. For comparison, the data reported in our previous works [34,43] in the Y2O3-MgO composites and the reported Y2O3 data in the literatures [26,44,45] are also plotted by the open and closed symbols, respectively. As shown in Figure 11, although the data scatter slightly, the trend of Hv-values monotonously increases by decreasing the grain size for the Y2O3 samples. The present data show a single linear dependence and fit well with the Hall–Petch relationship. The Hall–Petch behavior has already been reported in the Y2O3-MgO composites in our previous work as shown by the open symbols in Figure 11. The slope of the Y2O3 data (black line) was identical to that of the Y2O3-MgO composite results (blue line). Furthermore, the slightly higher hardness for the Y2O3-MgO composites than those of the monolithic Y2O3 indicates that the general trend follows the mixture rule very well owing to the much higher hardness in the MgO polycrystals than in the Y2O3 polycrystals. The Hall–Petch behavior apparently indicates that the reduction of the grain size to the nano scale, which attained by optimizing the powder and sintering processes, is effectively contributed to the enhancement of the mechanical properties of the Y2O3 ceramics.
In contrast to the hardness, the fracture toughness KIC in Figure 12 takes almost the similar value ranging from 1.1 ± 0.08 to 1.43 ± 0.19 MPa·m1/2 and the effect of grain size is not remarkable. This trend is similar to the results reported for the fine-grained ceramics. [46,47,48] The crack bridging and branching have generally been explained as to be the primary source of toughening mechanisms. According to our previous study, [34] however, when the grain size decreases to several hundred nanometers or a few micrometers, the bridging mechanism does not work as an effective toughening mechanism and the fracture toughness takes almost the same value to the intrinsic material toughness. If this is also the case for the present samples, the toughness would be independent of the grain size also in the monolithic Y2O3 even in the smaller grain size of ≈150 nm.
For comparison, KIC of the Y2O3-MgO nanocomposites with Y2O3:MgO = 50:50 reported in our previous work [34] is also given by the triangle in Figure 12. It is noted that the toughness of the Y2O3-MgO nanocomposite is much higher than that of the monolithic Y2O3 and can be explained by the mixture rule because the toughness of the monolithic MgO is slightly larger than that of Y2O3 [49,50,51].
Accordingly, the optimizing the SPS condition, for example optimizing the heating rate, can improve the sinterability of the ball milled Y2O3 powders. This is beneficial to obtain fully dense fine-grained Y2O3 ceramics with the enhanced optical and mechanical properties. Although the effect of reduced grain size is not remarkable on the toughness, it is confirmed to be effective for improving the hardness, which is comparable to that of Y2O3-MgO composites.

4. Conclusions

High transparent and full-density Y2O3 ceramics were successfully fabricated using the ball milled nanopowders and followed by the SPS technique with various heating rates. With increasing the heating rate, the grain growth was limited accordingly from 499 nm at a slow heating rate of 10 °C/min to 164 nm at a high heating rate of 100 °C/min. The in-line transmittance efficiency Tin gradually increase and exhibit about 46, 49, 64 and 66% at 700 nm for each sample fabricated with the heating rates of 10, 20, 50 and 100 °C/min, respectively. The Tin for the sample sintered by SPS at the high heating rate of 100 °C/min was comparable to the value (68%) reported from the sample fabricated by high pressure SPS technique. With increasing the heating rate from 10 °C/min to 100 °C/min, Hv increases from 9.4 GPa to 11.0 GPa due to the reduction of the grain size from 499 nm to 164 nm. The enhanced hardness can be interpreted by the Hall-Petch relation as a function of the grain size. On the other hand, KIC takes a similar value and the effect of grain size is not remarkable.

Author Contributions

Conceptualization and methodology, L.L. and K.M.; validation, K.M., T.S.S. and B.-N.K.; formal analysis, L.L.; investigation, L.L.; resources, K.M., T.S.S. and B.-N.K.; data curation, L.L. and K.M.; writing—original draft preparation, L.L.; writing—review and editing, K.M.; supervision, K.M.; project administration, K.M. and T.S.S.; funding acquisition, K.M., T.S.S. and B.-N.K.; All authors have read and agreed to the published version of the manuscript.

Funding

This research was funded by Innovative Science and Technology Initiative for Security, ATLA, Japan, grant number No. JPJ004596.

Institutional Review Board Statement

Not applicable.

Informed Consent Statement

Not applicable.

Data Availability Statement

Not applicable.

Acknowledgments

The authors appreciate to the assistance from Nakazato K. for providing machine for hardness measurement.

Conflicts of Interest

The authors declare no conflict of interest.

References

  1. Yan, D.; Xu, X.; Lu, H.; Wang, Y.; Liu, P.; Zhang, J. Fabrication and properties of Y2O3 transparent ceramic by sintering aid combinations. Ceram. Int. 2016, 42, 16640–16643. [Google Scholar] [CrossRef]
  2. Wang, Z.; Zhang, L.; Yang, H.; Zhang, J.; Wang, L.; Zhang, Q. High optical quality Y2O3 transparent ceramics with fine grain size fabricated by low temperature air pre-sintering and post-HIP treatment. Ceram. Int. 2016, 42, 4238–4245. [Google Scholar] [CrossRef]
  3. Gan, L.; Park, Y.-J.; Kim, H.; Kim, J.-M.; Ko, J.-W.; Lee, J.-W. Effects of pre-sintering and annealing on the optical transmittance of Zr-doped Y2O3 transparent ceramics fabricated by vacuum sintering conjugated with post-hot-isostatic pressing. Ceram. Int. 2015, 41, 9622–9627. [Google Scholar] [CrossRef]
  4. Huang, X.; Zhang, X.; Hu, Z.; Feng, Y.; Wei, J.; Liu, X.; Li, X.; Chen, H.; Wu, L.; Pan, H.; et al. Fabrication of Y2O3 transparent ceramics by hot isostatic pressing from precipitated nanopowders. Opt. Mater. 2019, 92, 359–365. [Google Scholar] [CrossRef]
  5. Chaim, R.; Shlayer, A.; Estournes, C. Densification of nanocrystalline Y2O3 ceramic powder by spark plasma sintering. J. Eur. Ceram. Soc. 2009, 29, 91–98. [Google Scholar] [CrossRef] [Green Version]
  6. Brown, E.E.; Hömmerich, U.; Bluiett, A.; Kucera, C.; Ballato, J.; Trivedi, S. Near-Infrared and Upconversion Luminescence in Er:Y2O3 Ceramics under 1.5 μm Excitation. J. Am. Ceram. Soc. 2014, 97, 2105–2110. [Google Scholar] [CrossRef]
  7. Dutta, S.; Gazza, G. Transparent Y2O3 by hot-pressing. Mater. Res. Bull. 1969, 4, 791–796. [Google Scholar] [CrossRef]
  8. Wang, J.; Ma, J.; Zhang, J.; Liu, P.; Luo, D.; Yin, D.; Tang, D.; Kong, L.B. Yb:Y2O3 transparent ceramics processed with hot isostatic pressing. Opt. Mater. 2017, 71, 117–120. [Google Scholar] [CrossRef]
  9. Zhang, L.; Pan, W. Structural and Thermo-Mechanical Properties of Nd: Y2O3 Transparent Ceramics. J. Am. Ceram. Soc. 2015, 98, 3326–3331. [Google Scholar] [CrossRef]
  10. Chaim, R. Densification mechanisms in spark plasma sintering of nanocrystalline ceramics. Mater. Sci. Eng. A 2007, 443, 25–32. [Google Scholar] [CrossRef]
  11. Morita, K.; Kim, B.-N.; Yoshida, H.; Hiraga, K. Densification behavior of a fine-grained MgAl2O4 spinel during spark plasma sintering (SPS). Scr. Mater. 2010, 63, 565–568. [Google Scholar] [CrossRef]
  12. Jiang, N.; Xie, R.-J.; Liu, Q.; Li, J. Fabrication of sub-micrometer MgO transparent ceramics by spark plasma sintering. J. Eur. Ceram. Soc. 2017, 37, 4947–4953. [Google Scholar] [CrossRef]
  13. Chaim, R.; Chevallier, G.; Weibel, A.; Estournès, C. Grain growth during spark plasma and flash sintering of ceramic nanoparticles: A review. J. Mater. Sci. 2018, 53, 3087–3105. [Google Scholar] [CrossRef] [Green Version]
  14. Mukhopadhyay, A.; Basu, B. Consolidation–microstructure–property relationships in bulk nanoceramics and ceramic nanocomposites: A review. Int. Mater. Rev. 2007, 52, 257–288. [Google Scholar] [CrossRef]
  15. Jiang, D.T.; Hulbert, D.M.; Anselmi-Tamburini, U.; Land, T.; Ng, D.; Mukherjee, A.K. Optically transparent polycrystalline Al2O3 produced by spark plasma sintering. J. Am. Ceram. Soc. 2008, 91, 151–154. [Google Scholar] [CrossRef]
  16. Kosyanov, D.Y.; Yavetskiy, R.P.; Vorona, I.O.; Shichalin, O.O.; Papynov, E.K.; Vornovskikh, A.A.; Kuryavyi, V.G.; Vovna, V.I.; Golokhvast, K.S.; Tolmachev, A.V. Transparent 4 at% Nd3+: Y3Al5O12 ceramic by reactive spark plasma sintering. In AIP Conference Proceedings; AIP Publishing LLC: New York, NY, USA, 2017; Volume 1874, p. 040020. [Google Scholar]
  17. Chaim, R.; Margulis, M. Densification maps for spark plasma sintering of nanocrystalline MgO ceramics. Mater. Sci. Eng. A 2005, 407, 180–187. [Google Scholar] [CrossRef]
  18. Morita, K.J.; Kim, B.-N.; Yoshida, H.; Hiraga, K.; Sakka, Y. Influence of spark plasma sintering (SPS) conditions on transmission of MgAl2O4 spinel. J. Am. Ceram. Soc. 2015, 98, 378–385. [Google Scholar] [CrossRef]
  19. Morita, K.; Hiraga, K.; Kim, B.N.; Yoshida, H.; Sakka, Y. Fabrication of Nanocrystalline Superplastic ZrO2 Ceramics. Mater. Sci. Forum 2007, 551, 491–496. [Google Scholar] [CrossRef]
  20. Hiroaki, F.; Nakasawa, S.; Yoshida, H.; Morita, K.J.; Suzuki, T.S.; Kim, B.-N.; Sakka, Y.; Hiraga, K. Transparent ultrafine Yb3+: Y2O3 laser ceramics fabricated by spark plasma sintering. J. Am. Ceram. Soc. 2018, 101, 694–702. [Google Scholar]
  21. Marder, R.; Chaim, R.; Estournès, C. Grain growth stagnation in fully dense nanocrystalline Y2O3 by spark plasma sintering. Mater. Sci. Eng. A 2010, 527, 1577–1585. [Google Scholar] [CrossRef] [Green Version]
  22. Korkmaz, E.; Sahin, F. Fabrication of Transparent Yttria Ceramics by Spark Plasma Sintering. Acta Phys. Pol. A 2017, 131, 460–462. [Google Scholar] [CrossRef]
  23. Park, C.W.; Lee, J.H.; Kang, S.H.; Park, J.H.; Kim, H.M.; Kang, H.S.; Lee, H.; Lee, J.H.; Shim, K.B. Characteristics of Y2O3 transparent ceramics rapidly processed using spark plasma sintering. J. Ceram. Process. Res. 2017, 18, 183–187. [Google Scholar]
  24. Zhang, H.; Kim, B.-N.; Morita, K.J.; Yoshida, H.; Hiraga, K.; Sakka, Y. Fabrication of transparent yttria by high-pressure spark plasma sintering. J. Am. Ceram. Soc. 2011, 94, 3206–3210. [Google Scholar] [CrossRef]
  25. Yoshida, H.; Morita, K.J.; Kim, B.-N.; Hiraga, K.; Yamanaka, K.; Soga, K.; Yamamoto, T. Low-temperature spark plasma sintering of yttria ceramics with ultrafine grain size. J. Am. Ceram. Soc. 2011, 94, 3301–3307. [Google Scholar] [CrossRef]
  26. Ahmadi, B.; Reza, S.R.; Ahsanzadeh-Vadeqani, M.; Barekat, M. Mechanical and optical properties of spark plasma sintered transparent Y2O3 ceramics. Ceram. Int. 2016, 42, 17081–17088. [Google Scholar] [CrossRef]
  27. Yeung, J.; Keong, L.C. Hardness Measurement of Copper Bonding Wire. Procedia Eng. 2014, 75, 134–139. [Google Scholar] [CrossRef] [Green Version]
  28. Evans, A.G.; Charles, E.A. Fracture Toughness Determinations by Indentation. J. Am. Ceram. Soc. 1976, 59, 371–372. [Google Scholar] [CrossRef]
  29. Tallan, N.M.; Vest, R.W. Electrical Properties and Defect Structure of Y2O3. J. Am. Ceram. Soc. 1966, 49, 401–404. [Google Scholar] [CrossRef]
  30. Norby, T.; Kofstad, P. Electrical Conductivity and Defect Structure of Y2O3as a Function of Water Vapor Pressure. J. Am. Ceram. Soc. 1984, 67, 786–792. [Google Scholar] [CrossRef]
  31. Zhang, H.B.; Kim, B.N.; Morita, K.; Hiraga, K.; Sakka, Y. Effect of sintering temperature on optical properties and microstructure of translucent zirconia prepared by high-pressure spark plasma sintering. Sci. Tech. Adv. Mater. 2011, 12, 055003. [Google Scholar] [CrossRef]
  32. Jiang, D.; Mukherjee, A.K. Spark Plasma Sintering of an Infrared-Transparent Y2O3-MgO Nanocomposite. J. Am. Ceram. Soc. 2009, 93, 769–773. [Google Scholar] [CrossRef]
  33. Mouzon, J.; Maître, A.; Frisk, L.; Lehto, N.; Odén, M. Fabrication of transparent yttria by HIP and the glass-encapsulation method. J. Eur. Ceram. Soc. 2009, 29, 311–316. [Google Scholar] [CrossRef]
  34. Liu, L.; Morita, K.; Suzuki, T.S.; Kim, B.-N. Evolution of microstructure, mechanical, and optical properties of Y2O3-MgO nanocomposites fabricated by high pressure spark plasma sintering. J. Eur. Ceram. Soc. 2020, 40, 4547–4555. [Google Scholar] [CrossRef]
  35. Sokol, M.; Halabi, M.; Kalabukhov, S.; Frage, N. Nano-structured MgAl2O4 spinel consolidated by high pressure spark plasma sintering (HPSPS). J. Eur. Ceram. Soc. 2017, 37, 755–762. [Google Scholar] [CrossRef]
  36. Vasylkiv, O.; Sakka, Y.; Skorokhod, V.V. Low-Temperature Processing and Mechanical Properties of Zirconia and Zirconia-Alumina Nanoceramics. J. Am. Ceram. Soc. 2003, 86, 299–304. [Google Scholar] [CrossRef]
  37. Krell, A.; Blank, P. Grain Size Dependence of Hardness in Dense Submicrometer Alumina. J. Am. Ceram. Soc. 1995, 78, 1118–1120. [Google Scholar] [CrossRef]
  38. Liu, W.; Wu, Y.; He, J.; Nieh, T.; Lu, Z. Grain growth and the Hall–Petch relationship in a high-entropy FeCrNiCoMn alloy. Scr. Mater. 2013, 68, 526–529. [Google Scholar] [CrossRef]
  39. Carsley, J.E.; Fisher, A.; Milligan, W.W.; Aifantis, E.C. Mechanical behavior of a bulk nanostructured iron alloy. Met. Mater. Trans. A 1998, 29, 2261–2271. [Google Scholar] [CrossRef]
  40. Moshtaghioun, B.M.; Diego, G.-G.; Arturo, D.-R.; Richard, I.T. Grain size dependence of hardness and fracture toughness in pure near fully-dense boron carbide ceramics. J. Eur. Ceram. Soc. 2016, 36, 1829–1834. [Google Scholar] [CrossRef]
  41. Rice, R.W.; Wu, C.C.; Boichelt, F. Hardness-Grain-Size Relations in Ceramics. J. Am. Ceram. Soc. 1994, 77, 2539–2553. [Google Scholar] [CrossRef]
  42. Wollmershauser, J.A.; Feigelson, B.N.; Gorzkowski, E.P.; Ellis, C.T.; Goswami, R.; Qadri, S.B.; Tischler, J.G.; Kub, F.J.; Everett, R.K. An extended hardness limit in bulk nanoceramics. Acta Mater. 2014, 69, 9–16. [Google Scholar] [CrossRef]
  43. Liu, L.; Morita, K.; Suzuki, T.S.; Kim, B.-N. Effect of volume ratio on optical and mechanical properties of Y2O3-MgO composites fabricated by spark-plasma-sintering process. J. Eur. Ceram. Soc. 2021, 41, 2096–2105. [Google Scholar] [CrossRef]
  44. Tani, T.; Miyamoto, Y.; Koizumi, M.; Shimada, M. Grain size dependences of vickers microhardness and fracture toughness in Al2O3 and Y2O3 ceramics. Ceram. Int. 1986, 12, 33–37. [Google Scholar] [CrossRef]
  45. An, L.; Ito, A.; Goto, T. Transparent yttria produced by spark plasma sintering at moderate temperature and pressure profiles. J. Eur. Ceram. Soc. 2012, 32, 1035–1040. [Google Scholar] [CrossRef]
  46. Ma, H.J.; Jung, W.K.; Baek, C.; Kim, D.K. Influence of microstructure control on optical and mechanical properties of infrared transparent Y2O3-MgO nanocomposite. J. Eur. Ceram. Soc. 2017, 37, 4902–4911. [Google Scholar] [CrossRef]
  47. Yao, W.; Liu, J.; Holland, T.B.; Huang, L.; Xiong, Y.; Schoenung, J.M.; Mukherjee, A.K. Grain size dependence of fracture toughness for fine grained alumina. Scr. Mater. 2011, 65, 143–146. [Google Scholar] [CrossRef]
  48. Huang, L.; Yao, W.; Liu, J.; Mukherjee, A.K.; Schoenung, J.M. Spark plasma sintering and mechanical behavior of magnesia–yttria (50:50vol.%) nanocomposites. Scr. Mater. 2014, 75, 18–21. [Google Scholar] [CrossRef]
  49. AZO Materials. Magnesia-magnesium Oxide (MgO) Properties & Applications. Available online: https://www.azom.com/properties.aspx?ArticleID=54 (accessed on 10 November 2020).
  50. Zhu, L.-L.; Park, Y.-J.; Gan, L.; Kim, H.-N.; Ko, J.-W.; Kim, H.-D. Fabrication of transparent Y2O3 ceramics with record-high thermal shock resistance. J. Eur. Ceram. Soc. 2018, 38, 4050–4056. [Google Scholar] [CrossRef]
  51. Conner, C.L.; Faber, K.T. Segregant-enhanced fracture in magnesium oxide. J. Mater. Sci. 1990, 25, 2737–2742. [Google Scholar] [CrossRef]
Figure 1. XRD patterns of Y2O3 nanopowders with and without ball milling and the ceramic after SPS processing at 1250 °C.
Ceramics 04 00006 g001
Figure 2. Microstructures of the Y2O3 ceramics fabricated with various heating rate; low magnification images of the samples fabricated at (a) 10 and (b) 100 °C/min, and high magnification images of the samples fabricated at (c) 10, (d) 20, (e) 50 and (f) 100 °C/min.
Ceramics 04 00006 g002
Figure 3. The photos of the sintered monolithic Y2O3 ceramics fabricated from (a) as-received and (b) ball milled nanopowders, respectively.
Ceramics 04 00006 g003
Figure 4. (a) Bright field (BF) and (b) high-resolution (HR) TEM images of the as-received Y2O3 powder. Selected area diffraction (SAD) pattern taken from the general area was inserted in (a).
Ceramics 04 00006 g004
Figure 5. (a) BF-TEM and SAD pattern of the ball-milled Y2O3 powder. (b) Magnified BF- and HR-TEM images of the plate-like particle. (c) EDS spectra taken from (a).
Ceramics 04 00006 g005
Figure 6. (a) Sintering temperature T and punch displacement L as functions of the processing time t, (b) densification rate (dL/dt) as a function of the sintering temperature T for the samples fabricated from the ball milled nanopowders under the conductive and insulation SPS set-up conditions; that is, for the conductive set-up, the both sides of the loaded powders were sandwiched by the electrical conductive graphite papers, whereas for the insulative set-up, those were sandwiched by the electrical insulator BN coating.
Ceramics 04 00006 g006
Figure 7. Heating rate dependent DC power during the SPS processing of the Y2O3 ceramics at 10 and 100 °C/min.
Ceramics 04 00006 g007
Figure 8. Typical optical properties of the Y2O3 with the various heating rates; (a) in-line and (b) total-forward transmittance spectra, Tin and Ttotal, at the wavelength range of λ = 0.2–1.6 μm, and (c) the comparation of Tin and Ttotal for the samples sintered at 10 and 100 °C/min.
Ceramics 04 00006 g008
Figure 9. (a). The scattering coefficients γ s c a as a function of λ and (b) the dependence of scattering coefficient on the wavelength to the minus fifth power (λ−4) for the Y2O3 with various heating rates.
Ceramics 04 00006 g009
Figure 10. Heating rate dependent Vickers hardness Hv and grain size of the Y2O3 ceramics. For comparison, Hv and grain size of the Y2O3-MgO nanocomposite sintered at 1250 °C under 70 MPa (triangles) [34] and Y2O3 ceramic fabricated at 1130 °C under 100 MPa (circles) are also given, respectively.
Ceramics 04 00006 g010
Figure 11. Hall-Petch plot of the Y2O3 with the data from this work and literatures [26] and the plot of Y2O3-MgO nanocomposites with data reported in our previous works. [34,43].
Ceramics 04 00006 g011
Figure 12. The fracture toughness KIC plotted as a function of the heating rate. For comparison, KIC of the Y2O3-MgO nanocomposites reported in our previous work (triangle) [34] is also given.
Ceramics 04 00006 g012
Publisher’s Note: MDPI stays neutral with regard to jurisdictional claims in published maps and institutional affiliations.

