
Prediction of Sodium Substitution Sites in Octacalcium Phosphate: The Relationships of Ionic Pair Ratios in Reacting Solutions


Health and Medical Research Institute, National Institute of Advanced Industrial Science and Technology (AIST), 2217-14 Hayashi-cho, Takamatsu 761-0395, Japan
*
Author to whom correspondence should be addressed.
Ceramics 2021, 4(2), 240-248; https://0-doi-org.brum.beds.ac.uk/10.3390/ceramics4020018
Submission received: 2 April 2021
/
Revised: 12 May 2021
/
Accepted: 15 May 2021
/
Published: 18 May 2021
(This article belongs to the Special Issue Advances in Ceramics)
Abstract
:Octacalcium phosphate (OCP) is widely used in biomaterial fabrication by virtue of its unique crystal structure and low environmental loading. Although various ion and molecule substitution methods into the OCP unit lattice have been introduced, it remains unclear which factors and mechanisms dominate the substitution process. Experimental studies have indicated that Na alkali metal ions are substituted at the P3 PO4 conjugated site in acidic to weakly acidic conditions and the P5 PO4 conjugated site in neutral to weak basic conditions. Ionic species calculation methods have indicated that the pair ratios of Na and HPO42− (NaHPO4−) are small in acidic reacting solutions but large under weakly basic conditions. Consequently, the roles played by NaHPO4− and ionic pair formation processes are thought to dominate ion and molecule substitution into the OCP unit lattice. Such ionic pair formation strongly inhibits dicarboxylic acid substitution into the OCP unit lattice due to the replacement of the Ca ion, which conjugates P5 PO4 as an anchor of dicarboxylic acid.
1. Introduction
Calcium phosphates constitute a diverse group of minerals that play important roles in geology and biology [1,2,3]. Among these minerals, some are constituent of bones and teeth and are thus closely related to hard tissue health and diseases [4,5]. They are also essential components in fertilizer, food additives, and other engineering aspects while constituting an important part of the phosphate cycle at the Earth’s surface [1,6]. Octacalcium phosphate (OCP: Ca8H2(PO4)6·5H2O), a major inorganic component of immature bone, has received much attention for its excellent biocompatibility and the ability to substitute various ions and molecules whose properties could be applied to green and low-toxicity drug delivery systems (DDS) and combination medical products [7,8,9]. In addition, the substitute ions and molecules in the OCP unit lattice could be controlled by radiation processes [10]. Therefore, OCP has been attracting attention from radiation medicine as novel DDS devices.
OCP are mainly synthesized via hydrolysis in solution [11,12,13,14]. During this process, co-existing ions and molecules present in the ambient fluid are substituted into the OCP unit lattice. Previous studies have indicated that metal ions [7,15,16,17], cationic molecules [18], ammonium ions [19] and dicarboxylic molecules [20,21,22,23] could substitute within the interlayer of the OCP unit lattice. Although the sizes of substituted ions and molecules have been extensively investigated, it remains unclear which factors, such as pH and co-existing ions, control their substitution.
For OCP synthesis, three processes have been identified based on the initial pH conditions: an acidic solution with a pH increasing process, a weak acidic solution with a titrate pH process, and a weak basic solution with a pH decreasing process [12,14,15,16].
Although it has been suggested that ionic species in reacting solutions preferentially form OCP with molecular substitution, the relationships between substitution and solution ionic species are not known. In this study, we focus on the specific substitution modes of Na into OCP, evaluating the relationships between Na ionic complexes in reacting solutions and the corresponding substitution modes into the OCP unit lattice.
2. Materials and Methods
2.1. Fabrication Methods of Na-Substituted OCP
All reagents were purchased from FUJI Film Wako Pure Chemical Inc., Japan. H3PO4, NaCl, and Na2HPO4 were diluted to 2 mol/L using distilled water. Thus, experimental solutions consisted of a 1.0 mol/L PO4 and a 2.0 mol/L Na mixture of either Na2HPO4 or H3PO4-NaCl.
In an acidic solution with increasing pH, 5.0 g of CaCO3 was immersed into 20 mL of H3PO4-NaCl solution. Following the elimination of initially formed CO2, the samples were packed and incubated at 60 °C for 1 day.
In weak basic solutions with decreasing pH, 2.39 g of dicalcium hydrogen phosphate hydrate (DCPD: CaHPO4·2H2O) was immersed into 20 mL of Na2HPO4 solution and incubated at 60 °C for 1 day.
The initial and final pH values of the solutions were measured using a pH electrode (LAQUA ToupH 9615S-10D) connected to a pH meter (Horiba Co. D-72, Kyoto, Japan). These treated samples were washed several times using distilled water and 99.5% ethanol to eliminate the residual immersion solution and were subsequently dried in an oven at 40 °C overnight.
2.2. Characterization
Crystallographic characterization of the samples was obtained via X-ray diffraction (XRD, MiniFlex600, Rigaku Co., Tokyo, Japan) at an accelerating voltage of 40 kV and an amplitude of 15 mA. The diffraction angle was continuously scanned over the 3−70° 2θ range at a scanning rate of 2°/min for characterization and over the 2−12° 2θ range at a scanning rate of 0.8°/min for crystallographic parameter analysis.
The chemical bonding structures of the samples were determined using Fourier-transform infrared spectroscopy (FT-IR, Nicolet NEXUS670, Thermo Fisher Scientific Co., Waltham, MA, USA) with a triglycine sulfate detector using the KBr method (32 scans, 2 cm−1 resolution) and using a ZnSe attenuate total reflection (ATR) prism (64 scans, 2 cm−1 resolution). Measurements were obtained in the air.
The Ca, P(PO4), and Na ion concentrations of the samples were measured using inductively coupled plasma-atomic emission spectroscopy (ICP-ES, 5110VDV, Agilent Technology Co., Tokyo, Japan) following the dissolution of the samples in 2% HNO3.
2.3. Calculation of Ionic Species in Solutions
The ionic complexes present in the reaction solutions were simulated as data inputs for speciation modeling using the PhreeqC software [24,25]. The input thermodynamic data for each ionic species and the reaction code are listed in Table 1. Briefly, each ionic species in solution was calculated at 333 K (60 °C), and 0.1 MPa with O2 contents assumed to be in equilibrium with the atmosphere. The phase diagrams of each ionic species were drawn using Microsoft Excel (Microsoft Office 365 MSO, Microsoft Co., Redmond, WA, USA).
3. Results
As described in Scheme 1, the OCP unit lattice used in these experiments consisted of eight Ca ions, four PO4 ions, two HPO4 ions, and five H2O molecules [11,28,29]. Some Ca, and PO4 ions exhibited conjugated relationships. Detecting ionic replacement of Ca ions used the vibration alternations in conjugated PO4 and HPO4 ions afforded by spectroscopic methods [28,29].
We then evaluated whether synthesis methods dominated Na substitution mode and controlled the site of the OCP unit lattice into which it substituted. We chose two methods for OCP synthesis: an acidic solution with an increasing pH and a basic solution with a decreasing pH. Both solutions contained 1 mol/L PO4 and 2 mol/L Na. Figure 1 shows the XRD patterns of the treated materials. In both methods of synthesis, the treated materials were monophasic OCP. Table 2 shows the initial and final pH values of the reacting solutions. For convenience, we denote the OCP synthesized acidic solution with increasing pH as OCP(Na) and that OCP basic solution with decreasing pH as OCP-Na. The Na contents of OCP(Na) and OCP-Na were 6.68 ± 0.21 at % and 6.83 ± 0.74 at %, respectively. There was no significance between Na contents of OCP(Na) and of OCP-Na (p = 0.39).
Spectroscopic analysis indicated Na-substituted sites as features exhibiting alternation of vibration in conjugated sites of PO4 and/or HPO4. Figure 2 and Figure S1 showed the transmitting FT-IR (KBr method) spectra, and ATR-FT-IR spectra of each OCP studied with conventional OCP provided for comparison. In OCP-Na, the P3 PO4 band of PO4 revealed v3′ PO4 mode rather than v3′ HPO4. It was indicated that the cations substituted in the conjugated site of P3 PO4 were likely to conjugate PO4 rather than HPO4. Considering the charge of cations, Ca2+ is likely to be placed into the conjugated site of P3 PO4 rather than Na+. On the other hand, in OCP(Na), the v3′ PO4 mode of the P3 PO4 band was significantly attenuated. Then, in OCP-Na, the P5 PO4 band was significantly altered relative to conventional OCP and OCP(Na). Furthermore, in ATR-FT-IR observation, unlike in the OCP and OCP(Na) cases, clearly γOH HPO4 band corresponded to hydrous layer structure around 633 cm−1 was observed. This strongly suggests that Na could be substituted into the conjugated site of P5 PO4 for OCP-Na, and into P3 PO4 for OCP(Na).
Ionic species calculation methods were used to determine the key factor for different Na substitution modes in the OCP unit lattice. The Ksp values of ions and each ionic pair are summarized in Table 1. Herein, we focused on the pH dependence of the ionic pair consisting of Na and HPO42− as NaHPO4−. NaHPO4− in the OCP unit lattice is described as having the form of Na substitution in a conjugated P5 PO4 site. Figure 3 shows the calculation results of the amount and ratio of NaHPO4− versus total Na ions as a function of pH and Na concentration. Note that, in this calculation, we used NaCl instead of Na+ due to the inherent limitations of the calculation. In addition, the pH values of each pH series were slightly altered by, at most, 0.3 between Na-0 mol/L and Na-2 mol/L (Figure S2). The concentration of NaHPO4− in solutions increased with increasing Na concentration between pH 5 and pH 10. On the other hand, below pH 5 and above pH 10, limited NaHPO4− was formed, irrespective of the Na concentration used. Other ionic species in this system exhibited the same tendency as NaHPO4− (Figure S3).
During OCP synthesis, the Ca ion is initially released into reacting solution as dissolving Ca salts. Therefore, the Ca ion effect toward NaHPO4− ratios in solution should be evaluated. Figure 4 shows the concentration and ratio of NaHPO4− as a function of Ca concentration and pH. The concentrations and ratios of NaHPO4− and other ionic pairs were almost constant with pH regardless of Ca ion concentration (Figures S4 and S5).
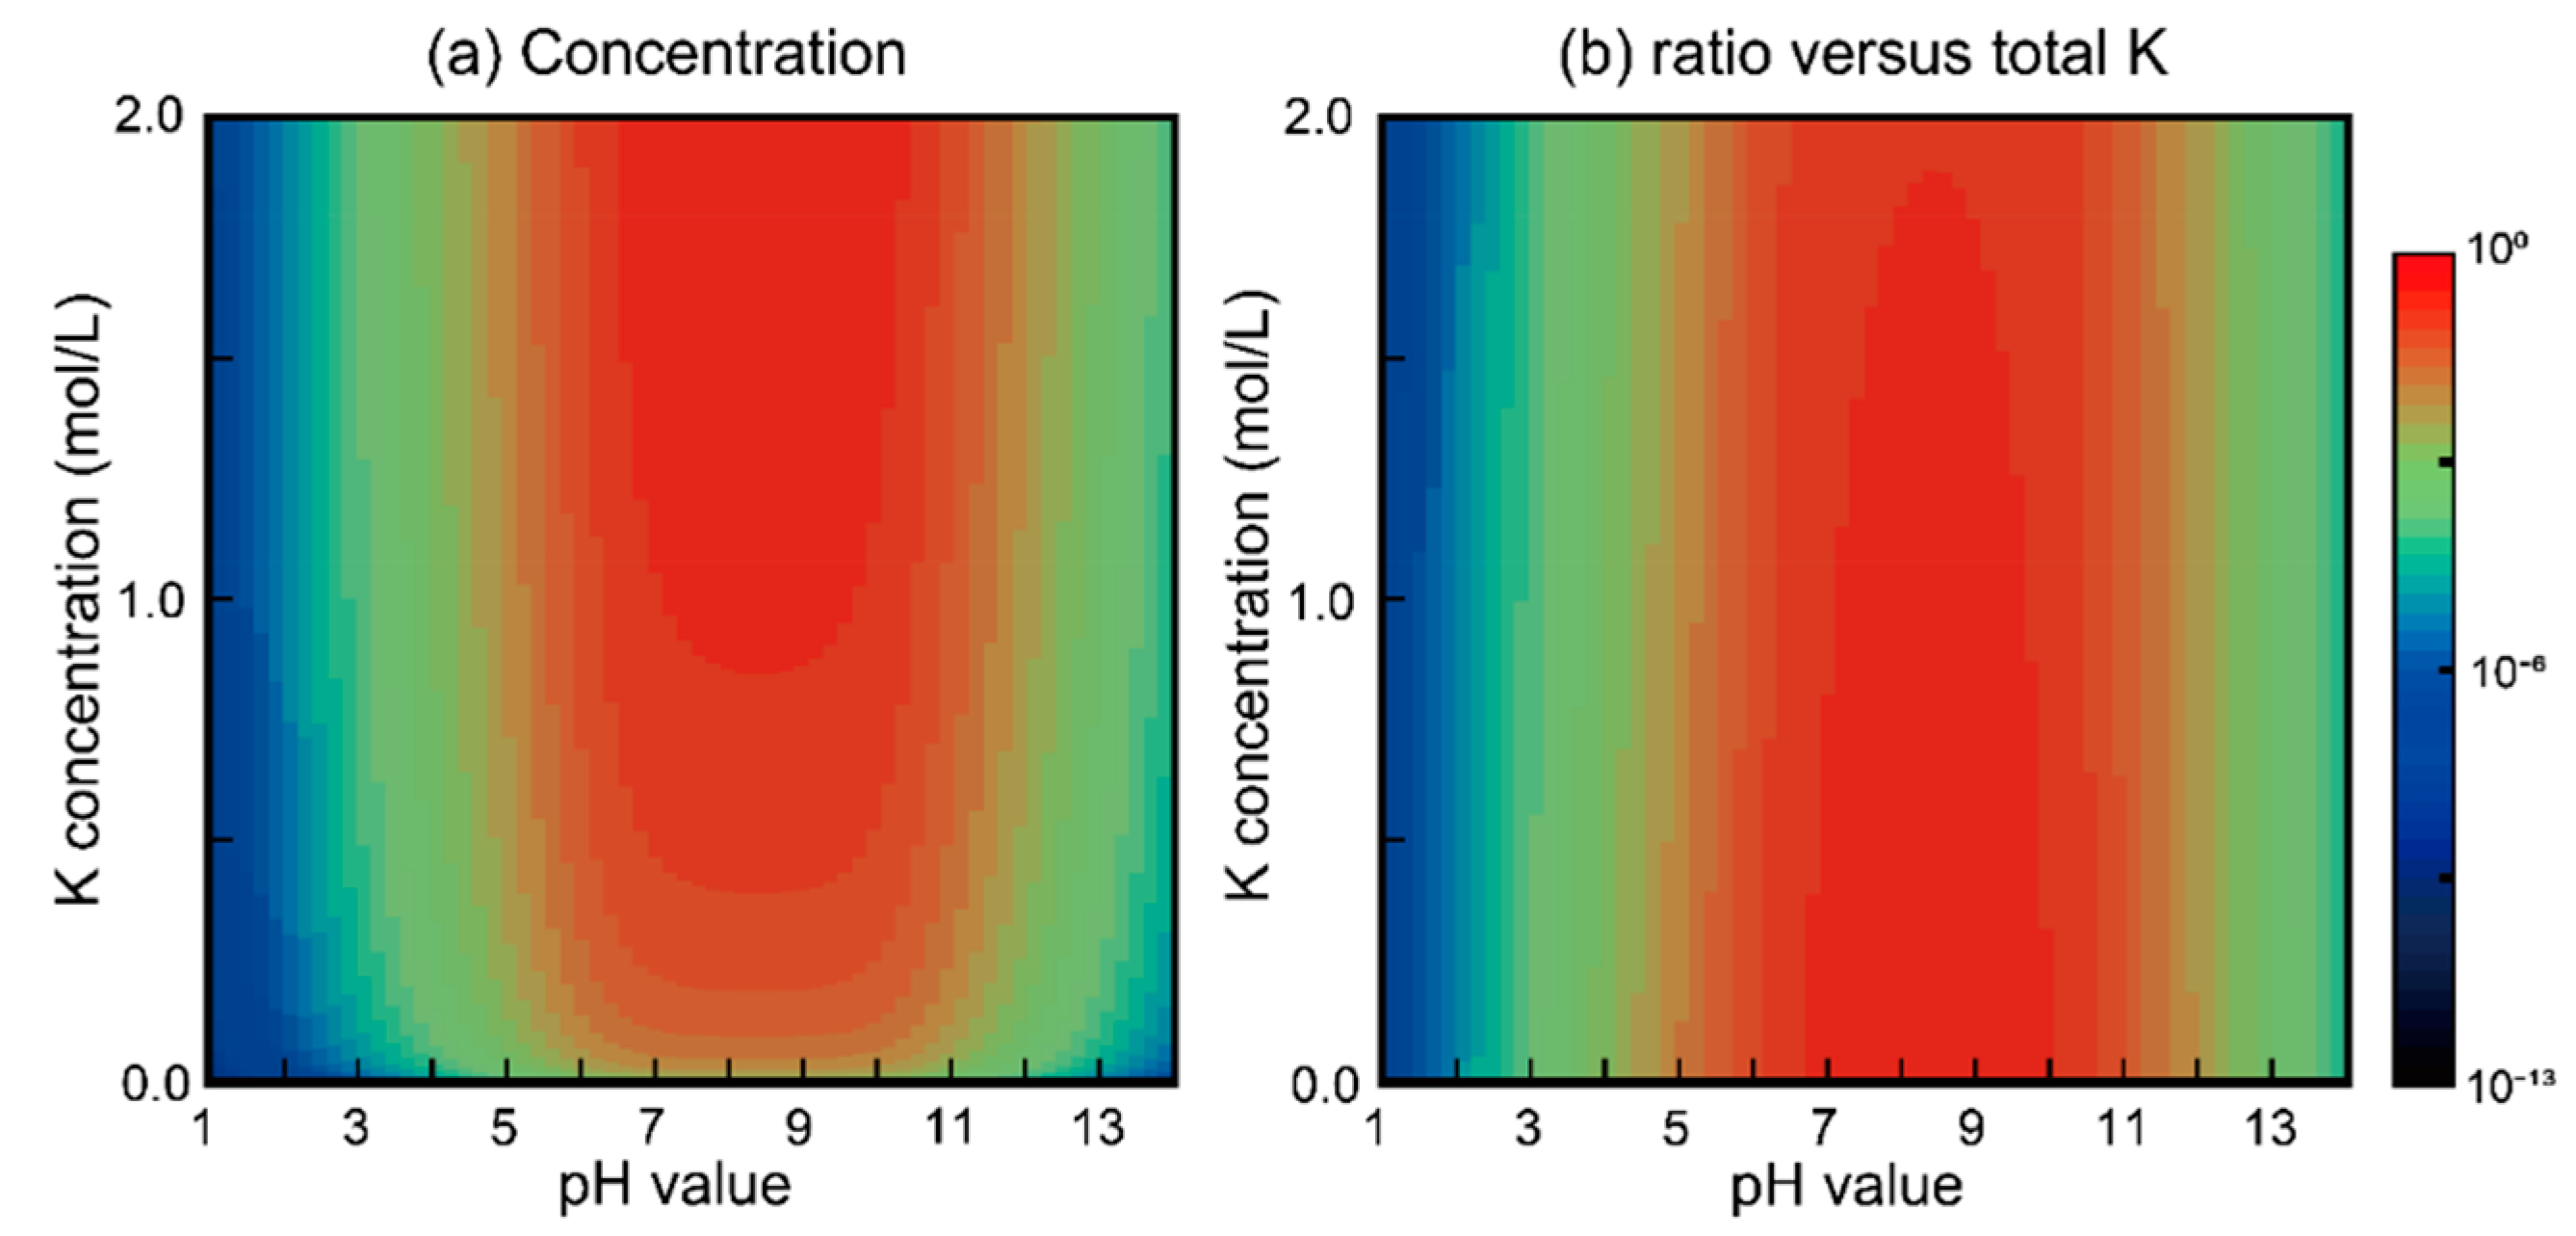
The pH dependence of the ratio of NaHPO4− in the Na–Ca system suggested that this ionic pair was significantly affected by the mode of Na substitution into the OCP unit lattice. Our previous studies also indicated that the ionic radii of substituted cations were an important parameter in OCP substitution. Excluding ionic radii, we evaluated how ionic pair formation was influenced by OCP unit lattice substitution. In that study, we also considered K ion, i.e., an alkali metal ion with a larger ionic radius (1.38 Å) than Na+ (1.02 Å) and Ca2+ (1.00 Å) [31]. Figure 5 shows the calculated results of KHPO4− concentration and ratio as a function of pH and K concentration in solution. Both the concentration and ratio of KHPO4− were the same as those of NaHPO4−. For alkali metal substitution into the OCP P5 PO4 conjugated site, the ionic radius of the cation was found to be a more important factor than the mode of ionic pair formation.
These experimental and simulation results clearly indicate that the formation ratio of ionic pairs of Na+ and HPO42− is influenced by the site of Na substitution into the OCP unit lattice. When NaHPO4− forms in solution, Na is likely to substitute into the conjugated site of P5 PO4, whereas bare Na+ was likely to substitute into the conjugated site of P3 PO4. These results support previous studies concerning the ionic potential and molecular orbital analysis of OCP crystals [32] and other trivalent cation substitution processes into OCP unit lattice [33,34]. Considering the unit lattice of OCP and FT-IR results, the cations were substituted at the conjugated site of P5 PO4. Nevertheless, pH and related ionic pair formation are the key factors influencing molecule and ion substitution into the OCP unit lattice.
Based on the analytical results presented, we considered how such cations strongly inhibited dicarboxylic intercalation into the OCP unit lattice under neutral to weak basic conditions [35]. When dicarboxylic acid was intercalated into the OCP interlayer termed the hydrous layer, the a-axis of the OCP unit lattice expanded; this phenomenon was detected via a peak shift in OCP d(100) from 4.7° to ~4.2° [19,20,21,22,23,35,36]. As shown in Figure 6 and Table S1, when OCP fabricated in dicarboxylic ions (thiomalate: HOOC(SH)(CH2)2COOH) and Na-containing weak basic solutions, a small number of dicarboxylic ions are intercalated into the OCP unit lattice, whereas significant intercalation is observed under acidic to weak acidic solutions. The Na+ substitution process at conjugated sites of P5 PO4 inhibited the Ca fulfilling process, which is the process as an anchor for such dicarboxylic molecules.
For calcium phosphate, including OCP so on formation process, Ca and PO4 ionic pair formation has mostly been discussed. During forming crystalline calcium phosphates from amorphous calcium phosphate, Ca–PO4 ionic pairs and clusters (such as Posner’s cluster) play essential roles [37,38,39,40,41,42,43]. Although the cluster structures of Ca–PO4 have been extensively investigated, the formation of Ca–PO4 with third and fourth molecules remains unclear, although molecular dynamics studies suggest that Posner-like clusters of Ca–Na-PO4 are important [44]. For in vivo and physiological conditions, residual ions and molecules with Ca and PO4 have not previously been considered. In this study, we demonstrate that Na also plays an important role in calcium phosphate formation processes.
4. Conclusions
In conclusion, using Na as a model cation, we investigated the role played by the cation substitution site in the OCP unit lattice on synthesis processes under acidic conditions with increasing pH and weak basic conditions with decreasing pH. Ionic species calculations indicated that the concentration of ionic pairs of Na+ and HPO42− were the key factors determining the Na substitution site. Under NaHPO4-poor conditions (i.e., pH < 5), Na was more likely to substitute in the conjugated site of P3 PO4. On the other hand, under NaHPO4-rich conditions (pH 5 to 10), Na was more likely to substitute in the conjugated site of P5 PO4.
Supplementary Materials
The following are available online at https://0-www-mdpi-com.brum.beds.ac.uk/article/10.3390/ceramics4020018/s1. The details of the experimental setting in the systems of SH-malate containing. Table S1: initial and final pH values of the SH-malate-containing systems. Figure S1: ATR-FT-IR spectra of the samples. Figures S2 and S3: calculation results of pH and other ionic species in the system of pH-Na, Figures S4 and S5: calculation results of pH and other ionic species in the system of pH-Ca containing 1 mol/L Na+.
Author Contributions
Y.S. and M.H. did the setup of experimental design and performed all experiments and simulations. Y.S. wrote the manuscript. Both authors have read and agreed to the published version of the manuscript.
Funding
This research was funded by the Japan Society for Promotion Science (JSPS), KAKENHI for Young Researcher, JP19K19081 (for Y.S.).
Acknowledgments
We thank Y. Uryu, Y. Suezawa and T. Nakanishi for helping with FT-IR measurements. This study is partially supported by the Research Center for Industrial Science and Technology, Kagawa Industry Support Foundation (RIST Kagawa).
Conflicts of Interest
The authors declare no conflict of interest.
References
- Elliott, J.C. Structure and Chemistry of the Apatites and Other Calcium Orthophosphates; Elsevier Co.: Amsterdam, The Netherlands, 1994. [Google Scholar]
- Dorozhkin, S.V.; Epple, M. Biological and medical significance of calcium phosphates. Angew. Chem. Int. Ed. 2002, 41, 3130–3146. [Google Scholar] [CrossRef]
- Dorozhkin, S.V. Calcium Orthophosphates in Nature, Biology and Medicine. Materials 2009, 2, 399–498. [Google Scholar] [CrossRef] [Green Version]
- Habraken, W.; Habibovic, P.; Epple, M.; Bohner, M. Calcium phosphates in biomedical applications: Materials for the future? Mater. Today 2016, 19, 69–87. [Google Scholar] [CrossRef]
- Von Euw, S.; Wang, Y.; Laurent, G.; Drouet, C.; Babonneau, F.; Nassif, N.; Azaïs, T. Bone mineral: New insights into its chemical composition. Sci. Rep. 2019, 9, 8456–8466. [Google Scholar] [CrossRef] [PubMed] [Green Version]
- Perez, E.; Sulbaran, M.; Ball, M.B.; Yarzabal, L.A. Isolation and characterization of mineral phosphate-solubilizing bacteria naturally colonizing a limonitic crust in the south-eastern Venezuelan region. Soil Biol. Biochem. 2007, 39, 2905–2914. [Google Scholar] [CrossRef] [Green Version]
- Shi, H.; He, F.; Ye, J. Synthesis and structure of iron- and strontium-substituted octacalcium phosphate: Effects of ionic charge and radius. J. Mater. Chem. B 2016, 4, 1712–1719. [Google Scholar] [CrossRef]
- Shiwaku, Y.; Tsuchiya, K.; Xiao, L.; Suzuki, O. Effect of calcium phosphate phases affecting the crosstalk between osteoblasts and osteoclasts in vitro. J. Biomed. Mater. Res. A 2019, 107A, 1001–1013. [Google Scholar] [CrossRef]
- Sugiura, Y.; Obika, H.; Horie, M.; Niitsu, K.; Makita, Y. Aesthetic Silver-Doped Octacalcium Phosphate Powders Exhibiting Both Contact Antibacterial Ability and Low Cytotoxicity. ACS Omega 2020, 5, 24434–24444. [Google Scholar] [CrossRef] [PubMed]
- Shurtakova, D.V.; Yavkin, B.V.; Mamin, G.V.; Orlinskii, S.B.; Sirotinkin, V.P.; Fedotov, A.Y.; Shinkarev, A.; Antuzevics, A.; Smirnov, I.V.; Tovtin, V.I.; et al. X-ray Diffraction and Multifrequency EPR Study of Radiation-Induced Room Temperature Stable Radicals in Octacalcium Phosphate. Radiat. Res. 2021, 195, 200–210. [Google Scholar] [PubMed]
- Brown, W.E. Octacalcium Phosphate and Hydroxyapatite: Crystal Structure of Octacalcium Phosphate. Nature 1962, 196, 1048–1050. [Google Scholar] [CrossRef]
- Davies, E.; Duer, M.J.; Ashbrook, S.E.; Griffin, J.M. Applications of NMR Crystallography to Problems in Biomineralization: Refinement of the Crystal Structure and 31P Solid-State NMR Spectral Assignment of Octacalcium Phosphate. J. Am. Chem. Soc. 2012, 134, 12508–12515. [Google Scholar] [CrossRef] [PubMed]
- Tseng, Y.-H.; Mou, C.-Y.; Chan, J.C.C. Solid-State NMR Study of the Transformation of Octacalcium Phosphate to Hydroxyapatite: A Mechanistic Model for Central Dark Line Formation. J. Am. Chem. Soc. 2006, 128, 6909–6918. [Google Scholar] [CrossRef] [PubMed]
- Kamitakahara, M.; Okano, H.; Tanihara, M.; Ohtsuki, C. Synthesis of octacalcium phosphate intercalated with dicarboxylate ions from calcium carbonate and phosphoric acid. J. Cera. Soc. Jpn. 2008, 116, 481–485. [Google Scholar] [CrossRef] [Green Version]
- Sugiura, Y.; Saito, Y.; Endo, T.; Makita, Y. Effect of the Ionic Radius of Alkali Metal Ions on Octacalcium Phosphate Formation via Different Substitution Modes. Cryst. Growth Des. 2019, 19, 4162–4171. [Google Scholar] [CrossRef]
- Boanini, E.; Gazzano, M.; Rubini, K.; Bigi, A. Collapsed Octacalcium Phosphate Stabilized by Ionic Substitutions. Cryst. Growth Des. 2010, 10, 3612–3617. [Google Scholar] [CrossRef]
- Boanini, E.; Torricelli, P.; Forte, L.; Pagani, S.; Mihailescu, N.; Ristoscu, C.; Mihailescu, I.N.; Bigi, A. Antiresorption implant coatings based on calcium alendronate and octacalcium phosphate deposited by matrix assisted pulsed laser evaporation. Colloid Surf. B Biointerf. 2015, 136, 449–456. [Google Scholar] [CrossRef]
- Sugiura, Y.; Makita, Y. Tris(hydroxymethyl)aminomethane Substitution into Octacalcium Phosphate. Chem. Lett. 2019, 48, 1304–1307. [Google Scholar] [CrossRef]
- Sugiura, Y.; Makita, Y. Ammonium Substitutional Solid Solution of Octacalcium Phosphate (OCP). Chem. Lett. 2018, 47, 1371–1374. [Google Scholar] [CrossRef]
- Monma, H.; Goto, M. Succinate-complexed Octacalcium Phosphate. Bull. Chem. Soc. Jpn. 1983, 56, 3843–3844. [Google Scholar] [CrossRef] [Green Version]
- Markovic, M.; Fowler, B.O.; Brown, W.E. Octacalcium Phosphate Carboxylates. 1. Preparation and Identification. Chem. Mater. 1993, 5, 1401–1405. [Google Scholar] [CrossRef]
- Davies, E.; Müller, K.H.; Wong, W.C.; Pickard, C.J.; Reid, D.G.; Skepper, J.N.; Duer, M.J. Citrate bridges between mineral platelets in bone. Proc. Nat. Acad. Sci. USA 2014, 111, E1354–E1363. [Google Scholar] [CrossRef] [PubMed] [Green Version]
- Yokoi, T.; Kamitakahara, M.; Ohtsuki, C. Continuous expansion of the interplanar spacing of octacalcium phosphate by incorporation of dicarboxylate ions with a side chain. Dalton Trans. 2015, 44, 7943–7950. [Google Scholar] [CrossRef]
- Charlton, S.R.; Parkhurst, D.L. Modules based on the geochemical model PHREEQC for use in scripting and programming languages. Comput. Geosci. 2011, 37, 1653–1663. [Google Scholar] [CrossRef]
- Parkhurst, D.L.; Wissmeier, L. PhreeqcRM: A reaction module for transport simulators based on the geochemical model PHREEQC. Adv. Water Resour. 2015, 83, 176–189. [Google Scholar] [CrossRef]
- Appelo, C.A.J.; Parkhurst, D.L.; Post, V.E.A. Equations for calculating hydrogeochemical reactions of minerals and gases such as CO2 at high pressures and temperatures. Geochim. Cosmochim. Acta 2014, 125, 49–67. [Google Scholar] [CrossRef]
- Laliberté, M. A Model for Calculating the Heat Capacity of Aqueous Solutions, with Updated Density and Viscosity Data. J. Chem. Eng. Data 2009, 54, 1725–1760. [Google Scholar] [CrossRef]
- Mathew, M.; Brown, W.E.; Schroeder, L.W. Crystal structure of octacalcium bis(hydrogenphosphate) tetrakis(phosphate)pentahydrate, Ca8(HPO4)2(PO4)4·5H2O. J. Crystallograph. Spectros. Res. 1988, 18, 235–250. [Google Scholar] [CrossRef]
- Berry, E.E.; Baddiel, C.B. Some assignments in the infra-red spectrum of octacalcium phosphate. Spectrochim. Acta 1967, 23A, 1781–1792. [Google Scholar] [CrossRef]
- Momma, K.; Izumi, F. VESTA3 for three-dimensional visualization of crystal, volumetric and morphology data. J. Appl. Crystallogr. 2011, 44, 1272–1276. [Google Scholar] [CrossRef]
- Shannon, R.D. Revised effective ionic radii and systematic studies of interatomic distances in halides and chalcogenides. Acta Cryst. 1976, A32, 751–767. [Google Scholar] [CrossRef]
- Sugiura, Y.; Makita, Y. Sodium Induces Octacalcium Phosphate Formation and Enhances Its Layer Structure by Affecting the Hydrous Layer Phosphate. Cryst. Growth Des. 2018, 18, 6165–6171. [Google Scholar] [CrossRef]
- Goldberg, M.A.; Gafurov, M.; Makshakova, O.; Smirnov, V.; Komlev, V.; Barinov, S.; Kudryavtsev, E.; Sergeeva, N.; Achmedova, S.; Mamin, G.; et al. Influence of Al on the Structure and In Vitro Behavior of Hydroxyapatite Nanopowders. J. Phys. Chem. B 2019, 123, 9143–9154. [Google Scholar] [CrossRef] [PubMed] [Green Version]
- Goldberg, M.A.; Gafurov, M.R.; Murzakhanov, F.F.; Fomin, A.S.; Antonova, O.S.; Khairutdinova, D.R.; Pyataev, A.V.; Makshakova, O.N.; Konovalov, A.A.; Leonov, A.V.; et al. Mesoporous Iron(III)-Doped Hydroxyapatite Nanopowders Obtained via Iron Oxalate. Nanomaterials 2021, 11, 811. [Google Scholar] [CrossRef] [PubMed]
- Matsunaga, K.; Murata, H. Strontium Substitution in Bioactive Calcium Phosphates: A First-Principles Study. J. Phys. Chem. B 2009, 113, 3584–3589. [Google Scholar] [CrossRef] [PubMed]
- Sugiura, Y.; Makita, Y. Ammonium inhibition of the intercalation of dicarboxylic acid molecules into octacalcium phosphate layer by substitution. J. Solid State Chem. 2019, 279, 120923. [Google Scholar] [CrossRef]
- Eanes, E.D.; Gillessen, I.H.; Posner, A.S. Intermediate States in the Precipitation of Hydroxyapatite. Nature 1965, 208, 365–367. [Google Scholar] [CrossRef]
- Christofferesen, J.; Christofferesen, M.R.; Kibalczyc, W. Apparent solubilities of two amorphous calcium phosphates and of octacalcium phosphate in the temperature range 30–42 °C. J. Cryst. Growth 1990, 106, 349–354. [Google Scholar] [CrossRef]
- Posner, A.S.; Betts, F. Synthetic amorphous calcium phosphate and its relation to bone mineral structure. Acc. Chem. Res. 1975, 8, 273–281. [Google Scholar] [CrossRef]
- Onuma, K.; Ito, A. Cluster Growth Model for Hydroxyapatite. Chem. Mater. 1998, 10, 3346–3351. [Google Scholar] [CrossRef]
- Kanzaki, N.; Treboux, G.; Onuma, K.; Tsutsumi, S.; Ito, A. Calcium phosphate clusters. Biomaterials 2001, 22, 2921–2929. [Google Scholar] [CrossRef]
- Dey, A.; Bomans, P.H.H.; Muller, F.A.; Will, J.; Frederik, P.M.; deWith, G.; Sommerdijk, N.A.J.M. The role of prenucleation clusters in surface-induced calcium phosphate crystallization. Nat. Mater. 2010, 9, 1010–1014. [Google Scholar] [CrossRef] [PubMed]
- Du, L.-W.; Bian, S.; Gou, B.-D.; Jiang, Y.; Huang, J.; Gao, Y.-X.; Zhao, Y.-D.; Wen, W.; Zhang, T.-L.; Wang, K. Structure of Clusters and Formation of Amorphous Calcium Phosphate and Hydroxyapatite: From the Perspective of Coordination Chemistry. Cryst. Growth Des. 2013, 13, 3103–3109. [Google Scholar] [CrossRef]
- Mancardi, G.; Tamargo, C.E.H.; DiTommaso, D.; deLeeuw, N.H. Detection of Posner’s clusters during calcium phosphate nucleation: A molecular dynamics study. J. Mater. Chem. B 2017, 5, 7274–7284. [Google Scholar] [CrossRef] [PubMed] [Green Version]
Scheme 1.
Schematic illustration of the OCP unit lattice oriented toward the c-axis, with phosphates labeled as P1 to P4 in their PO4 form (black labels) and P5, P6 in their HPO4 form (green labels) drown by VESTA3 program and ref [28,30]. The black dashed circle and red dotted circle indicate Ca ions corresponding to the conjugated sites of P3 and P5 PO4, respectively.

Figure 1.
XRD patterns of the treated samples. OCP-Na: DCPD treated in 1 mol/L Na2HPO4. OCP(Na): CaCO3 treated in 2 mol/L NaCl and 1 mol/L H3PO4. OCP-pure: CaCO3 treated in 1 mol/L H3PO4. OCP std was calculated by Mathew et al. [28] and the VESTA3 program [30].

Figure 2.
Transmitting FT-IR spectra (KBr method) of the treated samples. (a) Wide range. The green square corresponds to CO3 adsorption. (b) P3 PO4 vibration; the red and purple broken line corresponds to the P3 PO4 vibration. (c) P5 PO4 vibration.
Figure 2.
Transmitting FT-IR spectra (KBr method) of the treated samples. (a) Wide range. The green square corresponds to CO3 adsorption. (b) P3 PO4 vibration; the red and purple broken line corresponds to the P3 PO4 vibration. (c) P5 PO4 vibration.

Figure 3.
Calculated concentrations (a) and ratios (b) versus the total Na of NaHPO4− in a solution containing 1 mol/L PO4 at 60 °C.
Figure 3.
Calculated concentrations (a) and ratios (b) versus the total Na of NaHPO4− in a solution containing 1 mol/L PO4 at 60 °C.

Figure 4.
Calculated concentrations (a) and ratios (b) versus the total Na of NaHPO4− as a function of CaCl2 concentration in solutions of 1 mol/L PO4 and 2.0 mol/L Na+ at 60 °C.
Figure 4.
Calculated concentrations (a) and ratios (b) versus the total Na of NaHPO4− as a function of CaCl2 concentration in solutions of 1 mol/L PO4 and 2.0 mol/L Na+ at 60 °C.

Figure 5.
Calculated concentrations (a) and ratios (b) versus the total K of KHPO4− in a solution containing 1 mol/L PO4 at 60 °C.
Figure 5.
Calculated concentrations (a) and ratios (b) versus the total K of KHPO4− in a solution containing 1 mol/L PO4 at 60 °C.

Figure 6.
(a) Schematic illustration of SH-malate-substituted OCP. XRD patterns of treated samples in SH-malate substituted evaluation. (b) Wide range. (c) Small angle: the red dotted line indicates the main peak of OCP-SH-malate, and the broken blue line denotes the main peak of OCP-pure (conventional OCP). OCP std was calculated by Mathew et al. [28] and the VESTA3 program [30].


Table 1.
Selected thermodynamic data for reactions in this system and their corresponding complexes. All data refer to a reference temperature of 298.15 K and standard state, i.e., a pressure of 0.1 MPa and, for aqueous species, infinite dilution [26,27].
| H2O = O2 + 4H+ + 4e | -log_k | −86.08 |
| 2H+ + 2e− = H2 | -log_k | −3.15 |
| PO43− + H+ = HPO42− | -log_k | 12.346 |
| PO43− + 2H+ = H2PO4− | -log_k | 19.553 |
| PO43− + 3H+ = H3PO4 | -log_k | 21.721 |
| Ca2+ + H2O = CaOH+ + H+ | -log_k | −12.78 |
| Ca2+ + PO43− = CaPO4− | -log_k | 6.459 |
| Ca2+ + HPO42− = CaHPO4 | -log_k | 2.739 |
| Ca2+ + H2PO4− = CaH2PO4+ | -log_k | 1.408 |
| Na+ + HPO42− = NaHPO4− | -log_k | 0.29 |
| K+ + HPO42− = KHPO4− | -log_k | 0.29 |
Table 2.
The initial and final pH values of reacting solutions for each synthesis method.
| Sample | Initial | Final |
|---|---|---|
| OCP-pure | <1.00 | 6.26 |
| OCP(Na) | <1.00 | 5.85 |
| OCP-Na | 9.00 | 6.87 |
Publisher’s Note: MDPI stays neutral with regard to jurisdictional claims in published maps and institutional affiliations. |
© 2021 by the authors. Licensee MDPI, Basel, Switzerland. This article is an open access article distributed under the terms and conditions of the Creative Commons Attribution (CC BY) license (https://creativecommons.org/licenses/by/4.0/).
Share and Cite
MDPI and ACS Style
Sugiura, Y.; Horie, M. Prediction of Sodium Substitution Sites in Octacalcium Phosphate: The Relationships of Ionic Pair Ratios in Reacting Solutions. Ceramics 2021, 4, 240-248. https://0-doi-org.brum.beds.ac.uk/10.3390/ceramics4020018
AMA Style
Sugiura Y, Horie M. Prediction of Sodium Substitution Sites in Octacalcium Phosphate: The Relationships of Ionic Pair Ratios in Reacting Solutions. Ceramics. 2021; 4(2):240-248. https://0-doi-org.brum.beds.ac.uk/10.3390/ceramics4020018
Chicago/Turabian StyleSugiura, Yuki, and Masanori Horie. 2021. "Prediction of Sodium Substitution Sites in Octacalcium Phosphate: The Relationships of Ionic Pair Ratios in Reacting Solutions" Ceramics 4, no. 2: 240-248. https://0-doi-org.brum.beds.ac.uk/10.3390/ceramics4020018