
Release Profiles of Dyes and Proteins from Calcium Phosphate Microspheres with Different Crystalline Phases


Graduate School of Life Science and Systems Engineering, Kyushu Institute of Technology, Kitakyushu 808-0196, Japan
*
Author to whom correspondence should be addressed.
Ceramics 2021, 4(2), 291-301; https://0-doi-org.brum.beds.ac.uk/10.3390/ceramics4020023
Submission received: 28 April 2021
/
Revised: 20 May 2021
/
Accepted: 4 June 2021
/
Published: 6 June 2021
(This article belongs to the Special Issue Advances in Ceramics)
Abstract
:Calcium phosphate is attracting attention as a bone repair material and a controlled-release carrier of various drugs such as bone disease therapeutic agents and anticancer agents. Compared with some bioabsorbable polymers, calcium phosphates have the advantage of preventing a pH decrease in the surrounding body fluid. However, there are few studies comparing the effect of supporting substances with different physicochemical properties on the production of calcium phosphate microspheres with different crystalline phases. In this study, we investigated conditions for obtaining low crystallinity apatite and octacalcium phosphate (OCP) microspheres from calcium carbonate microspheres with different crystalline structures using a simple phosphoric acid treatment. Furthermore, we investigated the adsorption and release behavior of different dyes and proteins from the apatite and OCP microspheres. Overall, the factors governing the adsorption and release behavior are different depending on the molecular size and surface charge of the dye and protein adsorbates.
Keywords:
apatite; octacalcium phosphate (OCP); microsphere; drug delivery; dye; protein; mesopore; surface charge1. Introduction
Calcium phosphate is attracting attention as a bone repair material and a controlled-release carrier for various drugs such as bone disease therapeutic agents and anticancer agents [1,2]. Carriers must pass through capillaries; as a result, the carrier is preferably smaller than the typical 5-µm diameter of capillaries [3]. In addition, a sphere is a desirable shape to prevent damage to blood vessels. Extensive studies have been conducted on bioabsorbable poly-lactic-co-glycolic acid microspheres for controlled drug release; however, inflammation by their acidic degradation products is a concern [4,5]. To address these concerns, calcium phosphate has been added to suppress the pH decrease during degradation [6], and the degradation rate of calcium phosphate microspheres has been controlled by additives such as Sr2+ [7]. Various studies using composite microspheres as scaffolds for vascular regeneration in ischemic diseases have been reported [8].
Microspheres of various calcium phosphates, such as apatite [9], tricalcium phosphate (TCP) [10], octacalcium phosphate (OCP) [11], and biphasic calcium phosphate [12,13], have been fabricated, and the crystalline phase of calcium phosphate has been controlled by changing the heating temperature [14,15]. The drug and protein release profile have been investigated for some of these studies; however, few adsorbates have been used. There are few comparative studies using a range of supporting substances, from compounds with low molecular weight to proteins, to fabricate calcium phosphate microspheres with different crystalline phases.
In this study, we investigated the conditions for obtaining microspheres consisting of low crystallinity apatite and OCP from calcium carbonate microspheres with different crystalline structures using a simple phosphoric acid treatment. A high drug incorporation is expected because the plate-like morphology of OCP has a high specific surface area and a specific layered structure [16,17]. Vaterite-type calcium carbonate microspheres with suitable size for drug delivery are commercially available, and they can be easily converted into calcite by a simple heat treatment. We assumed that different calcium phosphates can be obtained in an aqueous process using vaterite and calcite because the precursors have different solubility products and reactivity [18]. Furthermore, the adsorption and release behaviors of dyes with different charges were investigated as models for drugs and proteins with different isoelectric points, and the interaction mechanism between the microspheres and adsorbates was defined.
2. Materials and Methods
2.1. Materials
Vaterite-type CaCO3 microspheres (SCS-M5, 5-µm particle size, Sakai Chemical Industry Co., Ltd., Sakai, Japan) were used as a starting material. NaCl and H3PO4 were purchased from Nacalai Tesque Inc., Kyoto, Japan and XL-Bradford reagent was purchased from Intégrale Co., Ltd., Tokyo, Japan. Methylene blue, eosin Y, albumin derived from egg, γ-globulin derived from human blood plasma, and lysozyme derived from egg white were purchased from FUJIFILM Wako Pure Chemical Industries Co., Osaka, Japan.
2.2. H3PO4 Treatment of CaCO3 Microspheres
The methods for the preparation of apatite and OCP by H3PO4 treatment of CaCO3 were previously reported [19,20]. To convert vaterite to calcite, an alumina crucible containing the microspheres was placed in an electric furnace (300-Plus, DENKEN-HIGHDENTAL Co., Ltd., Kyoto, Japan) maintained at 460 °C and heated for 30 min. The microspheres were then cooled in air. Preliminary thermal analysis demonstrated that the phase transition from vaterite to calcite occurred between 420 °C and 460 °C. The heating temperature was set to 460 °C to ensure complete transition. Vaterite microspheres (1.33 g) were added to a 0.1 M H3PO4 solution heated to 60 °C. The solution was adjusted to pH 6 with 1 M aqueous solutions of HNO3 and NaOH. The mixture was stirred for 1 h using a homogenizer (Homogenizing Mixer MARK II Model 2.5, PRIMIX Co., Hyogo, Japan). Alternatively, calcite microspheres (1.33 g) obtained by heat treatment of the vaterite were added to a 0.1 M H3PO4 solution heated to 60 °C, and methylene blue was added to achieve 3.2 × 10⁻³ M. The pH of the solution was adjusted to pH 4–7 with 1 M HNO3 and NaOH (aqueous) using a pH controller (NPH-680D, Nisshin Rika Co., Ltd., Tokyo, Japan). After stirring, the samples were filtered and washed with ultrapure water, then dried in a 60 °C oven (NDO-700, EYELA, Tokyo, Japan).
2.3. Dye Adsorption and Release
First, 0.1 g of apatite and OCP microspheres were immersed in 10 mL of 5.0 × 10⁻⁵ to 6.4 × 10⁻³ M aqueous methylene blue solution and 5.0 × 10⁻⁴ to 1.0 × 10⁻¹ M aqueous eosin Y solution. The mixture was stored for 4 h. The absorbance in the supernatant was measured using an ultraviolet-visible spectrophotometer (UV-Vis: V-603, JASCO Co., Tokyo, Japan) to determine the saturated adsorption concentration. The measurement wavelength was 664 and 517 nm for methylene blue and eosin Y, respectively. Microspheres (0.01 g), after immersion in dye solutions with saturated adsorption concentrations (3.2 × 10⁻³ M for methylene blue and 5.0 × 10⁻² M for eosin Y), were transferred to 10 mL of physiological saline heated to 38 °C. The absorbance of the supernatant was then measured at different times within 24 h using a UV-Vis spectrophotometer to investigate the release behavior.
2.4. Protein Adsorption and Release
Apatite and OCP microspheres with a total surface area of 3 m2 were immersed in 10 mL of an albumin, γ-globulin, and lysozyme solution (each protein concentration was 0 to 1.0 g/L), and the solution was stored at 38 °C for 4 h. Then, 70 μL of the supernatant and standard solutions were transferred to polystyrene cells, 3.5 mL of the XL-Bradford reagent (diluted five times with ultrapure water) was added to each cell, and the solution was stored at room temperature for 5 min. The absorbance at 595 nm was then measured using the UV-Vis spectrophotometer to calculate the amount of adsorption.
Apatite and OCP microspheres with a total surface area of 0.3 m2 were immersed in a solution containing 1.0 g/L albumin, 0.6 g/L γ-globulin, and 1.0 g/L lysozyme for 4 h. The microspheres were then immersed in 10 mL of physiological saline and stored at 38 °C. The released protein concentration was measured at different times within 24 h by the method described above.
2.5. Structural Analysis
The surface morphology of the samples was observed with a scanning electron microscope (SEM: S-3500N, Hitachi, Ltd., Tokyo, Japan). The samples were coated with an Au–Pd alloy using an ion sputtering device (E-101, Hitachi, Ltd., Tokyo, Japan). Powder X-ray diffraction (XRD: M03XHF22, Mac Science Co., Ltd., Yokohama, Japan) was performed with a CuKα X-ray as a source, and the crystalline structure of the samples was identified by referring to the Joint Committee on Powder Diffraction Standards (JCPDS) data file. The voltage and current applied to the X-ray tube were 40 kV and 30 mA, respectively. The step-scanning mode with a step width of 0.02° and counting time of 2 s were used.
The adsorption isotherm of the samples was measured using an automatic specific surface area/pore distribution measuring device (BELSORP-mini II, Nippon Bell Co., Ltd., Osaka, Japan). As a pre-treatment, the microspheres were evacuated at room temperature for 6 h. The measurement was performed with an equilibrium time of 180 s, and N2 gas was adsorbed at −196 °C. The specific surface area was calculated using the Brunauer–Emmett–Teller (BET) theory. The pore distribution was determined from the desorption isotherm by the Barrett–Joyner–Halenda (BJH) method.
The surface zeta potentials of the samples were measured in a 10-mM NaCl aqueous solution with a zeta potential analyzer (ELS-Z, Otsuka Electronics Co., Ltd., Osaka, Japan). A quartz cell was used for the measurement.
3. Results
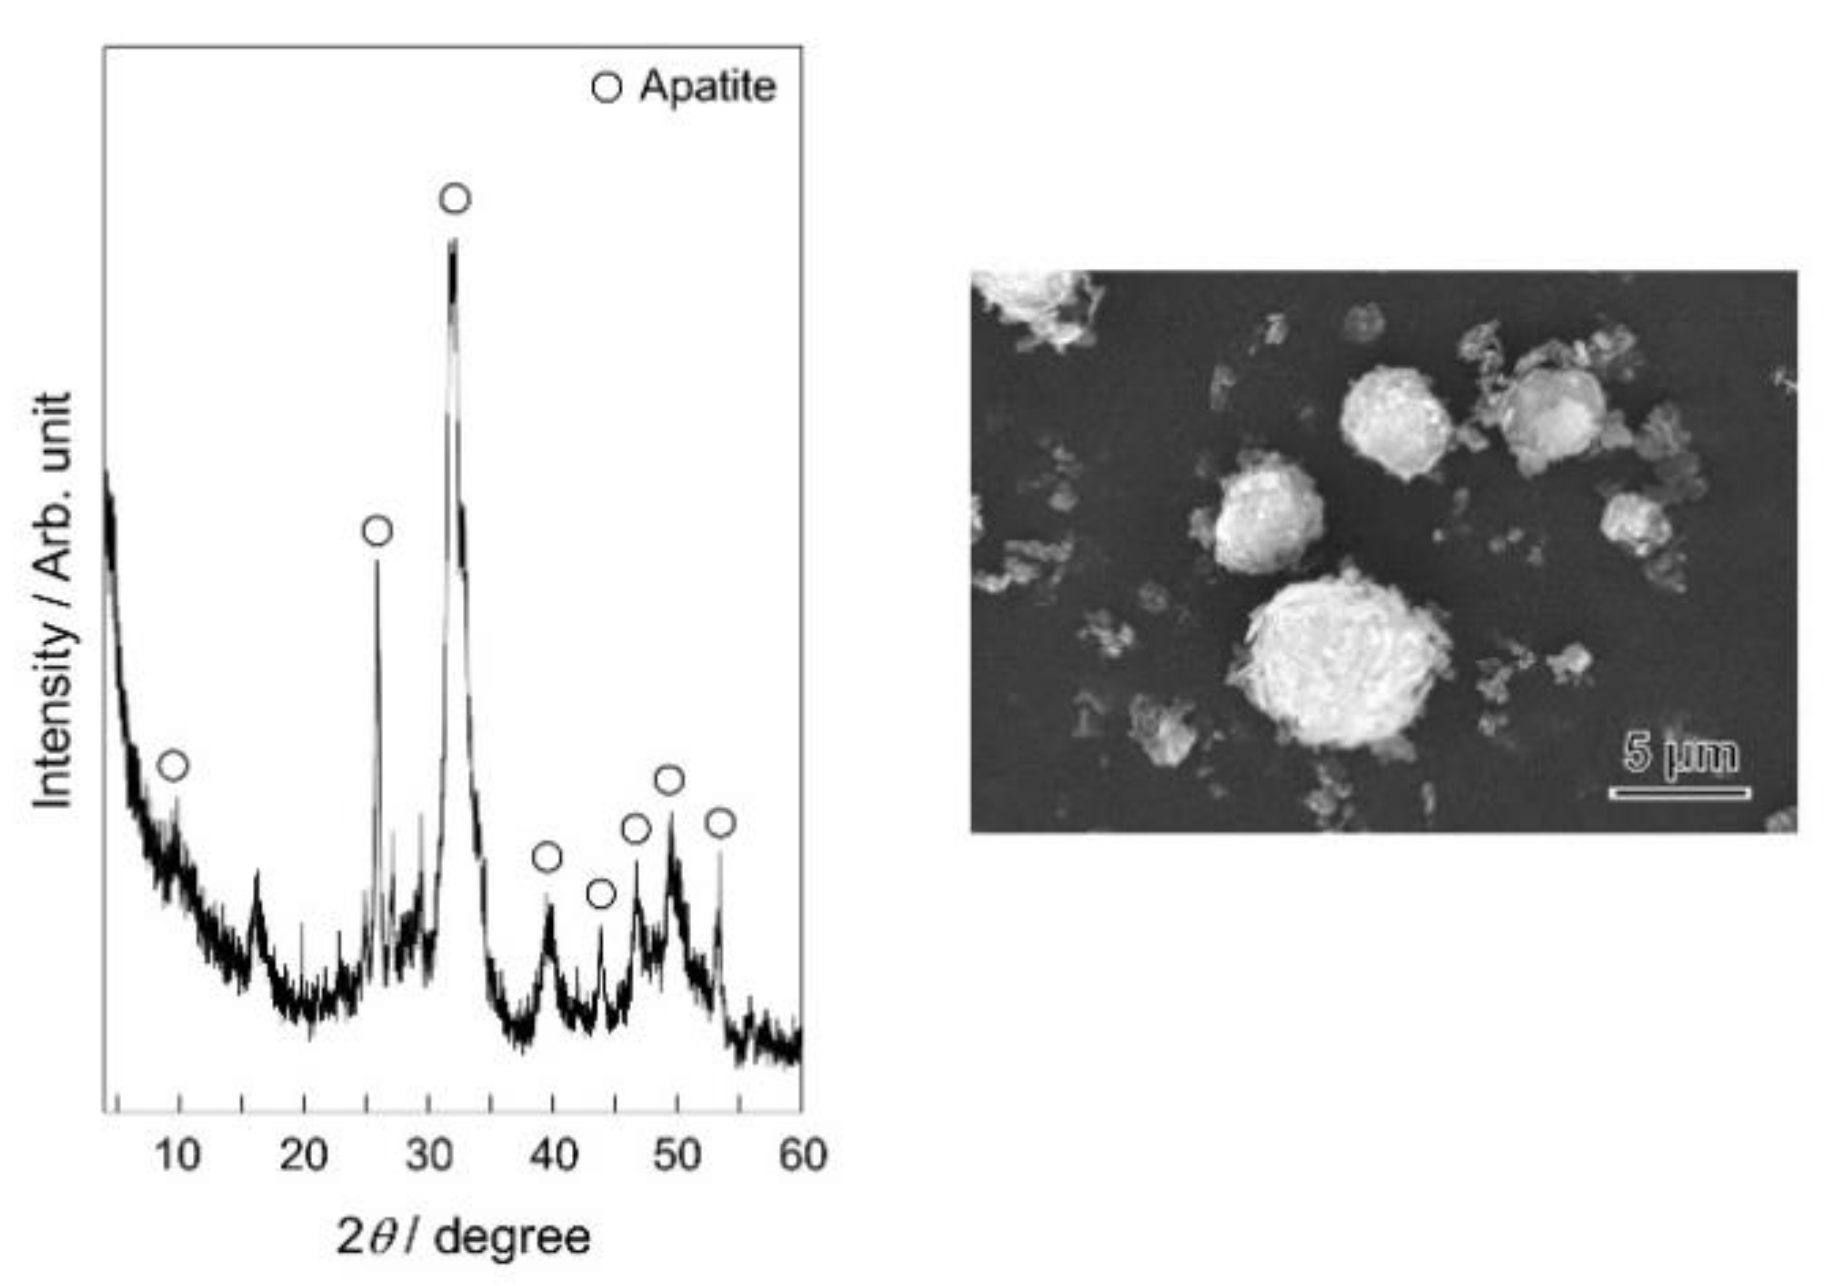
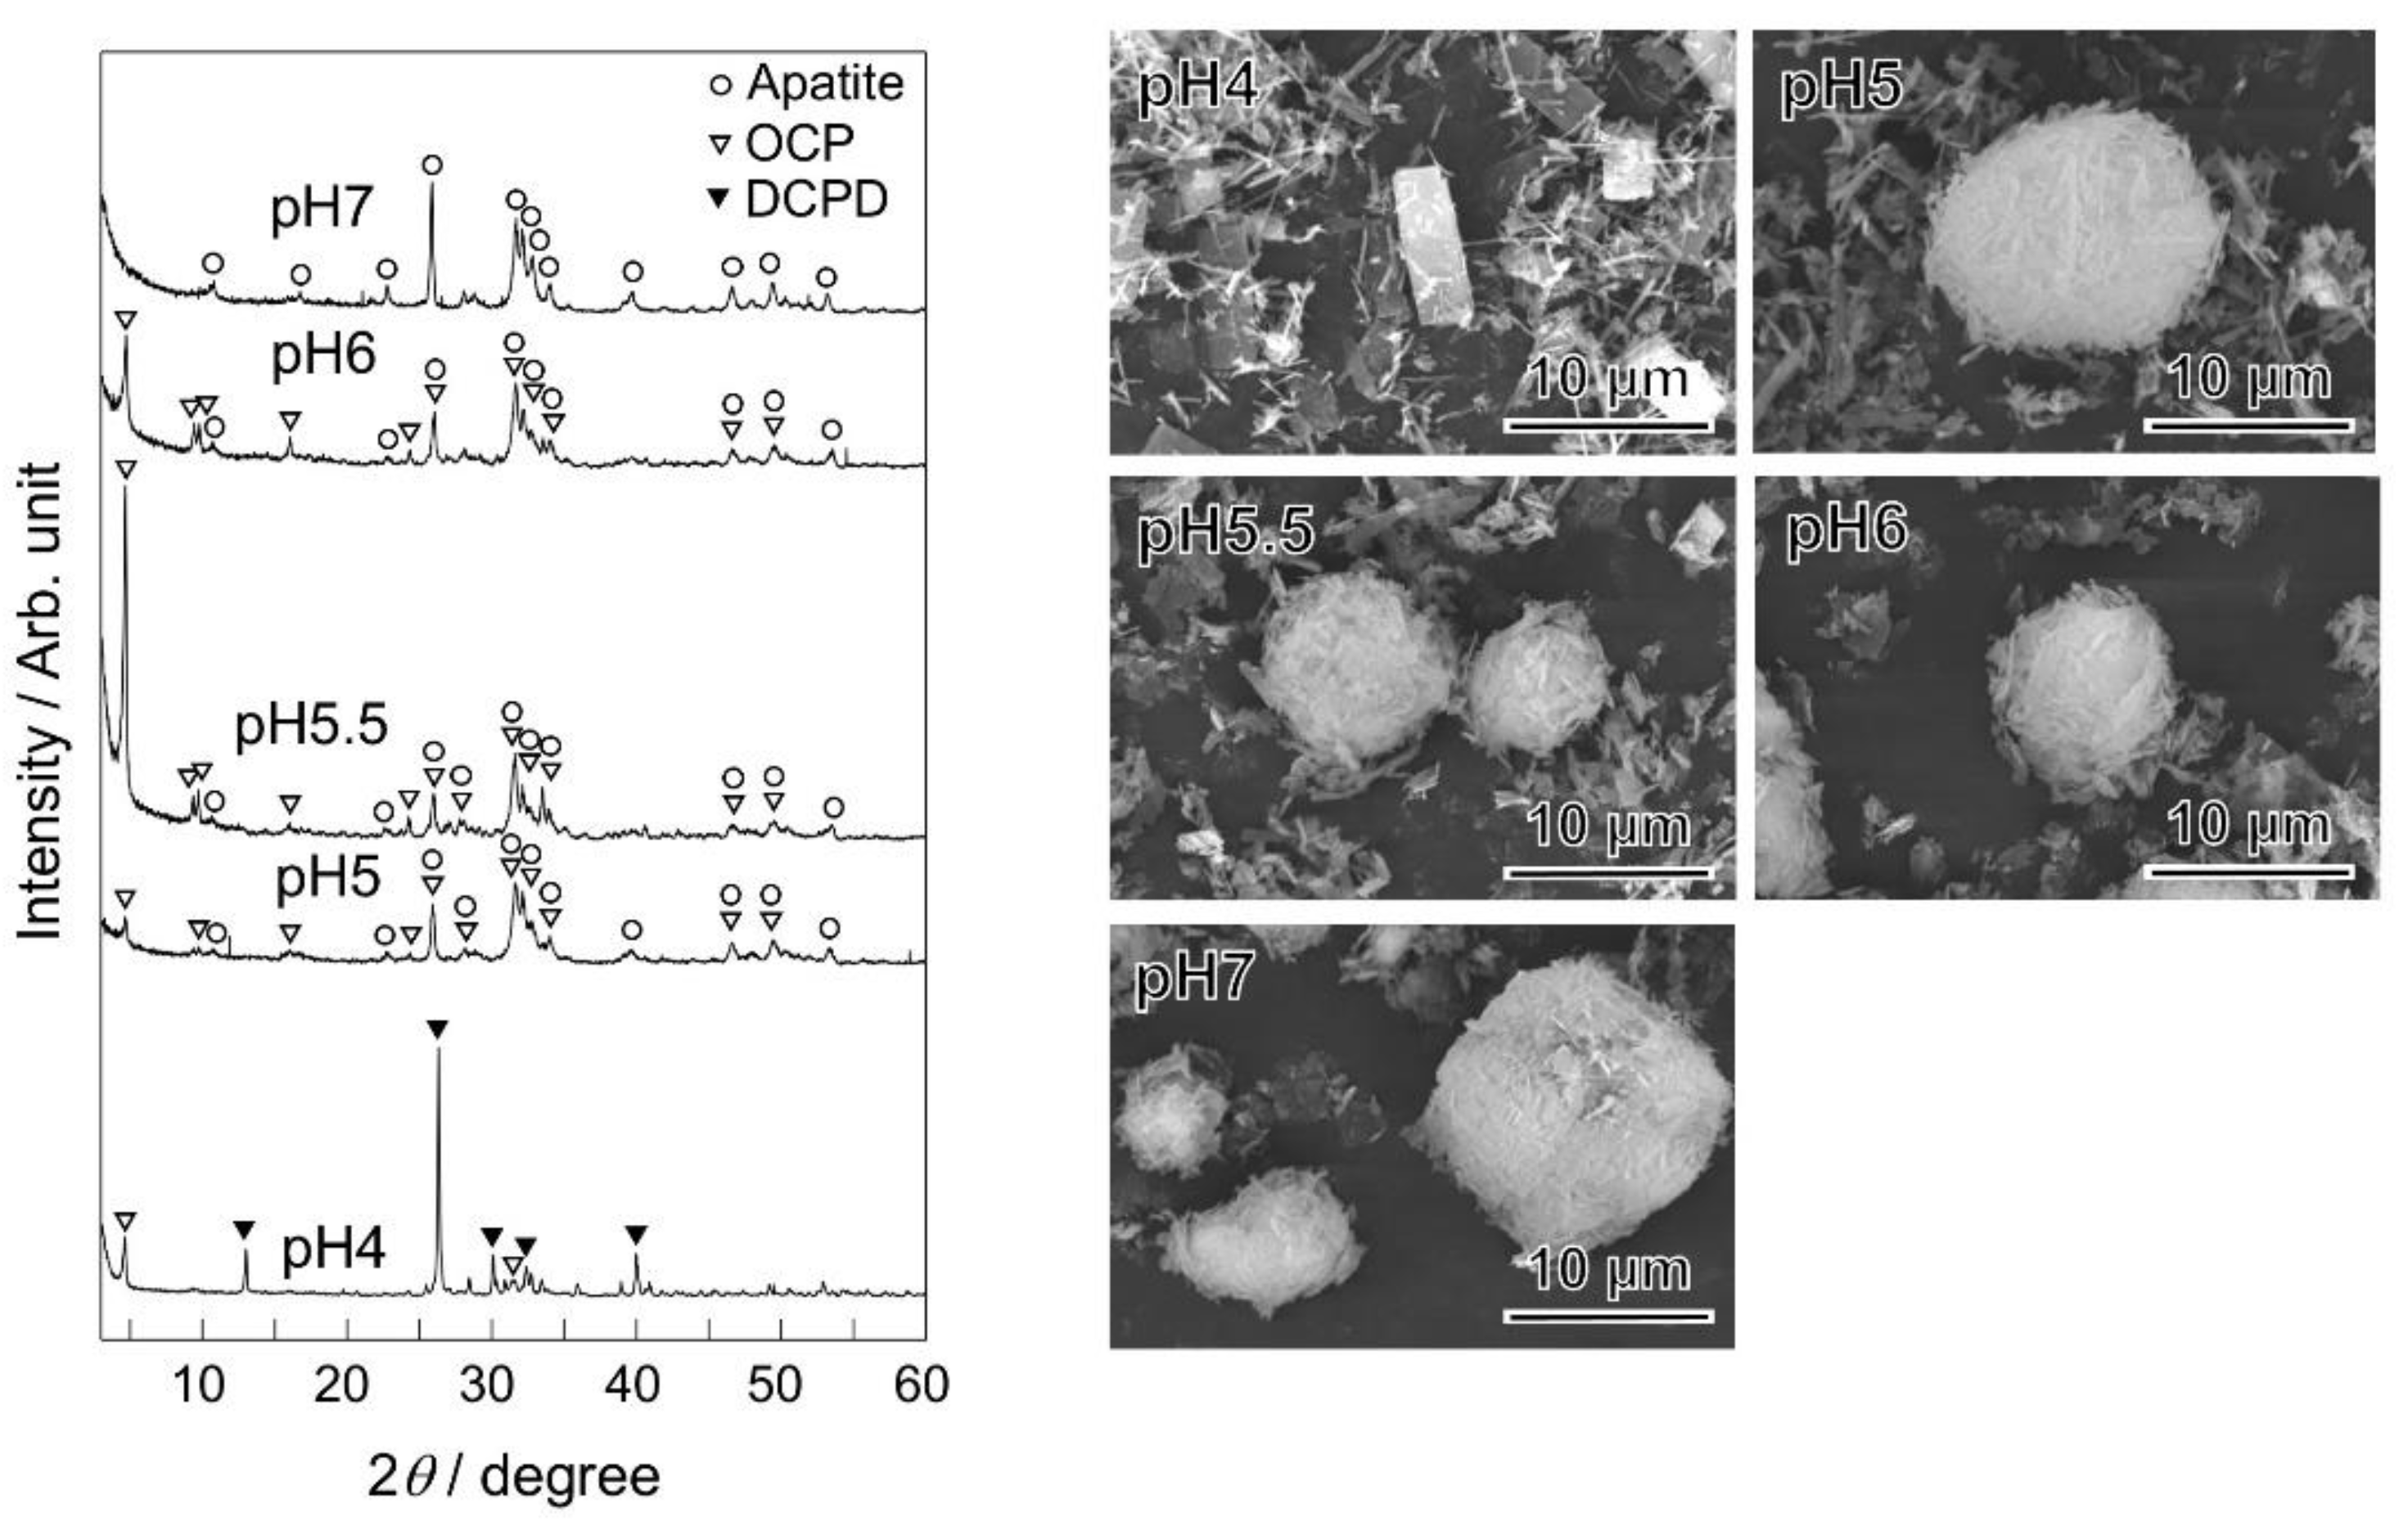
The crystalline phase after heat treatment of the vaterite microspheres was identified as a single phase of calcite by XRD. Figure 1 shows the XRD pattern and SEM photograph of the microspheres obtained by H3PO4 treatment of the vaterite microspheres. Spherical particles with a diameter of 5 to 10 µm were obtained. The crystalline phase was identified as low crystallinity apatite. Figure 2 shows the XRD patterns and SEM photographs of the microspheres obtained by H3PO4 treatment of the calcite microspheres at various pH values. The crystalline phase was CaHPO4·H2O with a small amount of OCP at pH 4. OCP with a small amount of apatite was detected at pH 5 to 6. The peak intensity near 4.7° assigned to the (010) diffraction of OCP was the highest at pH 5.5. The crystalline phase was only apatite at pH 7. Hereafter, the apatite microspheres shown in Figure 1 and OCP microspheres obtained at pH 5.5, as shown in Figure 2, were used.
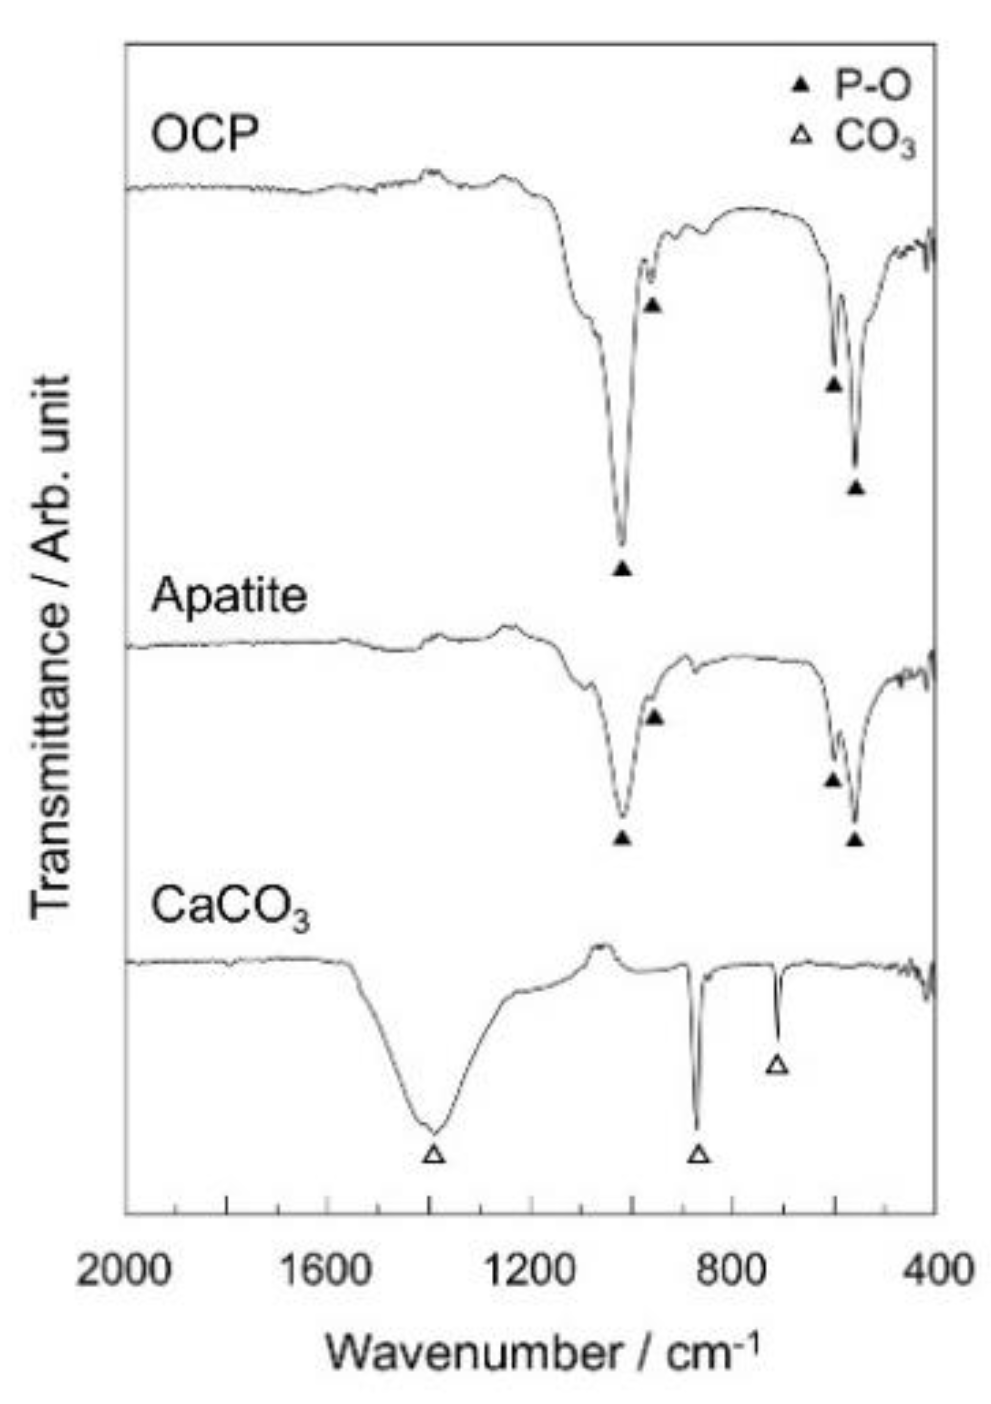
Figure 3 shows the FT-IR spectra of the apatite and OCP microspheres and calcite microspheres. Only peaks assigned to carbonate ions were observed at 700, 900, and 1400 cm−1 for the calcite microspheres. Alternatively, peaks assigned to the P–O bond were observed at 600 and 1000 cm−1 for the apatite and OCP microspheres, respectively; those assigned to carbonate completely disappeared.
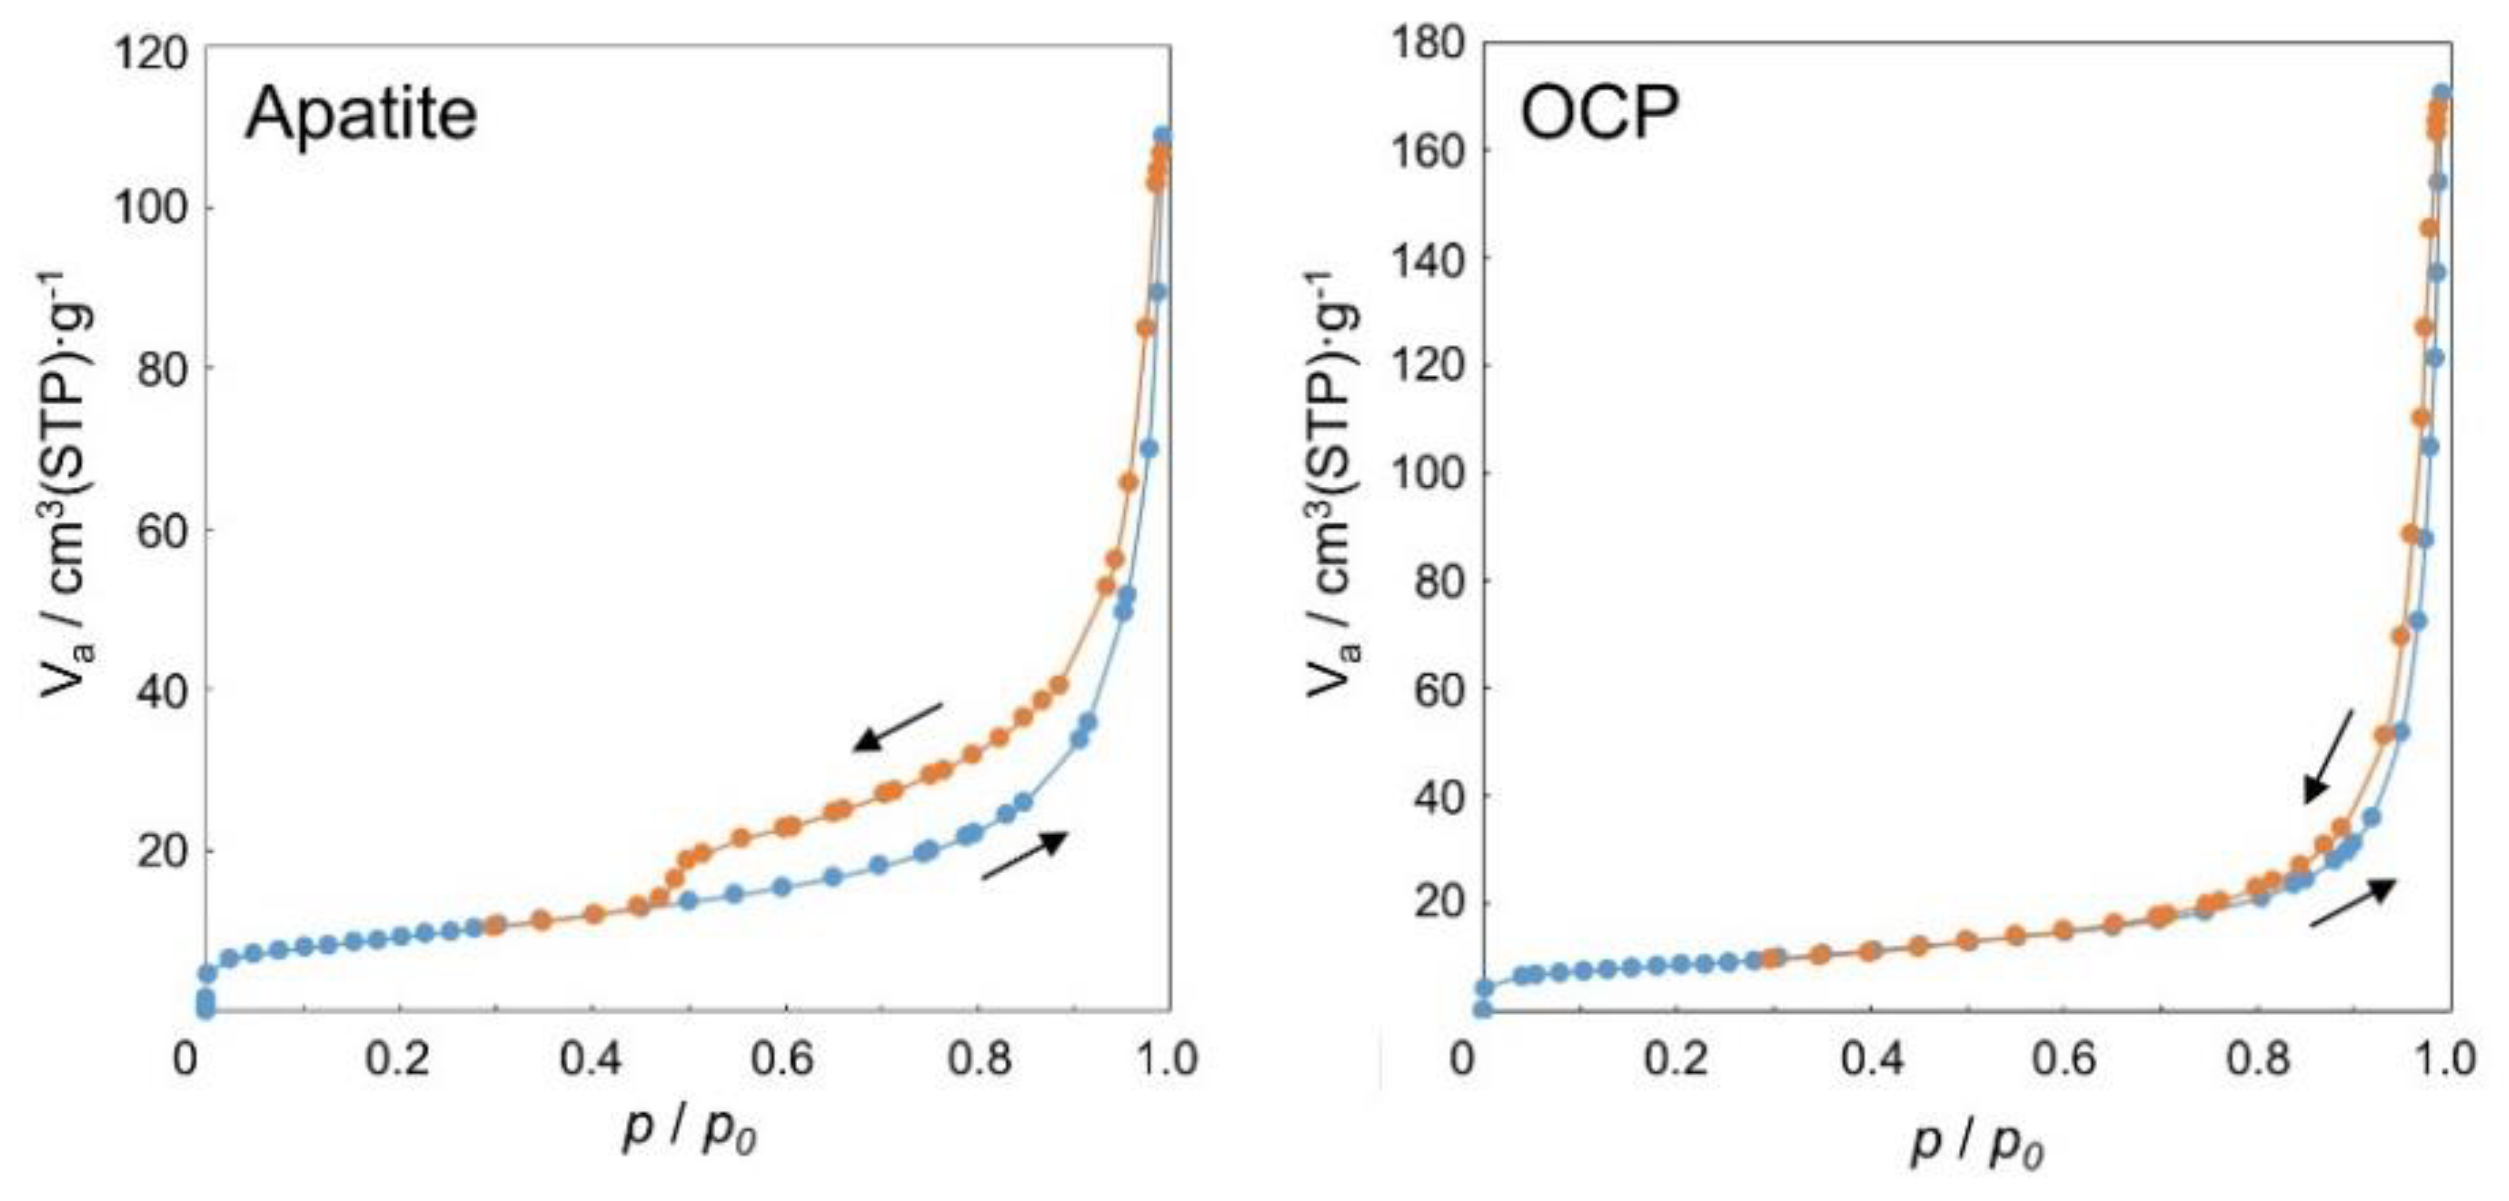
Figure 4 shows the adsorption isotherm of the apatite and OCP microspheres. In the case of apatite, the shape of the isotherm was categorized as Type IV according to the International Union of Pure and Applied Chemistry (IUPAC) classification, suggesting the existence of 2 to 50 nm mesopores. Hysteresis was observed at a relative pressure of 0.5 to 1.0, also suggesting the existence of mesopores. The shape of the hysteresis was categorized as a combination of Type H3 and H4 of the IUPAC classification. Type H3 indicates the presence of slit-type pores and aggregates of plate-like particles, and Type H4 indicates the presence of micropores smaller than 2 nm.
In the case of OCP, the shape of the isotherm was categorized as a combination of Type II and Type IV. Type II indicates that there were no pores or only macropores larger than 50 nm. Because the adsorption amount increased at a relative pressure of 0.9 or greater, there is the possibility of the presence of macropores or aggregates of the small particles. Hysteresis was observed at a relative pressure of 0.8 to 1.0, suggesting the existence of mesopores. The hysteresis pattern indicates Type H3. The specific surface area of apatite and OCP was 32.8 and 30.0 m2/g, respectively, according to BET theory.
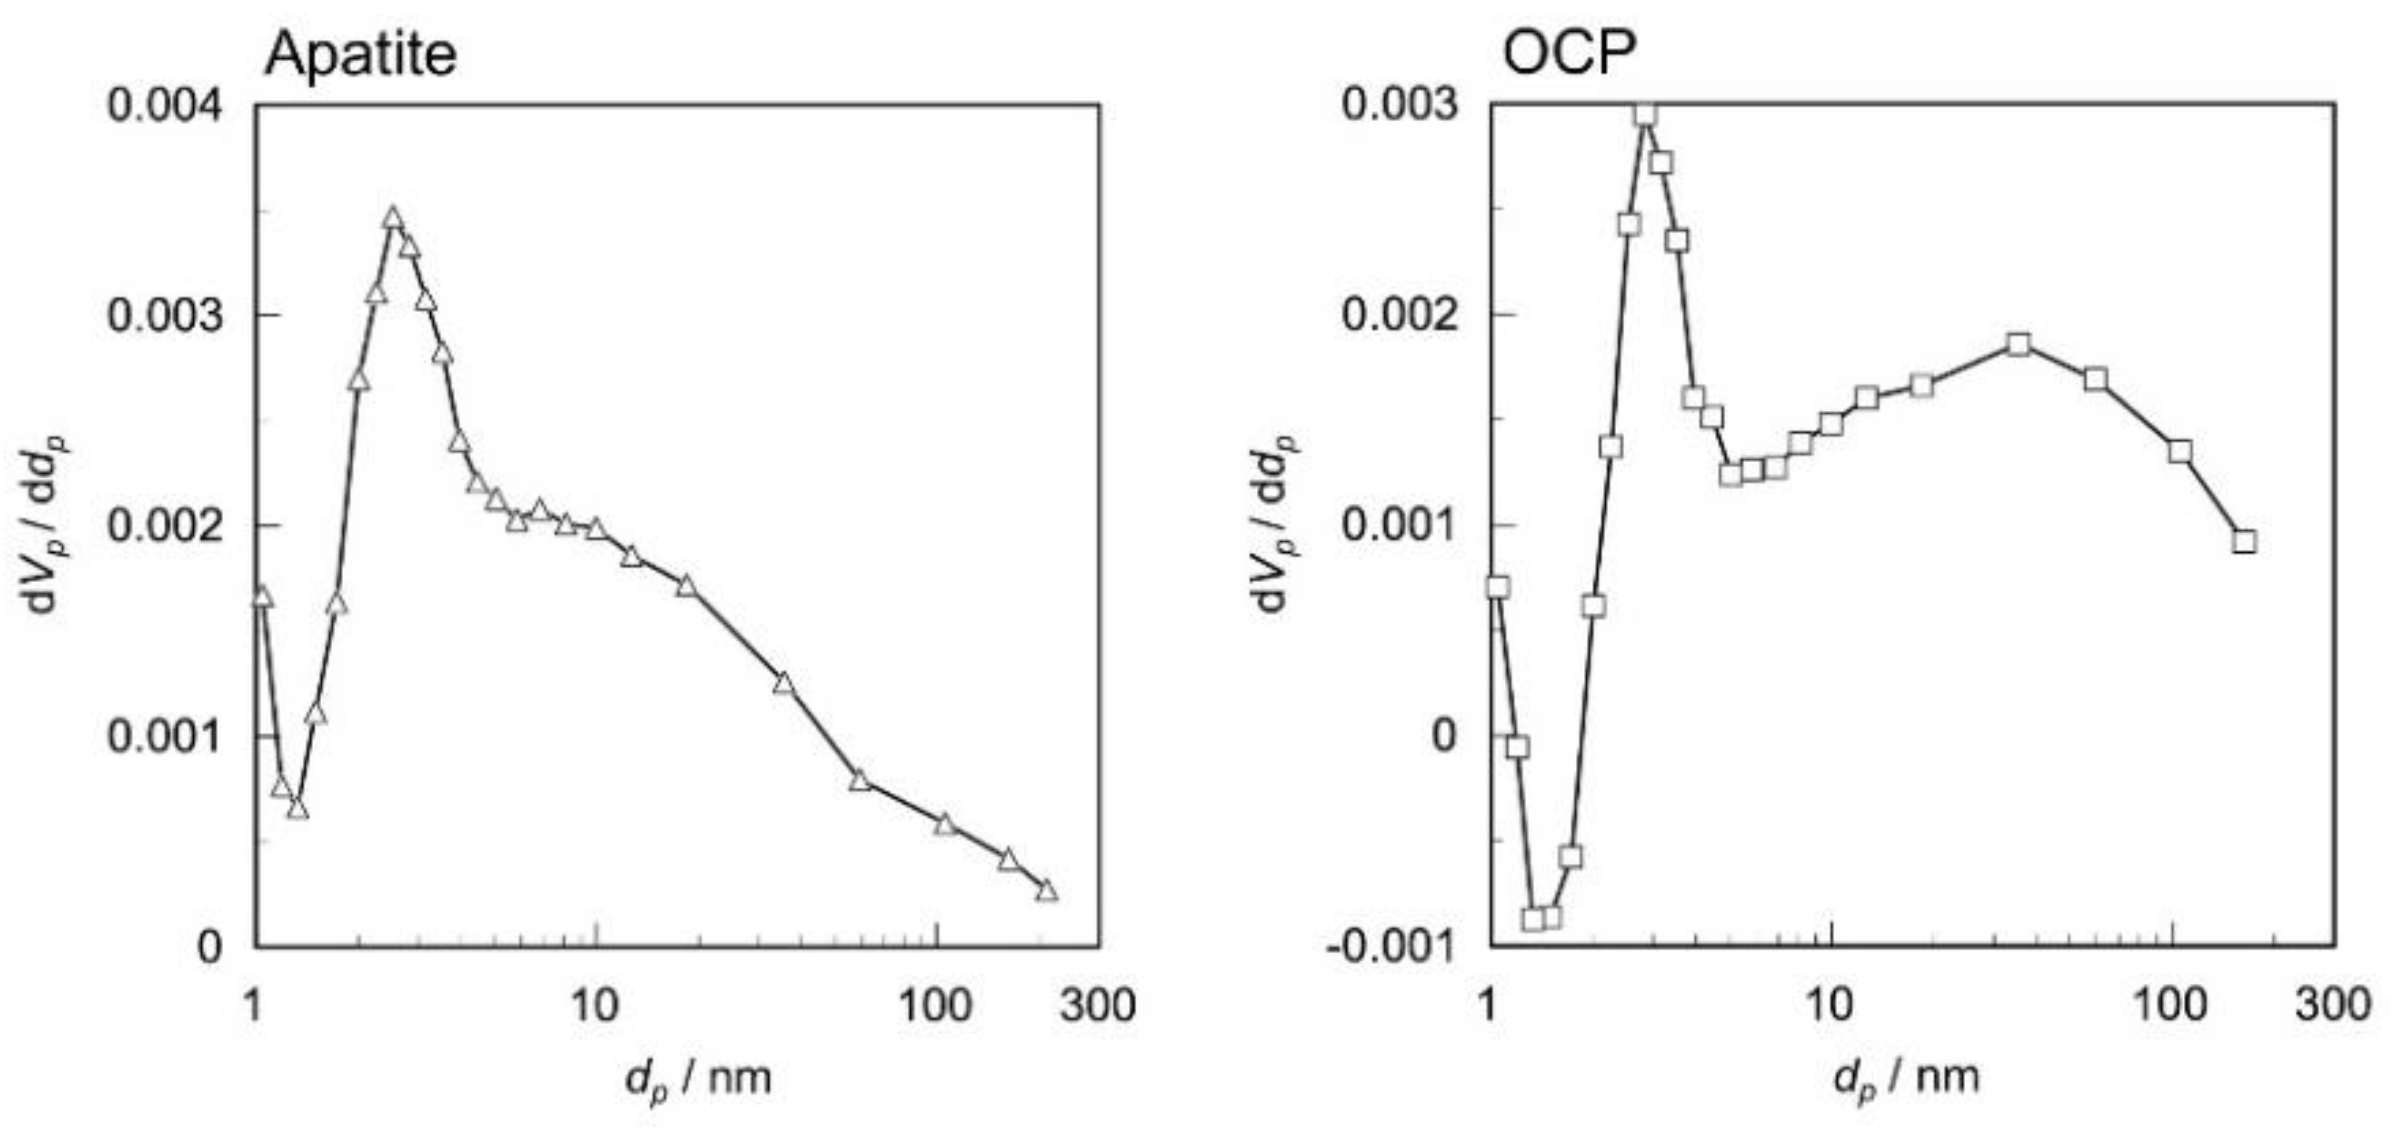
Figure 5 shows the BJH pore size distribution of the apatite and OCP microspheres. The average diameter of the pores in apatite was 20.0 nm. Distributions showing peaks near diameters of 2.5 and 7 nm were attributed to the mesopores. A broad increase in dVp/ddp was observed below 2 nm, suggesting the existence of micropores. Alternatively, the average diameter of the pores in OCP was 36.2 nm. Distributions showing peaks near 3 and 35 nm in diameter were attributed to the mesopores. In addition, a broad increase in dVp/ddp was observed at 2 nm, similar to apatite. However, the non-spherical particles observed in Figure 1 and Figure 2 may also affect the pore size distribution at the micrometer or submicron level.
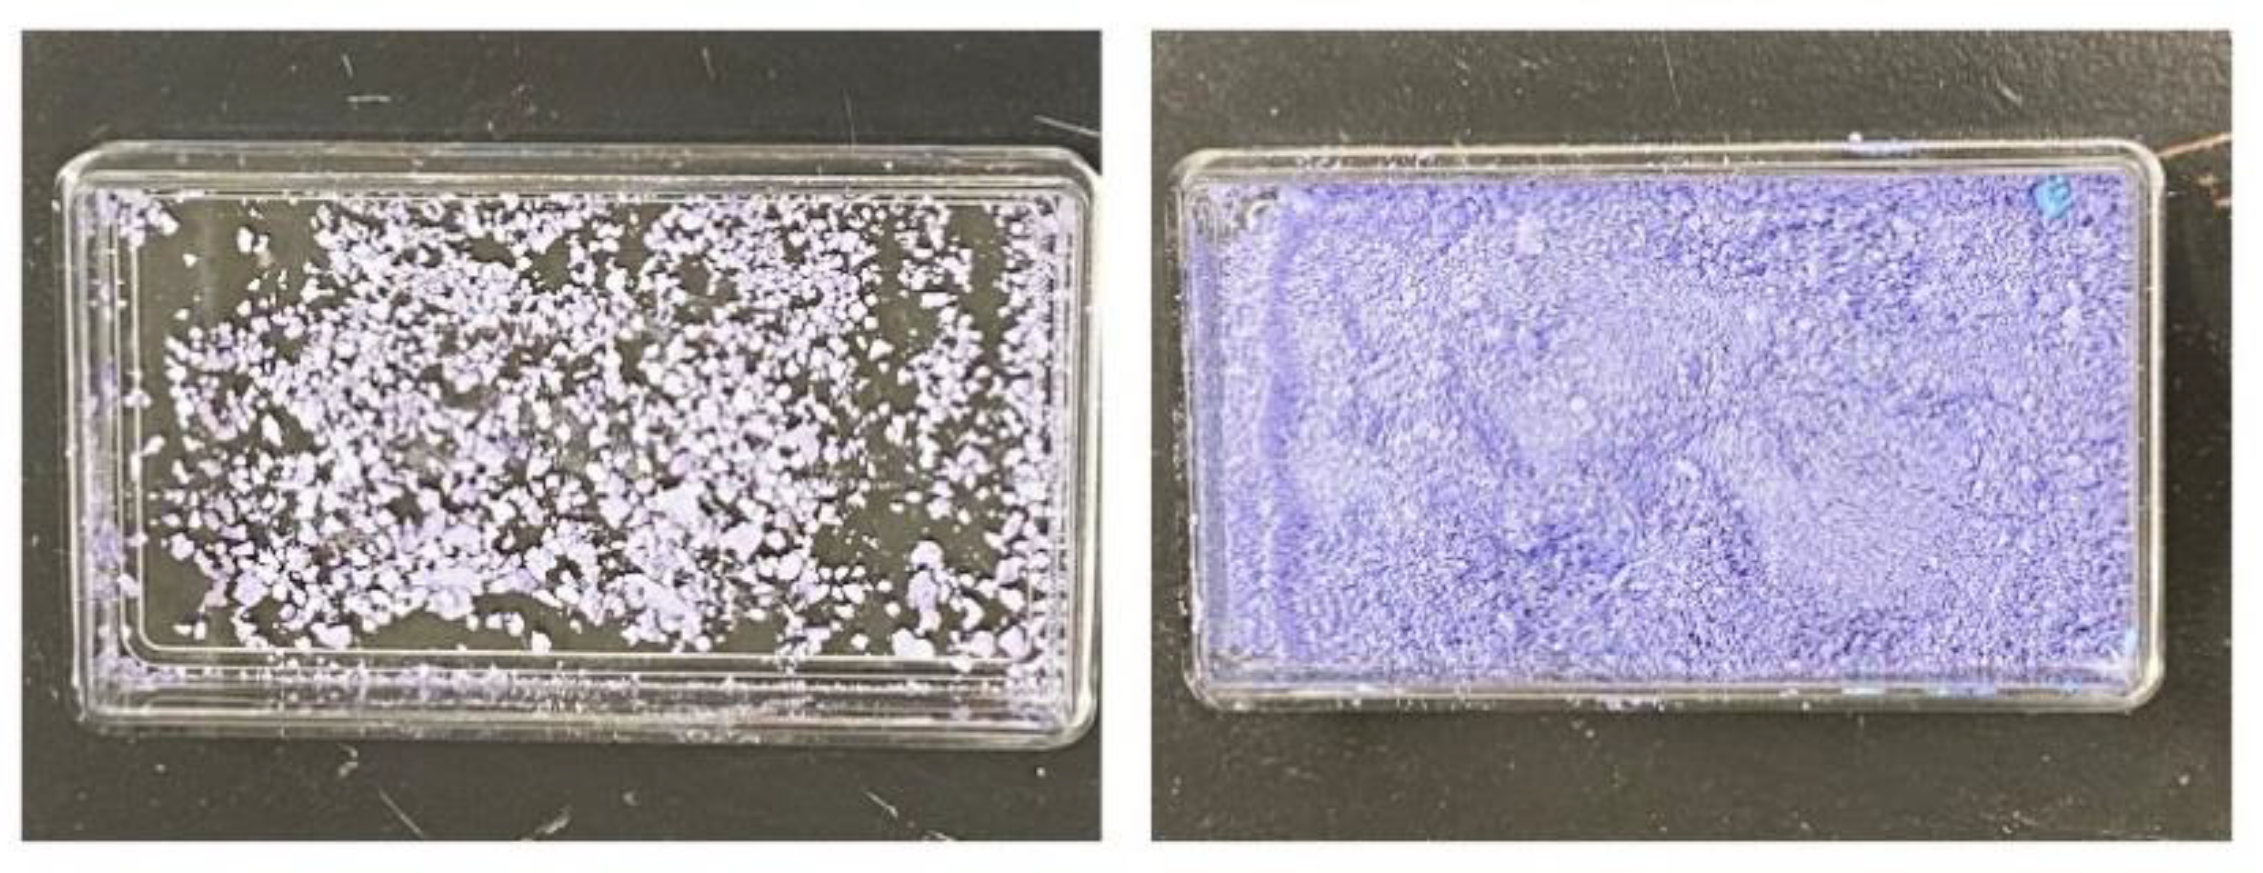
Figure 6 shows the appearance of OCP microspheres after immersion in the methylene blue solution and microspheres prepared with the addition of methylene blue. The microspheres prepared with methylene blue showed a darker blue color.
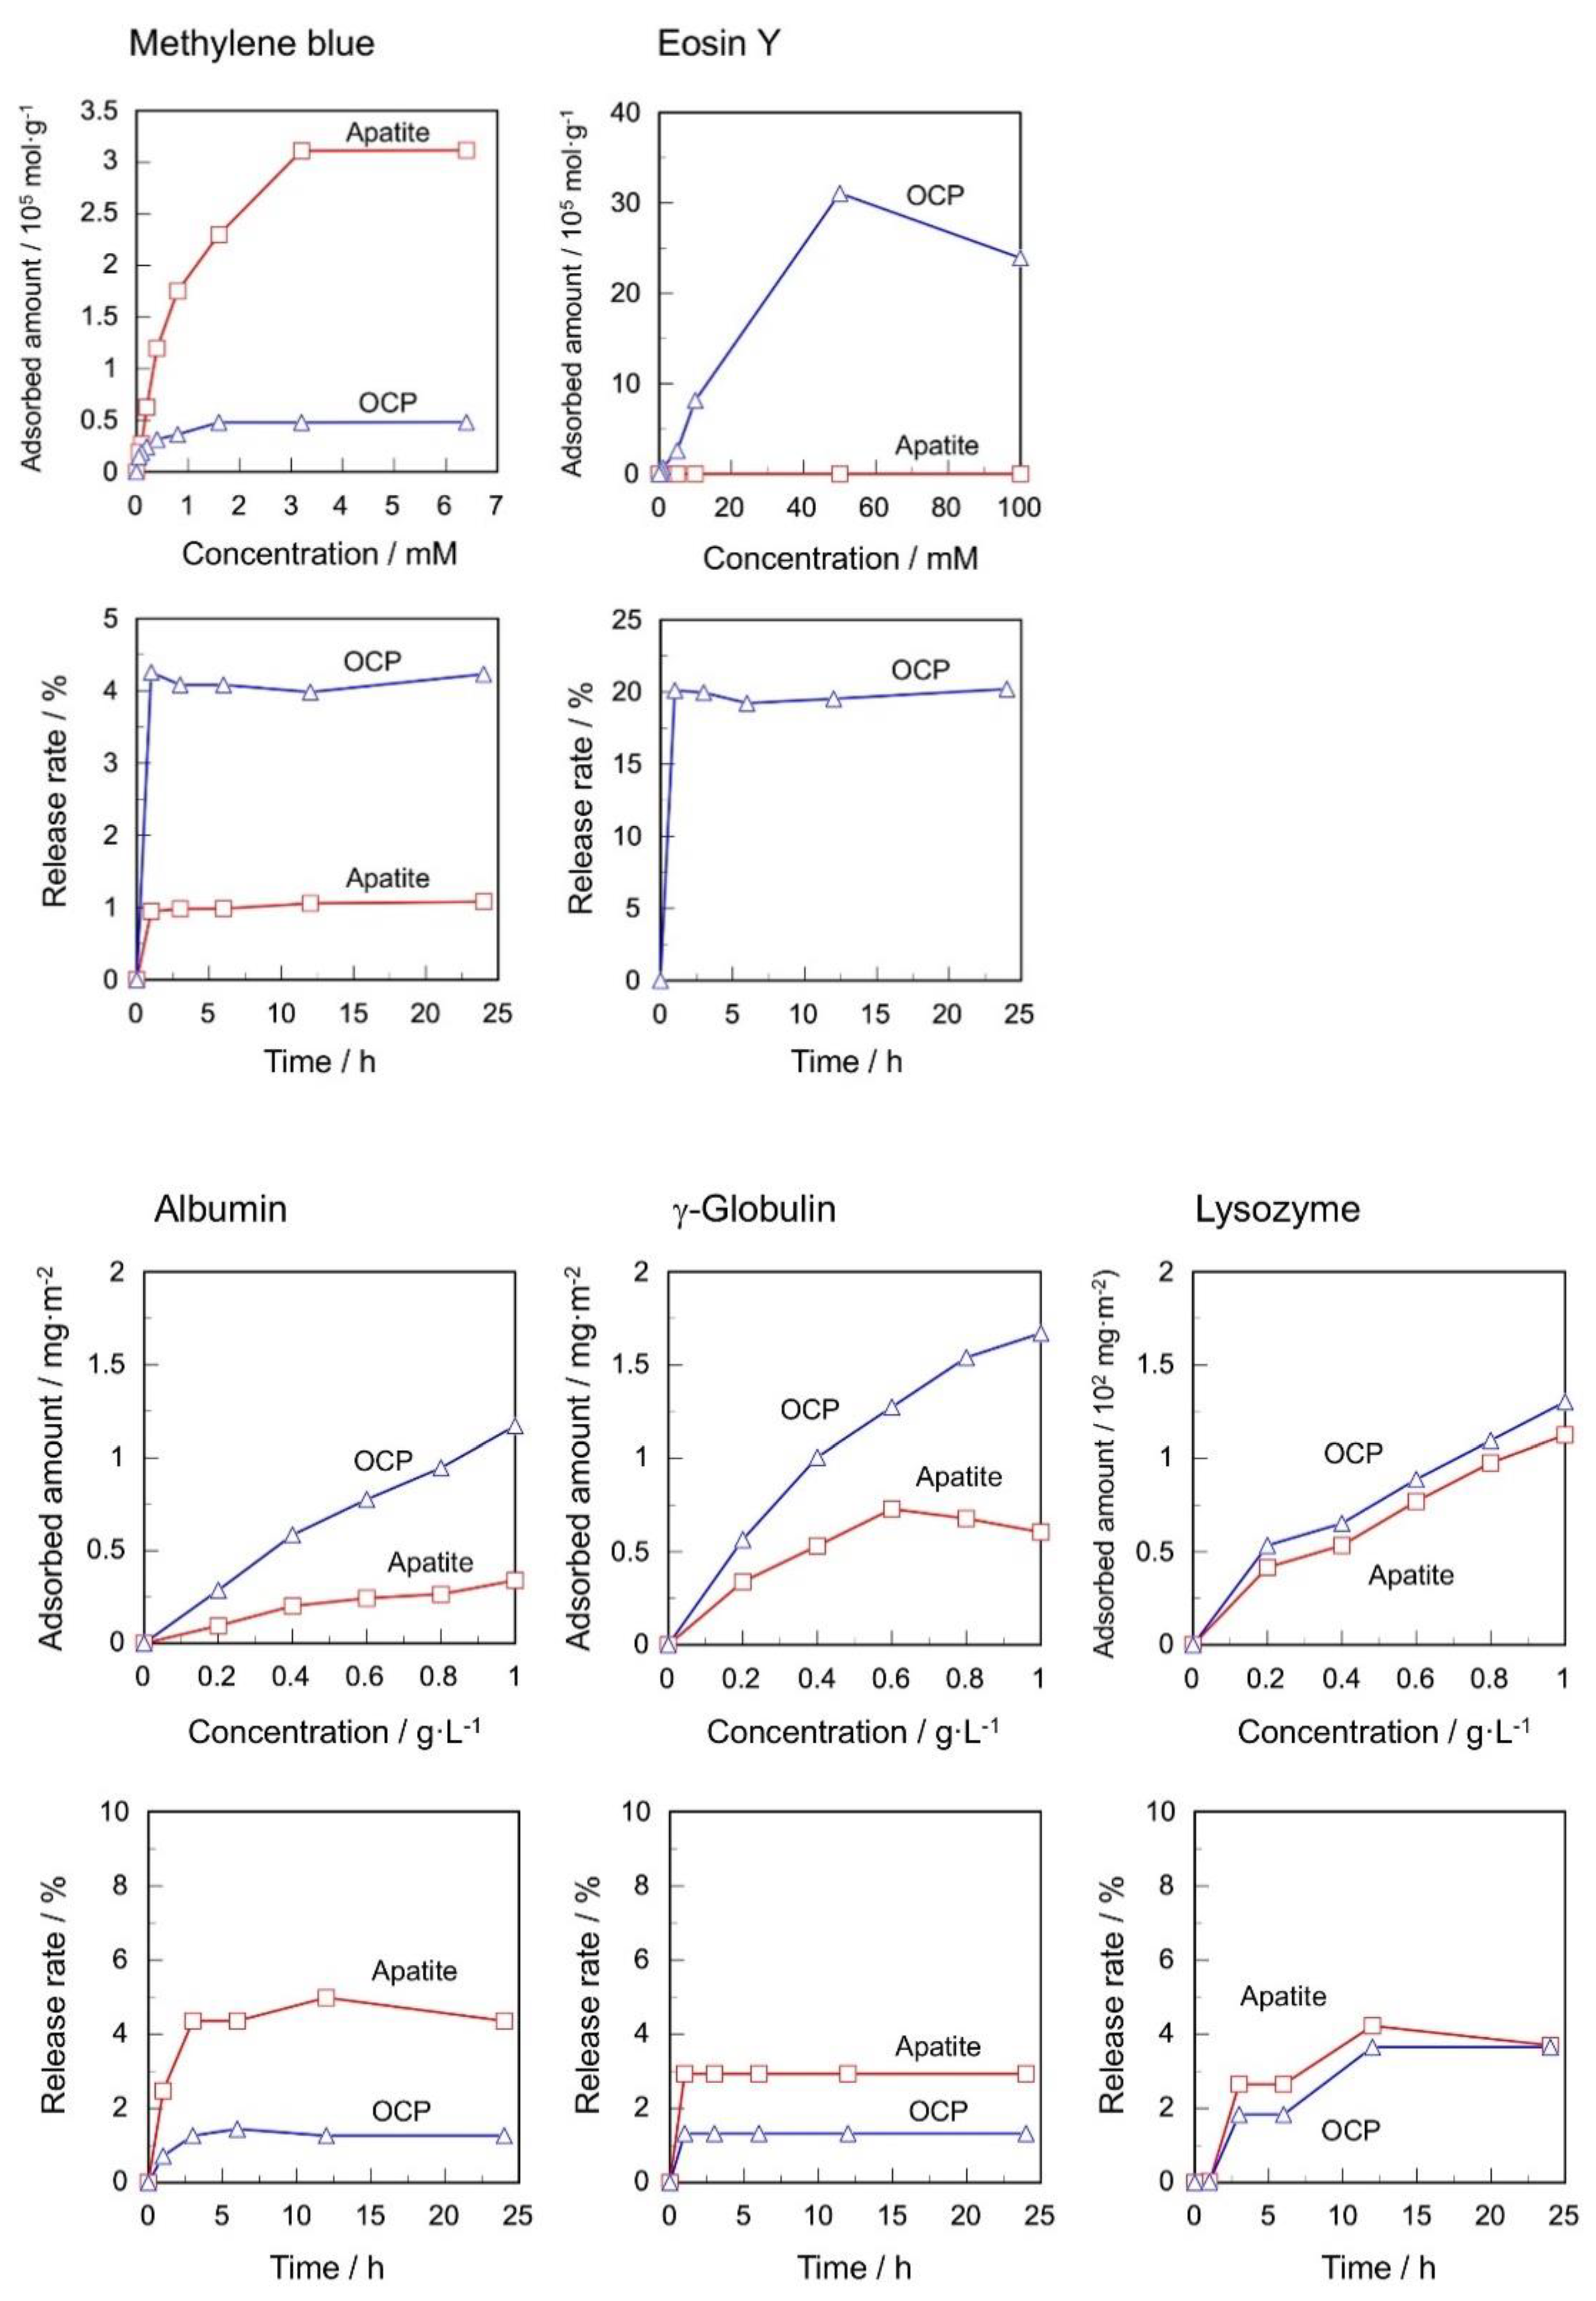
Figure 7 shows the adsorption and release profiles of various dyes and proteins incorporated into the apatite and OCP microspheres by post-treatment. The amount of methylene blue adsorbed to the apatite was greater than absorbed to OCP, and vice versa for eosin Y. In addition, OCP showed a higher release rate than apatite. The release rate of eosin Y in OCP was much greater than that in methylene blue. In the case of protein, the adsorption amount was greater in OCP, and the release rate was greater in apatite. In the case of lysozyme, the difference between the apatite and OCP was relatively small.
The zeta potential of apatite and OCP was −30.9 ± 0.6 and −20.5 ± 1.1 mV, respectively.
4. Discussion
In the synthesis of calcium phosphate microspheres by H3PO4 treatment of CaCO3 microspheres, the crystalline phase of the calcium phosphate depends on the starting material (Figure 1 and Figure 2). Specifically, low crystallinity apatite was formed at pH 6 in vaterite, while OCP was the primary crystalline phase, even at pH 6 in the calcite. Vaterite has greater solubility than calcite [18]. Therefore, an increase in local Ca2+ concentration by rapid dissolution of vaterite results in the formation of apatite with less solubility than OCP. In addition, the stable pH of OCP is 4.7 to 5.8 at 60 °C, and CaHPO4·H2O and apatite are stable at lower and higher pH, respectively [21]. These findings coincide with the results of this study.
Apatite was synthesized from CaCO3 as a starting material; however, the product contained nearly no carbonate ions (Figure 3). Apatite with 2.64 mass% carbonate is typically precipitated from a simulated body fluid with inorganic ion concentrations nearly equal to that of human plasma at pH 7.25 [22]. In a carbonate solution of approximately pH 6 (synthetic condition for apatite), 75% of the carbonate is reported to be present as CO2 and 25% is HCO3− [23]. Furthermore, the equilibrium moves to the right in the chemical reaction of Equation (1) if CO2 gas evaporates. Therefore, the amount of HCO3− decreases and it is not incorporated into the apatite crystals.
Gas formation was actually observed during the reaction of CaCO3 with H3PO4, which is similar to previous studies [20,24].
The amount of methylene blue adsorbed to the apatite was greater than that adsorbed to OCP, while the release rate of methylene blue from OCP was greater than that from apatite (Figure 6). The size of methylene blue and interlayer distance of OCP are 1.70 × 0.76 × 0.33 nm [25] and 1.87 nm [26], respectively. Therefore, the relatively small methylene blue molecules can be preferentially incorporated into the interlayer of OCP. However, the result was the opposite of the expectation. Because the apatite is more negatively charged than OCP, OCP has greater electrostatic interaction with the positively charged methylene blue. Therefore, the electrostatic interaction is a more dominant factor than the pore structure regarding the methylene blue release when it is incorporated into OCP by post treatment.
Monma showed that if OCP was synthesized in the presence of various negatively charged dicarboxylic acids, the acids were incorporated into the interlayer of OCP and the distance increased to approximately 2.6 nm depending on the molecular size of the acid [27]. In the present study, a large amount of methylene blue was incorporated during OCP synthesis (Figure 6), which was expected to promote the release of methylene blue.
Alternatively, OCP adsorbed more eosin Y than apatite, while its release rate was also greater than methylene blue (Figure 7). Considering the electrostatic interaction, it is difficult for negatively charged eosin Y to adsorb to both apatite and OCP. Although the molecular size of the eosin Y has not been reported, methylene blue (Mw = 319.9) has a chemical structure with three benzene rings, while eosin Y (Mw = 691.9) has a fourth benzene ring in the side chain, indicating a larger molecular size than methylene blue. Therefore, eosin Y is likely adsorbed on the mesopores of OCP (Figure 4 and Figure 5). As a result, the release of eosin Y is enhanced because of its weak electrostatic interaction with OCP.
OCP showed greater adsorption of all proteins than apatite (Figure 7). The long side of albumin, γ-globulin, and lysozyme are 14 nm [28], 10–20 nm [29], and 9 nm [30], respectively. Because these proteins are difficult to incorporate into the interlayer of OCP, the mesopores in OCP markedly contributed to the adsorption (Figure 4 and Figure 5). The difference in lysozyme adsorption between apatite and OCP was less than that of albumin and γ-globulin. The isoelectric points of albumin, γ-globulin, and lysozyme are 4.8 [31], 5.2 to 9.2 [32], and 11 [33], respectively; as a result, lysozyme is highly positively charged in neutral conditions. Therefore, the electrostatic interactions between the amino group on the lysozyme and the phosphate group on the microsphere surface are strong in both the apatite and OCP.
Alternatively, the release rate of all proteins from apatite was greater than from OCP (Figure 7). Apatite can easily release proteins because it contains no mesopores larger than the protein molecules. Kanno et al. investigated the release behavior of albumin and lysozyme from carbonate apatite particles [34]. In their study, the carbonate content was 1.1 mass% and the release rate of lysozyme was greater than that of albumin, which is consistent with the results of this study. However, the release rate was 60% or greater for the Kanno et al. study, which is considerably greater than our study, likely because of the high specific surface area (75 m2/g) and use of a dynamic fluid system for the protein release.
Suzuki et al. reported that OCP has better albumin adsorption capacity than apatite obtained by hydrolysis of OCP [35], which is consistent with this study. The results of Suzuki et al. also suggest that the adsorption characteristics gradually change in the biological environment. However, there are no studies comparing the hydrolysis rate of OCP in the presence of proteins. Alternatively, the hydrolysis rate of α-TCP to OCP decreases in the presence of polyacrylic acid [36]. Therefore, the adsorbed protein might stabilize the OCP phase in the biological environment. This point should be clarified in future studies.
All of the calcium phosphates used in this study were negatively charged. Although protein adsorption on negatively charged apatite and positively charged alumina was previously compared in aqueous solutions containing bovine serum [37], there is no comparative study concerning the protein adsorption on calcium phosphates that are positively and negatively charged. Aizawa et al. found that some of the c-axis oriented fibrous apatite is positively charged [38], suggesting the potential to study protein adsorption on positively and negatively charged calcium phosphates.
The protein release rate from the microspheres in this study was less than 6% for all conditions, suggesting chemical adsorption of the proteins (Figure 7). Particle size has a great influence on the protein release behavior from apatite. Wen et al. fabricated a thin film comprising apatite and OCP with a thickness of 0.3 µm and length of 5 µm on titanium substrates [39]. The albumin adsorbed on the film had limited release at pH 7.4; however, 30% or more was released at pH 4.0. The release rate of cytochrome c from rod-shaped apatite with a length of 200 nm to 2 µm was also 20% or less [40]. Alternatively, the release rate of albumin from the rod-shaped apatite with a length of 40 to 100 nm was 90% or more, even at pH 7.2 [41]. Furthermore, the protein release behavior from polymer fibers is controlled by hydrophilicity [42]. Future works should investigate the important factors of particle size and surface wettability to promote protein release.
5. Conclusions
Apatite microspheres were prepared by H3PO4 treatment of vaterite at pH 6, and OCP microspheres were prepared by H3PO4 treatment of calcite at pH 5 to 6. A comparison of the adsorption and release of various dyes and proteins from the microspheres suggested that electrostatic interactions were dominant for methylene blue and the pore structure was dominant for eosin Y and proteins. These results are expected to provide a guideline for obtaining sustained drug release properties from calcium phosphate microspheres.
Author Contributions
Conceptualization, T.M.; methodology, K.M. and K.S.; investigation, K.M. and K.S.; resources, T.M.; data curation, K.M.; writing—original draft preparation, T.M.; writing—review and editing, T.M.; visualization, T.M.; supervision, T.M.; project administration, T.M. All authors have read and agreed to the published version of the manuscript.
Funding
This research received no external funding.
Institutional Review Board Statement
Not applicable.
Informed Consent Statement
Not applicable.
Data Availability Statement
Data is contained within the article.
Acknowledgments
We thank Ashleigh Cooper, from Edanz (https://jp.edanz.com/ac, accessed on 6 June 2021) for editing a draft of this manuscript.
Conflicts of Interest
The authors declare no conflict of interest.
References
- Parent, M.; Baradari, H.; Champion, E.; Damia, C.; Viana-Trecant, M. Design of calcium phosphate ceramics for drug delivery applications in bone diseases: A review of the parameters affecting the loading and release of the therapeutic substance. J. Control. Release 2017, 252, 1–17. [Google Scholar] [CrossRef] [PubMed]
- Mondal, S.; Dorozhkin, S.V.; Pal, U. Recent progress on fabrication and drug delivery applications of nanostructured hydroxyapatite. WIREs Nanomed. Nanobiotechnol. 2018, 10, e1504. [Google Scholar] [CrossRef]
- Wiedeman, M.P. Dimensions of blood vessels from distributing artery to collecting vein. Circ. Res. 1963, 12, 375–378. [Google Scholar] [CrossRef] [PubMed] [Green Version]
- Yang, Y.Y.; Chia, H.H.; Chung, T.S. Effect of preparation temperature on the characteristics and release profiles of PLGA microspheres containing protein fabricated by double-emulsion solvent extraction/evaporation method. J. Control. Release 2000, 69, 81–96. [Google Scholar] [CrossRef]
- Lu, L.; Stamatas, G.N.; Mikos, A.G. Controlled release of transforming growth factor β1 from biodegradable polymer microparticles. J. Biomed. Mater. Res. 2000, 50, 440–451. [Google Scholar] [CrossRef]
- Ho, M.L.; Fu, Y.C.; Wang, G.W.; Chen, H.T.; Chang, J.K.; Tsai, T.H.; Wang, C.K. Controlled release carrier of BSA made by W/O/W emulsion method containing PLGA and hydroxyapatite. J. Control. Release 2008, 128, 142–148. [Google Scholar] [CrossRef] [PubMed]
- Chen, Y.; Liu, Z.; Jiang, T.; Zou, X.; Lei, L.; Yan, W.; Yang, J.; Li, B. Strontium-substituted biphasic calcium phosphate microspheres promoted degradation performance and enhanced bone regeneration. J. Biomed. Mater. Res. A 2020, 108, 895–905. [Google Scholar] [CrossRef]
- Mima, Y.; Fukumoto, S.; Koyama, H.; Okada, M.; Tanaka, S.; Shoji, T.; Emoto, M.; Furuzono, T.; Nishizawa, Y.; Inaba, M. Enhancement of cell-based therapeutic angiogenesis using a novel type of injectable scaffolds of hydroxyapatite-polymer nanocomposite microspheres. PLoS ONE 2012, 7, e35199. [Google Scholar] [CrossRef] [Green Version]
- Sambudi, N.S.; Cho, S.; Cho, K. Porous hollow hydroxyapatite microspheres synthesized by spray pyrolysis using a microalga template: Preparation, drug delivery, and bioactivity. RSC Adv. 2016, 6, 43041–43048. [Google Scholar] [CrossRef]
- Chou, J.; Valenzuela, S.; Green, D.W.; Kohan, L.; Milthorpe, B.; Otsuka, M.; Ben-Nissan, B. Antibiotic delivery potential of nano- and micro-porous marine structure-derived β-tricalcium phosphate spheres for medical applications. Nanomedicine 2014, 9, 1131–1139. [Google Scholar] [CrossRef]
- Tripathi, G.; Miyazaki, T. Synthesis and in vitro biodegradation of pure octacalcium phosphate spheres. Int. J. Appl. Ceram. Tech. 2020, 17, 372–379. [Google Scholar] [CrossRef] [Green Version]
- Kamitakahara, M.; Ishii, A.; Matsubara, H.; Kawashita, M.; Furuya, M.; Kanetaka, H. Fabrication and evaluation of ascorbic acid phosphate-loaded spherical porous hydroxyapatite/octacalcium phosphate granules. J. Ceram. Soc. Jpn. 2021, 129, 60–65. [Google Scholar] [CrossRef]
- Victor, S.P.; Kumar, T.S.S. BCP ceramic microspheres as drug delivery carriers: Synthesis, characterisation and doxycycline release. J. Mater. Sci.: Mater. Med. 2008, 19, 283–290. [Google Scholar] [CrossRef] [PubMed]
- Veljović, D.; Palcevskis, E.; Dindune, A.; Putić, S.; Balać, I.; Petrović, R.; Janaćković, D. Microwave sintering improves the mechanical properties of biphasic calcium phosphates from hydroxyapatite microspheres produced from hydrothermal processing. J. Mater. Sci. 2010, 45, 3175–3183. [Google Scholar] [CrossRef]
- Ding, G.-J.; Zhu, Y.-J.; Qi, C.; Lu, B.-Q.; Wu, J.; Chen, F. Porous microspheres of amorphous calcium phosphate: Block copolymer templated microwave-assisted hydrothermal synthesis and application in drug delivery. J. Colloid Interface Sci. 2015, 443, 72–79. [Google Scholar] [CrossRef]
- Kokubo, T.; Ito, S.; Huang, Z.T.; Hayashi, T.; Sakka, S.; Kitsugi, T.; Yamamuro, T. Ca, P-rich layer formed on high-strength bioactive glass-ceramic A–W. J. Biomed. Mater. Res. 1990, 24, 331–343. [Google Scholar] [CrossRef]
- Ban, S.; Maruno, S. Morphology and microstructure of electrochemically deposited calcium phosphates in a modified simulated body fluid. Biomaterials 1998, 19, 1245–1253. [Google Scholar] [CrossRef]
- Trushina, D.B.; Bukreeva, T.V.; Kovalchuk, M.V.; Antipina, M.N. CaCO₃ vaterite microparticles for biomedical and personal care applications. Mater. Sci. Eng. C 2014, 45, 644–658. [Google Scholar] [CrossRef]
- Kamitakahara, M.; Ohtsuki, C.; Takahashi, A.; Tanihara, M. Effect of silane-coupling treatment on thermal decomposition of octacalcium phosphate. J. Soc. Mater. Sci. Jpn. 2006, 55, 881–884. [Google Scholar] [CrossRef] [Green Version]
- Minh, D.P.; Rio, S.; Sharrock, P.; Sebei, H.; Lyczko, N.; Tran, N.D.; Raii, M.; Nzihou, A. Hydroxyapatite starting from calcium carbonate and orthophosphoric acid: Synthesis, characterization, and applications. J. Mater. Sci. 2014, 49, 4261–4269. [Google Scholar] [CrossRef] [Green Version]
- Monma, H. Octacalcium phosphate. Gypsum Lime 1980, 1980, 113–121. (In Japanese) [Google Scholar]
- Kim, H.M.; Kishimoto, K.; Miyaji, F.; Kokubo, T.; Yao, T.; Suetsugu, Y.; Tanaka, J.; Nakamura, T. Composition and structure of the apatite formed on PET substrates in SBF modified with various ionic activity products. J. Biomed. Mater. Res. 1999, 46, 228–235. [Google Scholar] [CrossRef]
- Pismenskaya, N.; Laktionov, E.; Nikonenko, V.; Attar, A.E.; Auclair, B.; Pourcelly, G. Dependence of composition of anion-exchange membranes and their electrical conductivity on concentration of sodium salts of carbonic and phosphoric acids. J. Membr. Sci. 2001, 181, 185–197. [Google Scholar] [CrossRef]
- Bournonville, B.; Nzihou, A.; Sharrock, P.; Depelsenaire, G. Stabilization of minerals by reaction with phosphoric acid: Evolution of model compounds. Process Saf. Environ. Prot. 2006, 84, 117–124. [Google Scholar] [CrossRef] [Green Version]
- Arias, M.; López, E.; Nuñez, A.; Rubinos, D.; Soto, B.; Barral, M.T.; Díaz-Fierros, F. Adsorption of methylene blue by red mud, an oxide-rich byproduct of bauxite refining. In Effect of Mineral-Organic-Microorganism Interactions on Soil and Freshwater Environments; Berthelin, J., Huang, P.M., Bollag, J.M., Andreux, F., Eds.; Springer: Berlin, Germany, 1999; pp. 361–365. [Google Scholar]
- Aoki, S.; Sakamoto, K.; Yamaguchi, S.; Nakahira, A. Syntheses of octacalcium phosphate containing dicarboxylic acids and effects of the side groups on the crystal growth of octacalcium phosphate. J. Ceram. Soc. Jpn. 2000, 108, 909–914. [Google Scholar] [CrossRef] [Green Version]
- Monma, H. The incorporation of dicarboxylates into octacalcium bis(hydrogenphosphate) tetrakis(phosphate) pentahydrate. Bull. Chem. Soc. Jpn. 1984, 57, 599–600. [Google Scholar] [CrossRef] [Green Version]
- Comper, W.D.; Glasgow, E.F. Charge selectivity in kidney ultrafiltration. Kidney Int. 1995, 47, 1242–1251. [Google Scholar] [CrossRef] [Green Version]
- Gibizova, V.V.; Sergeeva, I.A.; Petrova, G.P.; Priezzhev, A.V.; Khlebtsov, N.G. Interaction of albumin and γ-globulin molecules with gold nanoparticles in water solutions. Mosc. Univ. Phys. Bull. 2011, 66, 449–452. [Google Scholar] [CrossRef]
- Colvin, J.R. The size and shape of lysozyme. Can. J. Chem. 1952, 30, 831–834. [Google Scholar] [CrossRef]
- Peters, T. Serum albumin. Adv. Protein Chem. 1985, 37, 161–245. [Google Scholar]
- Da Vela, S.; Roosen-Runge, F.; Skoda, M.W.A.; Jacobs, R.M.J.; Seydel, T.; Frielinghaus, H.; Sztucki, M.; Schweins, R.; Zhang, F.; Schreiber, F. Effective interactions and colloidal stability of bovine γ-globulin in solution. J. Phys. Chem. B 2017, 121, 5759–5769. [Google Scholar] [CrossRef] [Green Version]
- Proctor, V.A.; Cunningham, F.E. The chemistry of lysozyme and its use as a food preservative and a pharmaceutical. CRC Crit. Rev. Food Sci. Nutr. 1988, 26, 359–395. [Google Scholar] [CrossRef]
- Kanno, T.; Inaba, M.; Sendai, T.; Horiuchi, J. Protein release properties on carbonate ion-containing apatite in a flow system. J. Ceram. Soc. Jpn. 2013, 121, 393–396. [Google Scholar] [CrossRef] [Green Version]
- Suzuki, O.; Yagishita, H.; Yamazaki, M.; Aoba, T. Adsorption of bovine serum albumin onto octacalcium phosphate and its hydrolyzates. Cells Mater. 1995, 5, 45–54. [Google Scholar]
- Bigi, A.; Boanini, E.; Botter, R.; Panzavolta, S.; Rubini, K. Alpha-tricalcium phosphate hydrolysis to octacalcium phosphate: Effect of sodium polyacrylate. Biomaterials 2002, 23, 1849–1854. [Google Scholar] [CrossRef]
- Kawashita, M.; Hayashi, J.; Kudo, T.; Kanetaka, H.; Li, Z.; Miyazaki, T.; Hashimoto, M. MC3T3-E1 and RAW264.7 cell response to hydroxyapatite and alpha-type alumina adsorbed with bovine serum albumin. J. Biomed. Mater. Res. A 2014, 102, 1880–1886. [Google Scholar] [CrossRef] [PubMed] [Green Version]
- Zhuang, Z.; Fujimi, T.J.; Nakamura, M.; Konishi, T.; Yoshimura, H.; Aizawa, M. Development of a,b-plane-oriented hydroxyapatite ceramics as models for living bones and their cell adhesion behavior. Acta Biomater. 2013, 9, 6732–6740. [Google Scholar] [CrossRef] [PubMed]
- Wen, H.B.; de Wijn, J.R.; van Blitterswijk, C.A.; de Groot, K. Incorporation of bovine serum albumin in calcium phosphate coating on titanium. J. Biomed. Mater. Res. 1999, 46, 245–252. [Google Scholar] [CrossRef]
- Matsumoto, T.; Okazaki, M.; Inoue, M.; Yamaguchi, S.; Kusunose, T.; Toyonaga, T.; Hamada, Y.; Takahashi, J. Hydroxyapatite particles as a controlled release carrier of protein. Biomaterials 2004, 25, 3807–3812. [Google Scholar] [CrossRef]
- Dasgupta, S.; Banerjee, S.S.; Bandyopadhyay, A.; Bose, S. Zn- and Mg-doped hydroxyapatite nanoparticles for controlled release of protein. Langmuir 2010, 26, 4958–4964. [Google Scholar] [CrossRef] [PubMed] [Green Version]
- Maretschek, S.; Greiner, A.; Kissel, T. Electrospun biodegradable nanofiber nonwovens for controlled release of proteins. J. Control. Release 2008, 127, 180–187. [Google Scholar] [CrossRef] [PubMed]
Figure 1.
X-ray diffraction pattern and scanning electron microscope photograph of the microspheres obtained by H3PO4 treatment of the vaterite microspheres.
Figure 1.
X-ray diffraction pattern and scanning electron microscope photograph of the microspheres obtained by H3PO4 treatment of the vaterite microspheres.

Figure 2.
X-ray diffraction patterns and scanning electron microscope photographs of the microspheres obtained by H3PO4 treatment of the calcite microspheres at various pH values.
Figure 2.
X-ray diffraction patterns and scanning electron microscope photographs of the microspheres obtained by H3PO4 treatment of the calcite microspheres at various pH values.

Figure 3.
FT-IR spectra of the OCP, apatite, and calcite microspheres.

Figure 4.
Adsorption isotherm of the apatite and OCP microspheres.

Figure 5.
BJH pore size distribution of apatite and OCP microspheres.

Figure 6.
Appearance of OCP microspheres after immersion in the methylene blue solution (Left) and microspheres prepared with the addition of methylene blue (Right).
Figure 6.
Appearance of OCP microspheres after immersion in the methylene blue solution (Left) and microspheres prepared with the addition of methylene blue (Right).

Figure 7.
Adsorption and release profiles of various dyes and proteins incorporated into apatite and OCP microspheres by post treatment. The release rate of eosin Y from the apatite was not measured because the adsorbed amount was too small.
Figure 7.
Adsorption and release profiles of various dyes and proteins incorporated into apatite and OCP microspheres by post treatment. The release rate of eosin Y from the apatite was not measured because the adsorbed amount was too small.

Publisher’s Note: MDPI stays neutral with regard to jurisdictional claims in published maps and institutional affiliations. |
© 2021 by the authors. Licensee MDPI, Basel, Switzerland. This article is an open access article distributed under the terms and conditions of the Creative Commons Attribution (CC BY) license (https://creativecommons.org/licenses/by/4.0/).
Share and Cite
MDPI and ACS Style
Miyazaki, T.; Masuda, K.; Sakamoto, K. Release Profiles of Dyes and Proteins from Calcium Phosphate Microspheres with Different Crystalline Phases. Ceramics 2021, 4, 291-301. https://0-doi-org.brum.beds.ac.uk/10.3390/ceramics4020023
AMA Style
Miyazaki T, Masuda K, Sakamoto K. Release Profiles of Dyes and Proteins from Calcium Phosphate Microspheres with Different Crystalline Phases. Ceramics. 2021; 4(2):291-301. https://0-doi-org.brum.beds.ac.uk/10.3390/ceramics4020023
Chicago/Turabian StyleMiyazaki, Toshiki, Koudai Masuda, and Kazuki Sakamoto. 2021. "Release Profiles of Dyes and Proteins from Calcium Phosphate Microspheres with Different Crystalline Phases" Ceramics 4, no. 2: 291-301. https://0-doi-org.brum.beds.ac.uk/10.3390/ceramics4020023