Electrical Properties of Reversed-Polarity Ball Plasmoid Discharges


1
Department of Chemistry, University of Illinois at Urbana-Champaign, Urbana, IL 61801, USA
2
Department of Mechanical Science and Engineering, University of Illinois at Urbana-Champaign, Urbana, IL 61801, USA
*
Author to whom correspondence should be addressed.
Plasma 2020, 3(3), 92-102; https://0-doi-org.brum.beds.ac.uk/10.3390/plasma3030008
Submission received: 18 May 2020
/
Revised: 19 June 2020
/
Accepted: 23 June 2020
/
Published: 29 June 2020
Abstract
:Ball plasmoid discharges are a unique type of atmospheric-pressure plasma discharge with a lifetime on the order of a hundred milliseconds without attachment to a power source. These discharges are generated by a moderate current pulse over the surface of an aqueous electrolyte, and some consider the spherical plasmoid that results to bear some resemblance to ball lightning. This article presents the first analysis of the electrical properties of ball plasmoid discharges in a reversed-polarity configuration, i.e., with the central electrode serving as the anode rather than as the cathode. These experiments demonstrate that ball plasmoids can indeed be generated with either electrode polarity with similar observable properties. These results are contrary to what has previously been discussed in the literature and raise additional questions regarding formation mechanisms of ball plasmoids. Analysis of images and electrical measurements collected at various discharge energies show that two distinct processes occur during discharges with our circuitry and in this reversed-polarity configuration: the formation of spark channels between the anode and electrolyte, and the generation of streamers and a jet from the surface of the anode.
1. Introduction
Recently, several publications have described the generation and analysis of ball plasmoid discharges [1,2,3,4,5,6,7,8,9,10,11,12]. Ball plasmoids are uniquely long-lived at atmospheric pressure and are generated via a pulse of stored energy from a capacitor bank over the surface of an electrolyte. Tens of kilojoules of stored energy facilitate current flow on the order of tens of Amps, depending on the magnitude of the stored energy. This geometry facilitates the formation of a spheroidal plasma which eventually detaches from the electrodes and exists as a self-sustaining plasmoid for approximately 100 ms before dissipating. The plasma formed at the central electrode has been shown to contain metal vapors, water vapor, excited atoms and molecules, and various ions. Some authors claim that this system is analogous to naturally-occurring ball lightning; however, the methods used in this article to generate ball plasmoid discharges are not sufficiently similar to make a comparison to this mysterious phenomenon.
In addition to this long lifetime, there are several components of the discharge which are fundamentally interesting, but make analyzing this system difficult. For example, it has been shown [12] that the early stages of ball plasmoid formation are governed by the development of streamers (arcs) between the central electrode and grounded electrolyte, and that these arc channels are highly dynamic. There are also processes occurring on several time scales that must be studied to develop a complete understanding of these discharges; e.g., electron impact excitation and ionization, chemical reaction processes, and fluid dynamic effects. Since the first description of the production of ball plasmoids in 2002 [1], incremental progress has been made in understanding the physics and chemistry of these discharges; however, more experiments and models are needed to fully describe the initiation, formation, and dissipation of ball plasmoid discharges.
References [1,2,3,4,5,6,7,8,9,10,11,12] describe the production of ball plasmoids from a specific electrode polarity. The typical configuration for ball plasmoid discharges utilizes the central electrode as the cathode, while the submerged ring electrode serves as the anode. In some cases, a small volume of electrolyte is pipetted directly onto the surface of the cathode to generate the discharge. For the experiments presented in this article, however, the polarity of the electrodes is reversed, i.e., the central rod is the anode, and the surrounding electrolyte is the cathode. Furthermore, no electrolyte is added to the surface of the central electrode; this modification was made to remove any potential electrical (or chemical) effects resulting from the presence of water. Contrary to what has previously been reported, the addition of water to the central electrode does not appear to be critical for the formation of the discharge.
As will be demonstrated below, plasmoids generated by a reversed-polarity discharge do not appear to be significantly different from those generated with the opposite polarity. In this article, we present a parameterized electrical analysis of ball plasmoids generated in a reversed-polarity configuration. We also expand on the work presented in [7] by performing measurements of current and voltage at various discharge energies and analyzing the resulting waveforms to describe the electrical properties of the discharge. We demonstrate that when ball plasmoids are generated in a reversed-polarity configuration (with our circuit), two distinct processes are occurring, namely, electrical connection between the anode and electrolyte via spark channels, and the emanation of streamers and a jet from the anode.
2. Experimental
2.1. Plasmoid Generator
Ball plasmoids are generated by a pulsed discharge over the surface of an electrolyte (Figure 1) [10,11]. A Glassman EK Series high-voltage DC power supply is used to charge a parallel-plate capacitor (873 F, Maxwell); typical discharge potentials are set between 5000–8000 V (DC). An Arduino Uno microcontroller board controls three Ross Engineering E-series high voltage switches and a GigaVac G50WF (Sensata Technologies, Attleboro, MA, USA) vacuum relay, all of which govern current flow through the system. The same microcontroller is used to record outputs from various diagnostics including voltage, current, photodiode signal, and others (as needed) at approximately 1 kHz. The microcontroller is also used in some cases to trigger external events (e.g., camera acquisition) when able. For the experiments described in this article, time = 0 is defined as the point at which the microcontroller code is initiated and the discharge sequence begins; this event is physically triggered by activating an SPST spring-return switch.
The stored energy from the capacitor bank is delivered to an electrode setup which is partially submerged in deionized water contained within a 20 L polypropylene bucket. The conductivity of the electrolyte is set by adding concentrated HCl dropwise to the deionized water. All discharges described in this article were performed at a conductivity of 300 S cm. Conductivity measurements were obtained with a calibrated Oakton PCSTest35 hand-held conductivity meter. No significant changes in the conductivity of the electrolyte resulting from heat generated during the discharge were observed.
Figure 1 details the circuitry used for these experiments. The central electrode is a solid metal rod with a 6 mm outer diameter, and this electrode is insulated from the surrounding aqueous environment with a tube of dielectric material. The edge of the dielectric tube is placed flush with the surface of the electrode, and the electrode and insulator are positioned such that the tip of the electrode (and insulator) protrudes approximately 1–2 mm above the surface of the electrolyte (see insets A and B of Figure 1). Two different metals and insulating materials were used as the central electrode for these experiments: tungsten/alumina (AlO) and copper/quartz (SiO). The second electrode is a commercially-available copper ring gasket (DN200CF, Kurt J. Lesker, Jefferson Hills, PA, USA) ) with a 222 mm outer diameter, 203 mm inner diameter, and a 2 mm thickness. The ring electrode is fully submerged at a depth of approx. 6.5 cm below the surface of the electrolyte.
The circuit is constructed in a way that allows for the polarity of the electrodes to be reversed. To reverse the polarity, the high-voltage wires that connect the FIRE switch to the electrode setup and connect the electrode setup to the grounded side of the circuit (shown in the right side of the circuit diagram in Figure 1) are reversed. No other changes to the circuit are made when the electrode polarity is reversed. Note that the configuration shown in Figure 1 establishes the central electrode as the anode; the ring electrode is therefore the cathode. The majority of the data presented in this article correspond to discharges generated with the ring electrode as the cathode, as (to our knowledge) this work is the first presentation of data collected at this electrode polarity. Data collected from discharges with the central electrode as the cathode will be labeled as such where necessary.
2.2. High-Speed Videography
Two high-speed cameras were used to monitor and characterize ball plasmoid discharges. For day-to-day operation of the experiment, a PL-B742U camera (Pixelink, Ottawa, Ontario, Canada) with a Computar LP390-30.5 lens (CBC America, Cary, NC, USA) was used to record 640 × 480 pixel color images with a 1 ms exposure time at 85.3 frames per second. An example color video obtained with this camera can be found in the Supplemental Materials. Additionally, a Phantom v5.2 camera (Vision Research Inc., Wayne, NJ, USA) with a 135 mm focal length Canon telephoto lens was used to record 1920 × 1200 pixel monochrome images of the discharge with 1 ms exposure time at 1000 frames per second. The Phantom camera provides additional diagnostics in the sense that the camera is synchronized with the discharge electronics.
3. Results and Discussion
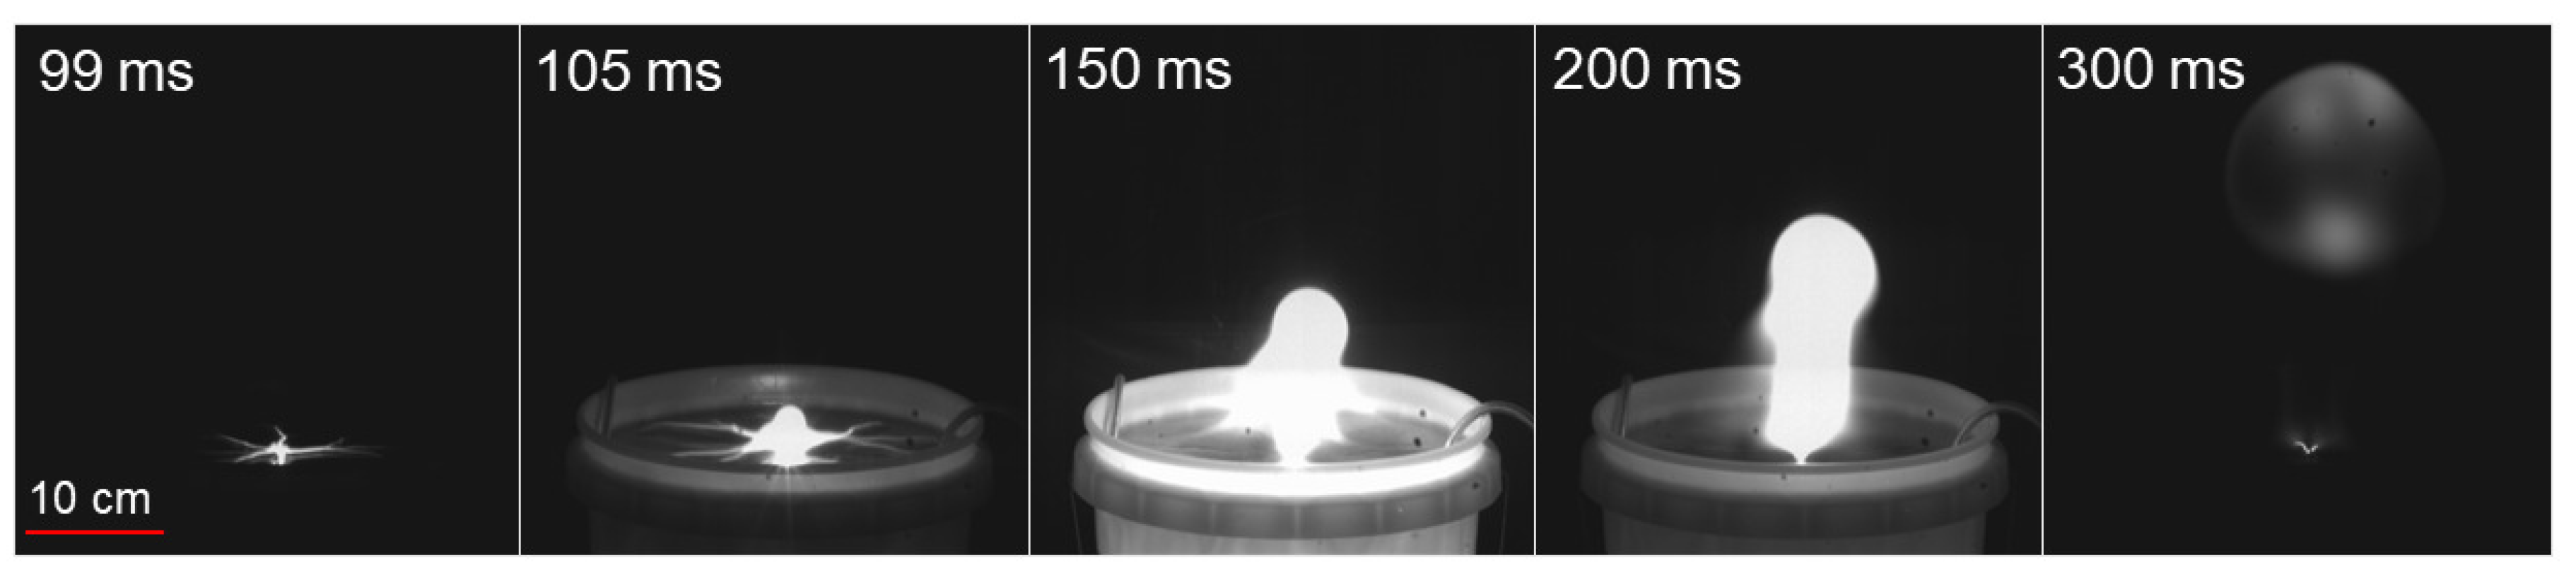
Figure 2 shows a series of images collected from a 7000 V ball plasmoid discharge with the Phantom v5.2 camera. The video from which these images were taken can be found in the Supplemental Materials. A scale bar is included, and the times provided in the images indicate the time after the discharge is initiated. These images also demonstrate various phases of the discharge as previously described by [9,12]. Towards the end of the discharge (∼300 ms), it appears as though an autonomous plasmoid exists without power input from the electrode. The images contained in Figure 2 are similar to results that we have reported previously [10,11].
3.1. Current
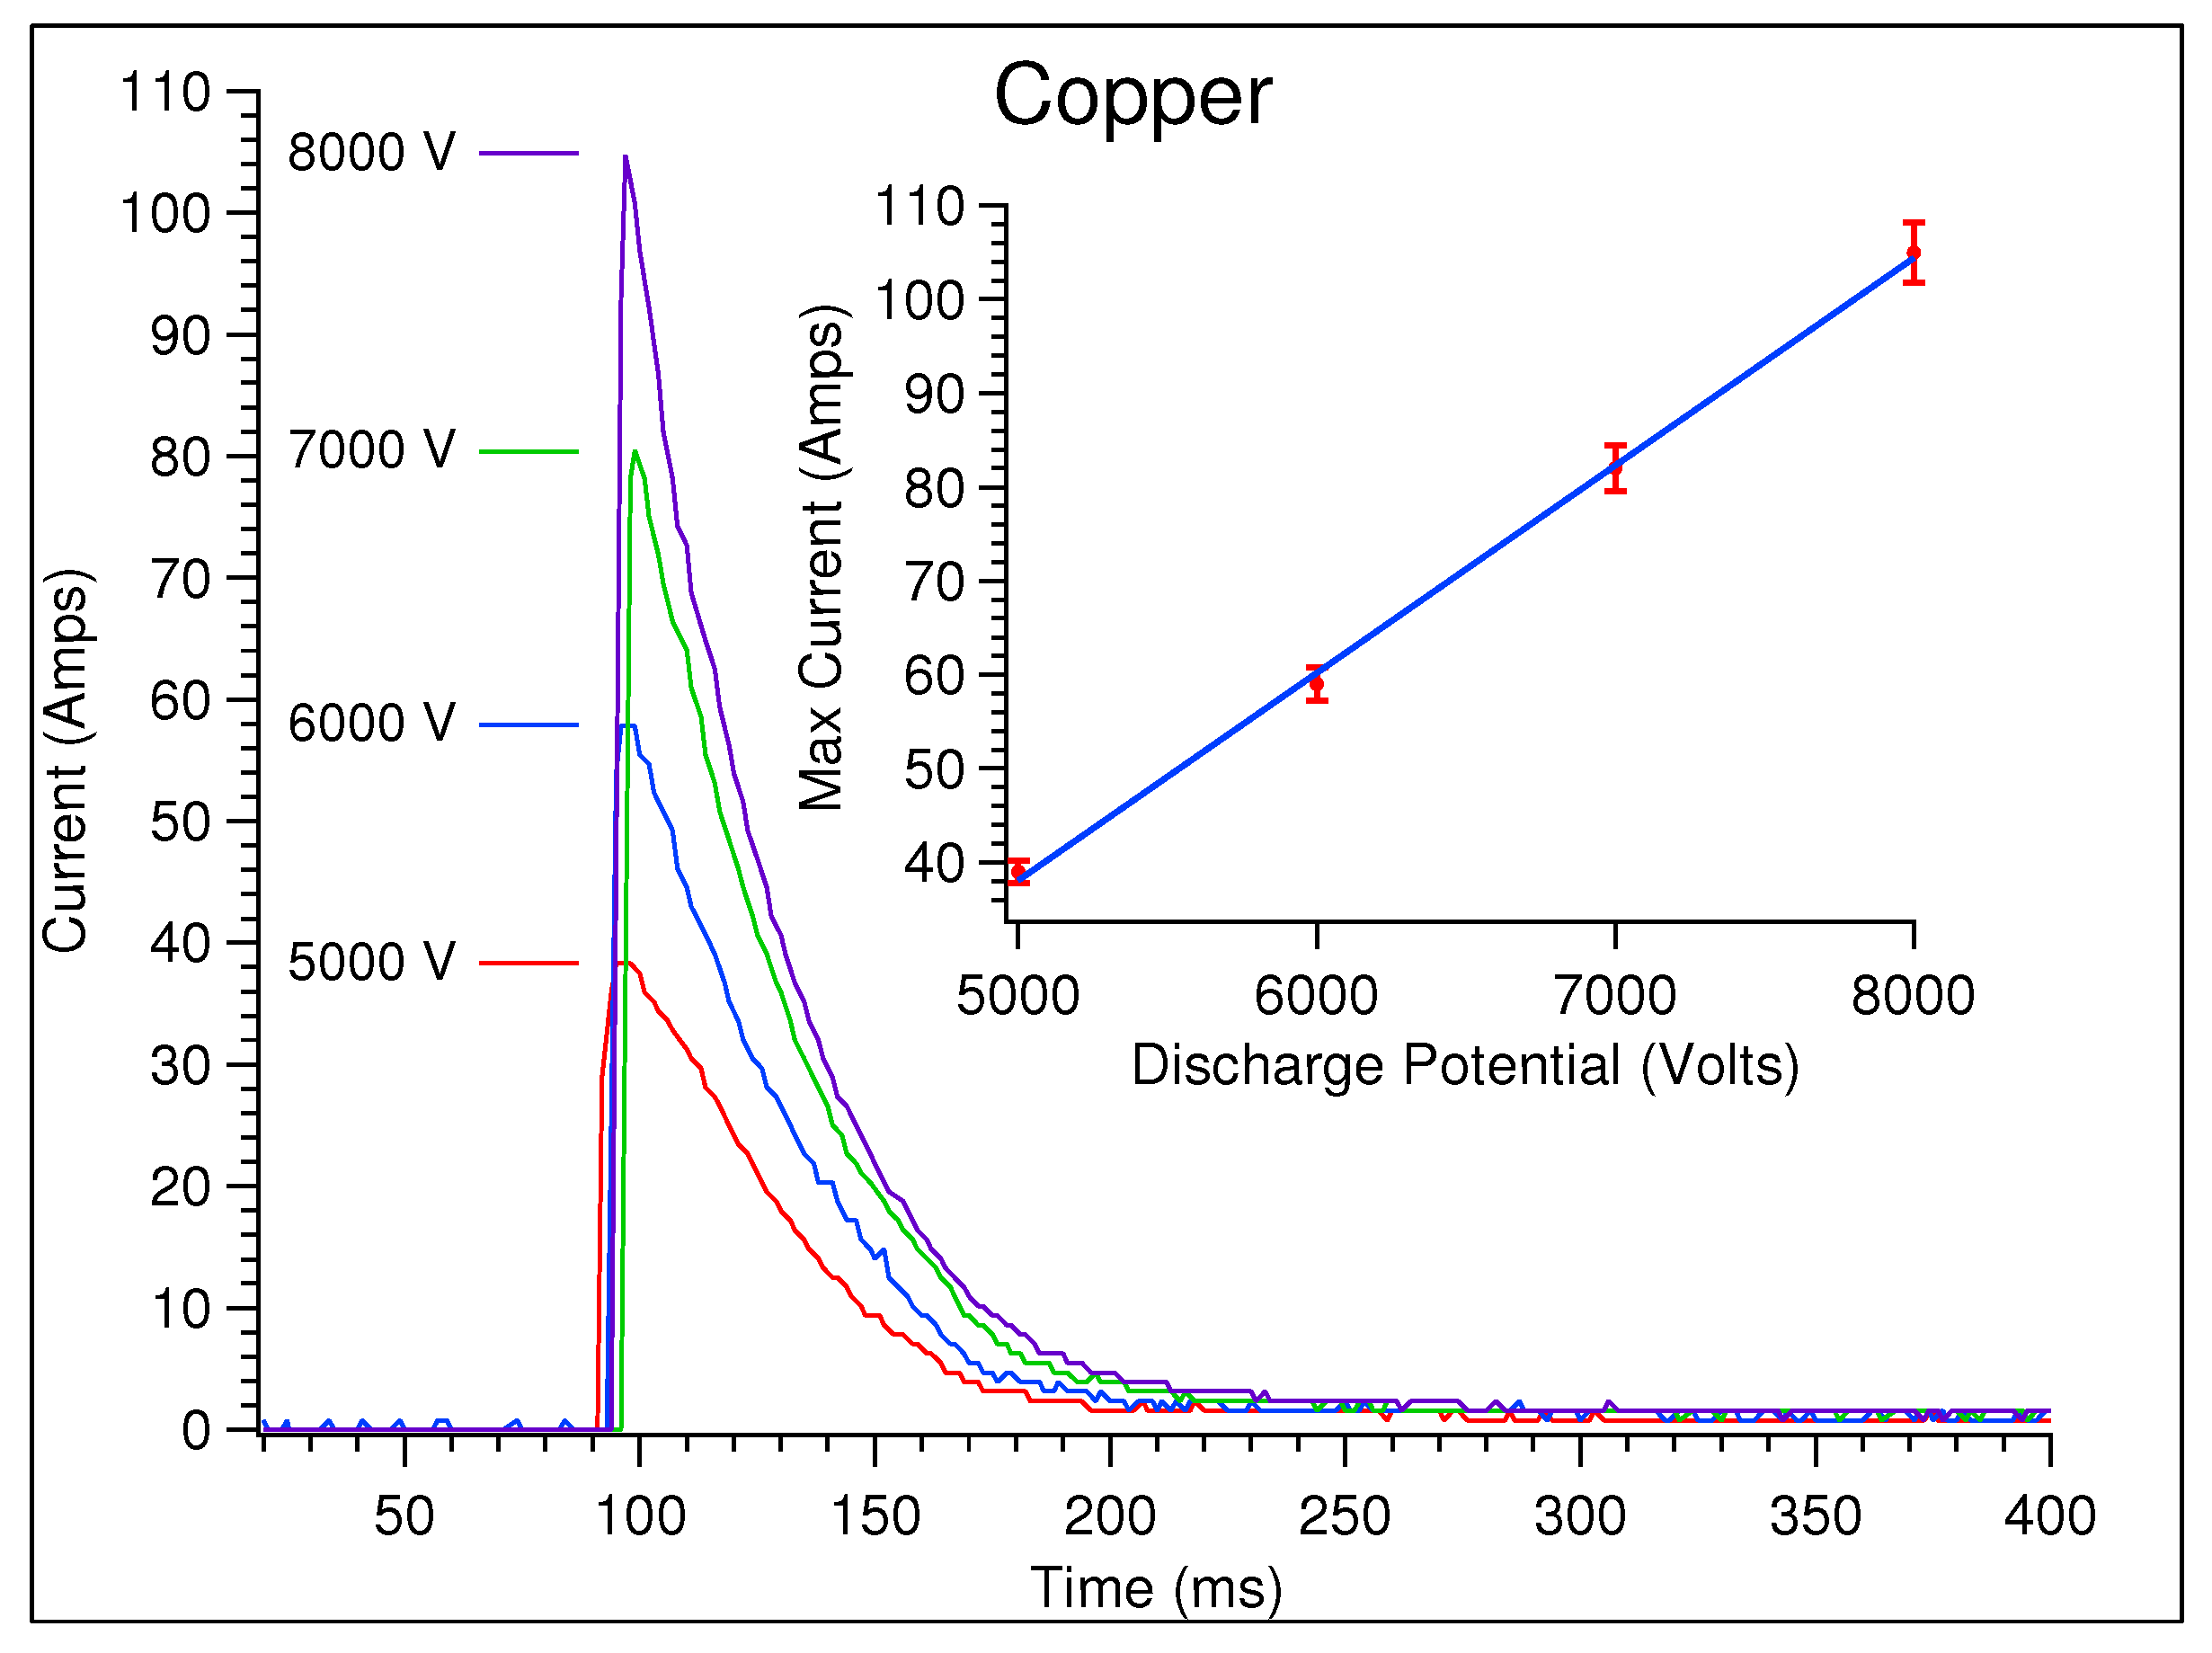
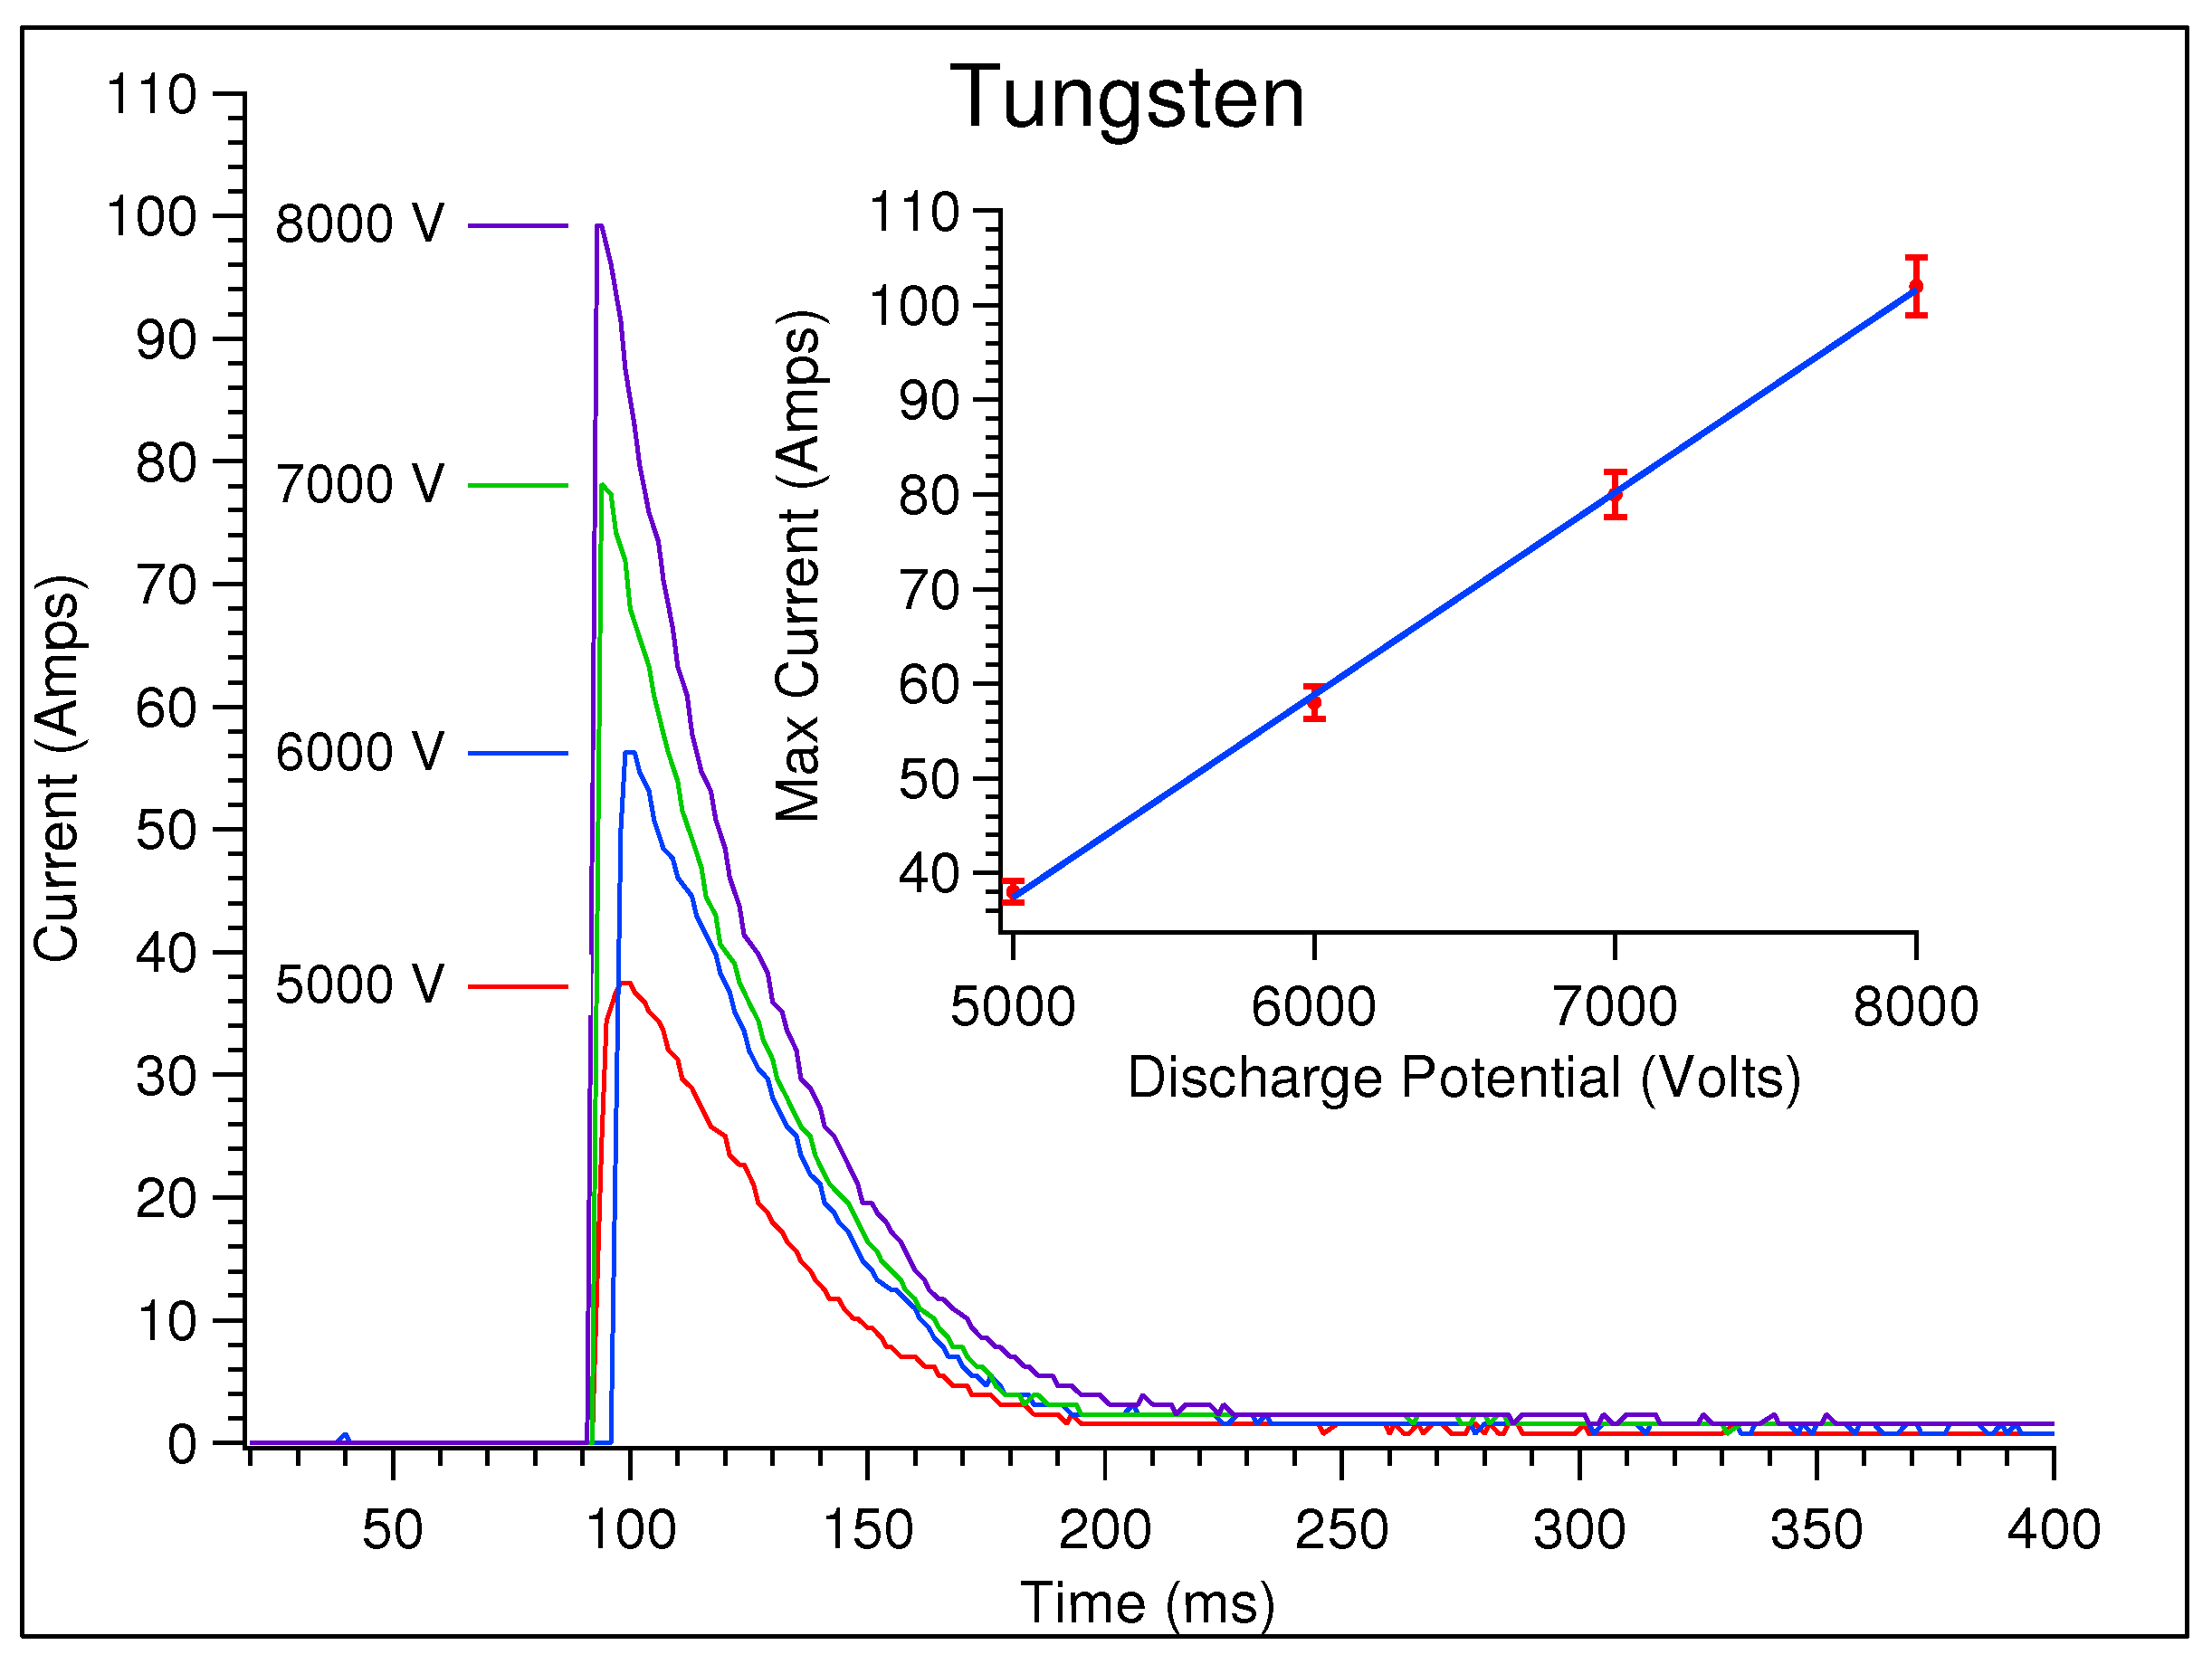
Figure 3 and Figure 4 are current traces collected at different discharge potentials for copper and tungsten anodes, respectively. The current profiles shown here resemble those recorded from impulse discharges, and are similar to those reported by other groups with similar discharge circuitry [7,8,9,12]. However, as stated in the Introduction, these discharges were generated with the electrode polarity reversed. The “FIRE” switch (see Figure 1) closes at 50 ms, and the first visible emission at the anode occurs at approximately 100 ms, after which a plasma begins to develop. Streamers (arcs) form and significant current begins to flow, reaching a maximum after a few ms. At this point, the discharge current and potential of the capacitor bank begin to decrease exponentially as the plasma grows in size and eventually detaches from the electrodes.
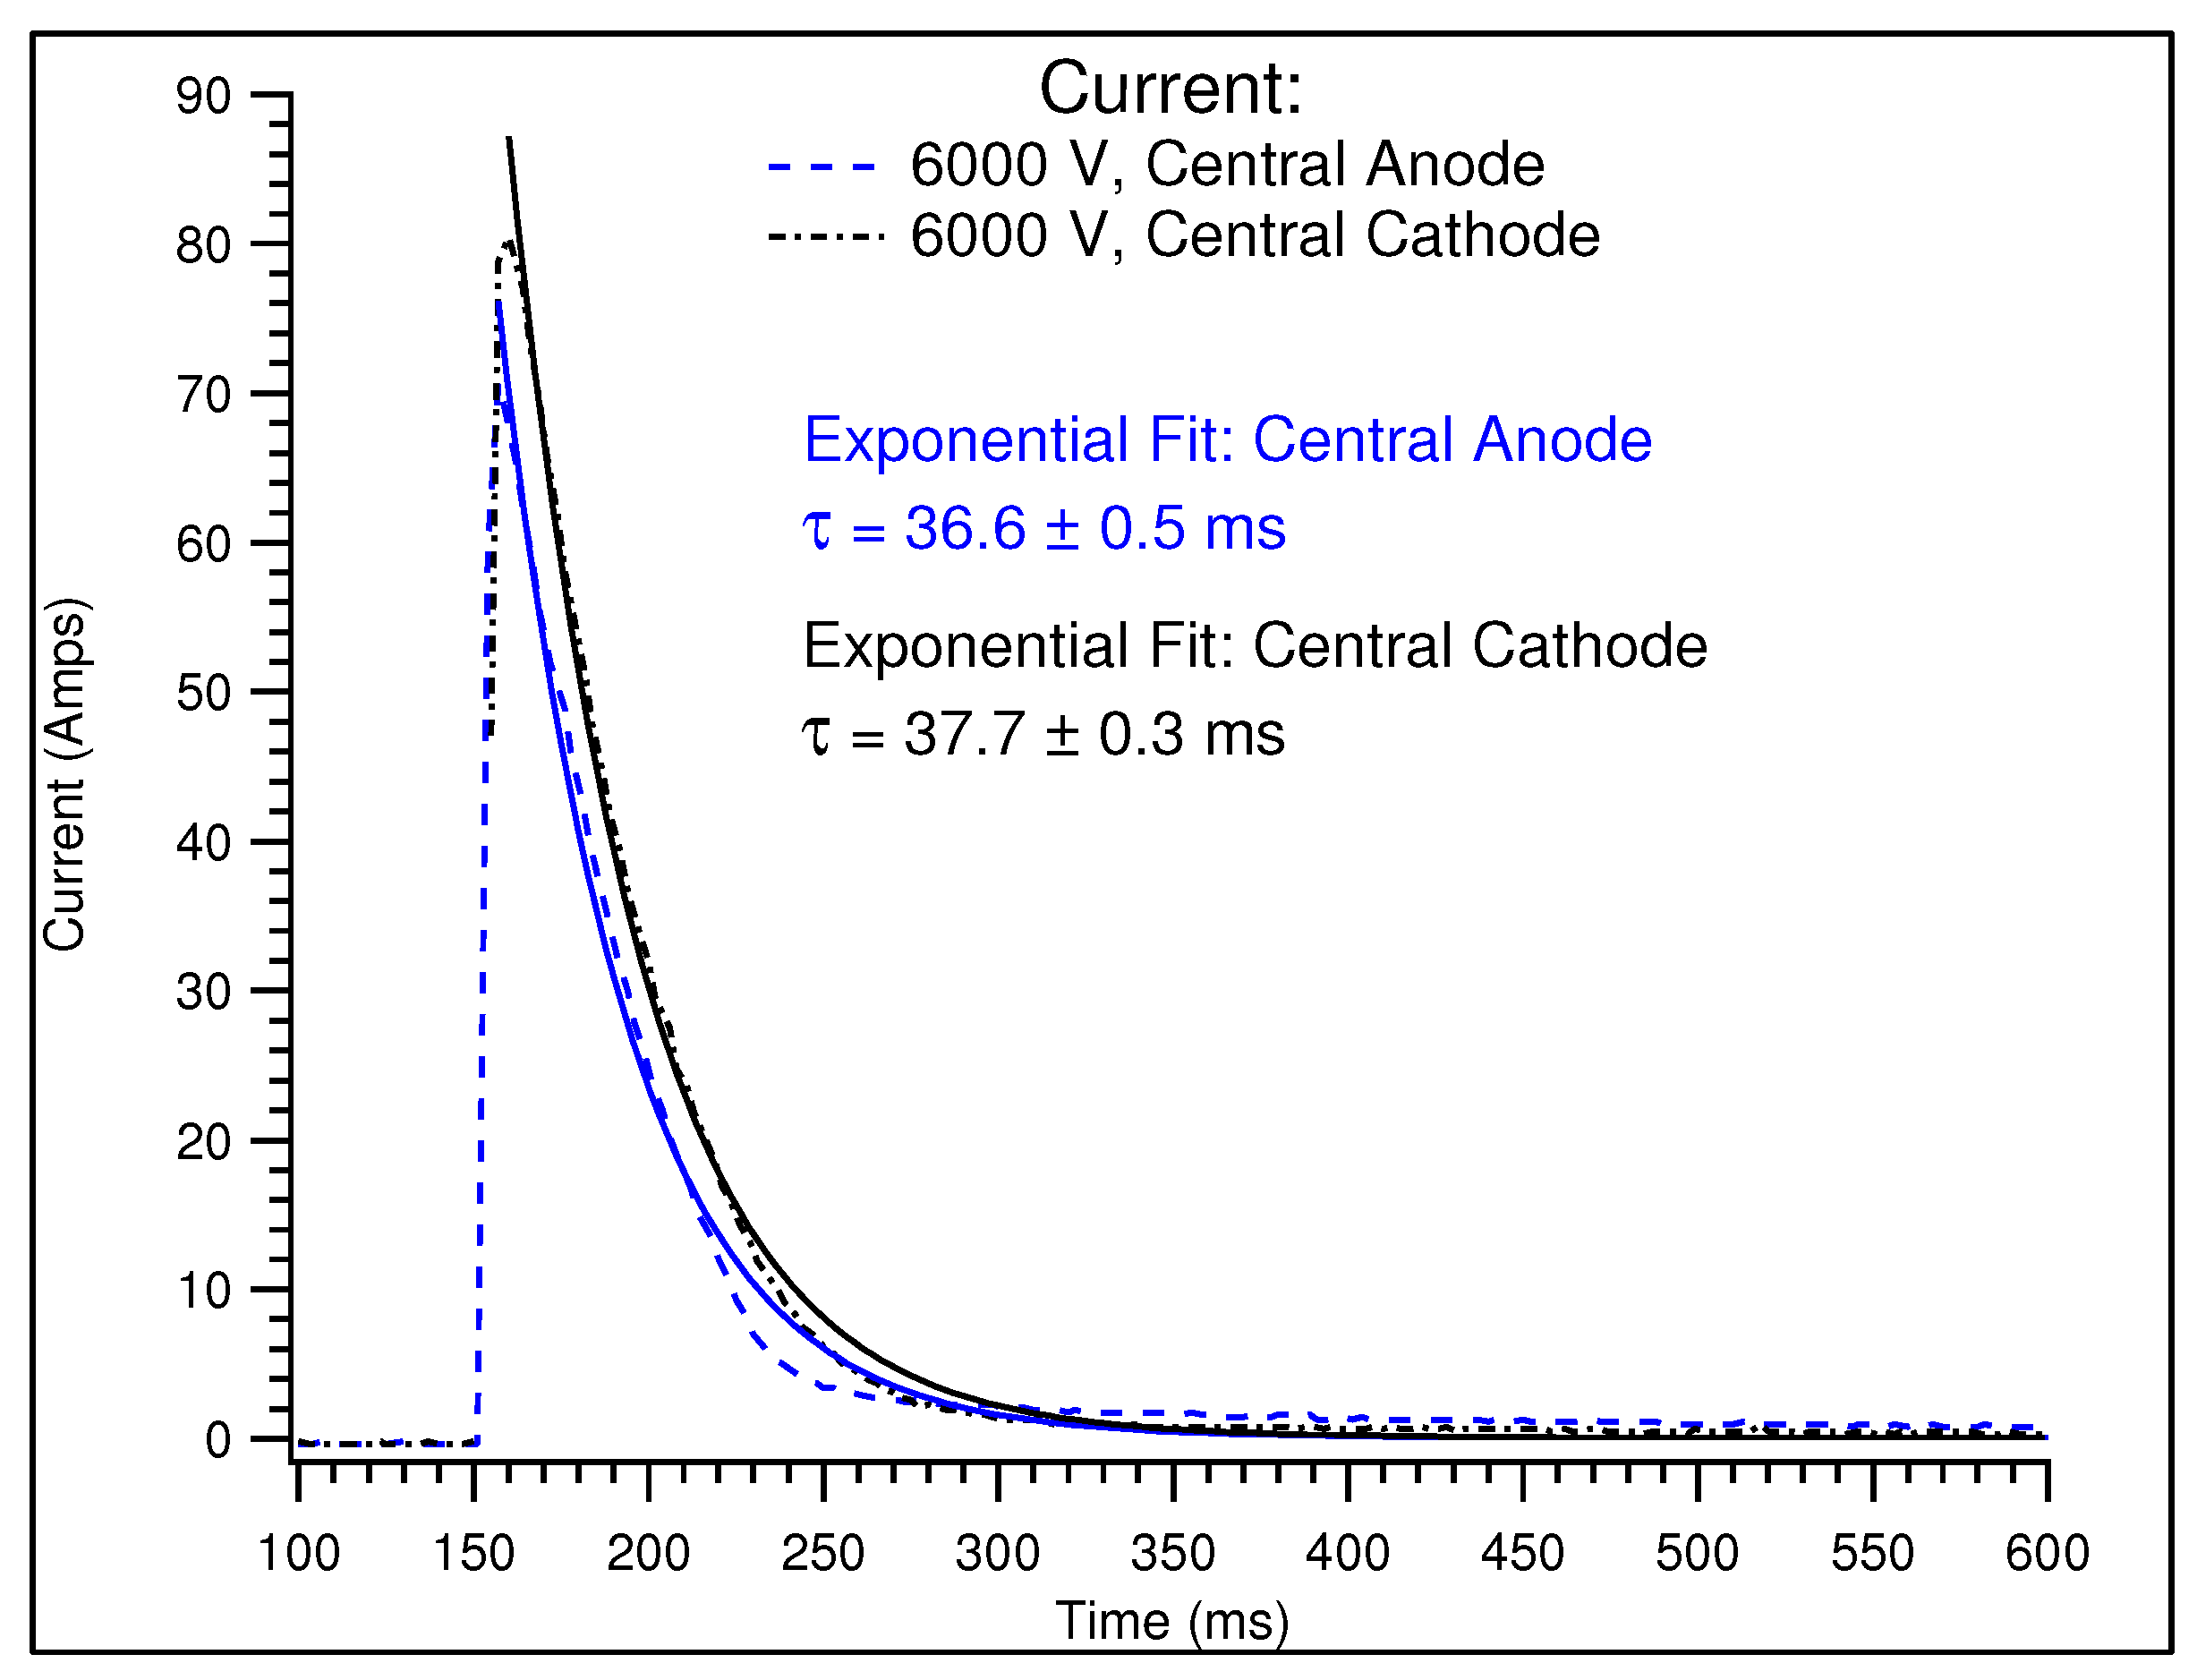
Current traces were also recorded from ball plasmoid discharges with the opposite electrode polarity, i.e., with the central electrode as the cathode. Figure 5 shows overlayed current traces collected from 6000 V ball plasmoid discharges at both electrode polarities and the numerical results of exponential fits to those data. It is apparent that the overall shape of the current profiles are similar between the two data sets; however, the maximum current reached with the central electrode as the cathode is significantly larger (approx. 10 Amps). Furthermore, it appears as though the current is slightly larger for a slightly longer period of time (in other words, the “width” of the current pulse is slightly larger) when the central electrode is the cathode. Exponential fits to the current traces were also performed on data collected from the opposite electrode polarity. The values of extracted from these fits are very similar to one another, which suggests that changing the electrode polarity does not significantly affect the behavior of the current during the discharge.
The current waveforms can be fit to an exponential, and do not vary significantly with discharge potential or electrode material. The maximum current increases linearly with the capacitor potential (Figure 3 and Figure 4). The maximum currents recorded for different electrode materials are also not significantly different. These two electrode materials appear to have only a slight influence on the electrical properties of ball plasmoid discharges, at least under these experimental conditions. It would be valuable in future studies to examine the effects of other electrode materials, e.g., platinum, stainless steel, aluminum, etc. on the electrical properties of ball plasmoid discharges.
It is apparent that current still flows late in the discharge in some cases. This current flow between the anode and the electrolyte results from spark channel formation and is discussed in more depth in the following sections. The 10-bit resolution of the A/D converter used in the microcontroller (4.9 mV per bit) combined with the properties of the Hall effect sensors gives uncertainties of ±0.8 A for high-current discharges (75 A and above) and ±0.3 A for moderate-current discharges (<75 A). It is also important to note that when performing discharges between 5000 and 8000 V (and at a sampling rate of 1 kHz) the current waveform reaches its maximum in a single time step. Therefore, at these potentials, only the decay of the potential and voltage are used to calculate the resistance and power (see below).
3.2. Voltage
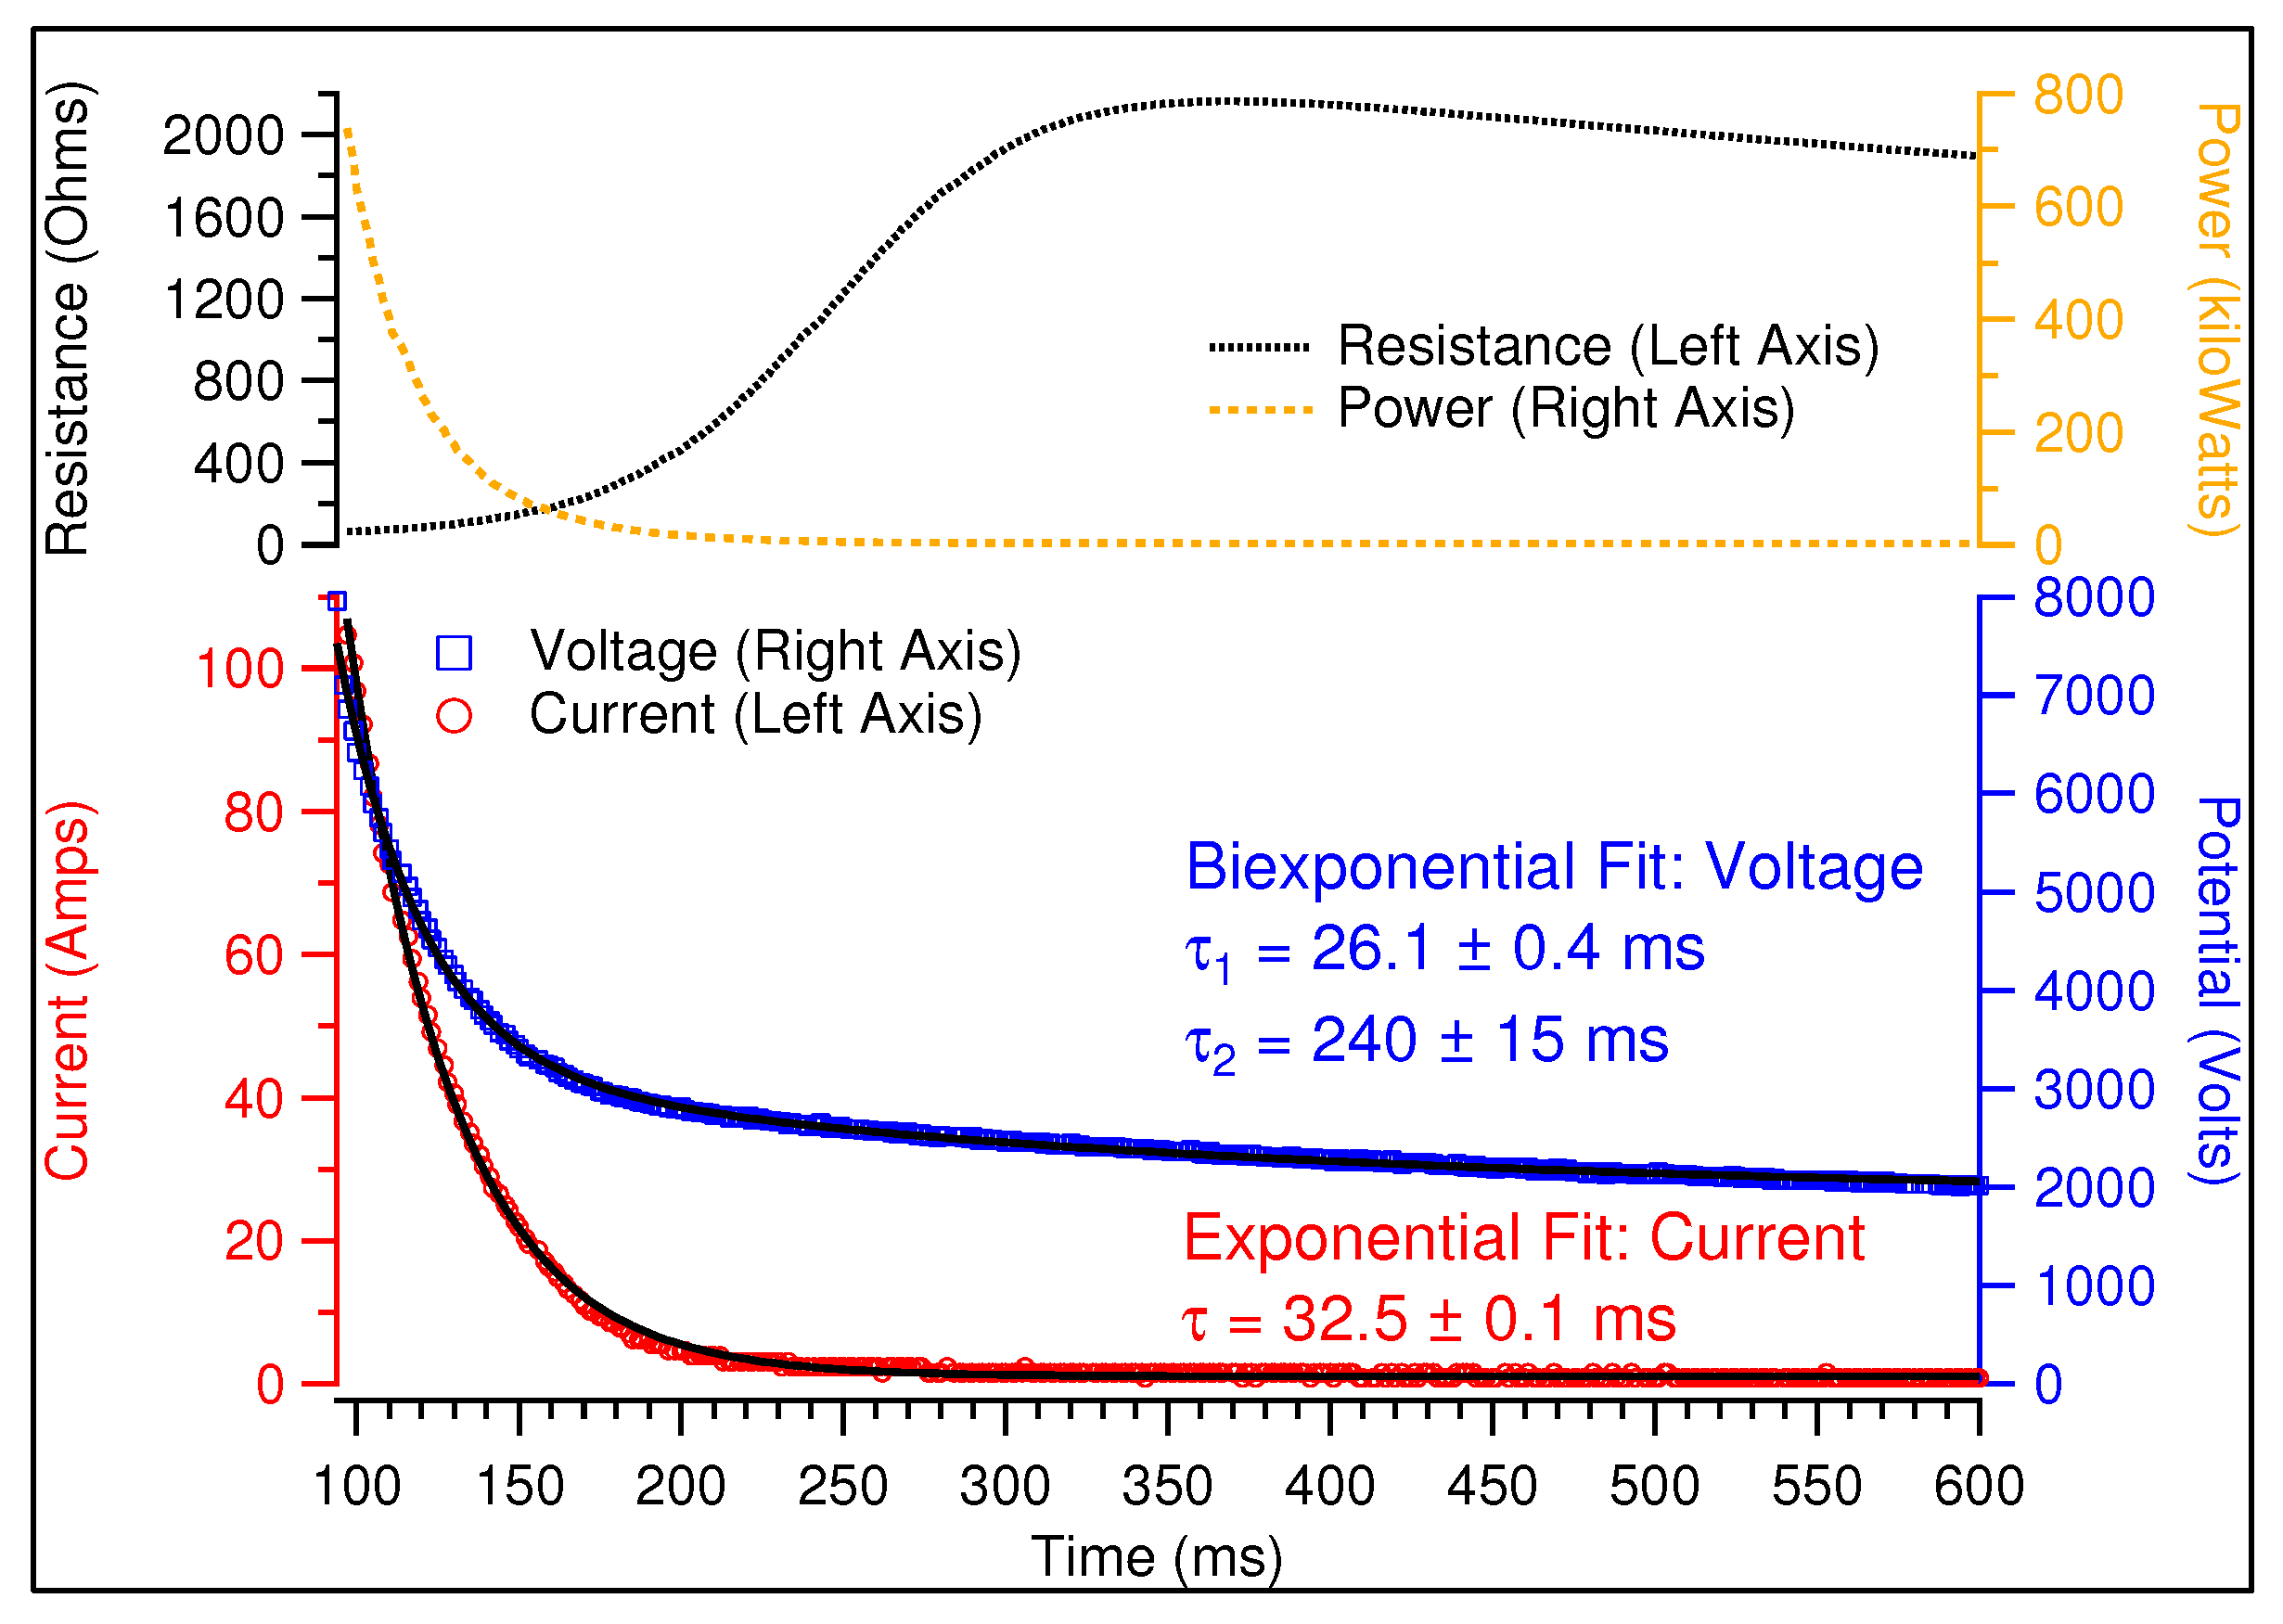
Voltage profiles were fit to a biexponential: this indicates that a fast time constant governs the voltage at early times, while a larger constant is dominant at longer times. These two time constants are interpreted to describe two physical processes that are initiated at the beginning and continue throughout the lifetime of the discharge (under certain conditions). These processes are discussed further below. Figure 6 provides an example analysis of the electrical characteristics of a ball plasmoid discharge (8000 V in this case). Resistance and power were calculated from experimental data according to Ohm’s Law and the power relation ().
The fast constant governs the first portion of the discharge during which there is significant current flow, streamer development, and jet production at the tip of the anode. The effect from is always present, but becomes much more significant after the current and voltage have decreased substantially. At this point, a jet is no longer observed at the anode, but there is still an electrical connection between the anode and the electrolyte, and a small amount of current continues to flow. This connection is established at the start of the discharge via spark channels and is a result of the close proximity of the anode to the electrolyte. Indeed, positioning the anode below the surface of the insulator increases the length of the air gap between the anode and the electrolyte and does not facilitate spark channel (or plasmoid) formation. This observation (of the persistent spark channel connection) indicates that it is not feasible to use the electrical profiles reported here to determine the point in time at which the plasmoid becomes detached from the electrodes. However, this limitation only applies to the electrode geometry and circuit used in our laboratory.
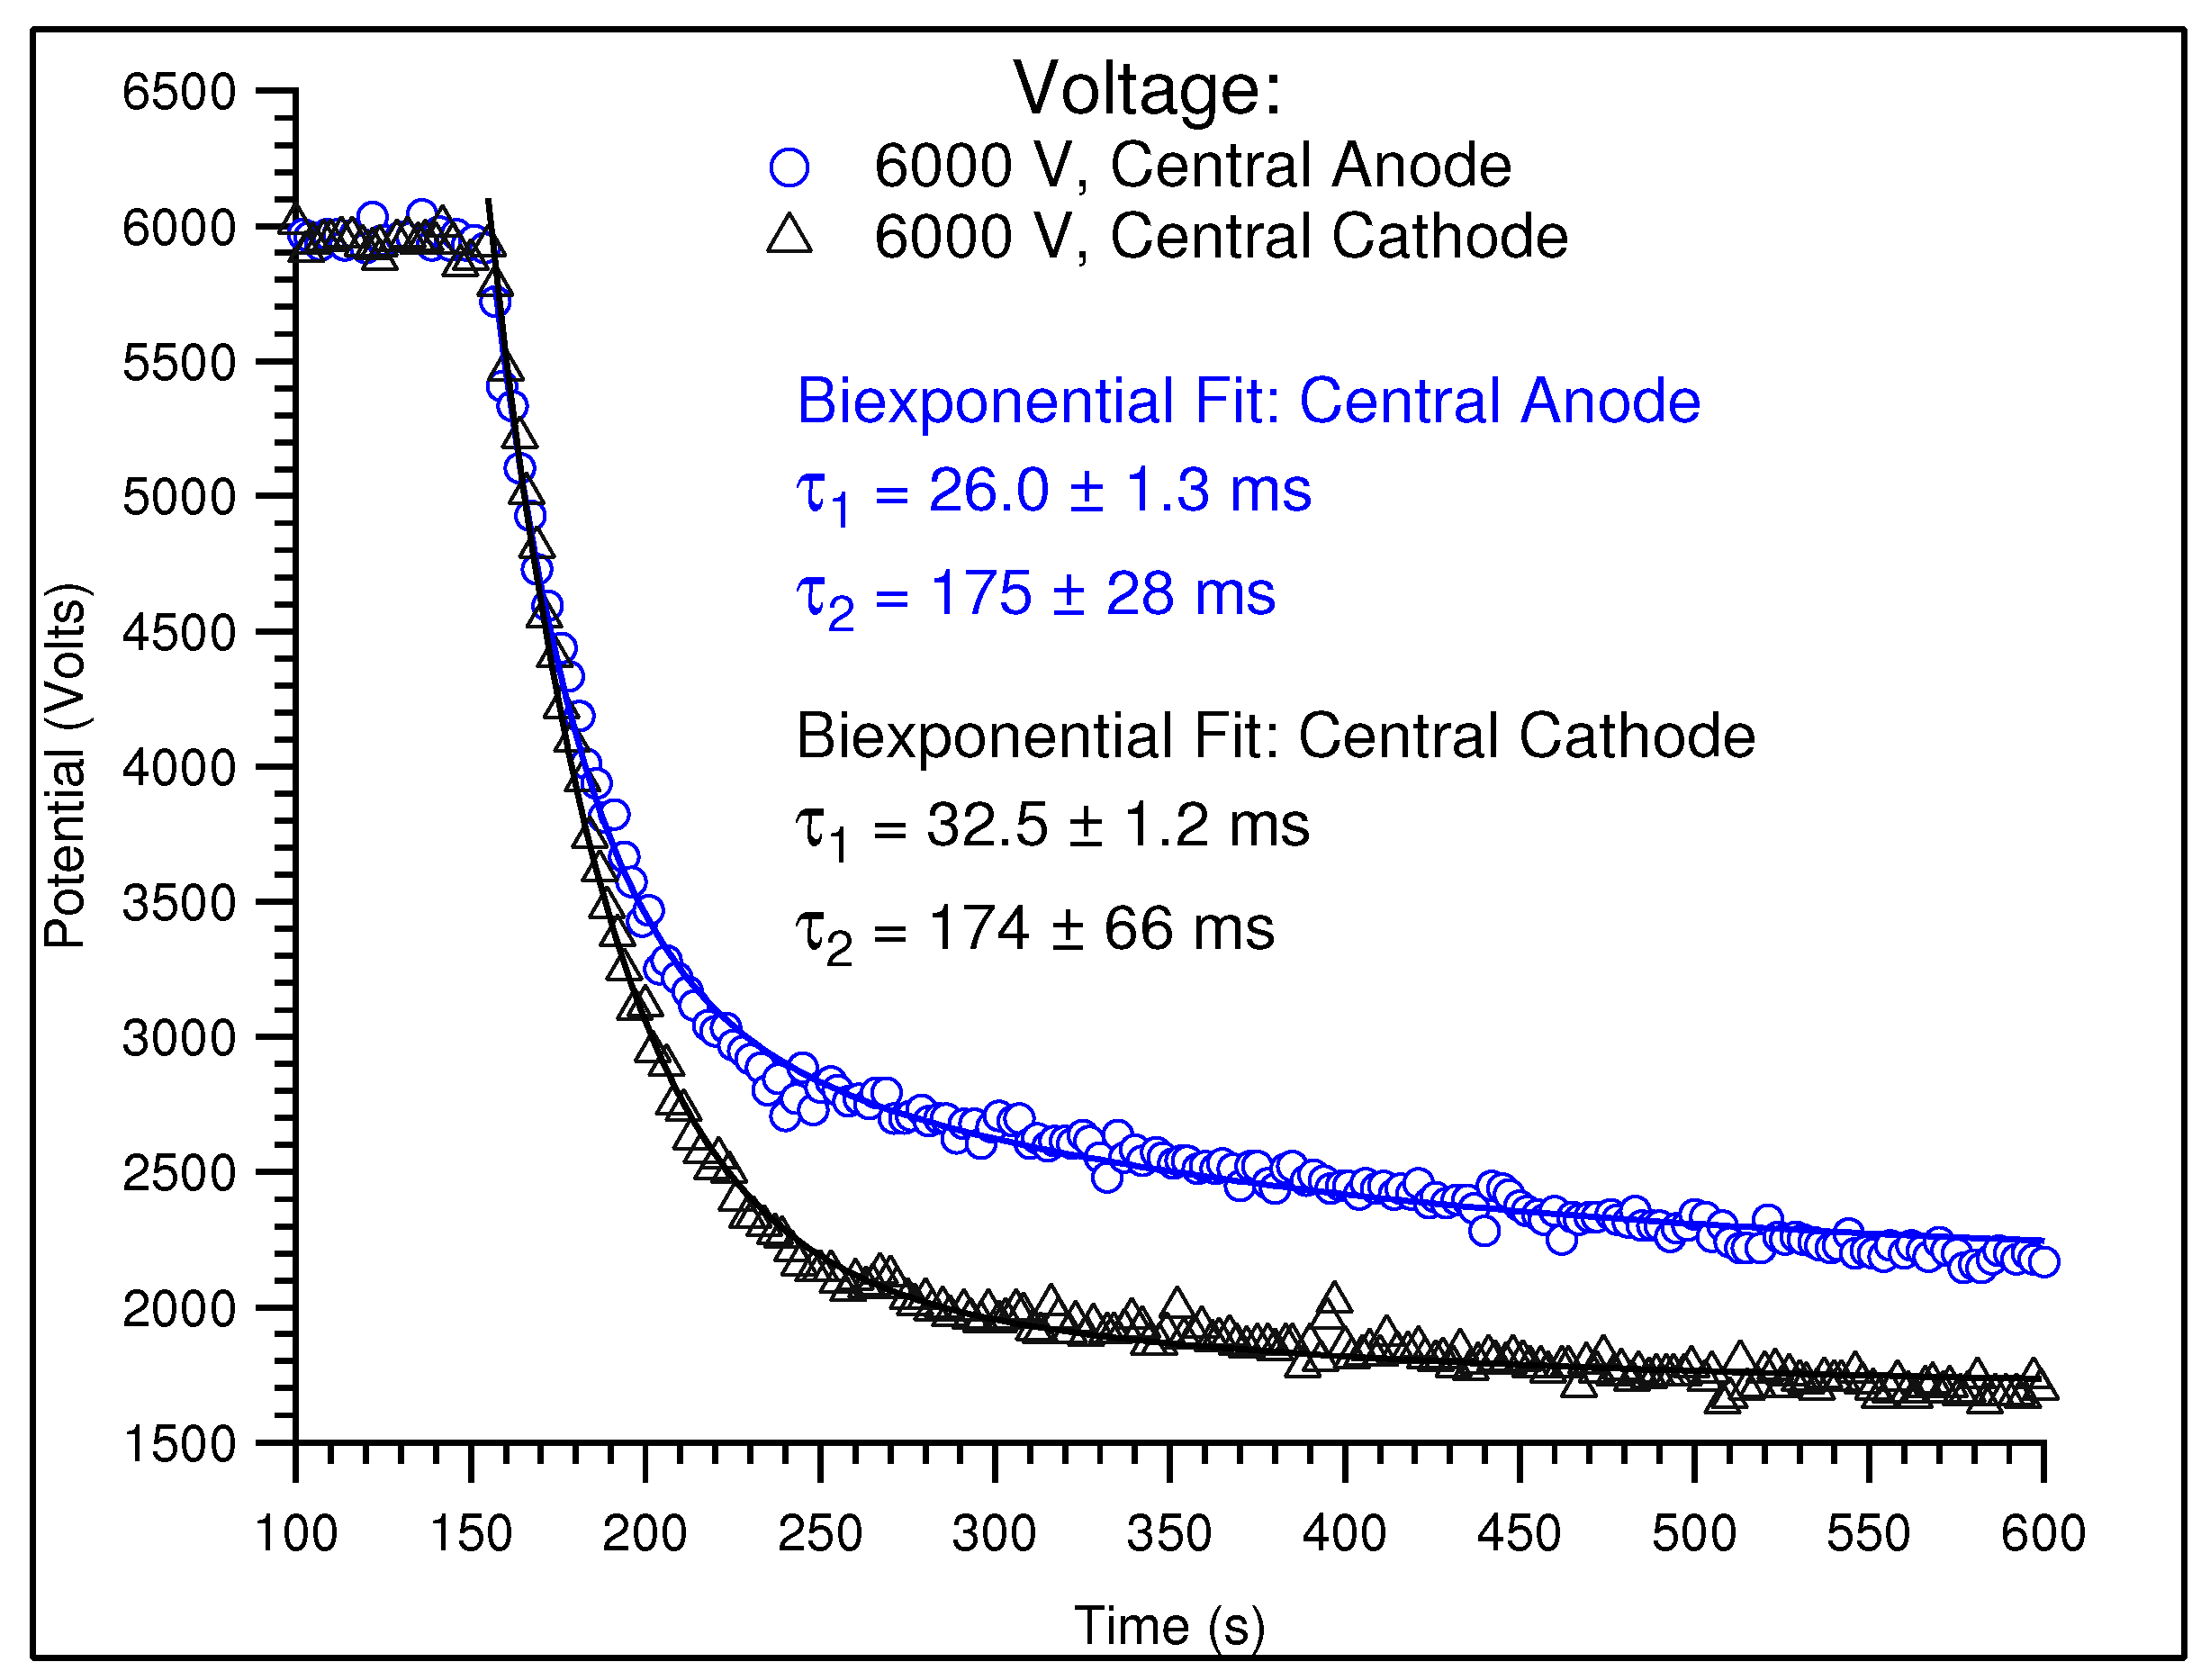
Voltage traces were also recorded from ball plasmoid discharges with the opposite electrode polarity, i.e., with the central rod as the cathode. The data presented in Figure 7 correspond to the current data that are presented in Figure 5. As is the case with the current traces, the voltage traces are similar between the two electrode polarities. However, it is apparent that when the central rod is the cathode, the voltage across the capacitor plates decreases much more rapidly, and the ending voltage is a few hundred volts lower than at the opposite polarity. If the total resistance of the circuit stays essentially the same between the two polarities, it stands to reason that a discharge with a larger maximum current could result in a smaller minimum (ending) voltage.
Additionally, biexponential fits to the voltage traces were performed for plasmoid discharges at both electrode polarities. The results included in Figure 7 show that is very similar at both polarities; however, is larger when the central electrode is the anode. This discrepancy suggests that the first phase of the discharge (during which a jet is produced) occurs more quickly when the central electrode is the cathode, which in turn could also explain why the ending voltage for this polarity is significantly lower. The physical explanation for why the initial stages of the discharge seem to be faster when the central electrode is the cathode is presently unclear.
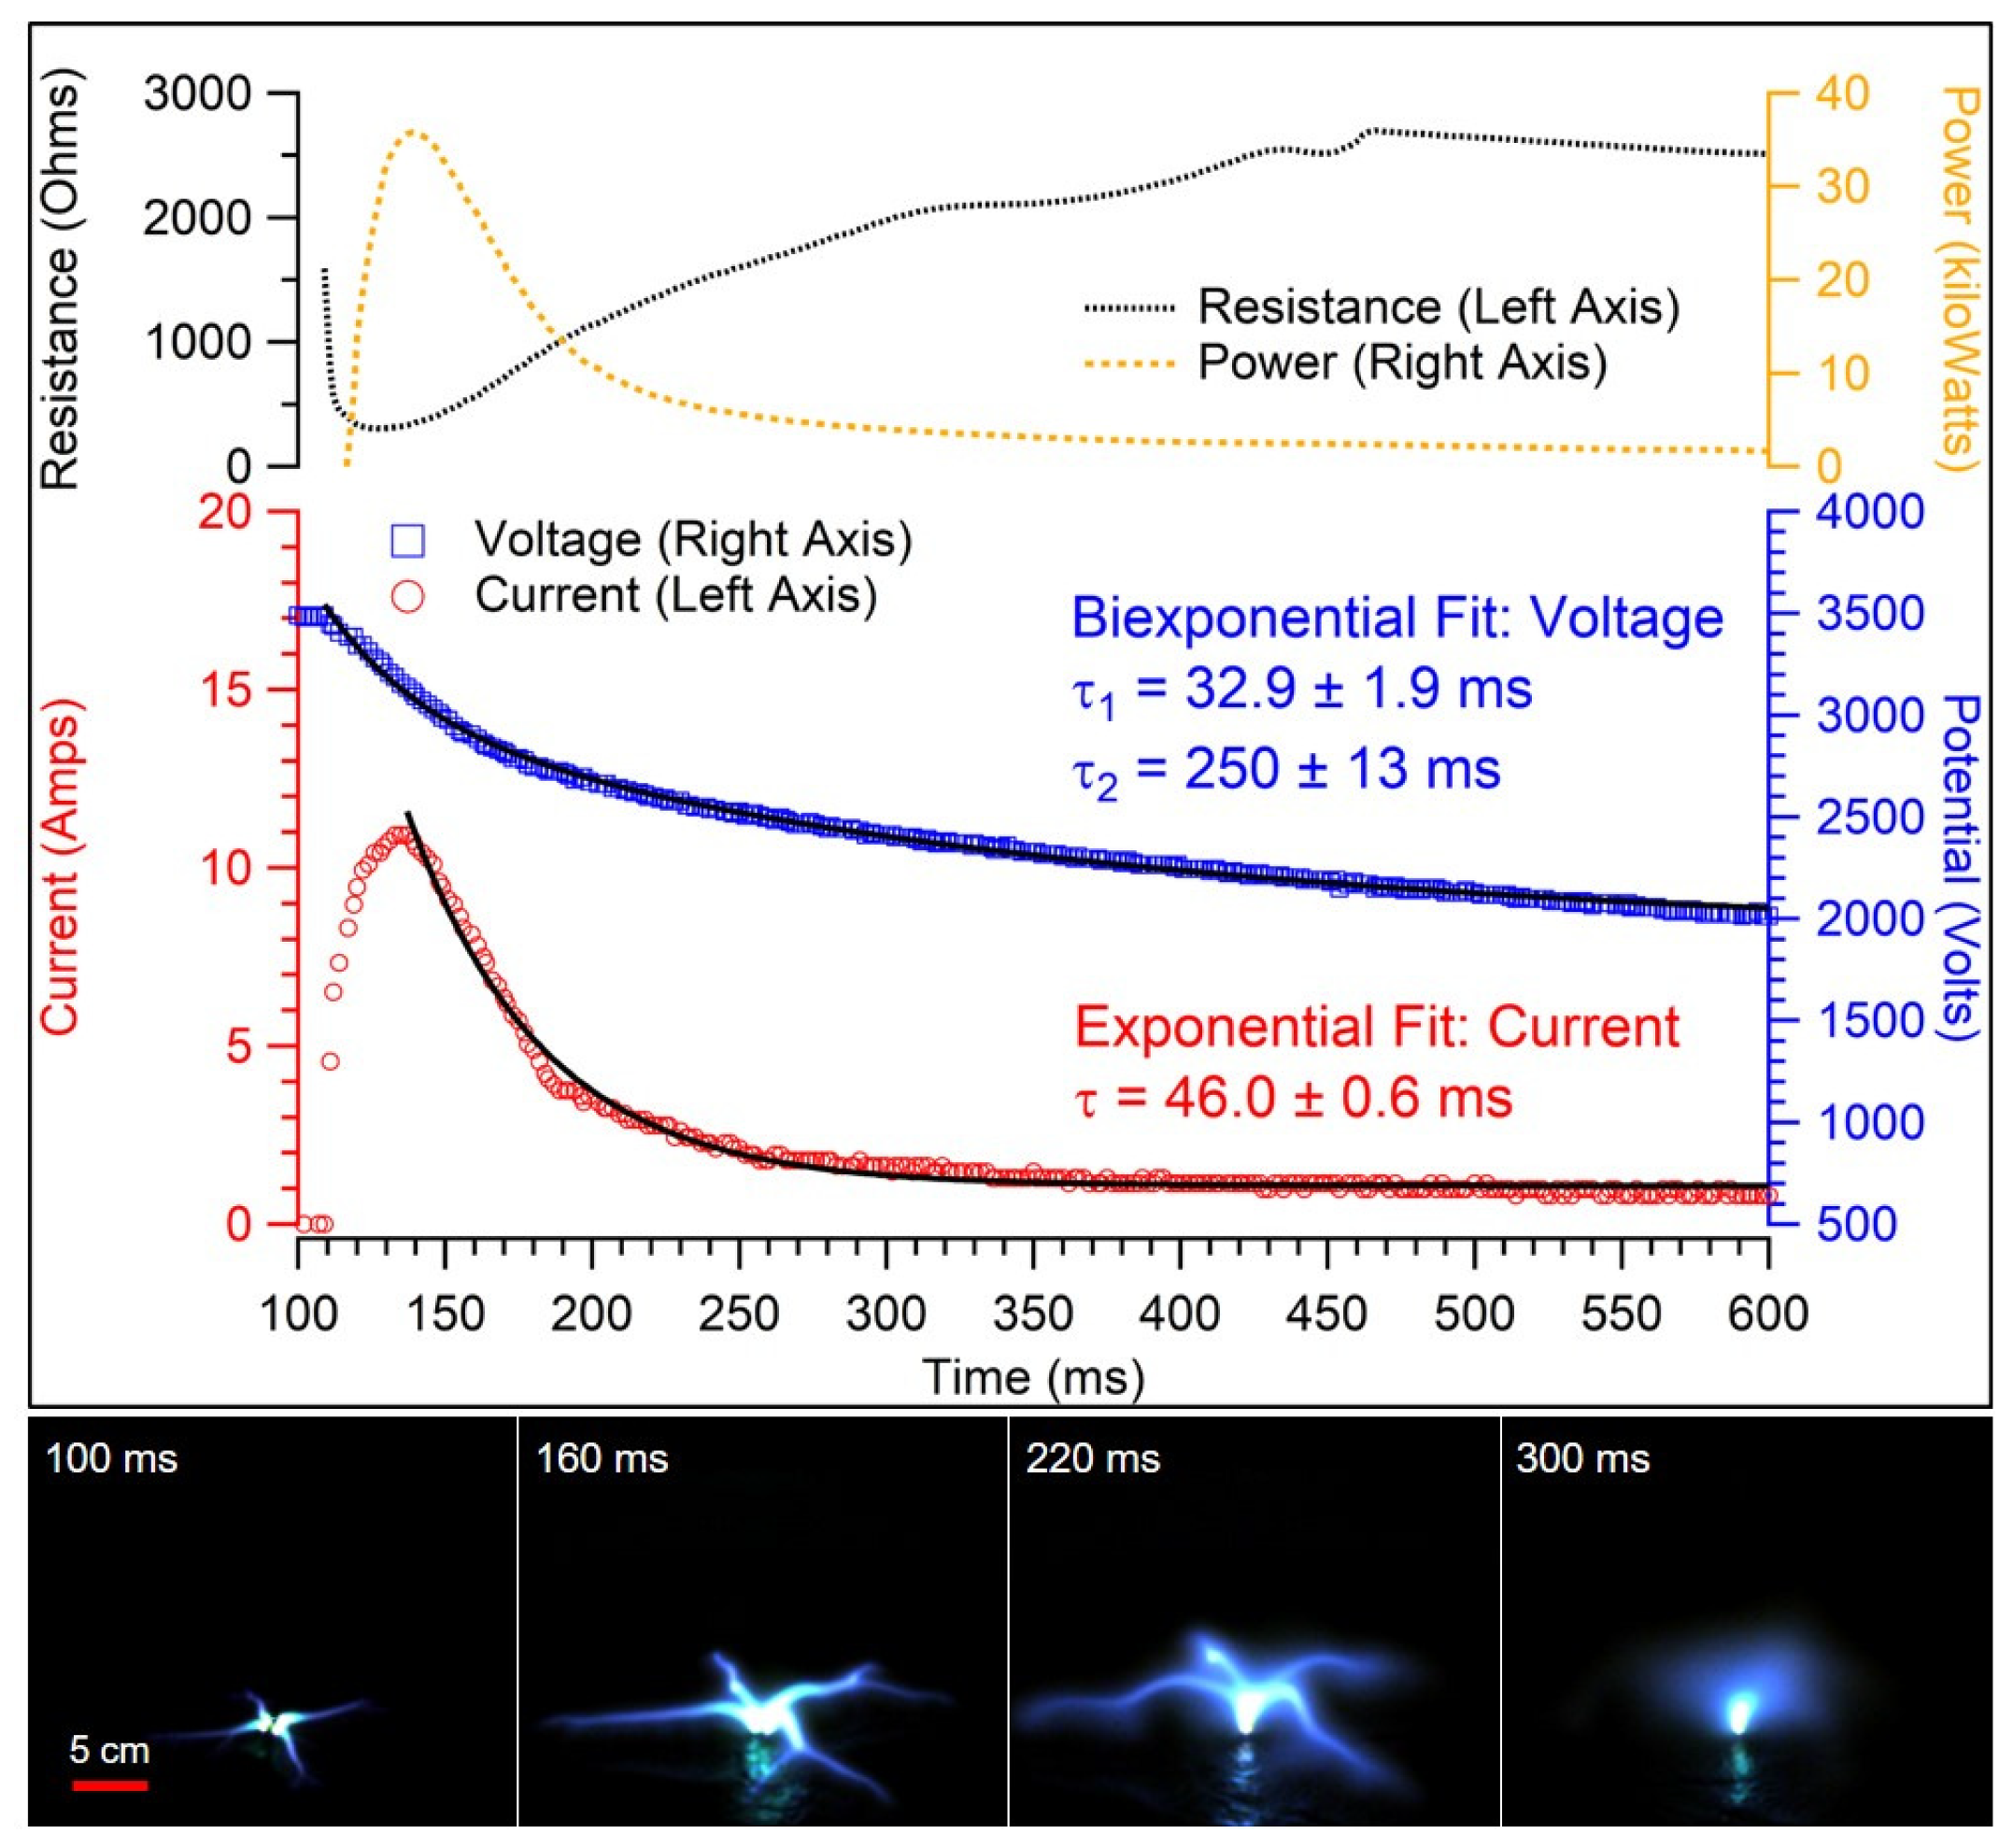
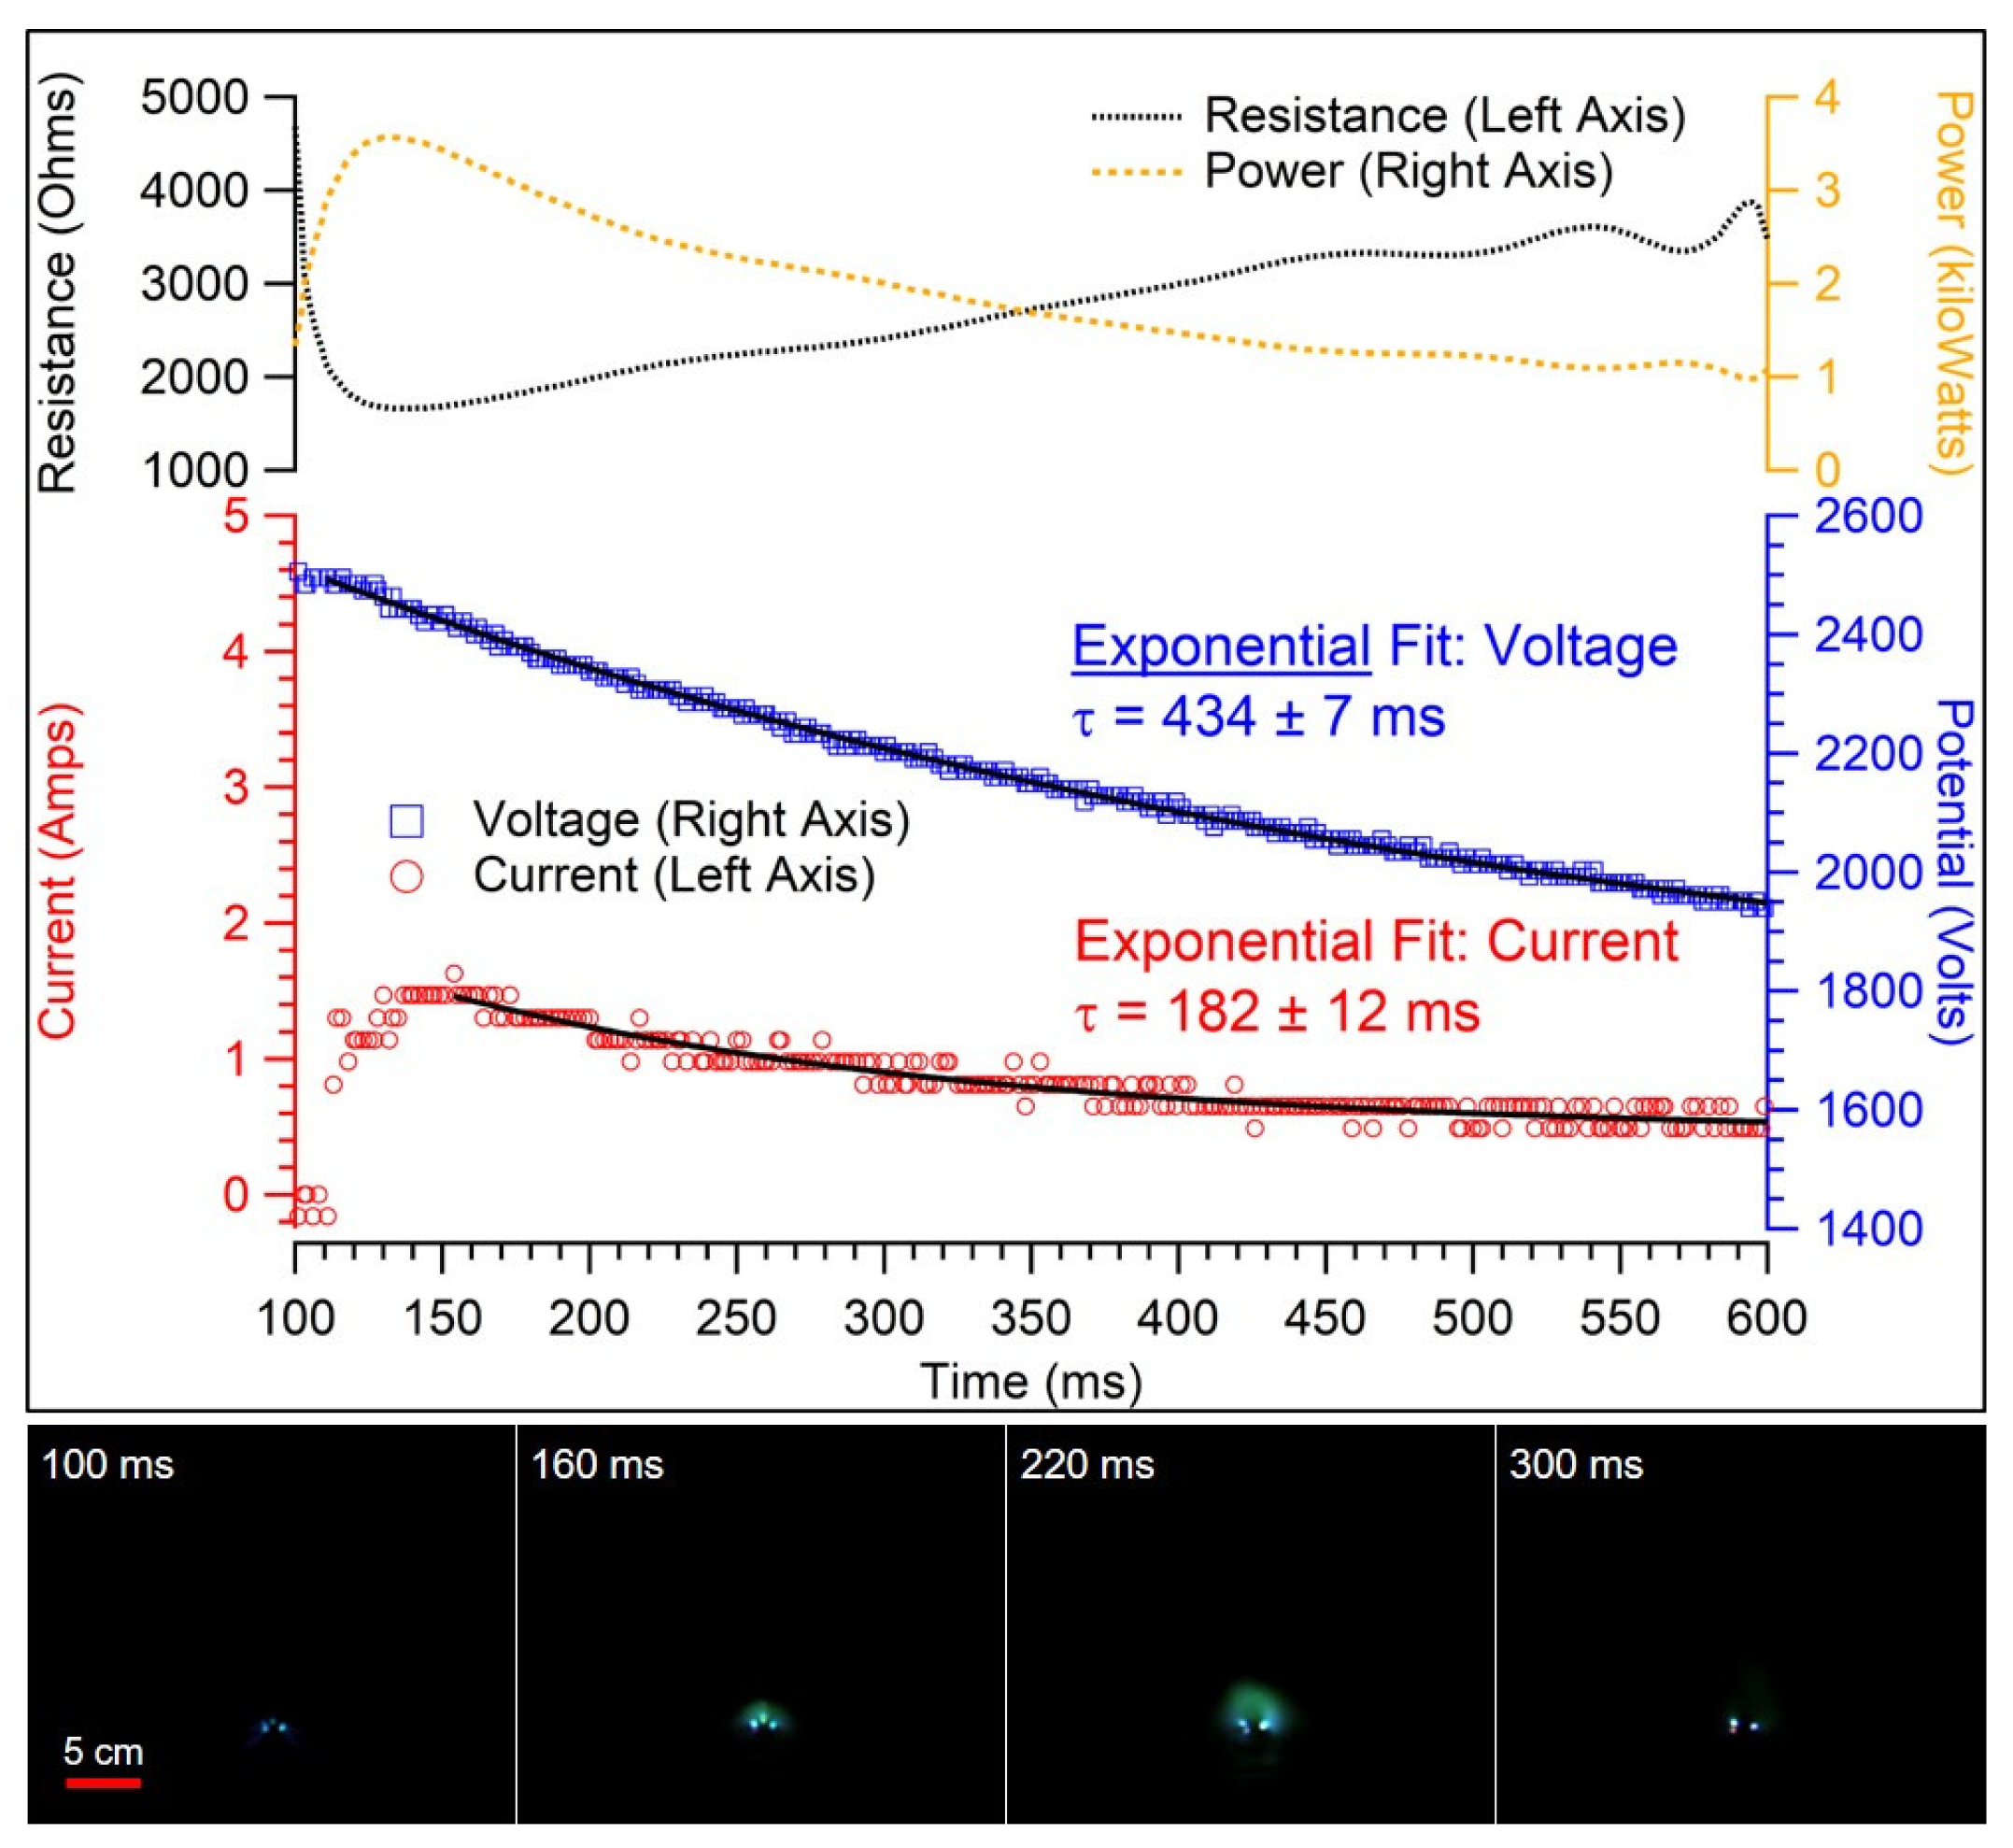
We have determined that (for this circuit) a plasmoid will not form at potentials less than ∼2800 V. The jet formed at the tip of the anode is not generated below this potential. Intentionally charging the capacitor bank to a voltage that will not produce a plasmoid, but does establish spark channel connections, generates a voltage waveform that can be fit to a single exponential. Thus, the fast time constant () likely corresponds to the formation of a jet at the anode. Electrical diagnostics and videography of discharges at 3500 V and 2500 V clearly demonstrate this phenomenon (Figure 8 and Figure 9).
In the case of a 3500 V discharge (Figure 8), streamers and a jet are observed forming at the anode, and the voltage profile is fit to a biexponential. For a 2500 V case (Figure 9), however, no plasmoid is formed, yet a small amount of current flows via spark channels. This observation is similar to the initiation phase described in [12]. These spark channels are visualized as bright spots at the edges of the anode in images obtained with the PixelLink camera. Fits to voltage profiles of 2500 V discharges (that do not produce a jet) are described by a single time constant which is on the same order but larger than as reported above. Thus, the larger time constant () likely corresponds to the spark channel connections between the anode and the electrolyte surface.
3.3. Resistance
Similar to what was reported in [7], the resistance across the lifetime of the discharge is not constant; these data are shown in Figure 6, Figure 8 and Figure 9. The resistance is essentially infinite before triggering the discharge and before breakdown of the air gap between electrolyte and anode. Once the discharge is triggered, the resistance rapidly decreases to a minimum before slowly increasing as the discharge develops. This minimum value of resistance (several tens of ) tends to decrease with increasing discharge potential. This trend is present no matter the voltage used to produce the plasmoid, although the magnitude of the total resistance change can vary. When discharges are performed below the potential threshold for jet formation (Figure 9), the same overall trend in the resistance profile is observed. However, the minimum resistance, i.e., the value to which the resistance decreases in the first several milliseconds of the discharge, is considerably larger (∼2 k).
The most likely explanation for the increase in resistance as the discharge develops is a decrease in the conductance of the plasma resulting from two possible mechanisms. As the plasma conductivity is proportional to the square of the electron density, an overall decrease in electron density would manifest as a decrease in overall conductivity and increase in resistivity of the plasma formed in the discharge. This assumes that as the measured current (and, subsequently, the current density) decreases, the electron density in the plasmoid also decreases. The dynamic nature of the arcs observed via high-speed videography in [12] could also explain this increase in resistance: as the lengths of the streamer channels increase (and the conductivity of the channels remain essentially constant) the conductance of the plasmoid will subsequently decrease. The nature of the resistance of the discharge will be examined in greater detail in future studies.
4. Conclusions
In this article, we have presented experiments which examine the electrical properties of reversed-polarity ball plasmoid discharges for the first time. We have presented an analysis of the electrical profiles generated with our circuit and electrode polarity. We have demonstrated that two processes occur during the discharge, namely the formation of spark channels and the formation of a jet at the anode, and that these processes can be described with different time constants. We have also discussed the nature of the observed resistance change across the lifetime of the plasmoid. These results have provided additional insight into the electrical behavior of ball plasmoid discharges and, more importantly, raise additional questions for future study.
In [2], the polarity of the electrodes is suggested to affect the shape and lifetime of the discharge; this is the only mention of the importance of electrode polarity to generating ball plasmoids in the literature. The authors indicate that the changes they observe in their ball plasmoids, as a result of reversing the polarity, alters the density of free electrons at the electrode surface, and “illustrates the role that the excess of electrons plays in the formation of ball lightning and its outer shell.” Our experiments, on the other hand, demonstrate that reversing the polarity of the electrodes (in combination with a slightly different positioning of electrodes) produces ball plasmoids with similar observables to those generated using the “traditional” method. This discrepancy is worth studying more closely. A more thorough understanding of the first few microseconds of the discharge will undoubtedly lead to better understanding of the properties of these discharges and could potentially confirm or refute the model of a negatively-charged shell proposed by the authors of [2].
It stands to reason that the polarity of the electrodes greatly influences the initiation phase of the discharge, namely, how the initial spark channels form between the central electrode and the surrounding liquid electrolyte. This raises additional questions about the nature of these spark channels, e.g., what is the distribution of space charge around the electrode/electrolyte interface; to which electrode are the streamer channels directed (cathode directed vs. anode directed); what breakdown mechanism should be employed to describe the formation of the streamer channels; what ions are formed in the first collisional processes and at what densities? High-speed videography and fast electrical and spectroscopic diagnostics are the necessary next steps for understanding the initiation and formation of ball plasmoid discharges.
Supplementary Materials
The following are available at https://0-www-mdpi-com.brum.beds.ac.uk/2571-6182/3/3/8/s1.
Author Contributions
Experimental setup, S.E.D. and A.N.R.; Data acquisition, S.E.D. and A.N.R.; Data analysis, S.E.D.; Manuscript writing—original draft preparation, S.E.D.; Manuscript writing—review and editing, B.J.M. and N.G.G.; Supervision, B.J.M. and N.G.G.; Project administration, B.J.M. All authors have read and agreed to the published version of the manuscript.
Funding
This research received no external funding.
Conflicts of Interest
The authors declare no conflict of interest.
References
- Egorov, A.I.; Stepanov, S.I. Long-lived plasmoids produced in humid air as analogues of ball lightning. Tech. Phys. 2002, 47, 1584–1586. [Google Scholar] [CrossRef]
- Egorov, A.I.; Stepanov, S.I.; Shabanov, G.D. Laboratory demonstration of ball lightning. Phys. Usp. 2004, 47, 99–101. [Google Scholar] [CrossRef]
- Egorov, A.I.; Stepanov, S.I. Properties of short-living ball lightning produced in the laboratory. Tech. Phys. 2008, 53, 688. [Google Scholar] [CrossRef]
- Sakawa, Y.; Sugiyama, K.; Tanabe, T.; More, R. Fireball Generation in a Water Discharge. Plasma Fusion Res. Rapid Commun. 2006, 1, 39. [Google Scholar] [CrossRef] [Green Version]
- Hayashi, N.; Satomi, H.; Kajiwara, T.; Tanabe, T. Properties of ball lightning generated by a pulsed discharge on surface of an electrolyte in the atmosphere. IEEJ Trans. Electr. Electron. Eng. 2008, 3, 731–733. [Google Scholar] [CrossRef]
- Versteegh, A.; Behringer, K.; Fantz, U.; Fussmann, G.; Jüttner, B.; Noack, S. Long-living plasmoids from an atmospheric water discharge. Plasma Sources Sci. Technol. 2008, 17, 024014. [Google Scholar] [CrossRef] [Green Version]
- Fantz, U.; Kalafat, S.; Friedl, R.; Briefi, S. Generation of an atmospheric plasmoid from a water discharge: An analysis of the dissipated energy. J. Appl. Phys. 2013, 114, 043302. [Google Scholar] [CrossRef]
- Friday, D.M.; Broughton, P.B.; Lee, T.A.; Schutz, G.A.; Betz, J.N.; Lindsay, C.M. Further Insight into the Nature of Ball-Lightning-Like Atmospheric Pressure Plasmoids. J. Phys. Chem. A 2013, 117, 9931–9940. [Google Scholar] [CrossRef] [PubMed]
- Stephan, K.D.; Dumas, S.; Komala-Noor, L.; McMinn, J. Initiation, growth and plasma characteristics of “Gatchin” water plasmoids. Plasma Sources Sci. Technol. 2013, 22, 025018. [Google Scholar] [CrossRef]
- Dubowsky, S.E.; Friday, D.M.; Peters, K.C.; Zhao, Z.; Perry, R.H.; McCall, B.J. Mass spectrometry of atmospheric-pressure ball plasmoids. Int. J. Mass Spectrom. 2015, 376, 39–45. [Google Scholar] [CrossRef]
- Dubowsky, S.E.; Deutsch, B.; Bhargava, R.; McCall, B.J. Infrared emission spectroscopy of atmospheric-pressure ball plasmoids. J. Mol. Spectrosc. 2016, 322, 1–8. [Google Scholar] [CrossRef]
- Stelmashuk, V.; Hoffer, P. Experimental Study of a Long-Living Plasmoid Using High-Speed Filming. IEEE Trans. Plasma Sci. 2017, 45, 3160–3165. [Google Scholar] [CrossRef]
Figure 1.
Simplified circuit diagram of plasmoid generator circuit with ring as cathode. (A): Hall-effect current sensor (V): voltage divider. Inset A: diagram of electrode setup; Inset B: photo of a pristine tungsten electrode and alumina insulator.
Figure 1.
Simplified circuit diagram of plasmoid generator circuit with ring as cathode. (A): Hall-effect current sensor (V): voltage divider. Inset A: diagram of electrode setup; Inset B: photo of a pristine tungsten electrode and alumina insulator.

Figure 2.
A series of images obtained using the Phantom v5.2 high-speed camera from a single plasmoid discharge with the ring as the cathode. A scale bar is included. The video corresponding to these images is included in the Supplemental Materials.
Figure 2.
A series of images obtained using the Phantom v5.2 high-speed camera from a single plasmoid discharge with the ring as the cathode. A scale bar is included. The video corresponding to these images is included in the Supplemental Materials.

Figure 3.
Discharge current profiles as a function of discharge potential recorded using a copper anode. Inset: maximum discharge current as a function of discharge potential for a copper anode.
Figure 3.
Discharge current profiles as a function of discharge potential recorded using a copper anode. Inset: maximum discharge current as a function of discharge potential for a copper anode.

Figure 4.
Discharge current profiles as a function of discharge potential recorded using a tungsten anode. Inset: maximum discharge current as a function of discharge potential for a tungsten anode.
Figure 4.
Discharge current profiles as a function of discharge potential recorded using a tungsten anode. Inset: maximum discharge current as a function of discharge potential for a tungsten anode.

Figure 5.
Current traces recorded from 6000 V ball plasmoid discharges from a tungsten electrode at both electrode polarities. Both data sets were fit to an exponential.
Figure 5.
Current traces recorded from 6000 V ball plasmoid discharges from a tungsten electrode at both electrode polarities. Both data sets were fit to an exponential.

Figure 6.
Fits to the current (red circles) and voltage (blue squares) profiles recorded during an 8000 V discharge (with the ring as the cathode), and the associated resistance (black dashes) and power (gold dashes) calculated from those fits. Note that only the decay of the voltage and current are fit in this instance.

Figure 7.
Voltage traces recorded from 6000 V ball plasmoid discharges from a tungsten electrode at both electrode polarities. Each data set was fit to a biexponential.
Figure 7.
Voltage traces recorded from 6000 V ball plasmoid discharges from a tungsten electrode at both electrode polarities. Each data set was fit to a biexponential.

Figure 8.
Electrical analysis and corresponding images of a plasmoid discharge at 3500 V (ring as cathode). Streamers and a jet can be observed in these images. Note: the pattern beginning at approx. 450 ms in the resistance profile is an artifact from a polynomial fit to the entirety of the current profile.

Figure 9.
Electrical analysis and corresponding images of a discharge at 2500 V (ring as cathode). The voltage profile is fit to a single exponential for this discharge. These images do not show the formation of streamers or a jet at the anode. Note: the pattern beginning at approx. 500 ms in the resistance profile is an artifact from a polynomial fit to the entirety of the current profile.

© 2020 by the authors. Licensee MDPI, Basel, Switzerland. This article is an open access article distributed under the terms and conditions of the Creative Commons Attribution (CC BY) license (http://creativecommons.org/licenses/by/4.0/).
Share and Cite
MDPI and ACS Style
Dubowsky, S.E.; Rose, A.N.; Glumac, N.G.; McCall, B.J. Electrical Properties of Reversed-Polarity Ball Plasmoid Discharges. Plasma 2020, 3, 92-102. https://0-doi-org.brum.beds.ac.uk/10.3390/plasma3030008
AMA Style
Dubowsky SE, Rose AN, Glumac NG, McCall BJ. Electrical Properties of Reversed-Polarity Ball Plasmoid Discharges. Plasma. 2020; 3(3):92-102. https://0-doi-org.brum.beds.ac.uk/10.3390/plasma3030008
Chicago/Turabian StyleDubowsky, Scott E., Amber N. Rose, Nick G. Glumac, and Benjamin J. McCall. 2020. "Electrical Properties of Reversed-Polarity Ball Plasmoid Discharges" Plasma 3, no. 3: 92-102. https://0-doi-org.brum.beds.ac.uk/10.3390/plasma3030008