
Negative Hydrogen and Deuterium Ion Density in a Low Pressure Plasma in Front of a Converter Surface at Different Work Functions


Abstract
:1. Introduction
2. Negative Ion Formation in Low Pressure Plasmas
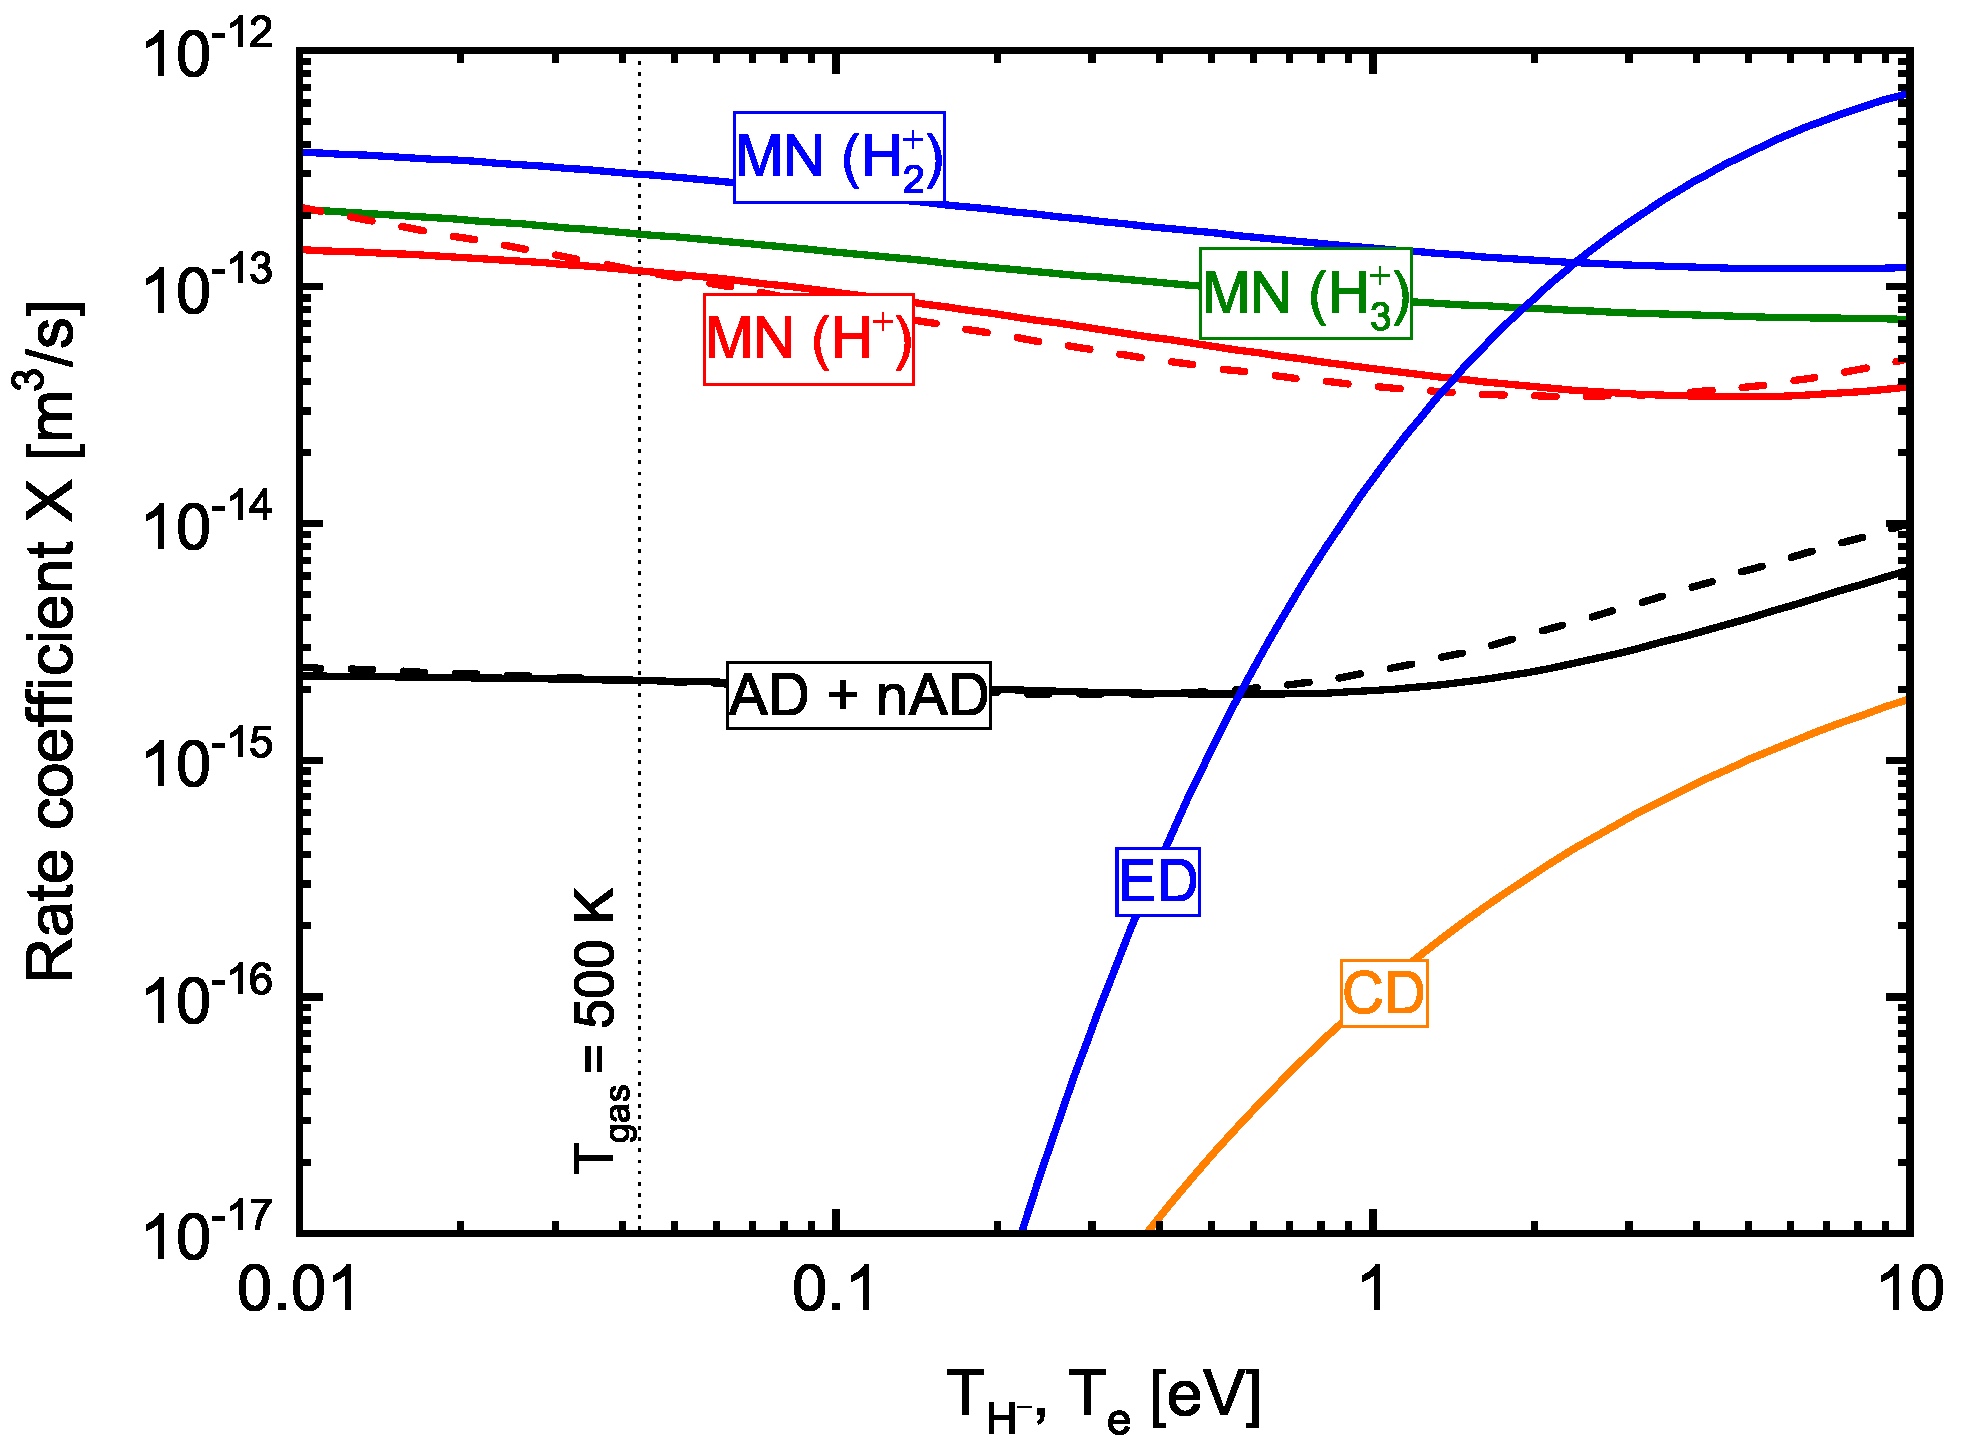
2.1. Volume Formation
2.2. Surface Formation
2.3. Destruction Mechanisms
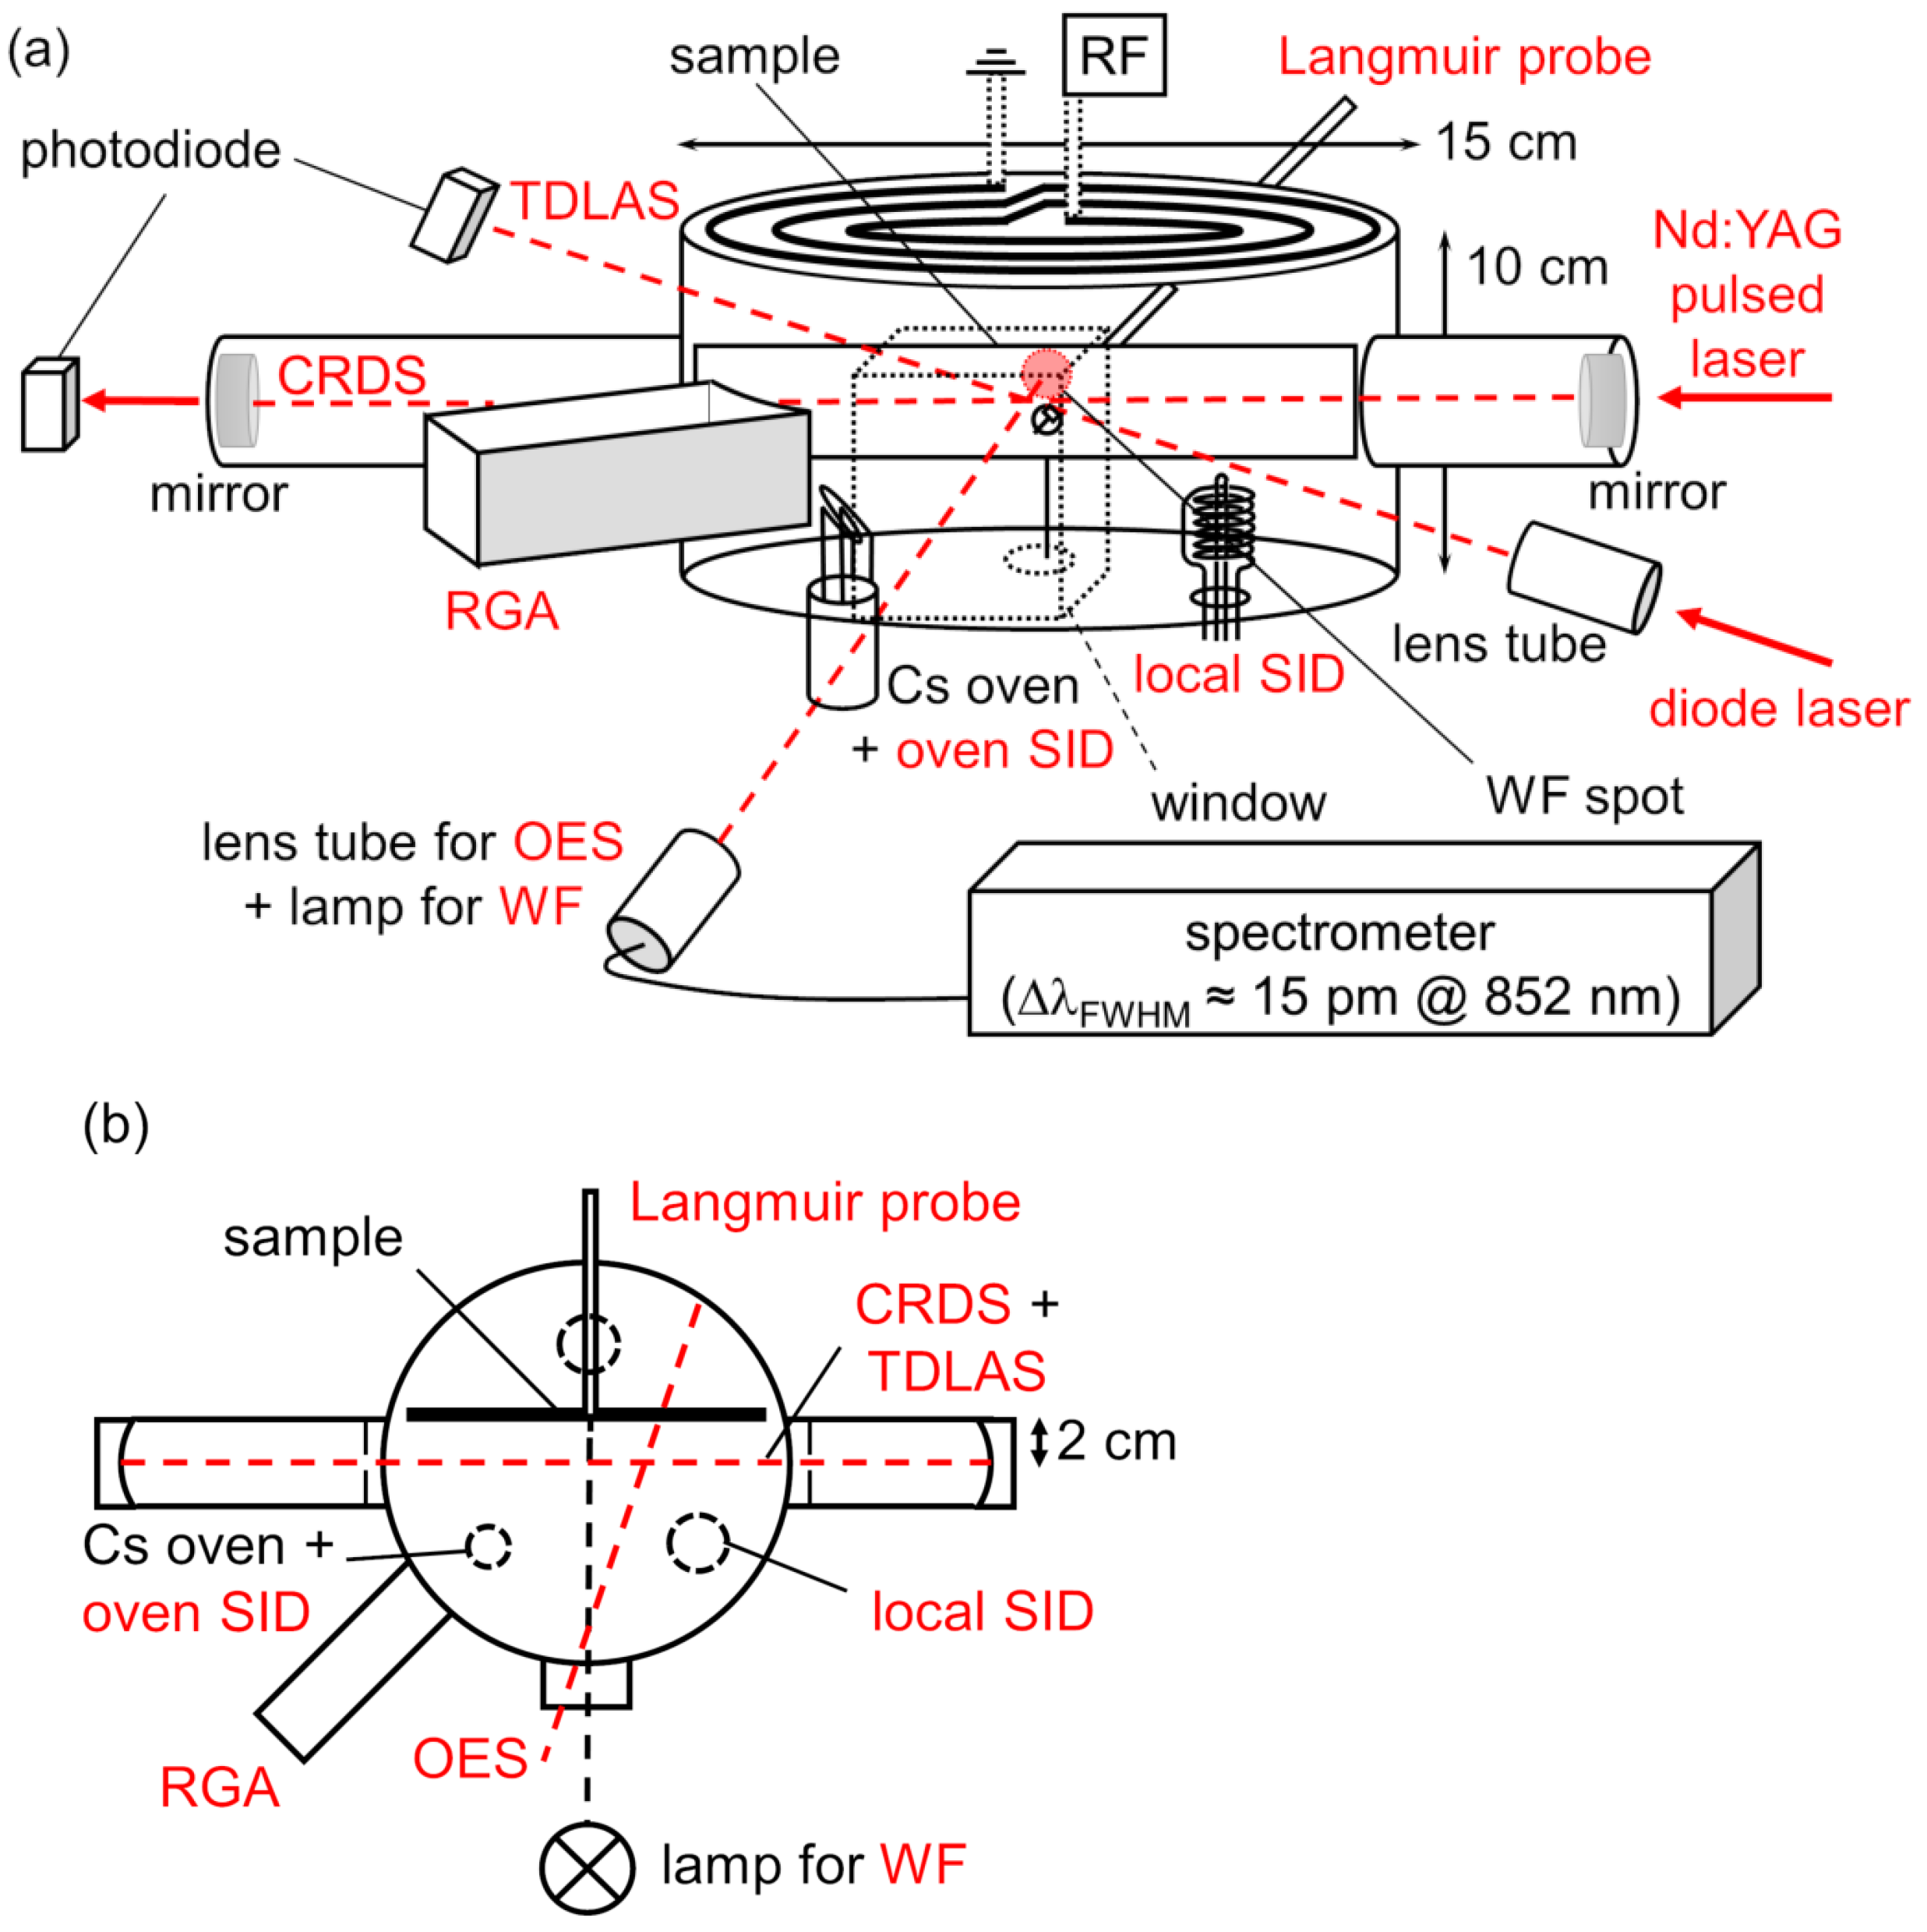
3. Experimental Setup
3.1. Diagnostics
3.2. Measurement Procedure
3.3. Modelling of the H Volume Processes
4. Results and Discussion
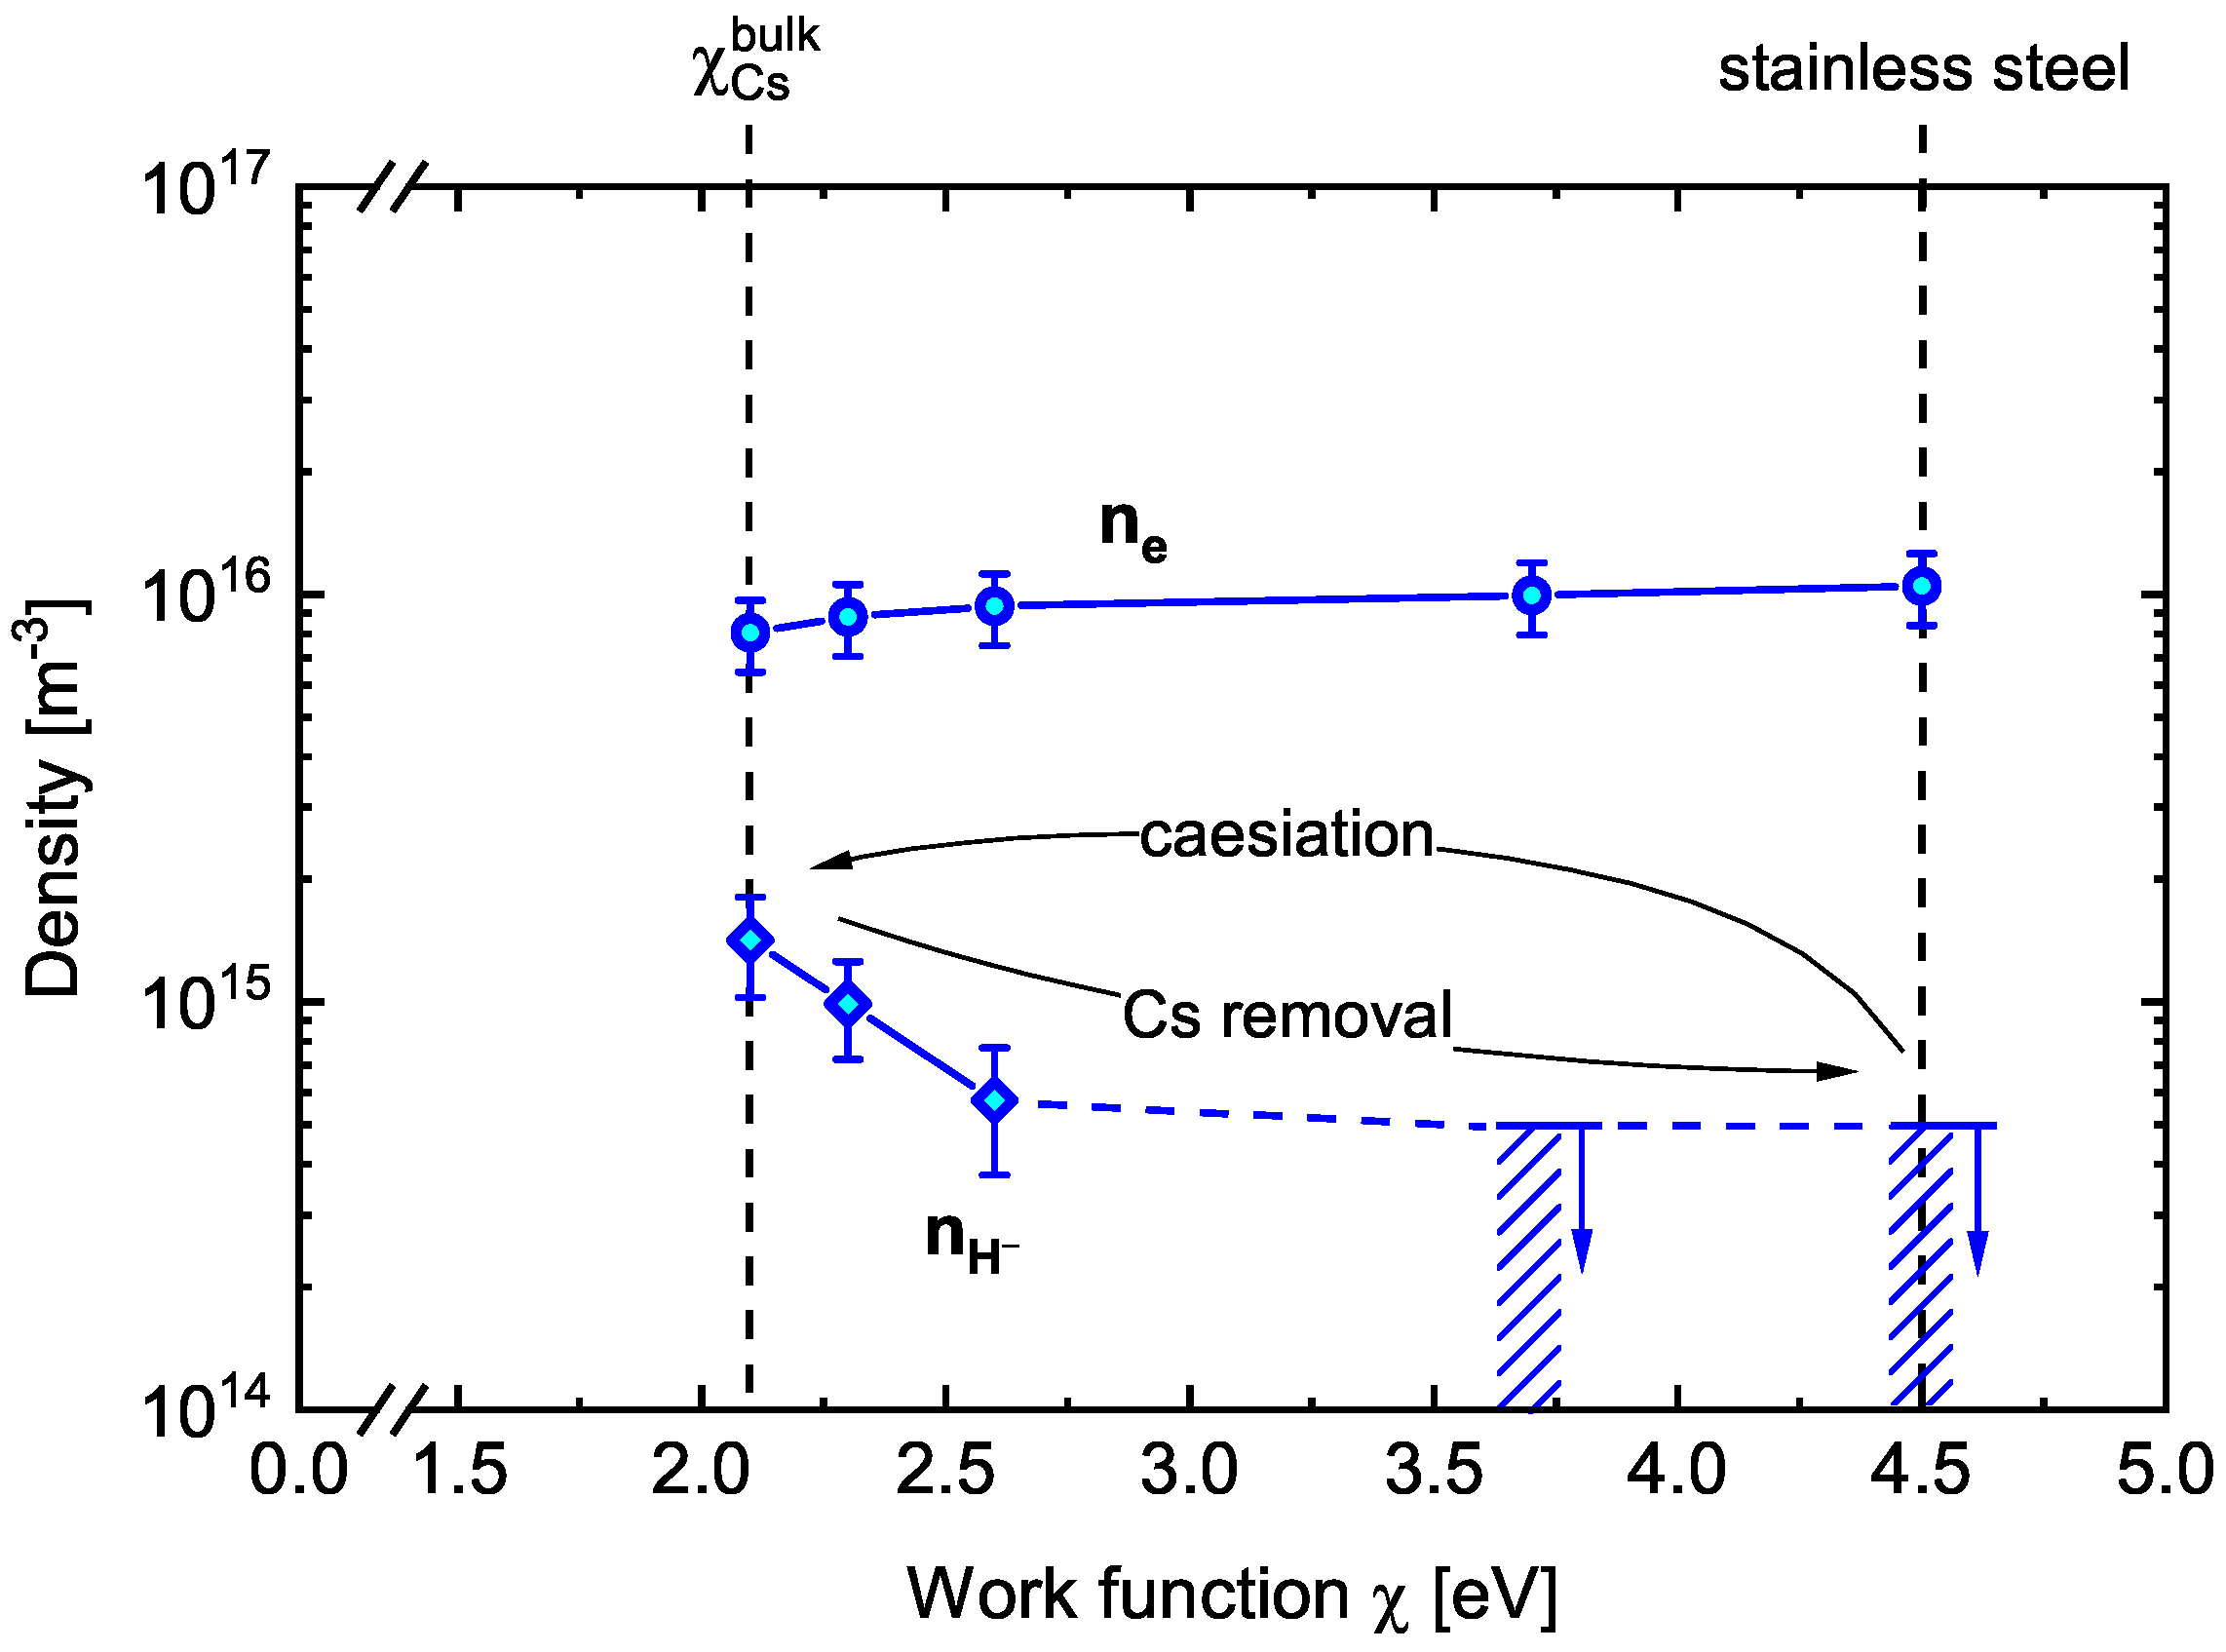
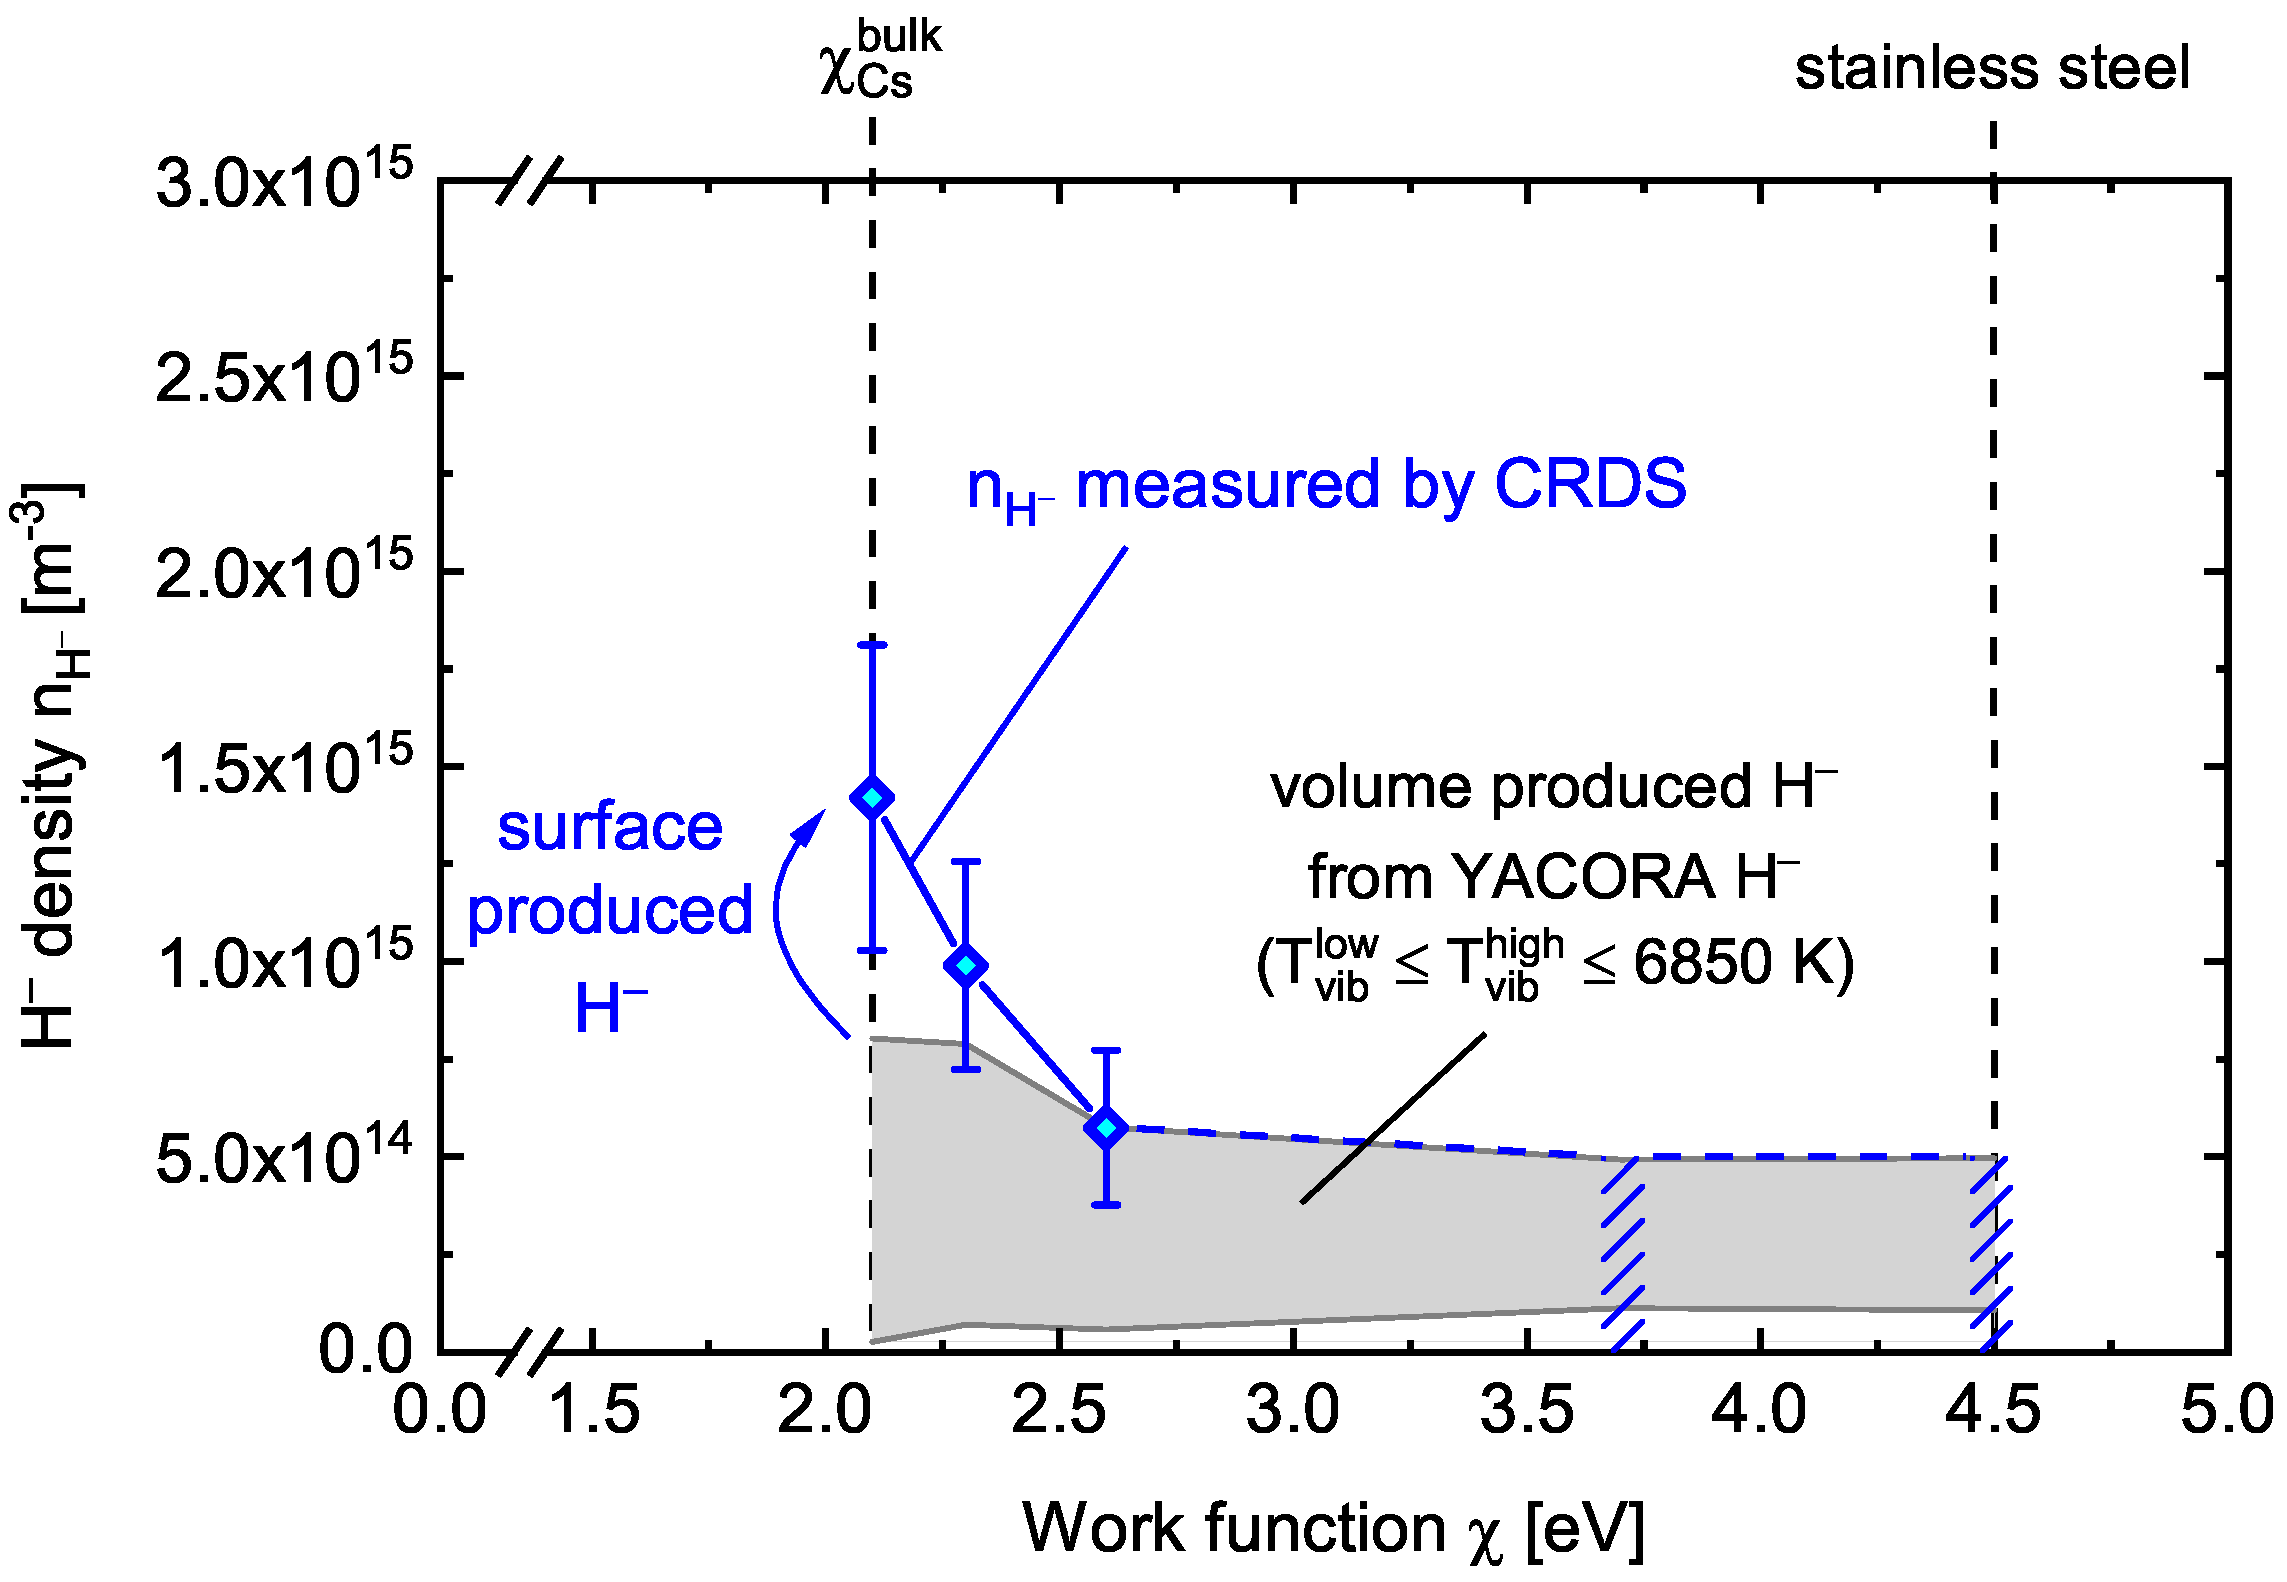
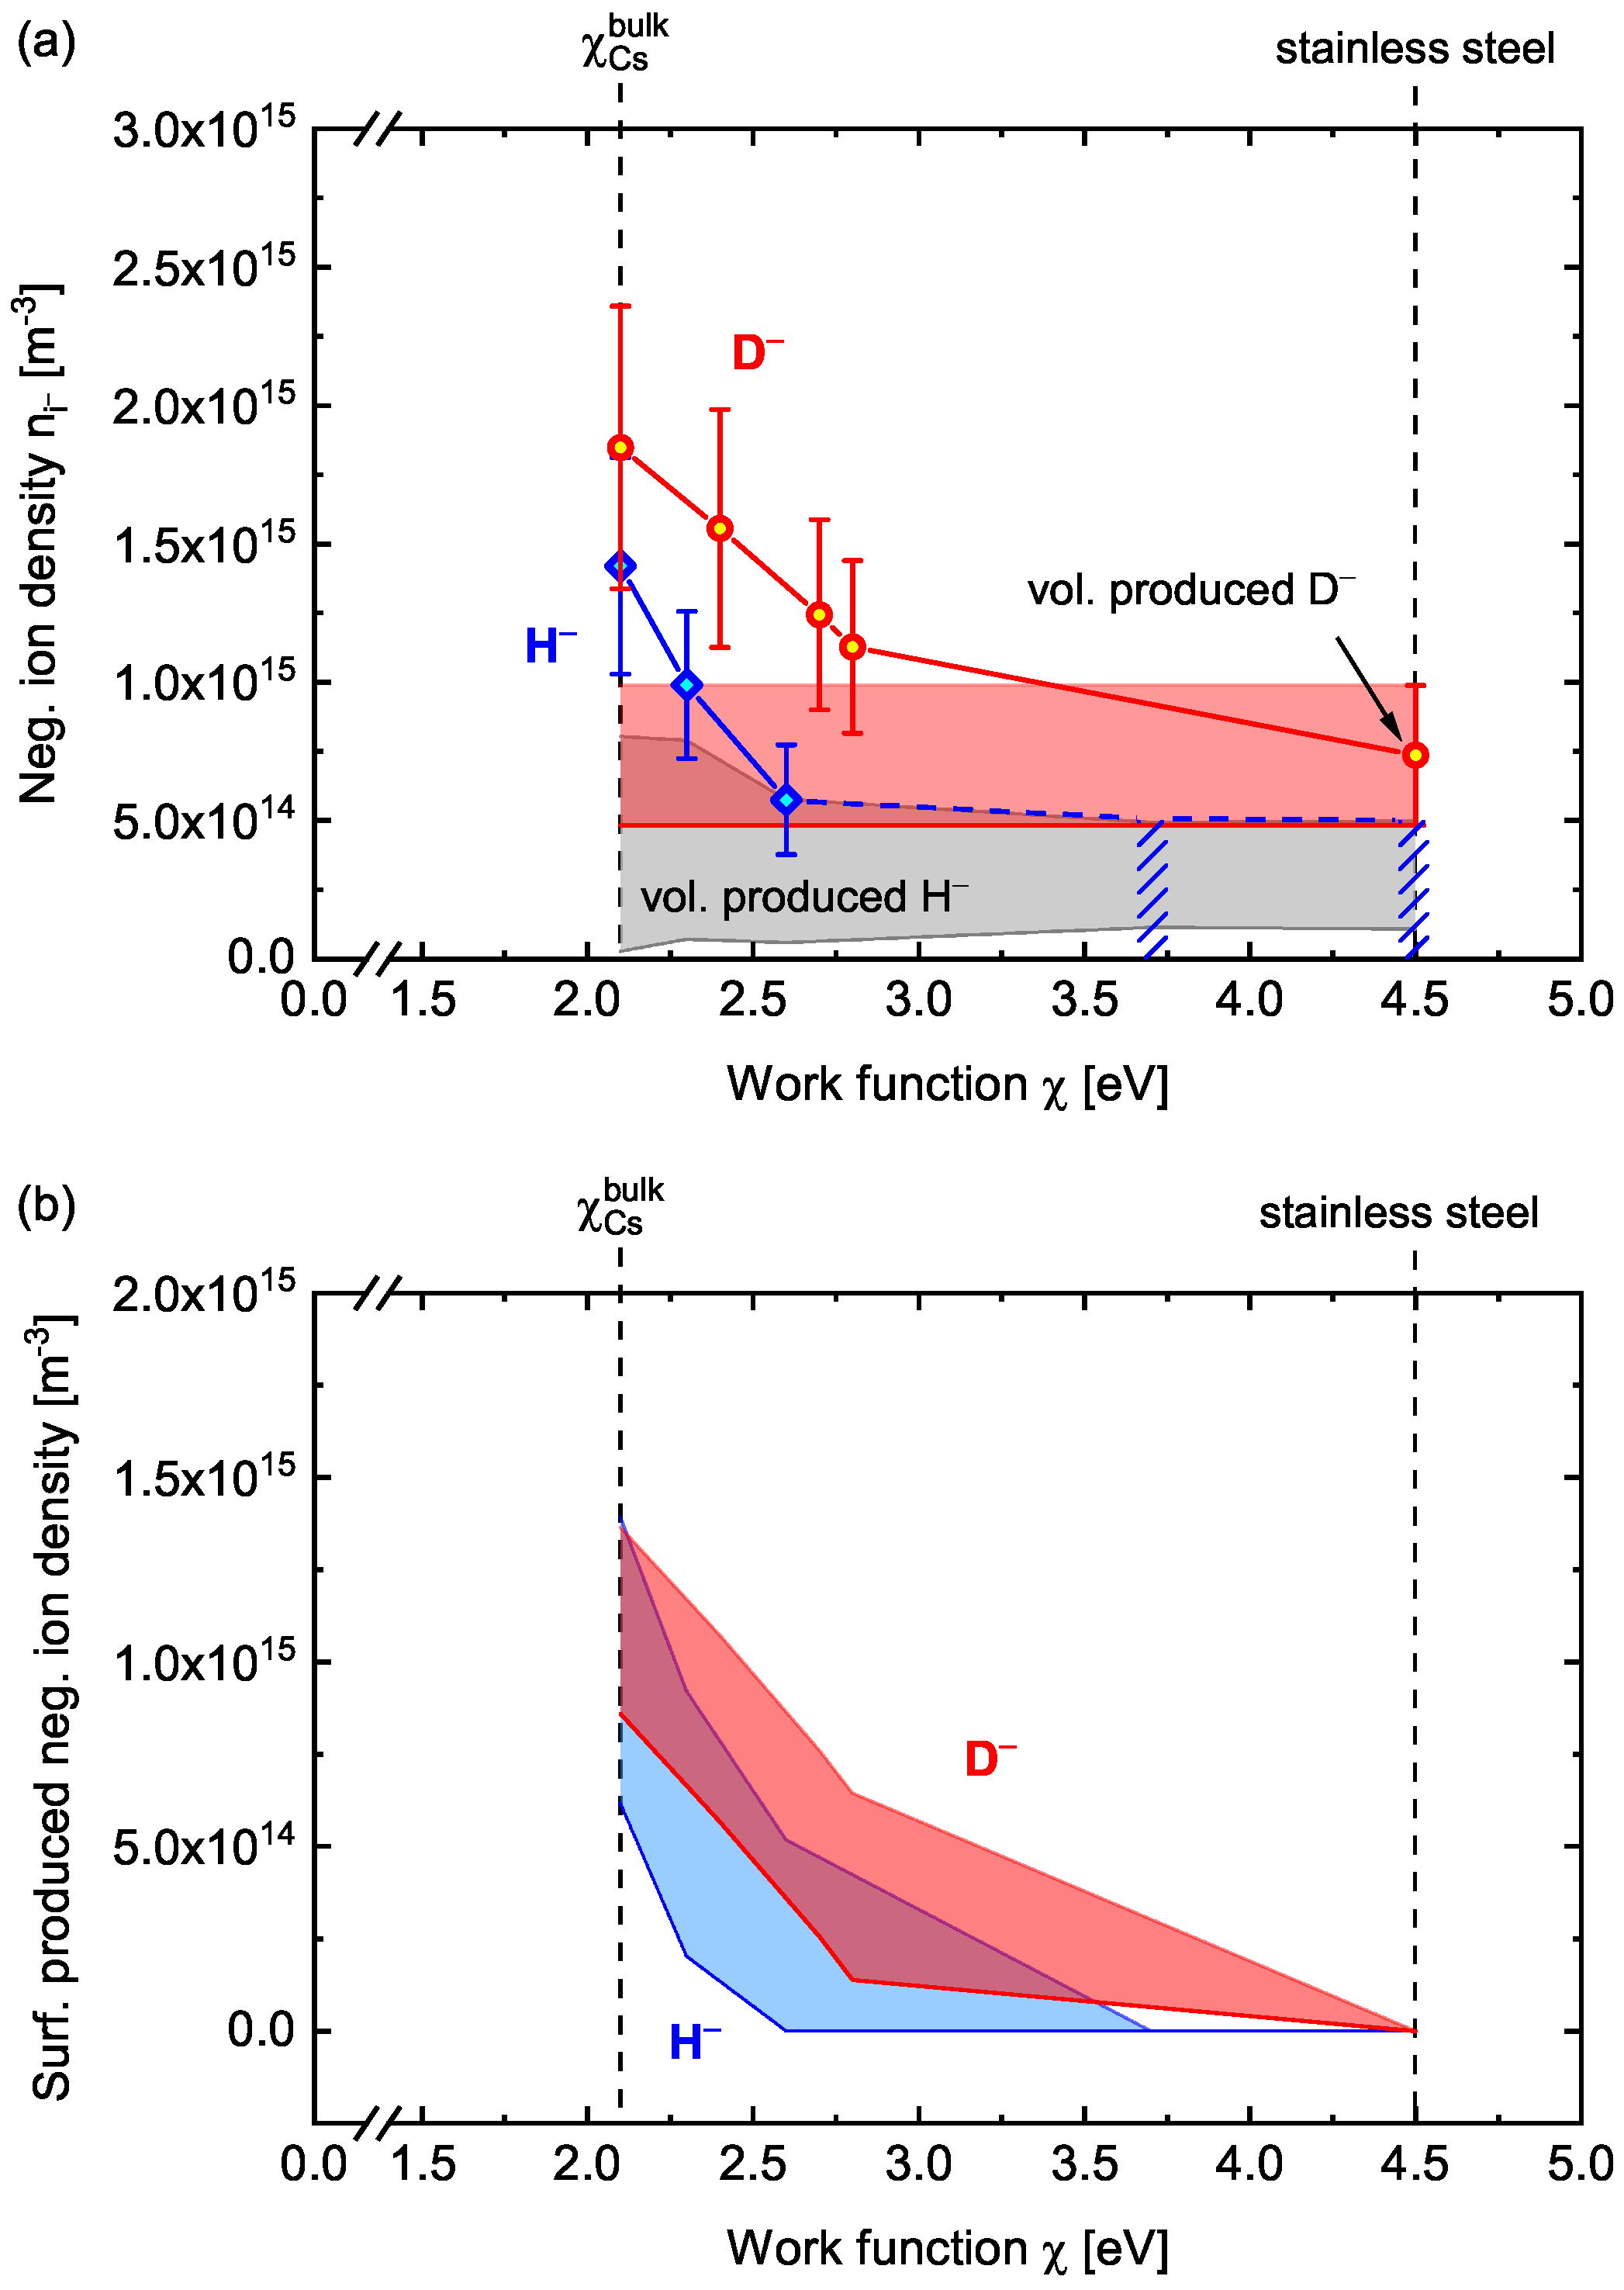
4.1. Correlation between Work Function and H− Density
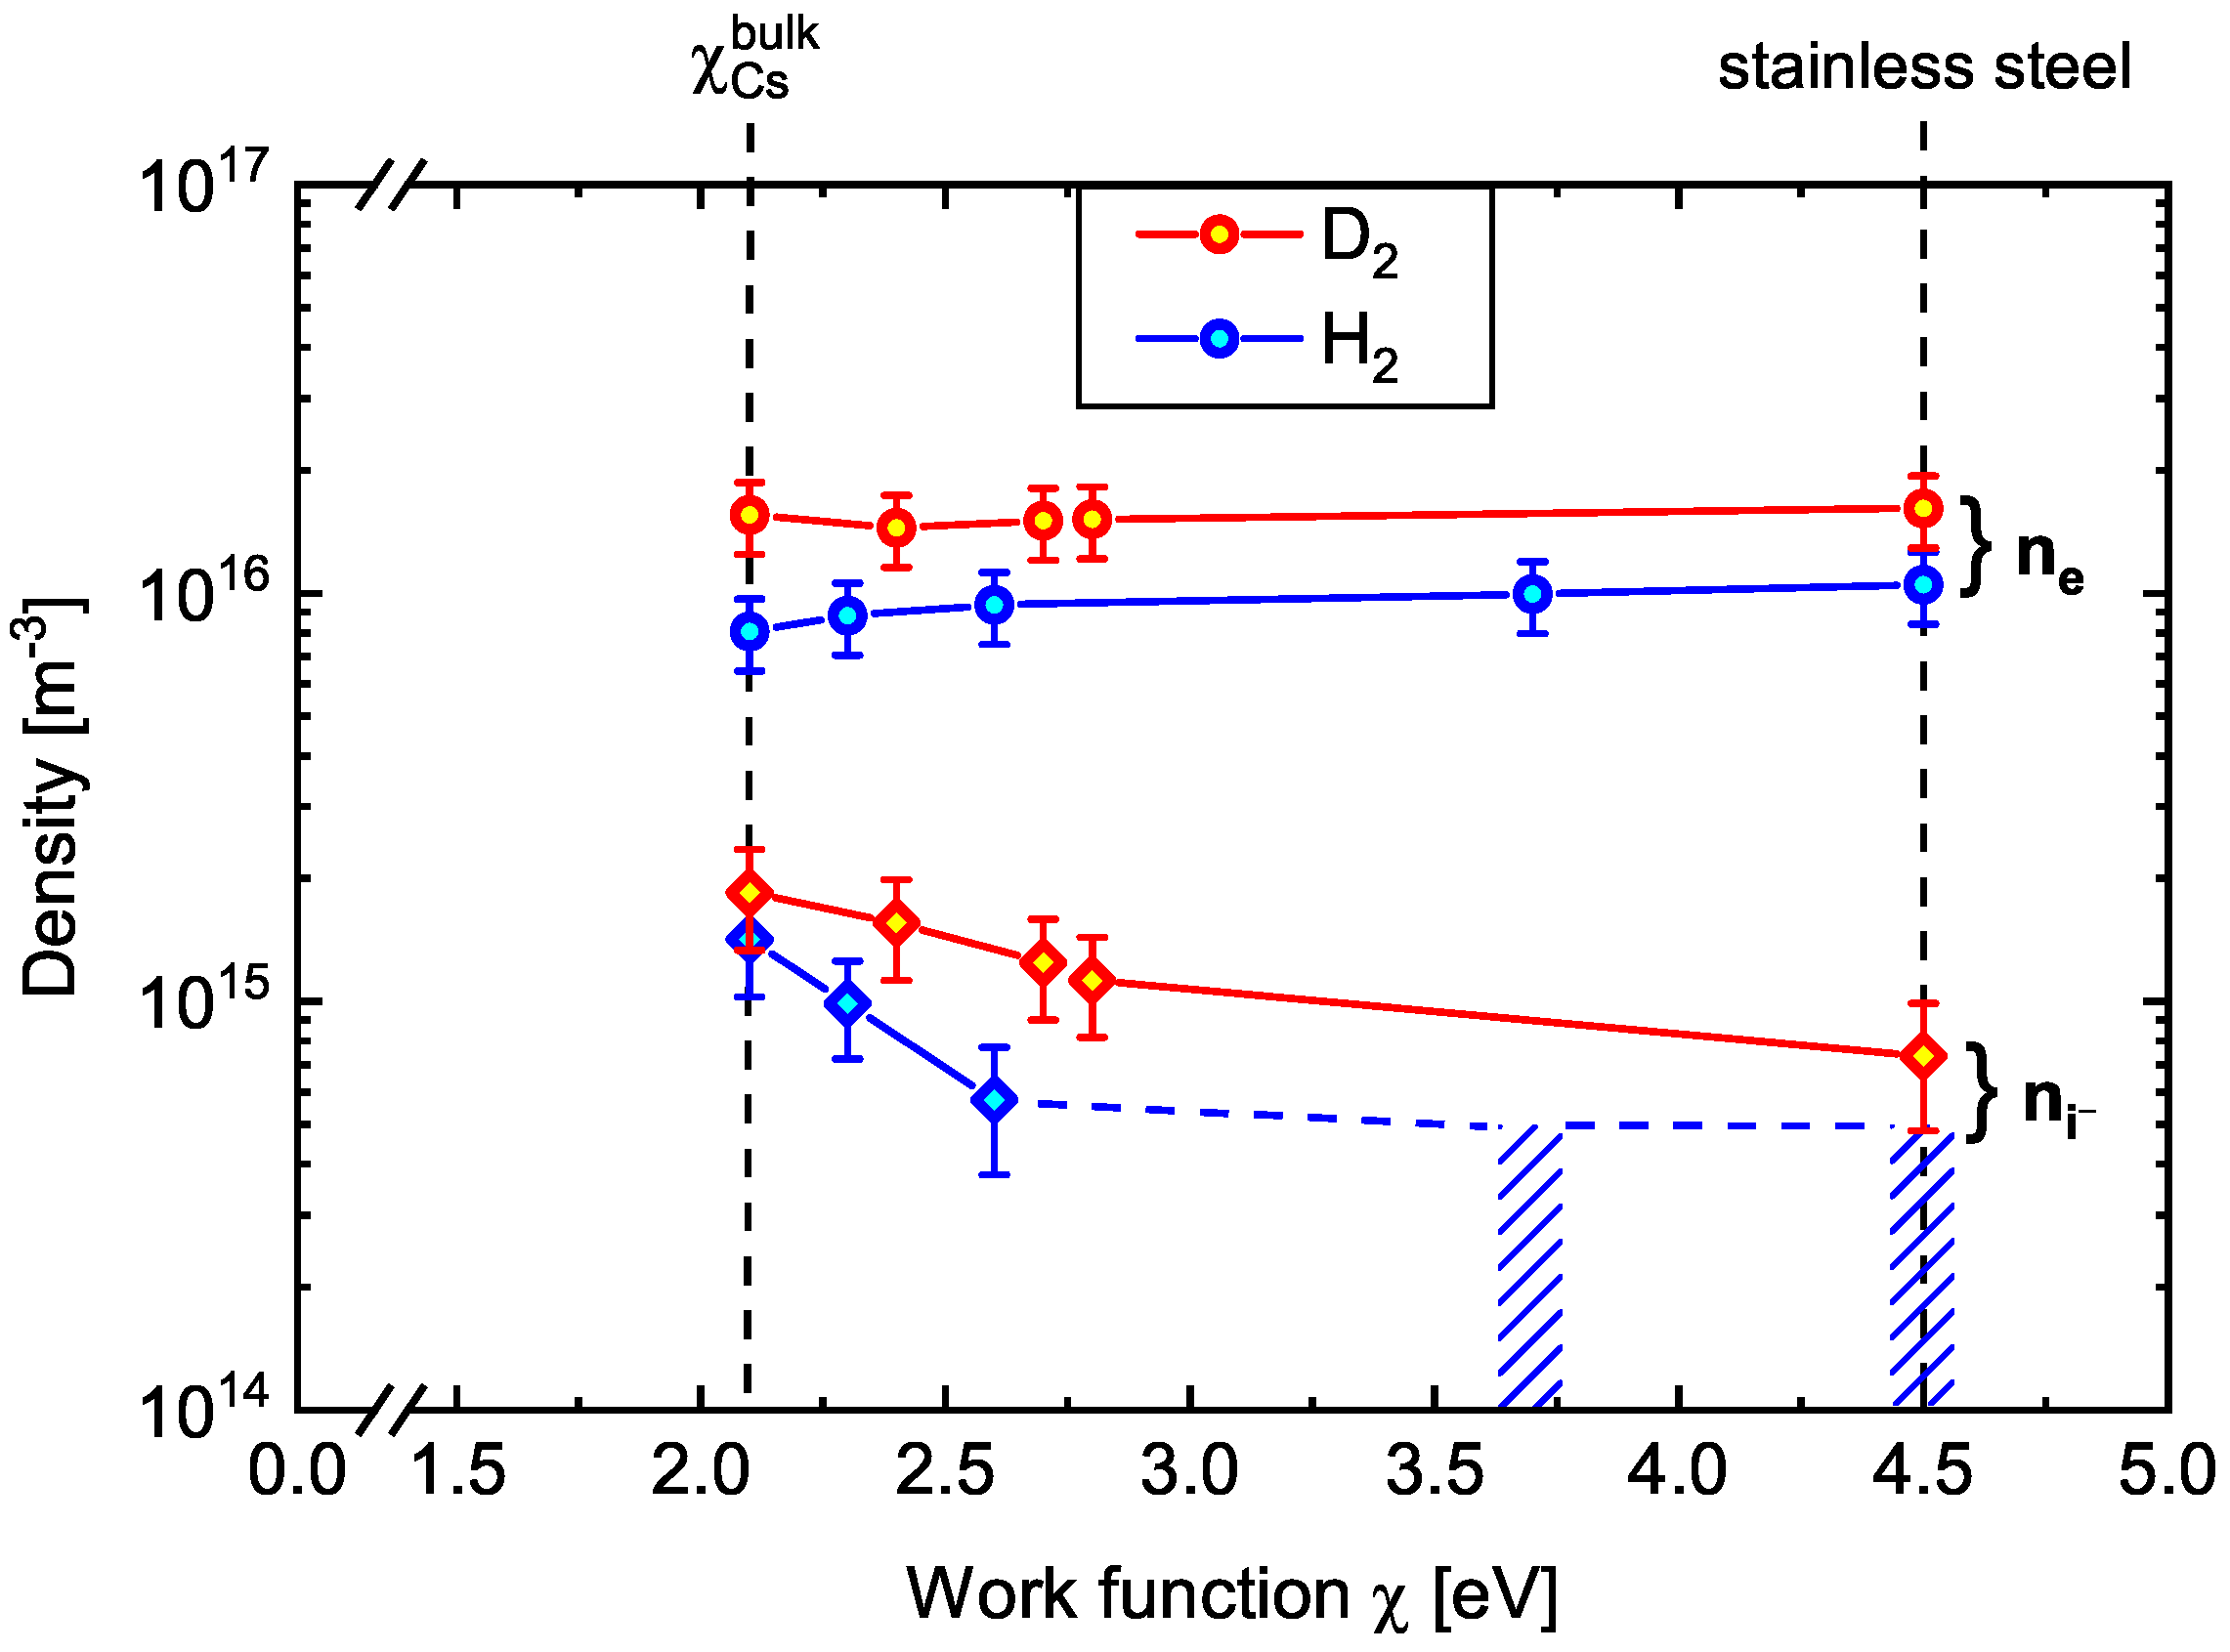
4.2. Comparison between H and D Plasmas
5. Summary and Conclusions
Author Contributions
Funding
Institutional Review Board Statement
Informed Consent Statement
Data Availability Statement
Conflicts of Interest
References
- IAEA. ITER Technical Basis; ITER EDA Documentation Series 24; International Atomic Energy Agency: Vienna, Austria, 2002. [Google Scholar]
- Hemsworth, R.; Decamps, H.; Graceffa, J. Status of the ITER heating neutral beam system. Nucl. Fusion 2009, 49, 045006. [Google Scholar] [CrossRef] [Green Version]
- Hemsworth, R.S.; Boilson, D.; Blatchford, P. Overview of the design of the ITER heating neutral beam injectors. New J. Phys. 2017, 19, 025005. [Google Scholar] [CrossRef]
- Bacal, M.; Wada, M. Negative hydrogen ion production mechanisms. Appl. Phys. Rev. 2015, 2, 021305. [Google Scholar] [CrossRef]
- Michaelson, H.B. The work function of the elements and its periodicity. J. Appl. Phys. 1977, 48, 4729. [Google Scholar] [CrossRef] [Green Version]
- Dudnikov, V. Forty years of surface plasma source development. Rev. Sci. Instrum. 2012, 83, 02A708. [Google Scholar] [CrossRef]
- Heinemann, B.; Fantz, U.; Kraus, W. Towards large and powerful radio frequency driven negative ion sources for fusion. New J. Phys. 2017, 19, 015001. [Google Scholar] [CrossRef]
- Fantz, U.; Hopf, C.; Wünderlich, D. Towards powerful negative ion beams at the test facility ELISE for the ITER and DEMO NBI systems. Nucl. Fusion 2017, 57, 116007. [Google Scholar] [CrossRef] [Green Version]
- Kraus, W.; Wünderlich, D.; Fantz, U. Deuterium results at the negative ion source test facility ELISE. Rev. Sci. Instrum. 2018, 89, 052102. [Google Scholar] [CrossRef] [Green Version]
- Wimmer, C.; Mimo, A.; Lindauer, M. Improved understanding of the Cs dynamics in large H− sources by combining TDLAS measurements and modeling. AIP Conf. Proc. 2018, 2011, 060001. [Google Scholar] [CrossRef] [Green Version]
- Cristofaro, S.; Friedl, R.; Fantz, U. Correlation of Cs flux and work function of a converter surface during long plasma exposure for negative ion sources in view of ITER. Plasma Res. Express 2020, 2, 035009. [Google Scholar] [CrossRef]
- Tsumori, K.; Nakano, H.; Kisaki, M. Spatial distribution of the charged particles and potentials during beam extraction in a negative-ion source. Rev. Sci. Instrum. 2012, 83, 02B116. [Google Scholar] [CrossRef]
- Wünderlich, D.; Riedl, R.; Bonomo, F. Achievement of ITER-relevant accelerated negative hydrogen ion current densities over 1000 s at the ELISE test facility. Nucl. Fusion 2019, 59, 084001. [Google Scholar] [CrossRef]
- Mimo, A.; Nakano, H.; Wimmer, C.; Wünderlich, D.; Fantz, U.; Tsumori, K. Cavity ring-down spectroscopy system for the evaluation of negative hydrogen ion density at the ELISE test facility. Rev. Sci. Instrum. 2020, 91, 013510. [Google Scholar] [CrossRef]
- Wünderlich, D.; Gutser, R.; Fantz, U. PIC code for the plasma sheath in large caesiated RF sources for negative hydrogen ions. Plasma Sources Sci. Technol. 2009, 18, 045031. [Google Scholar] [CrossRef]
- Fantz, U.; Schiesko, L.; Wünderlich, D.; the NNBI Team. A comparison of hydrogen and deuterium plasmas in the IPP prototype ion source for fusion. AIP Conf. Proc. 2013, 1515, 187. [Google Scholar] [CrossRef]
- Giacomin, M. Application of Collisional Radiative Models for Atomic and Molecular Hydrogen to a Negative Ion Source for Fusion. Master’s Thesis, University of Padova, Padova, Italy, 2017. [Google Scholar]
- Friedl, R.; Fantz, U. Influence of H2 and D2 plasmas on the work function of caesiated materials. J. Appl. Phys. 2017, 122, 083304. [Google Scholar] [CrossRef] [Green Version]
- Bardsley, J.N.; Wadehra, J.M. Dissociative attachment and vibrational excitation in low-energy collisions of electrons with H2 and D2. Phys. Rev. A 1979, 20, 1398. [Google Scholar] [CrossRef] [Green Version]
- Krishnakumar, E.; Denifl, S.; Čadež, I.; Markelj, S.; Mason, N.J. Dissociative Electron Attachment Cross Sections for H2 and D2. Phys. Rev. Lett. 2011, 106, 243201. [Google Scholar] [CrossRef] [PubMed] [Green Version]
- Isenberg, J.D.; Kwon, H.J.; Seidl, M. Surface production of H− ions by backscattering of H+ and ions in the 3–50 eV ion energy range. AIP Conf. Proc. 1992, 287, 38. [Google Scholar] [CrossRef]
- Seidl, M.; Cui, H.L.; Isenberg, J.D. Negative surface ionization of hydrogen atoms and molecules. J. Appl. Phys. 1996, 79, 2896. [Google Scholar] [CrossRef]
- Rasser, B.; Wunnik, J.N.M.v.; Los, J. Theoretical models of the negative ionization of hydrogen on clean tungsten, cesiated tungsten and cesium surfaces at low energies. Surf. Sci. 1982, 118, 697. [Google Scholar] [CrossRef]
- Nørskov, J.K.; Lundqvist, B.I. Secondary-ion emission probability in sputtering. Phys. Rev. B 1979, 19, 5661. [Google Scholar] [CrossRef]
- Lang, N.D.; Nørskov, J.K. The Theory of Ionization Probability in Sputtering. Phys. Scr. 1983, T6, 15. [Google Scholar] [CrossRef]
- Cui, H.L. Resonant charge transfer in the scattering of hydrogen atoms from a metal surface. J. Vac. Sci. Technol. A 1991, 9, 1823. [Google Scholar] [CrossRef]
- Melnychuk, S.T.; Seidl, M. Reflection of hydrogen atoms from alkali and alkaline earth oxide surfaces. J. Vac. Sci. Technol. A 1991, 9, 1650. [Google Scholar] [CrossRef]
- Lee, B.S.; Seidl, M. Surface production of H− ions by hyperthermal hydrogen atoms. Appl. Phys. Lett. 1992, 61, 2857. [Google Scholar] [CrossRef]
- Janev, R.K.; Reiter, D.; Samm, U. Collision Processes in Low-Temperature Hydrogen Plasmas; Berichte des Forschungszentrums Jülich; Forschungszentrum Jülich: Jülich, Germany, 2003; Volume 4105. [Google Scholar]
- Miller, K.A.; Bruhns, H.; Cížek, M. Isotope effect for associative detachment: H(D)− + H(D) → H2(D2) + e−. Phys. Rev. A 2012, 86, 032714. [Google Scholar] [CrossRef] [Green Version]
- Huq, M.S.; Doverspike, L.D.; Champion, R.L. Electron detachment for collisions of H− and D− with hydrogen molecules. Phys. Rev. A 1983, 27, 2831. [Google Scholar] [CrossRef]
- Fantz, U.; Friedl, R.; Fröschle, M. Controllable evaporation of cesium from a dispenser oven. Rev. Sci. Instrum. 2012, 83, 123305. [Google Scholar] [CrossRef] [Green Version]
- Friedl, R.; Fantz, U. Influence of cesium on the plasma parameters in front of the plasma grid in sources for negative hydrogen ions. AIP Conf. Proc. 2013, 1515, 255. [Google Scholar] [CrossRef]
- Fantz, U.; Falter, H.; Franzen, P. Spectroscopy—A powerful diagnostic tool in source development. Nucl. Fusion 2006, 46, S297. [Google Scholar] [CrossRef] [Green Version]
- Friedl, R.; Fantz, U. Fundamental studies on the Cs dynamics under ion source conditions. Rev. Sci. Instrum. 2014, 85, 02B109. [Google Scholar] [CrossRef]
- Fowler, R.H. The Analysis of Photoelectric Sensitivity Curves for Clean Metals at Various Temperatures. Phys. Rev. 1931, 38, 45. [Google Scholar] [CrossRef]
- Friedl, R. Enhancing the accuracy of the Fowler method for monitoring non-constant work functions. Rev. Sci. Instrum. 2016, 87, 043901. [Google Scholar] [CrossRef]
- Wünderlich, D.; Fantz, U. Evaluation of State-Resolved Reaction Probabilities and Their Application in Population Models for He, H, and H2. Atoms 2016, 4, 26. [Google Scholar] [CrossRef] [Green Version]
- Rauner, D.; Kurutz, U.; Fantz, U. Comparison of measured and modelled negative hydrogen ion densities at the ECR-discharge HOMER. AIP Conf. Proc. 2015, 1655, 020017. [Google Scholar] [CrossRef] [Green Version]
- Kurutz, U.; Friedl, R.; Fantz, U. Investigations on Cs-free alternatives for negative ion formation in a low pressure hydrogen discharge at ion source relevant parameters. Plasma Phys. Control. Fusion 2017, 59, 075008. [Google Scholar] [CrossRef] [Green Version]
- Bacal, M.; Berlemont, P.; Bruneteau, A.M. Measurement of the H− thermal energy in a volume ion source plasma. J. Appl. Phys. 1991, 70, 1212. [Google Scholar] [CrossRef]
- Nishiura, M.; Sasao, M.; Bacal, B. H− laser photodetachment at 1064, 532, and 355 nm in plasma. J. Appl. Phys. 1998, 83, 2944. [Google Scholar] [CrossRef]
- Lieberman, M.A.; Lichtenberg, A.J. Principles of Plasma Discharges and Materials Processing, 2nd ed.; John Wiley & Sons: Hoboken, NJ, USA, 2005. [Google Scholar]


Publisher’s Note: MDPI stays neutral with regard to jurisdictional claims in published maps and institutional affiliations. |
© 2021 by the authors. Licensee MDPI, Basel, Switzerland. This article is an open access article distributed under the terms and conditions of the Creative Commons Attribution (CC BY) license (http://creativecommons.org/licenses/by/4.0/).
Share and Cite
Cristofaro, S.; Friedl, R.; Fantz, U. Negative Hydrogen and Deuterium Ion Density in a Low Pressure Plasma in Front of a Converter Surface at Different Work Functions. Plasma 2021, 4, 94-107. https://0-doi-org.brum.beds.ac.uk/10.3390/plasma4010007
Cristofaro S, Friedl R, Fantz U. Negative Hydrogen and Deuterium Ion Density in a Low Pressure Plasma in Front of a Converter Surface at Different Work Functions. Plasma. 2021; 4(1):94-107. https://0-doi-org.brum.beds.ac.uk/10.3390/plasma4010007
Chicago/Turabian StyleCristofaro, Sofia, Roland Friedl, and Ursel Fantz. 2021. "Negative Hydrogen and Deuterium Ion Density in a Low Pressure Plasma in Front of a Converter Surface at Different Work Functions" Plasma 4, no. 1: 94-107. https://0-doi-org.brum.beds.ac.uk/10.3390/plasma4010007