Wildfire Response Performance Measurement: Current and Future Directions
by
Matthew P. Thompson
1,*, 
Christopher J. Lauer
2, 
David E. Calkin
3,
Jon D. Rieck
3,
Crystal S. Stonesifer
3 and
Michael S. Hand
4 1
Rocky Mountain Research Station, United States Department of Agriculture Forest Service, Fort Collins, CO 80526, USA
2
Department of Forest and Rangeland Stewardship, Colorado State University, Fort Collins, CO 80523, USA
3
Rocky Mountain Research Station, United States Department of Agriculture Forest Service, Missoula, MT 59801, USA
4
Rocky Mountain Research Station, United States Department of Agriculture Forest Service, Washington, DC 20227, USA
*
Author to whom correspondence should be addressed.
Fire 2018, 1(2), 21; https://0-doi-org.brum.beds.ac.uk/10.3390/fire1020021
Submission received: 11 April 2018
/
Revised: 12 June 2018
/
Accepted: 16 June 2018
/
Published: 24 June 2018
Abstract
:The Forest Service, U.S. Department of Agriculture, defines success in the wildland fire response environment as “safely achieving reasonable objectives with the least firefighter exposure necessary while enhancing stakeholder support for our management efforts”. However, persistent information and knowledge gaps challenge the agency’s ability to measure success in coming fire seasons. In this paper, we outline a roadmap to help fill these gaps, describing progress towards developing meaningful fire response key performance indicators (KPIs). We focus on characterizing suppression resource use and effectiveness as requisite initial steps towards reducing unnecessary exposure. Our intentions are to articulate the rationale for embracing KPIs for fire response operations, briefly review best practices as they relate to organizational performance measurement, and describe recent and emerging analysis techniques designed to ultimately improve responder exposure assessment. Specifically, we review tangible research products that could be operationalized as KPIs in the near future, and illustrate their calculation and interpretation for a set of large fires that occurred in the U.S. in 2017. To conclude, we offer thoughts on productive pathways forward with performance measurement.
1. Introduction
1.1. Response Success and Responder Exposure: The Case for Enhanced Data Collection on Suppression Resource Use and Effectiveness
The Forest Service, U.S. Department of Agriculture, is the largest wildland fire management organization in the United States. The agency defines success in the wildland fire response environment as “safely achieving reasonable objectives with the least firefighter exposure necessary while enhancing stakeholder support for our management efforts” [1] (emphasis added). Historically, however, the Forest Service has not systematically monitored either response objectives or responder exposure levels, such that the agency has a limited ability to actually evaluate past performance with respect to its own definition of success. Furthermore, persistent information and knowledge gaps remain, challenging the agency’s ability to measure success in coming fire seasons.
In this paper, we outline a roadmap to help fill these gaps. In addition, we aim to do so in light of responsibilities imposed upon local agency administrators (AAs), i.e., Forest Supervisors and District Rangers, as well as Incident Commanders (ICs), who are responsible to AAs for all incident wildfire response activities. The Forest Service Manual (Chapter 5130: Wildfire Response) requires AAs to oversee all aspects of wildfire response, to ensure that appropriate objectives are defined, to regularly monitor operations for effectiveness, and to monitor responder fatigue and exposure [1]. ICs oversee Incident Management Teams (IMTs) and are required to make safety the highest priority of response activities, to use risk management principles to develop strategies that minimize responder exposure, and to manage environmental exposure and fatigue [1]. Additionally, the Interagency Standards for Fire and Fire Aviation Operations (i.e., the “Red Book”) calls on AAs to “predetermine the range of acceptable response strategies for protecting the identified values at risk while balancing firefighter and public exposure” [2]. The focus on exposure is consistent with U.S. federal policy stating that “firefighter and public safety is the first priority in every fire management activity” [3].
As the Forest Service’s fire management system continues to learn and improve, better understanding the effectiveness of its actions and their associated levels of responder exposure have become paramount concerns. These concerns have been repeatedly highlighted by the agency and the broader wildland fire community. Examples include the National Cohesive Wildland Fire Management Strategy’s emphasis on safe and effective response [4], survey results from the Forest Service’s Life First initiative indicating common acceptance of unnecessary exposure [5], and findings from empirical studies suggesting ineffective or excessive suppression resource use [6,7]. The 2017 Chief’s Letter of Intent reemphasized the agency’s commitment to only engage in suppression operations “when and where they can be successful” and further stated that “we don’t expect and we won’t allow responders to risk their lives attempting the improbable” [8].
Here we describe progress towards developing meaningful fire response performance measures, in order to provide a preliminary structured blueprint that the Forest Service can use to determine attainment of success. Unpacking the agency’s definition of success leads to at least two questions. First, how do we know if objectives are reasonable? Second, how do we know how much exposure is necessary? Importantly, these questions are interrelated, in that poorly defined or unattainable objectives may lead to unnecessary exposure, and excessive exposure may result in resources being inappropriately assigned while reasonable objectives that could be achieved elsewhere are not addressed due to a lack of resources. In both cases, it is paramount to have a baseline understanding of the effectiveness of suppression operations.
For these reasons, we focus on characterizing suppression resource use and effectiveness as requisite initial steps towards reducing unnecessary exposure. Our intentions are to articulate the rationale for embracing key performance indicators (KPIs) for fire response operations, briefly review best practices as they relate to organizational performance measurement, and describe recent and emerging analysis techniques designed to improve responder exposure assessment. Investing in meaningful KPIs will help the agency improve its risk management capabilities, by establishing a more reliable basis for decision-making, improving organizational learning, and improving operational effectiveness and efficiency [9,10]. More broadly, embracing risk management and performance measurement will ultimately help the Forest Service ensure that its fire management decisions and actions align with its values and long-term goals [11].
1.2. Background on Performance Measurement in the Forest Service, and Origins of Developing Exposure-Relevant KPIs
The lack of a comprehensive approach to performance measurement and accountability in the context of fire management is a well-identified issue [12]. A primary recommendation of the 2014 Quadrennial Fire Review was to “develop key performance indicators for all core programs and begin targeted data collection to support evaluation of the effectiveness of those programs” [13]. Similarly, a series of previous reports over the last 20 years have concluded that the lack of meaningful data and limited analytical capacity remain serious impediments to improving the fire system [14,15,16]. Importantly, these data and analytics needs relate not only to fire behavior but also suppression operations [17,18].
Although the Forest Service has had a performance management framework for some time [19], elements of this framework have a very limited connection to response operations or responder exposure. For example, the fiscal year 2017 budget justification report includes only three categories of measures with direct relevance to fire response: percent of acres burned by natural ignition with resource benefits, percent change from the 10-year average for the number of wildfires controlled during initial attack, and percent of fires that exceed a statistically determined suppression cost threshold [20].
Our intent is not to critique existing performance measures or the broader framework in which they reside, but rather to provide actionable information to expand and enhance fire response performance measurement. This work emerged over the course of several years of close interaction between researchers at the U.S. Forest Service’s Rocky Mountain Research Station and U.S. Forest Service Fire and Aviation Management staff. The primary intention of these efforts is to establish a baseline understanding of how the fire management organization performs with respect to its definition of success, particularly regarding responder exposure through an improved ability to describe and quantify resource use and effectiveness. The secondary intent is to document improved performance and systems of accountability in pursuit of that objective. Ultimately, our long-term intent is to ensure that fire responders are supported with first-rate decision support and information systems to enrich evidence-based management [21].
1.3. Creating Effective Key Performance Indicators (KPIs) for Fire Response
In this section we offer a background on KPIs [22,23] and highlight some key themes that will guide our presentation of next-generation performance measurement for fire response. KPIs are widely used in strategic planning and management settings, and serve as measures of success in areas that are critical for achieving organizational objectives. Monitoring KPIs provides a benchmark to understand patterns of behavior, and to provide feedback and controls for continual improvement. They can help individual decision makers and leadership understand how an organization is performing, and how their own actions are affecting business processes and outcomes. KPIs can also be useful for (1) establishing baselines, targets, and standards for success; (2) identifying gaps in core competencies and capacities; and (3) improving internal and external communication. In sum, use of KPIs provides a disciplined approach for managing performance and tracking progress over time.
Table 1 outlines a generalized framework for defining KPIs. They are typically most useful when they are specific, objective, quantifiable, and easily communicated. They should have a clear line of sight to core organizational objectives, and in this sense can be forward-looking and even aspirational. It is important to identify a set of key issues to avoid diverting the attention of decision makers or creating undue burdens for data collection and analysis.
KPIs can be applied at different levels or scales within the organization, and can focus on areas as diverse as workforce capacity and biophysical condition. Our focal areas for KPI development largely relate to data from day-to-day suppression operations on individual fire incidents. However, finer-scale measures can readily be aggregated to different scales in terms of space (i.e., landscape » forest » region » nation), time (i.e., day » incident duration » season » multi-season), and even chain-of-command (i.e., crew boss » division chief » incident commander » local agency administrator » regional forester » chief). In the next section we expand on some ideas about the importance of aligning scale, accountability, and performance measures, with particular attention paid to the joint responsibility of AAs and ICs for fire response.
In addition to different scales, KPIs can be applied to different components of an organization, including its inputs, processes, outputs and outcomes. One of the struggles for the fire system is overcoming a tendency to focus on simple outputs (e.g., acres treated) and simple outcomes (e.g., acres burned). This reflects a broader challenge of developing effective KPIs, which is ensuring that efforts target what really matters and not what is most easily measured. To that end, we attempt to expand and reframe definition of output- and outcome-based KPIs in relation to exposure, effectiveness, and probability of success. We further attempt to expand the scope of KPIs by considering the magnitude of suppression resources used (i.e., inputs) and the quality of incident decision processes.
Evaluating the quality of decisions can present challenges (e.g., hindsight bias, subjectivity), and yet it is an essential element of organizational performance measurement [24,25]. This is especially true for management contexts like fire response, where we have only partial control over outcomes because fire weather often determines containment opportunities [26,27]. It is therefore important to focus on “upstream” decisions and actions in addition to “downstream” outcomes. Evaluation of decisions seeks to understand the process by which strategic response decisions were reached, based on information that was available at the time of the decision. Evaluation of actions asks what types of suppression resources were used, where, when, under what conditions, and with what probability of success. We focus primarily on suppression actions, and attempt to illustrate how the Forest Service could develop a more robust and meaningful set of KPIs.
Effectively sustaining a performance measurement program requires a number of pieces to fall into place: earnest engagement from leadership, flexibility to adapt to changing conditions, a commitment to generate and rely on scientific evidence as a primary basis for decision-making, and a long-term vision for continuous improvement. Strategies for efficiently rolling out a performance measurement program include developing streamlined information management systems and processes, and phasing implementation so as to start with high-priority, high-leverage KPIs. Successful implementation begins with a solid foundation for developing KPIs (Table 1), one that includes information on the why (i.e., the rationale behind the KPI), the how (i.e., methods to measure the KPI), and the what (i.e., how to interpret the KPI).
2. Developing and Prototyping KPIs for Wildfire Response
In this section we introduce concepts and tangible research products that could help set the stage for the Forest Service to develop meaningful fire response KPIs. The main intentions of developing KPIs for the fire management system could be summarized as follows: (1) to provide feedback that is reliable, transparent, easily understood, and actionable; (2) to facilitate the process of learning and continual improvement; and (3) to integrate with broader initiatives around maturing the agency’s risk management capabilities. These KPIs, if effectively measured and communicated, could in turn: (1) improve evaluation of systemic patterns of fire response behavior; (2) refocus fire managers’ attention on probability of success and unnecessary exposure; and (3) ideally, enhance the safety and effectiveness of all actions taken by ground and aerial suppression resources. It will be desirable to have broad agreement on the definition and usefulness of KPIs, and to ensure they can be readily measured and communicated to the fire management community.
2.1. Measurement Scale and Scope Considerations
As described earlier, AAs and ICs share responsibility for monitoring and managing responder exposure. It is important therefore to develop KPIs that relate to both AAs and ICs, recognizing differences in their respective roles and responsibilities vis-à-vis chain-of-command architecture. Although some ICs may not be Forest Service employees and therefore outside of direct lines of accountability, evaluating their actions is important to understand their impact on AA performance as well as broader system-wide performance. Consider that AAs may oversee multiple fires per season, and may interact with multiple ICs per fire and over the course of a season. Consider also that ICs may manage multiple fires per season, and may interact with multiple AAs per season. Every fire will have some unique characteristics, and each AA–IC interaction may be unique given factors such as personality types and shared experience. Because of this, it would be inappropriate to isolate evaluation of performance and accountability to individual incident-level decisions and actions. Rather, we emphasize the importance of focusing on patterns of AA and IC behavior over time.
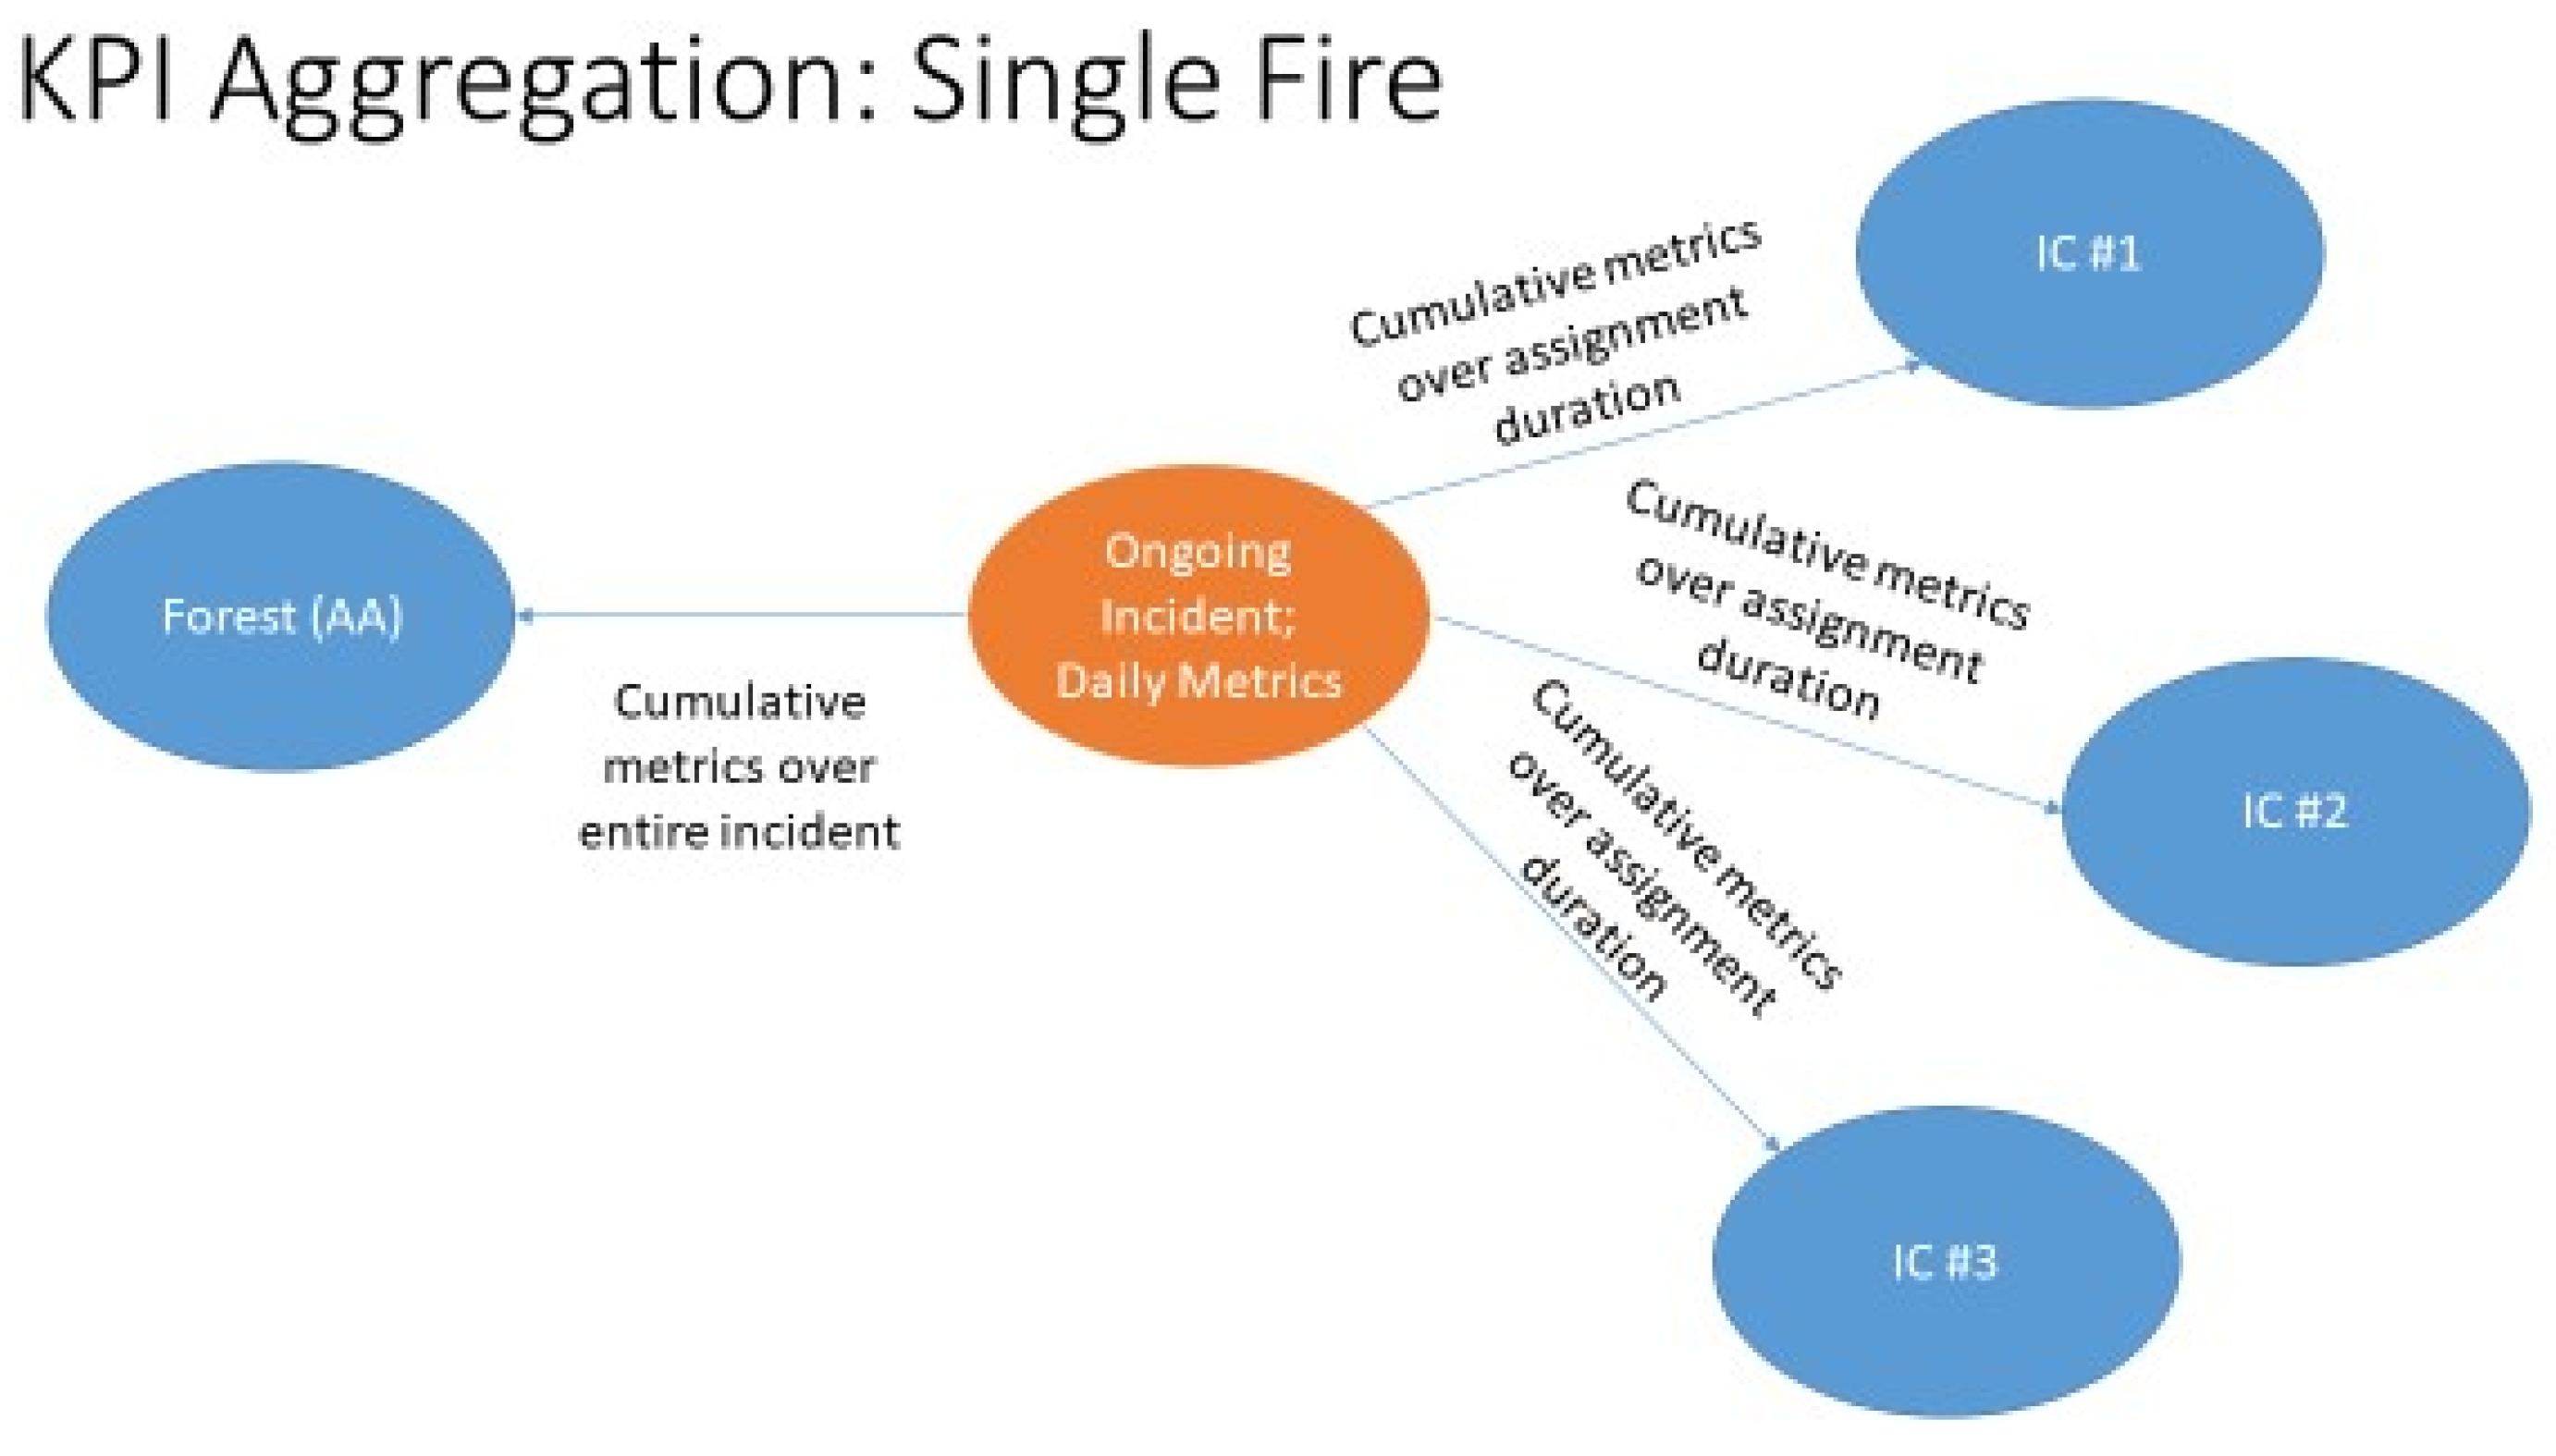
To describe KPI aggregation we begin with consideration of a single large fire incident, and describe how the temporal scales of measurement differ across AAs and ICs. Figure 1 illustrates a situation where multiple ICs were assigned to manage a relatively long-duration fire. Daily metrics related to suppression operations are highlighted in the central orange bubble. These then scale outwards in two directions. First, these metrics are aggregated to the ICs over the course of their respective assignment durations (typically ≤14 days). Second, metrics are aggregated to the AA over the duration of the entire fire.
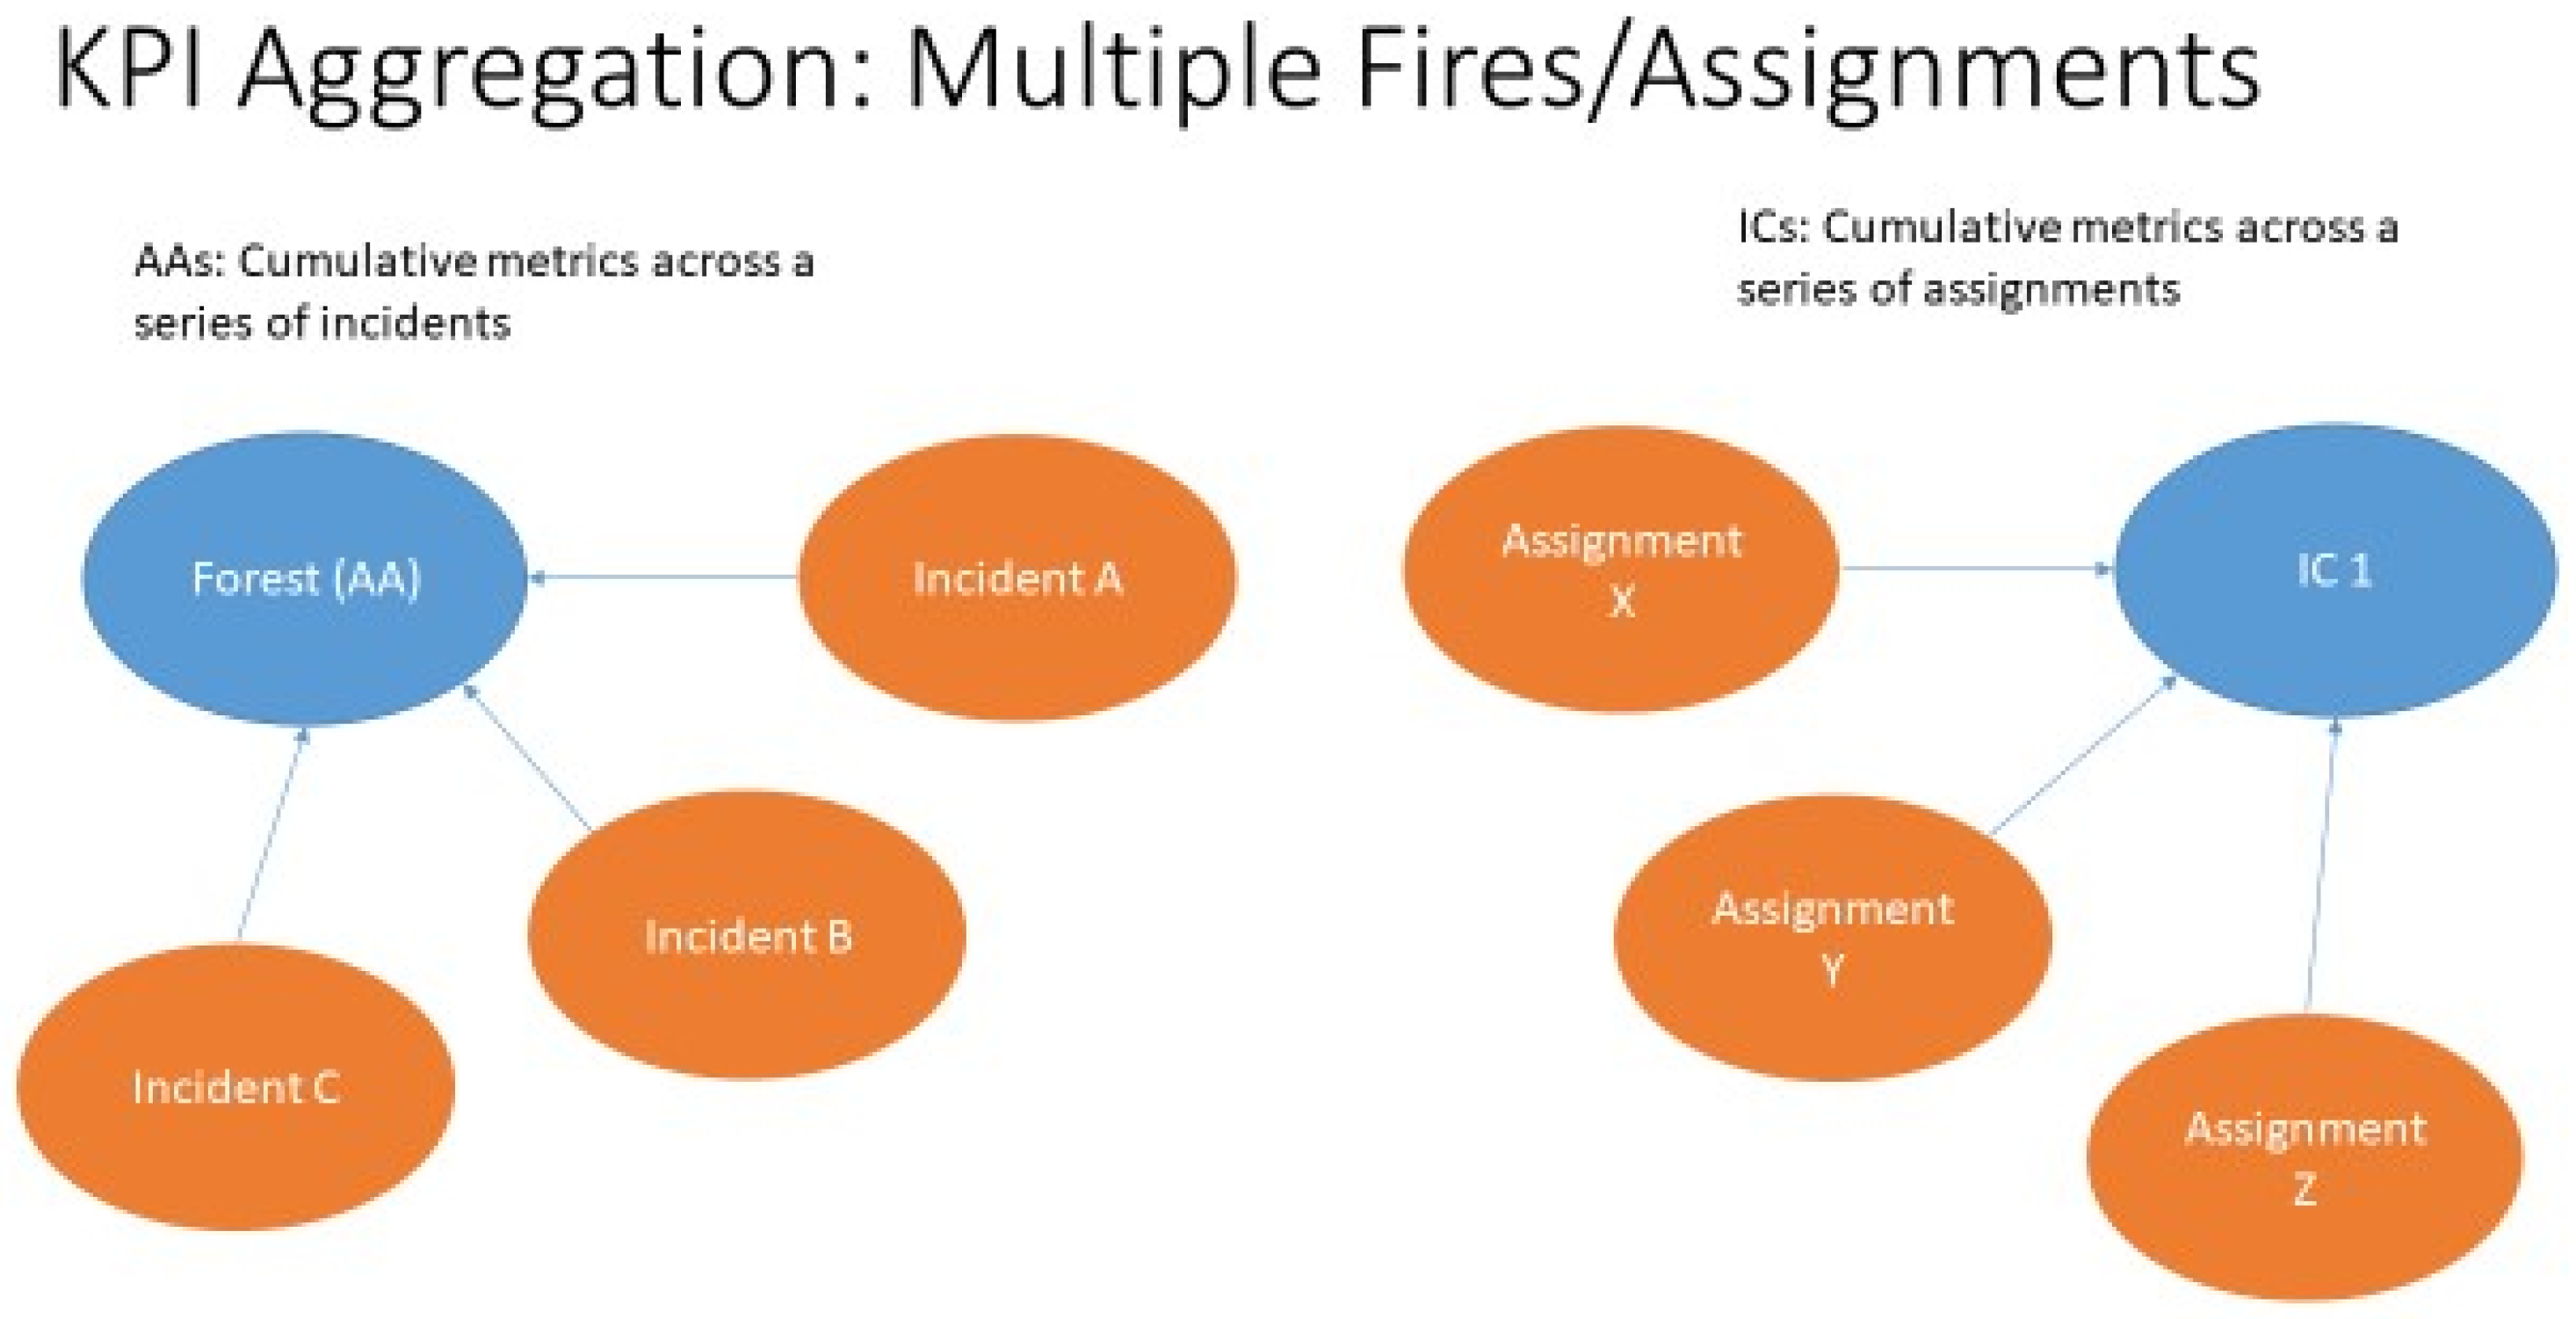
Next, we illustrate KPI aggregation across multiple fires and fire assignments (Figure 2). The orange bubbles now correspond to suppression operations metrics that have already been aggregated to the incident-level or assignment-level scale. The performance of AAs and ICs is assessed considering the range of observations across these incidents/assignments, which dampens the potential for a particularly challenging incident or AA–IC interaction to unduly influence evaluation. To reiterate, we are most interested in understanding and evaluating patterns of behavior over time. Consistently high rates of exposure associated with a particular AA or IC may suggest that their tolerance for responder risk is higher than the agency is willing to accept, and that interventions may be warranted.
2.2. Available Research Products to Prototype KPIs
In this section we review recently published empirical research that lays the foundations for possible KPIs [28,29,30,31]. These metrics are currently being summarized for historical fire seasons, and some are being operationalized for near-real-time monitoring for the coming 2018 fire season. Table 2 introduces a set of four primary KPIs, broken down into two categories (suppression resource use, suppression effectiveness). The primary sources for data on actual suppression operations are: (1) the Resource Ordering and Status System (ROSS), which maintains records of suppression resource requests and assignments to large fires; (2) Incident Status Summary (ICS-209) forms, which maintain records of daily fire and suppression resource characteristics; (3) the National Interagency Fire Center (NIFC) File Transfer Protocol (FTP) Incident-Specific Data page; (4) Automated Telemetry Unit (ATU) data from large air tankers; (5) Operational Loads Monitoring System (OLMS) data from large air tankers.
These KPIs are calculated using real incident data and transparent, replicable methods. We present example calculations for each KPI that can ultimately be aggregated to evaluate patterns of AA and IC behavior over time (Figure 1 and Figure 2). The notable exception is KPI #2 (Daily Resource Capacity), which is already summarized at the level of an IMT over multiple fire assignments and fire seasons. For demonstration purposes we anonymize all data with respect to individual fires and individual fire managers.
The KPIs under suppression resource use are relative indices of total suppression resource use, estimated on a common scale. They do not evaluate fire operations in terms of the missions to which different suppression resources were assigned, nor do they evaluate the degree to which these missions were successful. The KPIs under suppression effectiveness by contrast do focus on actual operations, specifically fire line construction and air tanker drops. In the case of the former, we observe the location of constructed fire line in relation to the final fire perimeter, and can directly calculate how much line was effective in engaging and holding the fire. In the case of the latter, we do not have direct observations of drop effectiveness, and instead use environmental conditions at the time and location of the drop as a proxy for probability of success. Findings from the ongoing Aerial Firefighting Use and Effectiveness study could in the future be leveraged to augment this KPI [32], although reliance on on-site personnel to directly observe drops may preclude exhaustive data collection and evaluation.
Specifics of data collection and analysis are provided in the accompanying sources. Data for KPIs 1, 3 and 4 are summarized at the level of an individual incident. Table 3 presents summary information on fires from the 2017 fire season that we analyze for purposes of demonstrating KPI calculations. In relative terms, all of these fires were large, long-duration, and high cost events (more information available from authors upon request). Note that we do not calculate every KPI for each fire, due to data availability issues and other factors; data needs are discussed in a future section. These fire-level data can then be aggregated across multiple incidents and fire assignments to AAs and ICs. To reiterate, the daily resource capacity KPI (KPI #2) is similarly based on data from individual fires, but is already aggregated in effect to the IC level by aggregating findings across all team assignments (see below).
Initially, the purpose of KPIs will be to develop objective, systematic and transparent metrics for the performance of the decision makers in the fire system. This initial work will help the agency determine what reasonable objectives and exposure levels are. Once a baseline is established, targets and standards for success may be considered. These standards for success will depend on value judgments made by agency leadership about the acceptable level of responder exposure and success probability associated with suppression actions, and may take time to acculturate within the agency. We therefore avoid suggesting targets and standards for success, and instead begin by summarizing the rationale, measurement methods, and possible interpretations for each KPI.
2.2.1. KPI #1: Suppression Resource Use: Relative Production Index (RPI) and Productive Efficiency (PE)
Rationale: All else being equal, responder exposure increases with the amount of suppression resources that are deployed to an incident. Similarly, all else being equal, the more time that responders are exposed to the inherent danger of the fire environment, the higher the likelihood of injury or fatality. The primary KPI, RPI, provides a coarse-scale measure of resource use that can be summarized and compared across individual incidents. The second KPI, PE, is supplemental, and describes established production benchmarks relative to observed rates of fire line construction. All else being equal, lower productive efficiency could suggest that line construction operations are conducted in more difficult terrain. In general, higher RPI and PE values would suggest lower fire responder exposure, and are best interpreted together.
Measurement: The three primary inputs to RPI and PE calculations are the total productive capacity (TPC) of most assigned ground-based suppression resources (e.g., crews, engines), the total fire perimeter (TFP), and the total amount of fire line completed (T). TPC is calculated on the basis of the productive fire line construction capacity of ground-based suppression resources assigned for the duration of the fire event. This calculation requires differentiating across different resource types according to their respective line construction rates [33,34]. Calculation of RPI is based on equations originally developed by [28], and is quantified as the ratio of TPC and TFP, as shown in Equation (1). PE instead compares TPC to T, as shown in Equation (2).
Interpretation: RPI is effectively an indirect measure of three components: (1) the relative effectiveness of built fire line in containing the fire; (2) the relative productivity of suppression resources in constructing fire line (i.e., PE); and (3) the relative breakdown of fire line construction in relation to other tasks (e.g., scouting, mop-up, point protection). The first component is also addressed by KPI #3, but RPI is important to include in its own right, as the data necessary to calculate KPI #3 are not widely available. The second component is directly addressed by PE, and in cases where data on T are available, can facilitate evaluation of RPI. The third component is rarely summarized at the incident scale, and can typically only be understood through interpretation of daily incident action plans, a task that can be time-consuming and subject to error. Thus, RPI might in some sense be interpreted as a stopgap performance measure that will fade in importance as data to populate other KPIs become more widely available.
In the simplest case (RPI = 1), all ground-based suppression resources are assigned to construct fire line, operate at average productive capacity, and the total amount of constructed fire line perfectly aligns with the final fire perimeter. In practice, RPI ratios are more likely to be greater or less than one (typically greater than one), and Table 4 presents possible interpretations for these conditions. As an example, in cases where large amounts of contingency line never engaged the fire, or where large amounts of line burned over, the RPI would be high. As the relative fire line productivity of resources decreases, and as the number of assignments that are not fire line construction increases, RPI also increases.
Example:
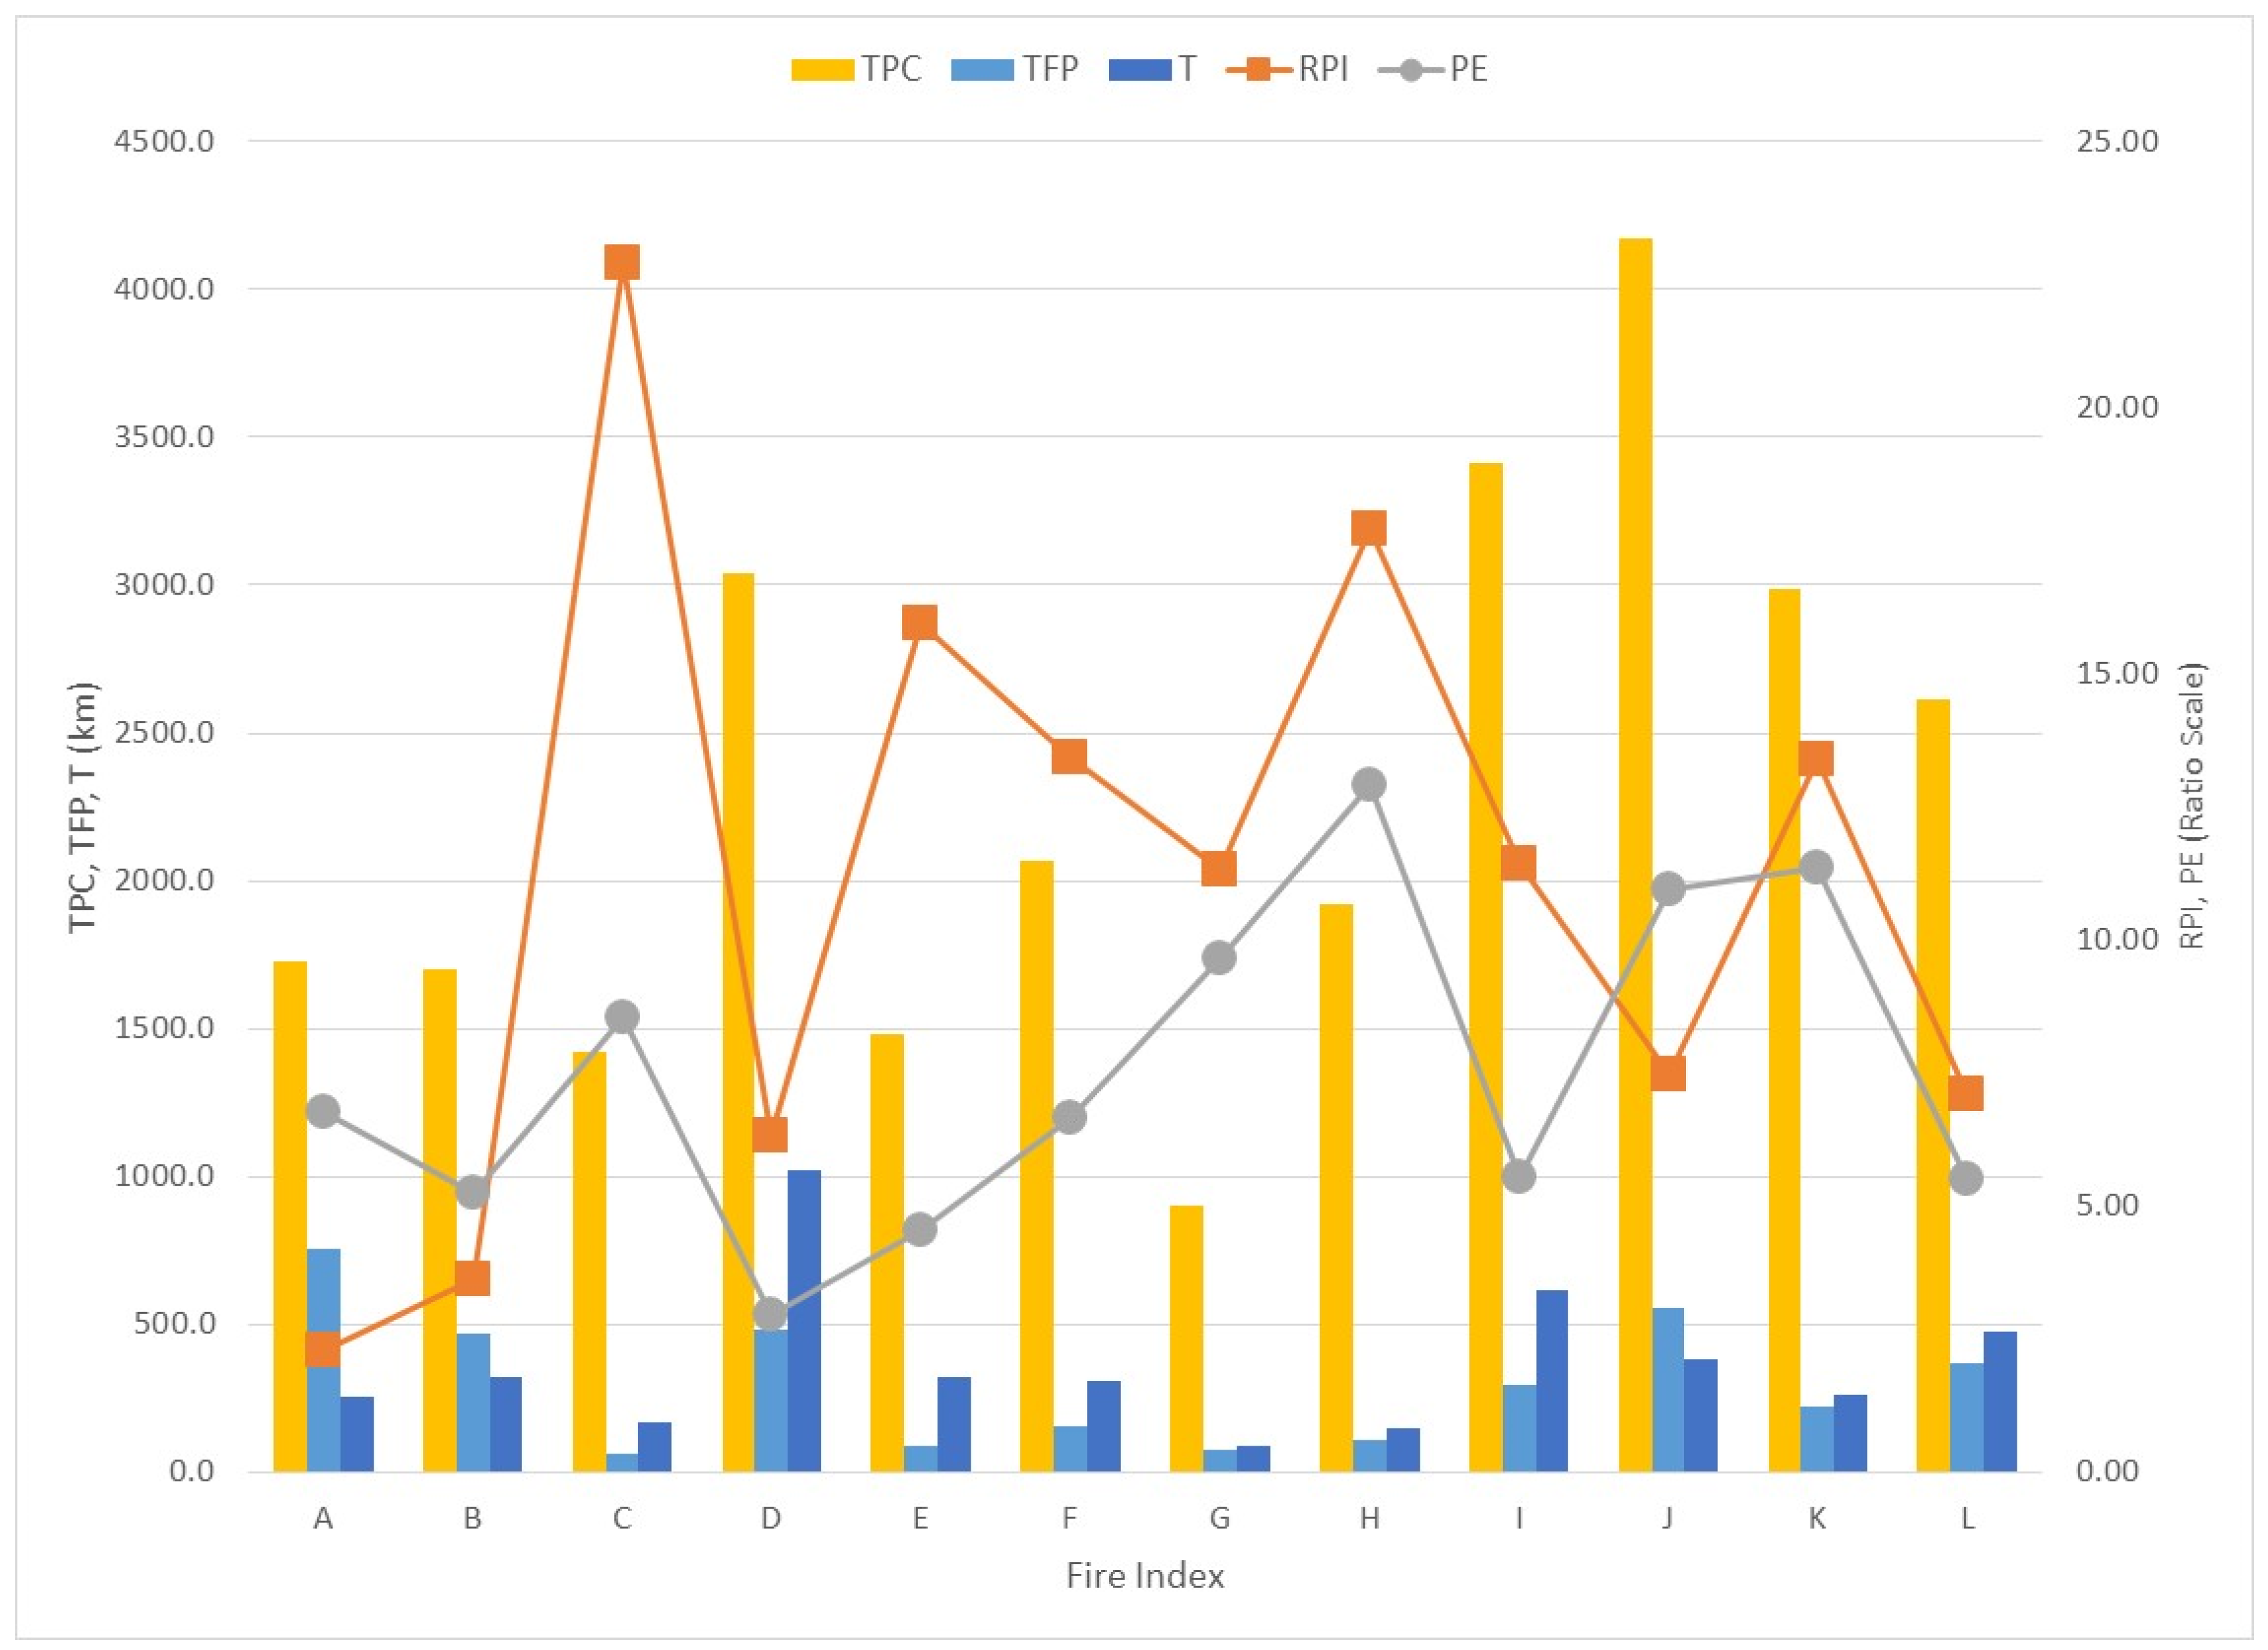
Table 5 presents TPC, T, TFP, and calculated RPI and PE values, and Figure 3 charts these same values. One immediate finding is that all fires have RPI values above 1.0, ranging from 2.3 to 22.7, with an average of 11.1. This suggests that resources on these fires were likely used for tasks other than line construction, but also that at least in some cases line construction efforts were inefficient or ineffective (see Section 2.2.3). In the most extreme case, the amount of suppression resources on site could have theoretically constructed line around the final perimeter more than twenty times (Fire C). Another noteworthy finding is that fires with smaller perimeters tend to have much higher relative production index values (correlation coefficient = −0.87). In addition to the possible interpretations outlined in Table 4, this also suggests the possibility that there may be differences in resource ordering across fires of different sizes, which is left for future research.
The magnitudes of PE were generally smaller than RPI, with values ranging from 3.0 to 12.9, and an average of 7.6. This supports the suggestion above that in some cases line construction efforts were inefficient, in the most extreme case suggesting that thirteen times more line could in theory could have been built (Fire H). The correlation coefficient between RPI and PE was slightly positive (0.39), and between RPI and TFP was slightly negative (−0.27).
2.2.2. KPI #2: Suppression Resource Use: Daily Resource Capacity (DRC)
Rationale: Fire managers have significant amounts of discretion to conduct suppression operations with limited oversight. A wide body of research has suggested that sociopolitical pressures, misaligned incentives, and cognitive biases could induce tendencies towards excessive ordering and use of suppression resources [35,36,37,38,39,40,41]. Understanding variation in decision-making across managers may help explain variation in suppression resource use and responder exposure. Identification of IMTs (and corresponding ICs) that consistently use higher amounts of suppression resources could target intervention to reduce unnecessary exposure.
Measurement: Daily Resource Capacity (DRC) is a parameter that corresponds to the fixed effects of a given IMT on suppression resource ordering. DRC is estimated using a regression model that accounts for a range of fire characteristics such as fire size, duration, spread potential and values-at-risk proximate to an individual fire. The dependent variable of the model is the total fire line production capacity for a single day, measured in meters. DRC tells us the amount of that total capacity that is accounted for by the associated IMT assigned to the fire on that day. As with the RPI, different suppression resources are normalized according to their respective fire line production capacity, although in this case helicopters were included as well. More details on data sources and statistical analysis techniques are available in [29].
Interpretation: One testable hypothesis within the statistical analysis framework of [29] posited that: “after controlling for other factors, unobserved differences between IMTs do not account for significant differences in resource orders between teams.” These unobserved differences between IMTs could relate to differences in risk perceptions, susceptibility to cognitive biases, or other factors. If this hypothesis is rejected, it suggests that there are consistent, statistically significant differences across IMTs, i.e., some teams may have a higher (or lower) tolerance for exposure than others. Assuming those IMTs with significantly lower DRC have equally acceptable final fire outcomes (and we must assume this in the absence of other systemic performance measures for IMTs), then there are likely lessons to be learned from these IMTs regarding how they balance exposure with protection and resource objectives.
Example: Initial results (for type 1 and 2 IMT assignments over 200720132011) illustrated significant variation in daily resource use across IMTs. The difference between the highest- and the lowest-ranked team was substantial, over 2000 km of line-producing capacity per day, which can amount to potentially hundreds of personnel. Table 6 presents results originally presented in [29], reorganized by binning IMTs into quintiles on the basis of DRC. To reiterate, these DRC values reflect the contribution to total daily fire line production capacity that is associated with the specific IMT, after controlling for a variety of observable fire and management characteristics. Low-use IMTs have negative values, with the 17 low-use teams on average using 3950 m less of fire line production capacity relative to the 17 high-use IMTs. To compare these quintiles, we calculate the average for each bin, then sum the absolute deviations from the bin average, and finally compare bin-level sums to the overall sum of deviations from average. If the fixed effects of each IMT were of little consequence, we would expect each bin to account for around 20% of total deviations from average. Results reveal, however, that this is not the case. The highest DRC bin (i.e., the highest resource use IMTs) alone accounts for over 58% of summed absolute deviations. The lowest and highest bins account for nearly 78% of summed absolute deviations. In other words, we have reason to believe that there are IMTs who tend to use significantly more or less suppression resources than the median IMT.
2.2.3. KPI #3: Suppression Effectiveness: Fire Line Effectiveness (FLE)
Rationale: Choices of where, when, and what type of line to build influence responder exposure and probability of success. Ineffective control line that burns over is sometimes the result of unpredicted changes in fire weather, but sometimes the result of less-than-optimal choices with a corresponding low probability of success. Similarly, control line that never interacts with the fire could be wise but untested contingent actions, or worse inefficient use and exposure of resources.
Measurement: There are four primary variables used here: the total length of the fire perimeter (TFP; see KPI #1); the total amount of fire line completed (T) (as defined earlier); the total amount of fire line that engaged the fire (E); and the total amount of fire line that held when engaged by the fire (H). Fire line segments are considered as engaged if located along or within the final fire perimeter, and as held if located along the final fire perimeter. By definition, H values cannot exceed E values. From these variables three primary ratio metrics are derived: total to perimeter (Tr); engaged to total (Er); and held to engaged (HEr), as shown in the equations below.
Note that amount of line engaged or held is not documented on the incident, and requires post-fire analysis using GIS software. Note also that the amount of line constructed does not include retardant drops or any aviation suppression activities. Natural barriers can be a line type recorded by the GIS Specialist on the fire and is commonly used, but for the purposes of this analysis we focused on constructed line only and not natural barriers.
Interpretation: Table 7 provides possible interpretations for various values of Tr, Er and HEr. Note that the interpretations for RPI and Tr are very similar, with the difference being that Tr is a direct measure of, rather than a proxy for, fire line construction. Note also that the Er and HEr ratios cannot exceed a value of 1 because of the relationships across the variables (i.e., there cannot be more line that engaged than there was line that was built, and there cannot be more line that held than there was line that engaged). Another possible interpretation not listed in Table 7 deals with data quality issues. It could be the case that the data on fire line is redundant, for instance a case where more than one individual submits GIS data for the same line segment, or where data shows up as both “completed hand line” and “road as completed line.” This can manifest most obviously in the data when the amount of held line is greater than the fire perimeter (Fires D, E and I), but remains unknown in situations where the amount of held line is less than the fire perimeter. To retain consistency we opted not to do any post hoc changes to the data.
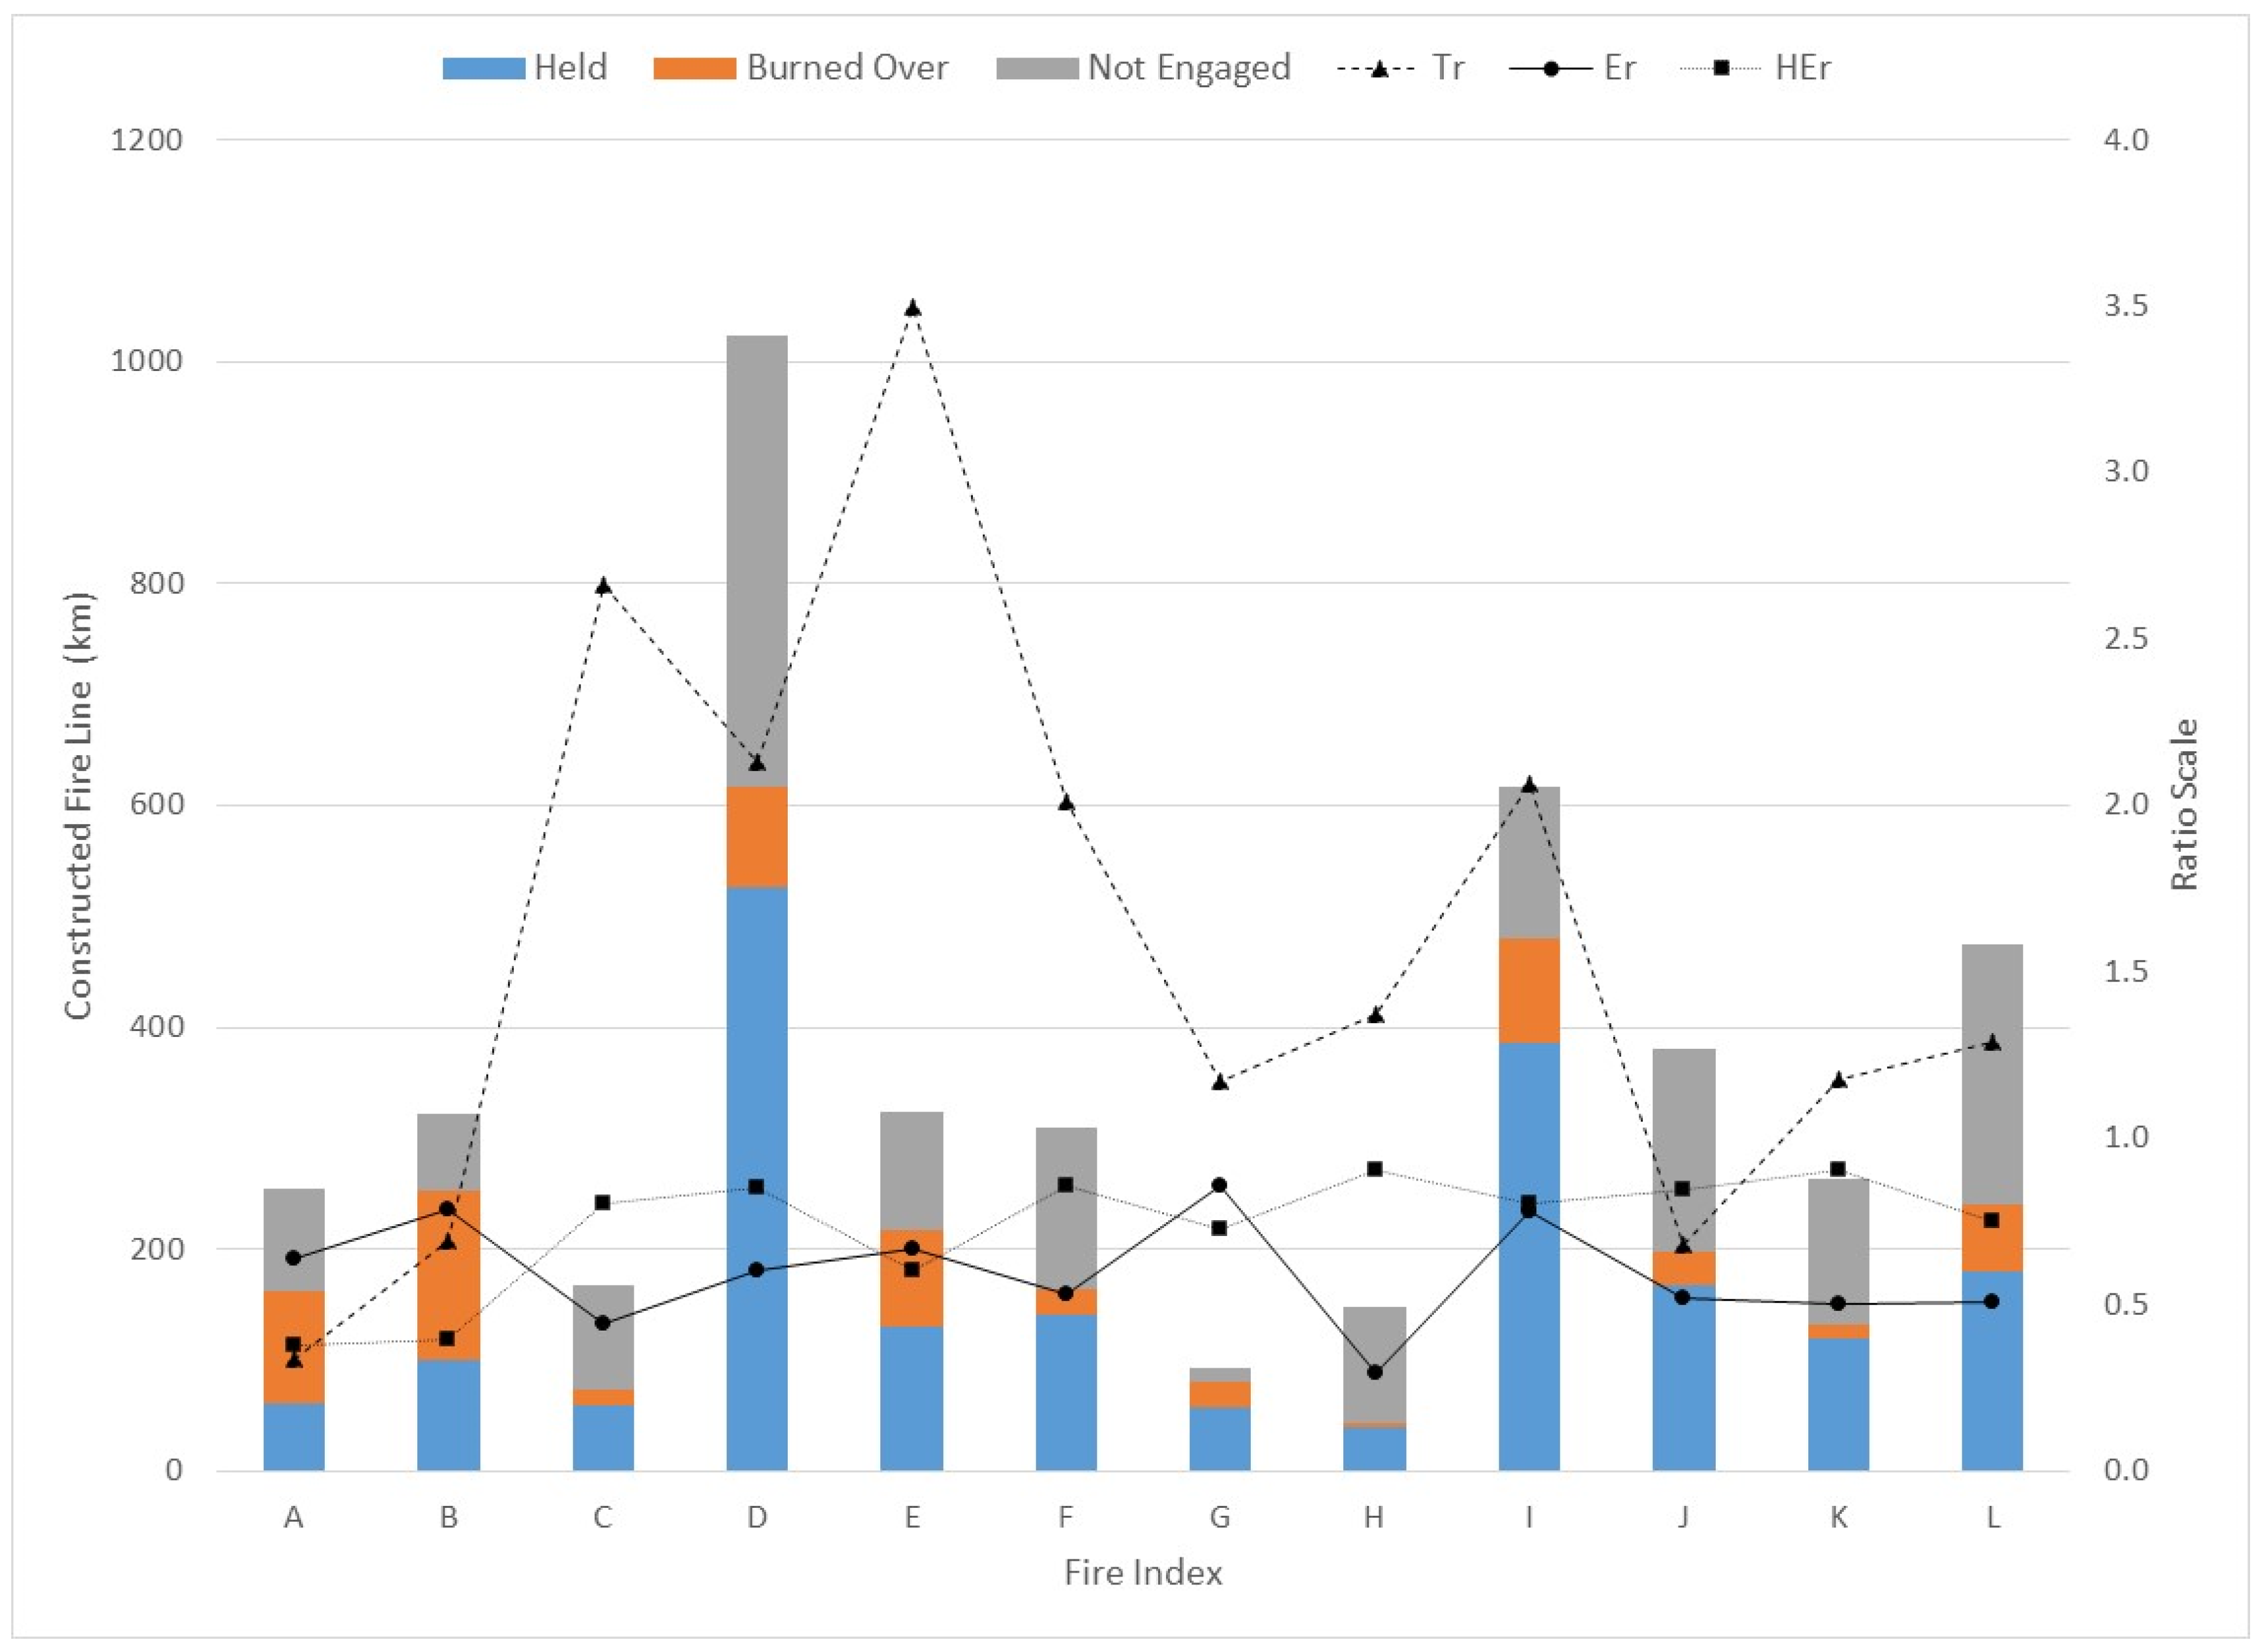
Example: Figure 4 summarizes data and results for the FLE framework across fires A through L. The stacked bar charts break down total amount of fire line (T) into its constituent parts: not engaged (T–E), engaged and held (H), and engaged but burned over (E–H). The total amount of line constructed varied significantly across fires, ranging from a minimum of 93 km (G) to a maximum of 1024 km (D). Interestingly, these fires did not correspond to the fires with the minimum (C) or the maximum (A) perimeter lengths. For ten of the twelve fires, the amount of line that held was larger than the amount of line that burned over. However, there were only five fires where the amount of line that held was greater than the amount that did not engage, suggesting large amounts of indirect or contingency line. Across all fires, 42.27% of line held on average, ranging from 24.15% to 52.45% of total line constructed.
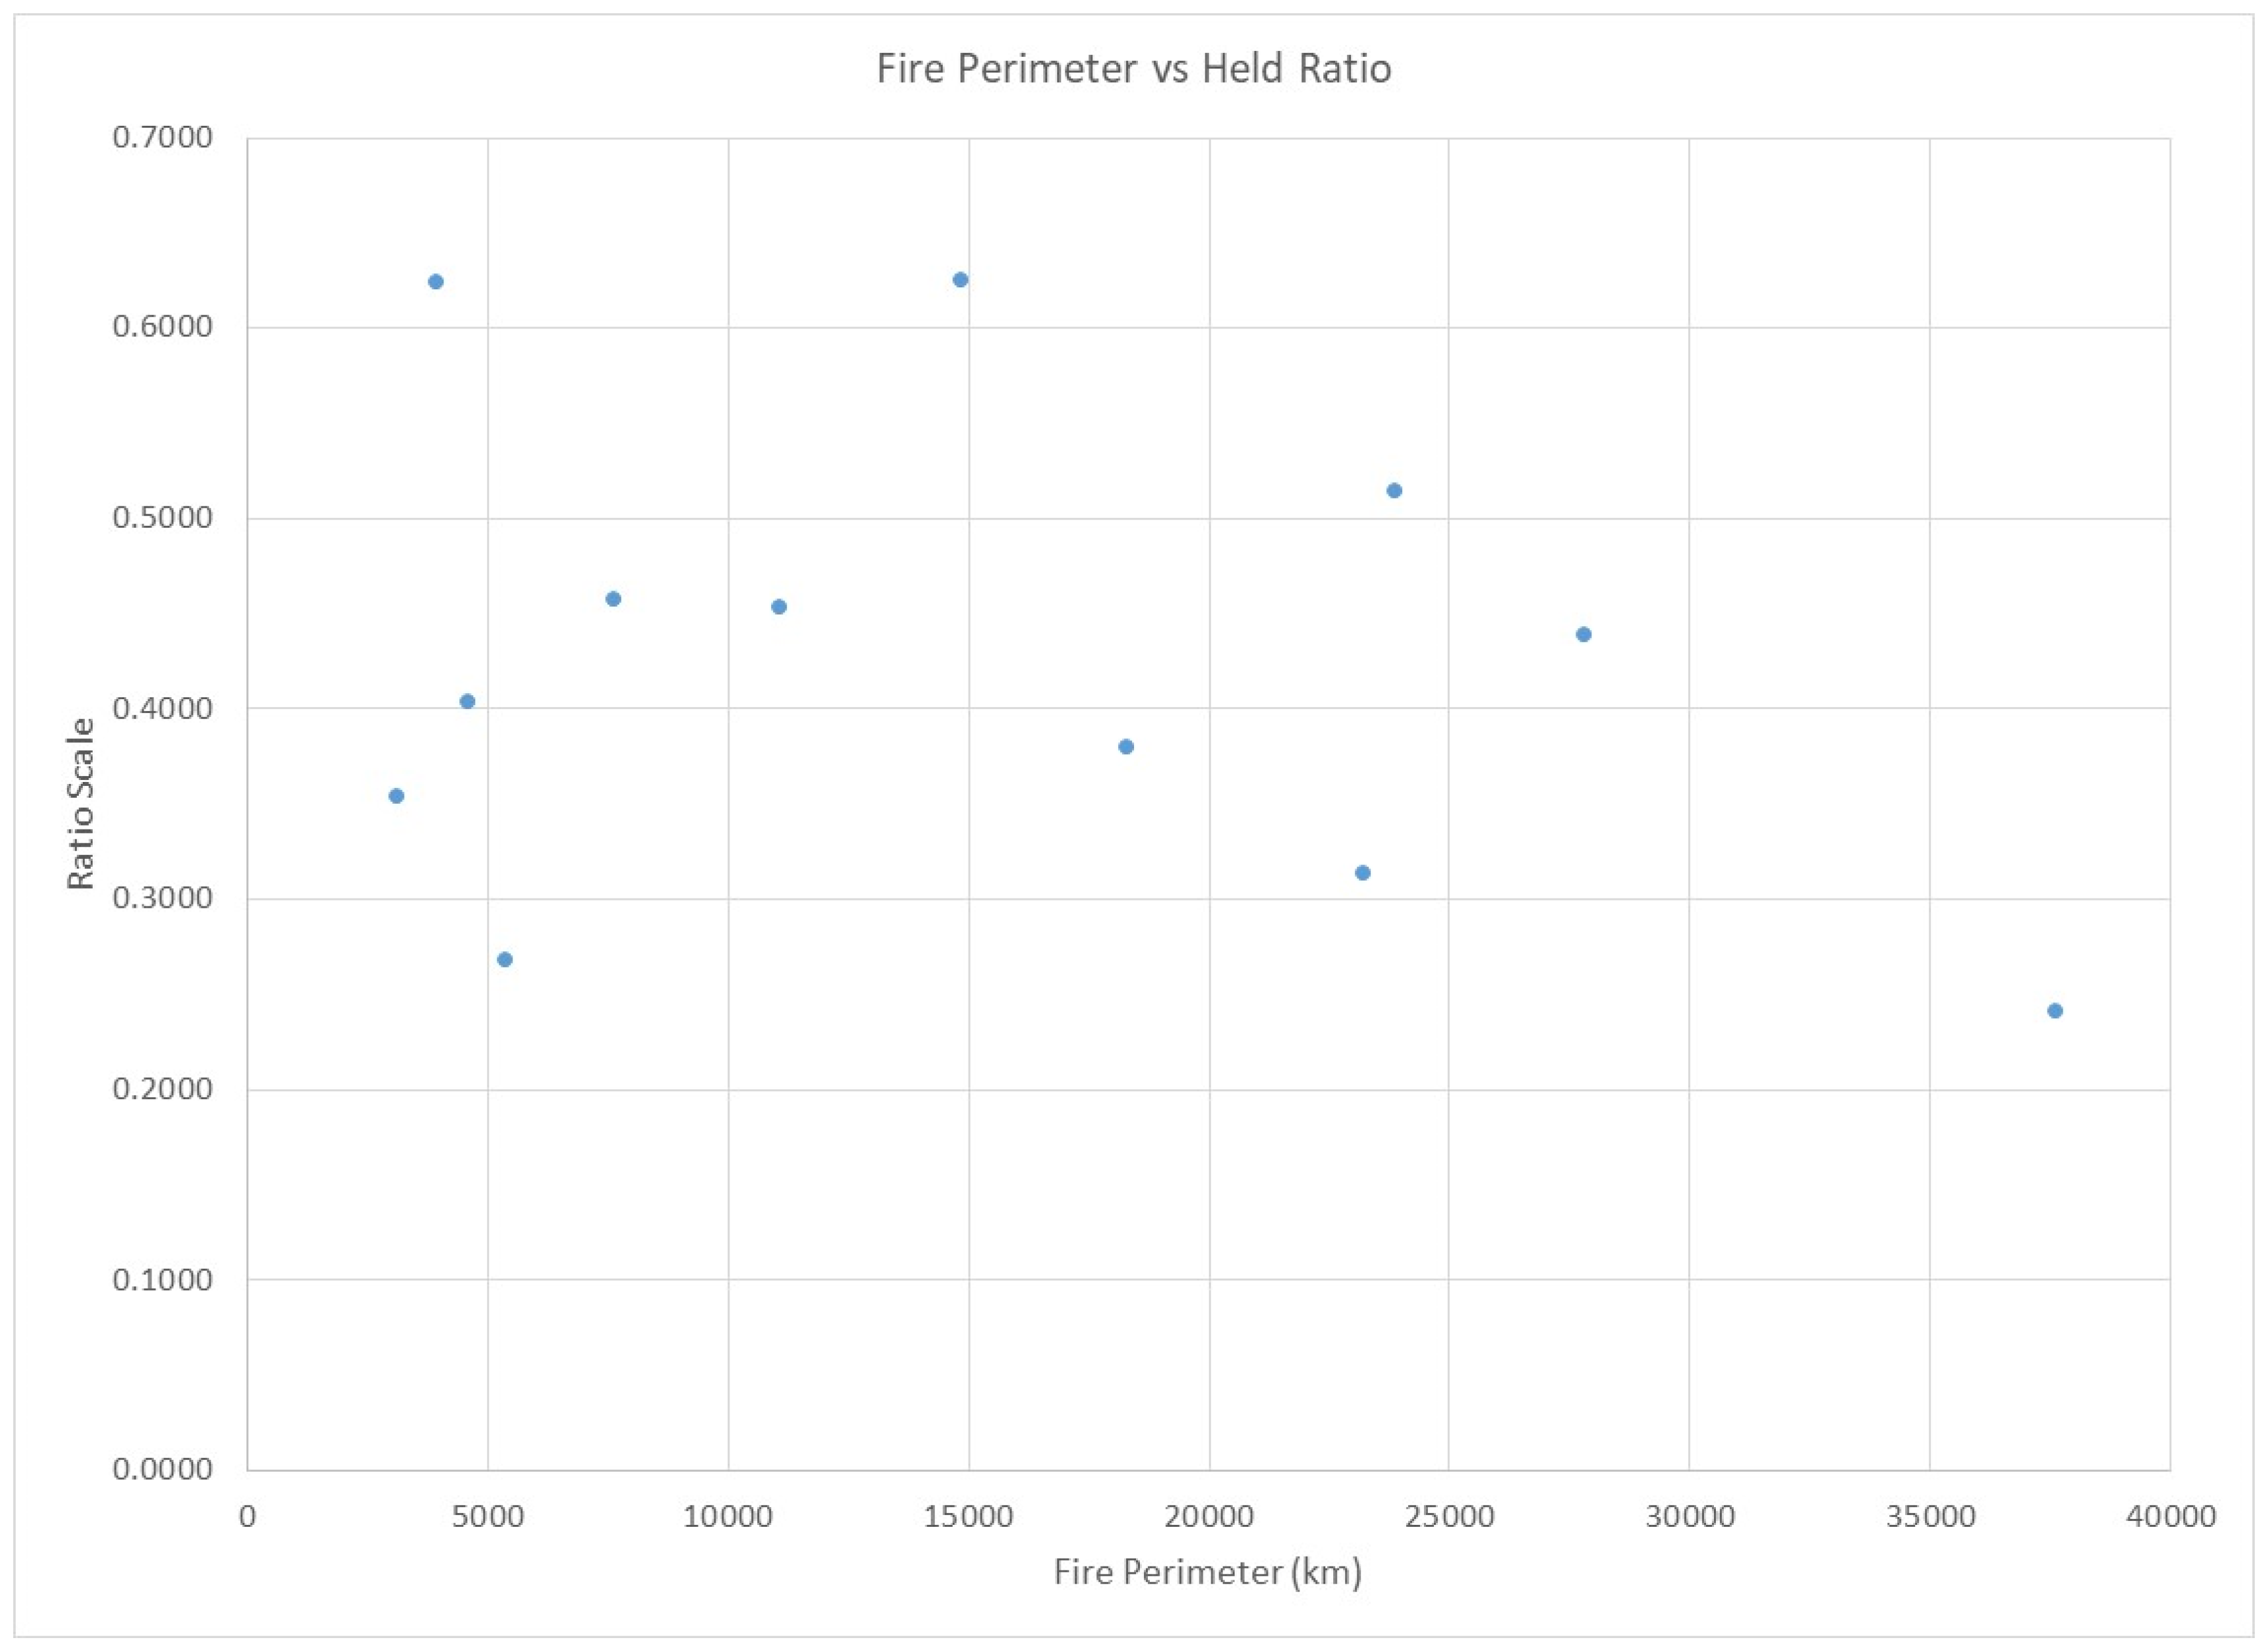
Figure 4 also displays the FLE ratios (Table 7), which similarly display significant variability across fires. Tr values range from 0.34 to 3.50. Excluding fires where the reported amount of line held exceeded the length of the fire perimeter, the highest Tr values were 2.66 (Fire C) and 2.01 (Fire F). Three fires (A, B and J) had Tr values less than one, suggesting that response strategies were not full perimeter control. Er values averaged 0.59, and ranged from 0.30 to 0.86. HEr values average 0.74, and ranged from 0.38 to 0.91. By these metrics, Fire G for example stands out as having high ratios of engaged and held line. However, that fire is one of the smallest, which may present fewer operational challenges associated with fire line. Figure 5 displays the length of the final fire perimeter against Hr values, quantified as Er × HEr, or more simply H/T. A slightly negative trend is evident, where the larger the fire perimeter, the lower the fraction of constructed line holds the fire (correlation coefficient = −0.28). This suggests an avenue for future research, examining issues of scaling and perhaps differentiating interpretation of FLE ratios accordingly.
2.2.4. KPI #4: Suppression Effectiveness: Air Tanker Drop Conditions (ATDC)
Rationale: Use of large air tankers (LATs) is one of the riskiest, highest cost, and highest profile suppression activities. Studies indicate that LATs are often used outside of conditions where they are generally thought to be most effective [31,42,43]. Targeting LAT use only for those missions where probability of success is commensurate with values protected could limit unnecessary aviation exposure.
Measurement: Operational Loads Monitoring System (OLMS) and Automated Telemetry Units (ATUs) can provide the relevant timing and location data for individual drops from Forest Service contract large air tankers. Geo-referencing drop locations with other information allows for linking individual drops to individual incidents. These drop data can then be coupled with landscape data from LANDFIRE [44] to determine slope steepness and majority fuel type. Depiction of drop occurrence along with characterization of the fire environment allows us to highlight where LAT use falls outside of best practices guidelines. The implications are that this use would have limited effectiveness, particularly when compared to use during periods of more quiescent fire weather or on more suitable terrain.
Interpretation: The ATDC KPI is not an observation of drop effectiveness, but rather a proxy for probability of success. As a general rule, drops are more likely to be effective outside of timber fuel types, outside of steep slopes, and outside of peak burning periods. We therefore summarize drops into a matrix that indicates the amount of drops that occurred in each (fuel type) × (slope steepness) × (burning period) category. At present, these data are aggregated to the level of an individual incident, but could also be summarized to the individual aircraft across incidents, or even to the responsible AA or IC across incidents and assignments. Further, it could be possible to expand the scope of accountability for this KPI by summarizing according to Air Attack Group Supervisors or Operations Section Chiefs, who in practice may have a more direct span of control over aircraft usage relative to AAs and ICs.
Example: Figure 6 displays the summary matrix for an individual fire (Fire E). The color ramp allows for simple identification of areas in the matrix where a higher amount of drops occurred. In this specific case, most of the drops occurred in steep slopes (>25%) and in the timber fuel type, conditions which are generally unfavorable for success and which may preclude the presence of nearby ground resources. Table 8 further summarizes drop conditions for Fire E along with four additional fires for which we were able to access individual drop data. The results presented in Table 8 consider various combinations of environmental conditions that may lead to low probability of success: slope steepness >25%; fuel type = timber; active burning period = 1200–1800. Variation is evident across the fires, with fire A and G having perhaps the highest probability of success, and Fire E the lowest. Across all 353 drops summarized in the table, 217 (61%) occurred on steep slopes, 207 (59%) occurred on timber fuel type, and 212 (60%) occurred during the active burning period (as defined here). Approximately 35% of all drops occurred under conditions with two low success factors (e.g., steep slopes and timber fuel), and 20% of all drops occurred under conditions with all three low probability of success factors.
3. Operationalizing and Enhancing KPIs
3.1. Key Data and Analytical Needs
As we stated earlier, the four KPIs we present are in various states of readiness for large-scale operationalization within the Forest Service. One key step remaining to be accomplished is linking back incident- and assignment-level data to AAs and ICs (with the exception of the DRC KPI). Additional investments of various magnitudes are needed for each KPI, in terms of improving data quality assurance/quality control, enhancing information and reporting systems to warehouse these data, developing capacity to automate calculation of KPIs, and even changing existing business practices so that meaningful data collection and analysis are possible. For example, two roadblocks to more comprehensive analysis of the ATDC KPI are that, first, not all air tankers with the Forest Service deliver reliable ATU data even though in some cases they are required contractually to do so, and second, not all Forest Service Regions follow protocol for ordering and use of air tankers. For example, aviation resources may be shared between incidents without unique incident orders, and aviation usage may be charged to miscellaneous job codes that are not incident-specific. This means that obtaining a census of all air tanker drops that link back to unique incidents is essentially infeasible, and further that the data that can be obtained for analysis may not be statistically representative across incidents of various scales, complexities and management strategies.
After ATDC, the FLE KPI might benefit the most from more streamlined and standardized data collection efforts. The use of ArcGIS Collector (https://doc.arcgis.com/en/collector/) in particular could help provide a consistent platform for inputting geospatial data on fire line construction and effectiveness. Timely (i.e., daily) collection of fire line data could improve our ability to understand the spatiotemporal dynamics of fire spread and control efforts, and perhaps enable refined perspectives that allow for credit where fire line slowed rather than completely stopped fire spread. Assigning clear ownership of these data may reduce instances where redundant or incorrect GIS data is input by multiple individuals.
In fact, expanding collection of daily fire management data could lead to a significant expansion of opportunities to develop more robust KPIs for suppression effectiveness. Listed below are key data along with personnel needs to better evaluate suppression effectiveness. Remaining questions include determining who (or which programs) within the organization have responsibility for performing data analysis at the end of the season, determining the frequency of performance reviews, and determining targets and standards for success.
- Daily suppression actions by activity per division. This would include explanation of what actions were taken during the operational period, i.e., amount of line constructed, number of structures protected, amount of area prepped for burnout, and the number and type of resources used for each action (Table 9).
- Daily fire perimeter from infrared or reconnaissance flights.
- Gridded Weather Observations. Gridded weather at a resolution of 2.5 km or smaller will enhance our ability to understand how weather influenced fire behavior and suppression outcomes. This would be a notable improvement over Remote Automated Weather Station data, which the fire management community has relied on for years to depict weather conditions across a fire area.
- Division Supervisors, Operations Section Chiefs and Field Observers will need to be utilized to document daily suppression activities, including what resource was associated with each action. GIS Specialists will be utilized to create a geospatial database of daily activities and accomplishments. Situation Unit Leaders will need to review the daily activity data and will certify data completion and data accuracy.
3.2. Envisioning Next-Generation KPIs
In this section we briefly outline opportunities for additional, perhaps more informative, KPIs. These ideas are in part aspirational, in part capitalization of emerging research, and in part simple extensions of existing KPIs. The first recommendation is to stratify DRC values by local AAs, in order to more fully reflect the intention of Figure 2 to analyze patterns of behavior across both AAs and ICs. This would allow for a stronger linkage to local socioeconomic and ecological context, and would also allow for more meaningful interpretation of suppression resource use in light of pre-fire assessment and planning intended to facilitate response decisions [45].
The second and third recommendations relate to the ATDC and FLE KPIs, with a specific intent of better characterizing probability of success. To do so, these next-generation KPIs would incorporate the following recently developed tools and data products: (1) an atlas of potential control locations generated using historical fire perimeters [46]; (2) a related layer quantifying suppression difficulty across the landscape based on factors including fire behavior, topography, and road density [47,48,49]; and (3) a gridded geospatial product depicting daily severe fire weather potential, which is calculated by combining modeled Energy Release Component and Burning Index values [50]. In the case of the FLE KPI, this would enable a transition from evaluation of outcomes (e.g., did the line hold or burn over) to evaluation of decisions around the location and timing of line construction (e.g., was the line built in an area of low or high control opportunity, and was it likely to engage the fire under moderate or extreme burning conditions). Evaluation of ATDC would similarly benefit, for instance the ability to determine the likelihood of ground resources being present on the basis of low/high suppression difficulty, and further the ability to directly estimate fire weather rather than using time of day as a proxy.
The fourth recommendation is to focus more directly on responder safety and exposure. Whereas we began from the notion of quantifying effectiveness in order to reduce instances of ineffective resource use (and thereby reduce unnecessary exposure), KPIs could be explicitly designed around factors such as safety zones and egress routes [51,52,53]. As an example, in-depth post-fire analysis could evaluate the frequency with which safety zones were pre-identified and determined suitable per new standards. Similarly, through pairing geolocation of crews with advanced landscape assessment tools, it could be possible to identify instances of actions in areas of high suppression difficulty or high snag hazard [47,54]. Ultimately, quantifying responder exposure in an operationally relevant sense is quite difficult given the dynamic nature of the fire environment and the range of hazards to which responders can be exposed. Collecting data on person-hours by exposure to various types of hazards would go a long way towards improved estimation of base rates for injuries and fatalities. Such quantitative data is necessary to move away from the more subjective and qualitative estimates that managers must rely on today.
The fifth, and perhaps most aspirational, KPI relates to decision quality. This KPI is premised on the joint ideas that the performance of an organization largely boils down to the quality of its high impact decisions, and that often times suboptimal decision processes leave uncaptured value on the table [24,25]. Following a structured process to guide uncertain and complex decisions can help avoid common cognitive errors, foster better communication, clarify tradeoffs, improve transparency, and facilitate more effective post hoc evaluation. Studies indicate that fire managers can be susceptible to common cognitive errors and may opt for response strategies that are inefficient or result in high levels of responder exposure, suggesting the value of following a more rigorous decision process [38,40]. At present, the decision support system used by the Forest Service requires documentation about the selected course of action, but not about the information, logic or rationale used to choose that specific course of action. As such, external reviewers would be unable to explore for example the degree to which the consequences of fire were specified, the degree to which the relative importance of multiple objectives were articulated, the degree to which multiple alternatives were identified and their tradeoffs balanced, or the degree to which stakeholders were identified, engaged and involved in decisions. Developing new templates and decision protocols along with expanded after action reviews would form the basis for further fleshing out this KPI.
4. Discussion
Responding to wildfire is a complicated task that requires managers to balance a number of concerns related to safety, costs, sociopolitical expectations, and fire effects in relation to desired ecological conditions. Decision-making can become especially challenging for larger, longer-duration events, where managers typically use a greater diversity and amount of suppression resources, and where fire can be more resistant to control. All wildfires eventually go out; in some cases this is due to highly effective suppression effort, but other mitigating factors, primarily weather and fuel conditions, can render suppression actions ineffective for changing wildfire outcomes. We want to know how, why and with what effect suppression resources are used in pursuit of fire management objectives. More importantly, we want to know whether fire management decisions and actions are consistent with Forest Service principles and would lead to a higher likelihood of attaining success. Despite our focus on the Forest Service, the basic elements of the KPIs that we introduce here could also have relevance for other fire management agencies seeking to enhance responder safety and suppression effectiveness.
Developing useful KPIs will require the Forest Service to build upon existing organizational knowledge. This will require asking some basic questions: What is currently being measured? What is being measured that is important to the definition of success? What is being measured that is trivial or irrelevant to the definition of success? What is not currently being measured that should be? Effective KPIs will focus on decisions and actions since these are the primary influences on wildfire outcomes that the agency can control. Good decisions will not always create the desired outcome, especially at the disaggregated or tactical levels. These measures should not be seen as a substitute for context-specific judgements made by managers. Instead, they can help the agency identify patterns of behavior that increase the likelihood of desired outcomes. Further, generation and acquisition of critical incident data could facilitate conversations between AAs and ICs as they monitor, deliberate and discuss possible courses of action, ideally resulting in better overarching response strategies.
This paper shows several examples of meaningful KPIs that can be generated with currently available data. However, a commitment to measuring the right things may require responders and agency administrators to change how they document their suppression actions and decision-making in order to generate meaningful measurements. Responders may also find that they need to develop new skills to most effectively use and interpret the information provided by KPIs. Developing and using KPIs will require support from agency leadership, and ideally that commitment to measuring things that matter will be rewarded with enhanced learning, accountability and effectiveness throughout the agency.
Moving forward, a performance measurement program could be expanded in a number of ways. First, the Forest Service could evaluate the third element of success—stakeholder support—through investments in post-fire event and management intervention social science research. Second, the agency could examine the usefulness of preparedness efforts, including the quality and relevance of pre-fire planning documents, and the degree and nature of engagement with communities and stakeholders [55]. A more comprehensive and inward-looking approach could evaluate organizational capacity to make risk-informed decisions, including an assessment of the sufficiency of available training and other workforce development programs [56].
It may be wise to acknowledge potential roadblocks and resistance upfront. We intentionally emphasize learning to forestall perceptions that KPIs will be used for “Monday morning quarterbacking”. KPIs provide a platform for outside-in performance evaluation, not for inside-out performance justification, which may raise concerns that the nuances of local context will be overlooked. Focusing on patterns of behavior over time, and not individual decisions or actions in isolation, is an effective way to dampen this concern. We recognize that probing to identify patterns of behavior that do not necessarily align with expectations will not always be comfortable but, we do stress its importance as part and parcel of learning and continual improvement. Having access to better information on suppression resource use, exposure and effectiveness will go a long way in helping us better understand, communicate and ideally improve wildfire response.
Author Contributions
Conceptualization, M.P.T., C.J.L., and D.E.C.; Data Curation, C.S.S., J.D.R., and M.S.H.; Formal Analysis, M.P.T., C.S.S., J.D.R., and M.S.H.; Writing—Original Draft Preparation, M.P.T., C.J.L., D.E.C., C.S.S., J.D.R., and M.S.H.; Writing—Review & Editing, M.P.T.; Project Administration, M.P.T. and D.E.C.
Funding
This research was partially funded by the 14-JV- 11221636-029 project between the United States Department of Agriculture Forest Service Rocky Mountain Research Station and Colorado State University.
Acknowledgments
The National Fire Decision Support Center supported this effort.
Conflicts of Interest
The authors declare no conflict of interest.
References
- U.S. Forest Service. Forest Service Manual (FSM) Directive Issuances, Series 5000—Protection and Development; 2017. Available online: https://www.fs.fed.us/im/directives/dughtml/fsm_5000.html (accessed on 10 April 2018).
- National Interagency Fire Center. Red Book 2017. Interagency Standards for Fire and Fire Aviation Operations; 2017. Available online: https://www.nifc.gov/policies/pol_ref_redbook.html (accessed on 10 April 2018).
- Fire Executive Council. Guidance for Implementation of Federal Wildland Fire Policy; 2009. Available online: https://www.nifc.gov/policies/policies_documents/GIFWFMP.pdf (accessed on 10 April 2018).
- Wildland Fire Leadership Council. National Action Plan: An Implementation Framework for the National Cohesive Wildland Fire Management Strategy; Washington, DC, USA, 2014. Available online: https://www.forestsandrangelands.gov/strategy/documents/strategy/CSPhaseIIINationalStrategyApr2014.pdf (accessed on 10 April 2018).
- Flores, D.; Haire, E. Life First: An Exploration of the 2016 Wildland Fire National Engagement Sessions: Executive Summary, 2017; Unpublished report.
- Rodríguez y Silva, F.; González-Cabán, A. Contribution of suppression difficulty and lessons learned in forecasting fire suppression operations productivity: A methodological approach. J. For. Econ. 2016, 25, 149–159. [Google Scholar] [CrossRef]
- Katuwal, H.; Dunn, C.J.; Calkin, D.E. Characterising resource use and potential inefficiencies during large-fire suppression in the western U.S. Int. J. Wildland Fire 2017, 26, 604–614. [Google Scholar] [CrossRef]
- U.S. Forest Service. Chief’s Letter of for Wildland Fire—2017; Forest Service: Washington, DC, USA, 2017. Available online: https://www.nifc.gov/PIO_bb/Agencies/USFS/ChiefLetterofIntent.pdf (accessed on 10 April 2018).
- Thompson, M.P.; MacGregor, D.G.; Calkin, D.E. Risk Management: Core Principles and Practices, and Their Relevance to Wildland Fire; Gen. Tech. Rep. RMRS-GTR-350; U.S. Department of Agriculture, Forest Service, Rocky Mountain Research Station: Fort Collins, CO, USA, 2016; p. 29.
- ISO. ISO 31000:2009(E), Risk Management—Principles and Guidelines; International Organization for Standardization: Geneva, Switzerland, 2009; Available online: https://www.iso.org/iso-31000-risk-management.html (accessed on 28 May 2018).
- Thompson, M.P.; MacGregor, D.G.; Dunn, C.J.; Calkin, D.E.; Phipps, J. Rethinking the Wildland Fire System. J. For. 2018. [Google Scholar] [CrossRef]
- Dunn, C.J.; Calkin, D.E.; Thompson, M.P. Towards enhanced risk management: Planning, decision making and monitoring of U.S. wildfire response. Int. J. Wildland Fire 2017, 26, 551–556. [Google Scholar] [CrossRef]
- Booz Allen Hamilton. 2014 Quadrennial Fire Review: Final Report; 2015. Available online: https://www.forestsandrangelands.gov/QFR/documents/2014QFRFinalReport.pdf (accessed on 10 April 2018).
- U.S. Department of Interior; U.S. Department of Agriculture. Federal Wildland Fire Management: Policy and Program Review; U.S. Department of Interior; U.S. Department of Agriculture: Washington, DC, USA, December 1995.
- U.S. Department of Interior; USDA Forest Service. Quadrennial Fire and Fuel Review; U.S. Department of Interior; USDA Forest Service: Washington, DC, USA, 2005.
- U.S. Department of Interior; USDA Forest Service. Quadrennial Fire and Fuel Review 2009 Final Report; U.S. Department of Interior; USDA Forest Service: Washington, DC, USA, 2009.
- Duff, T.J.; Tolhurst, K.G. Operational wildfire suppression modelling: A review evaluating development, state of the art and future directions. Int. J. Wildland Fire 2015, 24, 735–748. [Google Scholar] [CrossRef]
- Thompson, M.P.; Rodrìguez y Silva, F.R.; Calkin, D.E.; Hand, M.S. A review of challenges to determining and demonstrating efficiency of large fire management. Int. J. Wildland Fire 2017, 26, 562–573. [Google Scholar] [CrossRef]
- U.S. Forest Service. Budget and Performance; Forest Service: Washington, DC, USA, 2018. Available online: https://www.fs.fed.us/about-agency/budget-performance (accessed on 28 May 2018).
- U.S. Forest Service. Fiscal Year 2018 Budget Justification; Forest Service: Washington, DC, USA, 2017. Available online: https://www.fs.fed.us/sites/default/files/usfs-fy18-budget-justification.pdf (accessed on 10 April 2018).
- Pfeffer, J.; Sutton, R.I. Evidence-based management. Harv. Bus. Rev. 2006, 84, 62. [Google Scholar] [PubMed]
- Bauer, K. The Search for a Holy Grail: Best Practices for Defining KPIs. In Proceedings of the Data Warehousing & BI Conference, Orlando, FL, USA, 29 September 2005; Available online: www.tpgpractice.com/pdf/KBauer_DWandBI_Conf_KPI_Best_Practies_TPG.pdf (accessed on 10 April 2018).
- Parmenter, D. Key Performance Indicators: Developing, Implementing, and Using Winning KPIs; John Wiley & Sons: Hoboken, NJ, USA, 2015. [Google Scholar]
- Spetzler, C.; Winter, H.; Meyer, J. Decision Quality: Value Creation from Better Business Decisions; John Wiley & Sons: Hoboken, NJ, USA, 2016. [Google Scholar]
- Blenko, M.W.; Mankins, M.C.; Rogers, P. The decision-driven organization. Harv. Bus. Rev. 2010, 88, 54–62. [Google Scholar]
- Finney, M.; Grenfell, I.C.; McHugh, C.W. Modeling containment of large wildfires using generalized linear mixed-model analysis. For. Sci. 2009, 55, 249–255. [Google Scholar]
- Thompson, M.P. Modeling wildfire incident complexity dynamics. PLoS ONE 2013, 8, e63297. [Google Scholar] [CrossRef] [PubMed]
- Calkin, D.; Phipps, J.; Holmes, T.; Rieck, J.; Thompson, M. The exposure index: Developing firefighter safety performance measures. Fire Manag. Today 2011, 71, 24–27. [Google Scholar]
- Hand, M.; Katuwal, H.; Calkin, D.E.; Thompson, M.P. The influence of incident management teams on the deployment of wildfire suppression resources. Int. J. Wildland Fire 2017, 26, 615–629. [Google Scholar] [CrossRef]
- Thompson, M.P.; Freeborn, P.; Rieck, J.D.; Calkin, D.E.; Gilbertson-Day, J.W.; Cochrane, M.A.; Hand, M.S. Quantifying the influence of previously burned areas on suppression effectiveness and avoided exposure: A case study of the Las Conchas Fire. Int. J. Wildland Fire 2016, 25, 167–181. [Google Scholar] [CrossRef]
- Stonesifer, C.S.; Calkin, D.E.; Thompson, M.P.; Stockmann, K.D. Fighting fire in the heat of the day: An analysis of operational and environmental conditions of use for large airtankers in United States fire suppression. Int. J. Wildland Fire 2016, 25, 520–533. [Google Scholar] [CrossRef]
- U.S. Forest Service 2018. Aerial Firefighting Use and Effectiveness (AFUE). Available online: https://www.fs.fed.us/managing-land/fire/aviation/afue (accessed on 10 April 2018).
- Broyles, G. Fireline Production Rates; USDA Forest Service, National Technology & Development Program, Fire Management Report 1151-1805; U.S. Department of Agriculture: San Dimas, CA, USA, 2011.
- Holmes, T.P.; Calkin, D.E. Econometric analysis of fire suppression production functions for large wildland fires. Int. J. Wildland Fire 2013, 22, 246–255. [Google Scholar] [CrossRef]
- Maguire, L.A.; Albright, E.A. Can behavioral decision theory explain risk-averse fire management decisions? For. Ecol. Manag. 2005, 211, 47–58. [Google Scholar] [CrossRef] [Green Version]
- Calkin, D.E.; Venn, T.; Wibbenmeyer, M.; Thompson, M.P. Estimating U.S. federal wildland fire managers’ preferences toward competing strategic suppression objectives. Int. J. Wildland Fire 2013, 22, 212–222. [Google Scholar] [CrossRef]
- Donovan, G.H.; Prestemon, J.P.; Gebert, K. The effect of newspaper coverage and political pressure on wildfire suppression costs. Soc. Nat. Resour. 2011, 24, 785–798. [Google Scholar] [CrossRef]
- Hand, M.S.; Wibbenmeyer, M.J.; Calkin, D.E.; Thompson, M.P. Risk preferences, probability weighting, and strategy tradeoffs in wildfire management. Risk Anal. 2015, 35, 1876–1891. [Google Scholar] [CrossRef] [PubMed]
- Wibbenmeyer, M.J.; Hand, M.S.; Calkin, D.E.; Venn, T.J.; Thompson, M.P. Risk preferences in strategic wildfire decision making: A choice experiment with U.S. wildfire managers. Risk Anal. 2013, 33, 1021–1037. [Google Scholar] [CrossRef] [PubMed]
- Thompson, M.P. Social, institutional, and psychological factors affecting wildfire incident decision making. Soc. Nat. Resour. 2014, 27, 636–644. [Google Scholar] [CrossRef]
- Wilson, R.S.; Winter, P.L.; Maguire, L.A.; Ascher, T. Managing wildfire events: Risk-Based decision making among a group of federal fire managers. Risk Anal. 2011, 31, 805–818. [Google Scholar] [CrossRef] [PubMed]
- Thompson, M.P.; Calkin, D.E.; Herynk, J.; McHugh, C.W.; Short, K.C. Airtankers and wildfire management in the U.S. Forest Service: Examining data availability and exploring usage and cost trends. Int. J. Wildland Fire 2013, 22, 223–233. [Google Scholar] [CrossRef]
- Calkin, D.E.; Stonesifer, C.S.; Thompson, M.P.; McHugh, C.W. Large airtanker use and outcomes in suppressing wildland fires in the United States. Int. J. Wildland Fire 2014, 23, 259–271. [Google Scholar] [CrossRef]
- Ryan, K.C.; Opperman, T.S. LANDFIRE—A national vegetation/fuels data base for use in fuels treatment, restoration, and suppression planning. For. Ecol. Manag. 2013, 294, 208–216. [Google Scholar] [CrossRef]
- Thompson, M.P.; Bowden, P.; Brough, A.; Scott, J.H.; Gilbertson-Day, J.; Taylor, A.; Anderson, J.; Haas, J.R. Application of wildfire risk assessment results to wildfire response planning in the southern Sierra Nevada, California, USA. Forests 2016, 7, 64. [Google Scholar] [CrossRef]
- O’Connor, C.D.; Calkin, D.E.; Thompson, M.P. An empirical machine learning method for predicting potential fire control locations for pre-fire planning and operational fire management. Int. J. Wildland Fire 2017, 26, 587–597. [Google Scholar]
- Rodrìguez y Silva, F.; Martínez, J.R.M.; González-Cabán, A. A methodology for determining operational priorities for prevention and suppression of wildland fires. Int. J. Wildland Fire 2014, 23, 544–554. [Google Scholar] [CrossRef]
- O’Connor, C.D.; Thompson, M.P.; Rodríguez y Silva, F. Getting ahead of the wildfire problem: Quantifying and mapping management challenges and opportunities. Geosciences 2016, 6, 35. [Google Scholar] [CrossRef]
- Thompson, M.P.; Liu, Z.; Wei, Y.; Caggiano, M. Analyzing Wildfire Suppression Difficulty in Relation to Protection Demand. Environmental Risks; InTech Open: London, UK, 2018; ISBN 978-953-51-6188-2. [Google Scholar]
- Jolly, W.M.; Freeborn, P.H. Towards improving wildland firefighter situational awareness through daily fire behaviour risk assessments in the U.S. Northern Rockies and Northern Great Basin. Int. J. Wildland Fire 2017, 26, 574–586. [Google Scholar] [CrossRef]
- Campbell, M.J.; Dennison, P.E.; Butler, B.W. Safe separation distance score: A new metric for evaluating wildland firefighter safety zones using lidar. Int. J. Geogr. Inf. Sci. 2017, 31, 1448–1466. [Google Scholar] [CrossRef]
- Page, W.G.; Butler, B.W. An empirically based approach to defining wildland firefighter safety and survival zone separation distances. Int. J. Wildland Fire 2017, 26, 655–667. [Google Scholar] [CrossRef]
- Campbell, M.J.; Dennison, P.E.; Butler, B.W. A LiDAR-based analysis of the effects of slope, vegetation density, and ground surface roughness on travel rates for wildland firefighter escape route mapping. Int. J. Wildland Fire 2017, 26, 884–895. [Google Scholar] [CrossRef]
- Page, W.G.; Alexander, M.E.; Jenkins, M.J. Wildfire’s resistance to control in mountain pine beetle-attacked lodgepole pine forests. For. Chron. 2013, 89, 783–794. [Google Scholar] [CrossRef] [Green Version]
- Meyer, M.D.; Roberts, S.L.; Wills, R.; Brooks, M.; Winford, E.M. Principles of Effective USA Federal Fire Management Plans. Fire Ecol. 2015, 11, 59–83. [Google Scholar] [CrossRef]
- Steelman, T.A.; McCaffrey, S.M. What is limiting more flexible fire management—Public or agency pressure? J. For. 2011, 109, 454–461. [Google Scholar]
Figure 1.
Accumulation of daily metrics to agency administrators (AAs) and Incident Commanders (ICs) over the course of a single fire incident.
Figure 1.
Accumulation of daily metrics to agency administrators (AAs) and Incident Commanders (ICs) over the course of a single fire incident.

Figure 2.
Accumulation of daily metrics to agency administrators (AAs) and Incident Commanders (ICs) over the course of multiple fire incidents or assignments.
Figure 2.
Accumulation of daily metrics to agency administrators (AAs) and Incident Commanders (ICs) over the course of multiple fire incidents or assignments.

Figure 3.
Total productive capacity (TPC), total fire perimeter (TFP), total line constructed (T), calculated relative production index (RPI), and productive efficiency (PE) values (see Table 5).
Figure 3.
Total productive capacity (TPC), total fire perimeter (TFP), total line constructed (T), calculated relative production index (RPI), and productive efficiency (PE) values (see Table 5).

Figure 4.
Total amount of constructed fire line broken down by outcome (held, burned over, not engaged), as well as three fire line effectiveness (FLE) ratios.
Figure 4.
Total amount of constructed fire line broken down by outcome (held, burned over, not engaged), as well as three fire line effectiveness (FLE) ratios.

Figure 5.
Scatterplot of fire perimeter versus ratio of held to total fire line. The blue dots correspond to the individual fires A through L.
Figure 5.
Scatterplot of fire perimeter versus ratio of held to total fire line. The blue dots correspond to the individual fires A through L.

Figure 6.
Total amount of large air tanker drops, with each drop broken down into (fuel type) × (slope steepness) × (burning period) categories.
Figure 6.
Total amount of large air tanker drops, with each drop broken down into (fuel type) × (slope steepness) × (burning period) categories.


| Element | Primary Question |
|---|---|
| Big Picture | |
| Objective | What are the intended results, and how do they relate to strategic goals? |
| Measure | What is the specific measurement to be tracked? |
| Rationale | Why is the measure relevant or useful? |
| Interpretation | What does the measure tell us? |
| Details | |
| Frequency | How often should this KPI be measured? |
| Data & Methods | Where will the data come from, and how is the KPI calculated? |
| Performance Evaluation | |
| Target | What level or range of performance do we want to achieve? |
| Standard | How do we define success in relation to attainment of target performance? |
Table 2.
Summary of research studies currently being improved and updated for use as KPIs. ROSS = Resource Ordering and Status System; ICS-209 = Incident Status Summary forms; NIFC = National Interagency Fire Center; FTP = File Transfer Protocol; ATU = Automated Telemetry Unit; OLMS = Operational Loads Monitoring System.
| KPI Index | KPI Title | Definition | Primary Suppression Data Source(s) |
|---|---|---|---|
| Suppression Resource Use | |||
| 1 | Relative Production Index & Productive Efficiency | Ratios relating total fire line production capacity to length of final fire perimeter, and total fire line production capacity to actual construction | ROSS; ICS-209; NIFC FTP |
| 2 | Daily Resource Capacity | Daily resource capacity due to effects of assigned incident management team | ROSS; ICS-209 |
| Suppression Effectiveness | |||
| 3 | Fire Line Effectiveness | Ratio of total fire line construction to amount of fire line that engaged the fire and amount of fire line that held or burned over | NIFC FTP |
| 4 | Air Tanker Drop Conditions | Matrix of topography, fuel and weather conditions at time and location of drop | ATU; OLMS |
Table 3.
Summary statistics of fires evaluated for demonstration purposes.
| Fire Index | Area (ha) | Perimeter (km) | Duration (Days) |
|---|---|---|---|
| A | 66,290 | 756.5 | 85 |
| B | 21,781 | 466.9 | 83 |
| C | 7458 | 62.7 | 89 |
| D | 77,346 | 480.5 | 113 |
| E | 10,647 | 92.8 | 93 |
| F | 11,125 | 154.0 | 83 |
| G | 9723 | 79.5 | 44 |
| H | 2183 | 108.5 | 121 |
| I | 6006 | 298.6 | 51 |
| J | 52,631 | 559.3 | 36 |
| K | 26,680 | 223.0 | 52 |
| L | 17,479 | 368.4 | 69 |
Table 4.
Possible interpretations for various values of relative production index (RPI) and productive efficiency (PE). Some redundancy regarding fire line construction in relation to productive capacity is retained for completeness.
Table 4.
Possible interpretations for various values of relative production index (RPI) and productive efficiency (PE). Some redundancy regarding fire line construction in relation to productive capacity is retained for completeness.
| Condition | Possible Interpretations |
|---|---|
| RPI > 1 | Suppression strategy full perimeter control |
| Significant amount of fire line that burned over | |
| Significant amount of indirect or contingency line that never engaged fire | |
| Resources operating below estimated productive capacity when constructing fire line | |
| Resources assigned to tasks other than fire line construction | |
| RPI < 1 | Suppression strategy not full perimeter control |
| Resources operating above estimated productive capacity when constructing fire line | |
| PE > 1 | Resources operating below estimated productive capacity when constructing fire line |
| PE < 1 | Resources operating above estimated productive capacity when constructing fire line |
Table 5.
Total productive capacity (TPC), total line constructed (T), total fire perimeter (TFP), calculated relative production index (RPI), and calculated productive efficiency (PE) values for a select set of fires. Note that TFP corresponds to perimeter data presented in Table 3, presented here again for completeness.
| Fire Index | TPC (km) | TFP (km) | T (km) | RPI | PE |
|---|---|---|---|---|---|
| A | 1724.9 | 756.5 | 254.6 | 2.3 | 6.8 |
| B | 1701.3 | 466.9 | 322.8 | 3.6 | 5.3 |
| C | 1423.1 | 62.7 | 166.9 | 22.7 | 8.5 |
| D | 3036.5 | 480.5 | 1023.5 | 6.3 | 3.0 |
| E | 1478.9 | 92.8 | 324.8 | 15.9 | 4.6 |
| F | 2067.3 | 154.0 | 309.6 | 13.4 | 6.7 |
| G | 899.9 | 79.5 | 93.3 | 11.3 | 9.6 |
| H | 1923.3 | 108.5 | 149.0 | 17.7 | 12.9 |
| I | 3415.2 | 298.6 | 616.8 | 11.4 | 5.5 |
| J | 4171.9 | 559.3 | 381.6 | 7.5 | 10.9 |
| K | 2988.3 | 223.0 | 263.0 | 13.4 | 11.4 |
| L | 2615.4 | 368.4 | 475.4 | 7.10 | 5.5 |
Table 6.
Summary findings for Incident Management Team (IMT) variation in contribution to daily resource capacity (DRC) levels.
Table 6.
Summary findings for Incident Management Team (IMT) variation in contribution to daily resource capacity (DRC) levels.
| Quintile (# IMTs in bin) | Bin Average | Sum of Absoluate Deviations from Mean DRC for Quintile | Percent of Total |
|---|---|---|---|
| Lowest (17) | −1282.79 | 7341.82 | 19.56 |
| 2nd-Lowest (18) | −465.32 | 2322.09 | 6.19 |
| Middle (18) | 0.62 | 2440.62 | 6.50 |
| 2nd-Highest (18) | 517.68 | 3509.02 | 9.35 |
| Highest (17) | 2667.63 | 21,928.65 | 58.41 |
Table 7.
Possible interpretations for various values of Tr, Er and HEr (from [30]).
Table 7.
Possible interpretations for various values of Tr, Er and HEr (from [30]).
| Condition | Possible Interpretations |
|---|---|
| Tr > 1 | Suppression strategy full perimeter control |
| Significant amount of fire line that burned over | |
| Significant amount of indirect or contingency line that never engaged fire | |
| Tr < 1 | Suppression strategy not full perimeter control |
| Er ≈ 1 | All indirect or contingency line ultimately engaged fire |
| Significant effort devoted to construction of direct fire line | |
| Er < 1 | Significant effort devoted to construction of indirect or contingency line |
| HEr ≈ 1 | Engaged fire line effective in all locations |
| HEr < 1 | Engaged fire line not effective in all locations |
Table 8.
Summary ATDC findings for five fires.
| Drop Conditions | Fire A | Fire B | Fire C | Fire E | Fire G |
|---|---|---|---|---|---|
| Total Drops | 72 | 44 | 77 | 103 | 57 |
| Steep slopes (SS) | 0.31 | 0.66 | 0.81 | 0.88 | 0.23 |
| Timber fuel type (TF) | 0.75 | 0.61 | 0.26 | 0.78 | 0.46 |
| Active burning period (ABP) | 0.68 | 0.64 | 0.58 | 0.51 | 0.65 |
| SS & TF | 0.18 | 0.39 | 0.22 | 0.68 | 0.14 |
| SS & ABP | 0.22 | 0.45 | 0.47 | 0.43 | 0.16 |
| TF & ABP | 0.47 | 0.36 | 0.17 | 0.42 | 0.37 |
| SS & TF & ABP | 0.10 | 0.25 | 0.13 | 0.35 | 0.12 |
Table 9.
Schema for collection of data on daily suppression activities. Note each column presents an independent list providing examples of information to be included in the daily activity summary.
Table 9.
Schema for collection of data on daily suppression activities. Note each column presents an independent list providing examples of information to be included in the daily activity summary.
| Resource | Activity | Supplementary Information |
|---|---|---|
| Type 1 crew Type 2 crew Type 1 dozer Type 1 engine Large Air Tanker Type 1 helicopter | Direct line Indirect line Contingency line Point protection Mop up Rehab Scouting Burnout operation | Number of resources Local versus external Hours spent on assignment Continued or new assignment Day or nightime operations |
© 2018 by the authors. Licensee MDPI, Basel, Switzerland. This article is an open access article distributed under the terms and conditions of the Creative Commons Attribution (CC BY) license (http://creativecommons.org/licenses/by/4.0/).
Share and Cite
MDPI and ACS Style
Thompson, M.P.; Lauer, C.J.; Calkin, D.E.; Rieck, J.D.; Stonesifer, C.S.; Hand, M.S. Wildfire Response Performance Measurement: Current and Future Directions. Fire 2018, 1, 21. https://0-doi-org.brum.beds.ac.uk/10.3390/fire1020021
AMA Style
Thompson MP, Lauer CJ, Calkin DE, Rieck JD, Stonesifer CS, Hand MS. Wildfire Response Performance Measurement: Current and Future Directions. Fire. 2018; 1(2):21. https://0-doi-org.brum.beds.ac.uk/10.3390/fire1020021
Chicago/Turabian StyleThompson, Matthew P., Christopher J. Lauer, David E. Calkin, Jon D. Rieck, Crystal S. Stonesifer, and Michael S. Hand. 2018. "Wildfire Response Performance Measurement: Current and Future Directions" Fire 1, no. 2: 21. https://0-doi-org.brum.beds.ac.uk/10.3390/fire1020021