Geographic Patterns of Fire Severity Following an Extreme Eucalyptus Forest Fire in Southern Australia: 2013 Forcett-Dunalley Fire


Abstract
:1. Introduction
2. Materials and Methods
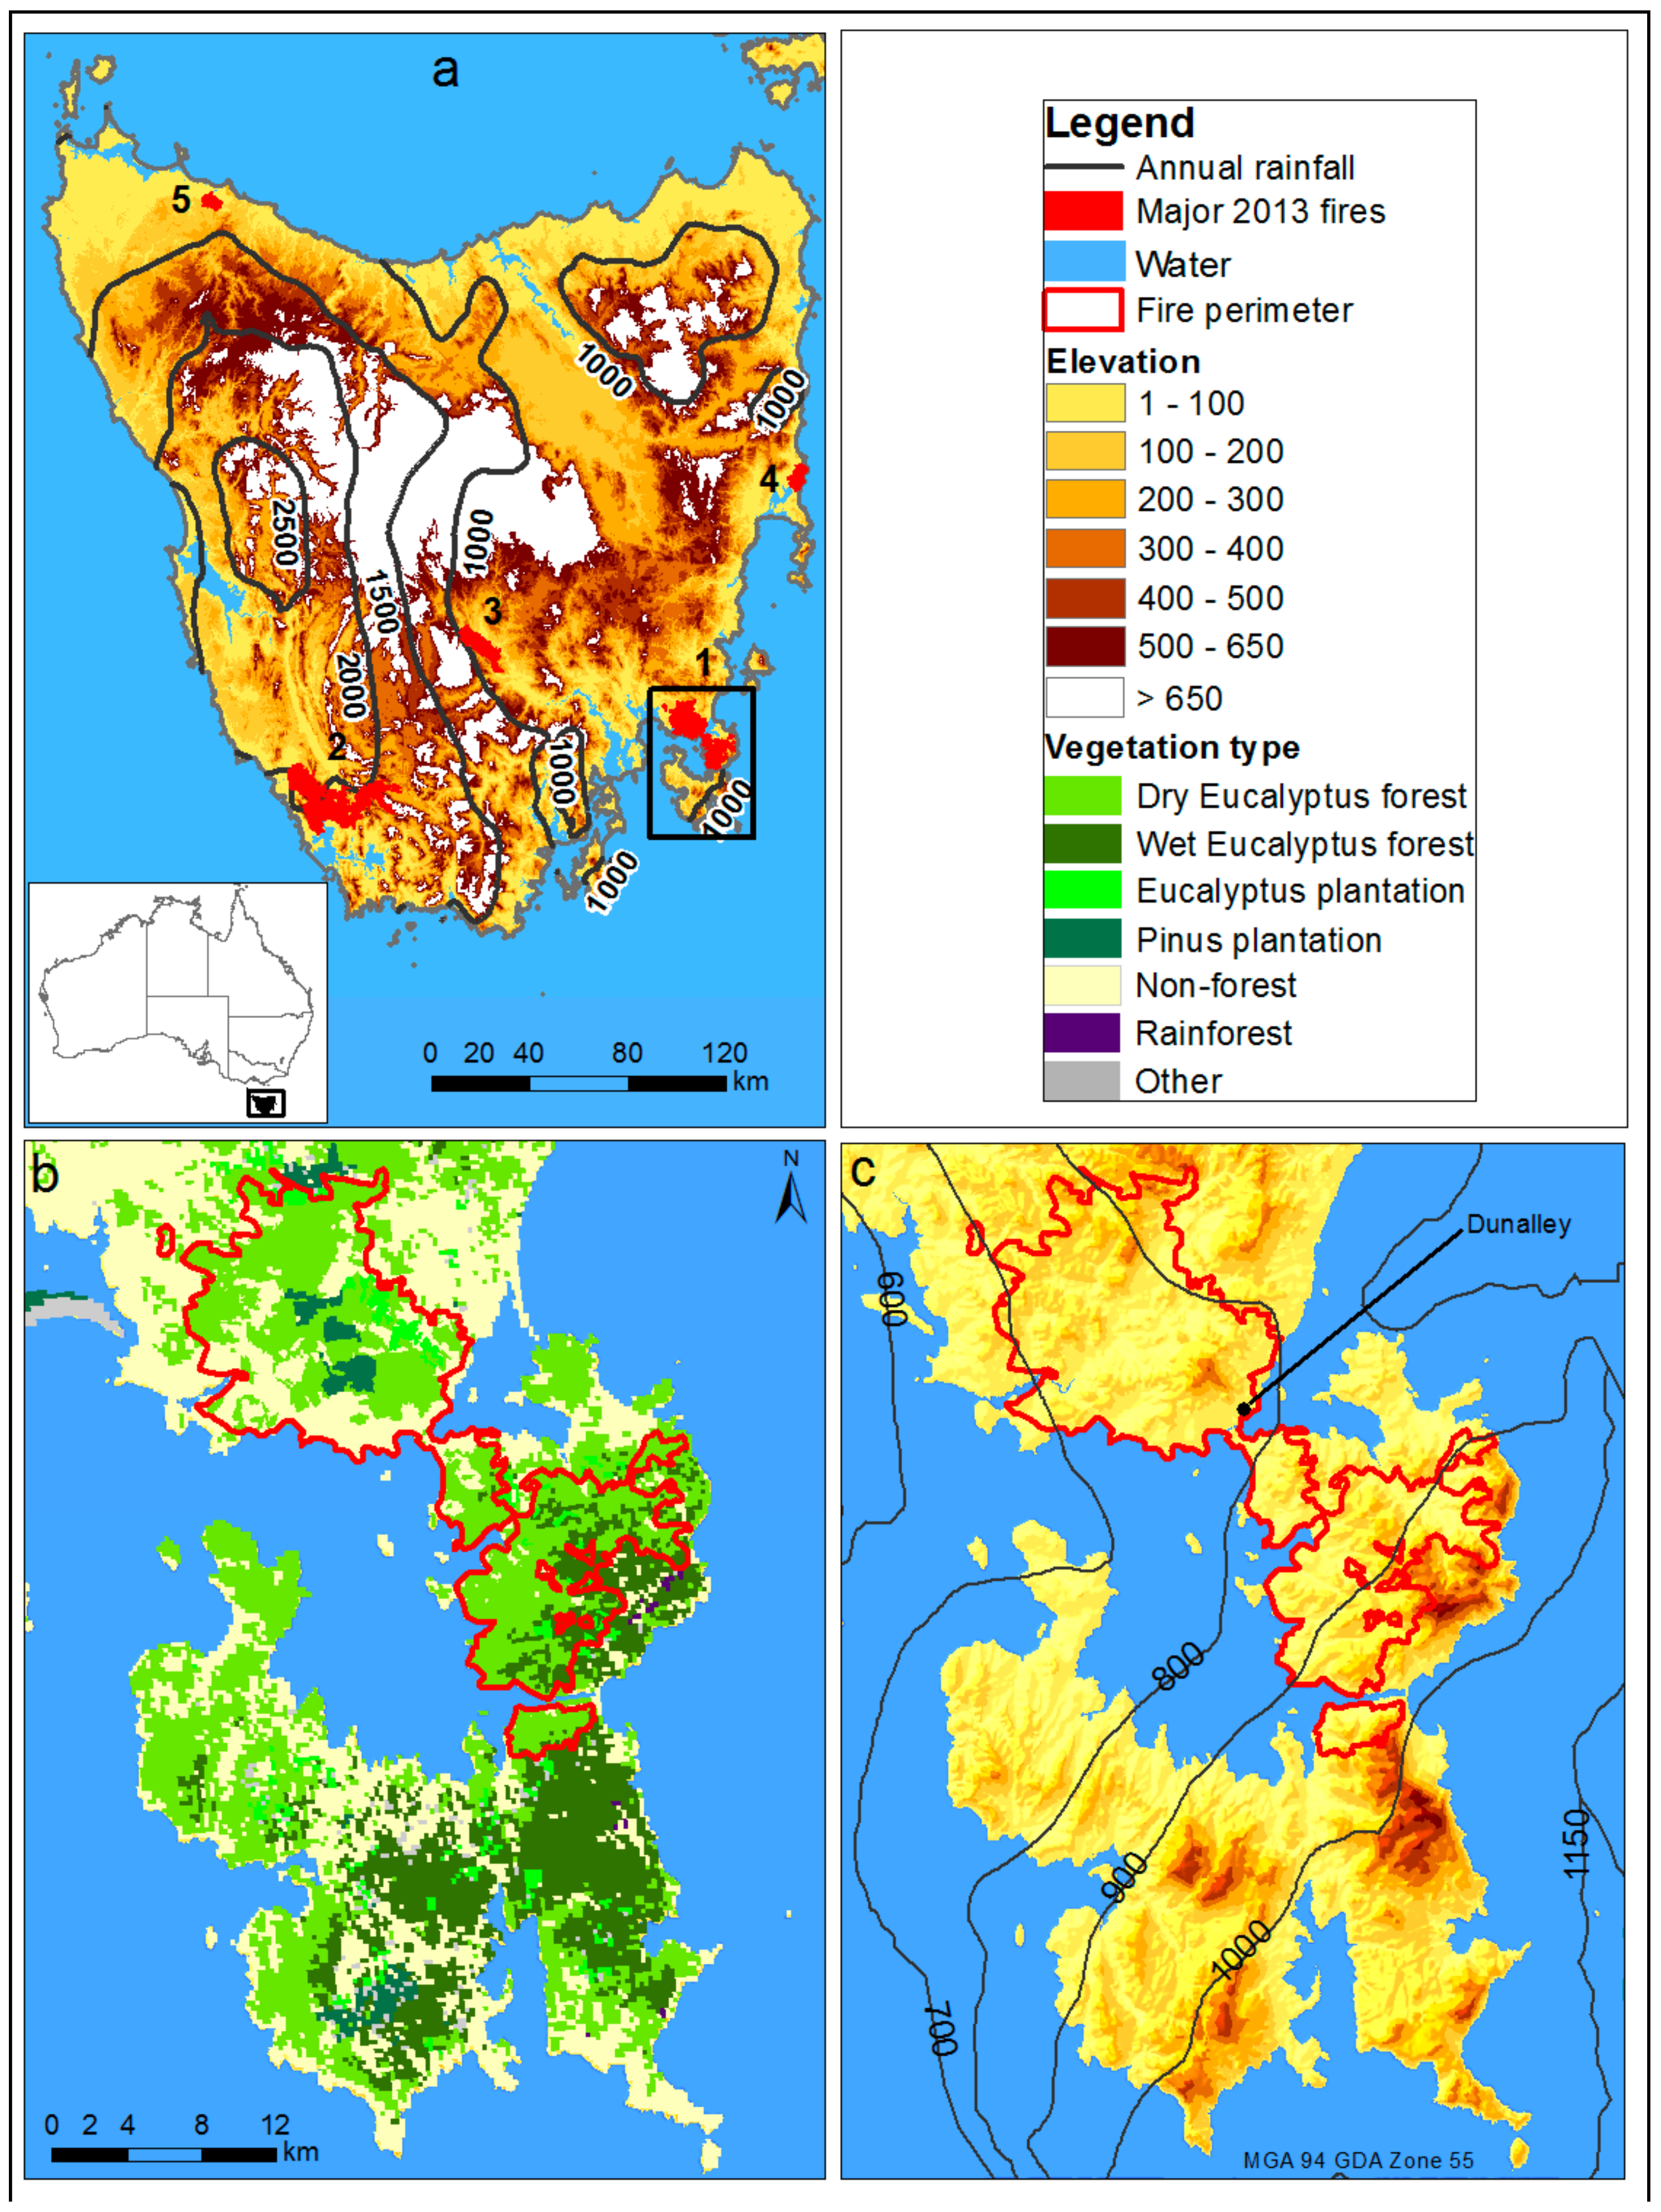
2.1. Study Area
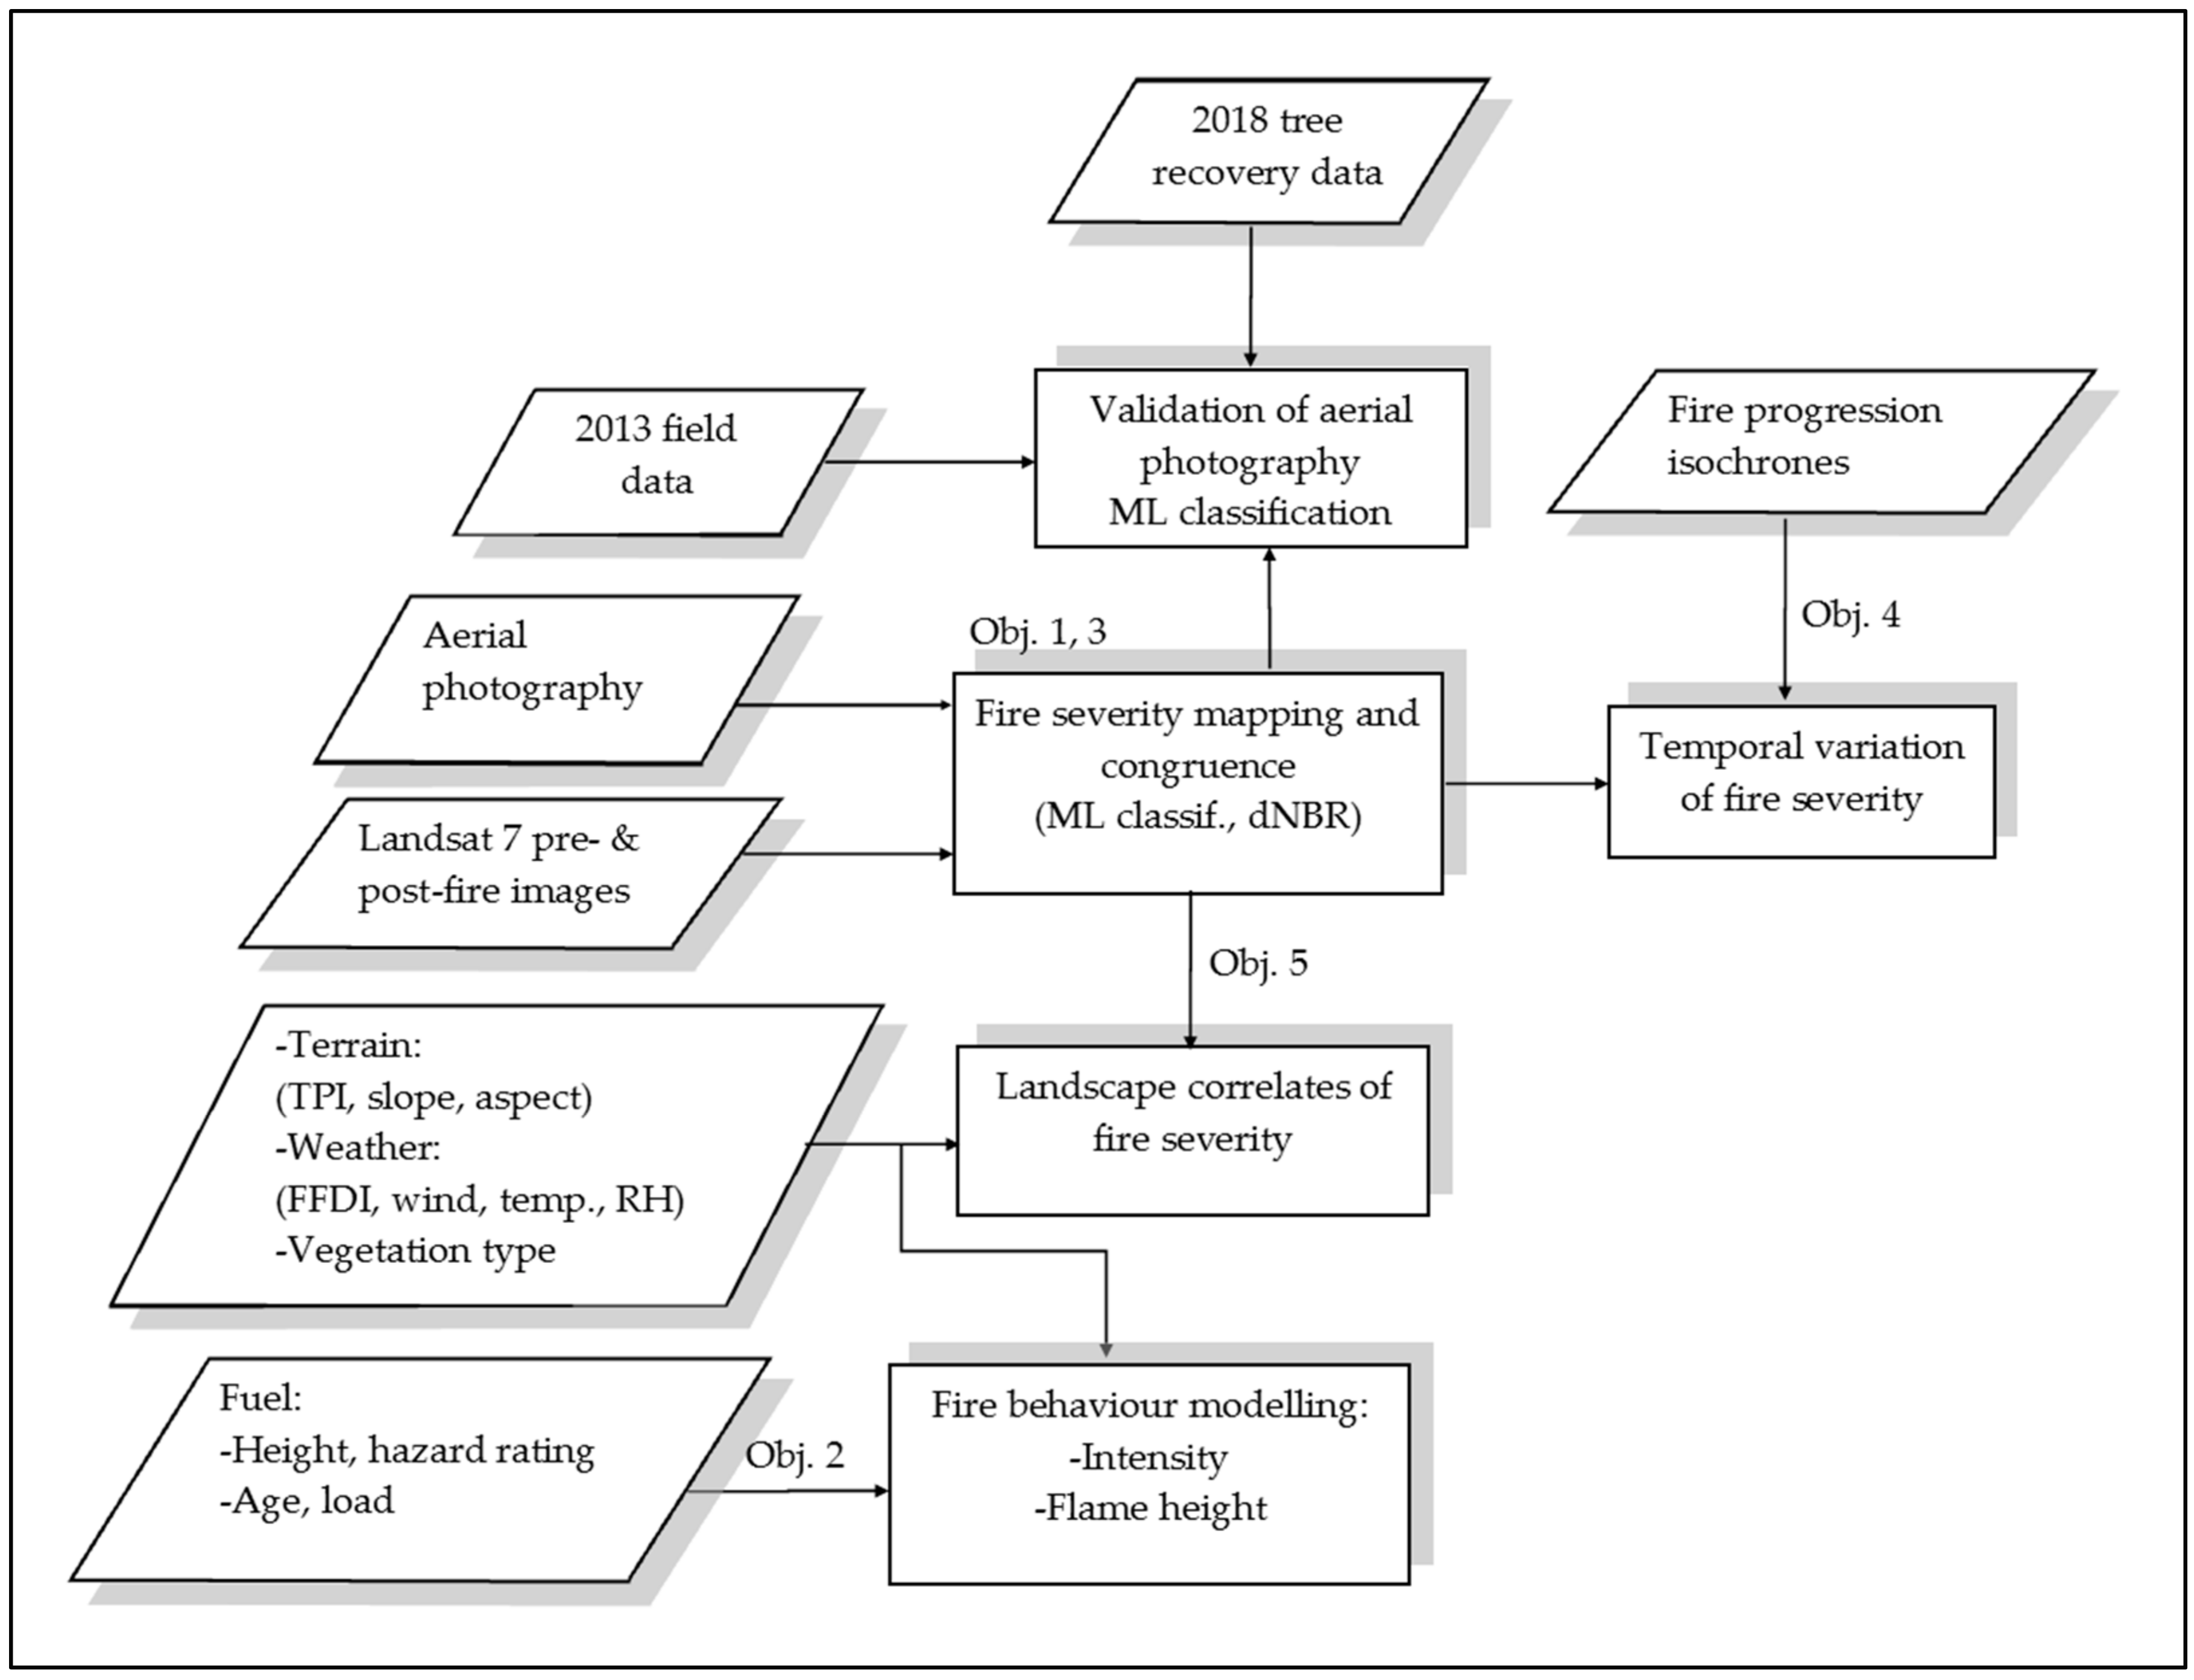
2.2. Data Harmonisation and Analysis
2.2.1. Fire Behavior Modelling
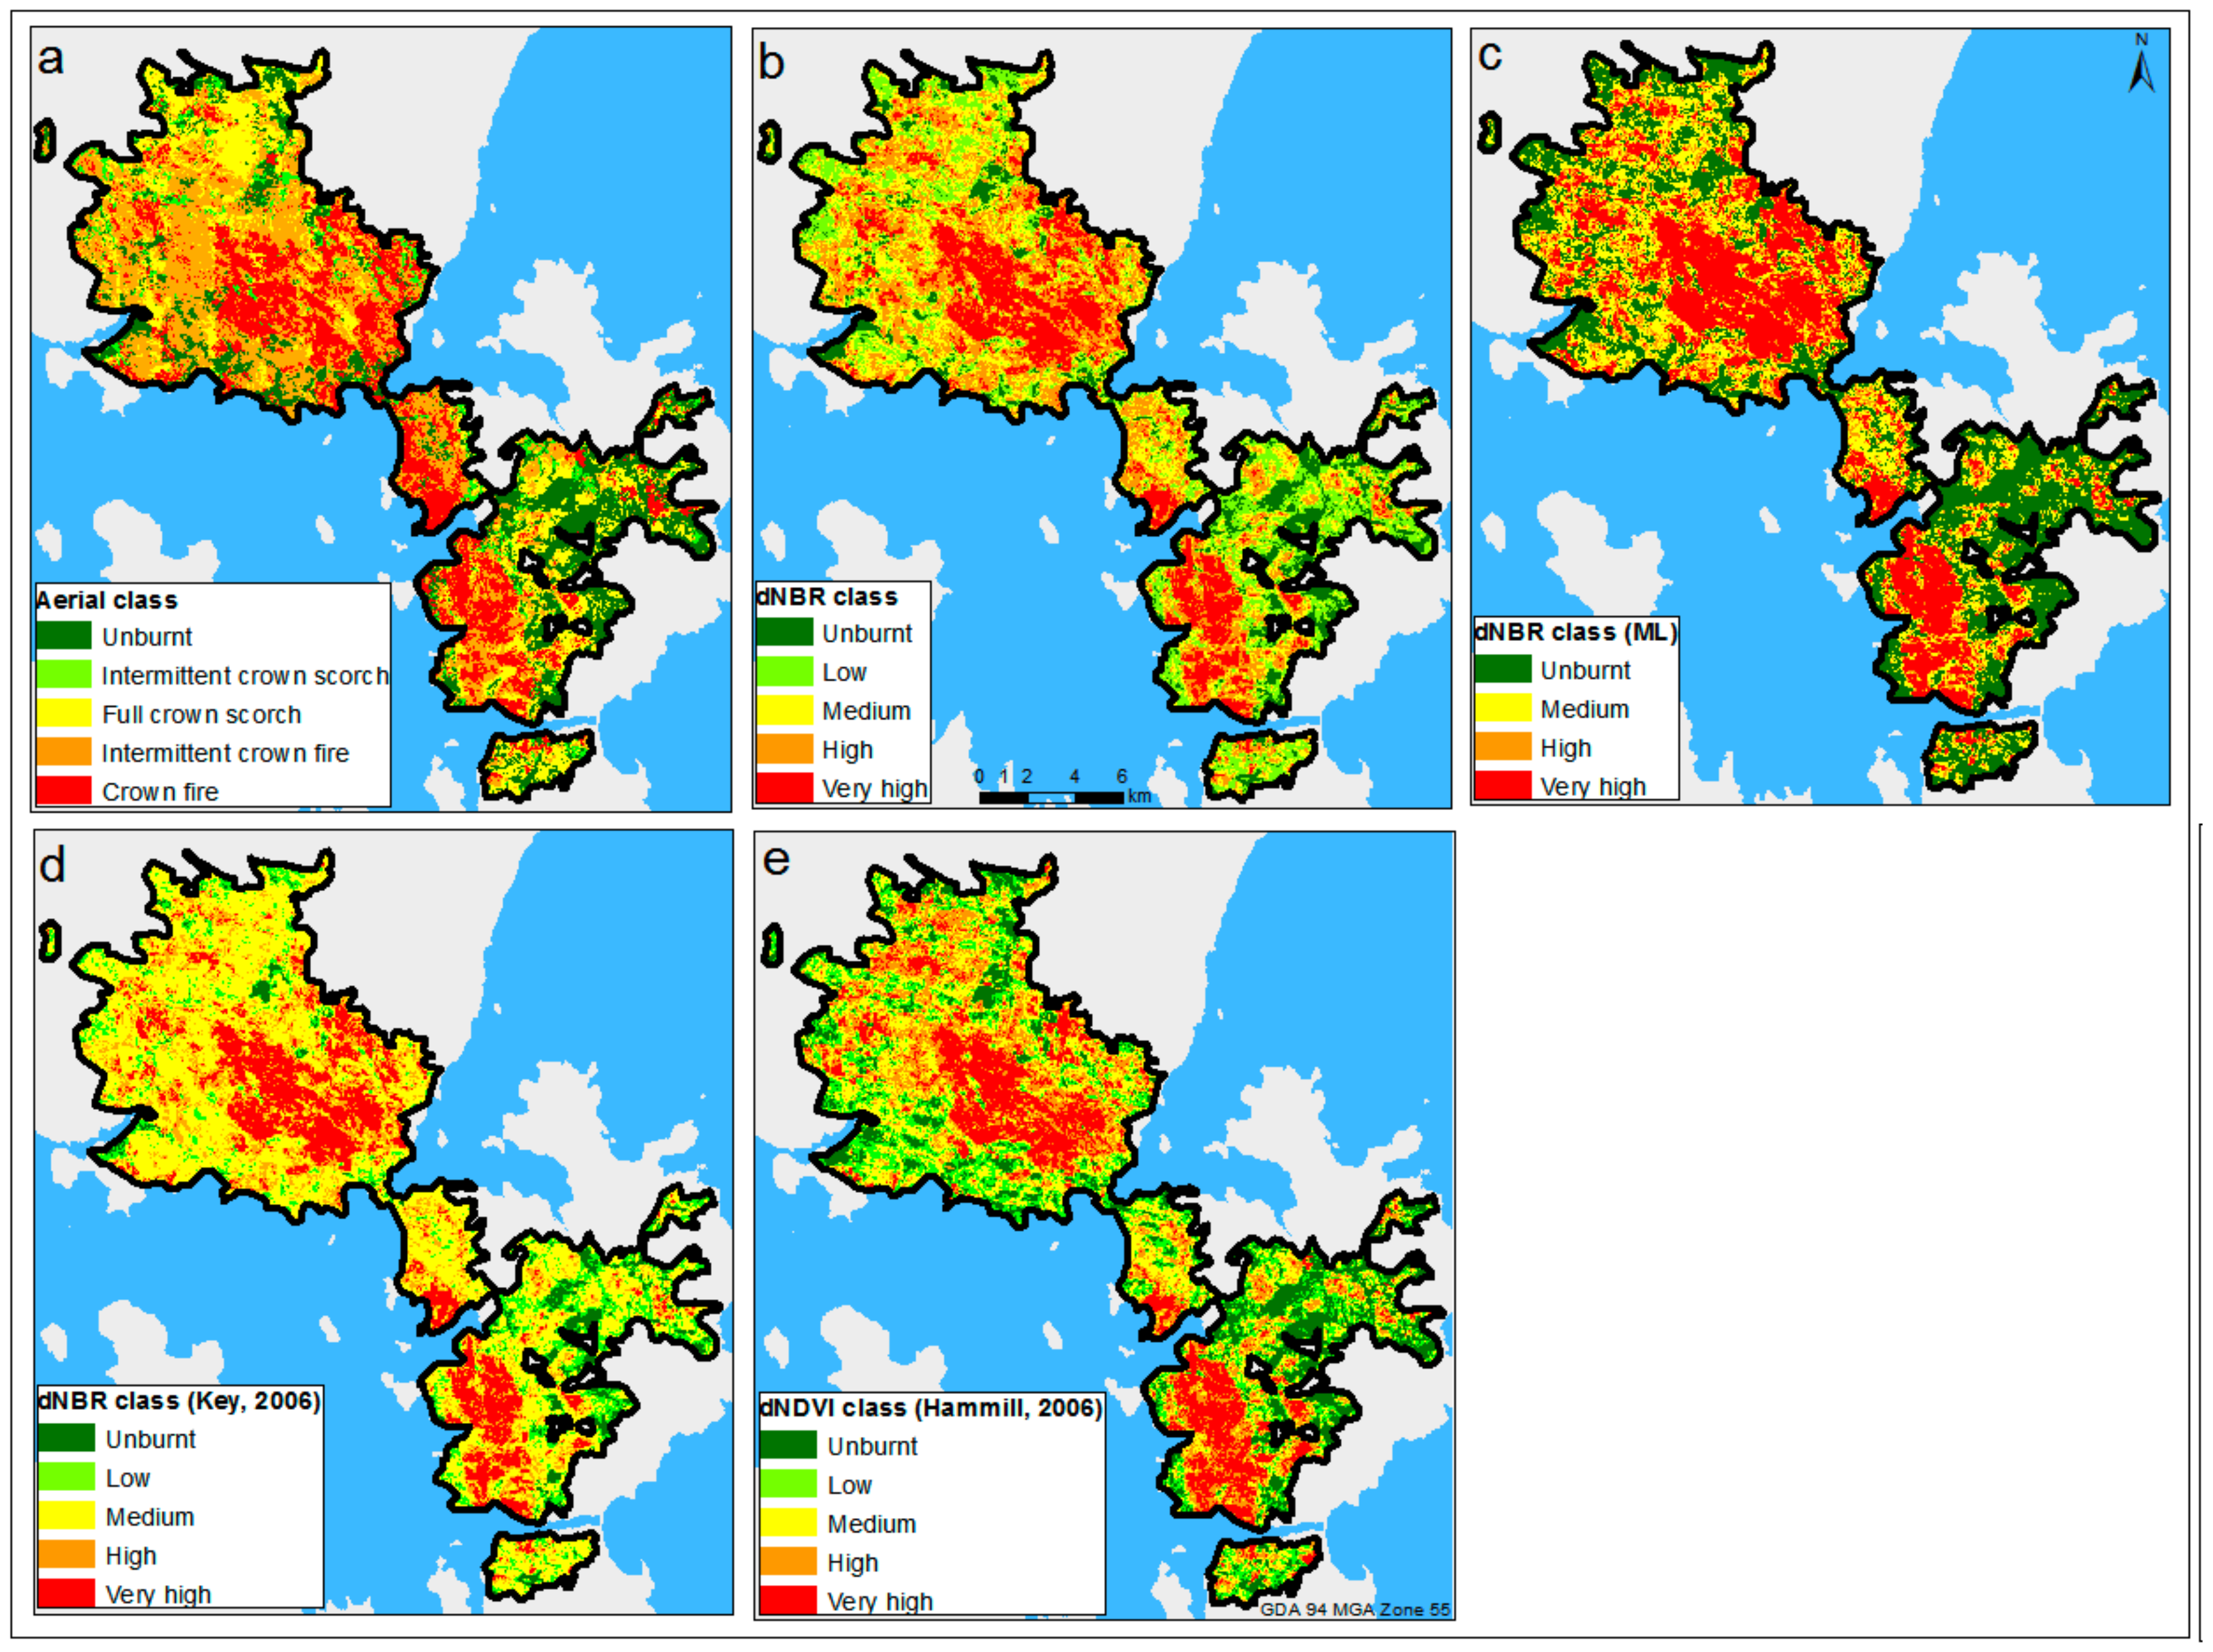
2.2.2. Fire Severity Mapping
Temporal Patterns of Fire Severity
2.2.3. Statistical Analysis
3. Results
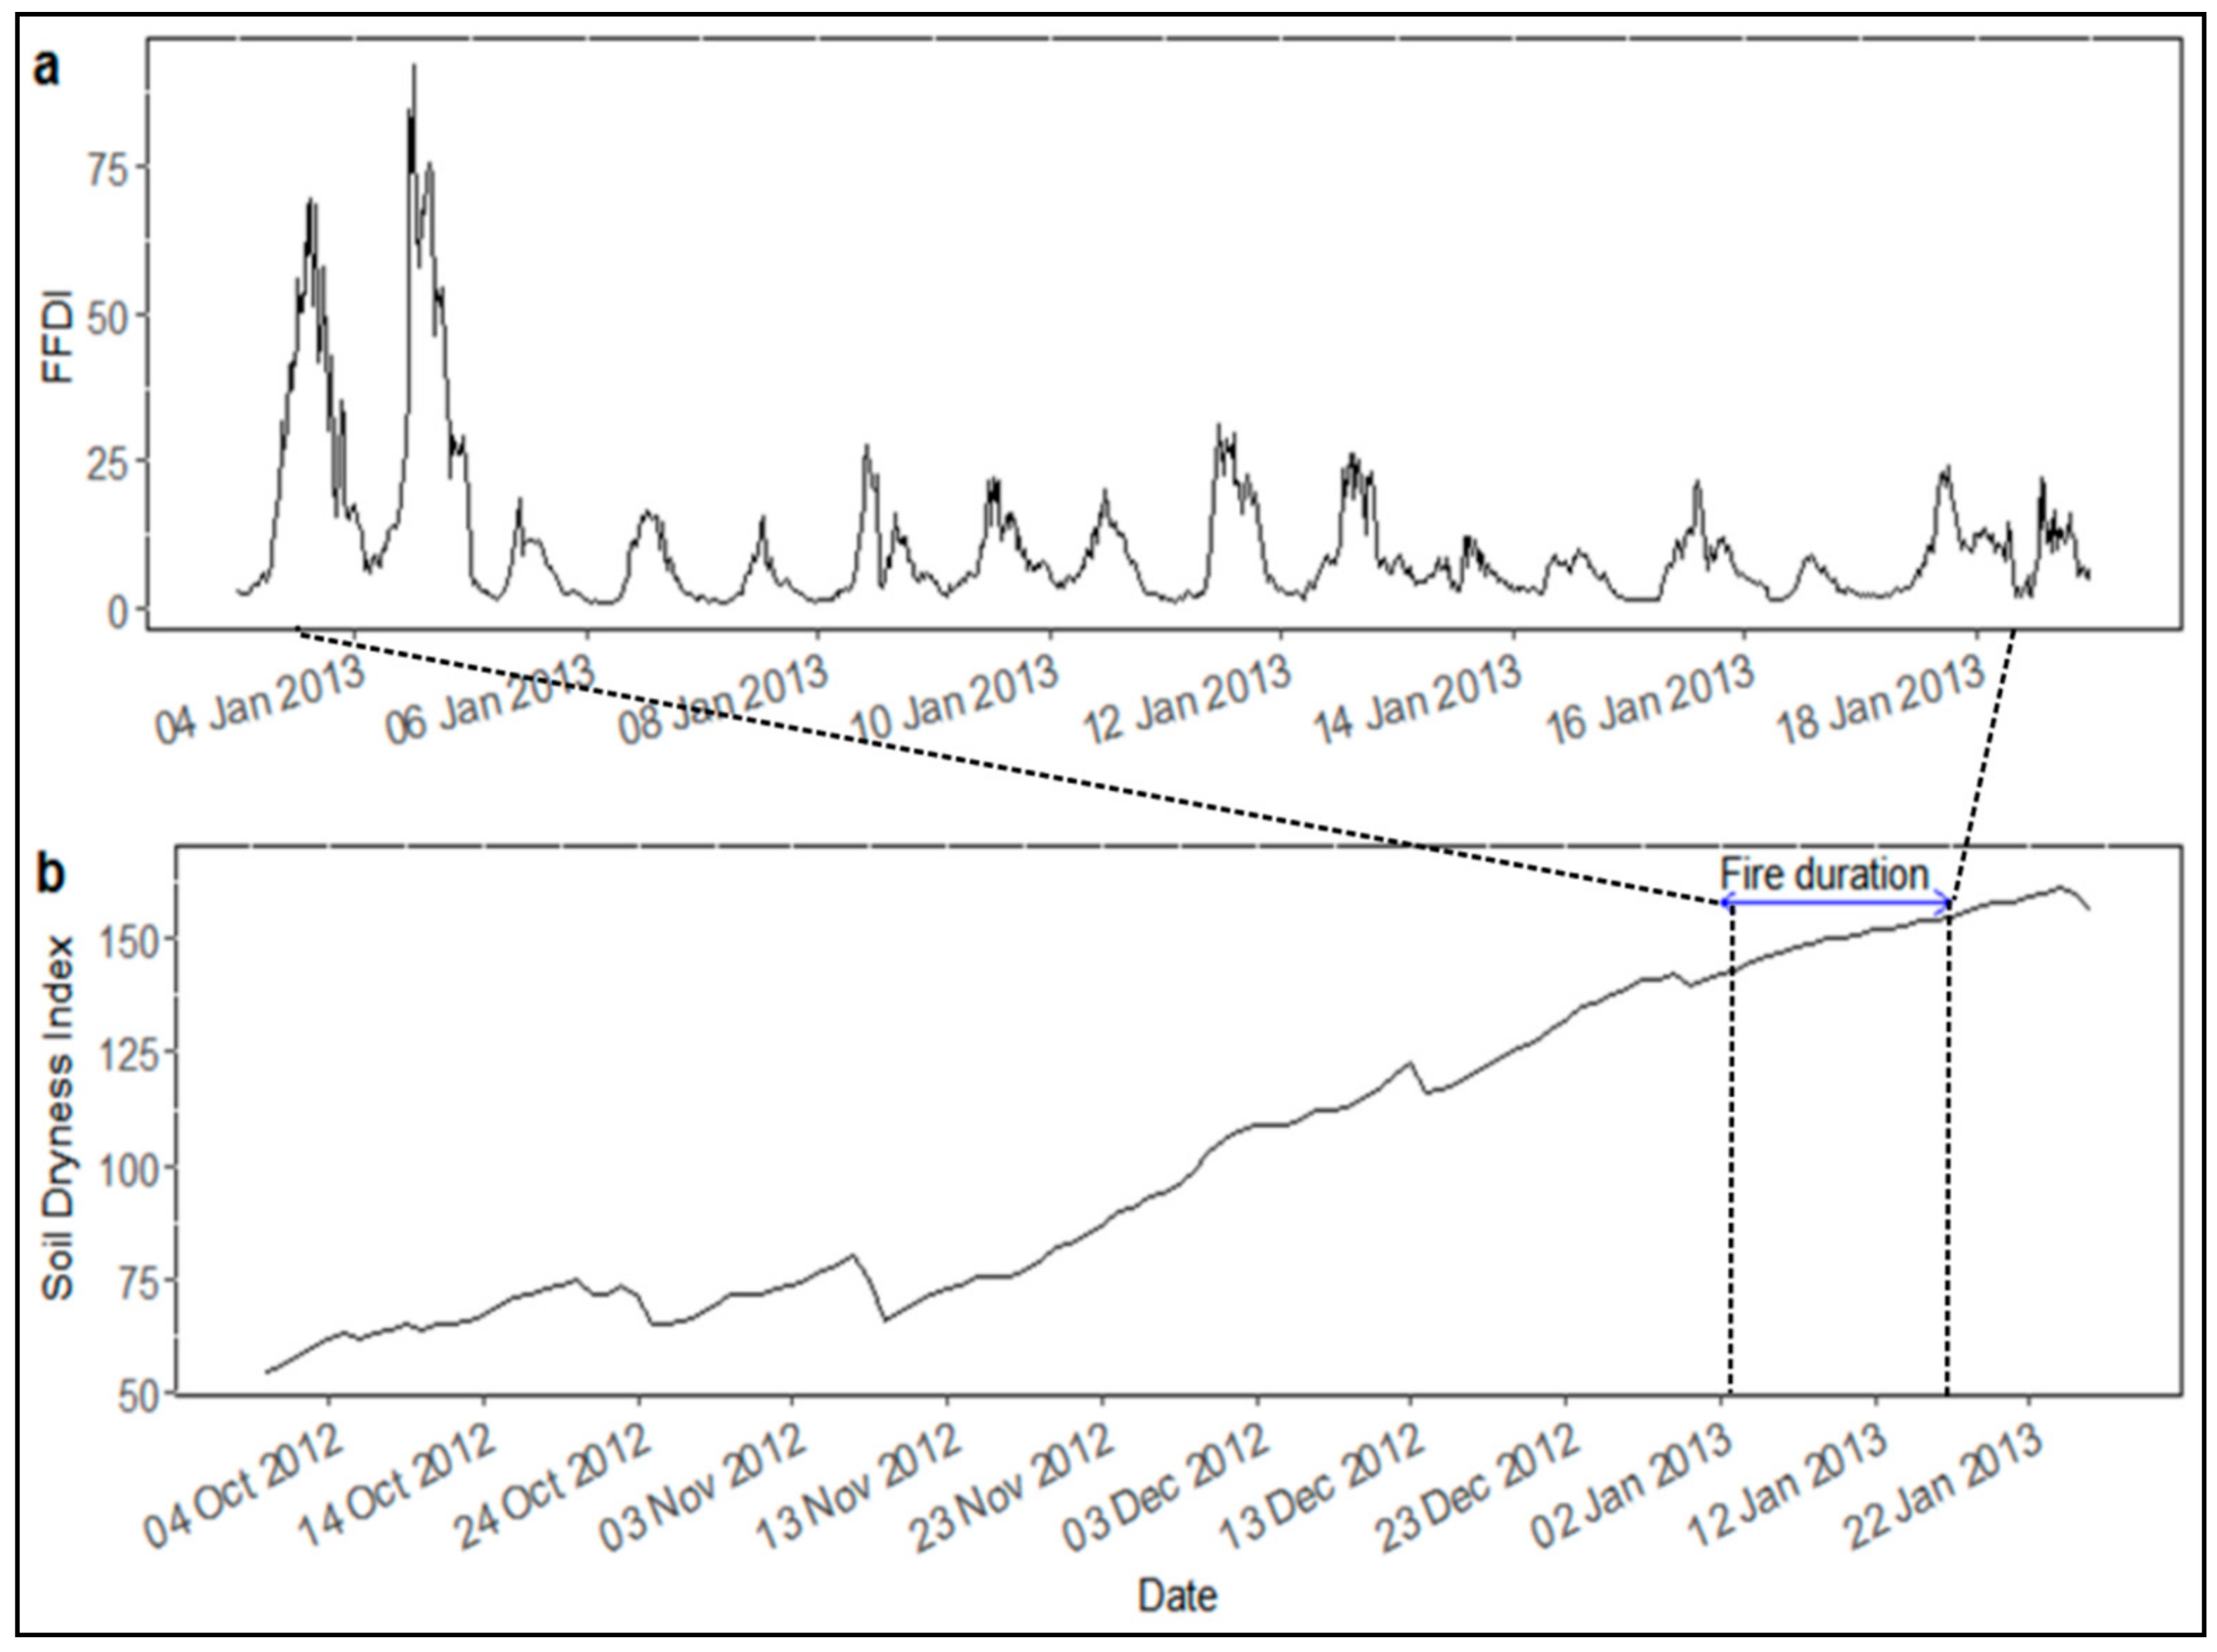
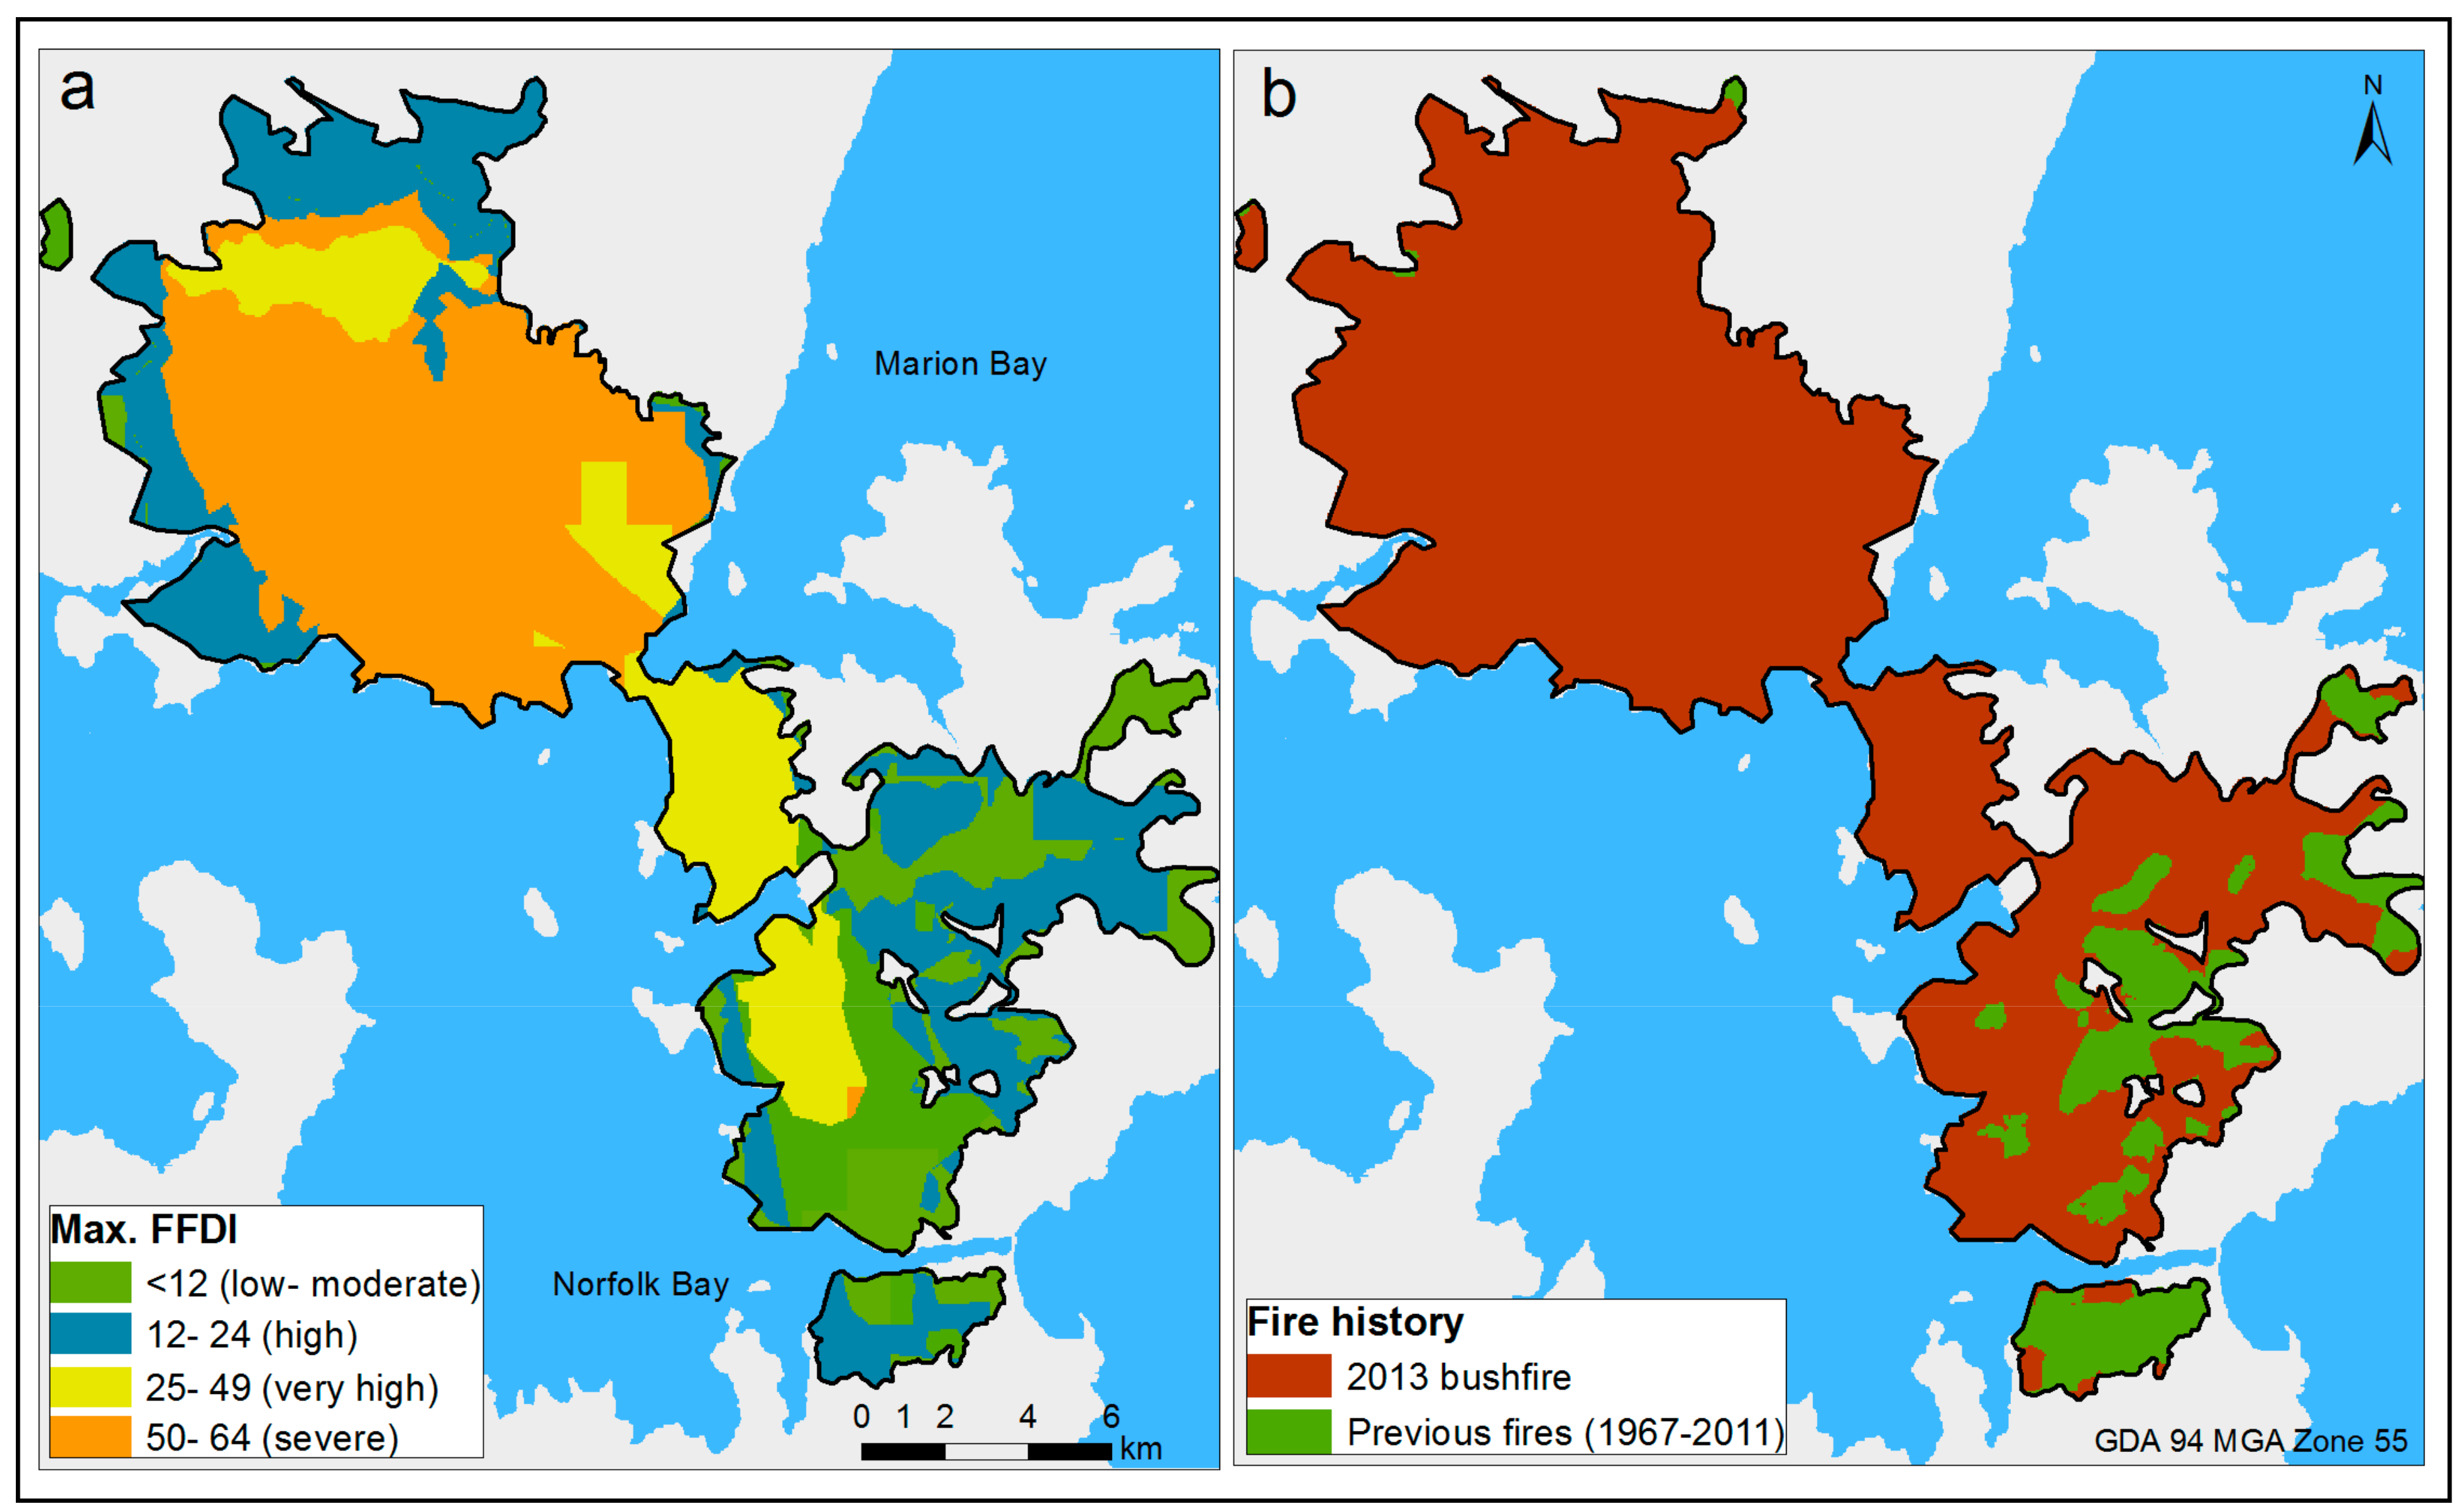
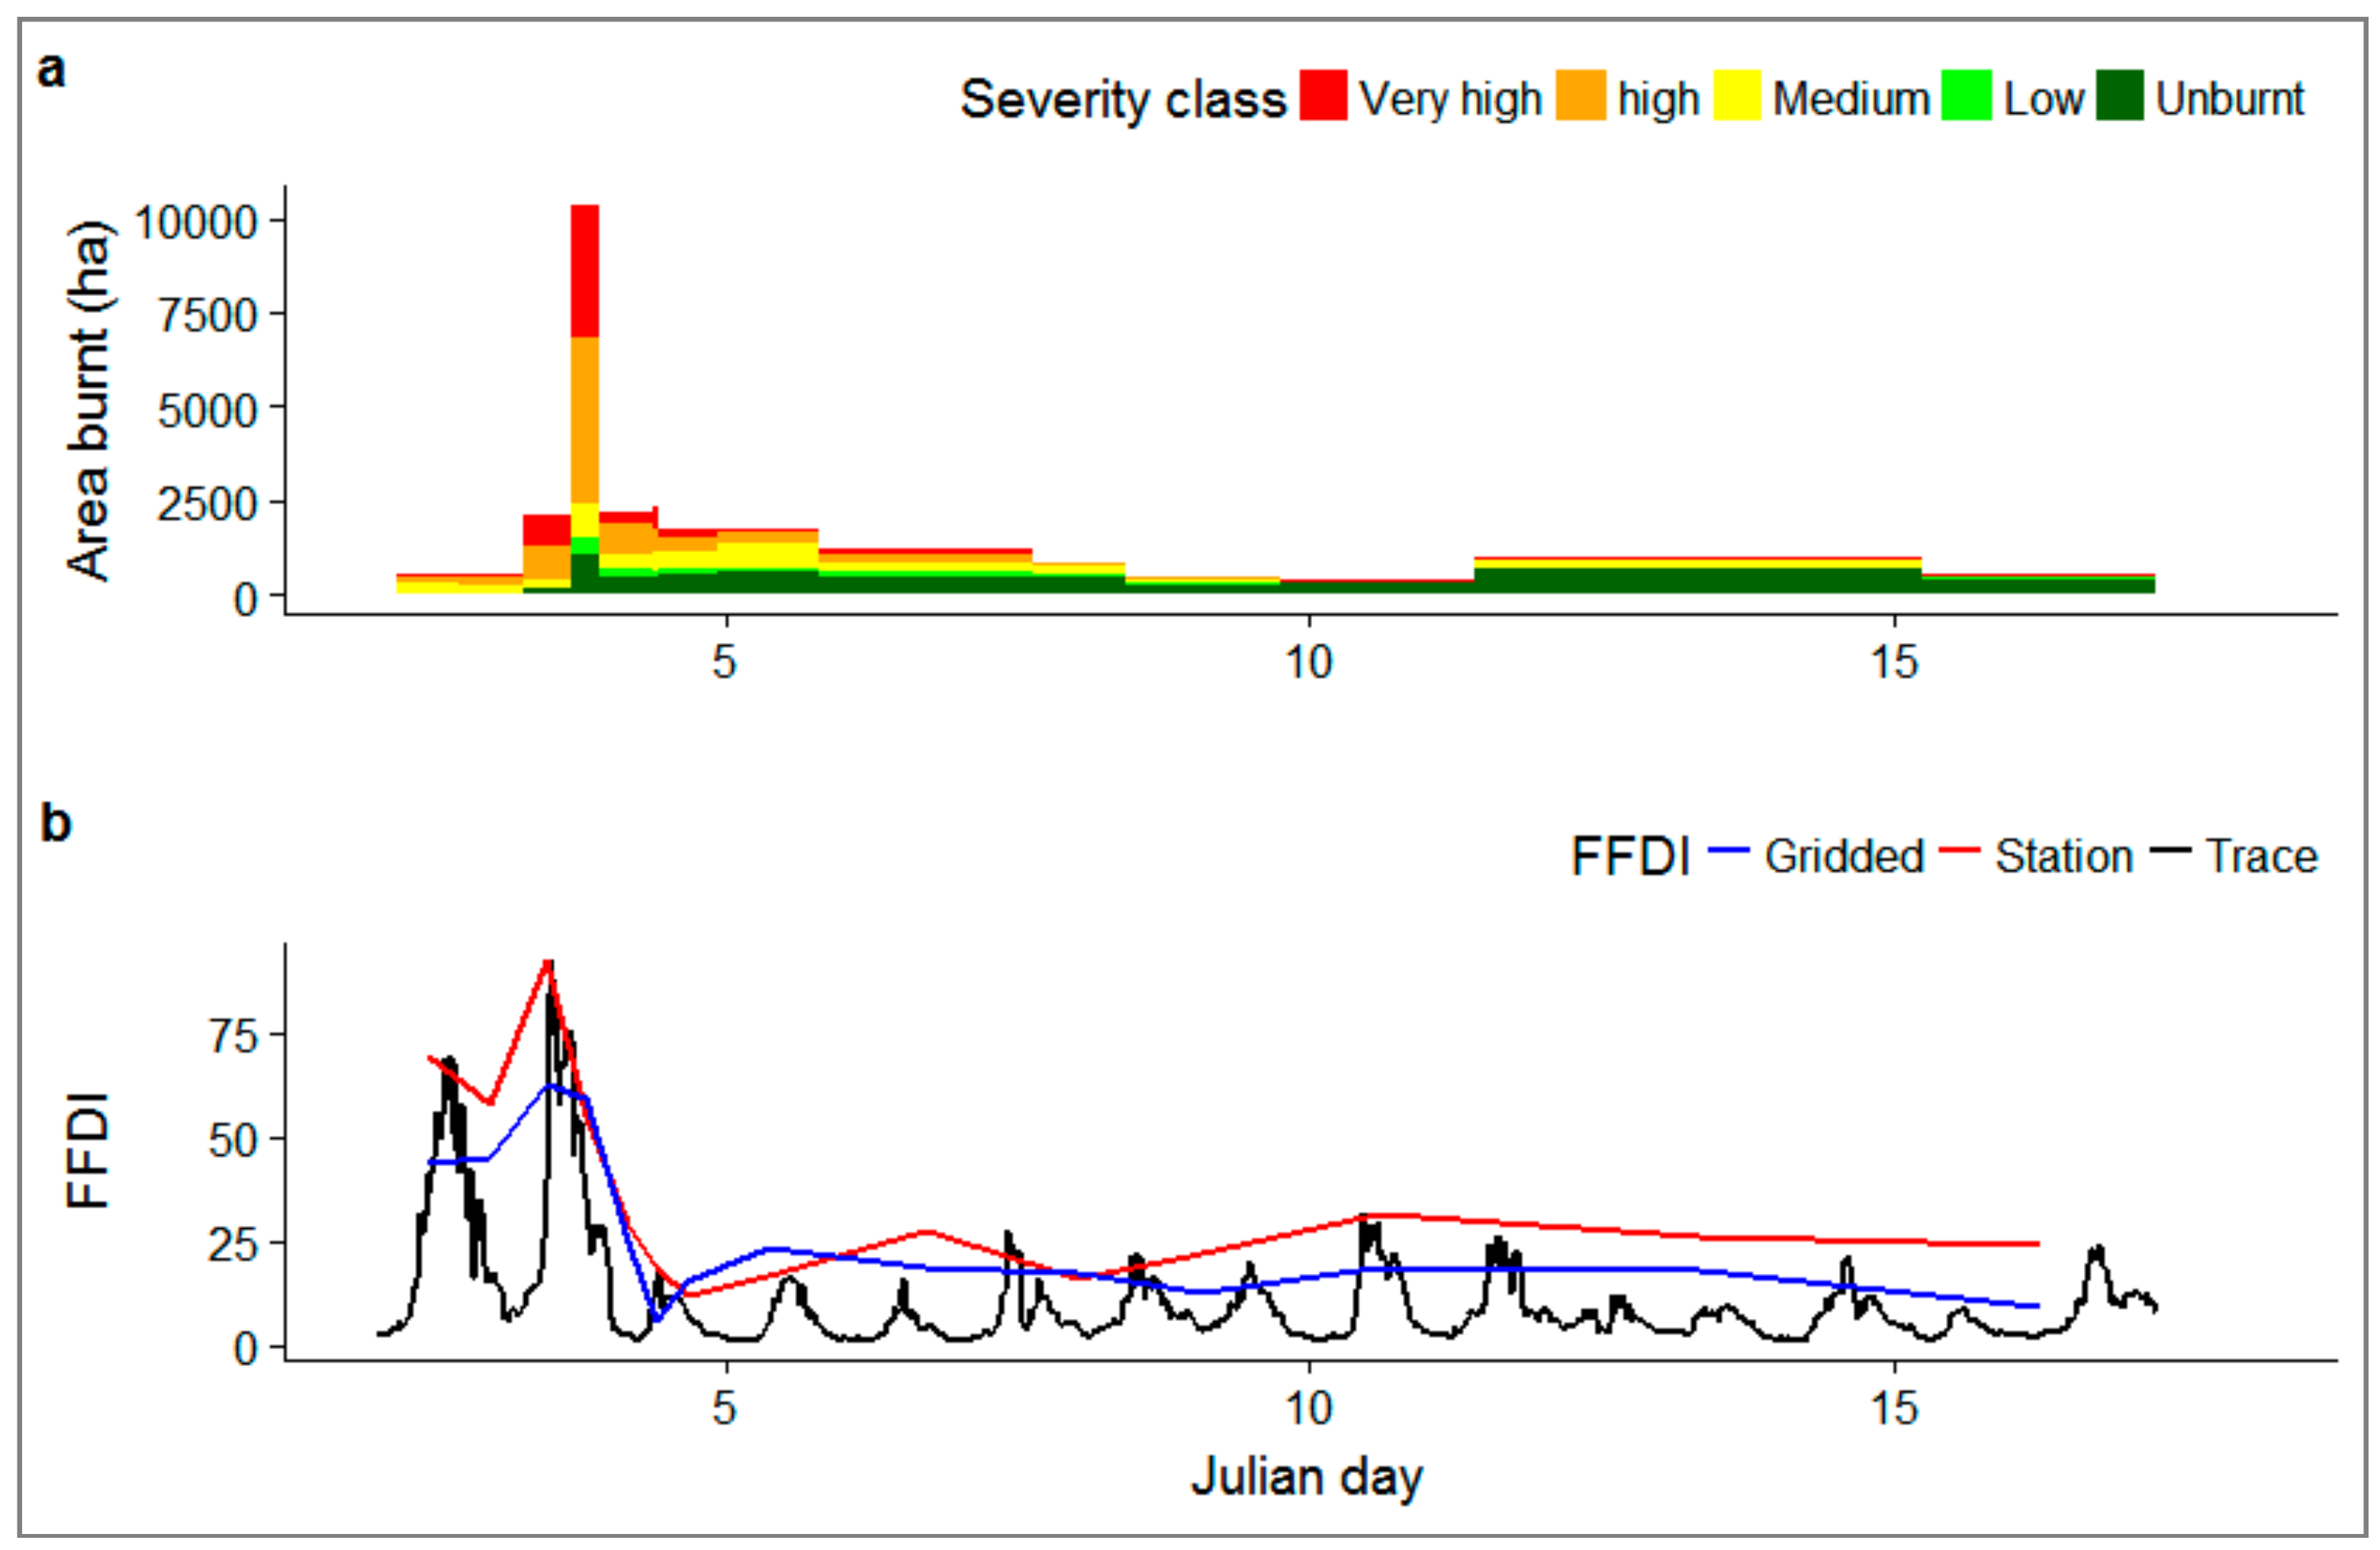
3.1. Fire Weather
3.2. Fire Behavior
3.3. Fire Severity Mapping
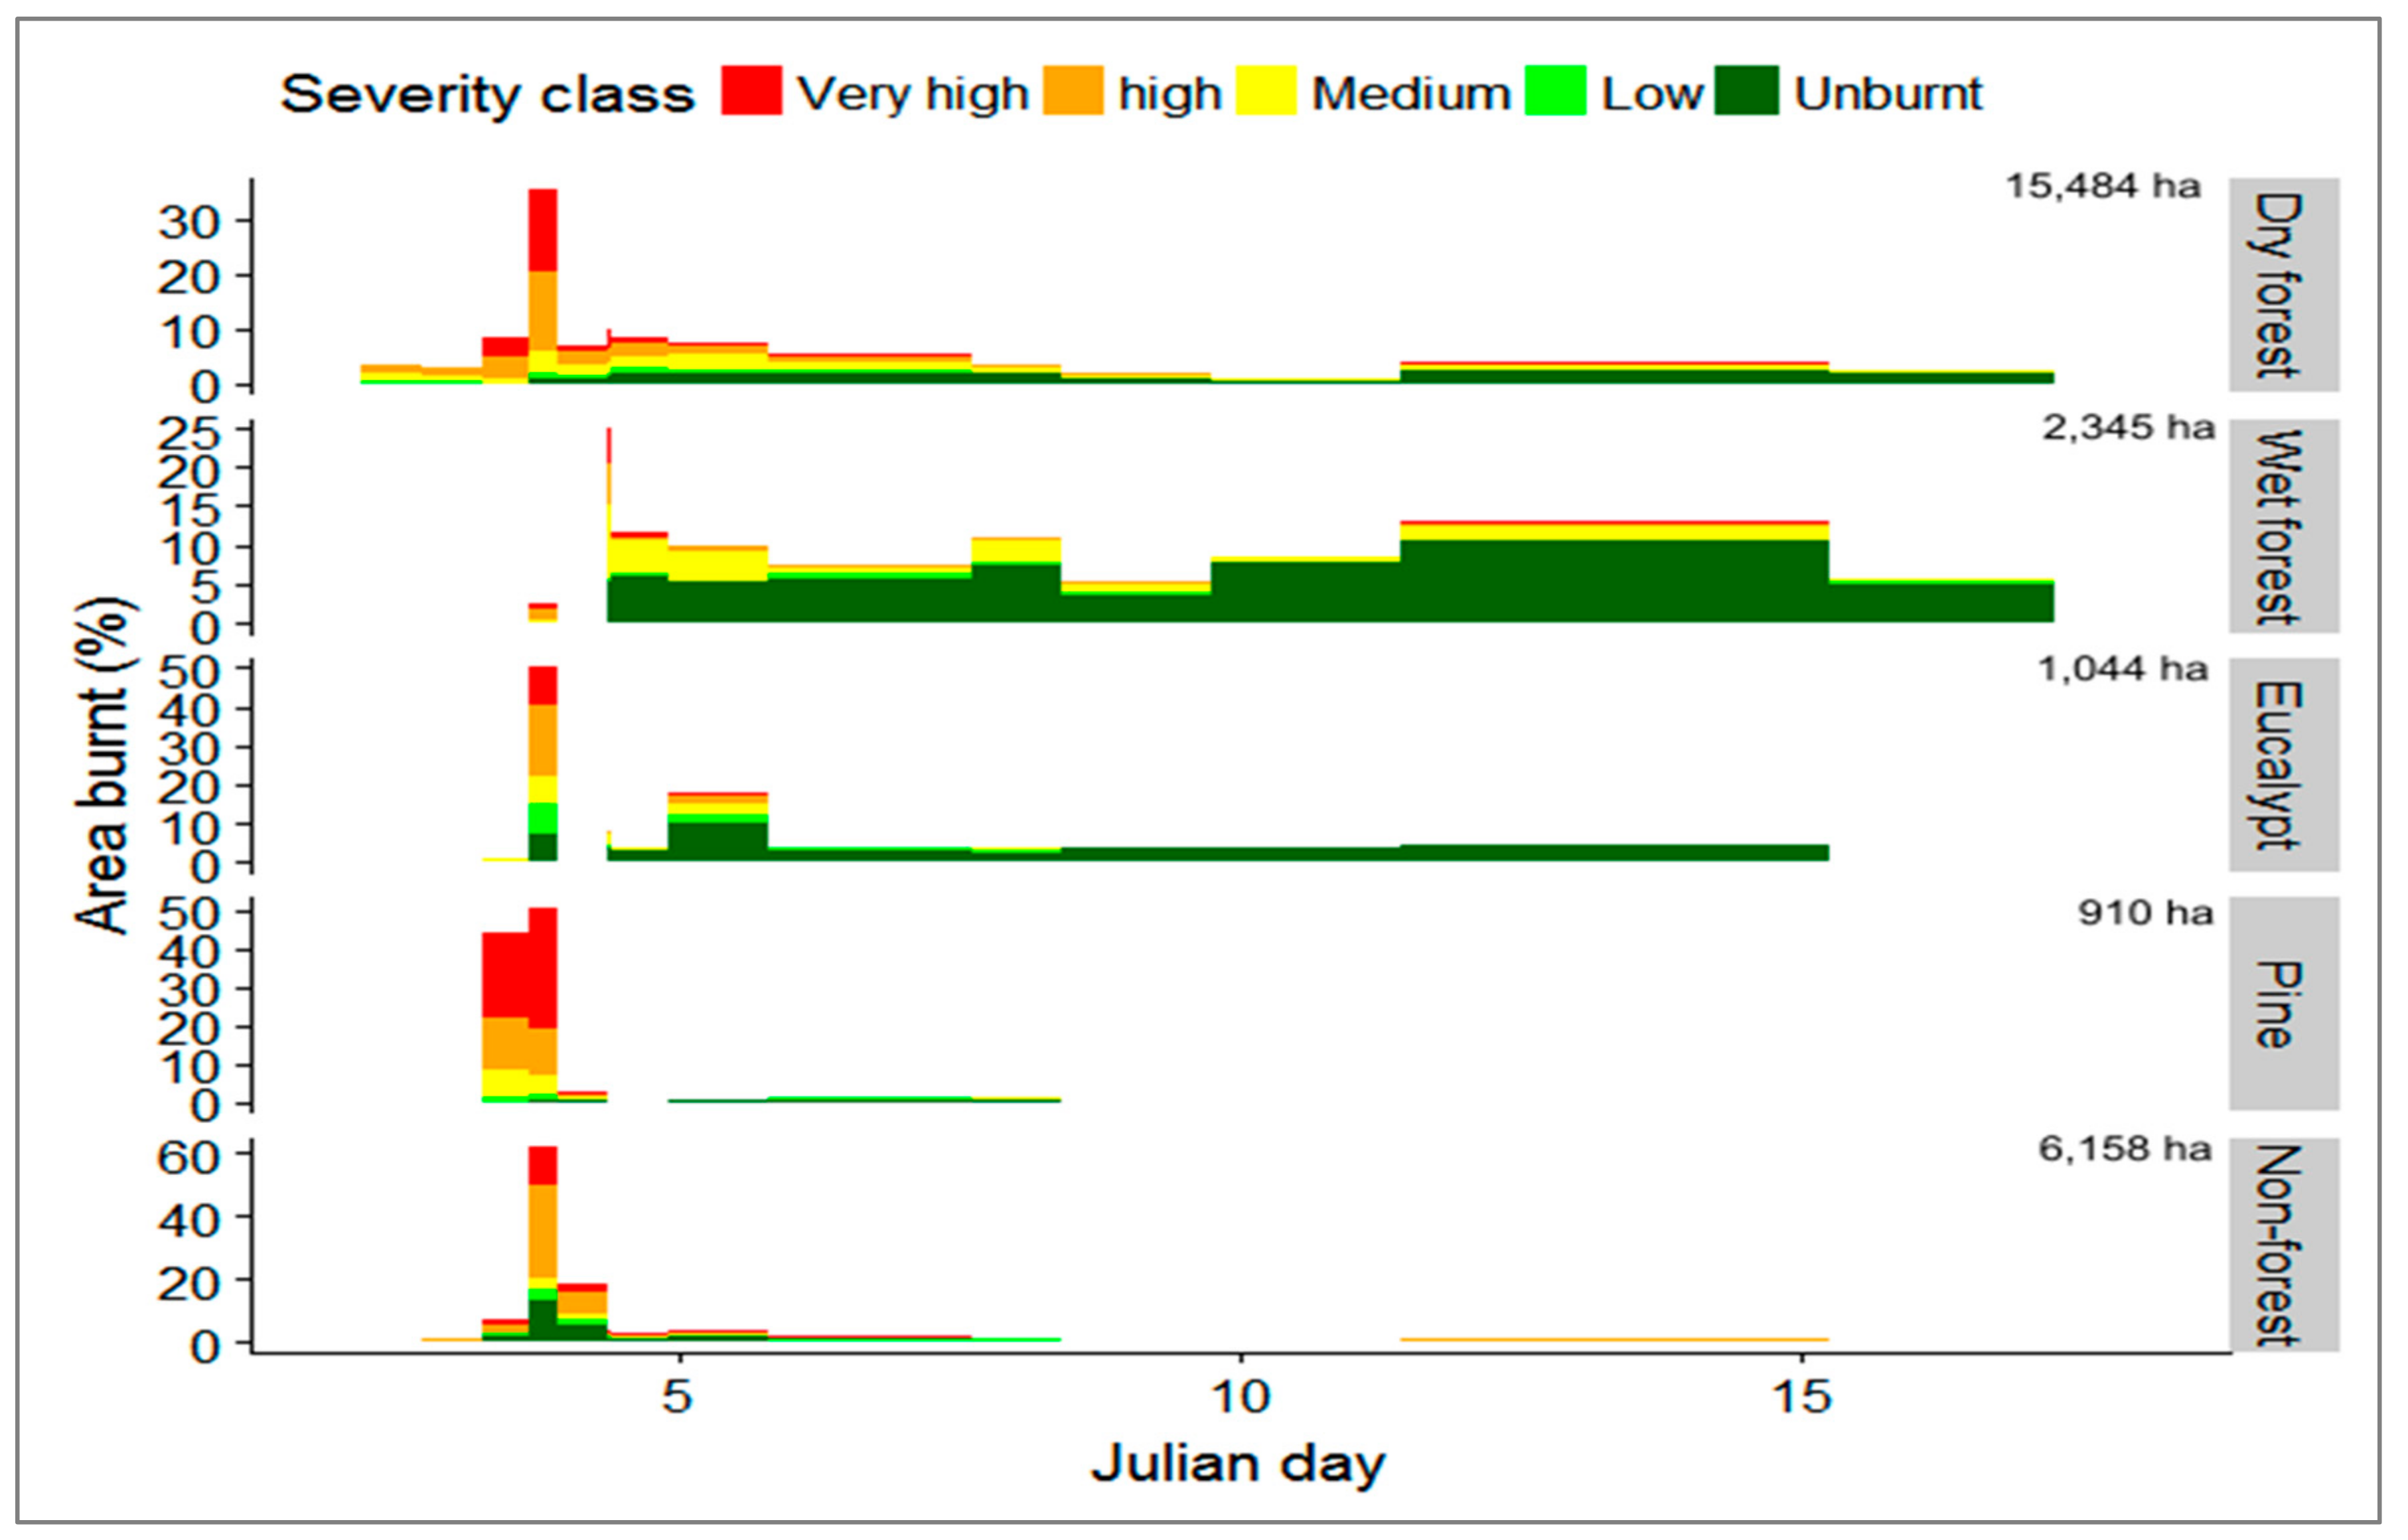
3.3.1. Temporal Patterns of Fire Severity
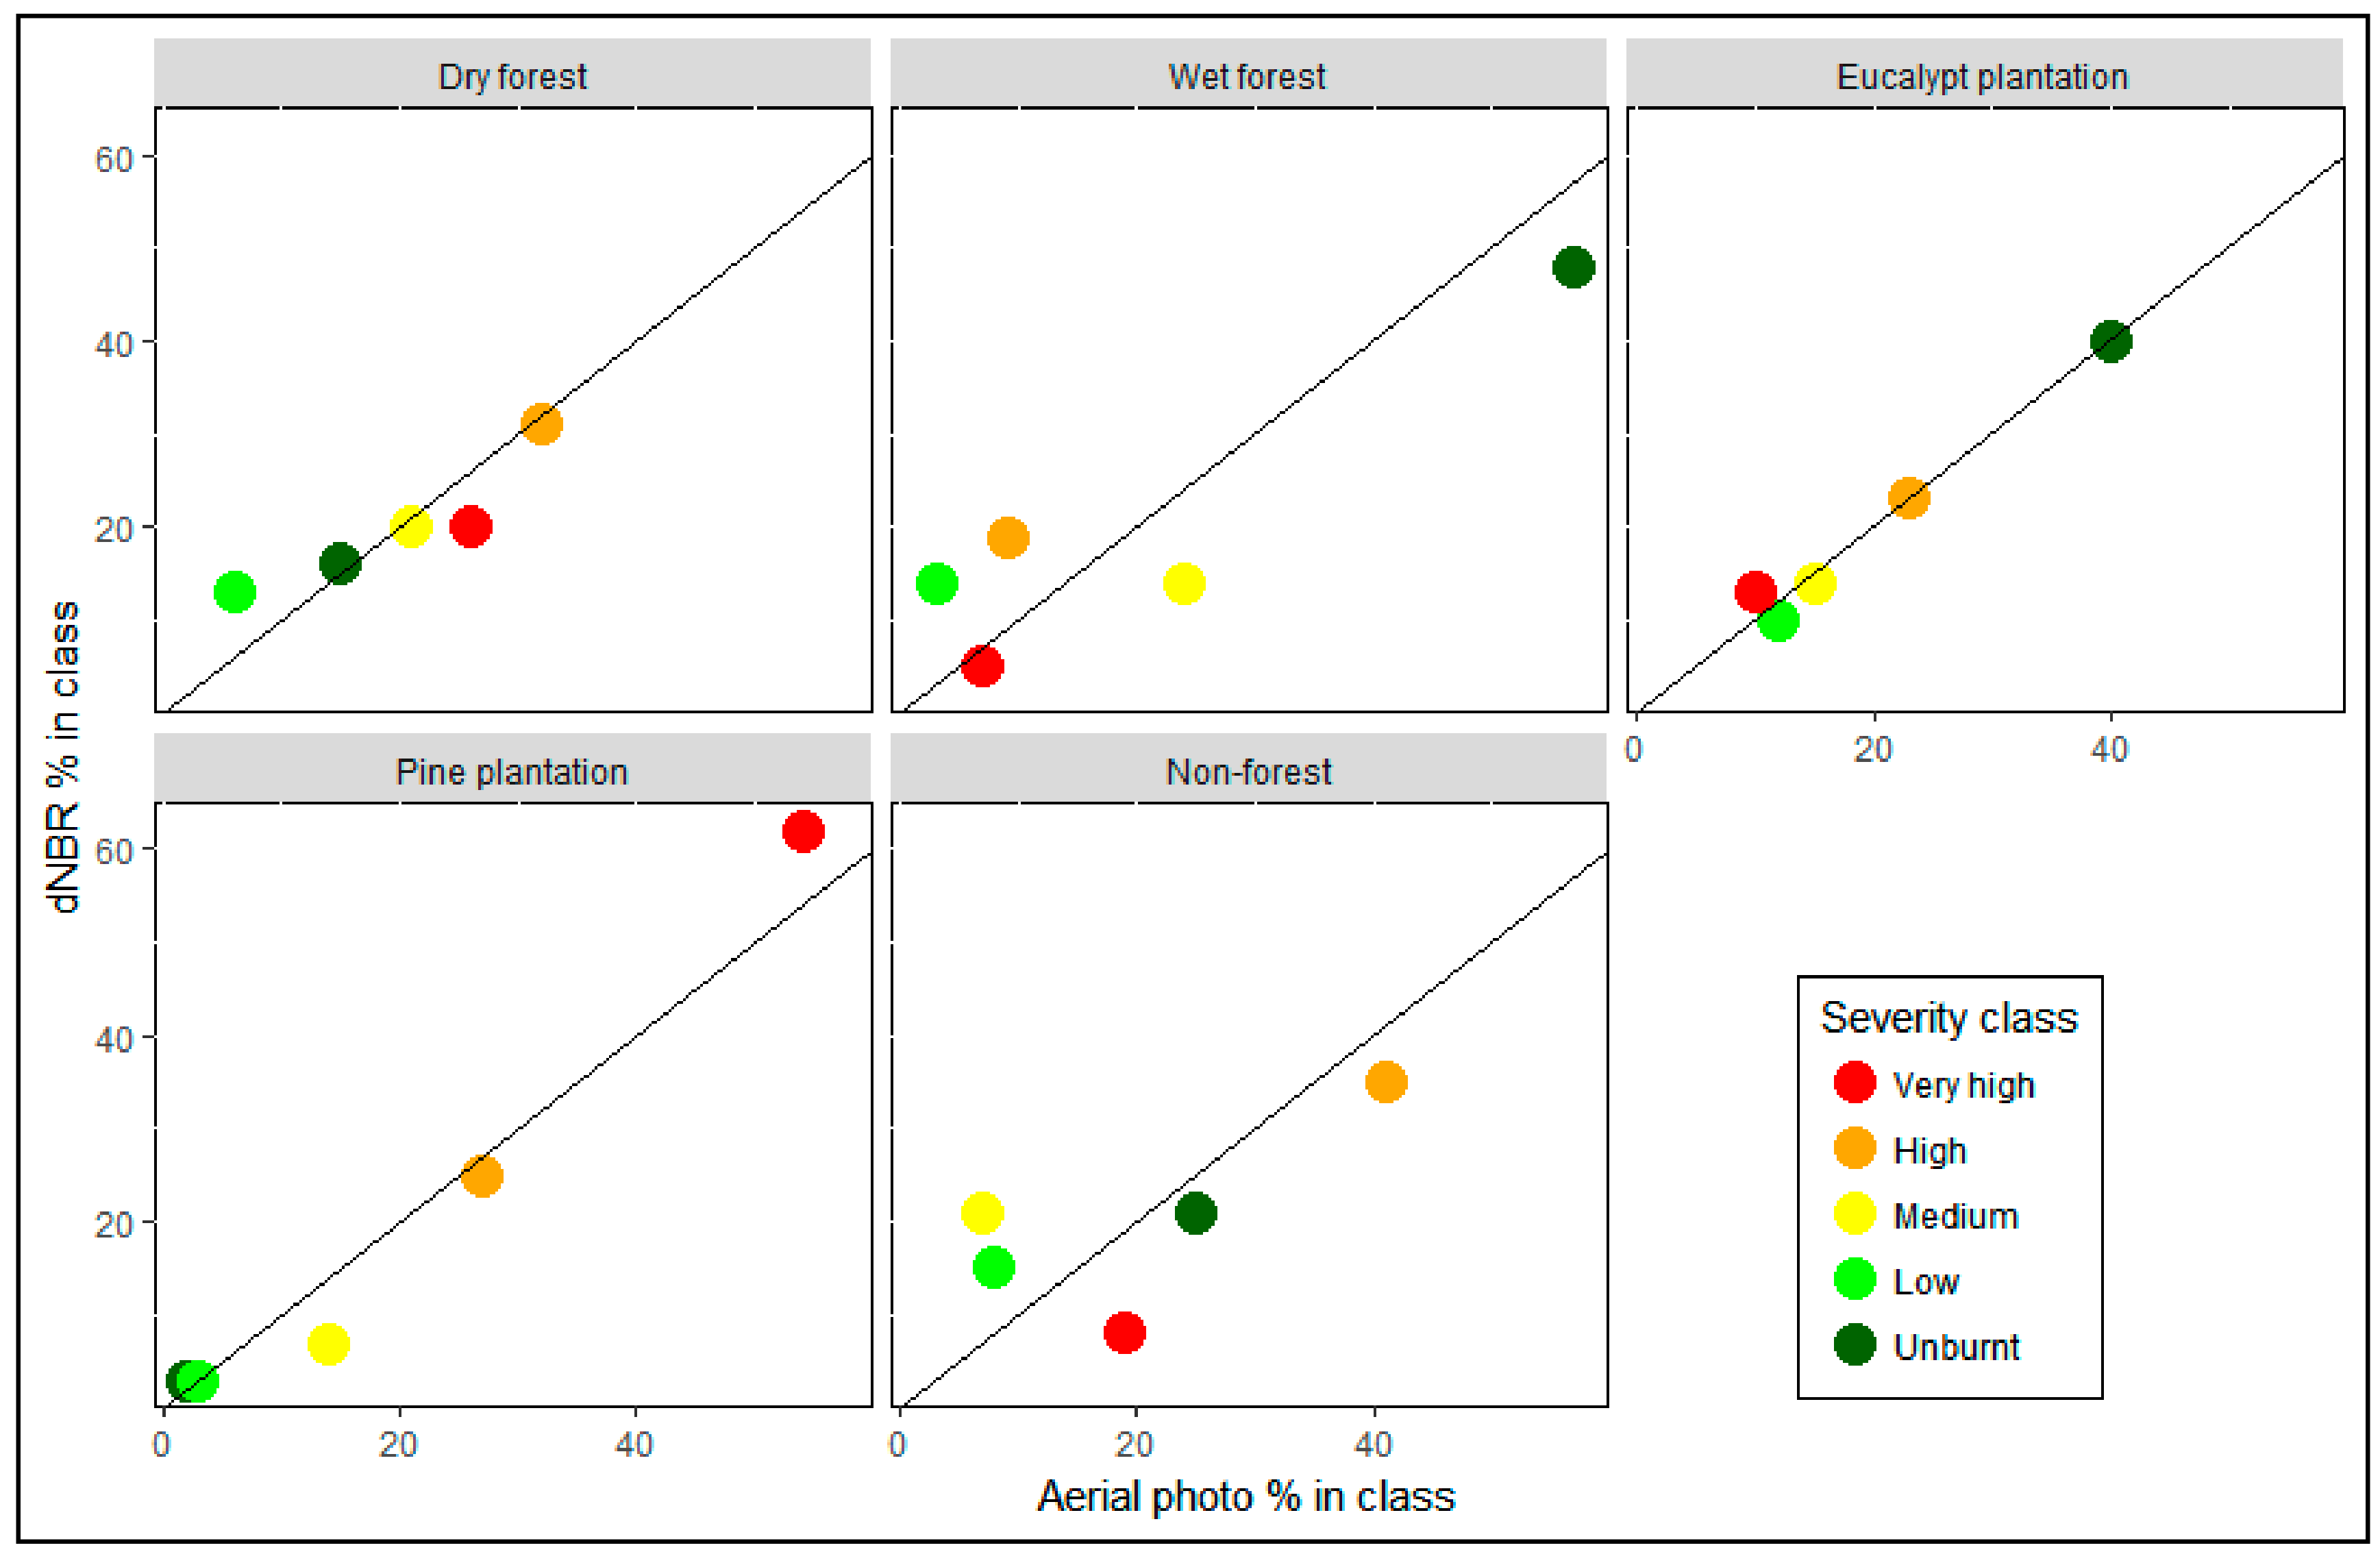
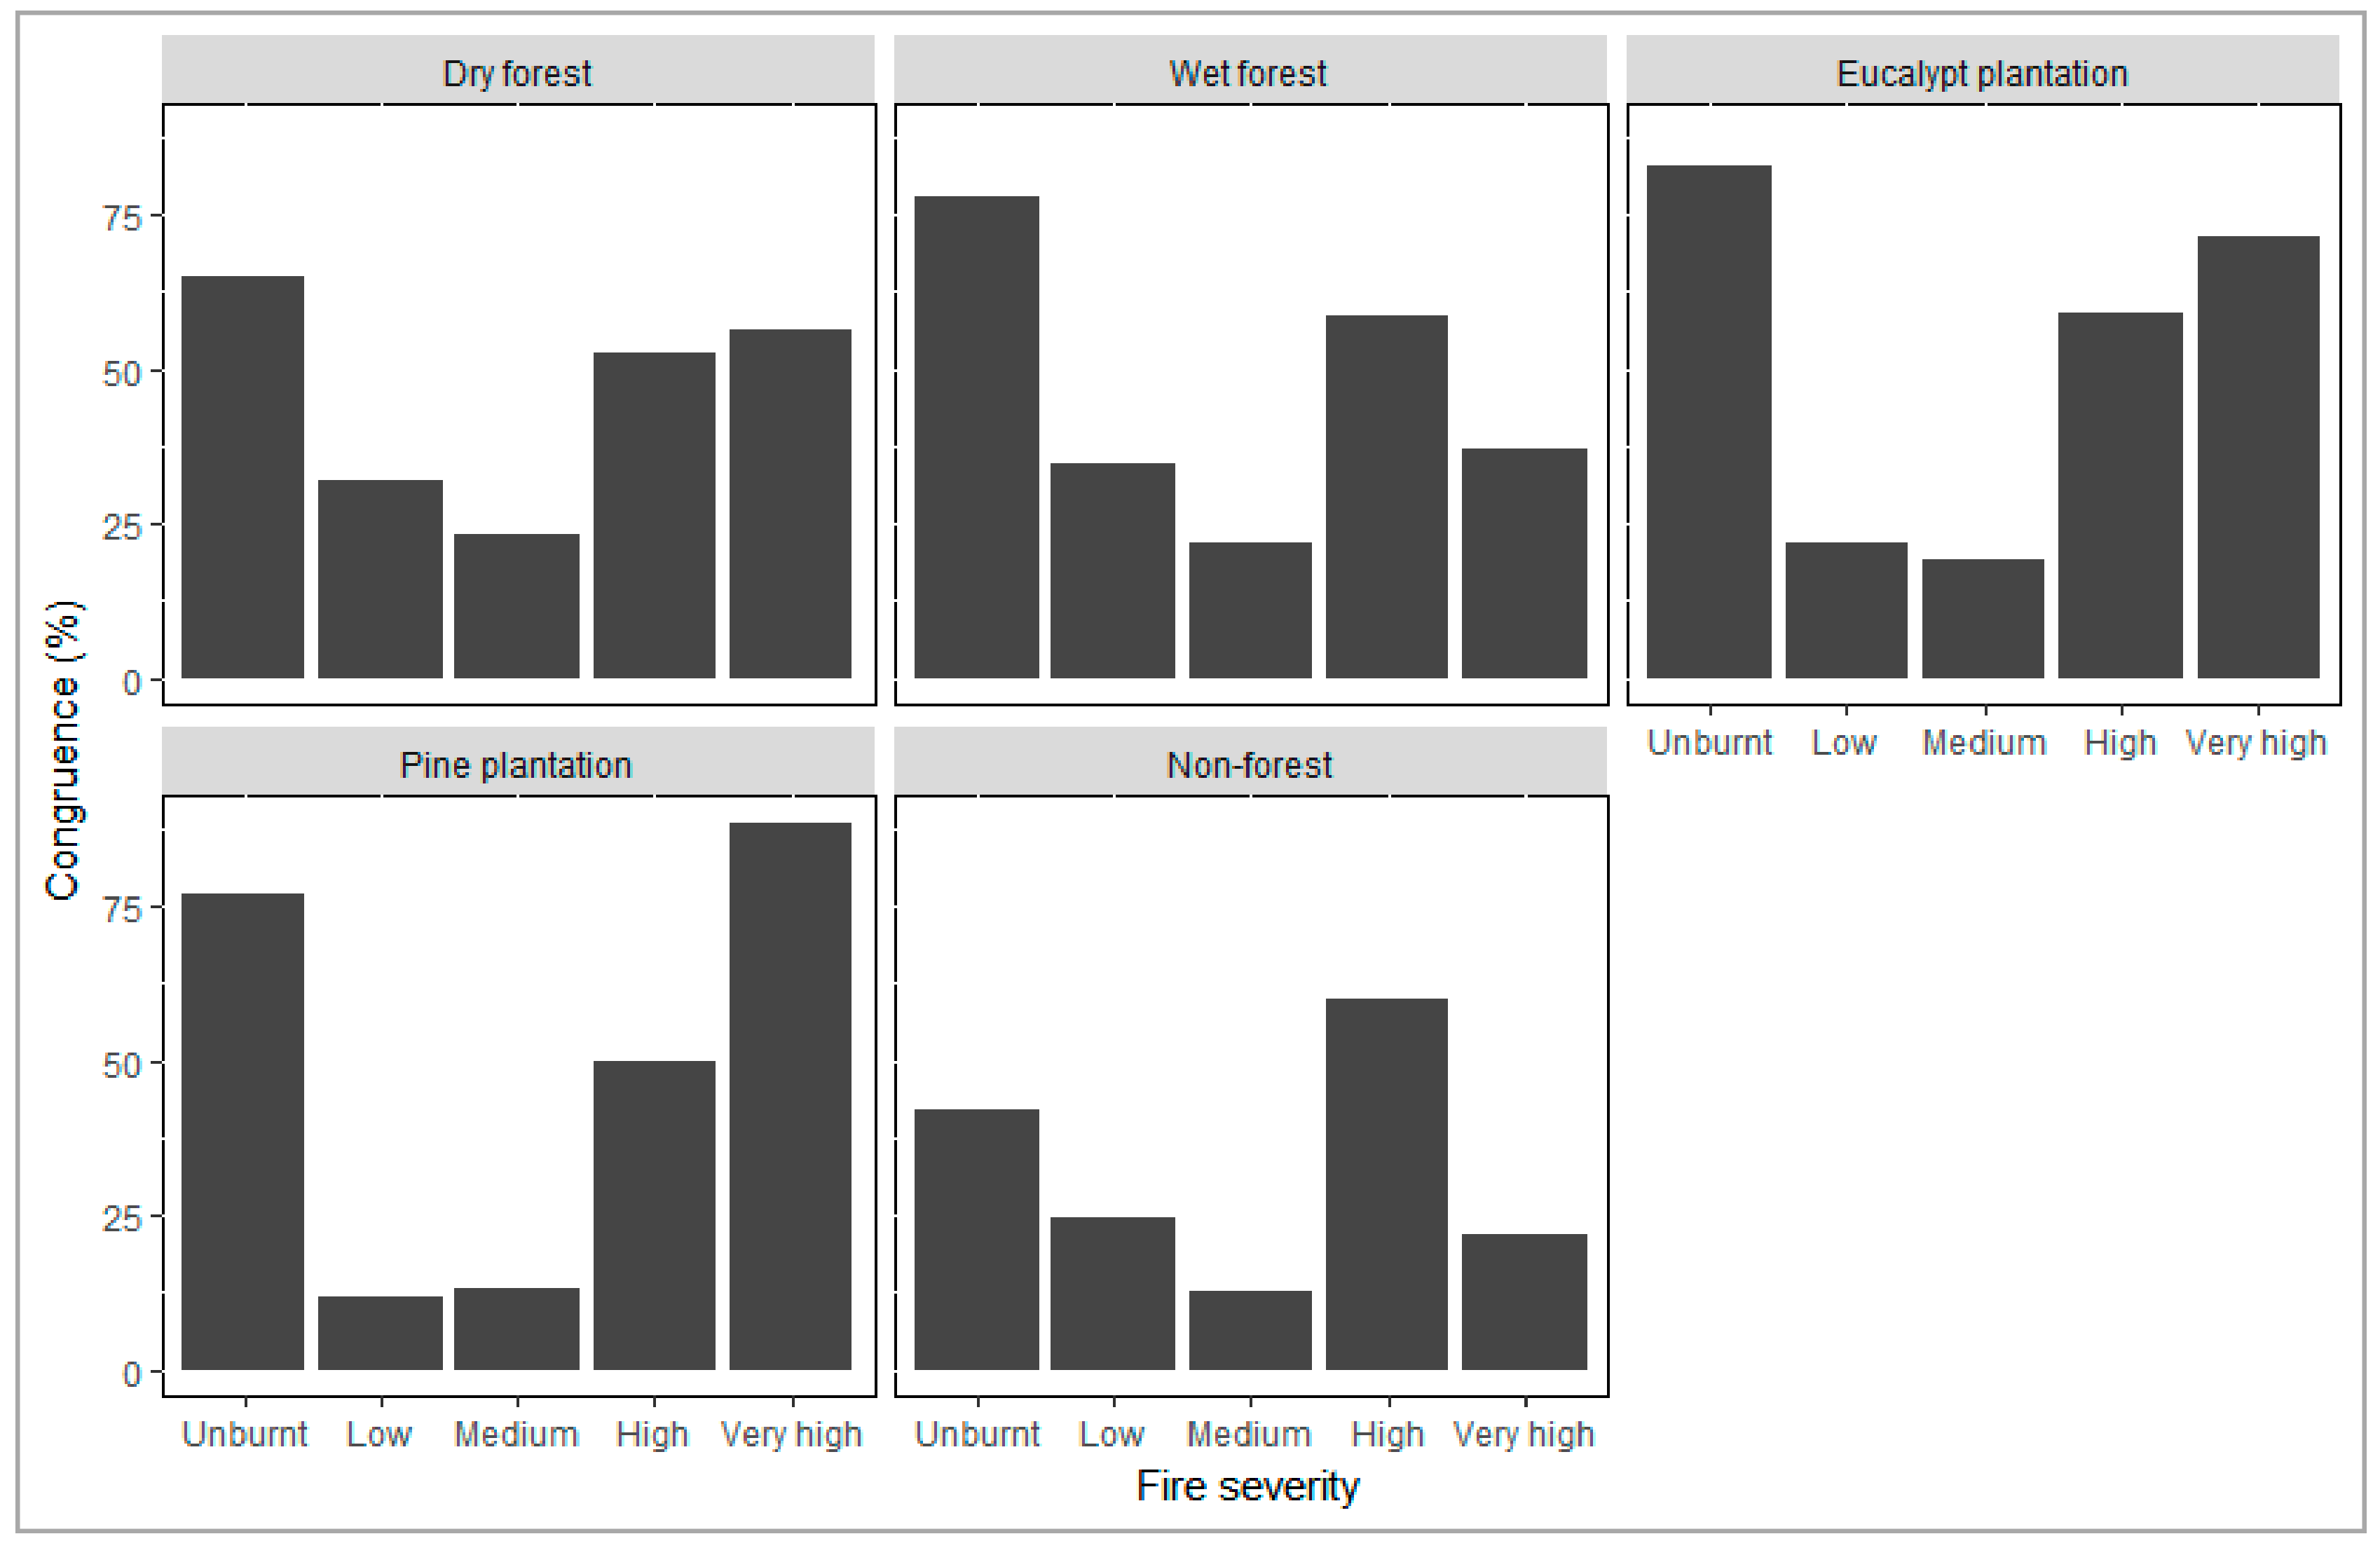
3.3.2. Congruence between Aerial and Satellite Fire Severity Maps
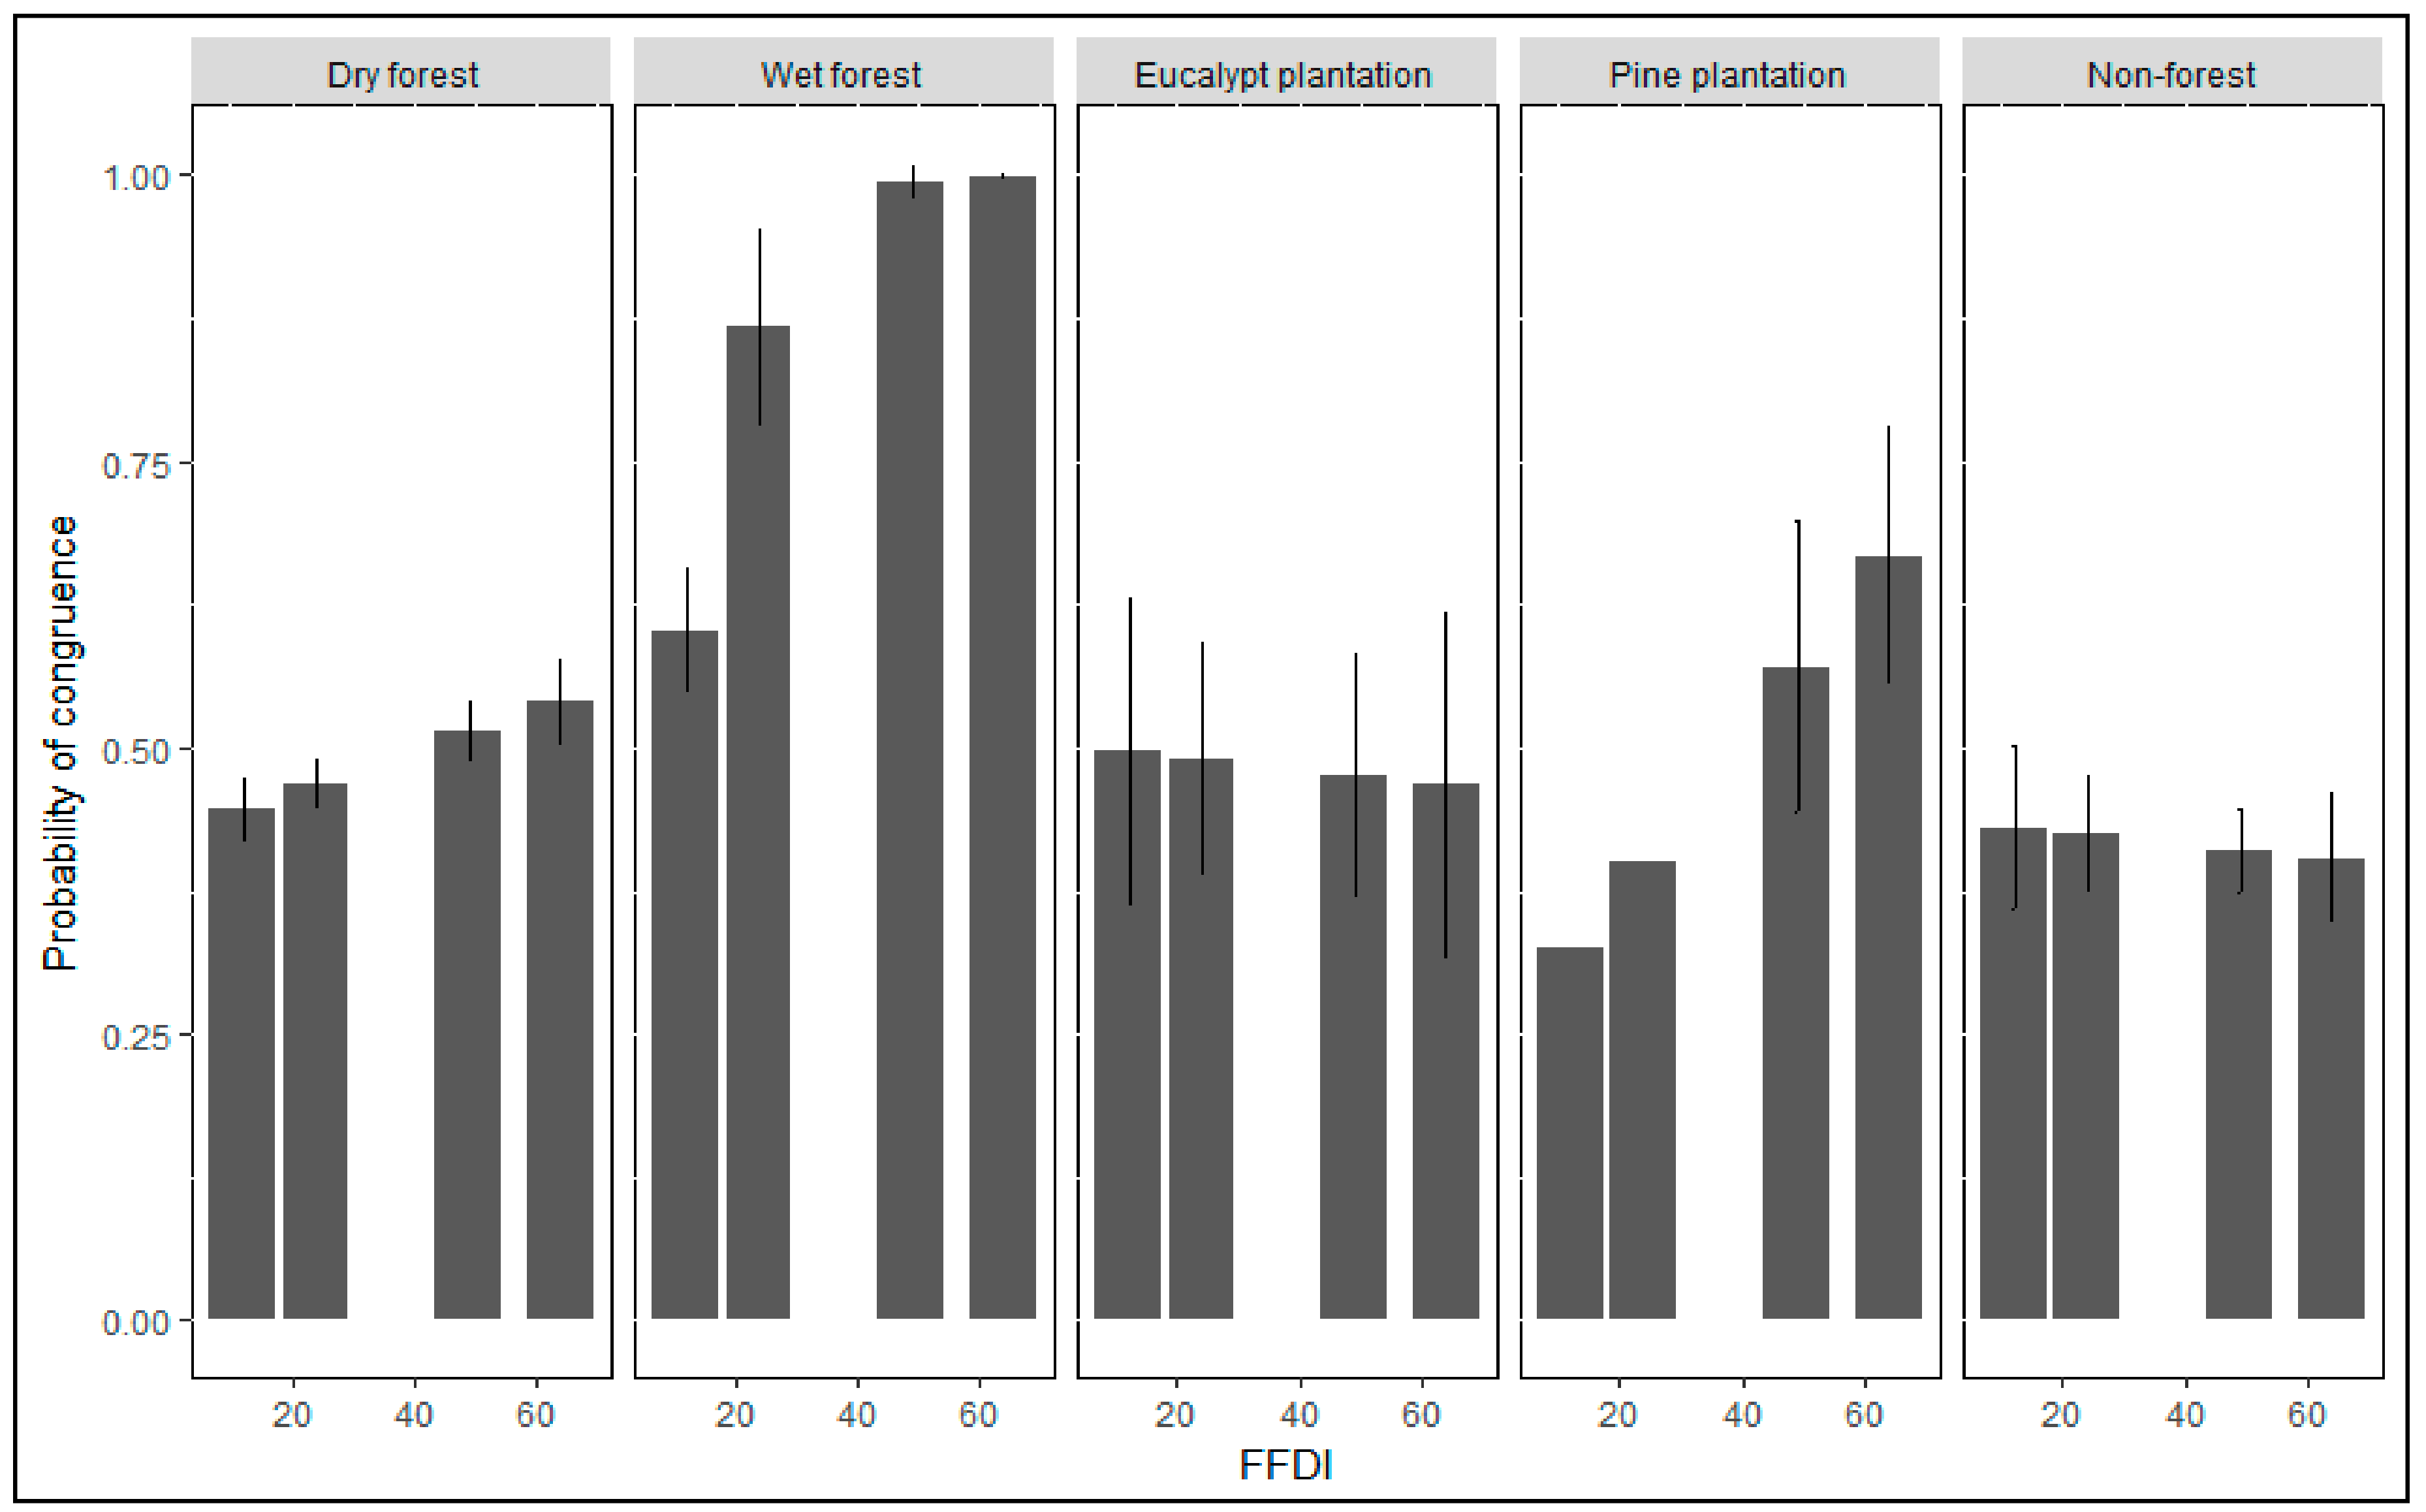
3.3.3. Statistical Results of Landscape Controls of Fire Severity
4. Discussion
5. Conclusions
Supplementary Materials
Author Contributions
Funding
Acknowledgments
Conflicts of Interest
References
- Cary, G.J.; Bradstock, R.A.; Gill, A.M.; Williams, R.J. Global Change and Fire Regimes in Australia; CSIRO Publishing: Collingwood, Australia, 2012. [Google Scholar]
- Bowman, D.M.J.S.; Murphy, B.P.; Burrows, G.E.; Crisp, M.D. Fire regimes and the evolution of the Australian biota. In Flammable Australia: Fire Regimes, Biodiversity and Ecosystems in a Changing World; Bradstock, R.A., Gill, A.M.J., Williams, R., Eds.; CSIRO Publishing: Collingwood, Australia, 2012; pp. 27–47. [Google Scholar]
- Keeley, J.E. Fire intensity, fire severity and burn severity: A brief review and suggested usage. Int. J. Wildland Fire 2009, 18, 116–126. [Google Scholar] [CrossRef]
- Lentile, L.B.; Holden, Z.A.; Smith, A.M.S.; Falkowski, M.J.; Hudak, A.T.; Morgan, P.; Lewis, S.A.; Gessler, P.E.; Benson, N.C. Remote sensing techniques to assess active fire characteristics and post-fire effects. Int. J. Wildland Fire 2006, 15, 319–345. [Google Scholar] [CrossRef]
- Conard, S.G.; Sukhinin, A.I.; Stocks, B.J.; Cahoon, D.R.; Davidenko, E.P.; Ivanova, G.A. Determining effects of area burned and fire severity on carbon cycling and emissions in Siberia. Clim. Chang. 2002, 55, 197–211. [Google Scholar] [CrossRef]
- Taylor, C.; McCarthy, M.A.; Lindenmayer, D.B. Nonlinear effects of stand age on fire severity. Conserv. Lett. 2014, 7, 355–370. [Google Scholar] [CrossRef]
- Lindenmayer, D.B.; Blanchard, W.; McBurney, L.; Blair, D.; Banks, S.C.; Driscoll, D.; Smith, A.L.; Gill, A.M. Fire severity and landscape context effects on arboreal marsupials. Biol. Conserv. 2013, 167, 137–148. [Google Scholar] [CrossRef]
- Price, O.; Bradstock, R. Landscape scale influences of forest area and housing density on house loss in the 2009 Victorian bushfires. PLoS ONE 2013, 8, e73421. [Google Scholar] [CrossRef] [PubMed]
- Perez-Cabello, F.; Echeverria, M.T.; Ibarra, P.; de la Riva, J. Effects of fire on vegetation, soil and hydrogeomorphological behaviour in Mediterranean Ecosystems. In Remote Sensing of Burn Severity. Earth Observation of Wildland Fires in Mediterranean Ecosystems; Chuvieco, E., Ed.; Springer: Berlin/Heidelberg, Germany, 2009; pp. 111–170. [Google Scholar]
- Hammill, K.A.; Bradstock, R.A. Remote sensing of fire severity in the Blue Mountains: Influence of vegetation type and inferring fire intensity. Int. J. Wildland Fire 2006, 15, 213–226. [Google Scholar] [CrossRef]
- Cochrane, M.A.; Alencar, A.; Schulze, M.D.; Souza, C.M.; Nepstad, D.C.; Lefebvre, P.; Davidson, E.A. Positive feedbacks in the fire dynamic of closed canopy tropical forests. Science 1999, 284, 1832–1835. [Google Scholar] [CrossRef] [PubMed]
- Byram, G.M. Combustion of forest fuels. In Forest Fire Control and Use; Davis, K.P., Ed.; McGraw-Hill: NewYork, NY, USA, 1959; pp. 61–89. [Google Scholar]
- Noble, J. Behaviour of a very fast grassland wildfire on the riverine plain of Southeastern Australia. Int. J. Wildland Fire 1991, 1, 189–196. [Google Scholar] [CrossRef]
- Keane, R.E.; Morgan, P.M.; Dillon, G.K.; Sikkink, P.G.; Karau, E.C.; Holden, Z.A.; Drury, S.A. A Fire Severity Mapping System for RealTime Fire Management Applications and LongTerm Planning: The FIRESEV Project; JFSP Research Project Reports. JFSP-09-1-07-4; JFSP: Boise, ID, USA, 2013. [Google Scholar]
- Loschiavo, J.; Cirulis, B.; Zuo, Y.; Hradsky, B.A.; Di Stefano, J. Mapping prescribed fire severity in south-east Australian eucalypt forests using modelling and satellite imagery: A case study. Int. J. Wildland Fire 2017, 26, 491–497. [Google Scholar] [CrossRef]
- Key, C.H.; Benson, N. Landscape Assessment (LA). FIREMON: Fire Effects Monitoring and Inventory System; U.S. Department of Agriculture, Forest Service, Rocky Mountain Research Station: Fort Collins, CO, USA, 2006; p. LA-1-55.
- Rouse, J.W., Jr.; Haas, R.; Schell, J.; Deering, D. Monitoring Vegetation Systems in the Great Plains with ERTS; Texas A&M Univ.: College Station, TX, USA, 1974. [Google Scholar]
- Van Wagtendonk, J.W.; van Wagtendonk, K.A.; Thode, A.E. Factors associated with the severity ofintersecting fires in Yosemite National Park, California, US. Fire Ecol. 2012, 8, 11–31. [Google Scholar] [CrossRef]
- Miller, J.D.; Thode, A.E. Quantifying burn severity in a heterogeneous landscape with a relative version of the delta Normalized Burn Ratio (dNBR). Remote Sens. Environ. 2007, 109, 66–80. [Google Scholar] [CrossRef]
- Picotte, J.J.; Peterson, B.E.; Meier, G.; Howard, S.M. 1984–2010 trends in fire burn severity and area for the conterminous US. Int. J. Wildland Fire 2016, 25, 413–420. [Google Scholar] [CrossRef]
- Parks, S.; Dillon, G.; Miller, C. A new metric for quantifying burn severity: The Relativized Burn Ratio. Remote Sens. 2014, 6, 1827–1844. [Google Scholar] [CrossRef]
- Lydersen, J.M.; North, M.P.; Collins, B.M. Severity of an uncharacteristically large wildfire, the Rim Fire, in forests with relatively restored frequent fire regimes. For. Ecol. Manag. 2014, 328, 326–334. [Google Scholar] [CrossRef] [Green Version]
- Coppoletta, M.; Merriam, K.E.; Collins, B.M. Post-fire vegetation and fuel development influences fire severity patterns in reburns. Ecol. Appl. 2016, 26, 686–699. [Google Scholar] [CrossRef] [PubMed] [Green Version]
- Smith, A.M.S.; Wooster, M.J.; Drake, N.A.; Dipotso, F.M.; Falkowski, M.J.; Hudak, A.T. Testing the potential of multi-spectral remote sensing for retrospectively estimating fire severity in African Savannahs. Remote Sens. Environ. 2005, 97, 92–115. [Google Scholar] [CrossRef]
- Roy, D.P.; Boschetti, L.; Trigg, S.N. Remote Sensing of fire severity: Assessing the performance of the Normalized Burn Ratio. IEEE Geosci. Remote Sens. 2006, 3, 112–116. [Google Scholar] [CrossRef]
- Edwards, A.C.; Maier, S.W.; Hutley, L.B.; Williams, R.J.; Russell-Smith, J. Spectral analysis of fire severity in north Australian tropical savannas. Remote Sens. Environ. 2013, 136, 56–65. [Google Scholar] [CrossRef]
- Escuin, S.; Navarro, R.; Fernandez, P. Fire severity assessment by using NBR (Normalized Burn Ratio) and NDVI (Normalized Difference Vegetation Index) derived from LANDSAT TM/ETM images. Int. J. Remote Sens. 2008, 29, 1053–1073. [Google Scholar] [CrossRef]
- Oliveras, I.; Gracia, M.; More, G.; Retana, J. Factors influencing the pattern of fire severities in a large wildfire under extreme meteorological conditions in the Mediterranean basin. Int. J. Wildland Fire 2009, 18, 755–764. [Google Scholar] [CrossRef]
- Lozano, F.J.; Suárez-Seoane, S.; de Luis, E. Assessment of several spectral indices derived from multi-temporal Landsat data for fire occurrence probability modelling. Remote Sens. Environ. 2007, 107, 533–544. [Google Scholar] [CrossRef] [Green Version]
- Lecina-Diaz, J.; Alvarez, A.; Retana, J. Extreme fire severity patterns in topographic, convective and wind-driven historical wildfires of Mediterranean pine forests. PLoS ONE 2014, 9, e85127. [Google Scholar] [CrossRef] [PubMed] [Green Version]
- Allen, J.L.; Sorbel, B. Assessing the differenced Normalized Burn Ratios ability to map burn severity in the boreal forest and tundra ecosystems of Alaskas national parks. Int. J. Wildland Fire 2008, 17, 463–475. [Google Scholar] [CrossRef]
- Hall, R.J.; Freeburn, J.T.; de Groot, W.J.; Pritchard, J.M.; Lynham, T.J.; Landry, R. Remote sensing of burn severity: Experience from western Canada boreal fires. Int. J. Wildland Fire 2008, 17, 476–489. [Google Scholar] [CrossRef]
- Chafer, C.J. A comparison of fire severity measures: An Australian example and implications for predicting major areas of soil erosion. Catena 2008, 74, 235–245. [Google Scholar] [CrossRef]
- Tanase, M.A.; Kennedy, R.; Aponte, C. Fire severity estimation from space: A comparison of active and passive sensors and their synergy for different forest types. Int. J. Wildland Fire 2015, 24, 1062–1075. [Google Scholar] [CrossRef]
- Clarke, P.J.; Knox, K.J.E.; Bradstock, R.A.; Munoz-Robles, C.; Kumar, L. Vegetation, terrain and fire history shape the impact of extreme weather on fire severity and ecosystem response. J. Veg. Sci. 2014, 25, 1033–1044. [Google Scholar] [CrossRef]
- Boer, M.M.; Macfarlane, C.; Norris, J.; Sadler, R.J.; Wallace, J.; Grierson, P.F. Mapping burned areas and burn severity patterns in SW Australian eucalypt forest using remotely-sensed changes in leaf area index. Remote Sens. Environ. 2008, 112, 4358–4369. [Google Scholar] [CrossRef]
- Chafer, C.J.; Noonan, M.; Macnaught, E. The post-fire measurement of fire severity and intensity in the Christmas 2001 Sydney wildfires. Int. J. Wildland Fire 2004, 13, 227–240. [Google Scholar] [CrossRef]
- Greg, M.; Kangmin, M.; Luke, S. Mapping fire severity and fire extent in forest in Victoria for ecological and fuel outcomes. Ecol. Manag. Restor. 2017, 18, 54–65. [Google Scholar] [Green Version]
- Demaria, E.M.C. Challenges of Remote Sensing validation. In Earth Observation for Water Resources Management: Current Use and Future Opportunities for the Water Sector; World Bank: Washington, DC, USA, 2016; pp. 167–171. [Google Scholar]
- Soto-Berelov, M.; Jones, S.; Farmer, E.; Woodgate, W. Review of validation standards of Earth Observation derived biophysical products. In AusCover Good Practice Guidelines: A Technical Handbook Supporting Calibration and Validation Activities of Remotely Sensed Data Products, 11th ed.; Held, A., Phinn, S., Soto-Berelov, M., Jones, S., Eds.; TERN AusCover: Canberra, Australia, 2015. [Google Scholar]
- Barrett, T.W. Modelling burn severity for the 2003 NSW/ACT wildfires using Landsat imagery. In Proceedings of the Bushfire Conference 2006. Life In A Fire-Prone Environment: Translating Science Into Practice, Brisbane, Australia, 6–9 June 2006. [Google Scholar]
- Storey, M.; Price, O.; Tasker, E. The role of weather, past fire and topography in crown fire occurrence in eastern Australia. Int. J. Wildland Fire 2016, 25, 1048–1060. [Google Scholar] [CrossRef]
- Bowman, D.M.; Williamson, G.J.; Prior, L.D.; Murphy, B.P. The relative importance of intrinsic and extrinsic factors in the decline of obligate seeder forests. Glob. Ecol. Biogeogr. 2016, 25, 1166–1172. [Google Scholar] [CrossRef] [Green Version]
- Bassett, O.D.; Prior, L.D.; Slijkerman, C.M.; Jamieson, D.; Bowman, D.M.J.S. Aerial sowing stopped the loss of alpine ash (Eucalyptus delegatensis) forests burnt by three short-interval fires in the Alpine National Park, Victoria, Australia. For. Ecol. Manag. 2015, 342, 39–48. [Google Scholar] [CrossRef]
- Hill, K.J.; Santoso, A.; England, M.H. Interannual Tasmanian rainfall variability associated with large-scale climate modes. J. Clim. 2009, 22, 4383–4397. [Google Scholar] [CrossRef]
- Bureau of Meteorology. 2013 Tasmanian Bushfires Inquiry; Bureau of Meteorology: Hobart, Australia, 2013. [Google Scholar]
- Marsden-Smedley, J. Tasmanian Wildfires January-February 2013: Forcett-Dunalley, Repulse, Bicheno, Giblin River, Montumana, Molesworth and Gretna; Bushfire Cooperative Research Centre: East Melbourne, Australia, 2014. [Google Scholar]
- Firestorm: The story of the bushfire at Dunalley. The Guardian, 23 May 2013. Available online: https://www.theguardian.com/world/interactive/2013/may/26/firestorm-bushfire-dunalley-holmes-family(accessed on 21 June 2018).
- Kitchener, A.; Harris, S. From Forest to Fjaeldmark: Descriptions of Tasmania’s Vegetation; Department Of Primary Industries Parks Water & Environment: Tasmania, Australia, 2013. [Google Scholar]
- United States Geological Survey. SLC-Off Products: Background. Available online: https://landsat.usgs.gov/slc-products-background (accessed on 2 May 2018).
- Hijmans, R.J. Raster: Geographic Data Analysis and Modeling. R Package Version 2.5-8. Available online: https://CRAN.R-project.org/package=raster (accessed on 2 June 2016).
- Weiss, A. Topographic position and landforms analysis. Presented at the ESRI User Conferencee, San Diego, CA, USA, 9–13 July 2001. Available online: http://www.jennessent.com/downloads/TPI-poster-TNC_18x22.pdf (accessed on 13 September 2018).
- Jakob, D.; Su, C.-H.; Eizenberg, N.; Kociuba, G.; Steinle, P.; Fox-Hughes, P.; Bettio, L. An atmospheric high-resolution regional reanalysis for Australia. Bull. Aust. Meteorol. Oceanogr. Soc. 2017, 30, 16–23. [Google Scholar]
- Bureau of Meteorology. Maps and Gridded Spatial Data. Available online: http://www.bom.gov.au/climate/data-services/maps.shtml (accessed on 3 May 2018).
- ESRI. ArcGIS Desktop: Release 10.3; Environmental Systems Research Institute: Redlands, CA, USA, 2015. [Google Scholar]
- Hexagon Geospatial. ERDAS Imagine 2016; Hexagon AB: Stockholm, Sweden, 2016. [Google Scholar]
- R Core Team. R: A Language and Environment for Statistical Computing; R Foundation for Statistical Computing: Vienna, Austria, 2017. [Google Scholar]
- Plucinski, M.P.; Sullivan, A.L.; Rucinski, C.J.; Prakash, M. Improving the reliability and utility of operational bushfire behaviour predictions in Australian vegetation. Environ. Model. Softw. 2017, 91, 1–12. [Google Scholar] [CrossRef]
- Cheney, N.P.; Gould, J.S.; McCaw, W.L.; Anderson, W.R. Predicting fire behaviour in dry eucalypt forest in southern Australia. For. Ecol. Manag. 2012, 280, 120–131. [Google Scholar] [CrossRef]
- Sneeuwjagt, R.J.; Peet, G.B. Forest Fire Behaviour Tables for Western Australia, 3rd ed.; Department of Conservation and Land Management: Perth, Australia, 1985. [Google Scholar]
- Cruz, M.G.; Alexander, M.E.; Fernandes, P.A.M. Development of a model system to predict wildfire behaviour in pine plantations. Aust. For. 2008, 71, 113–121. [Google Scholar] [CrossRef] [Green Version]
- Cruz, M.G.; Gould, J.S.; Alexander, M.E.; Sullivan, A.L.; McCaw, W.L.; Matthews, S. A Guide to Rate of Fire Spread Models for Australian Vegetation; CSIRO Land and Water Flagship: Canberra, Australia; AFAC: Melbourne, Australia, 2015. [Google Scholar]
- Bresnehan, S.J. An Assessment of Fuel Characteristics and Fuel Loads in the Dry Sclerophyll Forests of South-East Tasmania. Ph.D. Thesis, University of Tasmania, Hobart, Australia, 2003. [Google Scholar]
- Hirsch, K.; Martell, D. A Review of initial attack fire crew productivity and effectiveness. Int. J. Wildland Fire 1996, 6, 199–215. [Google Scholar] [CrossRef]
- Fernandes, P.M.; Botelho, H.S. A review of prescribed burning effectiveness in fire hazard reduction. Int. J. Wildland Fire 2003, 12, 117–128. [Google Scholar] [CrossRef]
- Cheney, N.P. Predicting Forest Fire Behaviour—The Australian Experienc; The U.S. Man and the Biosphere Program: Paris, France, 1991. [Google Scholar]
- Key, C.H.; Benson, N.C. Landscape Assessment (LA) sampling and analysis methods. In Fire Effects Monitoring and Inventory System; Lutes, D.C., Keane, R.E., Caratti, J.F., Key, C.H., Benson, N.C., Sutherland, S., Gangi, L.J., Eds.; USDA Forest Service, Rocky Mountain Research Station: Ogden, UT, USA, 2006; pp. 1–51. [Google Scholar]
- Lutes, D.C.; Keane, R.E.; Caratti, J.F.; Key, C.H.; Benson, N.C.; Sutherland, S.; Gangi, L.J. FIREMON: Fire Effects Monitoring and Inventory System; U.S. Department of Agriculture, Forest Service, Rocky Mountain Research Station: Fort Collins, CO, USA, 2006. [Google Scholar]
- Burnham, K.P.; Anderson, D.R. Model Selection and Inference: A Practical Information-Theoretic Approach, 2nd ed.; Springer: New York, NY, USA, 2002. [Google Scholar]
- Barton, K. MuMIn: Multi-Model Inference. R Package Version 1.40.4. Available online: https://CRAN.R-project.org/package=MuMIn (accessed on 30 January 2018).
- Richards, S.A.; Whittingham, M.J.; Stephens, P.A. Model selection and model averaging in behavioural ecology: The utility of the IT-AIC framework. Behav. Ecol. Sociobiol. 2011, 65, 77–89. [Google Scholar] [CrossRef]
- Finkele, K.; Mills, G.A. National gridded drought factors and comparison of two soil moisture deficit formulations used in prediction of Forest Fire Danger Index in Australia. Aust. Meteorol. Mag. 2006, 55, 183–197. [Google Scholar]
- CSIRO. Amicus Version 0.5 beta Users’ Guide; CSIRO: Canberra, Australia, 2016. [Google Scholar]
- Bowman, D.M.J.S.; Williamson, G.J.; Abatzoglou, J.T.; Kolden, C.A.; Cochrane, M.A.; Smith, A.M.S. Human exposure and sensitivity to globally extreme wildfire events. Ecol. Evol. 2017, 1, 0058. [Google Scholar] [CrossRef] [PubMed]
- Luke, R.H.; McArthur, A.G. Bushfires in Australia; Australian Government Publishing Service for CSIRO: Canberra, Australia, 1978. [Google Scholar]
- Keeves, A.; Douglas, D.R. Forest fires in South Australia on 16 February 1983 and consequent future forest management aims. Aust. For. 1983, 46, 148–162. [Google Scholar] [CrossRef]
- Mitchell, R.M.; O’Brien, D.M.; Campbell, S.K. Characteristics and radiative impact of the aerosol generated by the Canberra firestorm of January 2003. J. Geophys. Res. Atmos. 2006, 111. [Google Scholar] [CrossRef] [Green Version]
- Fromm, M.; Tupper, A.; Rosenfeld, D.; Servranckx, R.; McRae, R. Violent pyro-convective storm devastates Australia’s capital and pollutes the stratosphere. Geophys. Res. Lett. 2006, 33. [Google Scholar] [CrossRef]
- Tolhurst, K.G.; McCarthy, G. Effect of prescribed burning on wildfire severity: A landscape-scale case study from the 2003 fires in Victoria. Aust. For. 2016, 79, 1–14. [Google Scholar] [CrossRef]
- McRae, R.H.D.; Sharples, J.J.; Fromm, M. Linking local wildfire dynamics to pyroCb development. Nat. Hazards Earth Syst. Sci. 2015, 15, 417–428. [Google Scholar] [CrossRef] [Green Version]
- Cruz, M.G.; Sullivan, A.L.; Gould, J.S.; Sims, N.C.; Bannister, A.J.; Hollis, J.J.; Hurley, R.J. Anatomy of a catastrophic wildfire: The Black Saturday Kilmore East fire in Victoria, Australia. For. Ecol. Manag. 2012, 284, 269–285. [Google Scholar] [CrossRef]
- Peterson, D.A.; Hyer, E.J.; Campbell, J.R.; Fromm, M.D.; Hair, J.W.; Butler, C.F.; Fenn, M.A. The 2013 Rim Fire: Implications for predicting extreme fire spread, pyroconvection, and smoke Emissions. Bull. Am. Meteorol. Soc. 2014, 96, 229–247. [Google Scholar] [CrossRef]
- Nauslar, N.; Abatzoglou, J.; Marsh, P. The 2017 North Bay and Southern California Fires: A Case Study. Fire 2018, 1, 18. [Google Scholar] [CrossRef]
- Rosenfeld, D.; Fromm, M.; Trentmann, J.; Luderer, G.; Andreae, M.O.; Servranckx, R. The Chisholm firestorm: Observed microstructure, precipitation and lightning activity of a pyro-cumulonimbus. Atmos. Chem. Phys. 2007, 7, 645–659. [Google Scholar] [CrossRef]
- Fernandes, P.M.; Barros, A.M.G.; Pinto, A.; Santos, J.A. Characteristics and controls of extremely large wildfires in the western Mediterranean Basin. J. Geophys. Res. Biogeosci. 2016, 121, 2141–2157. [Google Scholar] [CrossRef]
- Gill, A.M.; Moore, P.H.R. Fire intensities in Eucalyptus forests of southeastern Australia. In Proceedings of the International Conference on Forest Fire Research, Coimbra, Portugal, 19–22 November 1990. [Google Scholar]
- Venäläinen, A.; Korhonen, N.; Hyvärinen, O.; Koutsias, N.; Xystrakis, F.; Urbieta, I.R.; Moreno, J.M. Temporal variations and change in forest fire danger in Europe for 1960–2012. Nat. Hazards Earth Syst. Sci. 2014, 14, 1477–1490. [Google Scholar] [CrossRef]
- Hammill, K.; Bradstock, R.A. Spatial patterns of fire behaviour in relation to weather, terrain and vegetation. Proc. R. Soc. Qld. 2008, 115, 127–133. [Google Scholar]
- Abatzoglou, J.T.; Kolden, C.A. Relationships between climate and macroscale area burned in the western United States. Int. J. Wildland Fire 2013, 22, 1003–1020. [Google Scholar] [CrossRef]
- Price, O.F.; Bradstock, R.A. The efficacy of fuel treatment in mitigating property loss during wildfires: Insights from analysis of the severity of the catastrophic fires in 2009 in Victoria, Australia. J. Environ. Manag. 2012, 113, 146–157. [Google Scholar] [CrossRef] [PubMed]
- Veraverbeke, S.; Lhermitte, S.; Verstraeten, W.W.; Goossens, R. The temporal dimension of differenced Normalized Burn Ratio (dNBR) fire/burn severity studies: The case of the large 2007 Peloponnese wildfires in Greece. Remote Sens. Environ. 2010, 114, 2548–2563. [Google Scholar] [CrossRef] [Green Version]
- Birch, D.S.; Morgan, P.; Kolden, C.A.; Abatzoglou, J.T.; Dillon, G.K.; Hudak, A.T.; Smith, A.M.S. Vegetation, topography and daily weather influenced burn severity in central Idaho and western Montana forests. Ecosphere 2015, 6, art17. [Google Scholar] [CrossRef]
- Jones, B.M.; Kolden, C.A.; Jandt, R.; Abatzoglou, J.T.; Urban, F.; Arp, C.D. Fire behavior, weather, and burn severity of the 2007 Anaktuvuk River Tundra Fire, North Slope, Alaska. Arct. Antarct. Alp. Res. 2009, 41, 309–316. [Google Scholar] [CrossRef]
- McRae, R. Extreme Fire—A Handbook; ACT Government and Bushfire Cooperative Research Centre: East Melbourne, Australia, 2010. [Google Scholar]
- Leonard, S.W.J.; Bennett, A.F.; Clarke, M.F. Determinants of the occurrence of unburnt forest patches: Potential biotic refuges within a large, intense wildfire in south-eastern Australia. For. Ecol. Manag. 2014, 314, 85–93. [Google Scholar] [CrossRef]
- Cheney, N.P. The effectiveness of fuel reduction burning for fire management. In Fire and Biodiversity: The Effects and Effectiveness of Fire Management, Proceedings of the Conference, Footscray, Victoria, 8–9 October 1994; Department of the Environment, Sport and Territories, Biodiversity Unit: Canberra, Australia, 1996; pp. 9–16. [Google Scholar]
- Bradstock, R.A.; Hammill, K.A.; Collins, L.; Price, O. Effects of weather, fuel and terrain on fire severity in topographically diverse landscapes of south-eastern Australia. Landsc. Ecol. 2010, 25, 607–619. [Google Scholar] [CrossRef]
- Wood, S.W.; Murphy, B.P.; Bowman, D.M.J.S. Firescape ecology: How topography determines the contrasting distribution of fire and rain forest in the south-west of the Tasmanian Wilderness World Heritage Area. J. Biogeogr. 2011, 38, 1807–1820. [Google Scholar] [CrossRef]
- Alexander, M.E.; Cruz, M.G. Interdependencies between flame length and fireline intensity in predicting crown fire initiation and crown scorch height. Int. J. Wildland Fire 2012, 21, 95–113. [Google Scholar] [CrossRef]
- Kirkpatrick, J.B.; Núñez, M. Vegetation-Radiation Relationships in Mountainous Terrain: Eucalypt-Dominated Vegetation in the Risdon Hills, Tasmania. J. Biogeogr. 1980, 7, 197–208. [Google Scholar] [CrossRef]
- Kumar, L.; Clarke, P.; Muñoz, C.; Knox, K. Mapping of fire severity and comparison of severity indices across vegetation types in Gibraltar Range National Park, Australia. Int. Arch. Photogram. Remote Sens. Spat. Inf. Sci. 2008, 37, 1477–1482. [Google Scholar]
- Harris, S.; Veraverbeke, S.; Hook, S. Evaluating spectral indices for assessing fire severity in chaparral ecosystems (Southern California) using MODIS/ASTER (MASTER) airborne simulator data. Remote Sens. 2011, 3, 2403–2419. [Google Scholar] [CrossRef]
- Brewer, C.K.; Winne, J.C.; Redmond, R.L.; Opitz, D.W.; Mangrich, M.V. Classifying and mapping wildfire severity. Photogramm. Eng. Remote Sens. 2005, 71, 1311–1320. [Google Scholar] [CrossRef]


| Variable | Minimum | Mean | Maximum | Standard Deviation |
|---|---|---|---|---|
| Fire Danger Index (FFDI) | 1.7 | 34 | 63 | 20.3 |
| Temperature (°C) | 15 | 32 | 41 | 8.4 |
| Relative Humidity (%) | 9.6 | 23.7 | 76 | 14.1 |
| Wind speed (km·h−1) | 6 | 29 | 54 | 6.7 |
| Forest Type | Slope (°) | Low-Moderate FFDI | High FFDI | Very High FFDI | Severe FFDI | |
|---|---|---|---|---|---|---|
| Dry forest | Flat | Fintensity | 8363 kW·m−1 | 13,523 | 29,185 | 34,285 |
| Fheight | 7.8 m | 11.1 | 19.4 | 21.8 | ||
| Upslope | Fintensity | 16,725 | 27,046 | 58,370 | 68,571 | |
| Fheight | 13 | 18.3 | 32.1 | 35.9 | ||
| Downslope | Fintensity | 5575 | 9015 | 19,457 | 22,857 | |
| Fheight | 5.9 | 8.3 | 14.5 | 16.2 | ||
| Wet forest | Flat | Fintensity | 4176 | 6819 | 14,174 | 14,962 |
| Fheight | - | - | - | - | ||
| Upslope | Fintensity | 8951 | 14,616 | 30,382 | 32,072 | |
| Fheight | - | - | - | - | ||
| Downslope | Fintensity | 2723 | 4447 | 9243 | 9757 | |
| Fheight | ||||||
| Eucalyptus plantation | Flat | Fintensity | 9426 | 15,796 | 31,316 | 34,315 |
| Fheight | 8.4 | 12.2 | 20.0 | 21.3 | ||
| Upslope | Fintensity | 15,313 | 25,661 | 50,873 | 55,745 | |
| Fheight | 11.9 | 17.3 | 28.3 | 30.3 | ||
| Downslope | Fintensity | 6809 | 11,410 | 22,620 | 24,786 | |
| Fheight | 6.6 | 9.6 | 15.8 | 16.9 | ||
| Pinus plantation | Flat | Fintensity | 2032 | 1940 | 43,070 | 42,932 |
| Fheight | 1.1 | 1.3 | 20.5 | 20.5 | ||
| Upslope | Fintensity | - | - | - | - | |
| Fheight | - | - | - | - | ||
| Downslope | Fintensity | - | - | - | - | |
| Fheight | - | - | - | - |
| 2018 Score | 2013 Fire Severity Class | ||||
|---|---|---|---|---|---|
| Unburnt | Intermittent Crown Scorch | Full Crown Scorch | Intermittent Crown Fire | Crown Fire | |
| Unburnt | 100 (38) | 21 (7) | 0 (0) | 0 (0) | 0 (0) |
| Epicormic resprouts | 0 (0) | 71 (75) | 94 (60) | 64 (46) | 66 (116) |
| Dead | 0 (0) | 8 (4) | 6 (4) | 36 (31) | 34 (49) |
| No. trees | 38 | 86 | 64 | 77 | 165 |
| No. plots | 3 | 7 | 5 | 7 | 14 |
| Dry Forest | Wet Forest | Eucalypt Plantation | Pine Plantation | Non-Forest | |
|---|---|---|---|---|---|
| Unburnt | 15 | 57 | 40 | 2 | 2 |
| Low | 6 | 3 | 12 | 3 | 3 |
| Medium | 21 | 24 | 15 | 14 | 14 |
| High | 32 | 9 | 23 | 27 | 27 |
| Very high | 26 | 7 | 10 | 54 | 54 |
| Area in ha and % of each vegetation | 15,484 | 2345 | 1044 | 910 | 6158 |
| 60% | 9% | 4% | 3% | 24% |
| dNBR Threshold (This Study) | dNBR ML Classification (This Study) | dNBR Threshold (Key & Benson, 2006) | dNDVI Threshold (Hammill & Bradstock, 2006) | |
|---|---|---|---|---|
| All vegetation | 45% (0.33) | 38% (0.19) | 34% (0.17) | 41% (0.26) |
| Dry forest | 48% (0.32) | 47% (0.32) | 36% (0.17) | 44% (0.29) |
| Wet forest | 51% (0.33) | 68% (0.44) | 33% (0.25) | 55% (0.36) |
| Best Models | *K | logLik | AICc | ΔAIC |
|---|---|---|---|---|
| (a) Severity: | ||||
| Raw dNBR~ FFDI:Vegetation +slope + aspect | 8 | 59.7 | −103.4 | 0.00 |
| Raw dNBR~ FFDI:Vegetation + slope | 7 | 58.7 | −103.3 | 0.06 |
| (b) Probability of classification congruence: | ||||
| Cong~ FFDI:Vegetation + raw dNBR + topo | 8 | −1365.2 | 2746.4 | 0.00 |
| Cong~ FFDI:Vegetation + raw dNBR + aspect | 8 | −1366.5 | 2749.1 | 2.73 |
| Cong~ FFDI:Vegetation + raw dNBR | 7 | −1367.6 | 2749.3 | 2.95 |
| Cong~ FFDI:Vegetation + topo | 7 | −1368.4 | 2750.9 | 4.50 |
| Model Parameter | Effect Estimate | Parameter Significance | 2.5% | 97.5% |
|---|---|---|---|---|
| (a) Severity: | ||||
| Slope | −0.002 | * | −0.003 | −0.0002 |
| Aspect | 0.008 | NS | −0.006 | 0.020 |
| FFDI: Dry forest | 0.006 | *** | 0.005 | 0.007 |
| FFDI: Wet forest | −0.001 | NS | −0.004 | 0.002 |
| FFDI: Eucalypt plantation | 0.003 | *** | 0.002 | 0.005 |
| FFDI: Pine plantation | 0.009 | *** | 0.008 | 0.010 |
| FFDI: Non-forest | 0.003 | *** | 0.002 | 0.004 |
| (b) Probability of congruence: | ||||
| Degree of severity (dNBR) | 0.712 | *** | 0.338 | 1.165 |
| Topographic position | −0.038 | NS | −0.103 | 0.0288 |
| FFDI: Dry forest | 0.002 | NS | −0.003 | 0.007 |
| FFDI: Wet forest | 0.052 | *** | 0.024 | 0.082 |
| FFDI: Eucalypt plantation | 0.008 | NS | −0.004 | 0.019 |
| FFDI: Pine plantation | 0.010 | *** | 0.002 | 0.018 |
| FFDI: Non-forest | −0.003 | NS | −0.009 | 0.001 |
© 2018 by the authors. Licensee MDPI, Basel, Switzerland. This article is an open access article distributed under the terms and conditions of the Creative Commons Attribution (CC BY) license (http://creativecommons.org/licenses/by/4.0/).
Share and Cite
Ndalila, M.N.; Williamson, G.J.; Bowman, D.M.J.S. Geographic Patterns of Fire Severity Following an Extreme Eucalyptus Forest Fire in Southern Australia: 2013 Forcett-Dunalley Fire. Fire 2018, 1, 40. https://0-doi-org.brum.beds.ac.uk/10.3390/fire1030040
Ndalila MN, Williamson GJ, Bowman DMJS. Geographic Patterns of Fire Severity Following an Extreme Eucalyptus Forest Fire in Southern Australia: 2013 Forcett-Dunalley Fire. Fire. 2018; 1(3):40. https://0-doi-org.brum.beds.ac.uk/10.3390/fire1030040
Chicago/Turabian StyleNdalila, Mercy N., Grant J. Williamson, and David M. J. S. Bowman. 2018. "Geographic Patterns of Fire Severity Following an Extreme Eucalyptus Forest Fire in Southern Australia: 2013 Forcett-Dunalley Fire" Fire 1, no. 3: 40. https://0-doi-org.brum.beds.ac.uk/10.3390/fire1030040