Contemporary Fire Regimes of the Arid Carnarvon Basin Region of Western Australia


Centre for Ecosystem Management, Edith Cowan University, Joondalup 6027, Perth, Australia
*
Author to whom correspondence should be addressed.
Fire 2018, 1(3), 51; https://0-doi-org.brum.beds.ac.uk/10.3390/fire1030051
Submission received: 8 November 2018
/
Revised: 10 December 2018
/
Accepted: 11 December 2018
/
Published: 14 December 2018
Abstract
:This study investigates the fire regime for the arid Carnarvon Basin region of Western Australia using remotely sensed imagery. A fire history database was constructed from satellite images to characterise the general fire regime and determine any effect of vegetation types and pre-fire weather and climate. The study area was divided into two sections (northern and southern) due to their inherently different vegetation and climate. A total of 23.8% (15,646 km2) of the study area was burnt during the 39-year study period. Heathland vegetation (54%) burnt the most extensively in the southern study area, and hummock grasslands (68%) in the northern. A single, unusually large fire in 2012 followed exceptional rains in the previous 12 months and accounted for 55% of the total burnt area. This fire burnt mainly through Acacia shrublands and woodlands rather than hummock grasslands, as normally experienced in the northern study area. Antecedent rainfall and fire weather were found to be the main meteorological factors driving fire size. Both study areas showed a moderate to strong correlation between fire size and increased pre-fire rainfall in the year preceding the fire. Predicted future changes in climate may lead to more frequent and higher intensity fires.
Keywords:
Acacia shrubland; hummock grassland; arid; semi-arid; fire regime; fire size; remote sensing1. Introduction
Vegetation fires in dry regions can be more extensive than in more populated temperate regions [1,2]. Bushfires of this magnitude, which are often ignited by lightning, may be left to burn if there are few resources and little willingness or need to extinguish them, since they typically pose little threat to life or property [3]. For remote regions with few people and resources, such as much of arid Australia, characterising fire regimes through remote sensing techniques is an important first step in understanding fire impacts and clarifying management priorities [4]. Such techniques help elucidate typical fire pathways and intervals, burn extent and the potential causes of the temporal and spatial patterns of fire. An understanding of the various fire regimes of a region is critical since the characteristics of fire can affect species composition, fuel levels and fire behaviour [5,6].
Fire size is important since large fires contribute most to the total burn area even though they may be relatively rare occurrences [3,7,8]. For this reason, the median size of fires is an important variable as outliers of fire size can significantly alter the mean fire size, which is not always recognised in the literature. Satellite imagery has been used successfully to map wildfires over large spatial scales and is now commonly used to produce fire history maps [2,4]. Using Geographic Information Systems (GIS) to display and analyse the fire history of regions over timescales of several decades has been found to be valuable for areas that may not be readily accessible to more conventional means of determining fire regimes [9].
Approximately 7% of the Australian continent burns annually (an area of between 300,000 and 700,000+ km2), with individual wildfires in hummock grasslands often exceeding 10,000 km2 [10]. Fires burning across a five-month period in the Tanami Desert in the year 2000 burnt over 81,000 km2 [3]. In a study on fire patterns in a semi-arid region of south-western Australia around Lake Johnston [11], fires ranged from 1.8–1519 km2; this study found the driver of large fires (climatic conditions) differed from those of small- and medium-sized fires. Further north in Central Australia, a mean fire size of 591 km2 in hummock grassland and 381 km2 in Acacia shrubland was found [3].
Drivers of vegetation fires in seasonally dry regions include: (1) Sufficient fuel loads and continuity to carry a fire [12]; (2) favourable weather with warm, dry and windy conditions being optimal for the spread of fire [2,13]; and (3) an ignition source—this could be natural such as lightning or human-induced such as prescribed burning for land management purposes [1]. Weather and climate interact with the amount and continuity of canopy cover to exert a great influence over bushfires, especially in seasonally dry ecosystems [14,15]. Very open shrubland canopies have few bushfires because there is usually insufficient and very patchy fuel. Sufficient prior rainfall (for grasses and ephemeral species to grow and cure), and optimal weather conditions (hot and dry with strong, driving winds) are often needed before large bushfires can occur in arid shrublands [2,16,17,18,19,20]. The link between higher antecedent rainfall (two year cumulative rainfall) and increased bushfire activity in arid regions is largely a consequence of ephemeral plant growth, especially grasses that bridge gaps in fuel [4,17,18]. Fire in vegetation with mid-dense to dense canopies are generally not as reliant on antecedent rainfall, but rather to fuel accumulation in the period since the last fire and local weather conditions, with wind being the most important of these [15,21]. Dense canopies are less reliant on wind to drive the bushfire than open and mid-dense canopies because of their continuous fuel distribution, while dense canopies are capable of sustaining crown fires once they have sufficiently recovered from a previous fire [13,22].
Many authors have noted that the major vegetation types of arid Australia have highly divergent fire regimes [4,11,23]. Burrows et al. [24] found that hummock grasslands in the Western Desert region of Western Australia have the potential to carry fire at a frequency of one every five to seven years depending on rainfall, although fires have become less frequent in this region after Aboriginal people stopped their traditional burning practices [25]. However, in these systems maximum fuel levels are only achieved after 18–20 years [4,24], and although Triodia-dominated vegetation is typically less than 20 years old they can be as old as 80 years depending on location, especially in more isolated patches [11]. Hummock grasslands are highly flammable once large enough to carry a fire, with fuel continuing to accumulate for many decades post fire [26]. In contrast, fuel in Acacia-dominated vegetation largely comprises ephemeral grasses and forbs which do not accumulate with time since fire [19,23], meaning that fires are more likely to be linked to high rainfall episodes making them independent of time since fire. Other arid vegetation types, such as shrubland dominated by saltbushes (Chenopodiaceae) and other halophytes, and vegetation of rocky uplands, rarely if ever experience fire [4].
Few studies have focused on the pattern and impact of fires on arid regions of Western Australia; one such study used remote sensing to analyse fire regimes across arid Australia over six years [2]. This study found that 13% of the southern part of the arid region that starts just north of Kalbarri burnt in the six-year study period, but only 1% of the drier—more northern region situated in the Carnarvon basin—burnt in this period [2]. However, given the acute variability in climate of these arid regions, and drylands in general [27], studies of fire patterns over longer timeframes are warranted. The majority of Western Australia has a population density of less than 0.1 persons per square kilometre and, consequently, fire-fighting infrastructure, equipment and resources are limited outside of major cities and towns. This also means the size of fires in remote regions is usually large, hence the use of remote sensing and GIS in studying fire becomes imperative.
Bushfires in regions with similar climate and vegetation structure to our study area are typically smaller than those found in Australia [8,28,29,30]. For instance, in southern California, vegetation fires ranged from 0.22 km2 to 0.76 km2 in size, and the total percentage area burnt averaged ~0.3% year−1 for the most fire prone vegetation types [31]. Although the area of vegetation burnt was generally small (which is likely to reflect active fire suppression and the fragmented nature of the vegetation across most of this region), there were small numbers of exceptionally large fires in this region, such as one that exceeded 4000 km2 in the Mojave Desert [28]. Fynbos vegetation in South Africa is similar in that the area burnt by bushfires is dominated by relatively rare, large fires [30], though the sizes of the largest fires are smaller than those found in arid Australia. In a study conducted in eastern coastal fynbos, the largest fire recorded for that area was 419 km2 [8]. Govender et al. [32] found grasslands in Kruger National Park, where fuel accumulates for four to five years post-fire before degrading after six years, had fire-return intervals between three and six years, and in areas of intense grazing, with smaller fuel loads, fires were less intense. In California, vegetation fires can alter the composition and structure of a community with repeated fires restricting the expansion of shrubs allowing grasslands to proliferate [33,34]. In other ecosystems, increased fire frequency has led to profound changes in the structure and loss of dominant species, thereby threatening their existence [31].
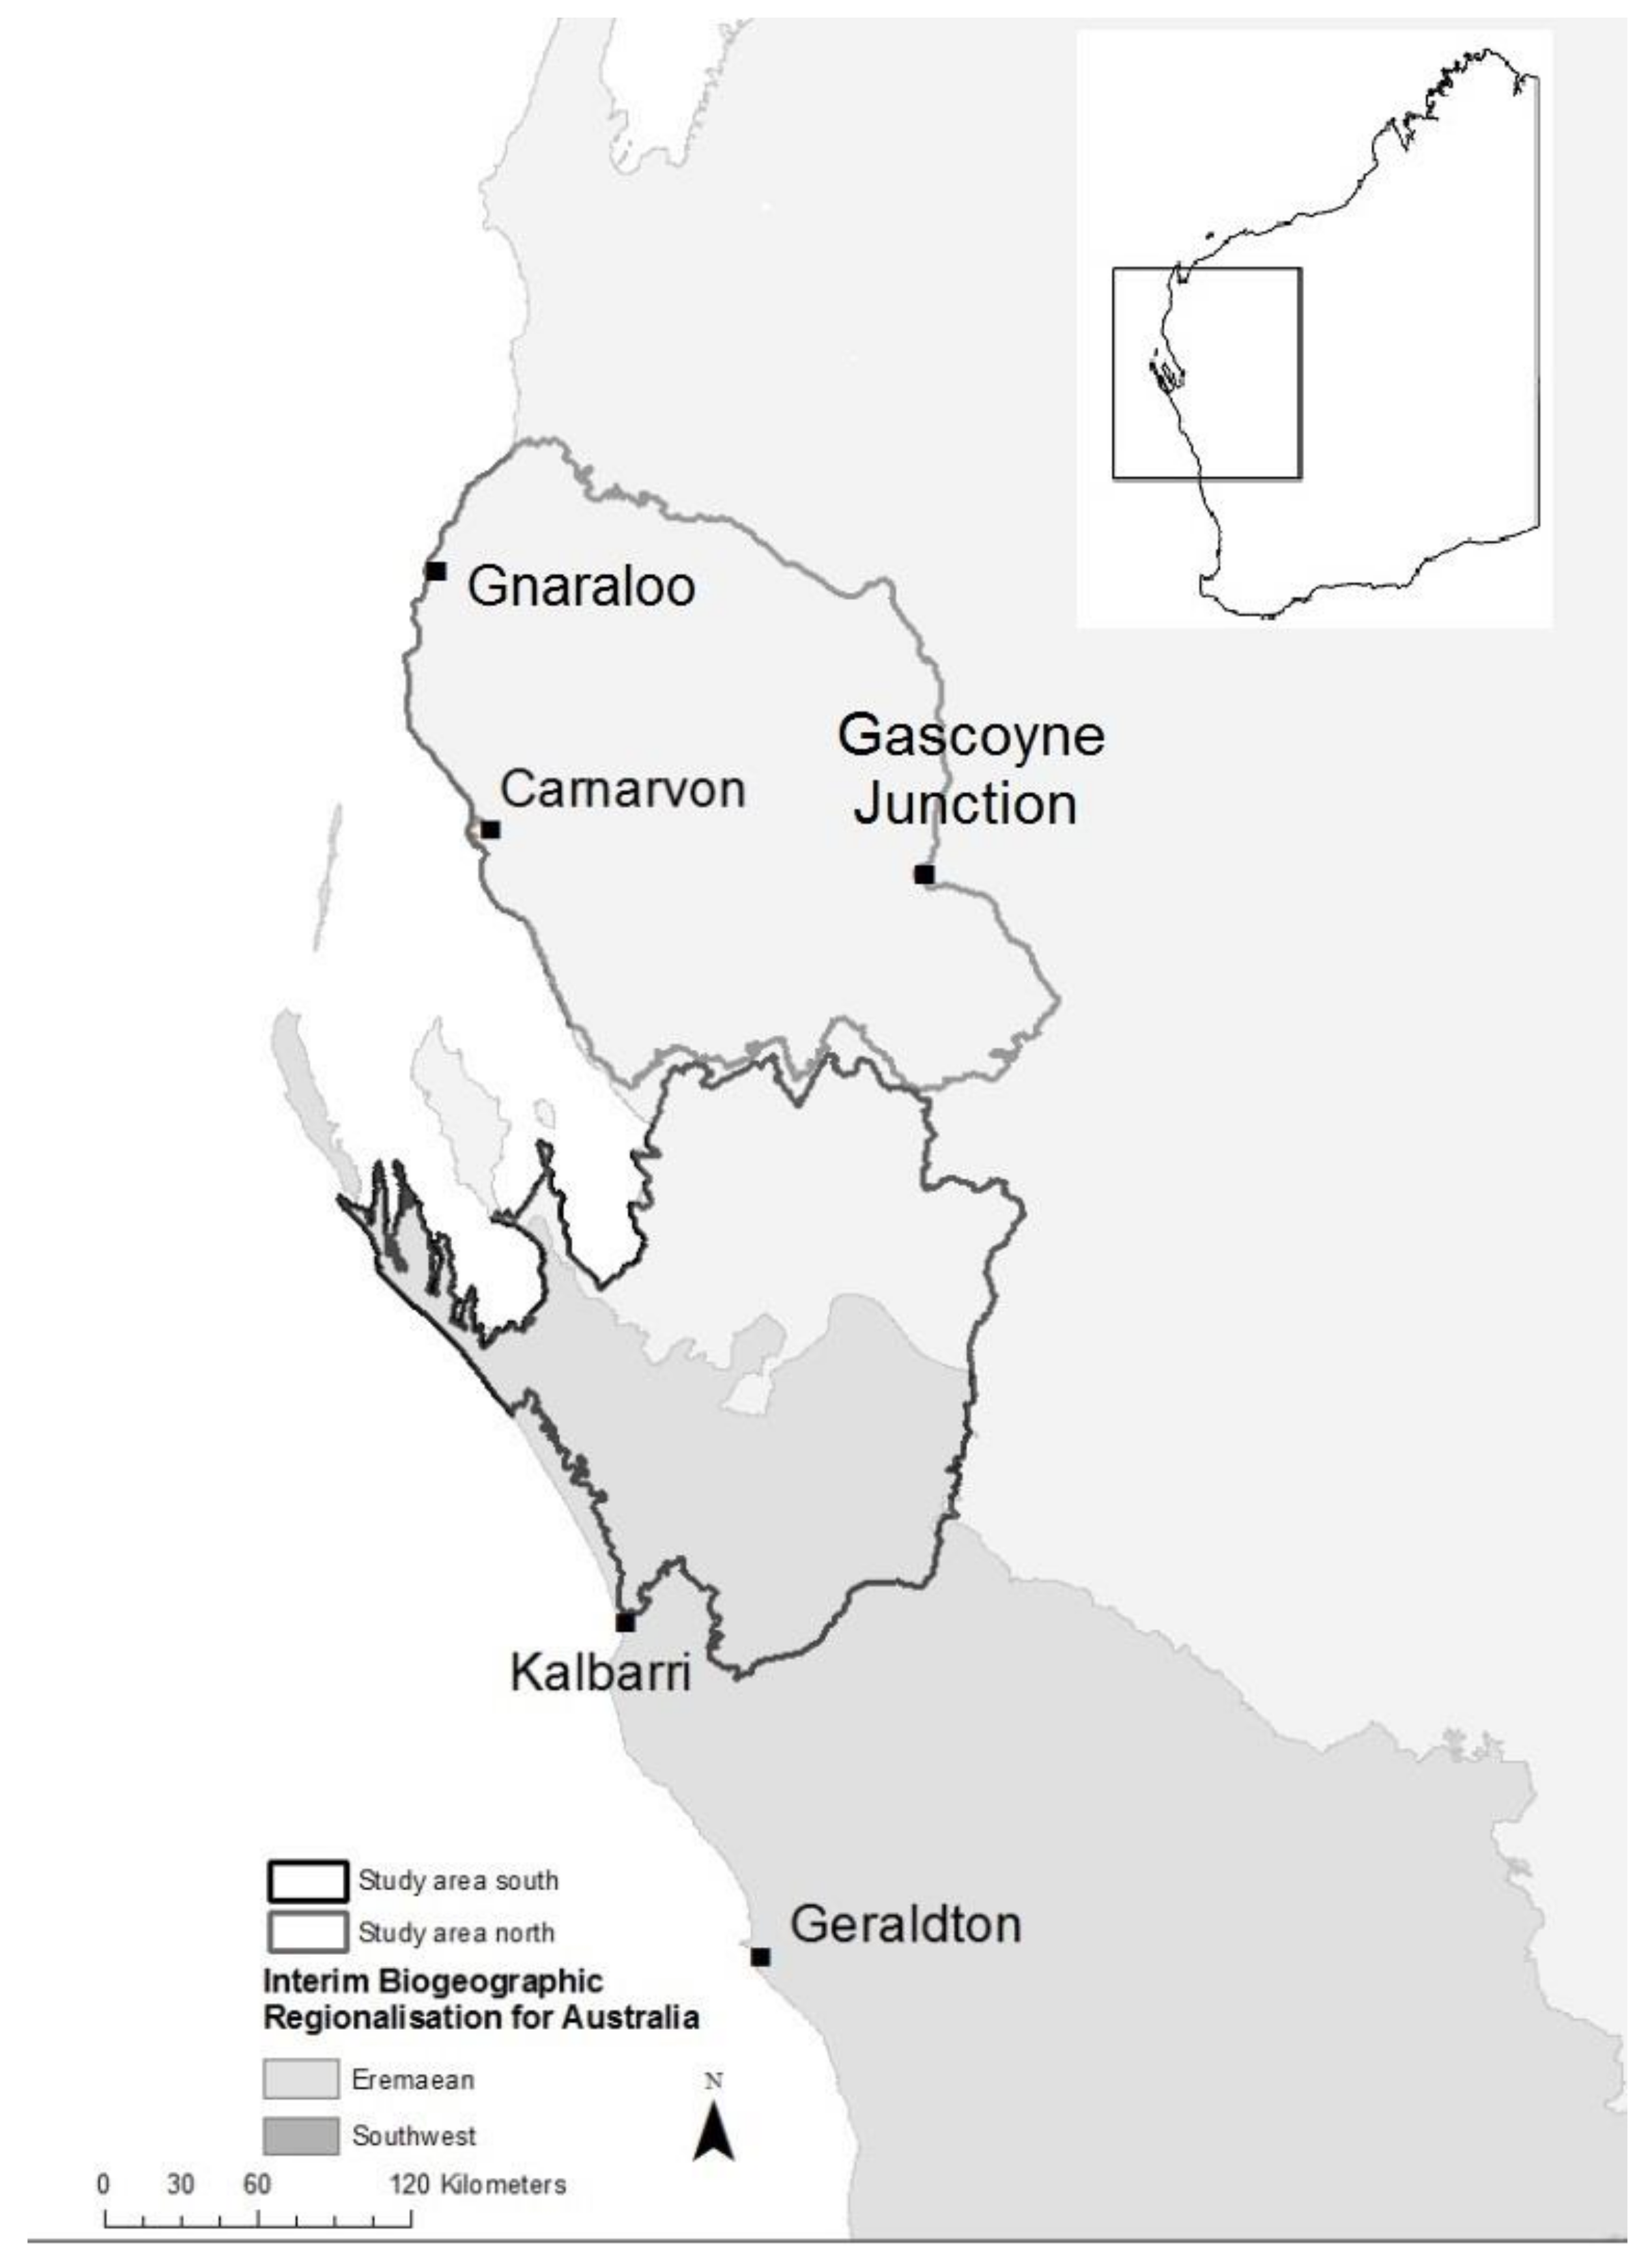
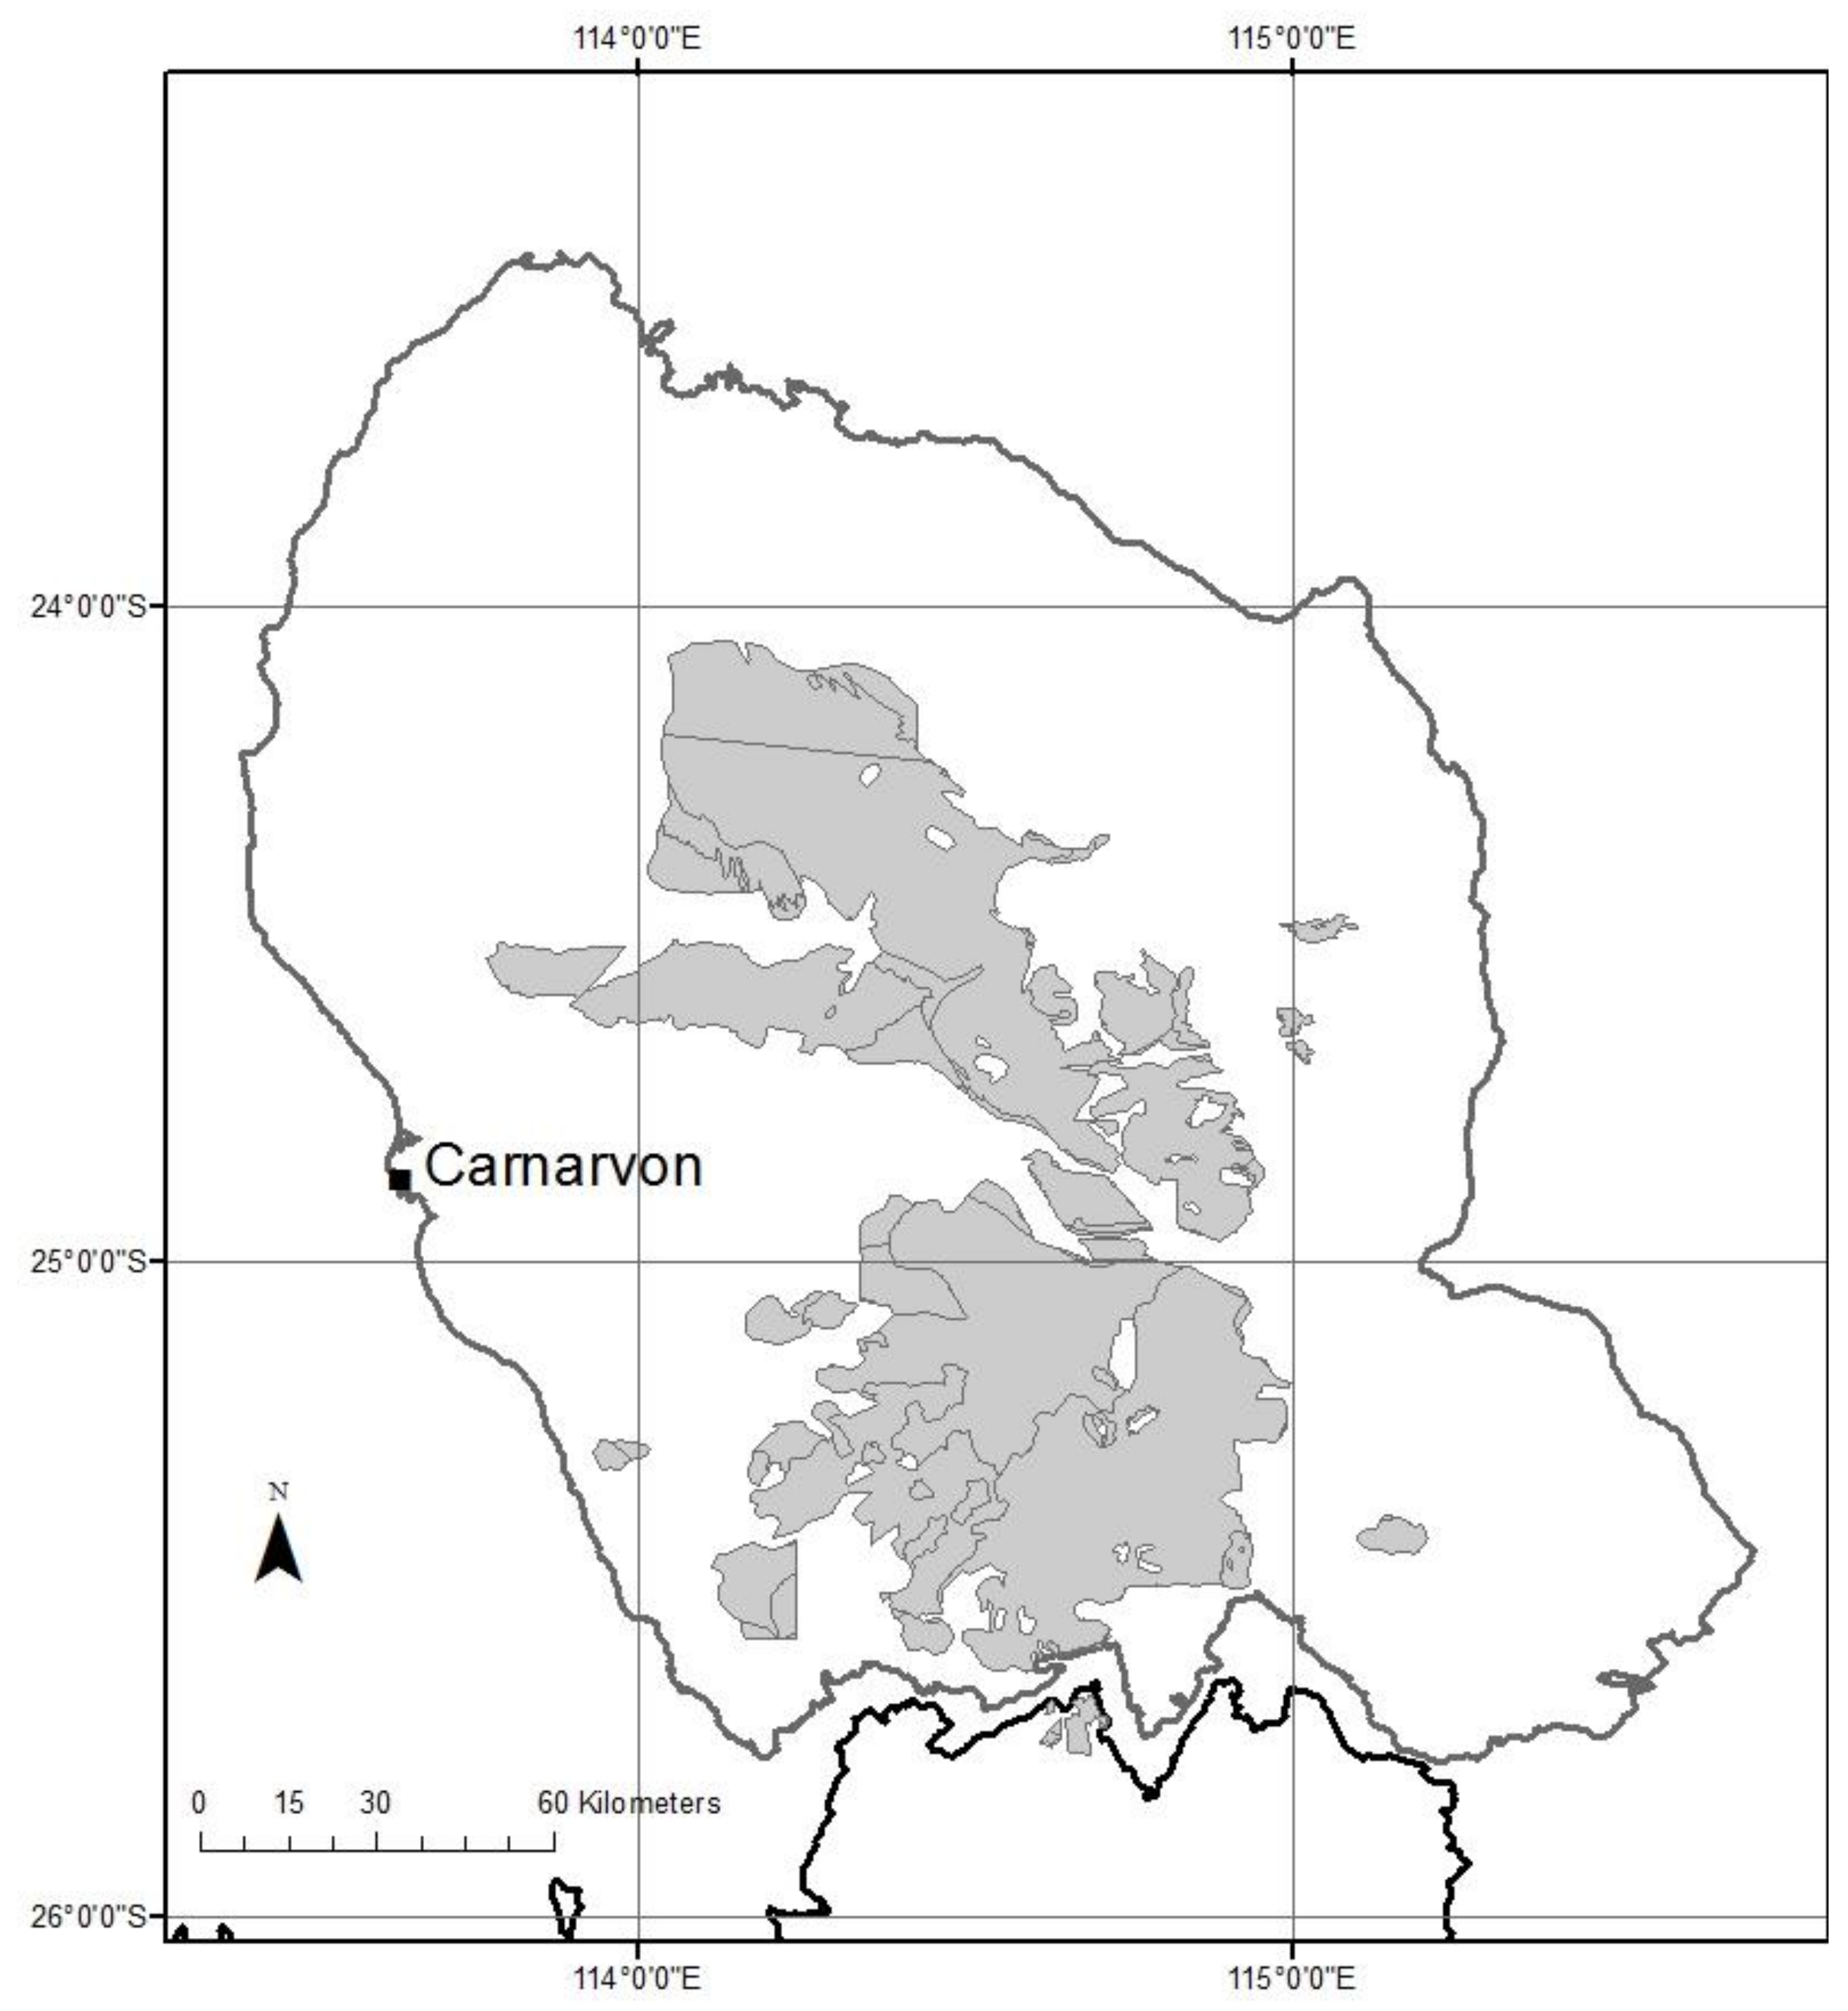
This study focuses on an arid region of Western Australia extending from north of the Murchison River to the Minilya River north of Carnarvon (Figure 1), an area closely corresponding to the Carnarvon Basin. The region was selected based on climate (arid), soil/geomorphology (mostly dunefields and alluvial deposits over sedimentary rocks) and vegetation (shrub-dominated vegetation). The study area straddles the divide between the Eremaean and Southwest Biogeographic Regions (Figure 1) that comprises different vegetation types and climates; the Southwest Biogeographic Region has a higher annual rainfall and lower average temperatures than the Eremaean Biogeographic Region. To date, there has been very limited study of fire regimes and histories undertaken in remote arid regions of Western Australia. The data collected in this study enabled the reconstruction of fire regimes/history over the last 40 years in a spatially extensive arid region by studying temporal (1973–2012) and spatial fire-scar patterns using remote sensing in a GIS environment throughout the Carnarvon Basin. Our goal was to characterise the contemporary fire regime, with particular focus on the fire sizes, and to determine the influence of vegetation type and recent climate/weather on fire size.
2. Materials and Methods
2.1. Study Area Including Climate
Given the large size of the study area in arid Western Australia (65,725 km2), and because of the substantially different vegetation types and weather patterns across this area, it was divided into northern and southern sections. The study area and two sub-areas (Figure 1) were chosen as they: (1) Have relatively consistent seasonal rainfall patterns, although the annual rainfall is changing; (2) correspond closely to a recognised biogeographic region (the Carnarvon bioregion) and geological province (Carnarvon Basin, a sedimentary basin of mostly sandstone and limestone of Palaeozoic to Mesozoic age and overlying sediment); (3) have not been previously studied in terms of fire regimes; and (4) have natural fire boundaries including rivers (northern, southern and central boundaries), salt flats, major geological formations and hills (eastern boundaries), coastal sand dunes and coast (western boundaries). The Wooramel River creates a significant natural fire boundary between the northern and southern study areas.
The area spans a transitional rainfall zone, changing from a semi-arid Mediterranean climate (i.e., with summer drought) in the south, to arid climate with bimodal rainfall distribution (both summer and winter rain) in the north [35,36]. The average annual rainfall of the study area gradually declines with distance north and east, ranging from 346 mm year−1 at Kalbarri to 233 mm year−1 at Gnaraloo, and 215 mm year−1 at Gascoyne Junction [37].
2.2. Vegetation Groups
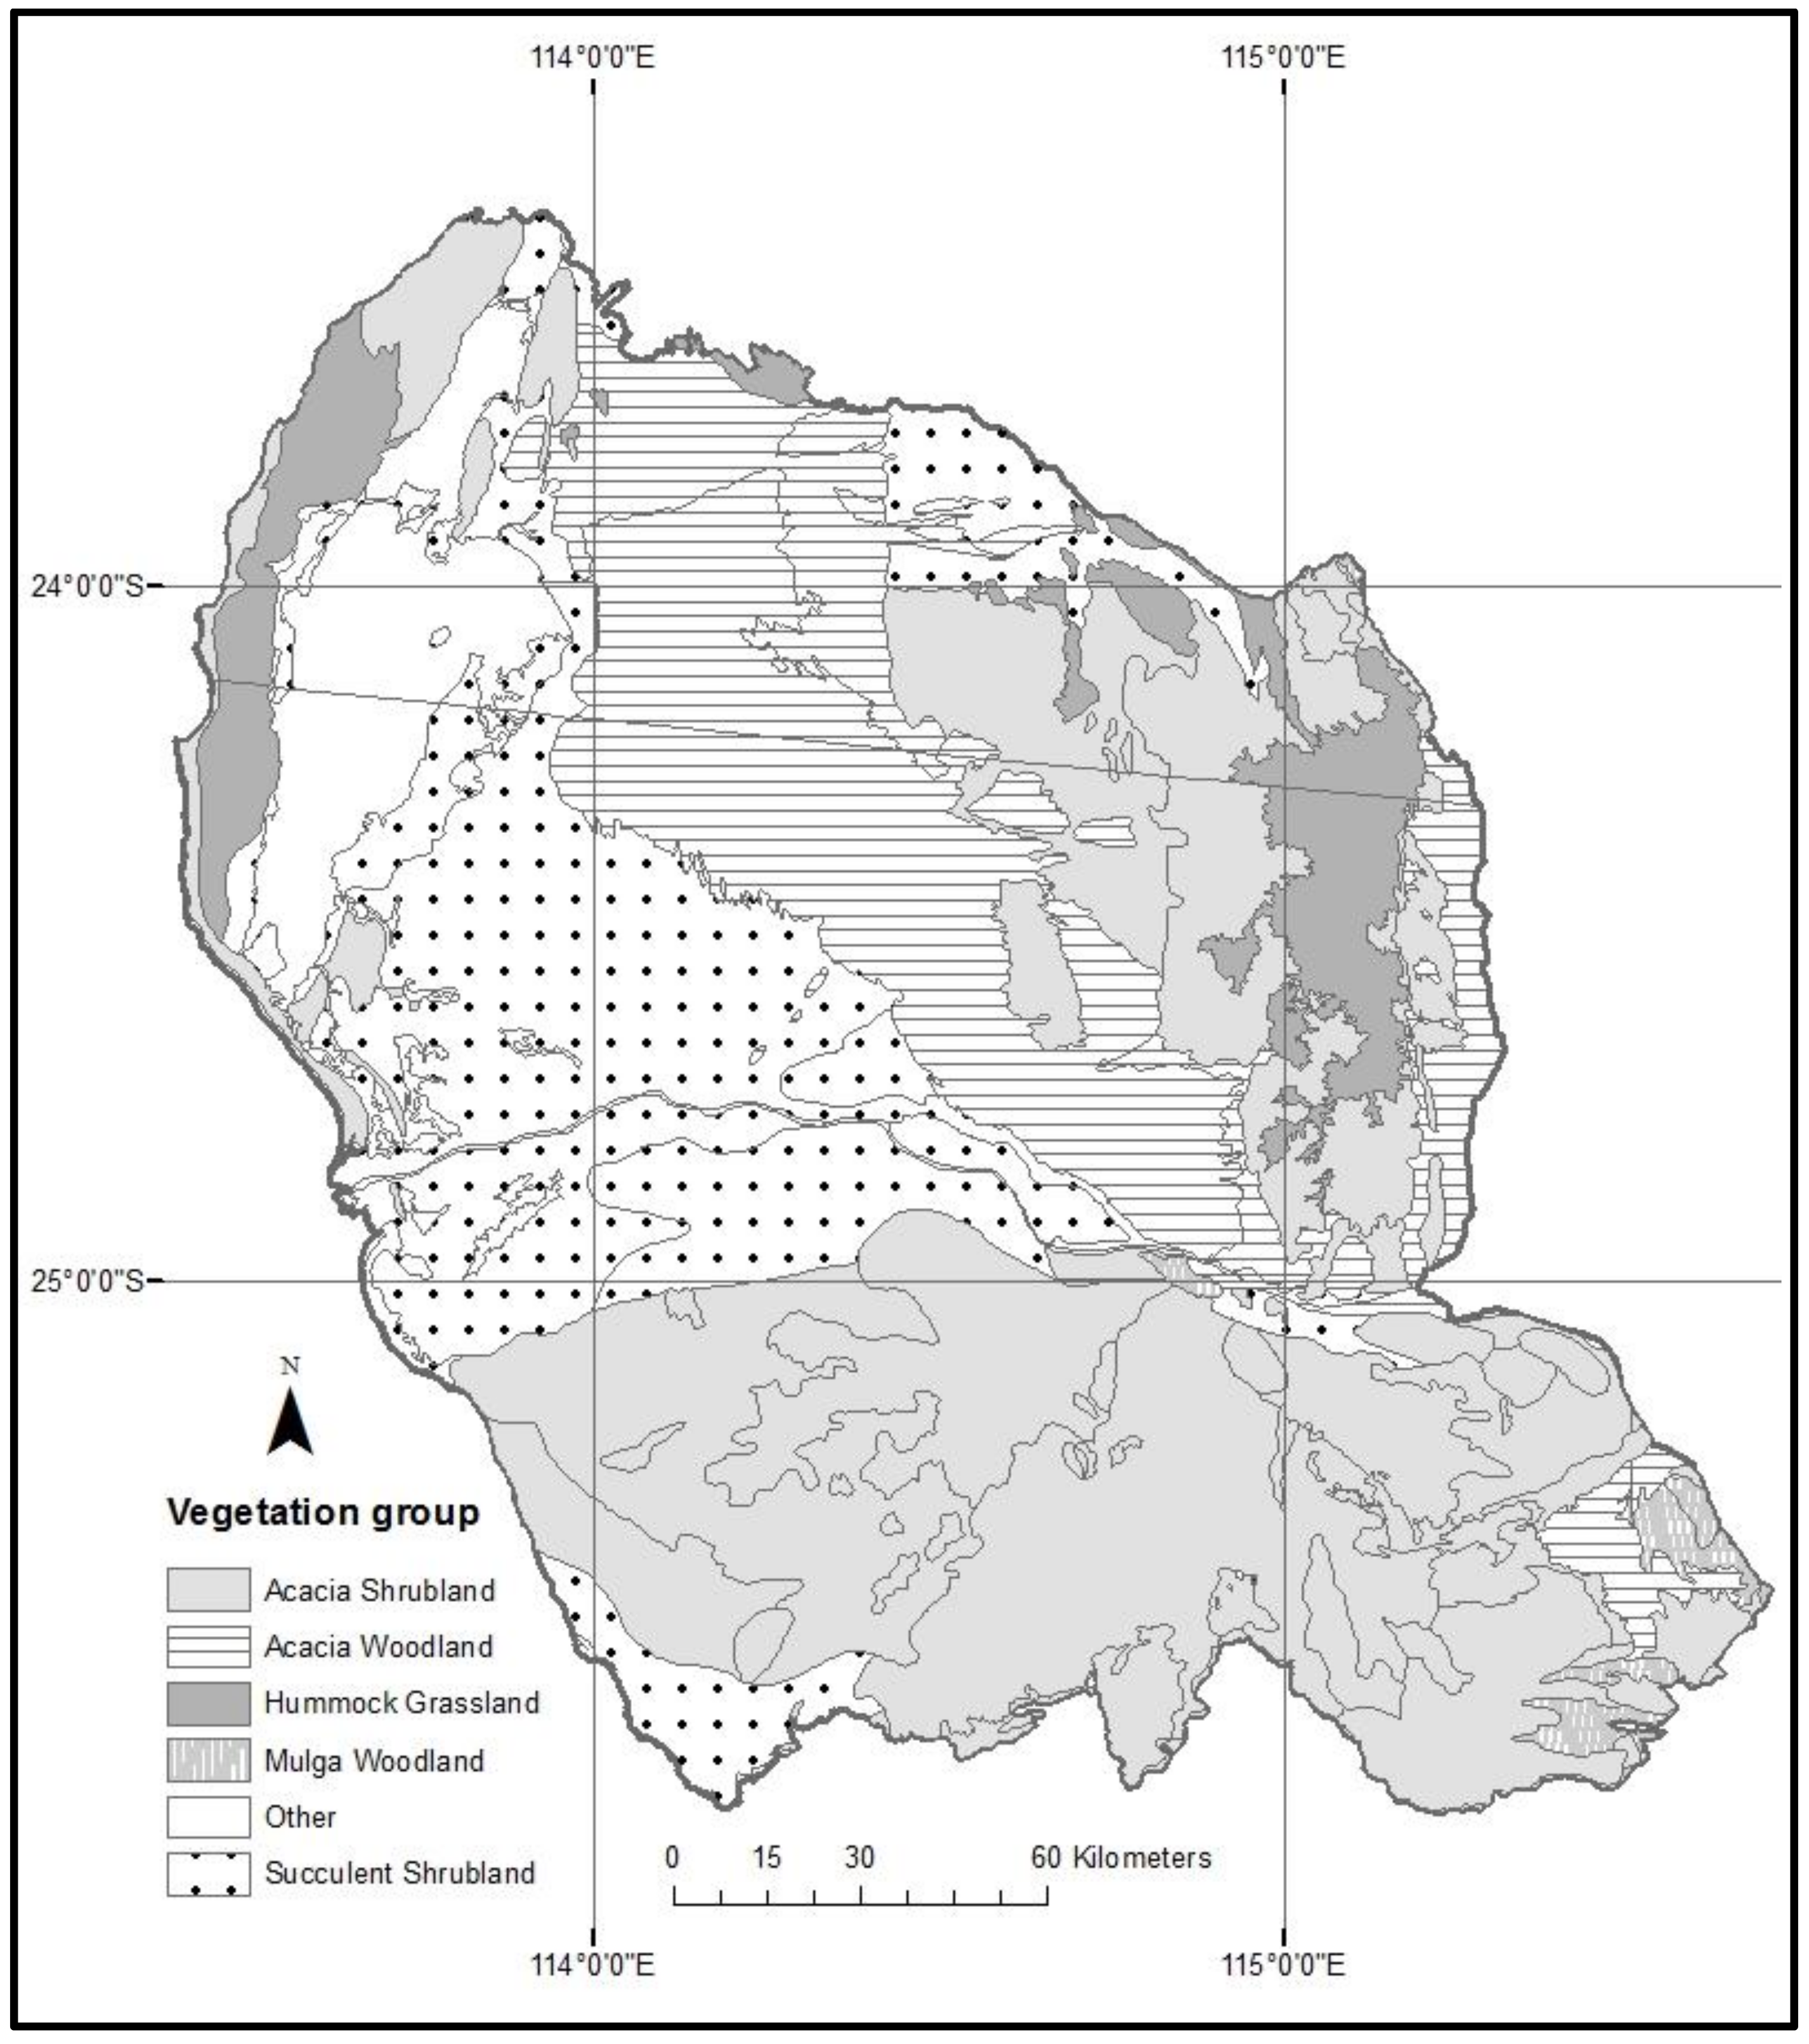
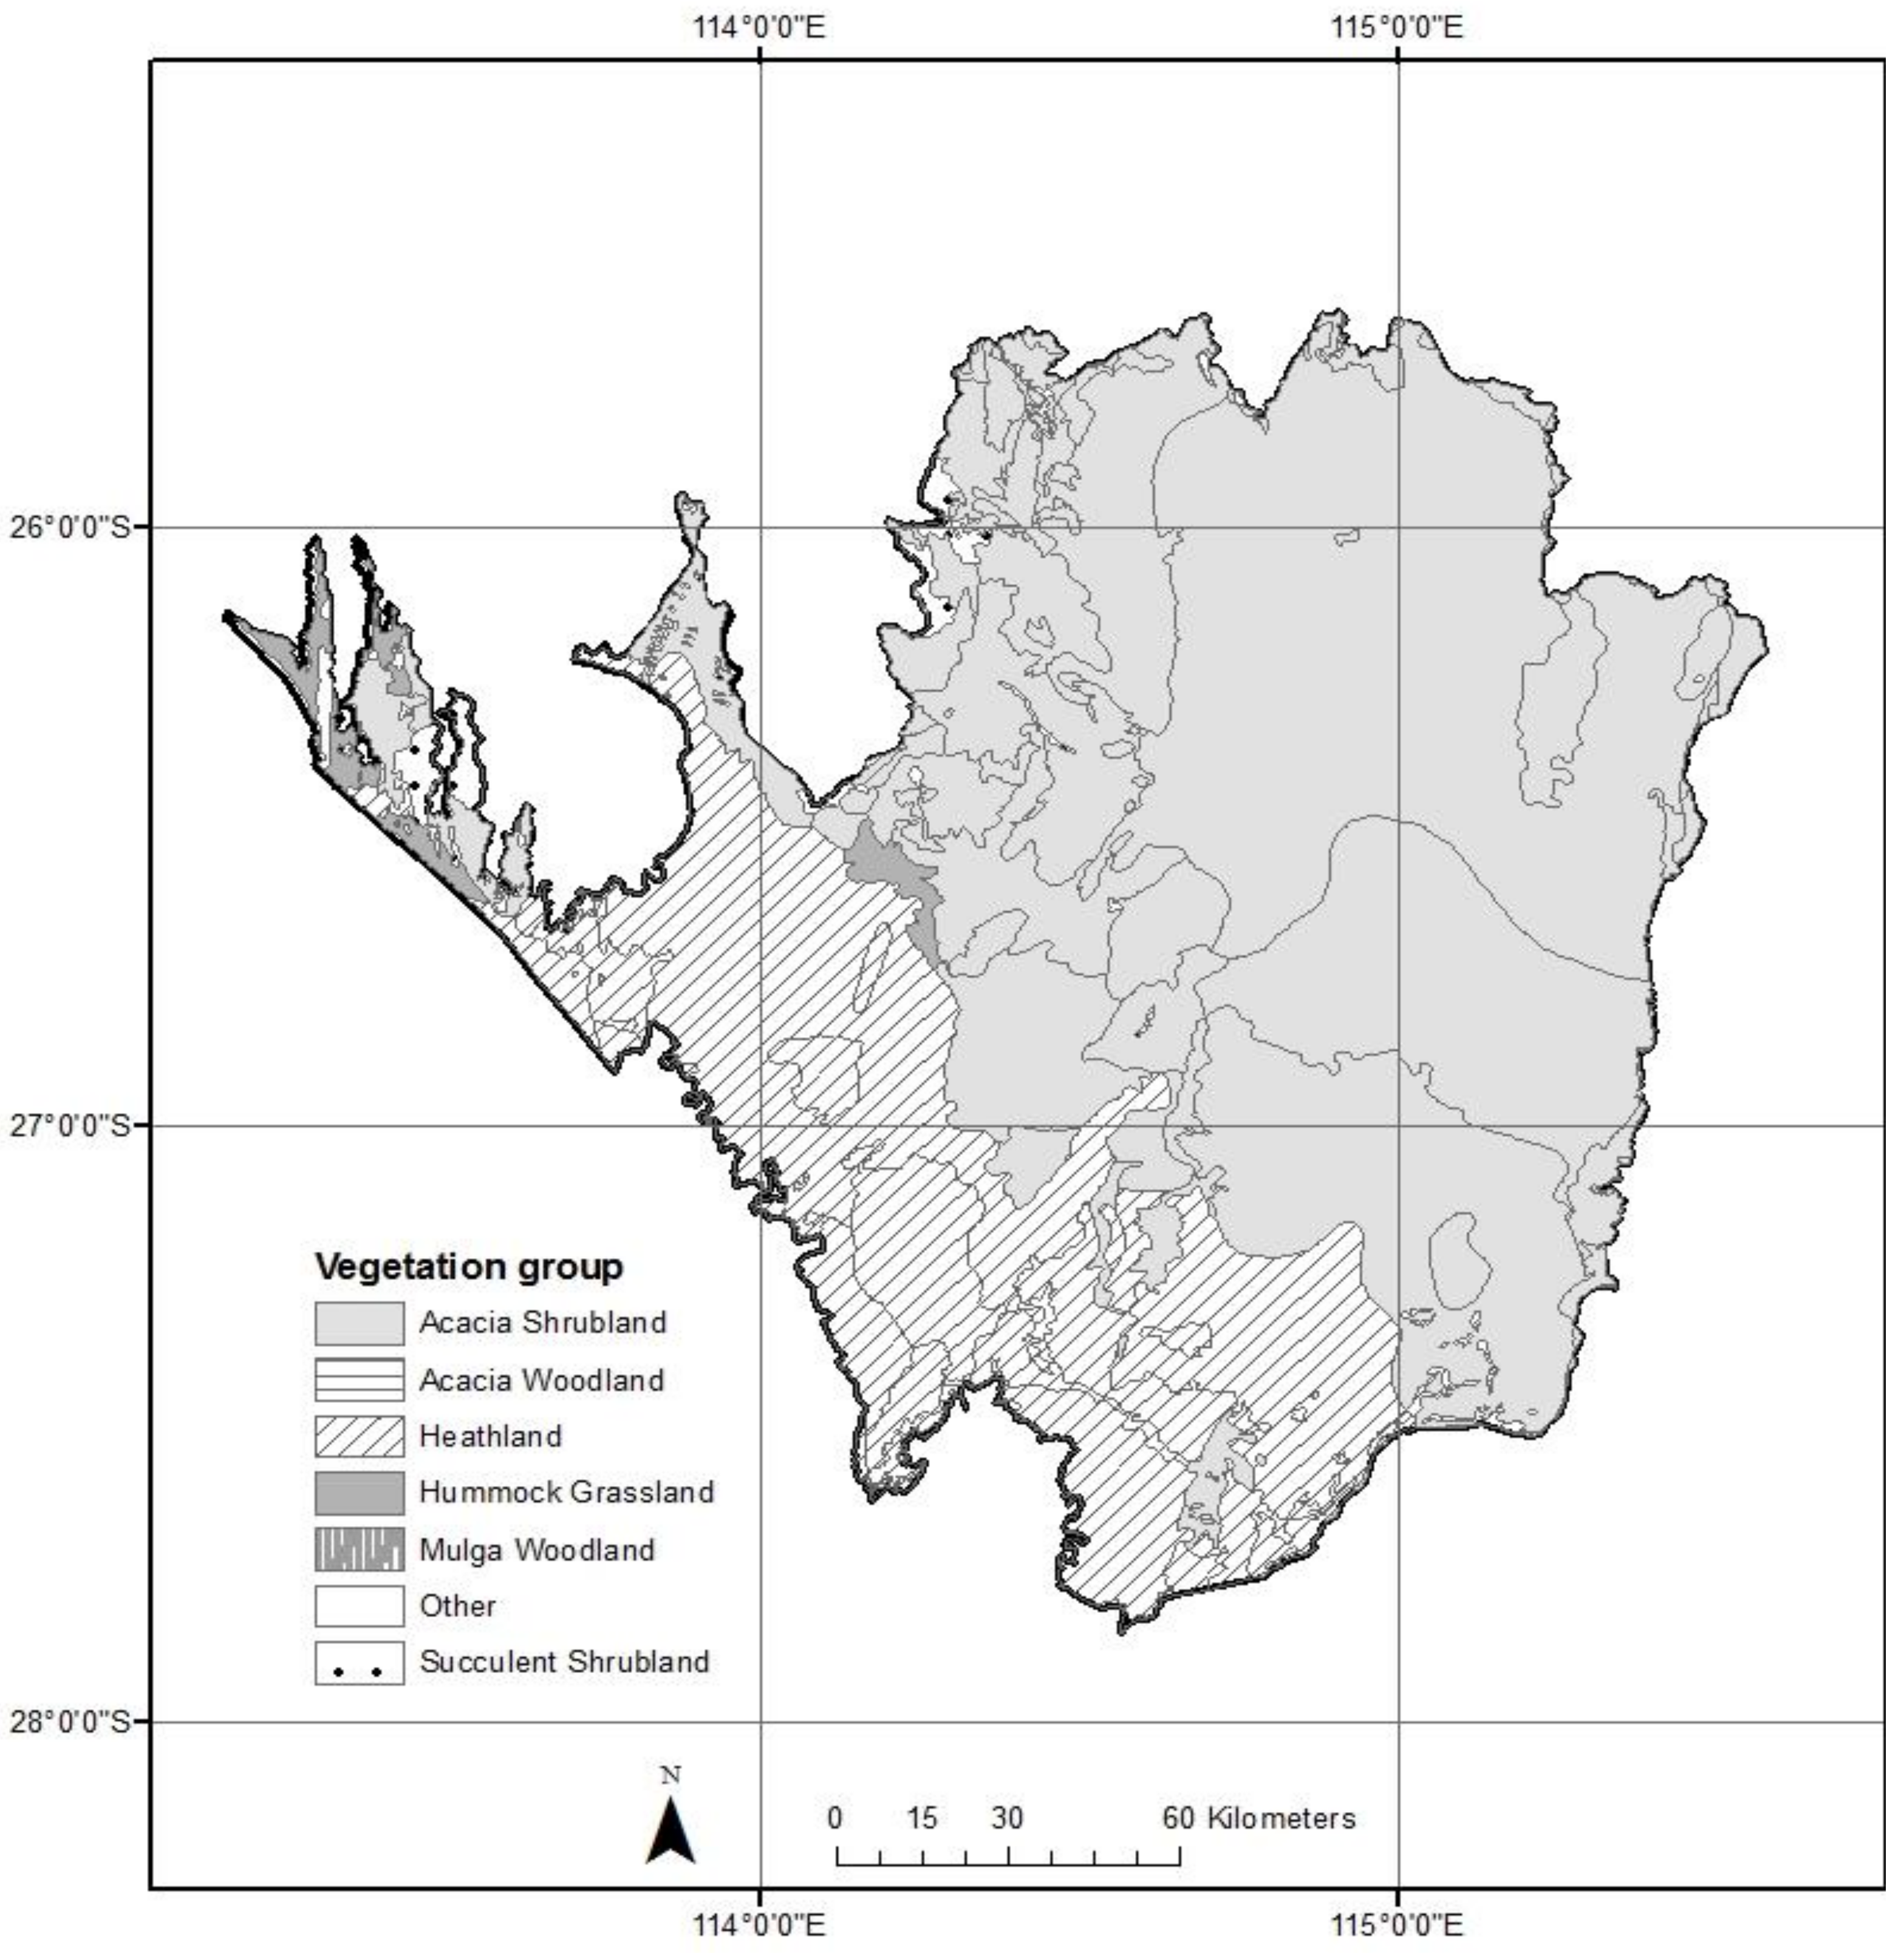
The study area has two main types of vegetation; hummock grassland (primarily Triodia spp.) and wooded shrublands (primarily Acacia spp. over generally sparse herbaceous understorey), creating a mosaic landscape with some succulent-plant shrubland interspersed throughout, all of which are typical of arid and semi-arid Australia [23]. There are 141 different vegetation associations mapped in the study area [38] (Table S1). To evaluate the effect of vegetation on bushfires, we combined the vegetation associations into seven broad groups (Figure 2 and Figure 3; Table 1 and Table S2): Acacia shrubland, Acacia woodland, heathland, mulga woodland, hummock grassland, succulent shrubland, and other. The groupings were based on the original association descriptions [38] and the National Vegetation Information System (NVIS) level 1 classifications and locations, and corresponds closely with the physiognomic vegetation types groups recently redefined and mapped by Beard et al. [39] at the 1:3,000,000 scale. Mosaics and mixed vegetation associations were placed into one of the seven vegetation groups based on their ground or lowest vegetation stratum (as this was deemed to have the largest influence on fire behaviour and patterns).
2.3. Data Sources and Fire Scar Mapping
The project used numerous geo-referenced digital data layers in ArcGIS including: Fire scars (created specifically for this study from satellite imagery interpretation), vegetation, temperature, rainfall, water courses, and coastline (Table S3). The imagery used for the project came from Landsat satellites and were a mixture of Multispectral Scanner (MSS) images from Landsat 1–3 (1973–1982, 60 m ground resolution), Thematic Mapper (TM) from Landsat 4–5 (1983–1998, 30 m ground resolution), and Enhanced Thematic Mapper Plus (ETM+) from Landsat 7 (1999–2012, 30 m ground resolution). Satellite imagery was downloaded from the United States Geological Survey Earth Explorer website (earthexplorer.usgs.gov). Where able, two image compositions for each year were chosen for each section of the study area; one from the middle of the year (around July) and the other from the end of the year (around December) and working backwards from those times when the images were not suitable. Imagery that was corrupted or affected by cloud cover was unsuitable for the study and for these reasons, as well as because of access constraints, no usable imagery was available for the entire study area for 1980 and 1985. Data from these two years were not included in the calculations of average annual burnt area. The data layers were compiled in ArcGIS v10 with Spatial Analyst extension (Environmental Systems Research Institute Inc., Redlands, California, USA, 2011). Digitising and mapping were based on the WGS 1984 UTM Zone 49S datum. Fire scars were digitised manually with raw images due to the numerous false positives given using the Normalized Difference Vegetation Index (NDVI) from the numerous salt lakes, such as found in other fire mapping products automatically produced for the study area (e.g., Firewatch, Dept. of Biodiversity, Conservation & Attractions, WA; although we did check these against our fire scars to confirm we didn’t miss any clearly identifiable fires). Fire scars were easily identified visually by the shape and true-colour differences from surrounding areas, and by their characteristic spatial patterns (Figure S1). Fire scars were clearly visible in the southern study area from 1972, and the northern study area from 1973. In most instances, fire scars were clearly visible on the imagery because of near-complete removal of vegetation by fire as there was typically only one vegetation stratum for fires to burn through (e.g., shrublands and heathland were dominated by dense shrubs which tended to develop crown fires [21,22]). Only portions inside the study area were included for fires that crossed the study area boundaries. Only fires larger than 1 ha were digitised. Each year of satellite imagery was checked (in a temporal sequence starting from oldest imagery) for any new fire scars not found in the previous years, which were then digitised by hand and the fires attributed to that year. Calendar year was used for analyses as the fire season differed between the two study areas.
2.4. Data Analysis
Summary statistics were determined for fire scars for each study area and each year, and overall. The area of each vegetation association and group, which was burnt was determined by constructing intercepts between these vegetation units and fire scars in the GIS. The area of each vegetation association and group burnt was then compared to the total area of the vegetation available for both the northern and southern study areas.
To explore the relationship between fire size and weather experienced during and prior to the fire required matching of fire events with reasonable and reliable estimates of weather at the locality of the fire. This is because in arid regions of this size, weather will vary spatially, sometimes acutely [40]; this is particularly so for summer rainfall events in arid Australia which are often highly localised due to small convective thunderstorm cells and movement of low pressure systems of former cyclones [41]. Most previous studies exploring the fire–weather relationship have used data from nearest meteorological station(s), and therefore assumed minimal deviations with weather experienced at fire localities. Here we obtained interpolated 0.05° × 0.05° (ca. 5 km × 5 km) gridded weather data [42] (available from www.longpaddock.qld.gov.au/silo) for each fire. For each fire event greater than 20 km2 in size, we obtained monthly weather data for the grid cell aligned to the fire centroid. For larger fires (>400 km2), we obtained such data from three scattered points within the fire scar and averaged these, and for the largest fire event (8698 km2) we averaged data extracted from five scattered points. A fire event was defined as all fires occurring within a single locality (nominally within 10 km of each other by nearest boundary) in a given period (within a single month for most fires, but up to three months for larger fire events). This definition was used as large fires can burn for extended periods in the region and can be disjunct due to spotting and/or multiple lightning ignitions during dry thunderstorms. From the interpolated weather data, we calculated the following variables for each fire event: Rainfall in month of fire; cumulative total rainfall in three months, six months, one year, two years, and four years preceding the fire; average maximum daily temperature in month of fire; average maximum temperature in preceding three months, six months and year of the fire; and the cumulative water deficit (calculated by cumulative difference between monthly rainfall and pan evaporation) for three, six and 12 months prior to fire (these were almost always negative values given high evaporation rates relative to rainfall for the study area). The month of fire events was obtained from monthly burnt area maps (produced from Advanced Very High Resolution Radiometer (AVHRR) data from the NOAA polar-orbiting satellites and available from FireWatch Pro: http://firewatch-pro.landgate.wa.gov.au), and for the largest fires (>1 month duration), we used the month with the greatest fire spread.
The relationships between interpolated weather data and fire size (both untransformed and log-transformed) was firstly explored using Pearson product-moment correlation coefficients. Multiple linear modelling was then performed to select the best subsets of all weather variables explaining variation in both log-transformed and untransformed fire size, with Akaike information criterion corrected for small sample size (AICC) used to select the most parsimonious models. We analysed the northern and southern study areas separately given climatic differences and geographic separation. We did not use fire events, which could not be confidently dated to nearest month; this effectively eliminated most pre-1985 fires. Altogether, fire size and matching weather variables were obtained for 22 fire events in the northern study area, and 24 in the southern area.
3. Results
3.1. Summary Statistics
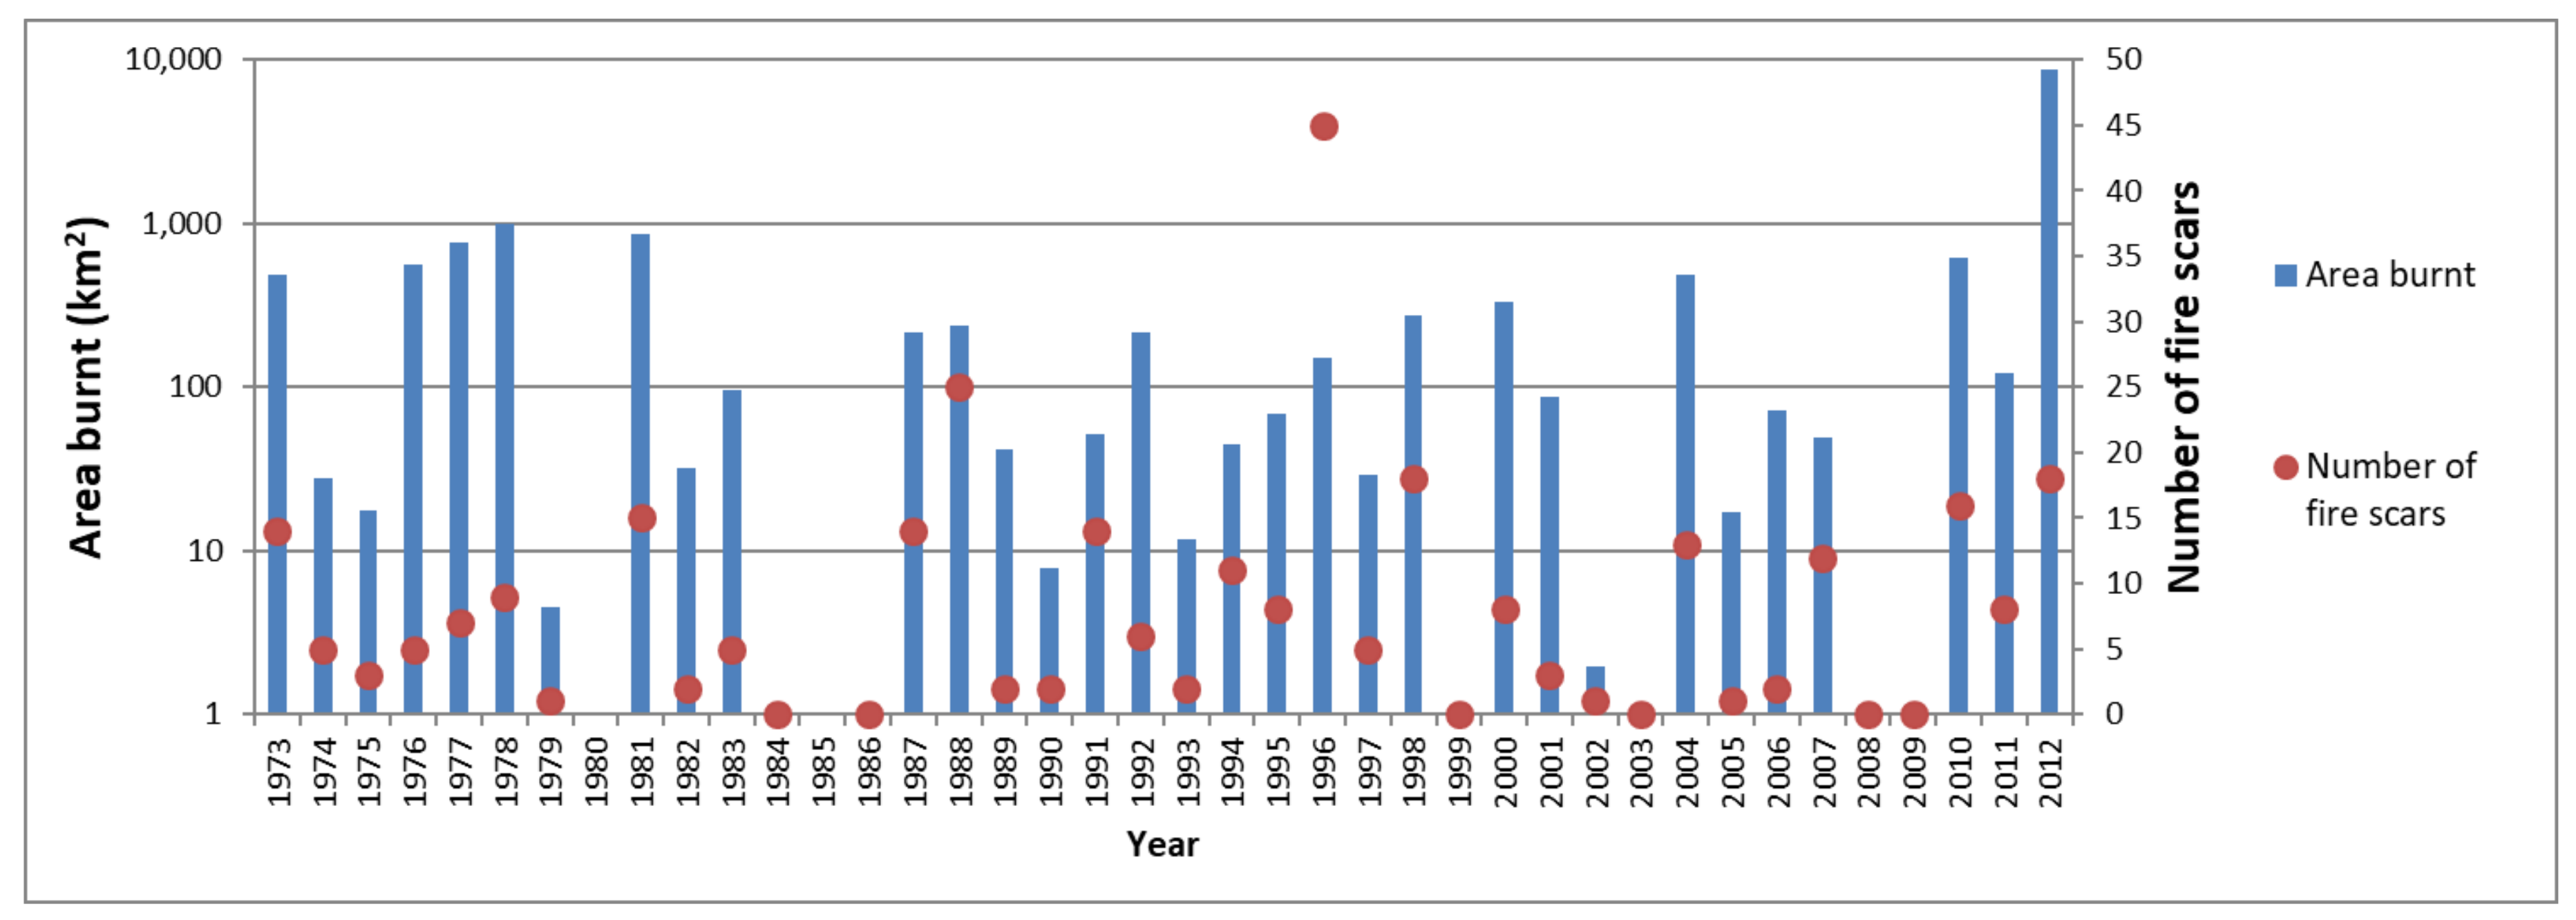
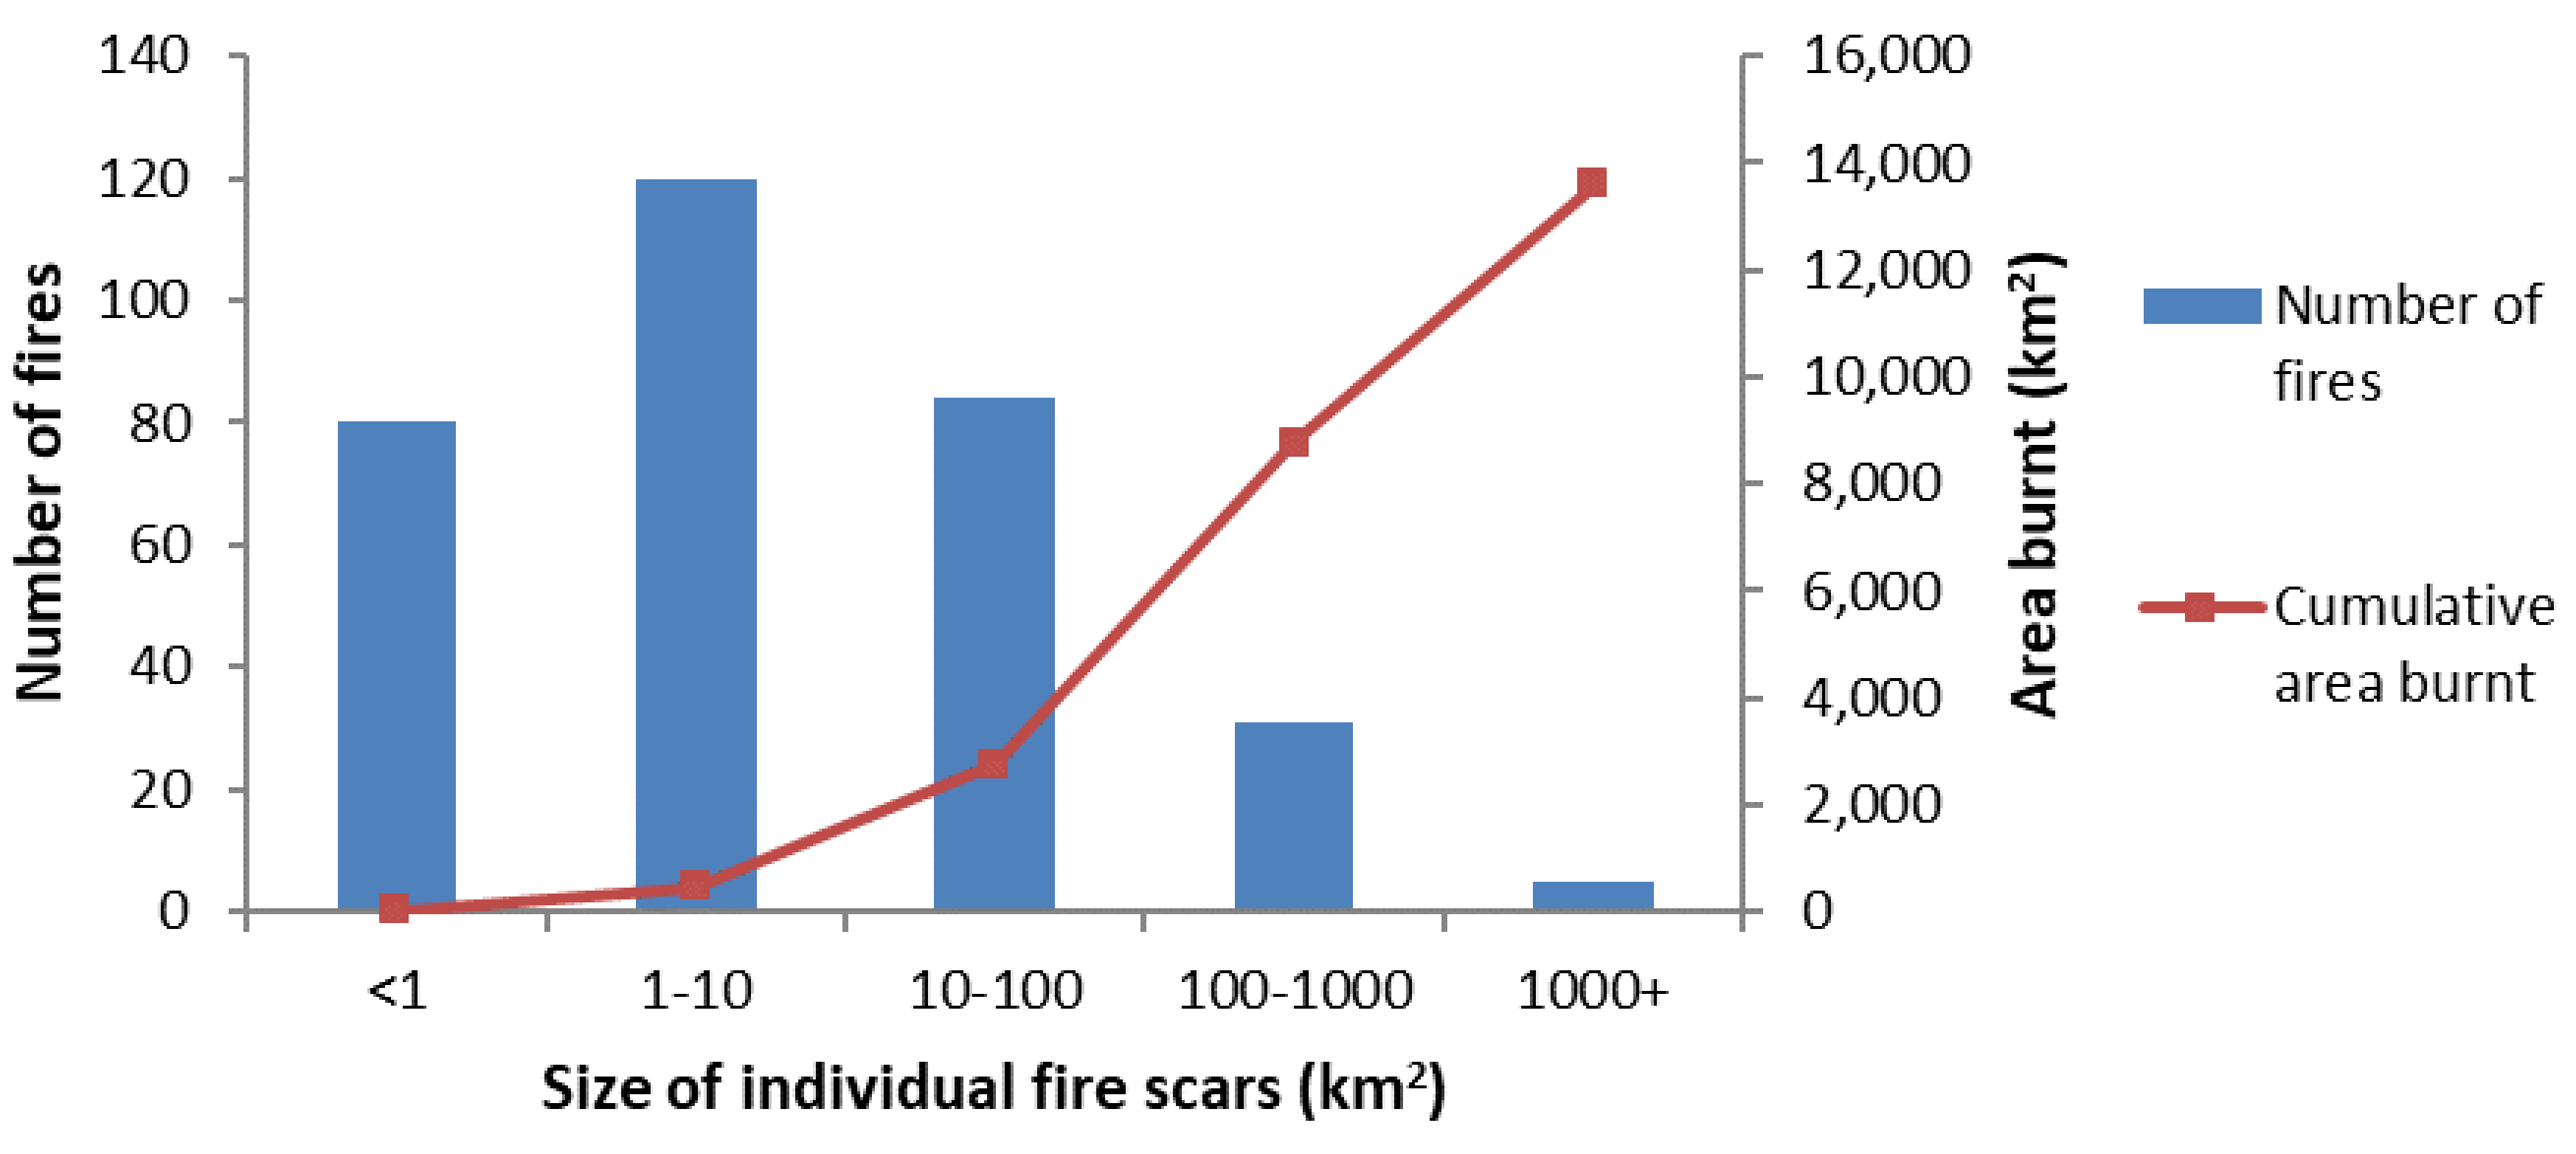
There were six years with no new bushfire scars detected, and two years (1980 and 1985) with no usable satellite imagery (Figure 4). The mean size of individual (disjunct) fire scars for the study period was 40.9 km2 with the median being 3.95 km2. The fires ranged in size from less than 1 km2 to more than 4000 km2 (Figure 5). The average count of separate fire scars per year was 9.4 with a range of 0–45 year−1, and there were 300 in total across all 39 years studied. The total area burnt (including areas that burnt more than once) during the study period was 15,646 km2 out of a total study area of 65,725 km2, which represents 23.8% of the study area. The yearly average for area burnt in the southern study area was 0.6% of the total area or 169 km2 year−1. The yearly average for the northern study area starting from 1988 was 1.9% of the total area or 447 km2 year−1. There was a very large bushfire in the northern study area in 2012, which accounts for substantially greater than normal area burnt for that year (Figure 4 and Figure 5). Some 8698 km2 burnt in 2012 (Figure 6), around eight times larger than the next largest burn year (1978) in which 982 km2 burnt. In 1996, some 45 separate fire scars were recorded but only 151 km2 burnt that year. Pearson’s correlation showed a weak correlation (r = 0.26; p = 0.11) between scar numbers and total area burnt each year.
3.2. Area Burnt by Vegetation Types
A total of 59 out of the 141 vegetation associations in the study area burnt during the study period; the greatest percentage burnt of a single association was a mosaic of Acacia woodlands and shrublands (NVIS 3432.1) with 85% (Table S4).
Vegetation groups in the southern study area showed detectable bushfire scars only within Acacia shrubland, Acacia woodland, and heathland (Table 2). Heathland had the greatest percentage of the total area burnt at least once in the southern study area (54%), with only 2% of Acacia shrubland burning at least once. The northern study area had detectable bushfire scars within Acacia shrubland, Acacia woodland, hummock grassland, succulent shrubland, and ‘other’ (Table 2). Although Acacia-dominated vegetation had greater areas burnt in the northern study area, hummock grassland had the greatest percentage burnt at least once (68% compared to 45% and 28% for Acacia woodland and shrubland, respectively). Mulga woodland had no fire scars in either study area, and there was no heathland in the northern study area. Around 14% of succulent shrubland was burnt in the northern study area, whereas none was burnt in the south (Table 2); almost all succulent shrublands burnt in the northern study area were vegetation mosaics of succulent shrubland and Acacia shrubland (Table S4).
In the southern study area, the majority of bushfires occurred in heathland (combined area burnt over all years; heathland 4496 km2, all other vegetation 396 km2; Table 2). The 2012 fires were exceptional in that only Acacia shrubland burnt in the study area, with this being the only fire to occur in this vegetation group in the southern study area during the study period. The northern study area had a greater range of vegetation groups burn across the years. The largest area burnt was Acacia shrubland (4467 km2) followed by Acacia woodland (3379 km2), hummock grassland (1669 km2), and other (34 km2). The majority of the Acacia shrubland and woodland areas burnt during the extensive 2012 bushfires, whereas medium-sized fires in hummock grassland occurred in many years, with only 47 km2 being burnt in the 2012 fire.
3.3. Weather—Fire Relationships
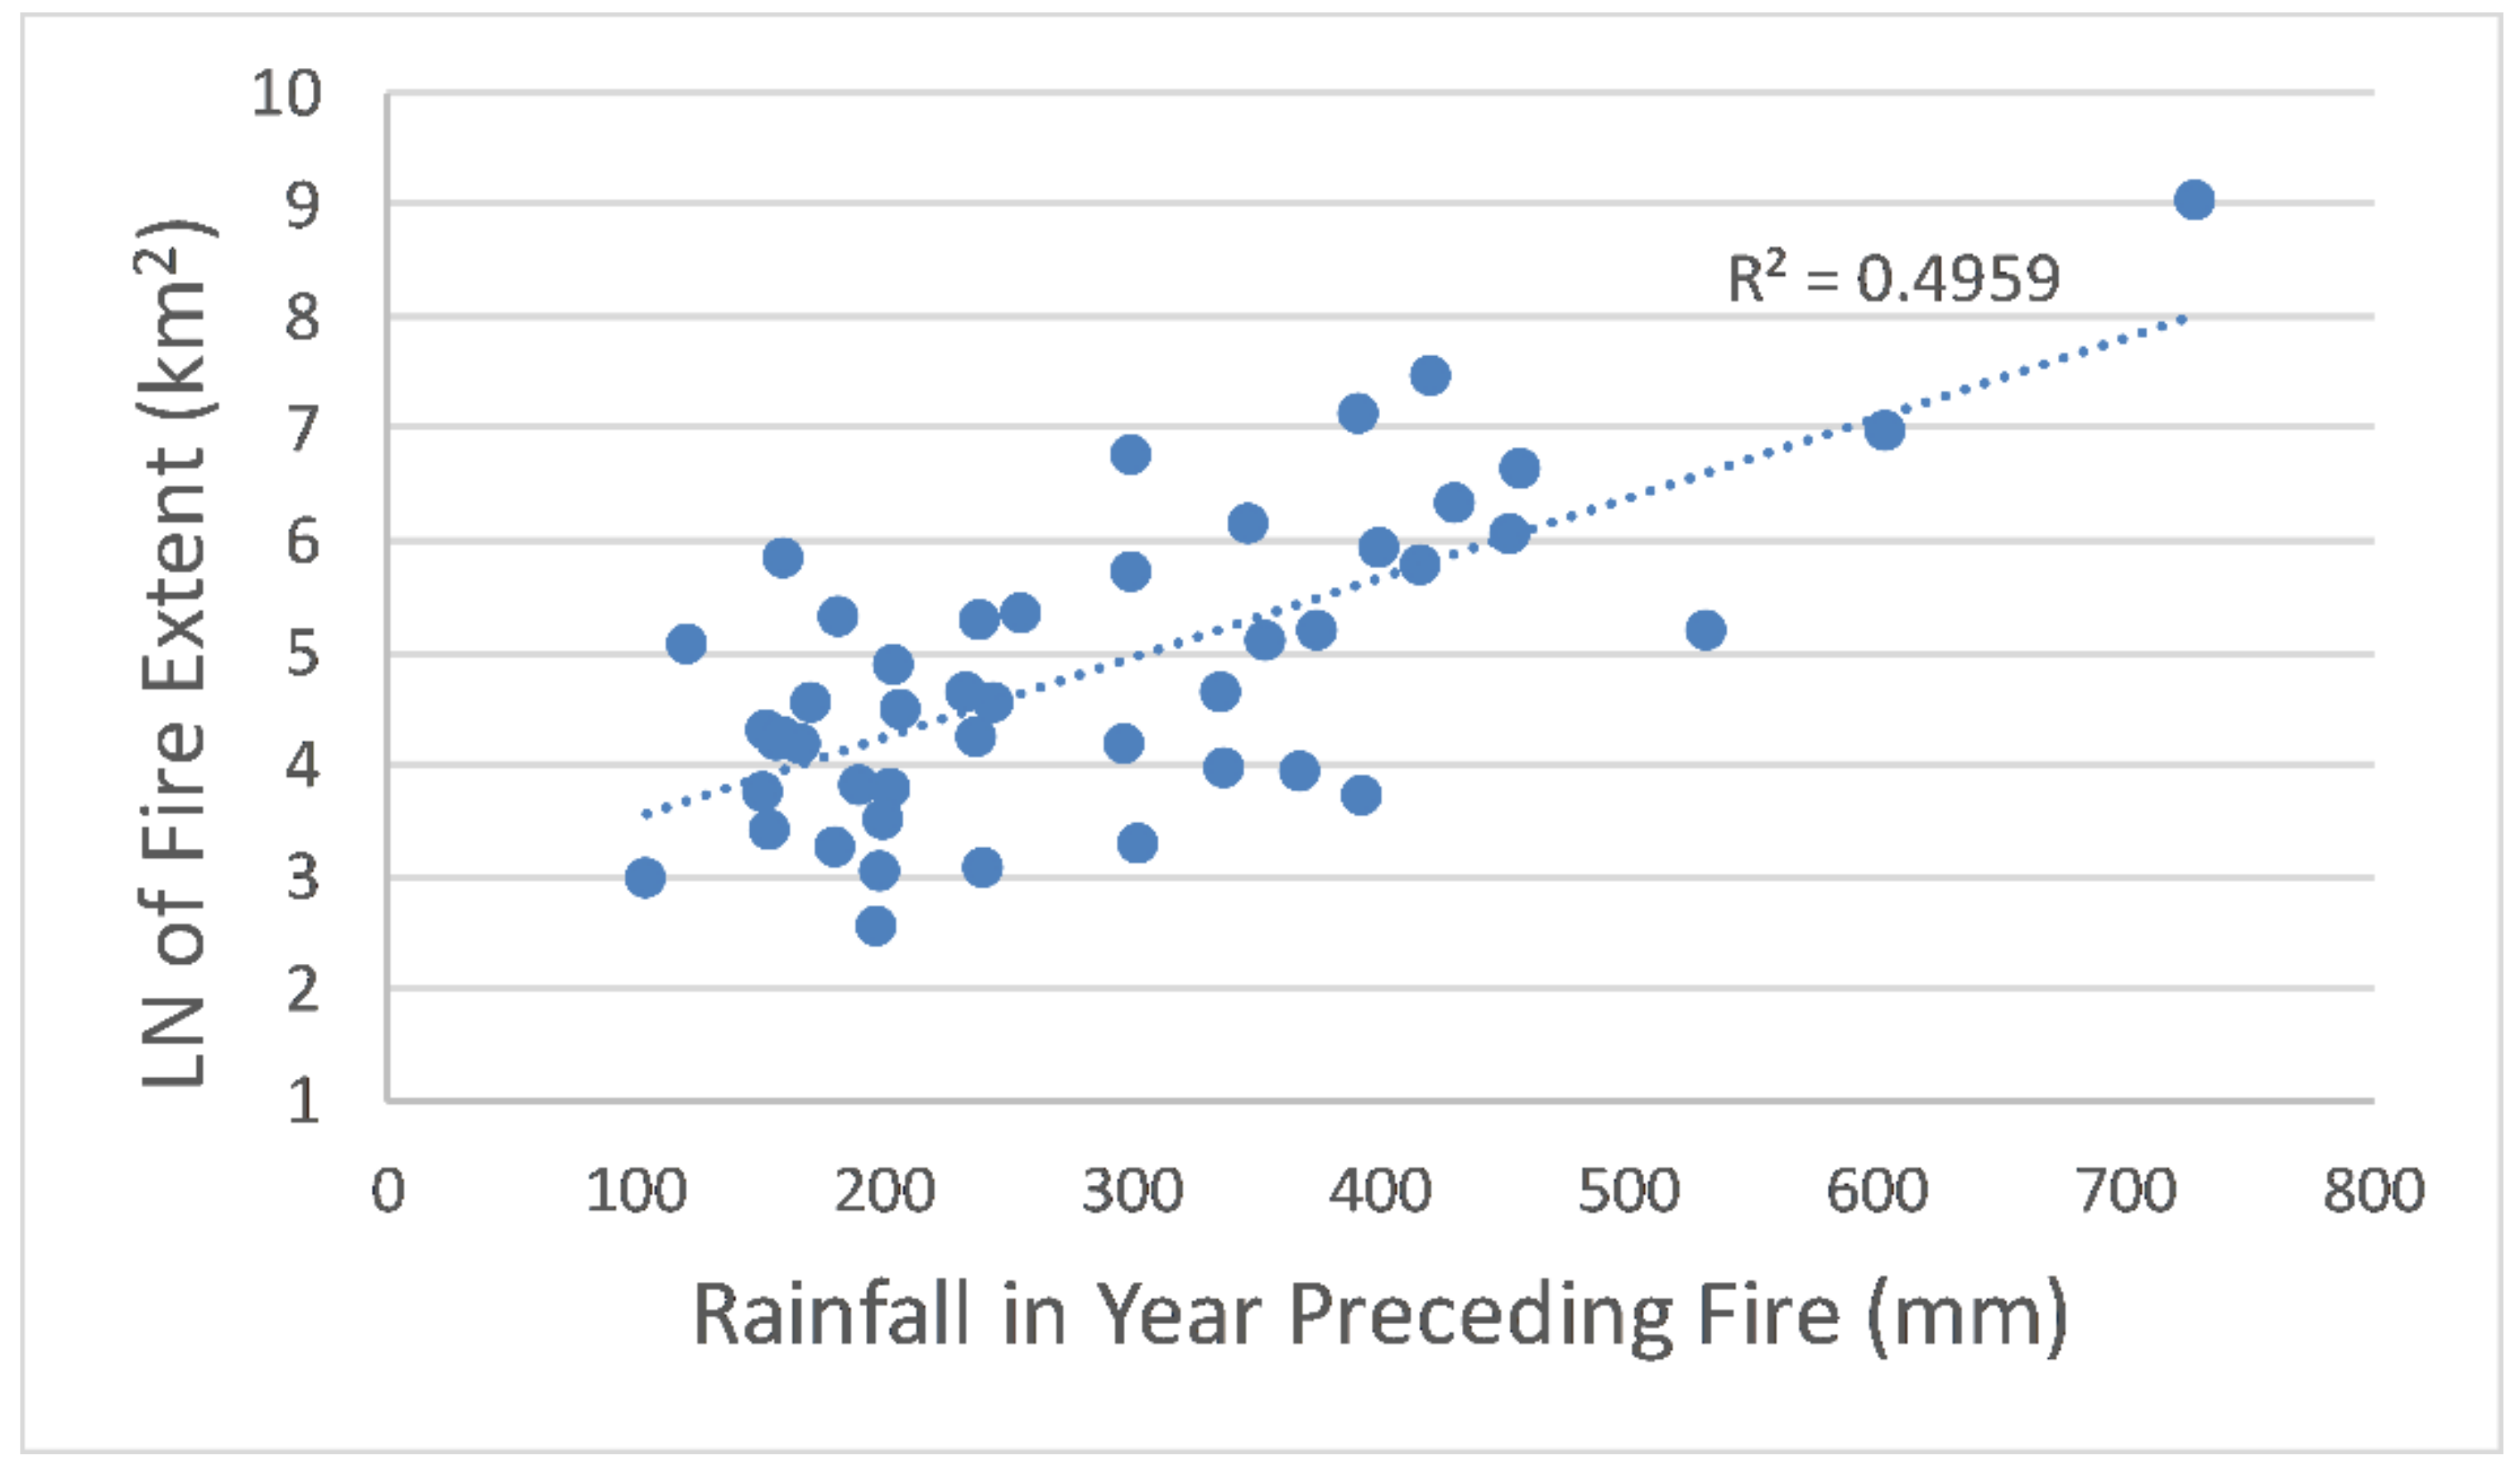
Moderately strong and statistically significant positive correlations were found between cumulative rainfall in the previous year and fire size for both study areas (Table 3), although the logarithmic relationship was a better fit for all fires across the whole study area (Figure 7; r2 = 0.50 compared to 0.33 for linear fit). The only other significant correlation with fire size was cumulative pre-fire water deficit (P-E) in the year prior to fire (less water deficit corresponding to bigger fires for northern study area only; Table 3). Multiple linear regression showed that rainfall in the year preceding fire was prominent in all the best (most parsimonious) models explaining variation in fire size (both untransformed and log transformed; Table 4). The models for the southern study area also included rainfall in three months prior to fire (with a negative coefficient), suggesting the combination of a wet period followed by shorter dry period best explained variation in fire size. Temperature in months before the fire made a small contribution to improving models in the northern study area, with mean maximum temperature in three month before fire being positively linked to log-transformed fire size in the context of the model (Table 4).
4. Discussion
4.1. Fire Size
The areas of fire scars we found in the Carnarvon Basin (ranging from less than 1 km2 to greater than 4000 km2, with a mean of 40.9 km2) and their size distribution (Figure 5), were comparable to those found in similar vegetation zones across Australia [3,11]. However, there was a discrepancy when comparing our results to Turner et al.’s [2] Australia-wide study of fires, which found that approximately 13% of their climatic region that included part of our southern study area burnt at least once in their six year study period (1998–2004). In comparison, we found only ~1% of our study area was burnt during this period. This discrepancy could be explained by the fact that their climatic region was much larger than our study area and experienced above-average rainfall during the period from 1996 to 2000, which could have contributed to enhanced fuel loads and some large fires outside of our study area. They also found only 1% of the climatic region that included the northern study area burnt [2], which was similar to the 2.5% of our study area burnt over the same six-year period. The northern study area had an extensive bushfire in 2012 that was not included in the Turner et al. [2] study, and exceptional fires such as this can significantly affect the calculations of average annual areas burnt skewing upwards the mean fire size. The non-linear shape of the frequency-size distribution of fires, even when log-transformed, suggests that different dominant drivers or constraints of fire size are operating between large and small-to-medium fires [11].
Large vegetation fires occurring in regions with comparable climates elsewhere on the globe tend to be less extensive than those found in this study, and in arid Australia generally. The largest bushfire recorded in eastern coastal fynbos in South Africa was 419 km2 [8], approximately five per cent the size of the 2012 fire in the northern study area. A bushfire of unusual size occurred during 2005 in southern California covering 4000 km2, with the second largest fire for the region measured at 60.7 km2 [31]. The vegetation in these regions is more fragmented due to farming and populated areas than our study area and fires are actively suppressed where possible, in contrast to our study area where fires are mostly uncontrolled wildfires (with the exception of the protected areas in the very south-west corner of the study area where some prescribed burning is practiced).
The data in this study used remotely-sensed imagery, which has limitations since the time scales are constrained with the first Landsat satellite only being launched in July 1972. Earlier imagery included aerial photography for the study region going back to 1943; however, it was decided not to use these photos because of very patchy and inconsistent coverage over the whole region [43]. Satellite imagery prior to 1988 has lower resolution than more recent imagery (60 m compared to 30 m) and consequently fewer small bushfire scars were detectable. However, we are confident that all large fires over 1 ha (our minimum mapping unit for fires) were visible during this pre-1988 period. Overall, the high spatial resolution of Landsat imagery enabled finely detailed spatial patterns of fire scars to be accurately mapped and analysed, and for this reason was preferred over more frequent, but coarser, imagery such as AVHRR (~1 km2 resolution). In the earlier imagery, there was also potential observer bias since it was easier to determine fire scars on more densely vegetated ground, such as hummock grasslands, which grow along the coast in the northern part of the study area, than some of the other vegetation types. As very few areas experienced two or more fires during the study period, fire intervals could not be reliably estimated via survival analysis or other means, although this could be remedied if a longer time sequence of fire events is obtained (such as by using dendrochronology [6]).
4.2. Hummock Grassland vs. Wooded Vegetation
A far greater proportion of hummock grassland burnt during the study period than Acacia woodlands and shrublands, especially in the northern study area (where ~70% of hummock grassland burnt at least once). Hummock grassland also burnt more frequently and had a greater number of fires than Acacia shrubland and woodland, with large, infrequent fires accounting for most of the burnt area in these latter vegetation groups. A very low proportion of succulent shrublands (comprised of mainly chenopods) and no mulga woodlands were burnt during the study period, which is in line with other studies [19,44], although mulga woodland was very uncommon in the study area (compared to the adjacent Murchison bioregion where extensive areas of mulga occur [19]).
The vegetation association that had the largest percentage area burnt (3432.1—mosaic Acacia low woodlands/shrublands: Acacia coriacea, Acacia sclerosperma, Acacia victoriae and Acacia subtessarogona, and other species including Senna charlesiana, Eremophila forrestii, Grevillea eriostachya, and Stylobasium spathulatum [39]; Table S4) consisted of Acacia woodlands and shrublands on extensive red sandplains. It was found that 85% of this vegetation association burnt during the extensive 2012 bushfires in the northern study area. This is contrary to what would be expected since Acacia-dominated vegetation is known to have low flammability [20,23], although outside of 2012, very little of the Acacia shrublands burnt during the study period. Since this vegetation grows on sandy soil, it is likely that there were, at times, sufficient perennial grasses and ephemeral species to provide a continuous fuel load which would have allowed the fires to proliferate under suitable weather conditions [19,20].
4.3. Rainfall and Ephemeral Species
It was found that the two study areas had similar climatic factors driving fire size, namely enhanced pre-fire rainfall the year preceding the fire, with a combination of a wet period followed by a hot-dry spell resulting in the largest fires. This is somewhat different to the study in central and eastern arid Australia, which found a positive correlation with two year cumulative rainfall and negative correlation with rainfall the year of fire event [17], although we more precisely matched pre-fire rainfall and temperature to fire events in time and space. Although well-above average antecedent rainfall is most important, a hot-dry spell closer to the bushfire event also contributes to fire size. For extensive Acacia shrublands and woodlands of the northern study area, with their relatively open structure and low shrub/tree densities, this suggests abundant growth and then curing of ephemeral plants is the main fire driver. Somewhat more surprisingly, the relationship also holds for the southern area, where shrub vegetation is denser and generally capable of carrying a crown fire [22]. Here, ample rain is likely to be increasing fuel by driving shrub growth or increases in ground cover (or both), but also there may be a pre-fire drought effect in these denser shrublands, which makes the vegetation more fire prone [45,46]. For both areas, on-ground monitoring of fuel load dynamics is recommended to confirm these speculated causal relationships between weather, fuel and fire.
Hummock grass and arid Acacia ecosystems both increase fuel loads after rain, but Triodia hummocks tends to accumulate fuel, whereas such fuel pulses are largely ephemeral (annual grasses and forbs) in Acacia vegetation [47]. Further to this as Triodia grows, the fuel becomes more continuous and therefore is conducive to burning [4]. This is shown in that 68% of hummock grassland burnt at least once during the study period, which is the highest for all vegetation groups. This is similar to what Brooks and Matchett [28] found in the Mojave Desert, namely that high rainfall years allow continuity of vegetation cover, which in turn promotes larger fires. Littell et al. [48] found in the deserts of western United States of America that increased precipitation the year prior has more impact on bushfires than warmer temperatures or drought the year of the fire; this is similar to the results of this study.
The fires in early 2012 were preceded by abnormally high rainfall in the last week of December 2010, and well-above average rainfall during March–May 2011 [49]; after these rains it was dry in the second half of 2011, and fires started late December 2011 burning through to February 2012. There was therefore around 12 months between the onset of above average rainfall and the fires. While this was the only very large fire during the study period, and the only one burning predominantly Acacia shrublands (other northern fires were largely in hummock grasslands), this suggests that well-above average rainfall followed by hot conditions leads to large fires in the northern study area, although a longer time sequence needs to be studied to confirm this relationship. Other very large fires in Acacia shrublands of the Carnarvon region have been reported in January 1894, summer 1923/3, and early 1964 [50]—each of these, as well as the 2012 fires, were associated with rainfall in excess of 500 mm in the seven to 18 month period prior to fire (i.e., over twice the average rainfall) combined with <60 mm in the 6 months prior to fire [49]. Further, large fires have also occurred more recently in the northern study region following above-average rainfall (November and December 2015), including some reburning of areas burnt in the 2012 wildfires. This suggests fire thresholds may be operating within the arid Acacia shrublands in terms of a certain amount of sustained high rainfall being required for fuel production followed by a dry period for grass curing and decreased fuel moisture. Rainfall was also high in 1974–1975 and 1998–1999 in the northern study area; however, there is little evidence of enhanced fire following these times—therefore other factors, such as fire weather, especially sustained strong winds, may also be important in promoting large fires once fuels are established.
5. Conclusions
Our study supports the central importance of vegetation type for fire activity in arid and semi-arid Australia, with hummock grasslands and heathlands (and other dense shrub-dominated ecosystems) being more fire prone than more open Acacia-dominated shrublands and woodlands. Further, periods of enhanced rainfall in year before fire are typically required to generate sufficient fuels loads and/or more connected fuels. Once fuels have accumulated, a subsequent dry period allows for the curing of fuel, and if fire weather conditions are present extensive bushfires can result such as the 2012 event. However, overall, fire is a relatively uncommon event in this arid region, with the majority of land not experiencing fire over our 40-year study period. Future climate projections predict increased rainfall and temperatures for the northern study area [51], and such changes could result in an increased number and intensity of bushfires as a consequence of increased fuel loads and elevated fire danger. Future research in the region could focus on capturing more historic data on fire occurrences (e.g., via aerial photograph interpretation, dendroecology, and isotope analysis), so that fire intervals can be reliably estimated for the various vegetation types and changes in fire regime due to recent climate change can be evaluated.
Supplementary Materials
The following are available online at https://0-www-mdpi-com.brum.beds.ac.uk/2571-6255/1/3/51/s1, Table S1: Beard (1996) vegetation associations classified into vegetation groups; Table S2: Classifications of vegetation associations into vegetation groups and their descriptions; Table S3: Digital datasets used for mapping and spatial analyses; Table S4: Percentage burnt of NVIS (National Vegetation Information System) vegetation associations; Figure S1: Satellite image from December 2002 showing an example of a fire scar.
Author Contributions
Conceptualization, methodology and analyses, M.L., E.J.B.v.E. and W.D.S.; writing—original draft preparation, M.L.; writing—review and editing, M.L., E.J.B.v.E. and W.D.S.; supervision, E.J.B.v.E. and W.D.S.
Funding
This research received no external funding.
Acknowledgments
The School of Science at Edith Cowan University is thanked for contributing to the equipment and resources needed for this project.
Conflicts of Interest
The authors declare no conflicts of interest.
References
- Russell-Smith, J.; Yates, C.P.; Whitehead, P.J.; Smith, R.; Craig, R.; Allan, G.E.; Thackway, R.; Frakes, I.; Cridland, S.; Meyer, M.C.P.; et al. Bushfires ‘down under’: Patterns and implications of contemporary Australian landscape burning. Int. J. Wildl. Fire 2007, 16, 361–377. [Google Scholar] [CrossRef]
- Turner, D.; Ostendorf, B.; Lewis, M. An introduction to patterns of fire in arid and semi-arid Australia, 1998–2004. Rangel. J. 2008, 30, 95–107. [Google Scholar] [CrossRef]
- Allan, G.E. Managing fire in the southern Tanami Desert. In Desert Fire: Fire and Regional Land Management in the Arid Landscapes of Australia; DKCRC Report 37; Edwards, G.P., Allan, G.E., Eds.; Desert Knowledge Cooperative Research Centre: Alice Springs, Australia, 2009; pp. 17–78. ISBN 174158112. [Google Scholar]
- Van Etten, E.J.B.; Burrows, N.D. Fire regimes and ecology of arid Australia. In On the Ecology of Australia’s Arid Zone; Lambers, H., Ed.; Springer Nature Publishing: Cham, Switzerland, 2018; pp. 243–282. [Google Scholar]
- Wittkuhn, R.S.; Hamilton, T.; McCaw, L. Fire interval sequences to aid in site selection for biodiversity studies: Mapping the fire regime. Proc. R. Soc. Qld. 2009, 115, 101–110. [Google Scholar]
- O’Donnell, A.J.; Boer, M.M.; McCaw, W.L.; Grierson, P.F. Vegetation and landscape connectivity control wildfire intervals in unmanaged semi-arid shrublands and woodlands in Australia. J. Biogeogr. 2011, 38, 112–124. [Google Scholar] [CrossRef]
- Nano, C.E.; Clarke, P.J. Woody-grass ratios in a grassy arid system are limited by multi-causal interactions of abiotic constraint, competition and fire. Oecologia 2010, 162, 719–732. [Google Scholar] [CrossRef] [PubMed]
- Kraaij, T.; Baard, J.A.; Cowling, R.M.; van Wilgen, B.W.; Das, S. Historical fire regimes in a poorly understood, fire-prone ecosystem: Eastern coastal fynbos. Int. J. Wildl. Fire 2013, 22, 277–287. [Google Scholar] [CrossRef]
- Díaz-Delgado, R.; Pons, X. Spatial patterns of forest fires in Catalonia (NE of Spain) along the period 1975–1995: Analysis of vegetation recovery after fire. For. Ecol. Manag. 2001, 147, 67–74. [Google Scholar] [CrossRef]
- Allan, G.E.; Southgate, R.I. Fire regimes in the spinifex landscapes of Australia. In Flammable Australia: The Fire Regimes and Biodiversity of a Continent; Bradstock, R.A., Williams, J.E., Gill, A.M., Eds.; Cambridge University Press: Cambridge, UK, 2002; pp. 145–176. [Google Scholar]
- O’Donnell, A.J.; Boer, M.M.; McCaw, W.L.; Grierson, P.F. Scale-dependent thresholds in the dominant controls of wildfire size in semi-arid southwest Australia. Ecosphere 2014, 5, 93. [Google Scholar] [CrossRef]
- Griffin, G.F.; Friedel, M.H. Effects of fire on central Australian rangelands. I Fire and fuel characteristics and changes in herbage and nutrients. Aust. J. Ecol. 1984, 9, 381–393. [Google Scholar] [CrossRef]
- Cruz, M.G.; Gould, J.S.; Hollis, J.J.; McCaw, W.L. A Hierarchical classification of wildland fire fuels for Australian vegetation types. Fire 2018, 1, 13. [Google Scholar] [CrossRef]
- Bradstock, R.A.; Hammill, K.A.; Collins, L.; Price, O. Effects of weather, fuel and terrain on fire severity in topographically diverse landscapes of south-eastern Australia. Landsc. Ecol. 2010, 25, 607–619. [Google Scholar] [CrossRef]
- Anderson, W.R.; Cruz, M.G.; Fernandes, P.M.; McCaw, L.; Vega, J.A.; Bradstock, R.A.; Fogarty, L.; Gould, J.; McCarthy, G.; Marsden-Smedley, J.B.; et al. A generic, empirical-based model for predicting rate of fire spread in shrublands. Int. J. Wildl. Fire 2015, 24, 443–460. [Google Scholar] [CrossRef]
- Griffin, G.F.; Price, N.F.; Portlock, H.F. Wildfires in the central Australian rangelands, 1970–1980. J. Environ. Manag. 1983, 17, 311–323. [Google Scholar]
- Greenville, A.C.; Dickman, C.R.; Wardle, G.M.; Letnic, M. The fire history of an arid grassland: The influence of antecedent rainfall and ENSO. Int. J. Wildl. Fire 2009, 18, 631–639. [Google Scholar] [CrossRef]
- Sullivan, A.L.; McCaw, W.L.; Cruz, M.G.; Matthews, S.; Ellis, P.F. Fuel, fire weather and fire behaviour in Australian ecosystems. In Flammable Australia: Fire Regimes, Biodiversity and Ecosystems in a Changing World; Bradstock, R.A., Gill, A.M., Williams, R.J., Eds.; CSIRO Publishing: Collingwood, Australia, 2012; pp. 51–79. [Google Scholar]
- Ward, B.G.; Bragg, T.B.; Hayes, B.A. Relationship between fire-return interval and mulga (Acacia aneura) regeneration in the Gibson Desert and Gascoyne–Murchison regions of Western Australia. Int. J. Wildl. Fire 2014, 23, 394–402. [Google Scholar] [CrossRef]
- Ward, B.G.; Bragg, T.B.; Hayes, B.A. Effects of chaining and burning in Acacia ramulosa shrublands of the Peron Peninsula, Shark Bay, Western Australia. Int. J. Wildl. Fire 2018, 27, 623–635. [Google Scholar] [CrossRef]
- Enright, N.J.; Keith, D.; Clarke, M.; Miller, B.P. Fire regimes in Australian sclerophyllous shrubby ecosystems: Heathlands, heathy woodlands and mallee woodlands. In Flammable Australia: Fire Regimes, Biodiversity and Ecosystems in a Changing World; Bradstock, R.A., Gill, A.M., Williams, R.J., Eds.; CSIRO Publishing: Collingwood, Australia, 2012; pp. 215–234. [Google Scholar]
- Dalgleish, S.A.; van Etten, E.J.B.; Stock, W.D.; Knuckey, C. Fuel dynamics and vegetation recovery after fire in a semi-arid Australian shrubland. Int. J. Wildl. Fire 2015, 24, 613–623. [Google Scholar] [CrossRef]
- Nano, C.E.M.; Clarke, P.J.; Pavey, C.R. Fire regimes in arid hummock grasslands and Acacia shrublands. In Flammable Australia: Fire Regimes, Biodiversity and Ecosystems in a Changing World; Bradstock, R.A., Gill, A.M., Williams, R.J., Eds.; CSIRO Publishing: Collingwood, Australia, 2012; pp. 195–214. [Google Scholar]
- Burrows, N.D.; Ward, B.; Robinson, A. Fuel dynamics and fire spread in spinifex grasslands of the Western Desert. Proc. R. Soc. Qld. 2009, 115, 69–76. [Google Scholar] [CrossRef]
- Burrows, N.D.; Burbidge, A.A.; Fuller, P.J.; Behn, G. Evidence of altered fire regimes in the Western Desert region of Australia. Conserv. Sci. West. Aust. 2006, 5, 272–284. [Google Scholar]
- Burrows, N.D.; van Didden, G. Patch-burning desert nature reserves in Western Australia using aircraft. Int. J. Wildl. Fire 1991, 1, 49–55. [Google Scholar] [CrossRef]
- Van Etten, E.J.B. Inter-annual rainfall variability of arid Australia: Greater than elsewhere? Aust. Geogr. 2009, 40, 109–120. [Google Scholar] [CrossRef]
- Brooks, M.L.; Matchett, J.R. Spatial and temporal patterns of wildfires in the Mojave Desert, 1980–2004. J. Arid Environ. 2006, 67, 148–164. [Google Scholar] [CrossRef]
- Balch, J.K.; Bradley, B.A.; D’Antonio, C.M.; Gόmez-Dans, J. Introduced annual grass increases regional fire activity across the arid western USA (1980–2009). Glob. Chang. Biol. 2013, 19, 173–183. [Google Scholar] [CrossRef] [PubMed]
- Kraaij, T.; van Wilgen, B.W. Drivers, ecology, and management of fire in fynbos. In Fynbos: Ecology, Evolution, and Conservation of a Megadiverse Region; Allsopp, N., Colville, J.F., Verboom, G.A., Eds.; Oxford University Press: Oxford, UK, 2014; pp. 47–72. [Google Scholar]
- Brooks, M.L.; Minnich, R.A. Southeastern deserts bioregion. In Fire in California’s Ecosystems; Sugihara, N., Ed.; University of California Press: Berkeley, CA, USA, 2006; pp. 391–414. [Google Scholar]
- Govender, N.; Trollope, W.S.; Van Wilgen, B.W. The effect of fire season, fire frequency, rainfall and management on fire intensity in savanna vegetation in South Africa. J. Appl. Ecol. 2006, 43, 748–758. [Google Scholar] [CrossRef] [Green Version]
- Humphrey, R.R. Fire in the deserts and desert grassland of North America. In Fire and Ecosystems; Kozlowski, T.T., Ahlgren, C.E., Eds.; Academic Press: New York, NY, USA, 1974; pp. 365–400. [Google Scholar]
- Bendix, J.; Cowell, C.M. Impacts of wildfire on the composition and structure of riparian forests in southern California. Ecosystems 2010, 13, 99–107. [Google Scholar] [CrossRef]
- Hopper, S.D. Biogeographical aspects of speciation in the southwest Australian flora. Ann. Rev. Ecol. Syst. 1979, 10, 399–422. [Google Scholar] [CrossRef]
- Peel, M.C.; Finlayson, B.L.; McMahon, T.A. Updated world map of the Kӧppen-Geiger climate classification. Hydrol. Earth Syst. Sci. 2007, 4, 439–473. [Google Scholar] [CrossRef]
- Bureau of Meteorology. Climate Statistics for Australian Locations. 2016. Available online: http://www.bom.gov.au/climate/data (accessed on 20 March 2017).
- Beard, J.S. Murchison 1:1 000,000 Vegetation Series: Explanatory Notes to Sheet 5: The Vegetation of the Murchison Area; University of Western Australia Press: Nedlands, Australia, 1976. [Google Scholar]
- Beard, J.S.; Beeston, G.R.; Harvey, J.M.; Hopkins, A.J.M.; Shepherd, D.P. The vegetation of Western Australia at the 1:3,000,000 scale. Explanatory memoir, Second Edition. Conserv. Sci. West. Aust. 2013, 9, 1–152. [Google Scholar]
- Noy-Meir, I. Desert ecosystems: Environment and producers. Ann. Rev. Ecol. Syst. 1973, 4, 25–51. [Google Scholar] [CrossRef]
- Letnic, M.; Dickman, C.R. The responses of small mammals to patches regenerating after fire and rainfall in the Simpson Desert, central Australia. Austral. Ecol. 2015, 30, 24–39. [Google Scholar]
- Jeffrey, S.J.; Carter, J.O.; Moodie, K.B.; Beswick, A.R. Using spatial interpolation to construct a comprehensive archive of Australian climate data. Environ. Model. Softw. 2001, 16, 309–330. [Google Scholar] [CrossRef]
- Geoscience Australia. Aerial Photography—Flight Line Diagrams. Available online: http://www.ga.gov.au/flight-diagrams/ (accessed on 21 June 2016).
- Murphy, B.P.; Bradstock, R.A.; Boer, M.M.; Carter, J.; Cary, G.J.; Cochrane, M.A.; Fensham, R.J.; Russell-Smith, J.; Williamson, G.J.; Bowman, D.M. Fire regimes of Australia: A pyrogeographic model system. J. Biogeogr. 2013, 40, 1048–1058. [Google Scholar] [CrossRef]
- Bradstock, R.A. A biogeographic model of fire regimes in Australia: Current and future implications. Glob. Ecol. Biogeogr. 2010, 19, 145–158. [Google Scholar] [CrossRef]
- Pausas, J.G.; Fernández-Muñoz, S. Fire regime changes in the Western Mediterranean Basin: From fuel-limited to drought-driven fire regime. Clim. Chang. 2012, 110, 215–226. [Google Scholar] [CrossRef]
- Bowman, D.M.J.S.; Boggs, G.S.; Prior, L.D.; Krull, E.S. Dynamics of Acacia aneura—Triodia boundaries using carbon (14 C and δ13C) and nitrogen (δ15N) in soil organic matter in central Australia. Holocene 2007, 17, 311–318. [Google Scholar] [CrossRef]
- Littell, J.S.; McKenzie, D.; Peterson, D.L.; Westerling, A.L. Climate and wildfire area burned in western US ecoprovinces, 1916–2003. Ecol. Appl. 2009, 19, 1003–1021. [Google Scholar] [CrossRef]
- Bureau of Meteorology. Gascoyne River Flood. Available online: http://www.bom.gov.au/announcements/sevwx/wa/gascoyne_river/gascoyne_river.shtml (accessed on 10/09/2017).
- Burnside, D.; Holm, A.; Payne, A.; Wilson, G. Reading the Rangeland: A Guide to the Arid Shrublands of Western Australia; Department of Agriculture and Food: Perth, Australia, 1995. [Google Scholar]
- CSIRO and Bureau of Meteorology. Climate Change in Australia Information for Australia’s Natural Resource Management Regions: Technical Report; CSIRO and Bureau of Meteorology: Canberra, Australia, 2015. [Google Scholar]
Figure 1.
Area of study showing the major botanical provinces of Western Australia (shaded), with the study area (and two sub-areas) outlined, and inset showing location within Western Australia.
Figure 1.
Area of study showing the major botanical provinces of Western Australia (shaded), with the study area (and two sub-areas) outlined, and inset showing location within Western Australia.

Figure 2.
Vegetation groups of the northern study area.

Figure 3.
Vegetation groups of the southern study area.

Figure 4.
Total area burnt by bushfires and numbers of visible separate fire scars between 1973 and 2012 for total study area. Please note that no usable imagery was available for 1980 and 1985.
Figure 4.
Total area burnt by bushfires and numbers of visible separate fire scars between 1973 and 2012 for total study area. Please note that no usable imagery was available for 1980 and 1985.

Figure 5.
Distribution of fire size (dots) and fire count (bars) across the whole study area.

Figure 6.
Northern study area showing the fire scars (shaded area) of the extensive 2012 bushfire.

Figure 7.
Relationships between rainfall in the year preceding fire and fire size (expressed on a natural log scale), for all discrete fires >20km2 in size across both northern and southern study areas.
Figure 7.
Relationships between rainfall in the year preceding fire and fire size (expressed on a natural log scale), for all discrete fires >20km2 in size across both northern and southern study areas.


Table 1.
Descriptions of the vegetation groups formed by combining vegetation associations (as per Table S2).
Table 1.
Descriptions of the vegetation groups formed by combining vegetation associations (as per Table S2).
| Vegetation Group | Description | % of Study Area |
|---|---|---|
| Acacia shrubland | Open to mid-dense shrublands (2–3 m high) on red sandplains and dunes dominated by Acacia with some Callitris and mallee (both very sparse). Dominated by Acacia ramulosa and A. linophylla, referred to as bowgada by Beard, and A. sclerosperma [39]. Mulga (Acacia aneura) is absent from this vegetation group, or may occur as a minor element only. | 53.7% |
| Acacia woodland | Consists of low open woodland with no mulga. The vegetation is low open woodland (2–4 m) on stony plains located mostly in the northern study area adjacent to Acacia shrublands, and often with the same dominant species, mixed with Acacia xiphophylla (snakewood) and A. victoriae. | 11.4% |
| Heathland | Comprises heathland and low scrub (<2 m) of proteaceous heath on sandplain, A. rostellifera on coastal dunes and some sparse mallee shrublands located on the coastal plain north of Kalbarri. | 12.6% |
| Mulga woodland | Contains low mulga (Acacia aneura s.l.) woodland (2–8 m) with other Acacia species situated mostly west of the Murchison River along floodplains and creeklines, and on washplains, stony plains and red loams. Mulga Woodland is the dominant vegetation on red loamy soil such those as found in the very eastern edge of the study area and on the Yilgarn Craton, whereas the majority of the rest of the study area consists of sandy soils. | 0.6% |
| Hummock grassland | Found on sandplains and dunes in the northern study area with isolated areas in the southern study area. The two main areas of hummock grassland in the northern study area are on sand dunes of the Kennedy Range where mid-dense Triodia basedowii occurs with scattered shrubs of Grevillea, Hakea and Hibbertia, and on the coastal plain on the west side of Lake Macleod where T. basedowii is also dominant but with very sparse Acacia shrubs. | 4.4% |
| Succulent shrubland | The vegetation contains samphire shrubland dominated by Tecticornia species around salt lakes as well as Atriplex species and Maireana species on mudflats and low floodplains, sometimes mixed with islands of Acacia shrubs [39]. | 13.7% |
| Other | Includes mangrove and other (minor) miscellaneous types such as bare areas (e.g., salt lake flats) and York gum woodlands. | 3.6% |
Table 2.
Cumulative area of burning for each major vegetation group relative to the size of each vegetation type in both the northern and southern study areas over the years 1973–2012.
Table 2.
Cumulative area of burning for each major vegetation group relative to the size of each vegetation type in both the northern and southern study areas over the years 1973–2012.
| Vegetation Group | Study Area km2 | % of Study Area | Burnt Area km2 | % of Burnt Area | % Vegetation Burnt |
|---|---|---|---|---|---|
| Northern Study Area | |||||
| Acacia Shrubland | 15,711 | 42.6 | 4467 | 41.6 | 28.4 |
| Acacia Woodland | 7437 | 20.2 | 3379 | 31.5 | 45.4 |
| Mulga Woodland | 399 | 1.1 | 0 | 0.0 | 0.0 |
| Hummock Grassland | 2460 | 6.7 | 1669 | 15.5 | 67.9 |
| Succulent Shrubland | 8555 | 23.2 | 1210 | 11.3 | 14.1 |
| Other | 2286 | 6.2 | 14 | 0.1 | 0.6 |
| TOTAL | 36,848 | 100.0 | 10,739 | 100 | 29.1 |
| Southern Study Area | |||||
| Acacia Shrubland | 19,604 | 67.9 | 393 | 8.0 | 2.0 |
| Heathland | 8281 | 28.7 | 4496 | 91.9 | 54.3 |
| Hummock Grassland | 424 | 1.5 | 0 | 0.0 | 0.0 |
| Succulent Shrubland | 442 | 1.5 | 0 | 0.0 | 0.0 |
| Other | 126 | 0.4 | 3 | 0.1 | 2.4 |
| TOTAL | 28,876 | 100.0 | 4893 | 100 | 16.9 |
Table 3.
Pearson correlation coefficients and two-tailed significance for correlations between fire size and weather variables (significant variables in bold). Month refers to month of fire, whereas all other variables are in the preceding months before the fire.
Table 3.
Pearson correlation coefficients and two-tailed significance for correlations between fire size and weather variables (significant variables in bold). Month refers to month of fire, whereas all other variables are in the preceding months before the fire.
| Study Area | Northern | Southern | |||
|---|---|---|---|---|---|
| Variable | Period | Correlation | p Value | Correlation | p Value |
| Rainfall | Month | −0.126 | 0.58 | 0.042 | 0.85 |
| (cumulative) | 3 months | −0.068 | 0.76 | −0.012 | 0.96 |
| 6 months | 0.144 | 0.52 | 0.328 | 0.12 | |
| 1 year | 0.652 | <0.001 | 0.619 | <0.001 | |
| 2 years | 0.309 | 0.16 | 0.322 | 0.12 | |
| 4 years | 0.282 | 0.20 | 0.193 | 0.37 | |
| Temperature | Month | −0.016 | 0.94 | 0.176 | 0.41 |
| (average maximum) | 3 months | −0.073 | 0.75 | 0.083 | 0.70 |
| 6 months | −0.187 | 0.41 | −0.060 | 0.78 | |
| 1 year | −0.140 | 0.53 | −0.133 | 0.54 | |
| P-E (cumulative) | 3 months | 0.020 | 0.93 | −0.119 | 0.58 |
| 6 months | 0.209 | 0.35 | 0.048 | 0.82 | |
| 1 year | 0.582 | 0.005 | 0.218 | 0.31 | |
Table 4.
Best models explaining variation in fire size as chosen using lowest AICC (Akaike Information Criteria Corrected for small sample size) values from all subsets of weather predictor variables (only models within two AICC values of best model are displayed).
Table 4.
Best models explaining variation in fire size as chosen using lowest AICC (Akaike Information Criteria Corrected for small sample size) values from all subsets of weather predictor variables (only models within two AICC values of best model are displayed).
| Study Area | Dependent Variable | Predictors | Coefficient | t | Prob. | AICC | Adj R2 |
|---|---|---|---|---|---|---|---|
| Northern | Fire size | 1 year Rain | 10.56 | 4.0 | 0.001 | 320.9 | 0.48 |
| 2 year Rain | −3.74 | −1.8 | 0.088 | ||||
| Fire size | 1 year Rain | 6.95 | 3.8 | 0.001 | 321.7 | 0.40 | |
| Northern | Ln (Fire size) | 1 year Rain | 0.007 | 5.1 | <0.001 | 7.01 | 0.54 |
| Ln (Fire size) | 1 Year Rain | 0.006 | 4.3 | 0.001 | 8.41 | 0.59 | |
| 6 month Temp | −0.395 | −2.2 | 0.044 | ||||
| 3 month Temp | 0.480 | 2.1 | 0.052 | ||||
| Ln (Fire size) | 1 Year Rain | 0.008 | 5.1 | <0.001 | 8.70 | 0.57 | |
| 3 month Temp | 0.059 | 2.7 | 0.039 | ||||
| Southern | Fire size | 1 year Rain | 2.12 | 4.6 | <0.001 | 251.8 | 0.45 |
| 3 month Rain | −6.05 | −2.2 | 0.038 | ||||
| Southern | Ln (Fire size) | 1 year Rain | 0.010 | 4.5 | <0.001 | -6.38 | 0.45 |
| 3 month Rain | −0.032 | −2.5 | 0.019 |
© 2018 by the authors. Licensee MDPI, Basel, Switzerland. This article is an open access article distributed under the terms and conditions of the Creative Commons Attribution (CC BY) license (http://creativecommons.org/licenses/by/4.0/).
Share and Cite
MDPI and ACS Style
Ladbrook, M.; J. B. van Etten, E.; D. Stock, W. Contemporary Fire Regimes of the Arid Carnarvon Basin Region of Western Australia. Fire 2018, 1, 51. https://0-doi-org.brum.beds.ac.uk/10.3390/fire1030051
AMA Style
Ladbrook M, J. B. van Etten E, D. Stock W. Contemporary Fire Regimes of the Arid Carnarvon Basin Region of Western Australia. Fire. 2018; 1(3):51. https://0-doi-org.brum.beds.ac.uk/10.3390/fire1030051
Chicago/Turabian StyleLadbrook, Megan, Eddie J. B. van Etten, and William D. Stock. 2018. "Contemporary Fire Regimes of the Arid Carnarvon Basin Region of Western Australia" Fire 1, no. 3: 51. https://0-doi-org.brum.beds.ac.uk/10.3390/fire1030051