1. Introduction
During the ignition and development phases of a fire, besides examining the production of smoke and toxic gases, we must analyze the increasing temperature over time (to check if the structures are able to resist the thermal stresses) [
1,
2]. Most victims die of asphyxiation and intoxication due to a high concentration of products of the combustion (CO, CO
2, HCN, Sox, NOx) [
3]. Those gases, at high temperatures, can cause: burns, eye irritation and breathing problems, provoking death even if the subject was not exposed directly to the flames [
4,
5]. The smoke, whose color is determined by the materials involved in the combustion, tends to decrease visibility, thus making it hard for the victim to escape and for the rescue squad to help [
6,
7]. Hence it is vital, during the first stage of the fire development, to make the subject escape, in order to let them be safe and for the firefighters to able to operate and make the structure safe during the fire’s development [
8,
9].
In order to have safe conditions indoors, it is important to examine parameters as the fire position, the amount of combustible materials and the extension of the ventilation openings affecting the possible occurrence of the flashover, which is the exact moment after the fire has completely developed [
10,
11]. Once it reaches this phase, the only procedure that can be adopted is to keep under control the fire until the combustible flame has been extinguished [
12]. The different stages characterizing the development of the fire (pre and post flashover) are affected by the values of the RHR (Rate of Heat Released), which is related to the thermal power [kW] released and to the velocity of the process [
13,
14]. The RHR is influenced by the flame speed, amount of air available and exchange rate and it is important to determine the value of the RHR
lim which, if not exceeded, will not allow the fire to reach the flashover. This is due to the temperature that is reached in the area: it is necessary to avoid a temperature (about 500 °C) that may break windows. Indeed, such a condition provokes the addition of a combustive agent which feeds the flames. If this situation cannot be prevented, the resistance of the structure must be guaranteed for a time interval to let the rescue squads operate in safe conditions during the development of the fire until its decay (which is when the combustible present is extinguished). This is why it is important to examine the inside temperature during the post flashover phase [
15]. Two different approaches can be identified for the analysis of the fire during the post flashover phase. The first one follows a prescriptive approach and examines the thermal actions of the nominal fire on the constructive elements. The second uses assessment codes on a performance-basis whose complexity can be modified according to the accuracy required by the evaluation [
16].
The prescriptive approach, which describes conventional fires, uses models of nominal fire and it is still commonly used in some countries (e.g., Italy). The only input data required is the time, while the only output data provided is the temperature of the gases with respect to time T (t), without taking into consideration the external structure of the building and the spatial distribution of the combustible. The procedure leads to the evaluation of the nominal curves of the standard fire (T-t) identified by the regulation EN 1991-1-2 [
17]. With respect to the fire load present in the area, it is possible to identify the maximum temperature reached. Hence it is important to avoid a flashover phase by setting a maximum time limit (t
lim) based on the volume of O
2 characterizing the area. It is then possible to determine the maximum equivalent allowed load of wood, that is the amount combusting during this time interval. The architect/engineer has to avoid a value of the aforementioned equivalent load which is higher than the one set by the regulations with the goal not to exceed the value of RHR
lim [
18,
19]. Such a method does not take into consideration either the type of activity or the type of combustible and it can be applied easily because any type of fire can be connected to the trend of the curve (T-t) provided by the prescriptive method. Sometimes this procedure is considered too strict and cautious compared to the safety conditions required, leaving the minimum level of discretion to those working in the field of fire safety systems.
Otherwise, it is possible to use a different approach, the Fire Safety Engineering approach, which is able to predict the dynamic-evolution of the fire through the exertion of assessment models [
20]. This method is used in different countries (especially English-speaking ones) whereas in Italy it is optional and the architect/designer can use it at his/her discretion. This method examines the thermal actions with respect to physical models and can be used to describe any type of fire through fire growth models which can be either simplified or advanced (the advanced ones use the curves of heat release RHR(t) which are devoid of any limit for their application and can lead to CFD simulations). Hence it is possible to determine, in a detailed way, how the fire affects the building, people and furniture and its consequences. The main advantage of this method is the extreme flexibility permitting the simulation of complex types of fire with a previous evaluation of some input data (geometry of the assessment domain, type and amount of the combustible present, ventilation, RHR curve: Release Heat Rate/time and so on) that have to be assigned a variable data based on the type of the model. Therefore, the exactitude of the simulation results depends on the level of realism of the simulation model and the input data. This represents a limitation of such an approach: the experimental validation of the used model sometimes can represent a problem due to the destructive nature of the tests that have to be performed. Moreover, complex field models require long assessment and time intervals.
2. Purpose of the Work
Taking as an example a case study and using performance-based methods, the authors examined how the fire development is controlled by both the combustible and the ventilation. The main goal was to provide a general analysis and determine what values of parameters such as fire load and opening factors of the area lead to a fire: (i) causing temperatures that if not exceeded guarantee the stability of the structures (planned according to the REI parameters) during the safety measures carried out by the firefighters; (ii) developing, in the area, temperatures that if exceeded the thermal fluxes must be kept under control to guarantee the mechanical stability of the structures. In this case it is important for the architect/engineer to adopt a planning approach with automatic fire suppression systems.
This is why an analysis of the security level of the structures was carried out through the comparison of the curves (T-t) during the post flashover phase, while assessing the nominal curve (prescriptive method) and comparing it to the natural curve (performance-based methods that take into consideration the variation in the load values of combustible “q” and the opening factor “O”) [
21]. When the nominal curve ISO 834 [
22] presents lower temperatures than those of the natural curves, the stability of the structures cannot be guaranteed. The results, which were parameterized based on variation in the type of building, “q” and “O” gave the possibility to realize a graph able to provide some information to architects/designers when installing fire prevention systems. Indeed, if a structure presents those systems, it is possible to mitigate the temperatures in the presence of fire in order to guarantee the stability of the structure and permit the rescue squads to operate in safe conditions while suppressing the fire.
The analysis performed was useful to provide an easy-to-read graph based on the type of building and the values of “q” and “O”. It might represent a guide for the architect/designer to carry out, in an early design phase, planning that takes into consideration the necessary fire prevention systems for the structure examined (in respect to the most important existing normative).
3. Methods and Assessments
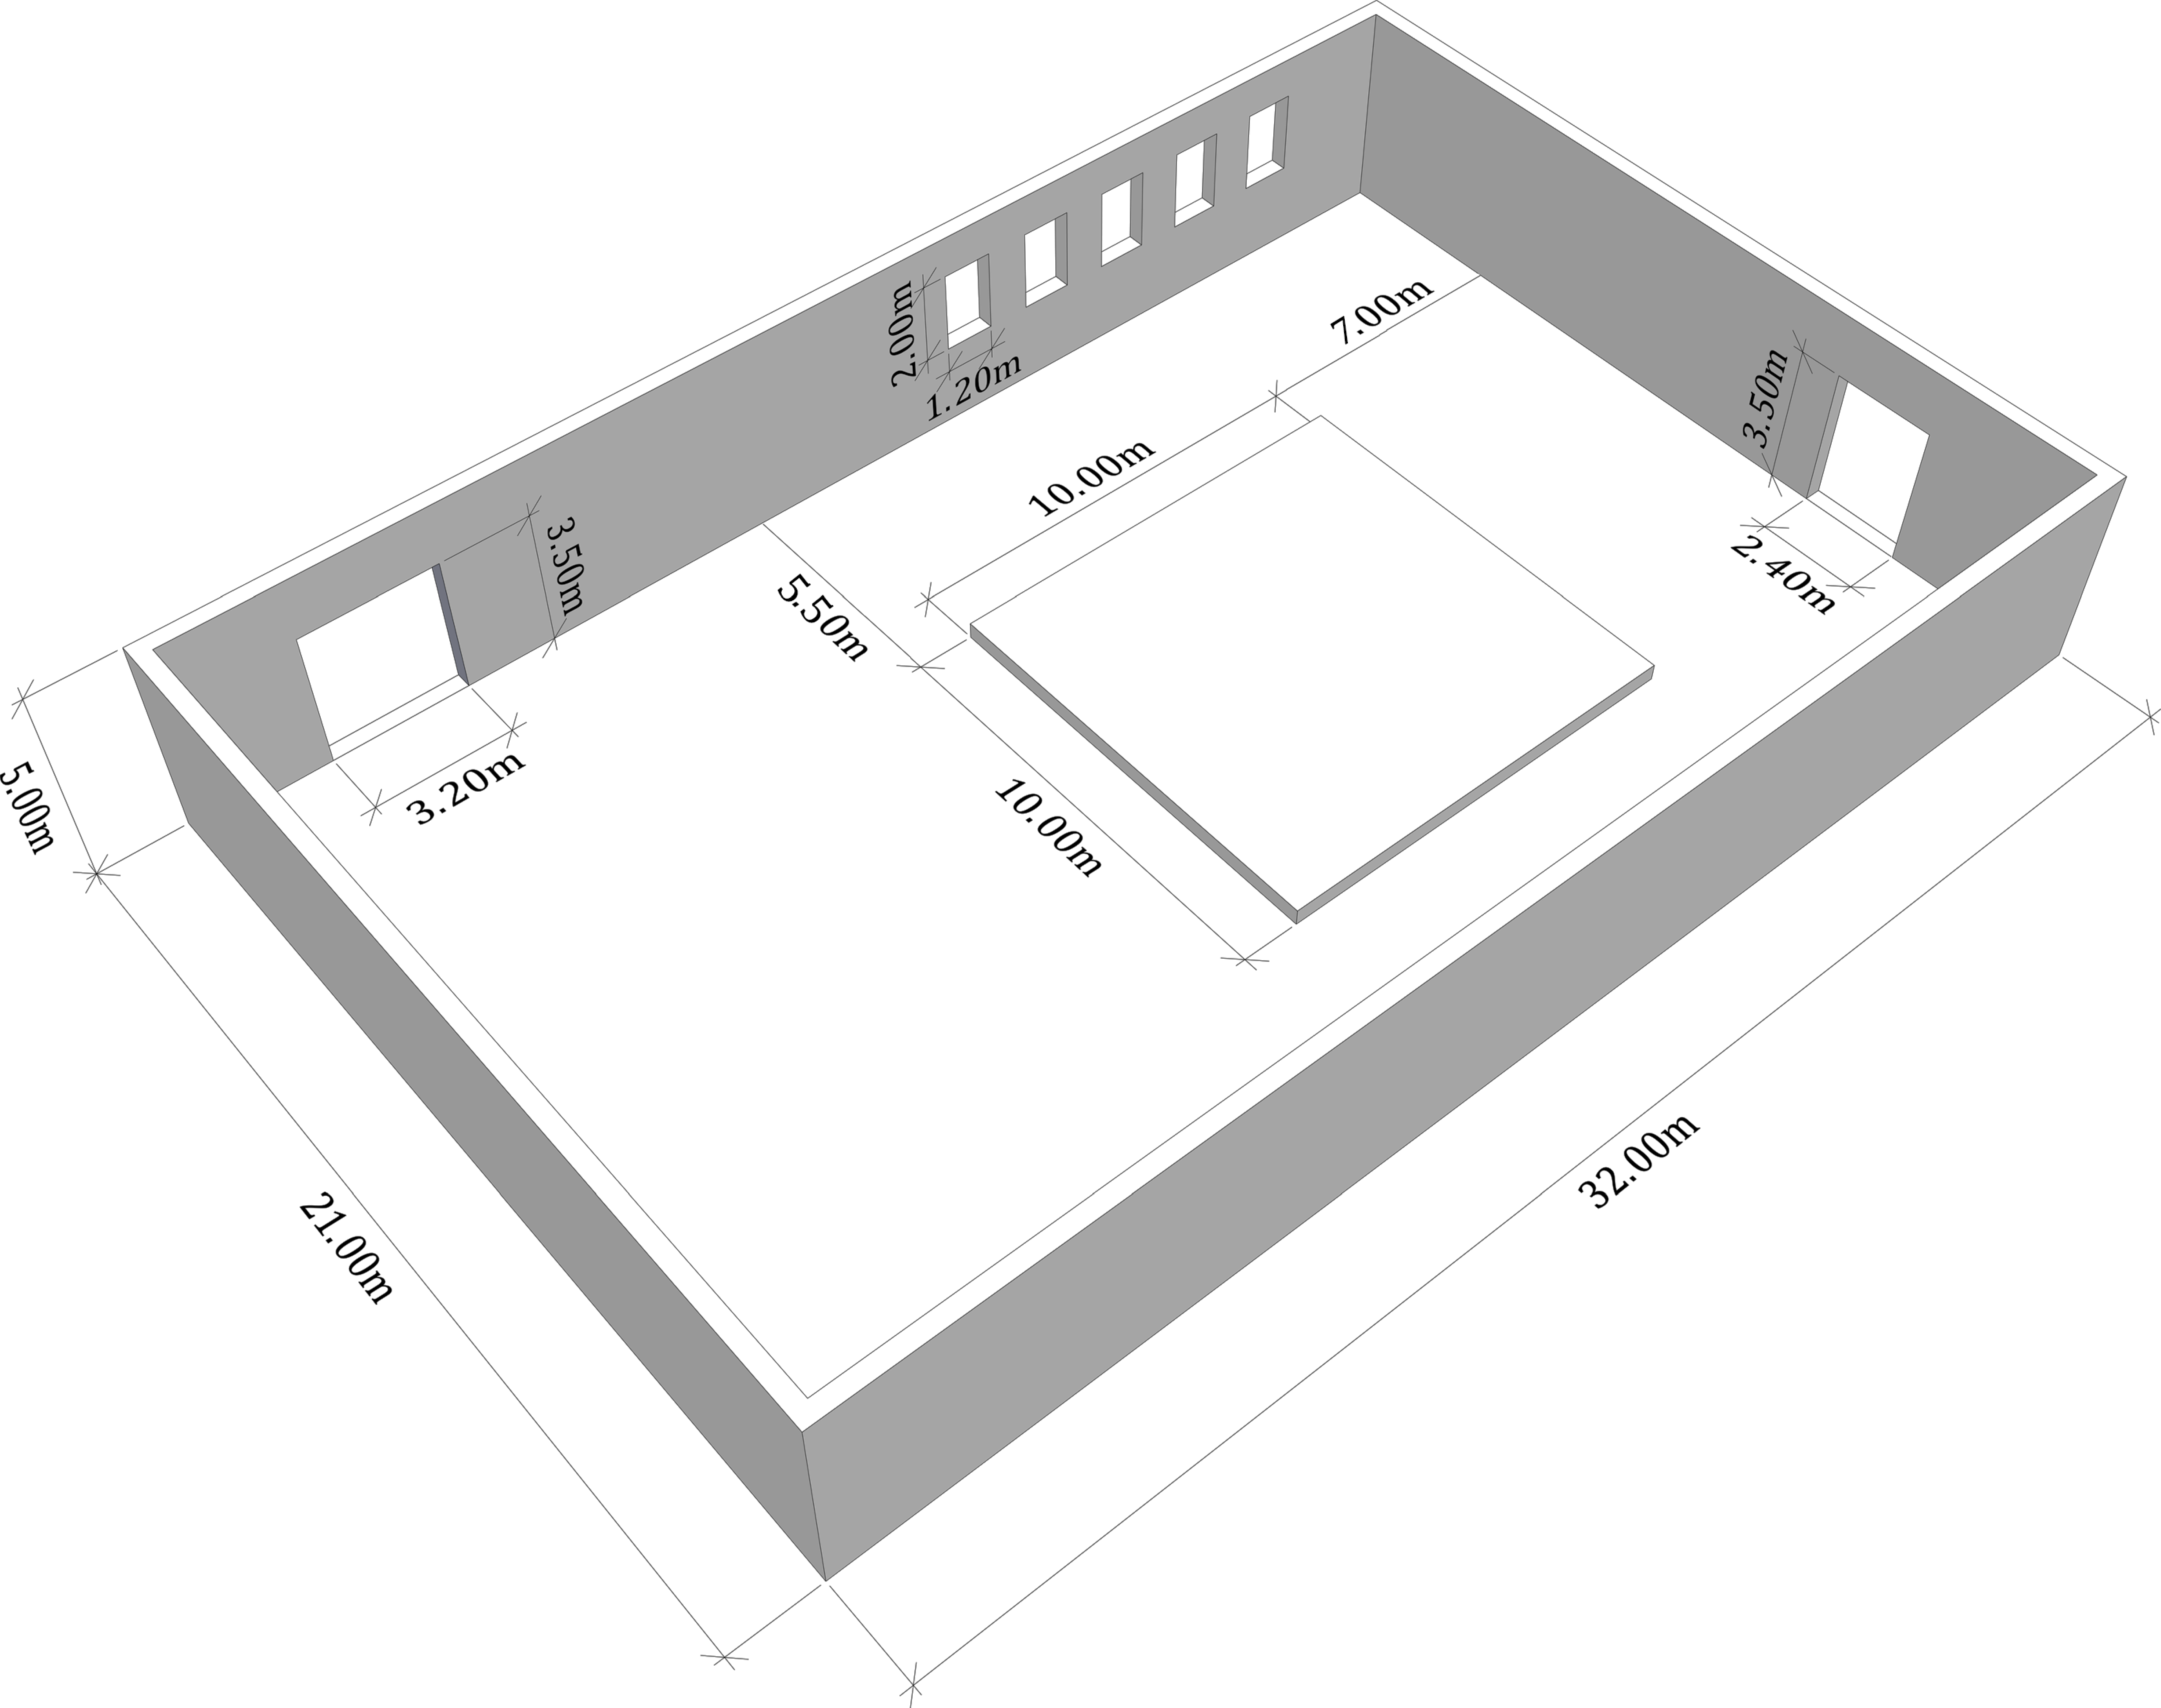
During this study a fire in a structure used for carpentry was examined. The size of the structure was 32·× 21·× 5 m (L
1·L
2·Z), with walls made of concrete (density of the wall = 2300 Kg m
−3, specific heat c
p = 913 J Kg
−1 K
−1 and conductivity λ = 1.45 W m
−1 K
−1). The structure was then characterized by 5 windows of 1.20·× 2.00 m (windowsill at 2 m from the ground) and 2 doors of 3.20·× 3.50 m and 2.40·× 3.50 m (B
1·B
2) respectively. 25,000 Kg of wood were placed on a surface of 100 m
2 with a calorific value of H = 17.5 MJ Kg
−1 (
Figure 1).
The case study examines a building made of concrete (
Table 1 shows that it is a building of type C), presenting a minimum level for protection measures with a class II risk (ordinary risk) and a class III level of performance being required for its structures. Following the calculation methodology shown in
Section 3.3, there is a planned specific fire load q
f,d of 973.5 MJ m
−2, hence a fire class resistance of the structures of REI 90 (5400 s).
The following conditions were assumed: (i) a III performance level for the constructive elements of the building which is able to guarantee rescue squads to operate in proper safe conditions; (ii) a class II type risk corresponding to an area with ordinary risk conditions, in terms of probability that a fire might occur, velocity of fire propagation and possibility for rescue squads to keep it under control; (iii) minimum fire protection measures with respect to regulation.
3.1. Prescriptive Approach: Nominal Fire Curves
The regulations set minimum safety requirements through the adoption of prescriptive measures where the risk evaluation is performed by the legislator. This is a deterministic approach which does not provide the possibility to have a quantitative evaluation of the fire safety level and this limitation emerges in complex structures. The standard nominal curve ISO 834, suitable for civil structures which are characterized by cellulosic materials, helps to define the conditions when the temperature increases according to Equation (1):
The aforementioned conditions, which determine the fire class resistance, allow the evaluation of the maximum temperature revealed in an area and the time interval during which the fire reaches that temperature. This method does not take into consideration the ignition phase and the phase during which the fire grows assuming a sudden increase in temperatures t = 0 s which corresponds to the flashover. The temperatures revealed through this method are the maximum temperatures that must not be exceeded to guarantee the stability of the structure.
The nominal curve, if the hydrocarbons burn, is described through Equation (2):
Such a curve is used to describe fires and evaluate the fire resistance of constructive elements where the temperature can increase more rapidly than that of the standard nominal curve, thus reaching higher values (as with combustible liquids). This article focuses on those fires involving cellulosic materials.
3.2. Performance-Based Approach: Natural Fire Curves through Simplified Models
In the simplified performance-based approaches the fire risk analysis is carried out in a quantitative way through a formula that is able to determine the hot gas temperature Tg(t) with respect to the time from the ignition phase to the one of the fire decay [
21]. Other factors affecting the fire are the ventilation “O,” thermal inertia of the walls “b” and the fire load “q” characterizing the area. The simplified natural curves represent an evolution when compared to the nominal curves in the characterization of the natural fires and they require simple math expressions. The combustion process assumes that at one point the gas temperature is homogenous in the site examined and this limits their application to only the post-flashover phase. For the evaluation of the temperature over a time interval in the presence of a growing fire in buildings devoid of ventilation openings, the following parametric models can be used:
- Curve A: National Research Council—Official Bulletin n. 37 of 25 July 1973 (updated by the Ministerial Decree 9 March 2007) [
23]:
where:
;
And where the fire load q, measured in Mcal m
−2, is assessed through Equation (4):
The opening factor O is:
with:
and the coefficients “a, b, c, d, m, n” depend on the type of wall and their values are reported in
Table 1.
- Curve B: EN 1991-1-2:2010 1 [
17] (surface of the floor which is less than 500 m
2, with a maximum height of 4 m where the combustible material can be assimilated to paper or wood).
In this case, when the temperature increases, Equation (6) is used:
In Equation (6) the values of the opening factor “O”, thermal inertia of the walls “b” (Equation (7)), and the non-dimensional factor G (Equation (8)) occurs:
where fire load q
t,d (Equation (9)):
with:
where “t” is measured in hours.
When the temperature decreases, Equations (10) and (11) are used:
where:
3.3. The Fire Resistance Class of the Structures with Respect to the Value of the Fire Load
The fire resistance class is the carrier capacity of a structure that indicates its ability to retain enough mechanical resistance in presence of fire. It can be described through the parameter REI (EN 13501-2) [
24] which identifies the time (in minutes) during which a structure stores: (i) mechanical resistance; (ii) resistance to flames and hot gases; (iii) thermal insulation. Such value can be determined through the nominal value of the specific fire load (Equation (13)):
where:
- -
“A” is the gross floor area [m2];
- -
“gi” is the mass of the i-th combustible material [kg];
- -
“Hi” is the calorific heat lower than the i-th combustible material [MJ kg−1];
- -
“mi” is the participation factor to the combustion of the i-th combustible material (it is equal to 0.80 for the wood and other cellulosic materials and 1.00 for all other combustible materials);
- -
“ψi” is the factor limiting the participation to the combustion of the i-th combustible material (it is equal to 0 for those materials stored in containers meant to resist to fire, 0.85 for those materials stored in non-combustible containers that were not planned to resist to fire and 1.00 in all other cases.
Then the value of the fire load should also be evaluated (Equation (14)):
where: δ
q1 is the factor which takes into consideration the fire risk with respect to the dimension of the area, δ
q2 is the factor which takes into consideration the fire risk with respect to the type of activity carried out in the area, and δ
n is the factor which takes into consideration the different protection measures adopted. Given q
f,d, the corresponding class resistance REI can be determined [
24]. By assessing the REI value, it is possible to determine the time limit of the structures which, once exceeded, the building subject to the fire cannot guarantee its solidity and provide a safe environment for the intervention squads operating in that environment anymore.
4. Results
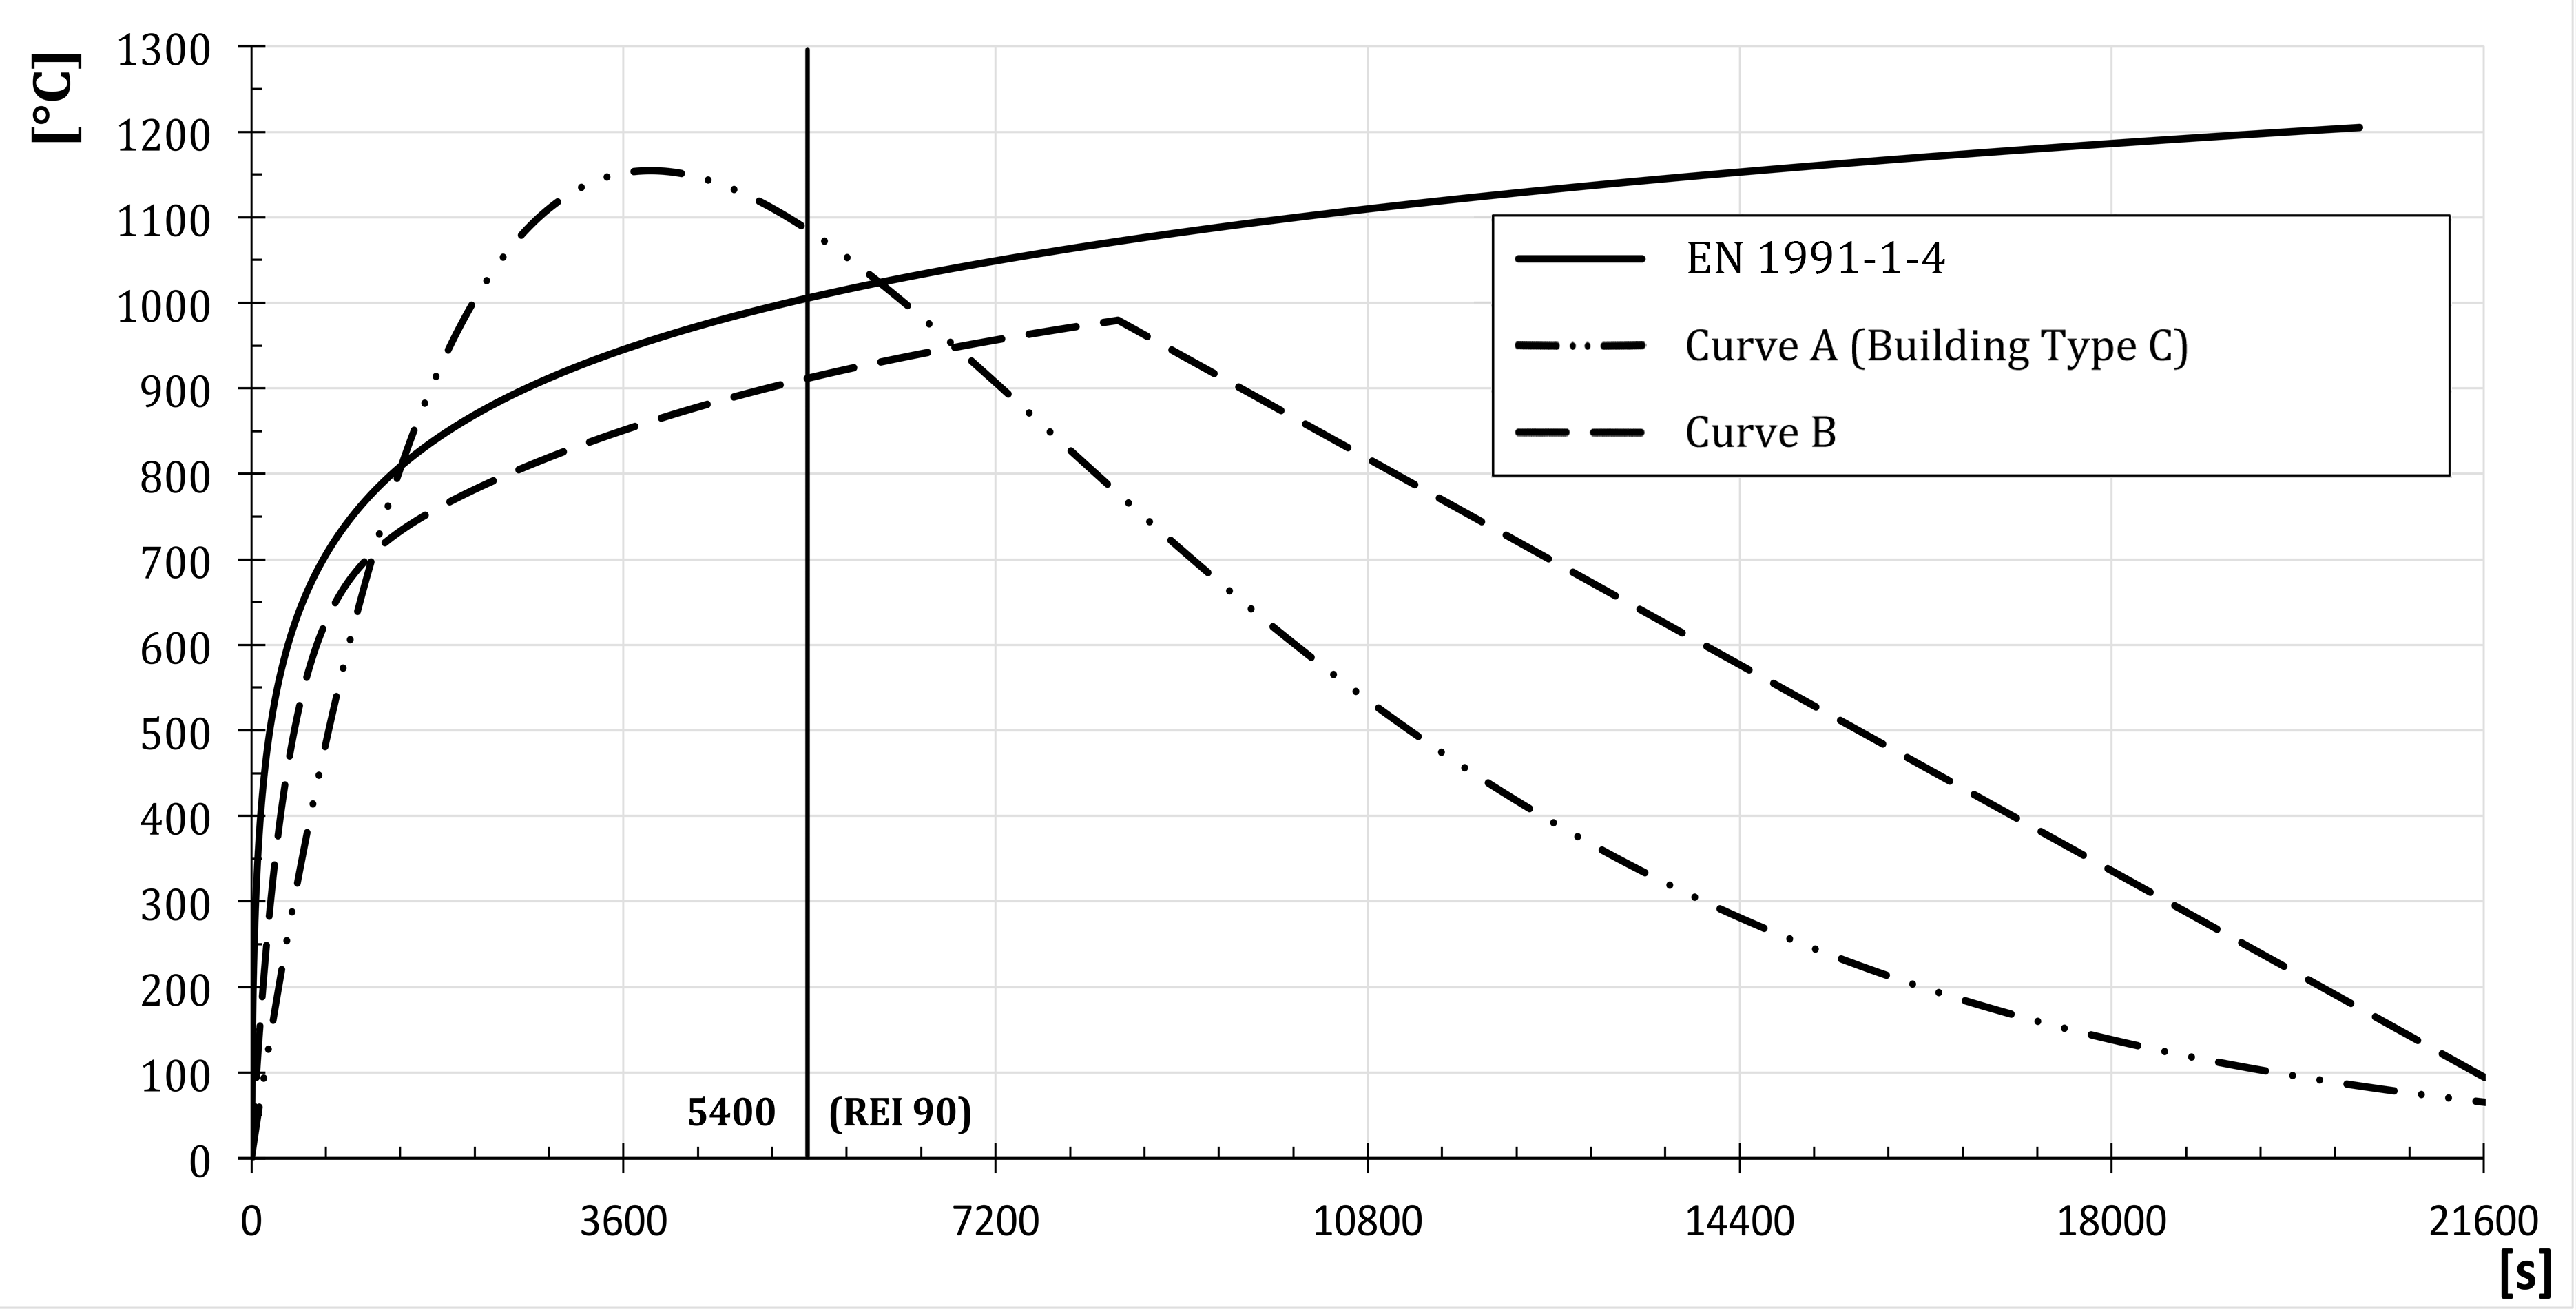
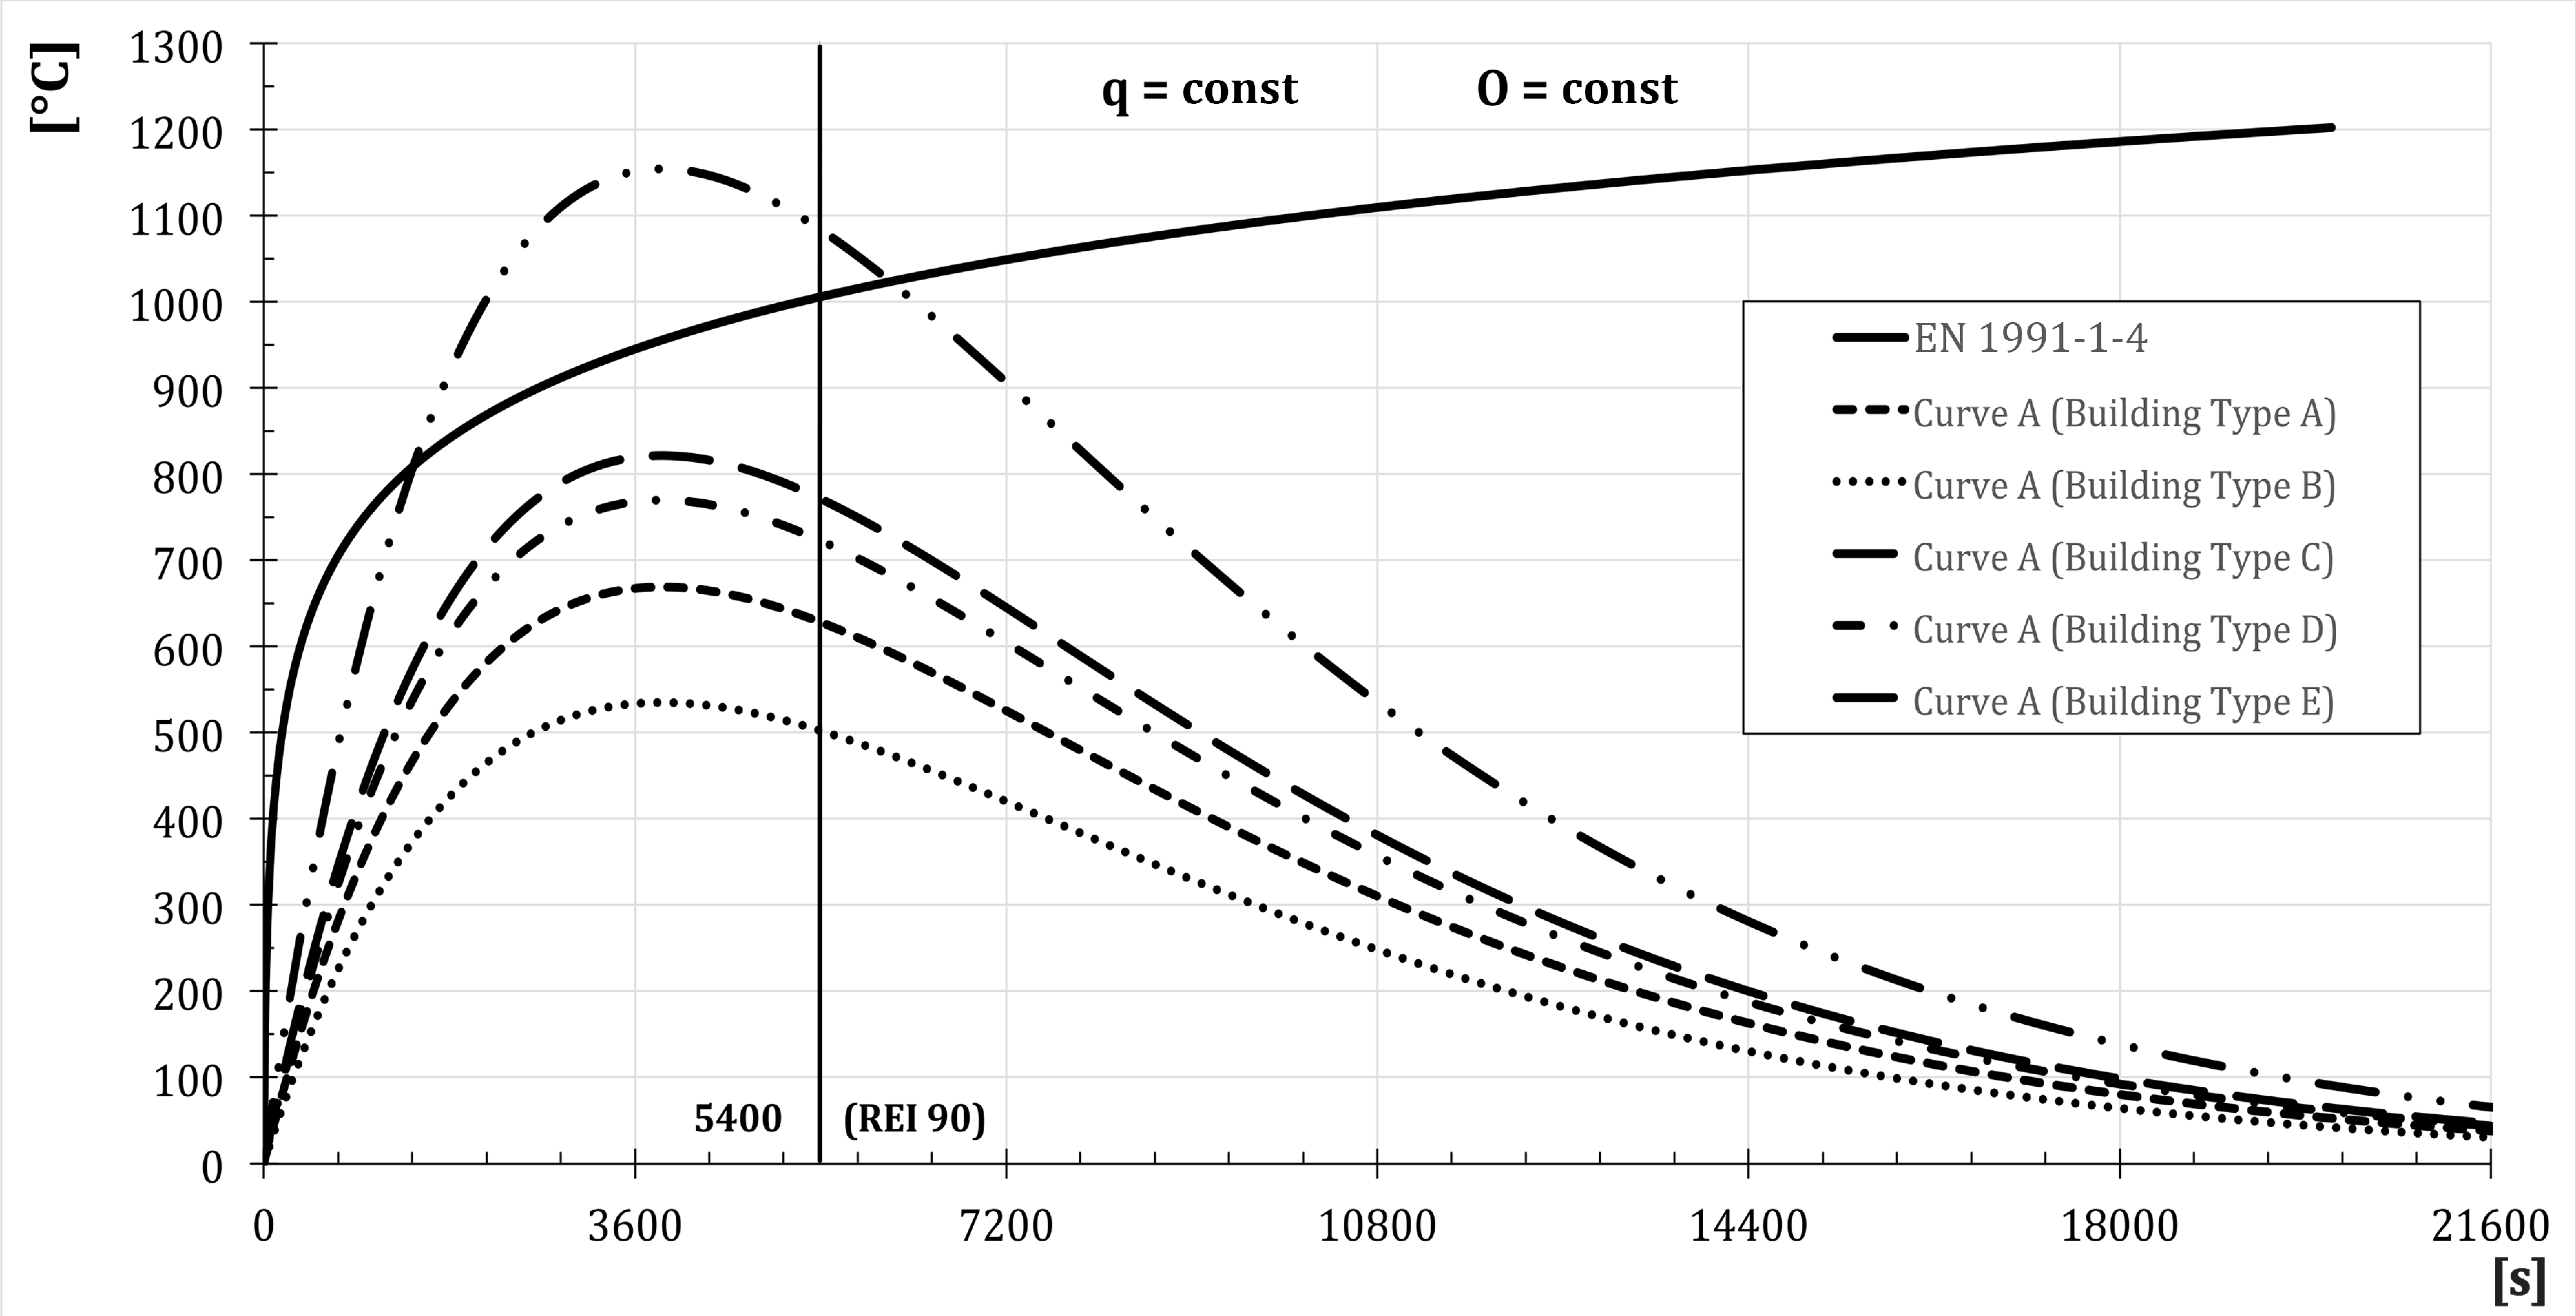
Over time, from the flashover (t
0) to the limit related to the fire class resistance, the trend of the temperature (nominal curve and simplified performance-based models) with respect to the case study is reported in
Figure 2. For the assessment of the parameters “q” and “O”, Equations (4) and (5) must be taken into consideration. In this study the values revealed where q = 233.6 MJ m
−2 and O = 0.0289 m
0.5.
While examining
Figure 2, using the input data of the case study (the type of combustible, the fire load and the opening factor), it can be noticed how the natural “Curve B” never exceed the nominal curve EN 1991-1-2:2002 [
17], while the trend of “Curve A” intertwines with and exceeds the nominal curve. In case of fire, during the post flashover phase, the structures might not be able to resist the thermal flux for the time interval set by the REI (90 min) with the consequence that the rescue squads will not operate in safe conditions. This is why it is important to: (i) guide the planning to provide the area with fire protection measures, able to intervene on the flames, thus limiting their entity: (ii) intervene during the planning phase based on the value of the opening factor diminishing the surface area of the windows characterizing the area.
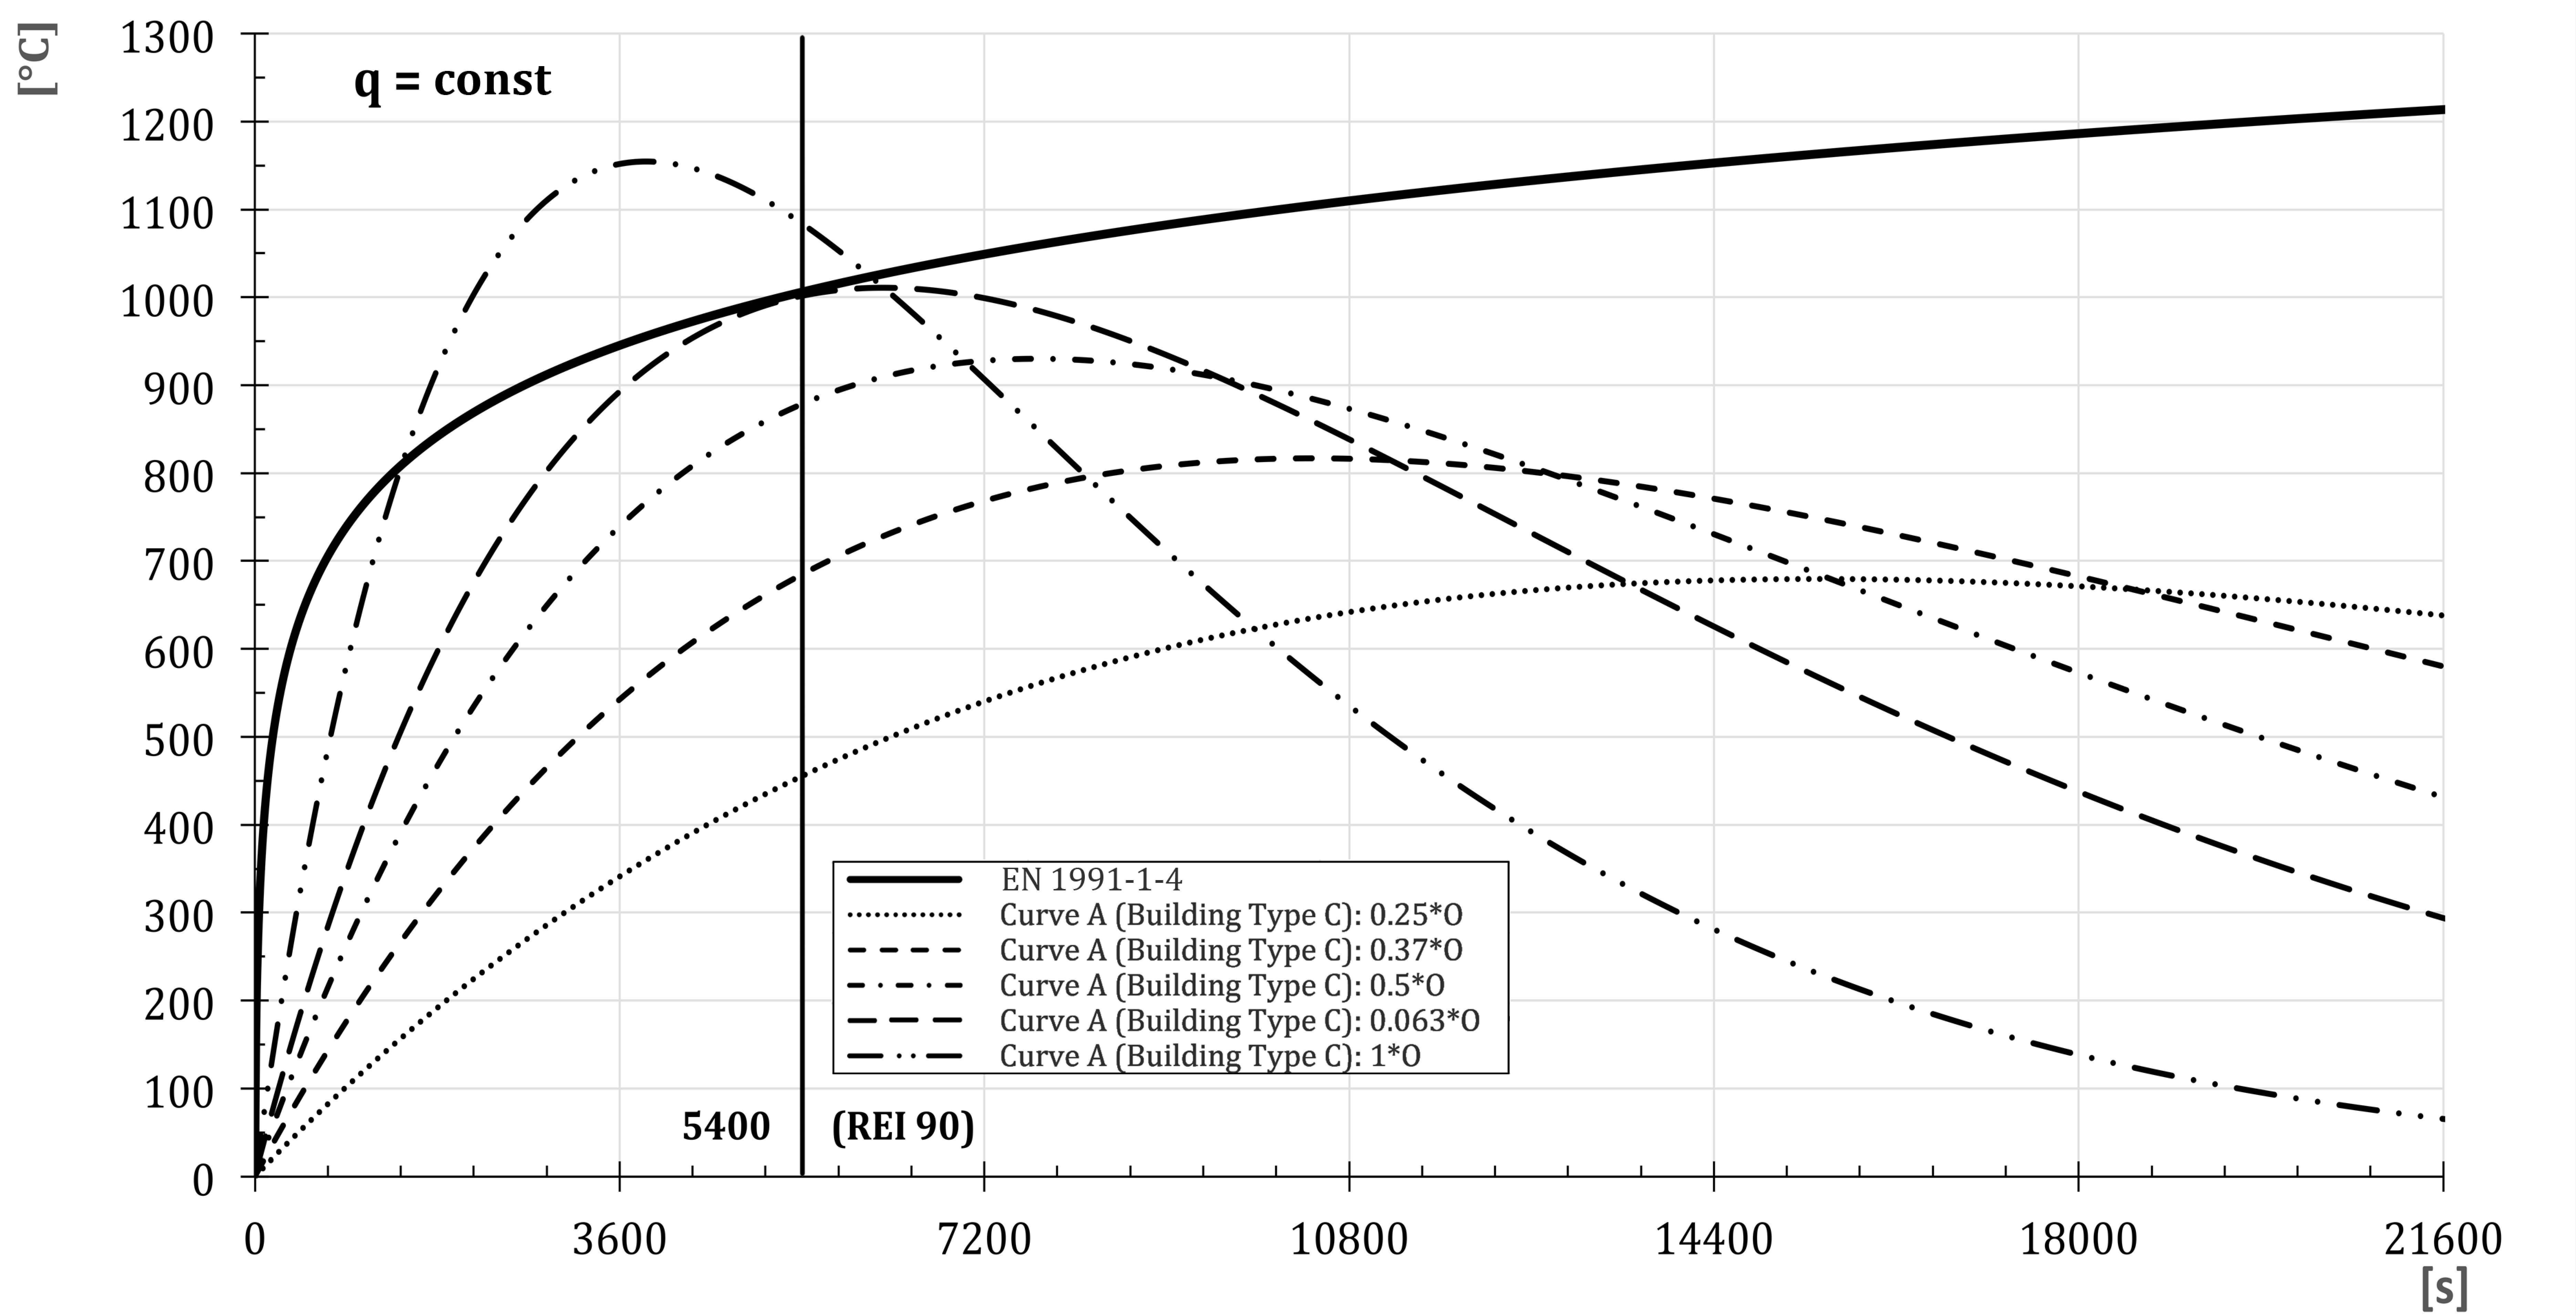
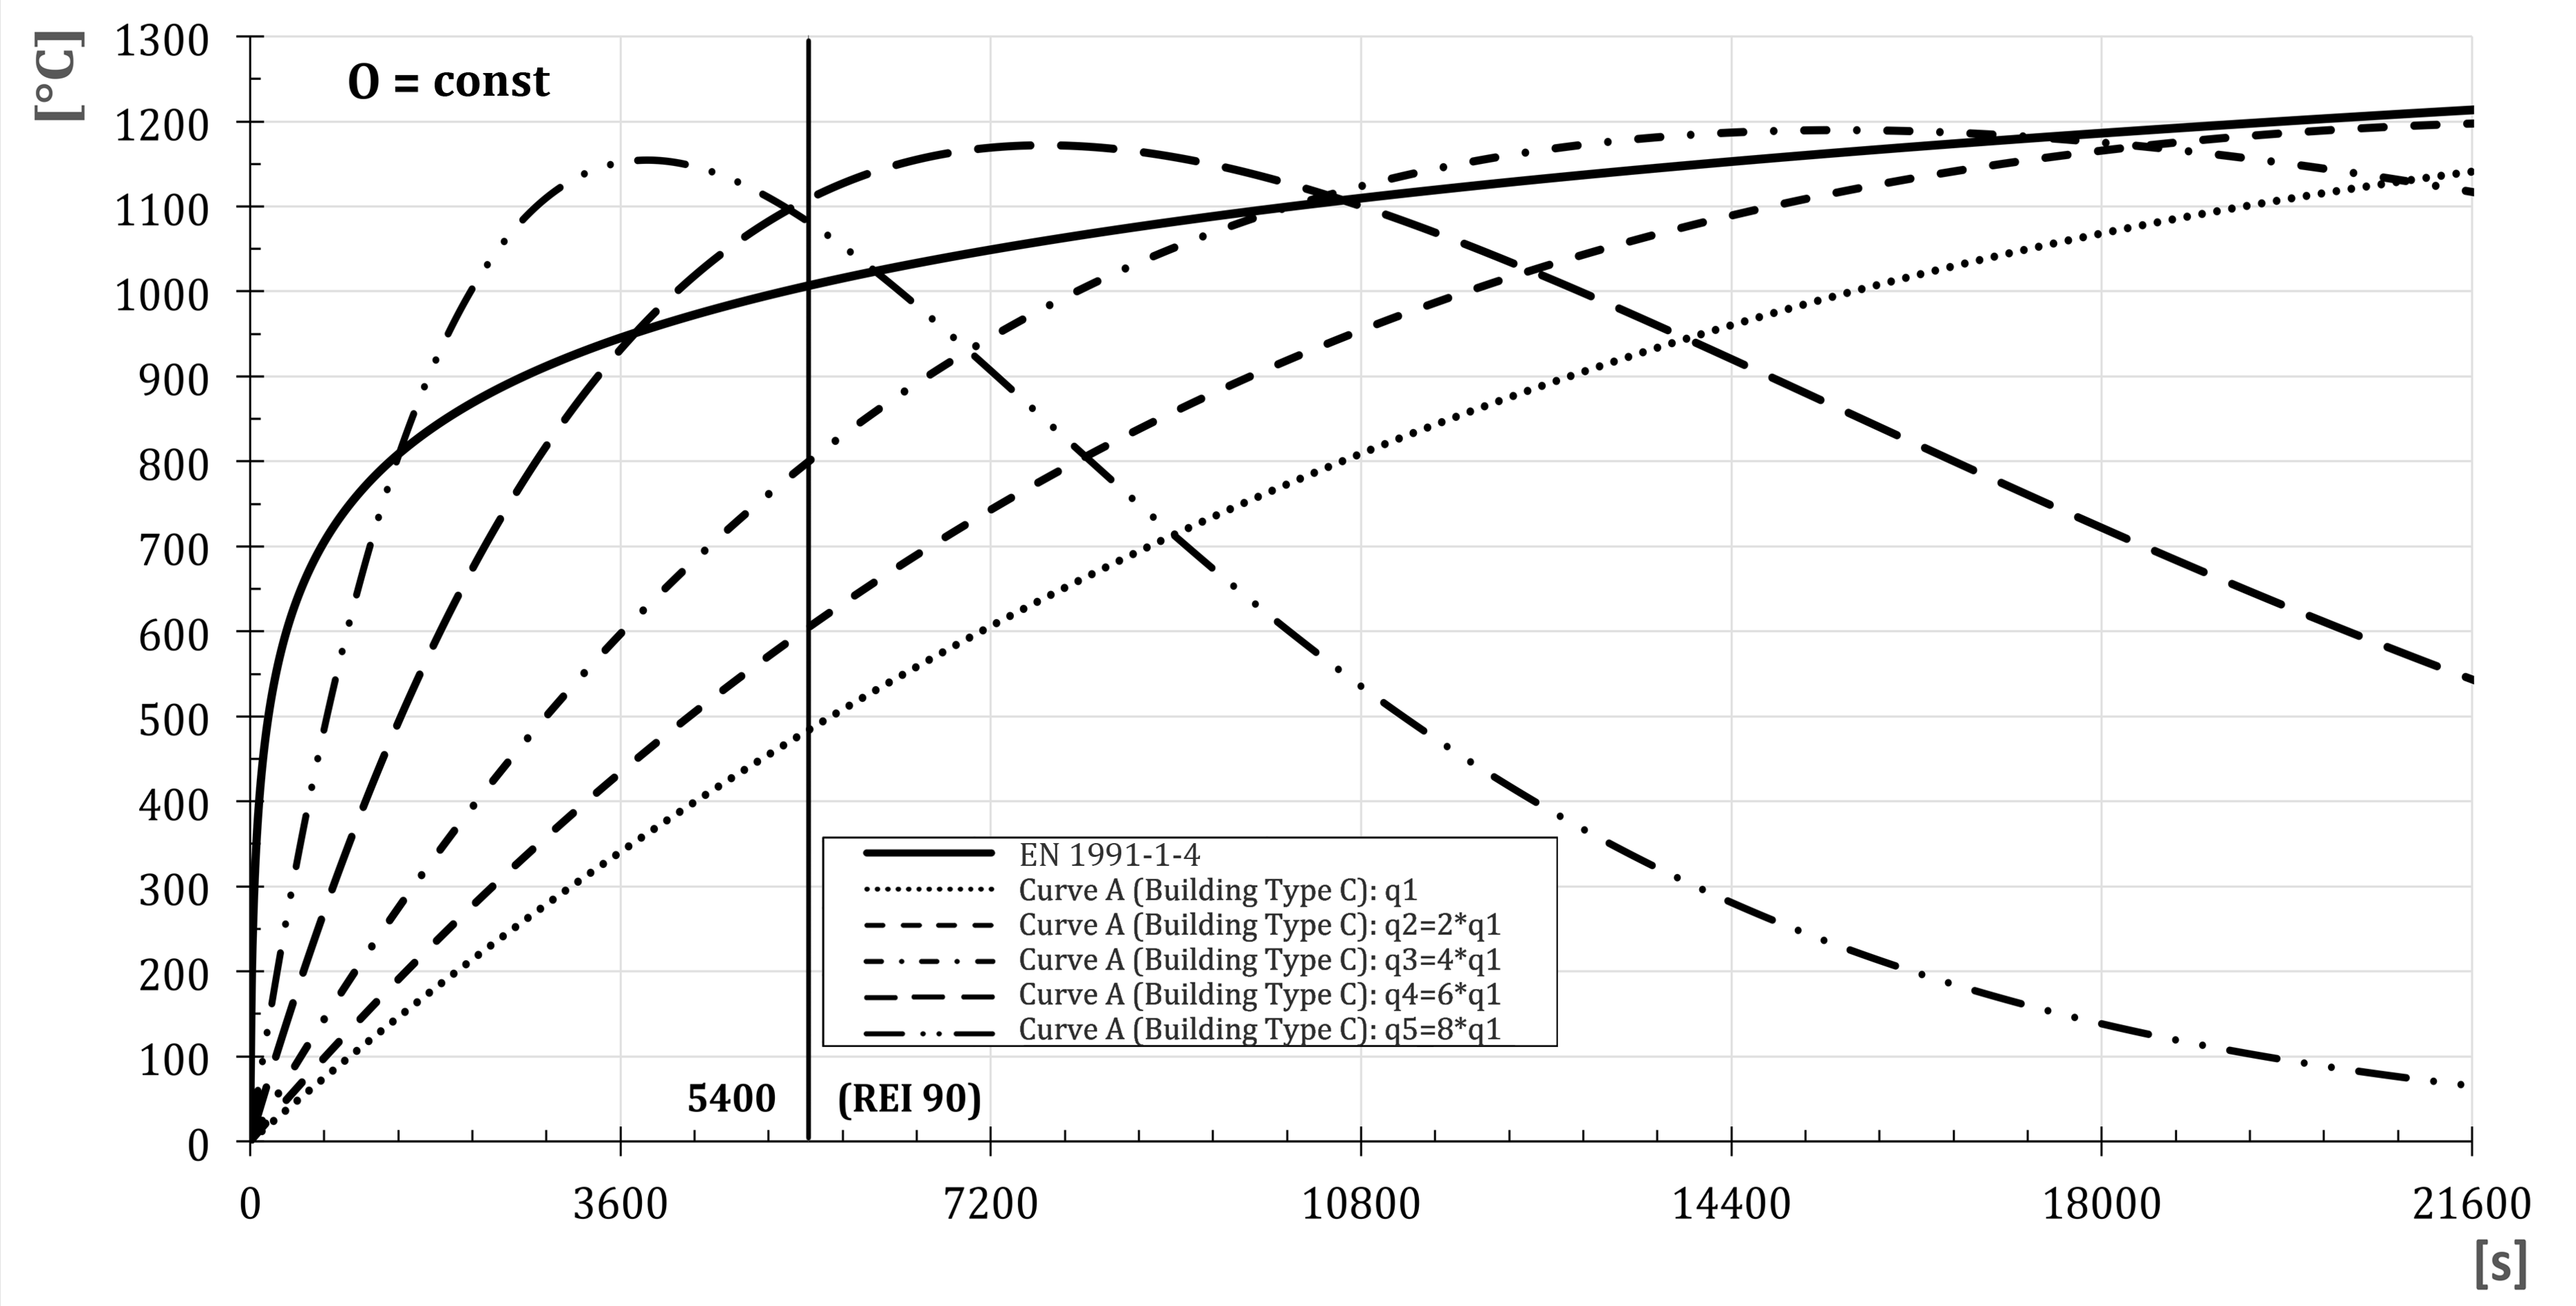
It is possible to examine and represent through a graph the trends of the nominal curves of type A based on the variation in the: (i) ventilation factor “O” with the type of building being the same (type C,
Table 1) (
Figure 3); (ii) fire load “q” present in the area with the type of building being the same (type C,
Table 1) (
Figure 4); III); (ii) type of building, “O” and “q” being the same (
Figure 5).
It can be noticed that, based on the value of the fire load and the opening factor, the temperature value in the simplified natural curves of type A exceeds the value provided by the prescriptive nominal curve. In these cases, it is not possible to guarantee the resistance of the structure until the limit expected by the fire class resistance. Therefore, it is necessary to adopt fire safety measures able to be implemented instantly to decrease the thermal fluxes released from the fire.
Nominal curves B do not provide useful information to verify if the temperature exceeds the value provided based on the prescriptive approach with respect to the opening factor “O” and the fire load “q” characterizing the area. These parameters will affect the time interval when the temperature reaches its maximum value, thus shifting this instant to higher values on the abscissa in the graph. However, it should be also said that the aforementioned method A is more precautionary.
5. Discussions
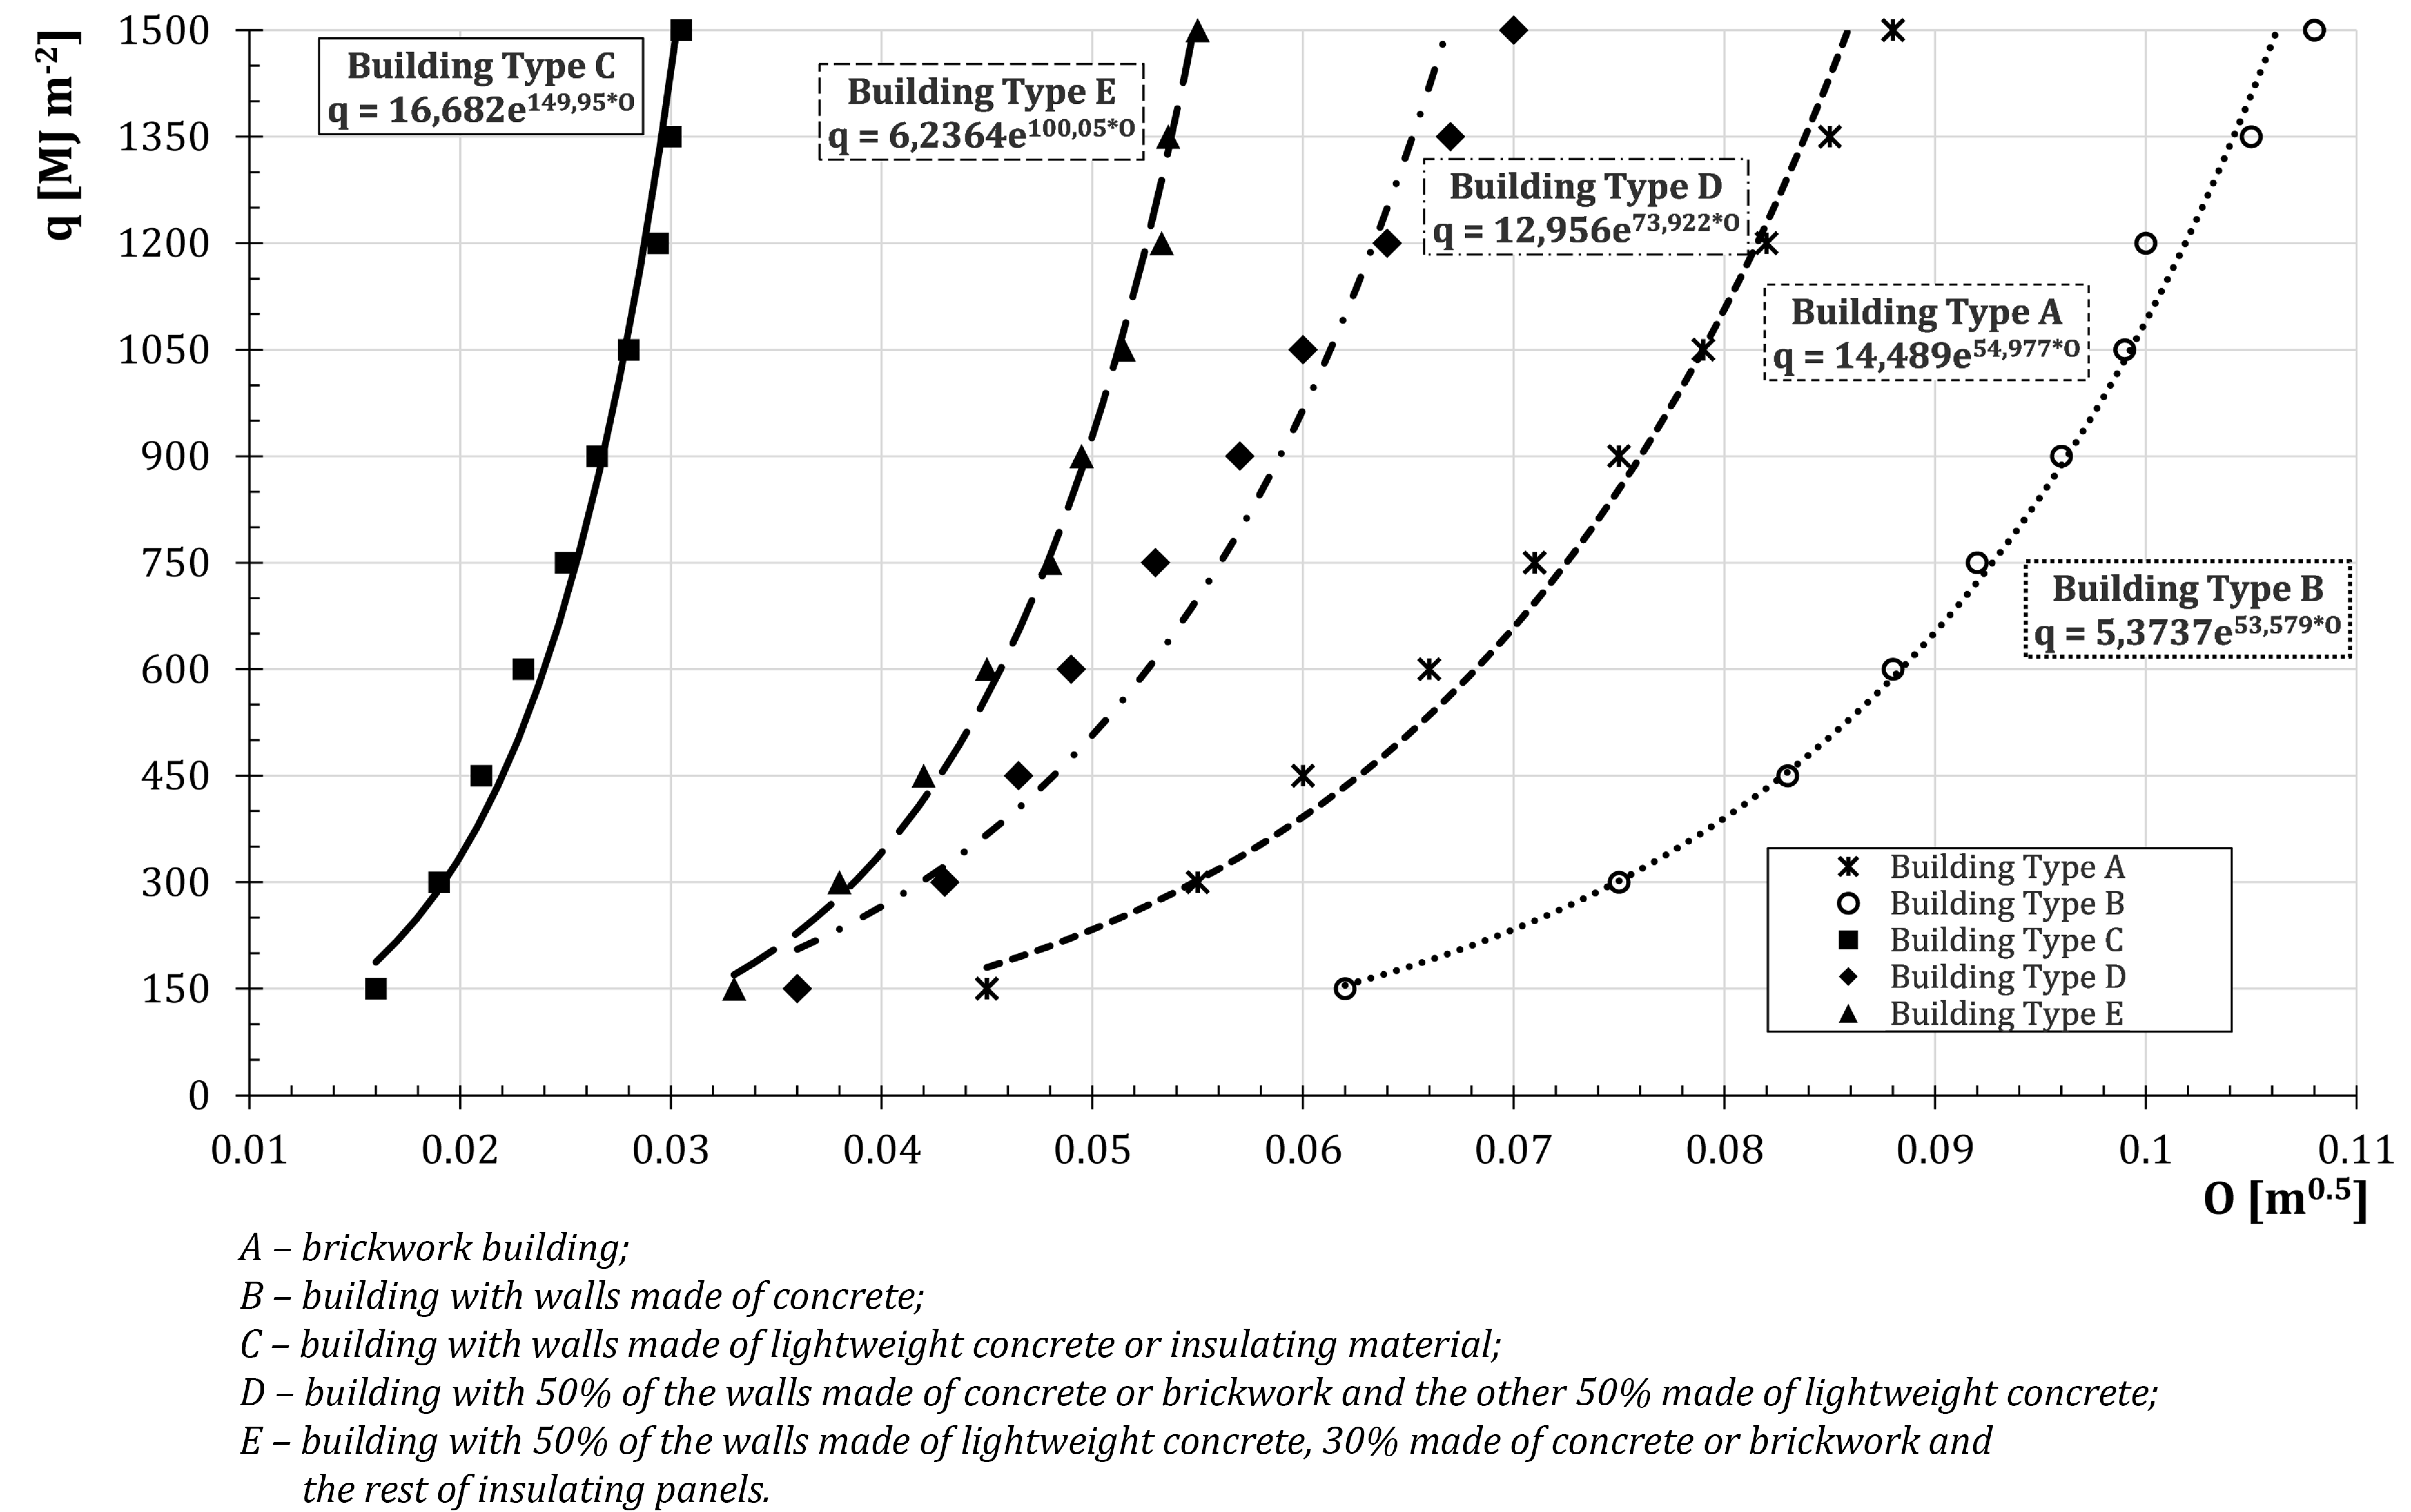
While examining all the information provided by the nominal curve type A, it can be noticed that for some combined value of the opening factor and the fire load the temperature reported in the graph is higher than the one related to the prescriptive approach. This means that it is important to adopt specific fire safety measures. The architect/engineer will be aware of this once he/she has carried out different assessments during the planning phase. Therefore, it might be useful to have a parametric graph revealing such information in a previous step with respect to the planning phase based on the following factors: (i) type of building provided by the regulations (
Table 1); (ii) value of the fire load “q;” (iii) value of the opening factor “O”. This is why
Figure 6 is reported here to represent standard types of fire in civil buildings characterized by cellulosic materials.
Once the curve of the type of building is identified, if the values representative of “q” and “O” are positioned on the right side of the curve, the structure will be put under stress in the post flashover phase from thermal fluxes while complying with those safety conditions that must be guaranteed for the rescue squads during the time interval identified through the class REI. On the other hand, on the left side of the curve this will not occur and it is important to set this value, since during the first steps of the planning phase, fire protection measures are necessary in order to keep possible thermal fluxes under control (e.g., automatic revelation systems, automatic fire suppression systems and so on).
While taking into consideration
Figure 6, it can be assumed that the demands will be examined in terms of fire prevention planning of a Type A Building characterized by a fire load “q” of 600 MJ m
−2 and an opening factor “O” of 0.06 m
0.5. If these parameters cannot be modified (because they depend on specific demands), since their coordinates (“O”, “q”) are located on the left side of the curve, the graph would suggest to perform the planning of fire prevention systems (as the exertion of sprinklers). However such a graph also gives the possibility of following another path if installing expensive or complex systems is too complicated; as a matter of fact it is possible to locate the value (“O”, ”q”) on the right side of the curve, thus increasing the value of the opening factor “O” higher than 0.068 m
0.5, or decreasing the value of the fire load “q” lower than 400 MJ m
−2.
6. Conclusions
A wide knowledge of the methods of analysis of the fire risk is important to guarantee proper safety conditions in buildings during the post flashover phase, during which rescue squads operate. In some countries, as Italy, different approaches can be adopted in order to carry out fire risk analysis. The designer/architect has to choose whether to operate through a prescriptive approach or a performance-based one. The first method makes the work of the designer/architect easier because the legislator sets all the limits to the equivalent fire load that can be stored in an area (without examining the characteristics of the fire in detail). This is how it is guaranteed that the temperature inside the area will not exceed the maximum temperature that if reached will cause the breaking of windows, thus provoking the entry of oxygen and feeding the fire. According to the volume of the area and the oxygen present, the temperature of the nominal curve (T-t) is kept under control, hence the time interval during which the fire reaches these conditions is also kept under control. The fire load is therefore controlled and kept lower than the maximum allowed load, assessed while keeping in mind that the combustible present will be consumed before reaching such a temperature.
However, this approach can be considered too cautious with respect to the real safety demand, because it can deeply influence or limit the exertion of the building. The performance-based approaches, even if they can guarantee that the structures will resist to the thermal fluxes during the post flashover phase, give the possibility to examine how variables such as the type of structures characterizing the building, the specific fire load and the opening factors of the area might affect the development of the fire. In particular, thanks to the assessment of the specific fire load and the opening factor of the area, it is possible to understand whether the temperatures (hence the thermal fluxes developed during the combustion) are too demanding for the structure. If the temperature revealed through a simplified performance-based model exceeds the one determined through the prescriptive approach, the area must be characterized by fire protection measures in order to keep the thermal fluxes of the fire under control. Such a hypothesis deeply affects the cost of those systems and it is a factor that has to be taken into consideration from the beginning.
Starting with the data of a case study, the goal was to make the assessment process as generalized as possible by focusing on the post flashover phase and the importance of having conditions able to guarantee the resistance of the structures of the building while rescue squads operate.
This is why this article examined a case study to let the reader understand this subject and the authors proceeded to:
- -
Examine the methods provided by the prescriptive approach and performance-based approach for the temperature prediction (based on time) developed in an enclosed environment in presence of a fire;
- -
Compare the trends of T(t) according to the performance-based approach, according to parameters as type of building, opening factor “O” and fire load “q”;
- -
Understand how these parameters lead the temperature to exceed the value provided by the performance-based approach with respect to the value of the temperature determined through the prescriptive approach;
- -
Find which parameters of the type of building, opening factor “O” and fire load “q” required since starting the planning of fire prevention measures in order to keep possible thermal fluxes under control.
Hence, the goal was to provide a graph (which might be used easily through simple input data as the type of building, specific fire load and opening factors) that can help architects/designers to instantly determine (during the first stage of design) the importance of guiding the planning of fire protection measures from the beginning. This might help while providing an idea of what kind of structure will be realized (and its costs as well) to guarantee proper safety conditions. Otherwise, if ex-novo buildings must be planned, the architect/designer will be able to explain the importance of dividing the building in a different way, changing the type of structure or changing the opening factors according to the specific fire load determined by the demand and the type of use of the building.
A schematic approach such as the one suggested here to understand the fire risk level of a building through just few parameters can be useful to classify buildings located near areas with a high fire risk level. While taking into consideration the maximum tolerable value of the fire load with respect to a parameter that can be easily determined, as the opening factor, the buildings can be classified and mapped based on their risk level. This approach is useful in cities located near areas characterized by a high risk level (as green areas with forests).
In the future, it might be useful to suggest to designers to use a series of easy nomograms to help the experts during the planning of a fire prevention system. Moreover, while considering the results achieved in the field of fire propagation, the analysis carried out here can be examined more deeply and enlarged by going beyond the recommendations provided by current regulations. The regulatory approach can be examined together with new recent theories, as the studies characterizing the Travelling Fire Method (and further developments) [
25,
26]. This is how the dynamic nature of a fire might best be taken into consideration, thus obtaining more realistic information about fires occurring in big spaces (where the hypothesis of having uniform quantities to be examined is not realistic).

 ,
, 


