Factors Associated with Structure Loss in the 2013–2018 California Wildfires


1
Sage Insurance Holdings LLC, San Francisco, CA 94102, USA
2
USGS Western Ecological Research Center, Three Rivers, CA 93271, USA
3
Department of Ecology & Evolutionary Biology, University of California, Los Angeles, CA 90095, USA
*
Author to whom correspondence should be addressed.
Fire 2019, 2(3), 49; https://0-doi-org.brum.beds.ac.uk/10.3390/fire2030049
Submission received: 15 August 2019
/
Revised: 21 August 2019
/
Accepted: 24 August 2019
/
Published: 2 September 2019
Abstract
:Tens of thousands of structures and hundreds of human lives have been lost in recent fire events throughout California. Given the potential for these types of wildfires to continue, the need to understand why and how structures are being destroyed has taken on a new level of urgency. We compiled and analyzed an extensive dataset of building inspectors’ reports documenting homeowner mitigation practices for more than 40,000 wildfire-exposed structures from 2013–2018. Comparing homes that survived fires to homes that were destroyed, we investigated the role of defensible space distance, defensive actions, and building structural characteristics, statewide and parsed into three broad regions. Overall, structural characteristics explained more of a difference between survived and destroyed structures than defensible space distance. The most consistently important structural characteristics—having enclosed eaves, vent screens, and multi-pane windows—were those that potentially prevented wind-born ember penetration into structures, although multi-pane windows are also known to protect against radiant heat. In the North-Interior part of the state, active firefighting was the most important reason for structure survival. Overall, the deviance explained for any given variable was relatively low, suggesting that other factors need to be accounted for to understand the full spectrum of structure loss contributors. Furthermore, while destroyed homes were preferentially included in the study, many “fire-safe” structures, having > 30 m defensible space or fire-resistant building materials, were destroyed. Thus, while mitigation may play an important role in structure survival, additional strategies should be considered to reduce future structure loss.
1. Introduction
California has long been recognized for its fire-prone ecosystems and fire-related losses to human lives and property [1]. In the last several years, however, this recognition has turned into bewilderment and terror as tens of thousands of structures and hundreds of human lives have been lost in fire events throughout the state [2]. Deadly and destructive wildfires have been occurring in other regions across the globe as well, such as Portugal [3], Australia [4], and Southern Europe [5]. The increased frequency and magnitude of these fire events have contributed to the recent claim that we are entering a “new normal” phase of wildfires [6]. Most of these catastrophic fires are started by humans, so as populations steadily increase and people are pushed farther into hazardous wildlands, the problem could get even worse. Thus, the need to understand why and how structures are being destroyed during wildfires has taken on a new level of urgency.
Fully understanding why recent California wildfires were so destructive will likely require many years of research focusing on a range of factors at different scales, from fire behavior and climatology to fire management and land development. Answering questions pertaining to fire behavior will require different data and methodological approaches, compared to answering the questions related to why homes were destroyed, although the actual outcome will be a combination of the two.
In California, there has been a long-standing interest in understanding how local and regional responses are needed to reduce damage from wildfires [7,8]. In terms of understanding why homes are destroyed, there is an emerging literature that includes studies focused on local, property-level factors as well as studies on landscape-scale factors such as vegetation management and fuel characteristics, fire suppression, topography, and housing development patterns (e.g., [9,10]). These studies have significantly advanced our understanding of home safety, but the majority have been conducted through computer simulations and laboratory experiments, and thus, there remains a need for pre- and post-fire empirical data to document and validate what happens under actual wildfire conditions [11]. Recent fire events have generated more data on structure losses, and the number of empirical studies is increasing, particularly relative to understanding spatial patterns of structure loss at a landscape scale [12,13,14,15].
In terms of defensible space, the state of California requires fire-exposed homeowners to create a minimum of 30 m (100 ft) of defensible space around structures, and some localities are beginning to require at least 60 m (200 ft) in certain circumstances (e.g., [16]). Of the few studies that have empirically tested the relative benefits of defensible space, the authors demonstrated that up to 30 m (100 ft) of vegetation reduction around a structure can significantly increase the chance of structure survival (e.g., [17,18,19,20]). However, in these case studies, the most effective distance of defensible space was much less than regulations require (e.g., [19,21,22]), and other factors, such as housing density, landscape position, proximity of vegetation to the house, irrigation and water bodies, and building construction materials, were equally or more important [20,23,24].
Regarding fire safety in building construction materials, there have been many detailed studies conducted via carefully designed laboratory experiments [25,26,27]; and recent building codes in California have been designed to reflect these studies. Despite the solid laboratory evidence, few empirical studies have documented building characteristics associated with structure loss in real wildfire situations. In one study, Syphard et al. [23] found several significant relationships among building construction materials and structure loss in San Diego County, CA, USA, with window framing material and number of windowpanes being more protective than roofing or exterior siding material, and year of construction also being a significant proxy for building characteristics. The sample size in this study was somewhat limited, however, and other factors like structure density and vegetation characteristics were found to be equally or more important, depending on the location of the structure.
In addition to knowing whether certain mitigation actions can be statistically significantly associated with structure destruction, it is important to understand how often these homeowner ‘best practices’ actually translate into structure survival. Statistical significance is not a safety guarantee and does not necessarily translate into probability. While it is important for homeowners to have the best protection available, it is also important for them to understand the extent to which these actions tend to result in a positive outcome. Without large datasets of actual structure losses, it has until now been impossible to know the frequency at which best practices translate into structure survival, and whether those results are generalizable across different landscapes.
As of now, most guidance on homeowner ‘best practices’ is derived from limited empirical studies and assumptions based on fire behavior, and thus, the relative efficacy of these practices remains largely theoretical. Empirical studies on the effects of local homeowner mitigation practices, including defensible space or building materials, have been mostly in the form of case studies for a selection of wildfires on specific landscapes (e.g., [19,23,28,29]). Although these studies provide insights, we need a broader understanding across multiple fire events, and thus we need a database that captures characteristics of structures exposed to many fires across a variety of ecosystems.
The California Department of Forestry and Fire Protection (Cal Fire) began a statewide building inspection program in the late 1980s that has been continually upgraded and improved over time, and recent large catastrophic wildfires have added enormously to the amount of data available. The Cal Fire Damage INSpection Program (DINS) was founded with the goal to collect data on damaged, destroyed, and unburned structures during and immediately after fire events to assist in the recovery process, to validate defensible space regulations, and to provide local governments and scientists information for analyzing why some structures burned and why some survived [30]. For all fire events in the state that involve the damage or destruction of buildings worth $10,000 or more, a team of trained inspectors visit during and immediately after the wildfire to collect, for all structures exposed to the fire, a range of information including the extent of damage, defensible space before the fire, building characteristics, and other items.
Through a public records request, we acquired DINS data for more than 40,000 structures that survived, were damaged, or were destroyed across all California wildfires from 2013–2018, making this potentially the largest combined dataset of its sort. Our objective was to summarize these data statewide and across three broad California regions (San Francisco Bay Area, Northern Interior forests and foothills, and Southern California) to a develop a more generalized understanding of local-scale factors characterizing and differentiating destroyed or majorly damaged structures (“destroyed”) from those that survived or only had minor damage (“survived”) during wildfires. Although other studies have shown landscape-scale and other spatial factors such as topography, fuels, and housing arrangement to significantly affect structure loss probability, we focused here exclusively on the homeowner mitigation practices quantified by the building inspectors to answer:
1. How important was the extent of defensible space in distinguishing destroyed and survived structures?
2. What structural characteristics of homes were associated with increased susceptibility to destruction?
3. Did these patterns vary by region?
2. Materials and Methods
2.1. Data and Summary Statistics
The Cal Fire DINS data were collected for all wildfires, of any size, that resulted in structure damage or destruction. Once building inspection teams arrived at a fire, they recorded information on every exposed structure, including damaged, destroyed, and unburned homes, valued at a minimum of $10,000 or greater than 120 square feet (11 square meters), which is the size at which a permit is required for building. The inspection process occurred by dividing active wildfires into geographical zones as the fire was burning, then a designated number of two-person teams of trained inspectors were assigned to the zone and went to the field to record data. Data were collected for surviving structures in addition to damaged and destroyed structures, and the level of structural damage was recorded in different percentage classes.
Given that most recent structure losses in California have occurred in three distinct regions of the state [2], with most losses occurring within single fire events, we divided the dataset into three regions to compare potential regional differences. Thus, we assigned each county with structure loss to either the “Bay Area”, which included counties surrounding the San Francisco Bay; the “North-Interior”, which included primarily the northern Sierra Nevada but also other northern coastal and interior counties; and “Southern CA”, including coastal counties south of San Luis Obispo County (Table 1).
Building inspectors grouped the structures into classes of damage corresponding to unburned; minor (cosmetic or nonstructural damage); moderate (partial to complete failure of structural building elements); and destroyed. The vast majority of structures were in either the minor or destroyed classes (94% in the Bay Area, 99% in the North-Interior, and 95% in Southern CA), so we lumped unburned with minor and called them “survived,” and lumped moderate with destroyed and called those “destroyed.”
The types of data collected included features of the property and vegetation, and inspectors also started to use pre-fire ancillary data, such as assessors’ parcel information, to add details for badly damaged or destroyed structures. Most data fields were categorical to ensure consistency in recording, and the teams used phone applications and GPS data to enter information in the field. For this study, we summarized data for most categories in the inspection report, including distance of defensible space, roof type, exterior siding, eaves, windowpanes, vent screens, and deck or porch material.
The distance of defensible space around structures was recorded as one of several ordinal categories, including 0; 0–9 m (0–30 ft); 9–18 m (30–60 ft); 9–30 m (30–100 ft); 18–30 m (60–100 ft); and >30 m (100 ft). We therefore labeled defensible space into four classes in which 5 m (15 ft) were added to the lowest number of each class and used as the label. We merged the class 9–30 m (30–100 ft) with the 18–30 m (60–100 ft) class. Therefore, 0 or 0–9 m were labeled as “5 m”, 9–18 m was labeled “14 m,” 9–30 m or 18–30 m were labeled “22 m,” and >30 m was labeled “35 m.” We also used these numeric values to calculate average defensible space distances.
In the 2018 fires (including the Camp Fire and Woolsey Fire in the North-Interior and Southern CA regions, respectively), some new variables were added, including defensive action taken and home age. For defensive action, the inspectors recorded whether it was firefighters, civilians, or both who protected the structures during the wildfires, or, they recorded when the information was unknown. For all years, roof type was most frequently recorded as either “combustible” or “resistant” in the Bay Area, but it was broken into different material classes in the other two regions, so for each region we analyzed data according to the most commonly used classification for that variable. Vent screens were also characterized differently for different fires in which the “screened” class was broken into “fine” or “mesh > 1/8” in some cases, and “unscreened” was referred to as “no” or “none” in some cases. We lumped these together into “screened” and “unscreened”.
Building data were collected for different occupancy types (e.g., single- and multi-family residences, outbuildings, commercial buildings, and barns), so we conducted an initial sensitivity analysis using the full dataset comparing rankings of proportions using all structures versus single-family residential structures only, and we found similar rankings for most variables. The variables in which the ranking between single-family residential and other buildings was different were those which would likely characterize non-residential structures (e.g., buildings having no windowpanes, vents, or eaves). Therefore, to preserve the integrity of these classes and for a more robust dataset we used all structures for our analyses in the different regions.
For all variables, there were a substantial number of blank fields where no data were recorded, so there are unequal numbers of data points in all data categories (Table S1). Therefore, we summarized and analyzed all data fields based only on the data that were available for those fields. For comparison purposes we calculated two types of proportions for different perspectives. First, we determined the proportion of the category in each burn class (i.e., for both survived and destroyed structures, what proportion belonged to each category of the variable); and second, we determined the proportion of burn class within each category (i.e., for each category in the variable, what proportion survived or were destroyed) (Figures S1–S8).
2.2. Analysis
To assess the relative importance of each variable, we developed simple generalized linear regression models (GLMs) [31] using defensible space or building characteristics as single predictor variables and survived versus destroyed structures as the bivariate dependent variable. For each model, we used a logit link and specified a binomial response, then calculated and compared the deviance explained (D2), which is analogous to R-squared in linear regression for each variable. For the statewide analyses of defensive action and structure age, we used the combined data for the North-Interior and Southern CA regions only. We did not model roof type statewide (i.e., only ran models for individual regions) because the classification system varied from region to region. For these regions, we used data from whichever classification was most common in each region (roof type 1 for North-Interior and Southern CA and roof type 2 for the Bay Area, Table 1). Given the large amount of missing data in the different explanatory variables, we did not perform multiple regression, as our objective was to create a relative importance ranking of the variables using only the data available.
Because defensible space distance classes can be hypothetically considered as progressively protective against harm (i.e., that more defensible space is more protective), we used a calculation common in medical research, the relative risk [32], to compare adjacent pairs of shorter and longer distance classes of defensible space in addition to comparing the protective effect of the shortest versus longest distance classes (0–30 ft vs. >100 ft). Relative risk is a ratio between proportions of classes having a good outcome (here, structure survived wildfire) versus proportions of classes having a bad outcome (here, structure was destroyed) and indicates whether there is either no relationship (a value of 1) or if the exposed group (structures with shorter distances of defensible space) has either a significantly higher (values >1) or significantly lower (with values <1) risk of surviving the fire given the data available.
We also calculated the relative risk for most of the building inspection variables. For those with more than one independent category, we calculated the relative risk based on the proportion of survived structures in each category relative to the combined proportion of survived structures in all other categories. For variables with binary classes of “combustible” or “resistant”, (Table 1), we calculated the relative risk using the combustible class as the exposure group.
3. Results
From 2013 to 2018, building inspectors examined 41,717 structures, with 37,838 (~90%) damaged or destroyed by fires in 36 California counties, with the largest number destroyed in Butte County in the North-Interior Region, followed by the Bay Area, then Southern California (Table 1). Of the total number of structures inspected, 18% (n = 2045) in the Bay Area, 5% (n = 1105) in the North-Interior, and 20% (n = 729) in Southern CA survived the fires.
3.1. Defensible Space and Defensive Actions
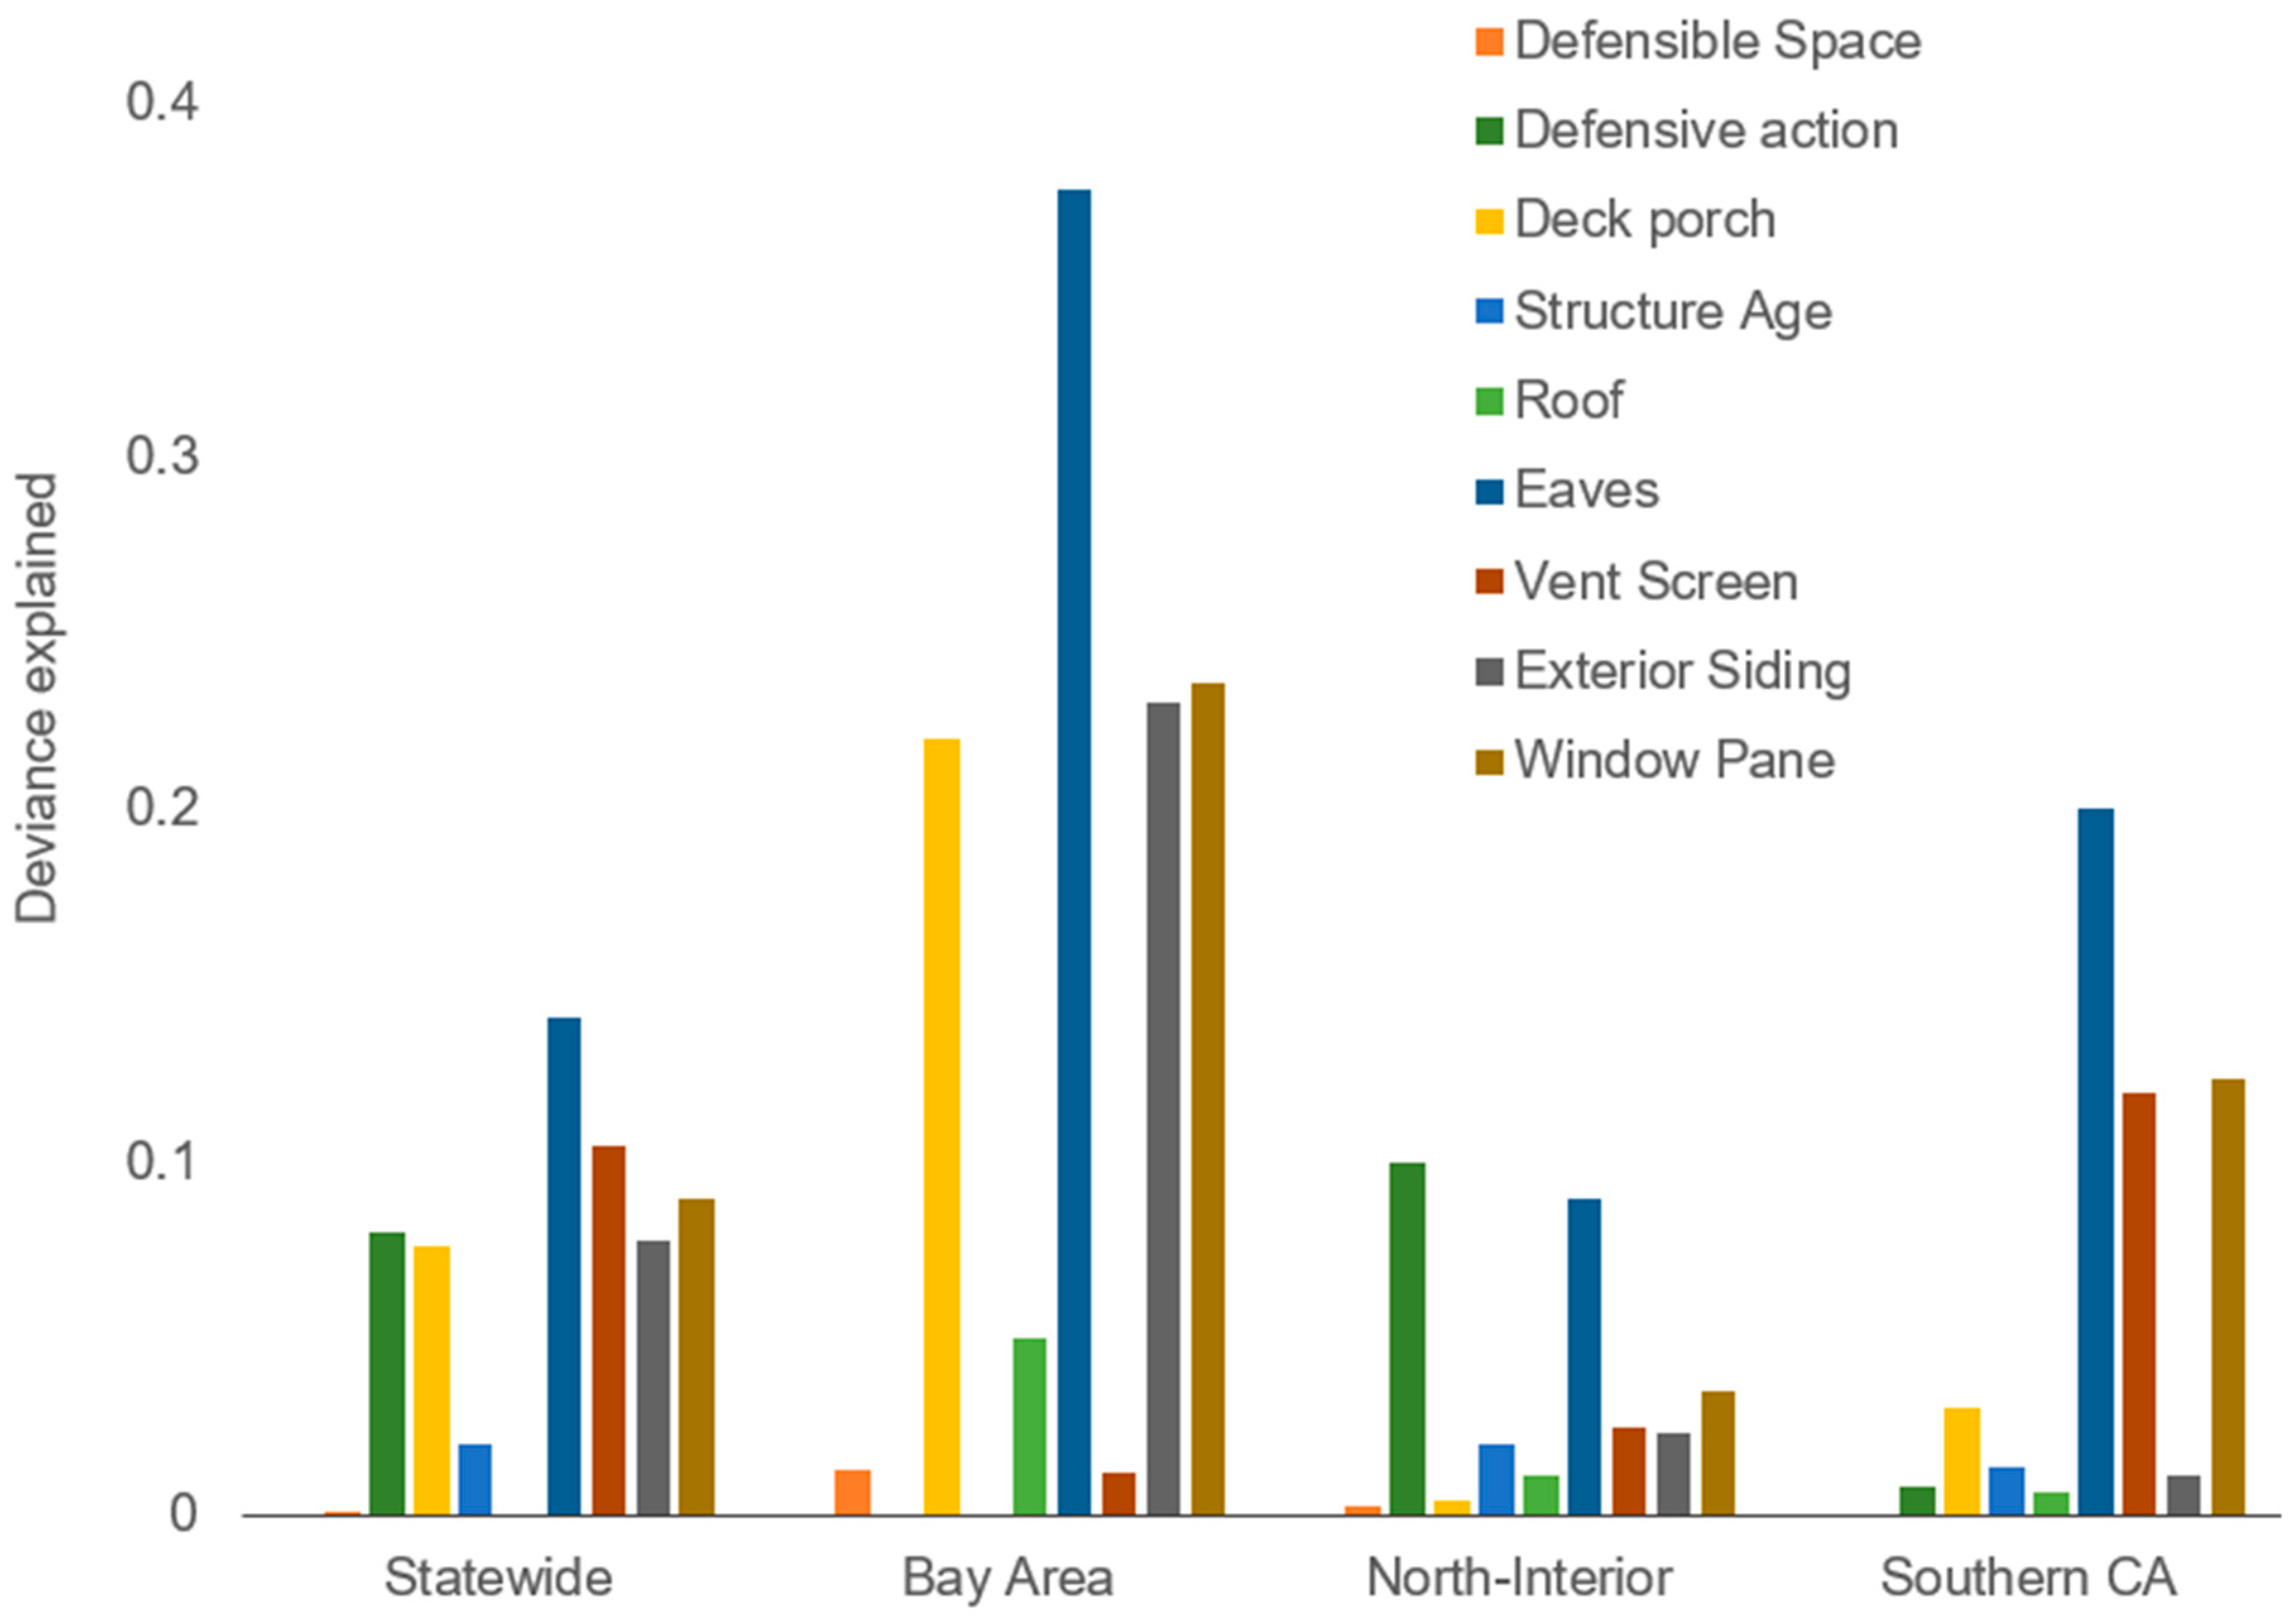
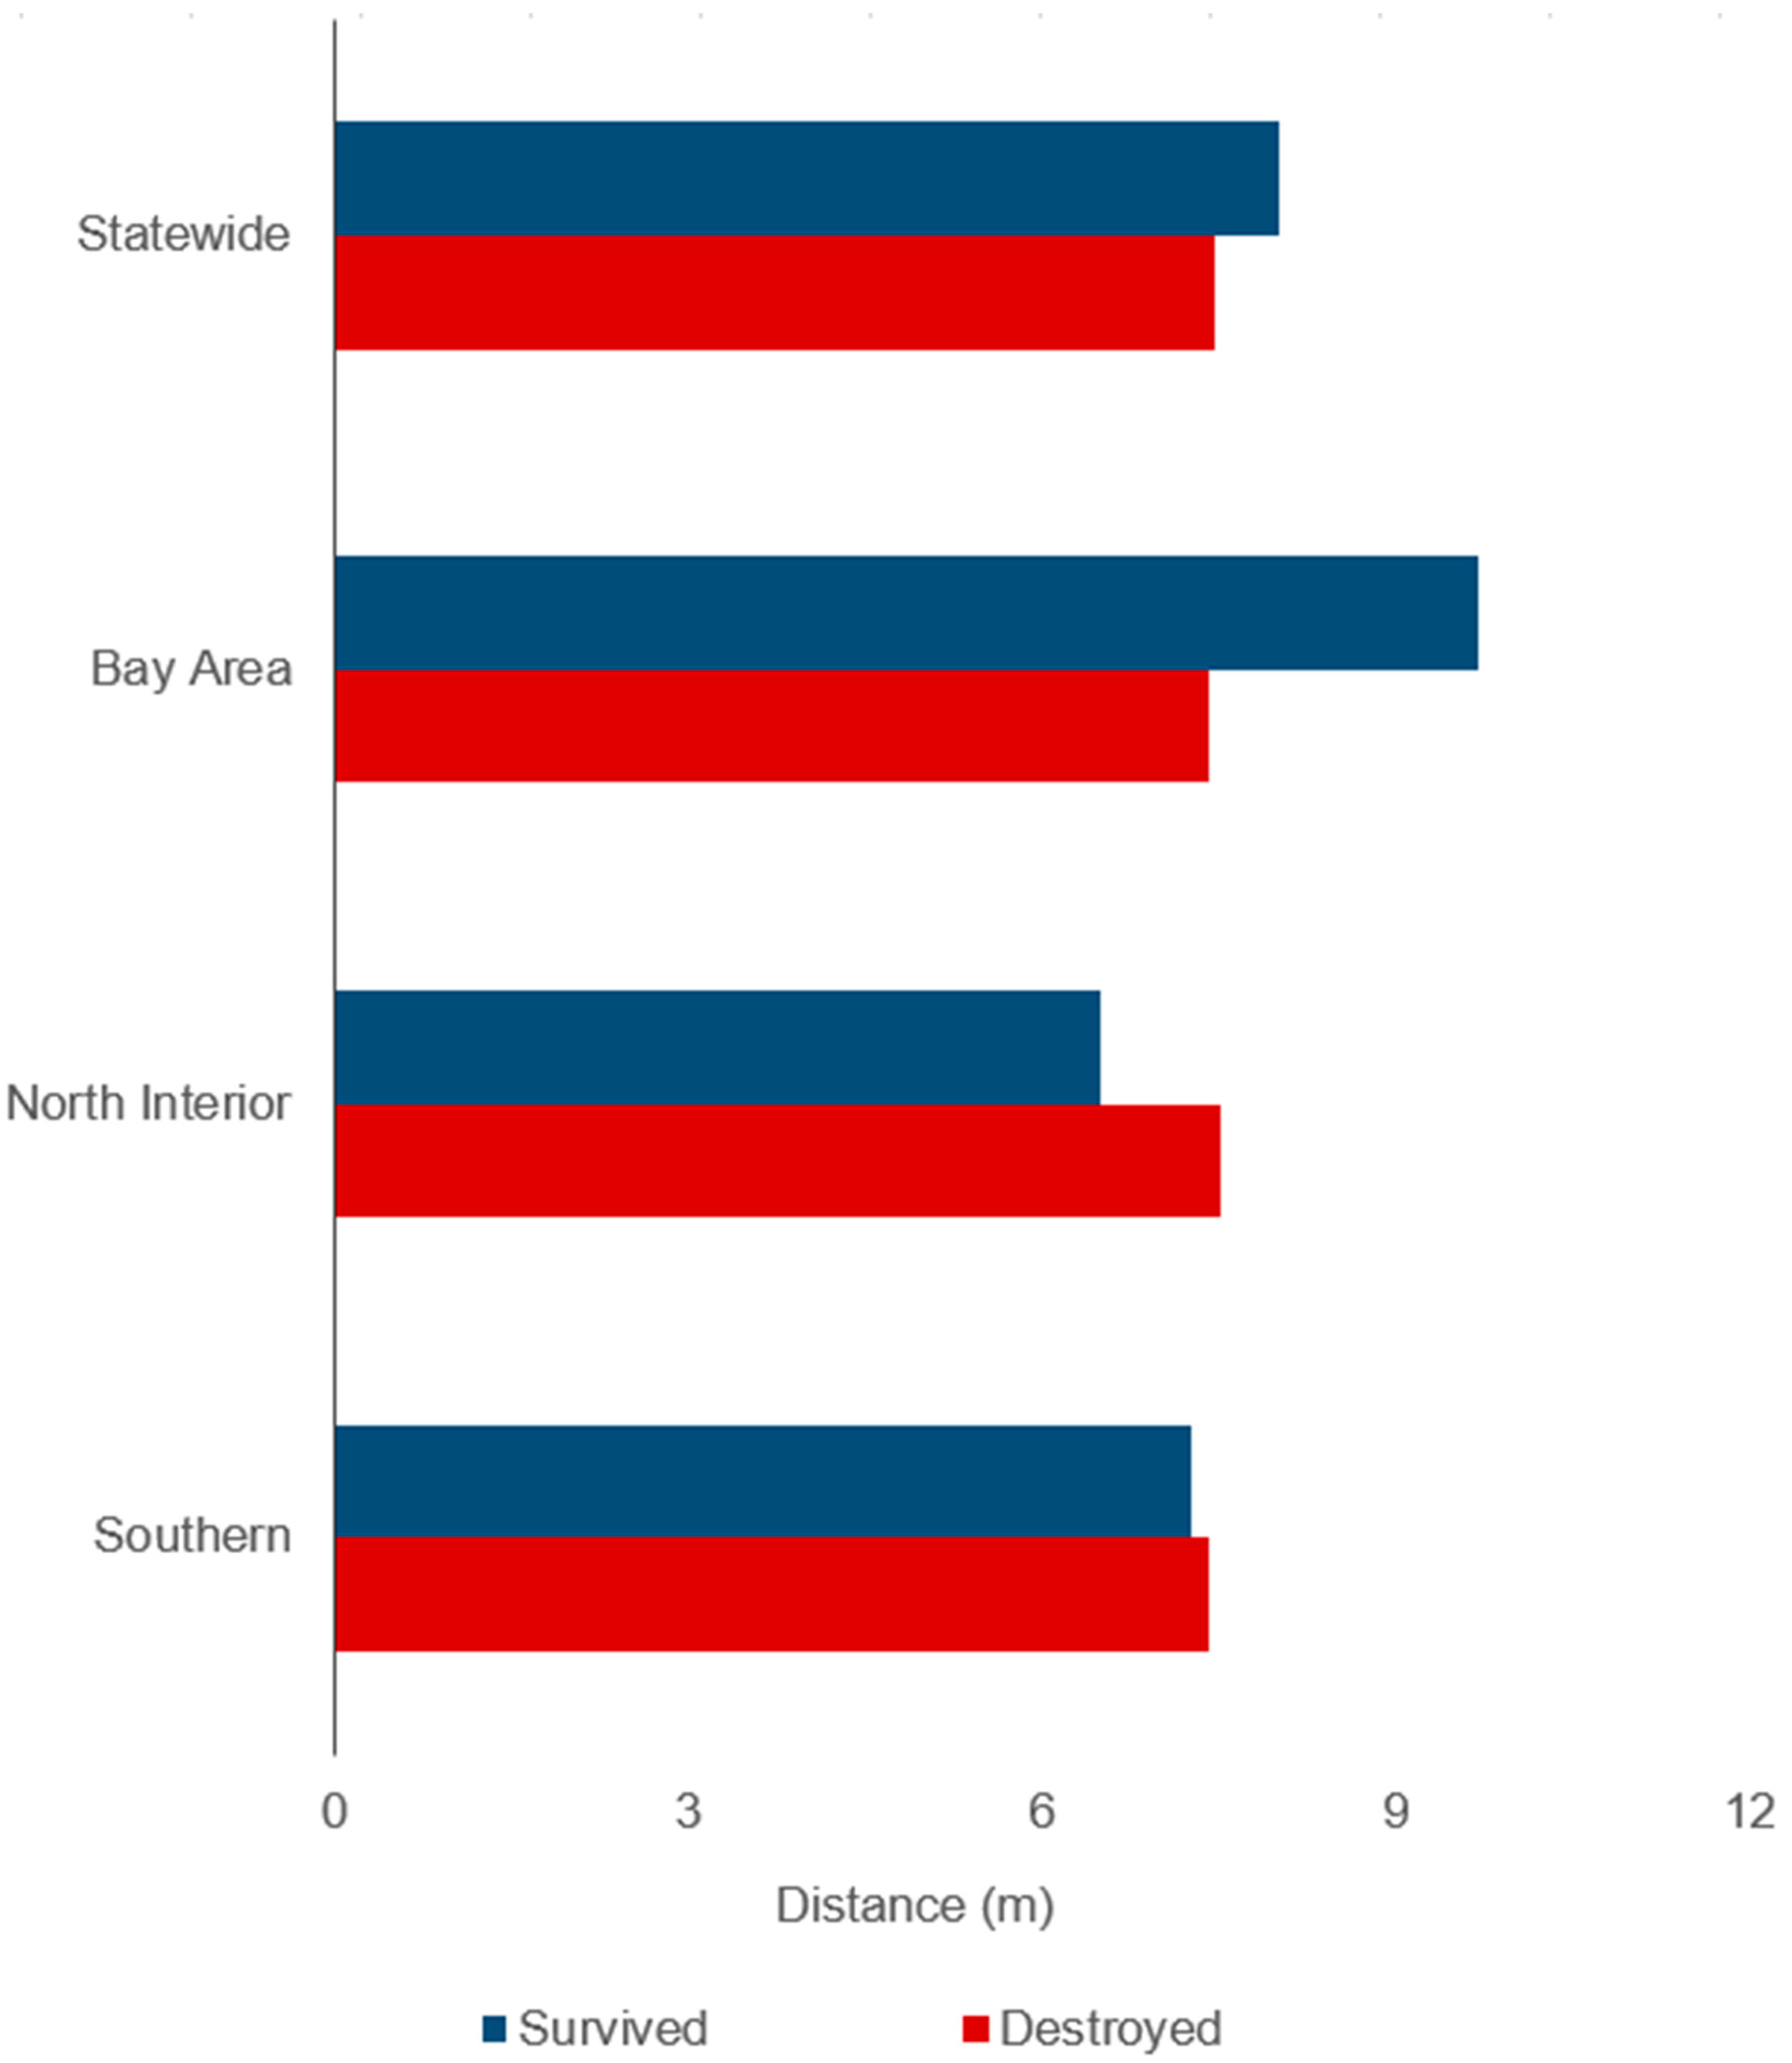
The relative importance of defensible space, as quantified by deviance explained in the regression models, was virtually nil statewide, and the only region in which defensible space had a deviance explained of at least 1% was the Bay Area (Figure 1). Statewide, home survival was associated with slightly longer average distances of defensible space, and this distinction was more pronounced for the Bay Area (Figure 2). On the other hand, when averaging mean values of defensible space classes across survived and destroyed homes, there was a slightly higher mean defensible space distance for destroyed structures in the North-Interior, and virtually no difference in Southern CA (Figure 2).
Except for the comparison between 22 m (75 f) vs. 14 m (45 ft) of defensible space statewide, the relative risk ratios for the statewide and Bay Area data showed consistently lower relative risk when comparing classes of longer distance intervals with shorter distance intervals (Table 2). In the North-Interior, there was a higher relative risk of destruction with more defensible space when comparing 22 m (75 f) vs. 14 m (45 ft), but there was a significantly lower relative risk when comparing 35 m (115 ft) vs. 22 m (75 ft) (Table 2). There were no significant differences in relative risk among any defensible space distance classes in Southern California (Table 2).
Although defensive action was only recorded in the 2018 fires in the North-Interior and Southern CA regions, it was more important than any other variable for North-Interior, and it was less important in the Southern California data (Figure 1). Statewide (using these two regions and comparing the importance to other variables), it had a medium-high relative importance (Figure 1). The relative risk ratios for both regions showed that civilian, fire department, and both types of defensive actions were significantly more protective than unknown action (Table 2). In the North-Interior, the fire department providing defensive action provided better protection than civilian actions, but either both or civilian defensive actions provided a slightly better relative risk ratio for Southern CA.
3.2. Building Inspection Characteristics
Home construction materials explained a substantial amount of variation in housing losses statewide and across regions (Figure 1). Overall, eaves consistently explained more than any other structural parameters, and having enclosed eaves versus no eaves or unenclosed eaves had a highly significant protective effect as seen in the relative risk ratios (Table 2). The structural variable with the second highest deviance explained across all regions was windowpanes (Figure 1), although statewide this variable was ranked slightly lower than vent screens, and vent screens were also nearly as important as windowpanes in Southern California (Figure 1). The relative risk of having single pane windows was consistently and significantly higher than having multiple pane windows statewide and across all areas (Table 2). Structures that had no windows were not significantly different in relative risk compared to structures with windows statewide, but they had a lower relative risk than structures with windowpanes in the Bay Area and North-Interior, and this was reversed in Southern CA (Table 2). There was a consistent and significantly lower relative risk for structures with screened versus unscreened vents across the state and regions (Table 2).
Aside from eaves, windowpanes, and vent screens, the importance and relative risk of structural parameters associated with structure survival varied across the state and regions. Statewide and in the Bay Area, fire-resistant exterior siding material and deck or porch material were nearly as important as windowpanes (Figure 1), with consistently lower relative risk ratios for fire-resistant siding material (Table 2). In terms of deck or porch material, the most consistently significant effect was the significantly lower relative risk of having composite decking material versus other materials (Table 2). Although roofing material did not explain substantial variation in any of the regions (Figure 1), for the North-Interior and Southern CA regions, where the material types were broken out, concrete and tile both had lower relative risk ratios, although tile was not significant for Southern CA (Table 2). In the North-Interior, metal roofs also had slightly lower significant relative risk (Table 2).
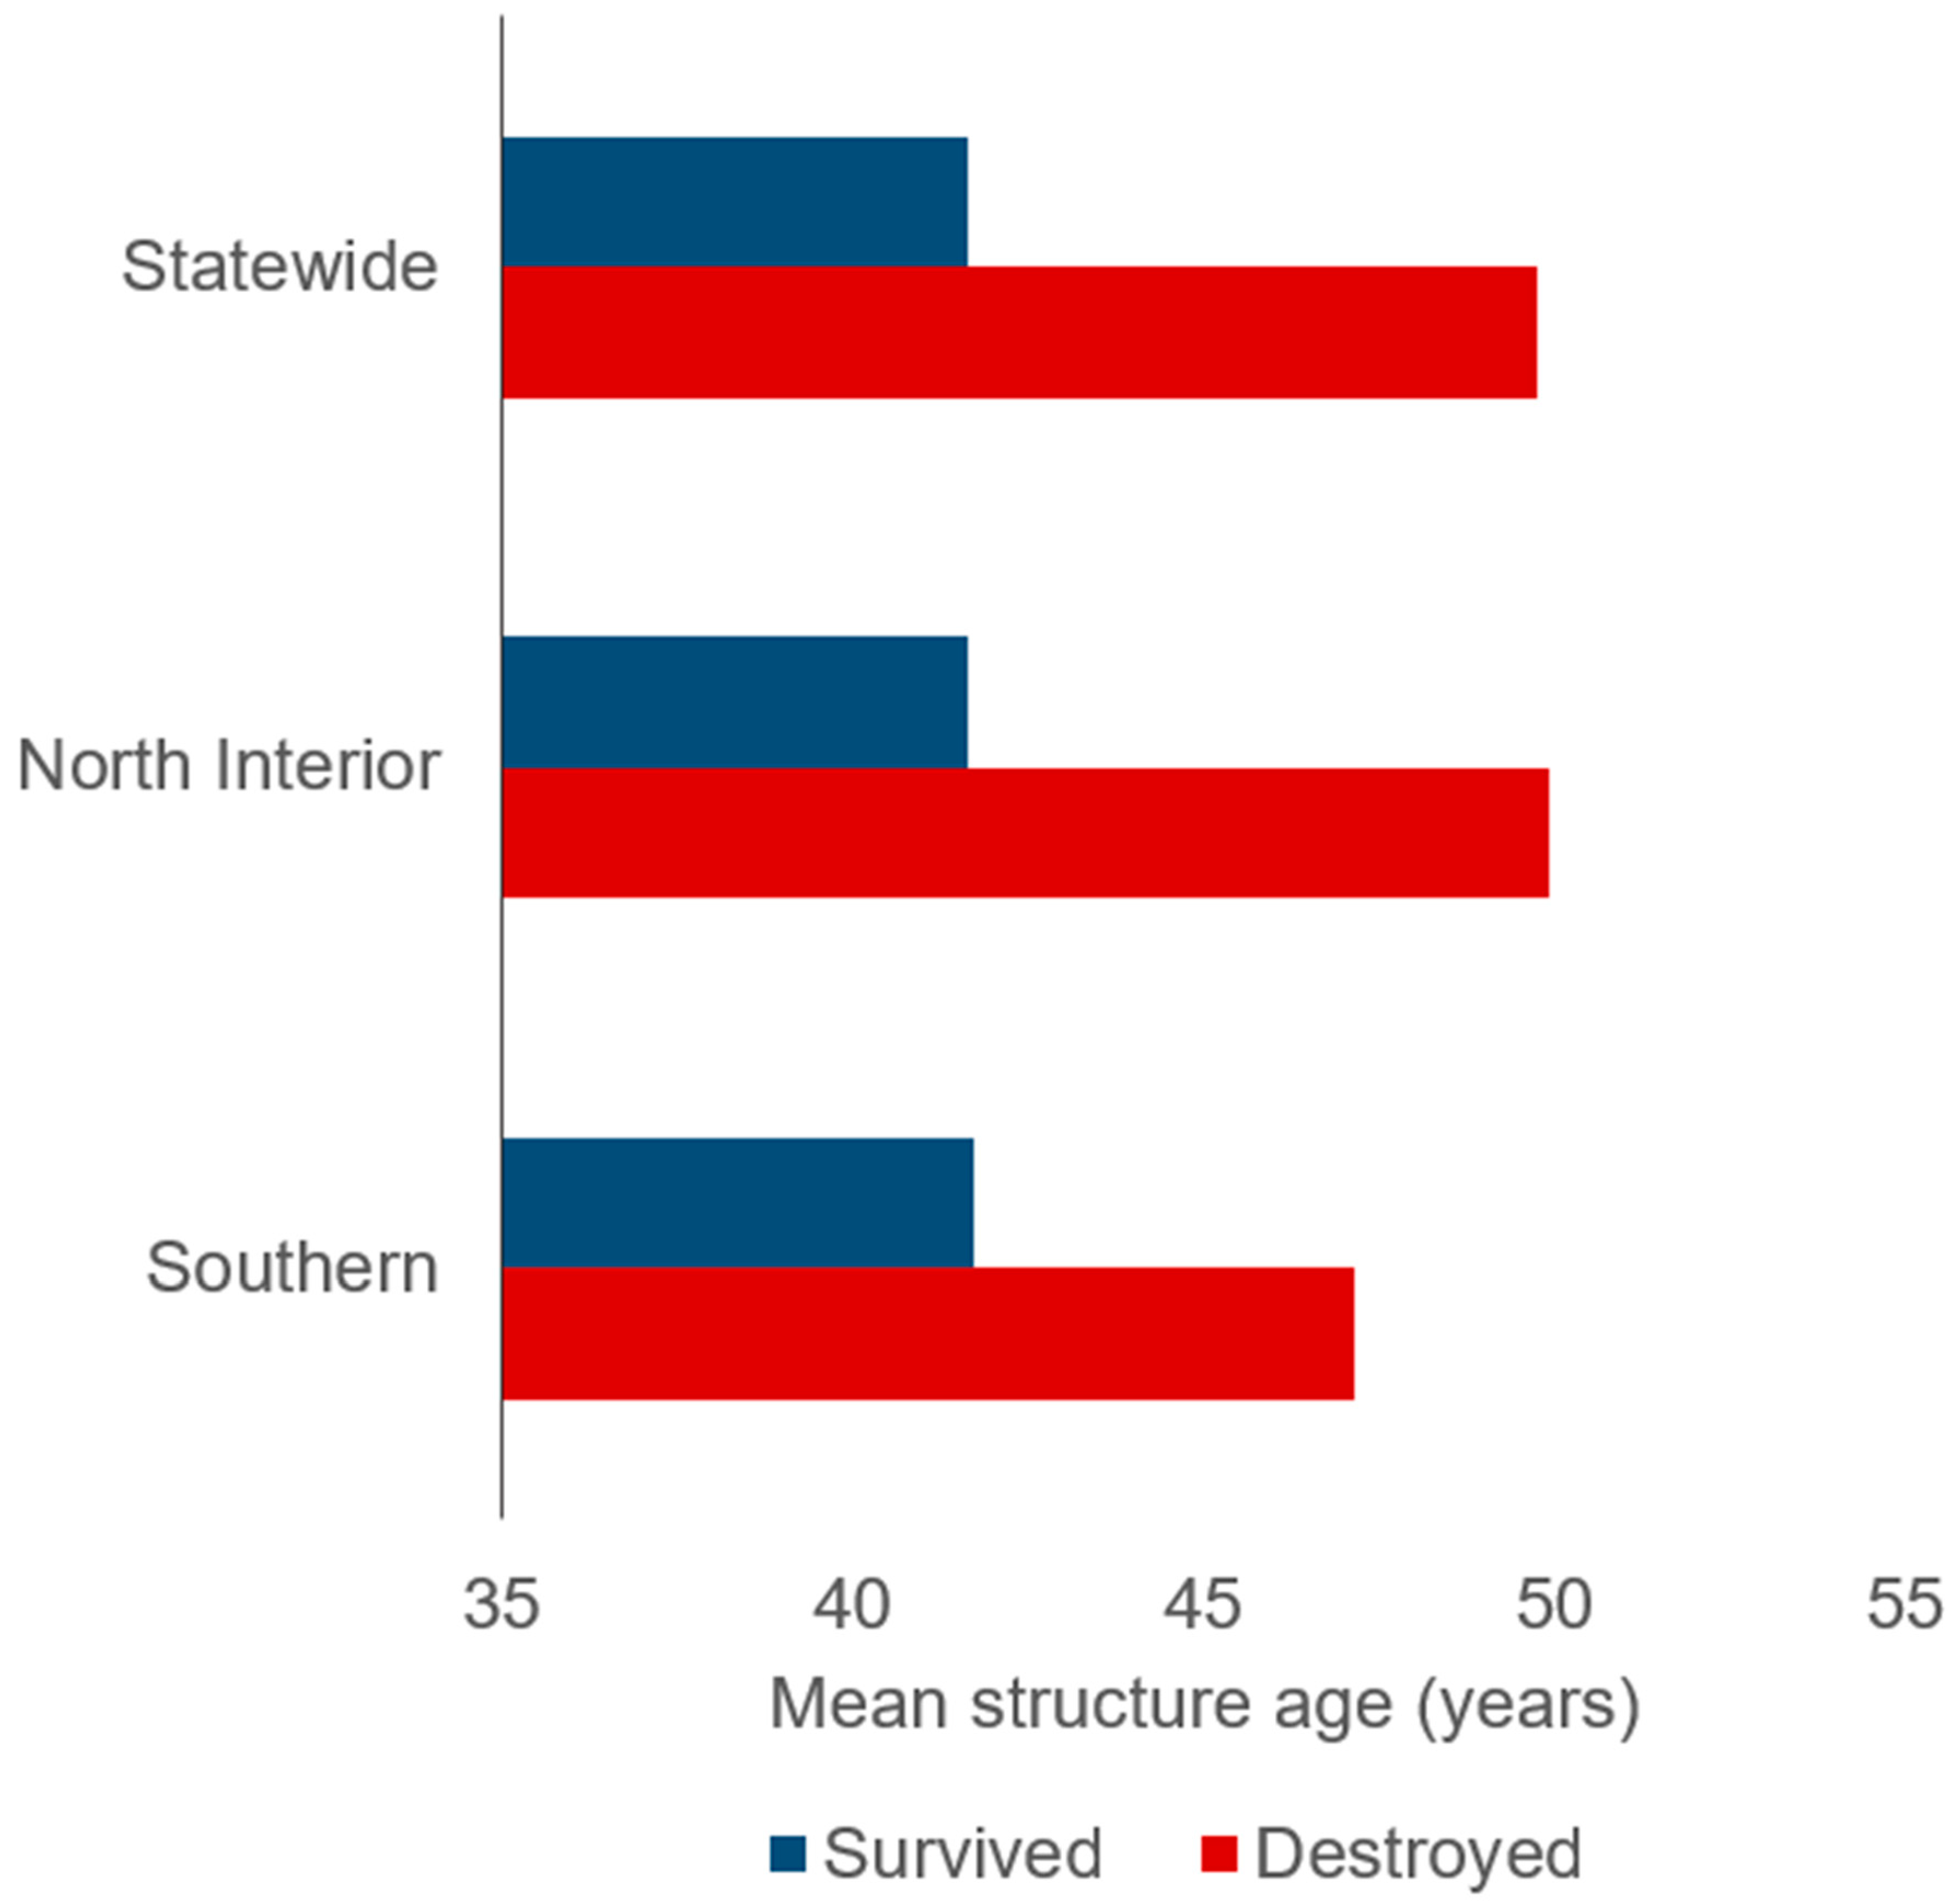
Although structure age, a proxy for all building construction materials, was only recorded for the North-Interior and Southern CA regions, it did not explain substantial variation in structure survival relative to individual building characteristics (Figure 1). On average, however, older homes were consistently more likely to be destroyed than younger homes (Figure 3).
4. Discussion
In terms of mitigation practices for protecting homes against wildfire, perhaps the most widely recognized and regarded action that homeowners can take is to create defensible space around structures [20,33]. In fact, defensible space and “hardening homes” via building construction practices or structure retrofits, collectively referred to as the home ignition zone (HIZ), have often been considered the primary factors that matter in terms of structures surviving wildfire [34,35]. Despite the widespread advocacy of these practices, there has been little empirical study of their effectiveness under actual wildfires, and there is still debate on how much defensible space is critical to home survival despite the regulated distance of 30 m (100 ft).
In this study based on more than 40 k records of structures exposed to wildfires from 2013 to 2018, we found that, overall, defensible space distance explained very little variation in home survival and that structural characteristics were generally more important. Although the relative importance and relative risk ratios of different factors recorded by building inspectors varied slightly from region to region, there were also general similarities, particularly in that structure survival was highest when homes had enclosed or no eaves; multiple-pane windows, and screened vents.
The only region in which defensible space distance explained at least 1% variation in structure survival was the Bay Area, where survived structures had an average of 9.7 m (~32 ft) of defensible space versus 7.4 m (~24 ft) for destroyed structures. Although there were significant differences in relative risk between most pairs of distance classes of defensible space statewide and for the North-Interior, there were some conflicting patterns in the Bay Area and North-Interior, and there was no significant effect of defensible space distance for any comparison in Southern California. The other surprising finding was that, of the structures that did have more than 30 m of defensible space, the vast majority were destroyed in these fires (Figures S1–S8). This of course reflects the large proportion of destroyed structures in the dataset, but it also suggests that structures with greater amounts of defensible space are often still vulnerable.
One potential explanation for the limited importance of defensible space in these data may be that the defensible space distance classes were defined rather broadly, too broad to discern critical details that may have a much bigger impact. Of the few studies quantifying the most effective distance of defensible space for making a significant difference in structure survival probability, Syphard et al. and Miner [19,21] both found the optimum distance to be much shorter than the required 30 m, with the ideal range between 5–22 m. Distances longer than that provided no additional significant protection. Furthermore, these and other studies have shown that more nuanced characteristics of landscaping are most critical for structure protection, including vegetation touching the structure or trees overhanging the roof [36]. The arrangement of vegetation and irrigation are also important factors not accounted for [20]. In fact, despite defensible space traditionally being divided into zones, with the first being from 0–9 m (30 ft) from the structure, newer recommendations are beginning to isolate and focus heavily on the first zone being from 0–1.5 m (5 ft) [37], which may be the most critical zone to account for.
Most structures are lost in wildfires that are burning under severe weather and wind conditions [2], such that burning embers are capable of crossing large, multi-lane freeways and have been reported to blow as far as 1–2 km ahead of a fire front [2,25]. Therefore, one of the primary reasons for the importance of vegetation modification directly adjacent to homes as opposed to longer distances, is that homes are generally not ignited by the fire front but more often by wind-driven embers landing on combustible fuels in or on the house [17,29,38]. Material closest to the house is thus the most likely to cause a proximate spark that can penetrate the structure. To this point, irrigating vegetation and removing dead plant material to reduce ignitability may be as or more important than fuel volume, which is a finding borne out by recent research [24]. While defensible space distances <30 m may be sufficient for increasing structure survival probability, another important reason for requiring 30 m (100 ft) is firefighter safety and providing a zone of protection [39]. Finally, while the inspectors recorded defensible space distances, part of the definition of defensible space in California revolves around the horizontal and vertical spacing of fuels; thus, if these factors matter as much or more than distance, they could not be accounted for here.
The nature of building loss via ember flow factors such as exterior siding or roof material were much less important than exposed eaves, vents, or windows. This again is likely due to the extreme weather condition characteristics of destructive wildfires. That is, the fire-resistance of materials such as roofs or siding, i.e., preventing them from catching fire, was less important than building characteristics that provided gaps in the structure that could allow penetration of wind-borne burning debris. These results suggest that one of the potentially most effective methods of protecting homes from wildfire destruction would be to perform simple building retrofits, such as placing fine mesh screens over vents and coverings other openings in the structures, such as gaps in roofs, and enclosing structure eaves. Specific recommendations for these types of retrofits are easily found online, e.g., [40], and suggest that improving the fire safety of structures does not necessarily require expensive replacement of construction materials but rather careful attention to structure details.
The previous post-fire study of the role of construction materials in structure survival also found that windows, particularly framing material and panes, were more important than roof or siding material, although the methods and overall suite of variables differed in that study [23]. In the case of windows, they can, like other parts of the structure, provide an easy entry point for firebrands [26]. Additionally, however, they are also vulnerable to radiant heat, and multi-pane windows can withstand much higher levels of thermal exposure than single-pane windows [41]. Although not recorded here, the type of glass used in the window is also important for resistance to cracking [26].
Although individual structural characteristics were highly influential in this study, structure age did not explain a lot by itself, which may mean that, at a broad scale, it does not necessarily serve well as a proxy for the building characteristics most likely to protect homes. On the other hand, Syphard et al. [23] found that structure age did correlate with both building characteristics and structure survival, but that study was only conducted in San Diego County, where building codes had already been updated several times in response to wildfires in the regions. Although the state of California has also recently adopted strict building codes for wildfires [42], those codes only apply to new housing, so the effects may not have been seen yet. Further analysis might be warranted to compare structural characteristics and outcomes as a function of date of code enforcement.
Another consideration is that, despite the importance of structure age in the San Diego study, that study also determined that building location and arrangement were more important in predicting structure loss than structure age, building materials, or defensible space. The effect of structure age was primarily important in higher-density neighborhoods where structure loss was overall less likely. Thus, the role of housing arrangement and location, found to be the most important predictors of structure loss in several California studies [13,14,15] and nationwide [43] should ultimately be factored into discussions of reducing future fire risk; and this looks to be a challenge given trends of rapid ongoing development in the wildland–urban interface [44].
One of the reasons that housing arrangement and location are such strong predictors of structure loss may be structure accessibility by firefighters, who must divide manpower and resources to reach communities located in dispersed or remote locations [45,46]. The role of defensive actions in determining the extent and location of structure survival has been historically difficult to quantify, mostly because data are sparse, but also because defining suppression effectiveness is an inherently difficult task [47]. In the North-Interior region, defensive action explained more than any other factor in structure survival, although it was less important than building characteristics in Southern California. Even given the high importance of defensive action in the North-Interior, the total number of structures with unknown defensive action was substantial, and the proportion of unknown actions was even larger in Southern California. Thus, while these results suggest that defensive actions may be one of the most important and overlooked factors in structure survival, it remains difficult to make definitive conclusions. Given that building inspectors have just started collecting this information, it is important to recognize this is an on-going process of increasing our knowledge base as more data are collected.
5. Dataset and Limitations
Given the enormous number of structures lost in California in recent years, the dataset compiled for this study may represent the largest existing source of information on homeowner mitigation practices associated with structure loss. Other large databases and studies of house loss have been developed in other countries, however, where wildfires result in substantial losses in structures and human life; much of this work has been conducted in Australia, a country with a long history of destructive wildfires with substantial structure losses [48], and human fatalities [49]. This ongoing data collection process, especially if more exposed but unburned homes are included, will be important for continued understanding of structure loss and identifying the most effective strategies for prevention.
Despite the unprecedented opportunity the DINS data have provided for this broad-scale analysis of structure loss, there are nevertheless uncertainties and limitations within the data, and Cal Fire is working to improve the collection process on an ongoing basis [30].
The primary limitation is, as we discussed previously, that defensible space was presented uni-dimensionally as a function of distance categories and thus excluded other relevant factors such as vegetation spacing, height, type, age, moisture content, or composition. Nevertheless, given the broad scale of the data and similar conclusions for all study areas, these additional vegetation characteristics do not appear to be biased in one direction or the other; thus, our conclusions about distance classes are likely robust.
Another limitation of the dataset is the potential uncertainty inherent in recording building characteristics after a wildfire for homes that have been badly burned with materials largely consumed in the fire. This likely explains the missing data seen throughout the records. Cal Fire is aware of this and is beginning to combine their reports with pre-fire information from county assessors’ offices [30]; however, the extent to which pre-fire data may have been incorporated in the reports used for this study is unclear.
Finally, as mentioned previously, this study only focused on the relative importance of the local-scale factors reported by the building inspectors, and full understanding of structure loss will need to include additional factors. Ongoing research will account for a fuller range of landscape-scale factors as well as information on fire behavior and spatial patterns.
6. Conclusions
We have explored the factors correlated with structure loss and survival during a recent five-year period in California. In most regions home structural characteristics are far more important in determining home survival than defensible space. Statewide, the most critical factor was eave construction. Windowpanes were also widely important in the state. Exterior siding was an important structural characteristic in the Bay Area, but vent screens were much more important in southern California. The likely explanation for why structure characteristics play a greater role than defensible space is that most homes burn by embers, which often come from long distances; and the impact of the ember cast is not likely affected by distance of defensible space. Whether or not the embers ignite is largely a function of structure.
Given that the primary role of building inspectors is to assess building damage, most structures in the data were destroyed. As such, one of the striking outcomes of this study is the finding that many of these destroyed structures could be characterized as “fire-safe,” such as having >30 m defensible space or fire-resistant building materials. While the number of structures lost in these fire events was unprecedented in California history, structure loss during severe fire-weather and wind conditions similar to some of the fires represented here has occurred for decades in the state 2. Therefore, it may be safe to assume that these data are broadly representative.
Supplementary Materials
The following are available online at https://0-www-mdpi-com.brum.beds.ac.uk/2571-6255/2/3/49/s1, Figure S1: Proportion of defensible space distance classes for survived and destroyed structures (a) and proportion of survived and destroyed structures within defensible space distance classes (b) for three California regions, Figure S2: Figure S2: Proportion of defensible action type for survived and destroyed structures (a) and proportion of survived and destroyed structures within defensive action types (b) for two California regions, Figure S3: Proportion of deck material type for survived and destroyed structures (a) and proportion of survived and destroyed structures within deck material type classes (b) for three California regions, Figure S4: Proportion of roof material type for survived and destroyed structures (a) and proportion of survived and destroyed structures within roof material type classes (b) for two California regions, Figure S5: Proportion of eave type for survived and destroyed structures (a) and proportion of survived and destroyed structures within eave type classes (b) for three California regions, Figure S6: Proportion of Exterior siding classes for survived and destroyed structures (a) and proportion of survived and destroyed structures within exterior siding classes (b) for three California regions, Figure S7: Proportion of vent screen classes for survived and destroyed structures (a) and proportion of survived and destroyed structures within vent screen classes (b) for three California regions, Figure S8: Proportion of windowpane type for survived and destroyed structures (a) and proportion of survived and destroyed structures within windowpane type (b) for three California regions. Table S1: Number or average value of destroyed and survived structures within building inspection classes for three California regions.
Author Contributions
Conceptualization, A.D.S. and J.E.K.; methodology, A.D.S. and J.E.K.; formal analysis, A.D.S.; data curation, A.D.S.; writing—original draft preparation, A.D.S.; writing—review and editing, J.E.K.
Funding
This research received no external funding.
Acknowledgments
The US government does not endorse any product mentioned in this manuscript.
Conflicts of Interest
The authors declare no conflict of interest.
References
- Sugihara, N.G.; Van Wagtendonk, J.W.; Fites-Kaufman, J.; Shaffer, K.E.; Thode, A.E. Fire in California’s Ecosystems; University of California Press: Berkeley, CA, USA, 2006. [Google Scholar]
- Keeley, J.E.; Syphard, A.D. Twenty-First Century California, USA, Wildfires: Fuel-Dominated vs. Wind Dominated Fires. Fire Ecol. 2019, 15, 24. [Google Scholar] [CrossRef]
- Viegas, D.X. Wildfires in Portugal. Eur. J. For. Res. 2018, 130, 775–784. [Google Scholar] [CrossRef]
- Leonard, J.; Blanchi, R.; Lipkin, F.; Newnham, G.; Siggins, A.; Opie, K.; Culvenor, D. Building and Land-Use Planning Research after the 7th February Victorian Bushfires: Preliminary Findings; Bushfire CRC: Melbourne, Australia, 2009. [Google Scholar]
- Molina-Terrén, D.M.; Xanthopoulos, G.; Diakakis, M.; Ribeiro, L.; Caballero, D.; Delogu, G.M.; Viegas, D.X.; Silva, C.A.; Cardil, A. Analysis of Forest Fire Fatalities in Southern Europe: Spain, Portugal, Greece and Sardinia (Italy). Int. J. Wildland Fire 2019, 28, 85–98. [Google Scholar] [CrossRef]
- Edwards, W.P. The New Normal: Living with Wildland Fire. Nat. Resour. Environ. 2019, 33, 30–33. [Google Scholar]
- Radtke, K.W.H. Living More Safely in the Chaparral-Urban Interface. USDA For. Serv. Pac. Southwest For. Range Exp. Stn. 1983, 67, 51. [Google Scholar]
- Moore, H.E. Protecting Residences from Wildfires: A Guide for Homeowners, Lawmakers, and Planners; DIANE Publishing: Collingdale, PA, USA, 1993. [Google Scholar]
- Bradstock, R.A.; Gill, A.M.; Kenny, B.J.; Scott, J. Bushfire Risk at the Urban Interface Estimated from Historical Weather Records: Consequences for the Use of Prescribed Fire in the Sydney Region of South-Eastern Australia. J. Environ. Manag. 1998, 52, 259–271. [Google Scholar] [CrossRef]
- Penman, T.D.; Collins, L.; Syphard, A.D.; Keeley, J.E.; Bradstock, R.A. Influence of Fuels, Weather and the Built Environment on the Exposure of Property to Wildfire. PLoS ONE 2014, 9, e111414. [Google Scholar] [CrossRef]
- Mell, W.E.; Manzello, S.L.; Maranghides, A.; Butry, D.T.; Rehm, R.G. The Wildland-Urban Interface Fire Problem—Current Approaches and Research Needs. Int. J. Wildland Fire 2010, 19, 238–251. [Google Scholar] [CrossRef]
- Conlisk, E.; Lawson, D.; Syphard, A.D.; Franklin, J.; Flint, L.; Flint, A.; Regan, H.M. The Roles of Dispersal, Fecundity, and Predation in the Population Persistence of an Oak (Quercus Engelmannii) under Global Change. PLoS ONE 2012, 7. [Google Scholar] [CrossRef]
- Syphard, A.D.; Rustigian-Romsos, H.; Mann, M.; Conlisk, E.; Moritz, M.A.; Ackerly, D. The Relative Influence of Climate and Housing Development on Current and Projected Future Fire Patterns and Structure Loss across Three California Landscapes. Glob. Environ. Chang. 2019, 56, 41–55. [Google Scholar] [CrossRef]
- Alexandre, P.M.; Stewart, S.I.; Mockrin, M.H.; Keuler, N.S.; Syphard, A.D.; Bar-Massada, A.; Clayton, M.K.; Radeloff, V.C. The Relative Impacts of Vegetation, Topography and Spatial Arrangement on Building Loss to Wildfires in Case Studies of California and Colorado. Landsc. Ecol. 2015, 31, 415–430. [Google Scholar] [CrossRef]
- Syphard, A.D.; Keeley, J.E.; Massada, A.B.; Brennan, T.J.; Radeloff, V.C. Housing Arrangement and Location Determine the Likelihood of Housing Loss Due to Wildfire. PLoS ONE 2012, 7, e33954. [Google Scholar] [CrossRef] [PubMed]
- Los Angeles County Board of Supervisors. A Guide to Defensible Space Ornamental Vegetation Maintenance. Available online: https://www.fire.lacounty.gov/wp-content/uploads/2019/06/A-Guide-to-Defensible-Space-Ornamental-Vegetation-Maintenance.pdf (accessed on 20 August 2019).
- Cohen, J.D. Home Ignitability in the Wildland-Urban Interface. J. For. 2000, 98, 15–21. [Google Scholar]
- Cohen, J. Relating Flame Radiation to Home Ignition Using Modeling and Experimental Crown Fires. Can. J. For. Res. 2004, 34, 1616–1626. [Google Scholar] [CrossRef]
- Syphard, A.D.; Brennan, T.J.; Keeley, J.E. The Role of Defensible Space for Residential Structure Protection during Wildfires. Int. J. Wildland Fire 2014, 23, 1165–1175. [Google Scholar] [CrossRef]
- Penman, S.H.; Price, O.F.; Penman, T.D.; Bradstock, R.A. The Role of Defensible Space on the Likelihood of House Impact from Wildfires in Forested Landscapes of South Eastern Australia. Int. J. Wildland Fire 2019, 28, 4–14. [Google Scholar] [CrossRef]
- Miner, A. Defensible Space Optimization for Preventing Wildfire Structue Loss in the Santa Monica Mountains; Johns Hopkins University: Baltimore, MD, USA, 2014. [Google Scholar]
- Rahman, S.; Rahman, S. Defensible Spaces and Home Ignition Zones of Wildland-Urban Interfaces in the Fire-Prone Areas of the World. Preprints 2019. [Google Scholar] [CrossRef]
- Syphard, A.D.; Brennan, T.J.; Keeley, J.E. The Importance of Building Construction Materials Relative to Other Factors Affecting Structure Survival during Wildfire. Int. J. Disaster Risk Reduct. 2017, 21, 140–147. [Google Scholar] [CrossRef]
- Gibbons, P.; Gill, A.M.; Shore, N.; Moritz, M.A.; Dovers, S.; Cary, G.J. Options for Reducing House-Losses during Wildfires without Clearing Trees and Shrubs. Landsc. Urban Plan. 2018, 174, 10–17. [Google Scholar] [CrossRef]
- Quarles, S.L.; Valachovic, Y.; Nakamura, G.; Nader, G.; De, L.M. Home Survival in Wildfire-Prone Areas: Building Materials and Design Considerations; UC Agriculture and Natural Resources: Richmond, CA, USA, 2010. [Google Scholar]
- Bowditch, P.; Sargeant, A.; Leonard, J.; Macindoe, L. Window and Glazing Exposure to Laboratory-Simulated Bushfires; Bushfire CRC: East Melbourne, Australia, 2006. [Google Scholar]
- Manzello, S.L.; Suzuki, S.; Hayashi, Y. Exposing Siding Treatments, Walls Fitted with Eaves, and Glazing Assemblies to Firebrand Showers. Fire Saf. J. 2012, 50, 25–34. [Google Scholar] [CrossRef]
- Gibbons, P.; van Bommel, L.; Gill, A.; Cary, G.J.; Driscoll, D.A.; Bradstock, R.A.; Knight, E.; Moritz, M.A.; Stephens, S.L.; Lindenmayer, D.B. Land Management Practices Associated with House Loss in Wildfires. PLoS ONE 2012, 7, e29212. [Google Scholar] [CrossRef] [PubMed]
- Maranghides, A.; Mell, W. A Case Study of a Community Affected by the Witch and Guejito Fires; National Institute of Standards and Technology. Building and Fire Research Laboratory: Gaithersburg, MD, USA, 2009.
- Henning, A.; Cox, J.; Shew, D. CAL FIRE’s Damage Inspection Program—Its Evolution and Implementation. Available online: http://www.fltwood.com/perm/nfpa-2016/scripts/sessions/M26.html (accessed on 20 August 2019).
- Venables, W.M.; Ripley, B.D. Modern Applied Statistics with S-Plus; Springer: New York, NY, USA, 1994. [Google Scholar]
- Sheskin, D.J. Handbook of Parametric and Nonparametric Statistical Procedures; CRC Press: Boca Raton, FL, USA, 2003. [Google Scholar]
- Elia, M.; Lovreglio, R.; Ranieri, N.; Sanesi, G.; Lafortezza, R. Cost-Effectiveness of Fuel Removals in Mediterranean Wildland-Urban Interfaces Threatened by Wildfires. Forests 2016, 7, 149. [Google Scholar] [CrossRef]
- Cohen, J.D. Wildland–Urban Fire—A Different Approach. In Proceedings of the Firefighter Safety Summit; International Association of Wildland Fire: Missoula, MT, USA, 2001; pp. 6–8. [Google Scholar]
- Platt, R.V. Wildfire Hazard in the Home Ignition Zone: An Object-Oriented Analysis Integrating LiDAR and VHR Satellite Imagery. Appl. Geogr. 2014, 51, 108–117. [Google Scholar] [CrossRef]
- Keeley, J.E.; Syphard, A.D.; Fotheringham, C.J. The 2003 and 2007 Wildfires in Southern California; Cambridge University Press: Oxford, UK, 2008. [Google Scholar] [CrossRef]
- DistasterSafety.Org. Maintain Defensible Space. Available online: https://disastersafety.org/wildfire/defensible-space/ (accessed on 20 August 2019).
- Cohen, J.; Stratton, R. Home Destruction Examination: Grass Valley Fire, Lake Arrowhead, California; Tech. Paper R5-TP-026b; USDA: Vallejo, CA, USA, 2008.
- Cheney, P.; Gould, J.; McCaw, L. The Dead-Man Zone—A Neglected Area of Firefighter Safety. Aust. For. 2001, 64, 45–50. [Google Scholar] [CrossRef]
- Extension, U. of C.C. Wildfire Preparation & Recovery. Available online: https://ucanr.edu/sites/fire/Wildfire_Preparation_-_Recovery/ (accessed on 20 August 2019).
- Cuzzillo, B.; Pagni, P. Thermal Breakage of Double-Pane Glazing by Fire. J. Fire Prot. Eng. 1998, 9, 1–11. [Google Scholar] [CrossRef]
- Commission, C. B. S. 2016 California Building Code Title 24, Part 2, Volume 1 of 2. Available online: https://codes.iccsafe.org/content/document/653 (accessed on 20 August 2019).
- Alexandre, P.M.; Stewart, S.I.; Keuler, N.S.; Clayton, M.K.; Mockrin, M.H.; Bar-Massada, A.; Syphard, A.D.; Radeloff, V.C. Factors Related to Building Loss Due to Wildfires in the Conterminous United States. Ecol. Appl. 2016, 26, 2323–2338. [Google Scholar] [CrossRef] [PubMed]
- Radeloff, V.C.; Helmers, D.P.; Anu Kramer, H.; Mockrin, M.H.; Alexandre, P.M.; Bar-Massada, A.; Butsic, V.; Hawbaker, T.J.; Martinuzzi, S.; Syphard, A.D.; et al. Rapid Growth of the US Wildland-Urban Interface Raises Wildfire Risk. Proc. Natl. Acad. Sci. USA 2018, 115, 3314–3319. [Google Scholar] [CrossRef] [PubMed]
- Gude, P.H.; Rasker, R.; van den Noort, J. Potential for Future Development on Fire-Prone Lands. J. For. 2008, 106, 198–205. [Google Scholar]
- Gorte, R. The Rising Cost of Wildfire Protection; Headwaters Economics: Bozeman, MT, USA, 2013. [Google Scholar]
- Plucinski, M.P. Fighting Flames and Forging Firelines: Wildfire Suppression Effectiveness at the Fire Edge. Curr. For. Rep. 2019, 5, 1–19. [Google Scholar] [CrossRef]
- Leonard, J. Report to the 2009 Victorian Bushfires Royal Commission. Building Performance in Bushfires. In Highett, Victoria: Australia Sustainable Ecosystems; CSIRO: Canberra, Australia, 2009. [Google Scholar]
- Blanchi, R.; Leonard, J.; Haynes, K.; Opie, K.; James, M.; Kilinc, M.; De Oliveira, F.D.; Van den Honert, R. Life and House Loss Database Description and Analysis; CSIRO: Canberra, Australia, 2012. [Google Scholar]
Figure 1.
Deviance explained for building inspection variables statewide in three California regions. Defensive action and structure age were only available for North-Interior and Southern CA.
Figure 1.
Deviance explained for building inspection variables statewide in three California regions. Defensive action and structure age were only available for North-Interior and Southern CA.

Figure 2.
Average distance of defensible space for survived and destroyed structures statewide and in three California regions.
Figure 2.
Average distance of defensible space for survived and destroyed structures statewide and in three California regions.

Figure 3.
Mean age of structure for survived and destroyed homes in two California regions. The statewide calculations are based on combined totals of both regions (i.e., the Bay Area did not include this variable).
Figure 3.
Mean age of structure for survived and destroyed homes in two California regions. The statewide calculations are based on combined totals of both regions (i.e., the Bay Area did not include this variable).


Table 1.
Number of destroyed and survived structures from 2013–2018 by county and region in California. Dash marks indicate no structure outcomes recorded. The bold totals report the sums of destroyed and survived structures for each region.
Table 1.
Number of destroyed and survived structures from 2013–2018 by county and region in California. Dash marks indicate no structure outcomes recorded. The bold totals report the sums of destroyed and survived structures for each region.
| Region | County | Number Destroyed | Number Survived |
|---|---|---|---|
| Bay Area | Contra Costa | 1 | -- |
| Lake | 2588 | 89 | |
| Mendocino | 566 | 32 | |
| Monterey | 88 | 4 | |
| Napa | 1123 | 587 | |
| Santa Clara | 29 | 700 | |
| Santa Cruz | 6 | 19 | |
| Solano | 11 | 56 | |
| Sonoma | 6764 | 470 | |
| Yolo | 24 | 88 | |
| Total | 11,200 | 2045 | |
| North-Interior | Amador | 1 | |
| Butte | 19,061 | 740 | |
| Calaveras | 936 | 31 | |
| Fresno | 10 | 2 | |
| Humboldt | 5 | -- | |
| Inyo | 2 | -- | |
| Lassen | 4 | 1 | |
| Madera | 16 | 4 | |
| Mariposa | 142 | 20 | |
| Mono | 58 | 6 | |
| Nevada | 63 | 4 | |
| Shasta | 1889 | 260 | |
| Siskiyou | 339 | 18 | |
| Tehama | 26 | 4 | |
| Trinity | 142 | 7 | |
| Tuolumne | 1 | -- | |
| Yuba | 274 | 8 | |
| Total | 22,969 | 1105 | |
| Southern | Kern | 398 | 21 |
| Kings | 1 | -- | |
| Los Angeles | 1667 | 339 | |
| Orange | 38 | 43 | |
| Riverside | 53 | 10 | |
| San Diego | 246 | 67 | |
| San Luis Obispo | 81 | 7 | |
| Santa Barbara | 110 | 42 | |
| Ventura | 1075 | 200 | |
| Total | 3669 | 729 |
Table 2.
Relative risk (RR) among building inspection variables statewide and for three California regions. A relative risk of 1 indicates no difference between classes; >1 means the relative risk of destruction is higher in the first category listed; <1 means the relative risk of destruction is lower than in the other classes. Dashes indicate where no data were available for certain categories.
| Variable | Statewide | Bay Area | North-Interior | Southern | ||||
|---|---|---|---|---|---|---|---|---|
| Defensible Space | RR | p-Value | RR | p-Value | RR | p-Value | RR | p-Value |
| 14 m (45 ft) vs. 5 m (15 ft) | 0.95 | 0.0001 | 0.98 | 0.06 | 0.97 | 0.09 | 0.97 | 0.24 |
| 22 m (75 ft) vs. 14 m (45 ft) | 1.08 | 0.0001 | 0.98 | 0.19 | 1.07 | 0.003 | 1.07 | 0.06 |
| 35 m (15 ft) vs. 22 m (75 ft) | 0.88 | 0.0001 | 0.79 | 0.0001 | 0.95 | 0.0001 | 0.98 | 0.61 |
| 35 m (15 ft) vs. 5 m (15 ft) | 0.91 | 0.0001 | 0.76 | 0.0001 | 0.98 | 0.09 | 1 | 0.89 |
| Defensive Action | ||||||||
| Both vs. others | 0.95 | 0.0001 | -- | -- | 0.68 | 0.004 | 0.69 | 0.04 |
| Civilian vs. others | 1.08 | 0.0001 | -- | -- | 0.81 | 0.0001 | 0.68 | 0.04 |
| Fire Department vs. others | 0.88 | 0.0001 | -- | -- | 0.44 | 0.0001 | 0.81 | 0.03 |
| Unknown vs. defensive action | 0.91 | 0.0001 | -- | -- | 1.02 | 0.0001 | 1.01 | 0.39 |
| Deck, Porch Material | ||||||||
| Composite vs. others | 0.85 | 0.0001 | 0.93 | 0.007 | 0.92 | 0.03 | 0.78 | 0.04 |
| Masonry vs. others | 1.002 | 0.48 | 1.17 | 0.0001 | 0.99 | 0.03 | 1 | 0.78 |
| Wood vs. others | 0.98 | 0.01 | 1 | 0.6 | 1.01 | 0.002 | 0.97 | 0.27 |
| None | 1.01 | 0.10 | 0.35 | 0.0001 | 1 | 0.24 | 1.02 | 0.25 |
| Roof Type | ||||||||
| Asphalt vs. others | 1.05 | 0.0001 | -- | -- | 1.03 | 0.0001 | 1.02 | 0.4 |
| Concrete vs. others | 0.89 | 0.0007 | -- | -- | 0.94 | 0.05 | 0.82 | 0.04 |
| Metal vs. others | 0.97 | 0.0001 | -- | -- | 0.98 | 0.001 | 1.04 | 0.14 |
| Tile vs. others | 0.88 | 0.0001 | -- | -- | 0.89 | 0.0001 | 0.97 | 0.25 |
| Wood vs. others | 1 | 0.84 | 0.99 | 0.96 | 1.06 | 0.38 | ||
| Combustible vs. resistant | -- | -- | 1 | 0.75 | -- | -- | -- | -- |
| Eaves | ||||||||
| Enclosed vs. others | 0.79 | 0.0001 | 0.88 | 0.0001 | 0.95 | 0.0001 | 0.83 | 0.0001 |
| None vs. others | 1.06 | 0.0001 | 0.49 | 0.0001 | 1.02 | 0.004 | 1.35 | 0.0001 |
| Unenclosed vs. others | 1.04 | 0.0001 | 1.15 | 0.0001 | 1.5 | 0.0001 | 0.99 | 0.86 |
| Vent Screen | ||||||||
| Screened vs. unscreened | 0.94 | 0.0001 | 0.76 | 0.0001 | 0.97 | 0.0001 | 0.95 | 0.23 |
| Exterior Siding | ||||||||
| Combustible vs. resistant | 1.05 | 0.0001 | 1.03 | 0.0002 | 1.04 | 0.0001 | 1.07 | 0.0001 |
| Window Panes | ||||||||
| Multi vs. others | 0.94 | 0.0001 | 0.94 | 0.0001 | 0.97 | 0.0001 | 0.74 | 0.0001 |
| None vs. others | 1.01 | 0.12 | 0.25 | 0.0001 | 0.98 | 0.04 | 1.14 | 0.01 |
| Unenclosed vs. others | 1.06 | 0.0001 | 1.05 | 0.0001 | 1.02 | 0.0001 | 1.12 | 0.0001 |
© 2019 by the authors. Licensee MDPI, Basel, Switzerland. This article is an open access article distributed under the terms and conditions of the Creative Commons Attribution (CC BY) license (http://creativecommons.org/licenses/by/4.0/).
Share and Cite
MDPI and ACS Style
Syphard, A.D.; Keeley, J.E. Factors Associated with Structure Loss in the 2013–2018 California Wildfires. Fire 2019, 2, 49. https://0-doi-org.brum.beds.ac.uk/10.3390/fire2030049
AMA Style
Syphard AD, Keeley JE. Factors Associated with Structure Loss in the 2013–2018 California Wildfires. Fire. 2019; 2(3):49. https://0-doi-org.brum.beds.ac.uk/10.3390/fire2030049
Chicago/Turabian StyleSyphard, Alexandra D., and Jon E. Keeley. 2019. "Factors Associated with Structure Loss in the 2013–2018 California Wildfires" Fire 2, no. 3: 49. https://0-doi-org.brum.beds.ac.uk/10.3390/fire2030049