Article

Fire Suppression Impacts on Fuels and Fire Intensity in the Western U.S.: Insights from Archaeological Luminescence Dating in Northern New Mexico

by
Christopher I. Roos
1,*,
Tammy M. Rittenour
2,
Thomas W. Swetnam
3,
Rachel A. Loehman
4,
Kacy L. Hollenback
1,
Matthew J. Liebmann
5 and
Dana Drake Rosenstein
6
1
Department of Anthropology, Southern Methodist University, Dallas, TX 75275, USA
2
Department of Geosciences, Utah State University, Logan, UT 84322, USA
3
Laboratory of Tree-Ring Research, University of Arizona, Tucson, AZ 85721, USA
4
U.S. Geological Survey, Alaska Science Center, Anchorage, AK 99508, USA
5
Department of Anthropology, Harvard University, Cambridge, MA 02138, USA
6
School of Anthropology, University of Arizona, Tucson, AZ 85721, USA
*
Author to whom correspondence should be addressed.
Submission received: 8 June 2020 / Revised: 19 July 2020 / Accepted: 19 July 2020 / Published: 20 July 2020

Abstract

:
Here, we show that the last century of fire suppression in the western U.S. has resulted in fire intensities that are unique over more than 900 years of record in ponderosa pine forests (Pinus ponderosa). Specifically, we use the heat-sensitive luminescence signal of archaeological ceramics and tree-ring fire histories to show that a recent fire during mild weather conditions was more intense than anything experienced in centuries of frequent wildfires. We support this with a particularly robust set of optically stimulated luminescence measurements on pottery from an archaeological site in northern New Mexico. The heating effects of an October 2012 CE prescribed fire reset the luminescence signal in all 12 surface samples of archaeological ceramics, whereas none of the 10 samples exposed to at least 14 previous fires (1696–1893 CE) revealed any evidence of past thermal impact. This was true regardless of the fire behavior contexts of the 2012 CE samples (crown, surface, and smoldering fires). It suggests that the fuel characteristics from fire suppression at this site have no analog during the 550 years since the depopulation of this site or the 350 years of preceding occupation of the forested landscape of this region.

1. Introduction

Since at least 1910 CE, fire suppression has been an official policy in the U.S. [1] and in similar industrialized contexts globally [2], leading to historical nadirs of fire activity evident in both charcoal [3] and fire scar records [4]. The era of fire suppression is now accompanied by global climate changes that make many environments more flammable [5]. The associated continental scale “fire deficits” have led to accumulations of fuels in some ecosystems and contributed to ongoing wildfire crises. Increased fuel loads over the past century have fed the emergence of “megafires,” extreme fire behavior, and maladaptive policy syndromes of spiraling socioecological hazard accompanied by even more suppression [6], especially in forests that were formerly characterized by moderate to high frequency surface fire regimes (i.e., 2 to 20 year intervals between fires).
Here, we use a novel application of archaeological luminescence dating to demonstrate that the fuel loads and resultant fire intensities (defined as energy released per unit area [7]) generated by fire suppression are unprecedented in at least the past 900 years. We measured the optically stimulated luminescence (OSL) [8,9] of ceramic sherds from the surface of the archaeological site of Wabakwa (LA 478) as a proxy for the age of last exposure to fire. Wabakwa is one of more than two dozen Ancestral Jemez (Pueblo) villages with apartment-style contiguous masonry dwellings located in the ponderosa pine (Pinus ponderosa) forests that blanket the Jemez Mountains in northern New Mexico (Figure 1). Located within the Jemez Ranger District of the Santa Fe National Forest, parts of the site burned in October 2012 CE during the 2,877 ha San Juan prescribed fire under mild weather conditions (air temperatures between 12 and 22 °C, wind speeds between 2 and 8 kmph). Archaeologists first recorded the site of Wabakwa in the 1930s CE. Ceramic cross-dating suggests that the village was inhabited approximately from 1325 to1450 CE [10]. Five radiocarbon ages on four maize (Zea mays) cob fragments that were exhumed by animal burrowing indicate that at least part of the village core was no longer occupied after 1430 CE (Table A1). The surrounding area continued to be used for agriculture by Jemez people into the 17th century CE [11].
During village occupation and agricultural use, there were likely frequent, relatively small, patchy surface fires in the area, as we documented previously for Native American land use on the Jemez landscape (at least from 1500 to 1650 CE) [4,12]. Fire-scarred trees around Wabakwa record widely spreading surface fires that followed the period of Native American fire management beginning by at least 1696 CE (recorded by ≥2 scarred trees). This pattern, referred to as the “free range” fire period because fires were able to spread widely across the landscape, is replicated across spatial scales in the Jemez Mountains after the mid-17th century [4]. These surface fires of both Native American (small, patchy) and “free-range” fire regimes would have regularly consumed surface fuels, thereby restarting the cycle of fuel accumulation. Throughout the American West, widespread surface fires ceased by the end of the 19th century due to intensive livestock grazing followed by logging and active fire suppression [13], leading to increased surface fuel loads, increased densities of trees, and reduced structural and spatial heterogeneity of vegetation. Thus, recent fires in these forests have been more intense with larger areas of high-severity fire—high rates of aboveground biomass loss and canopy mortality [7]—than occurred historically [4,14,15]. The last replicated wildfire (≥2 trees scarred) recorded in the Wabakwa area was in 1893 CE, meaning that there was a 119-year fire-free period at the site before the 2012 CE San Juan prescribed fire, during which time fuels accumulated and forest stand structure was altered (Figure 2). Charcoal records from bogs in the Jemez Mountains suggest that this recent fire-free period had the lowest fire activity in the entire Holocene (the past 12 kyr) [16].
OSL dating provides an age estimate of the time since quartz and feldspar grains were last exposed to light or heat, which resets the luminescence signal [9]. Luminescence in pottery regenerates as electrons accumulate in traps within their crystal lattice upon exposure to ionizing radiation from radioisotopes of U, Th, and K within the ceramic sherd, from the surrounding sediments and from incoming cosmic radiation. Exposure to light or heat frees these electrons, emitting photons of energy that are measurable as light—luminescence. In the lab, grains are re-exposed to heat (thermoluminescence or TL) or light (OSL) under controlled conditions (Table A2). The luminescence signal measured in the lab (the equivalent dose or DE) is directly proportional to the time since removal from the stimulating energy source (heat or light) and the radioactive environment of the sample (dose rate or DR) [8]. Measurements of cosmic and geogenic sources of radiation are used to calculate DR (Table A3 and Table A4). OSL ages are calculated by dividing the equivalent dose (DE) of radiation by the radioactive dose rate from the environment (DR).
In the case of archaeological pottery, the OSL age typically represents thermal resetting at the moment the vessel was manufactured (fired). This resetting occurs within seconds once the temperatures of the grains within the clay body reaches 300–500 °C. For ceramic sherds on the ground surface at an archaeological site, the luminescence signal was potentially reset again if grains in a sherd were sufficiently heated during a wildfire. Thus, our two critical concerns are the temperatures achieved in the fire (fire intensity) and the duration of heating. The character and abundance of the fuels was important for determining whether a sherd is heated sufficiently to reset the luminescence signal. Fine, herbaceous fuels that promote fast-moving fires may not generate enough heat for a long enough period to significantly impact the luminescence signal in pottery; by contrast, smoldering combustion in heavy duff or coarser fuels may provide sufficient heat for sufficient duration to fully reset it. Here we are able to show that the resetting of OSL in quartz sand temper from archaeological ceramics is a sensitive indicator for fire intensity exposures after deposition at that site.

2. Results

We collected pottery from the ground surface of Wabakwa in June 2014 CE. These sherds were either (1) burned in the 2012 CE San Juan prescribed fire (Figure 1d; Figure A1); (2) unburned in 2012 CE but possibly exposed to fires in a midden (trash) area that burned historically as documented in nearby tree-ring fire scar records (Figure 1d; Figure A2); or (3) never exposed to wildfire because they were outside the limits of burning in 2012 CE and they had been deeply buried in pueblo room blocks until brought to the surface by animals or vandals (Figure 1d; Figure A3). In total, we dated 32 surface-collected ceramics with single-grain OSL of quartz sand temper, an unusually large number of samples for OSL dating studies. The key contexts for comparison are (1) sherds on the surface of an area exposed to the 2012 San Juan prescribed fire after 100+ years of fire suppression (N = 11), and (2) sherds on the surface of an area exposed to documented historical wildfires (N = 11). If fire suppression had no impact on fire intensities, then we would expect to see the same luminescence patterns in (1) and (2), whereby the sherds were reset at the moment of last fire exposure or not reset since the vessel was made if wildfire intensities and duration were insufficient. In contrast, if fire suppression has led to unprecedented fire intensities and durations, then samples from context (1) would be reset but those from (2) would retain their original archaeological signal. Samples from context (3), which without a doubt, date to the time when Wabakwa was occupied, are to ensure that samples from context (2) are comparable to their original archaeological ages.
The sherds from the 2012 CE San Juan fire (setting 1) were from three fire behavior and fuel contexts: (1) areas that burned as a surface fire in heavy duff and needle litter; (2) under the canopy of pinyon pine (Pinus edulis) that burned as a crown and surface fire; or (3) areas where surface fuels were completely consumed, with evidence of smoldering combustion of downed logs (Figure A1). Despite the mild fire weather, the 2012 CE fire reset the luminescence signal of grains in all 11 of these samples from all fuel and fire behavior contexts (Figure 3; Table A2). All samples yielded dates that are anomalously young, although since these are ages calculated from partial resetting of measured grains, the “apparent ages” do not reflect dates of real events (Figure 3). Five of the 11 had 50% or more of measurable grains reset by the 2012 CE fire and ten samples produced apparent ages within error of the last 50 years (Table A2).
By contrast, OSL measurements of 20 of 21 ceramics we collected from areas that did not burn in 2012 CE (10 from a midden (trash) area that burned historically and 10 from ceramics that have never been exposed to wildfire) produced ages consistent with ceramic cross-dating and radiocarbon age estimates and agree with each other (range of 1140–1460 CE for unburned samples and 1220–1470 CE for midden samples). Although the midden area was exposed to at least 8 widespread fires between 1724 and 1893 CE (≥2 trees scarred within 100 m of the midden, 14 widespread fires across the entire site between 1696 and 1893 CE; Figure 3), there is no evidence of historical resetting of the luminescence signal of quartz grains from the sherds collected from the surface of this area. One sherd collected in the midden area was reset in the 2012 CE fire but could not have been burned in its collection location (see the unburned fuels in Figure A2b), suggesting that it was moved and redeposited by a human visitor (artifacts at the site were surface collected by archaeologists in 2013 CE, and it was likely moved then). If any of the historical fires had reached intensities and durations comparable to the 2012 fire, then at least some of the sherds from the midden area would be at least partially reset but not a single sherd shows any evidence of this. Archaeologically, it is notable that four sherds (NM-45, UB-25, UB-52, and UB-53) from three different collection locations (two different burrows and the archaeological midden) provide the first evidence of village establishment between 1140 and1220 CE (Figure 2B; Table A2). Radio-elemental (Table A3), dose rate (Table A4), and radial plots of single-grain data (Figure A4, Figure A5 and Figure A6) are available in Appendix A.

3. Discussion

The ubiquitous OSL resetting by heat of ceramics in 2012 CE with no evidence of historical resetting in the area exposed to numerous past fires indicates that at no time over the multiple centuries since these sherds were deposited has any fire burned as intensely as the 2012 CE prescribed fire; likely due to elevated fuels generated by 100+ years of fire suppression. Tree-ring evidence of the continuity of frequent, low-intensity surface fires during Native American occupation (1100–1650 CE) and “free-range” fire periods (1650–1880 CE) [4] suggests that the fire intensities in suppression-generated fuel loads is unprecedented in at least the 880 years since Wabakwa was established in 1140 CE. While this is just one site, studies of fire and forest regeneration from archaeological sites across the southern Jemez Mountains indicate that forests began regenerating within decades of village depopulation and that fuels accumulated sufficiently to support spreading surface fires shortly thereafter [12,17]. Therefore, the record from Wabakwa is representative of the forested landscape of the southern Jemez Mountains over at least the last 500 years after the depopulation of the site. Tree-ring evidence for Ancestral Jemez fire management with small but frequent surface fires during human occupation [4,12] indicates that low-severity surface fire regimes likely extended to at least as early as 1140 CE. Given the tree-ring [4,12] and OSL data, modern fuel loads appear to be unprecedented in at least 880 years on the southern Jemez Mountains landscape.
We cannot directly measure fuels with a luminescence study, but here we argue that by using a modern fire with mild weather conditions as a proxy (thereby removing fire weather as a driver of higher fire intensity), we can isolate the impacts of fuels on fire intensity and duration. Archaeological sites are particularly fidelitous recorders of fuel accumulation from the fire deficit because they have historically been protected from fire spread during managed burns via Section 106 of the National Historic Preservation Act. While unquestionably fuels and tree abundance would have been low during occupation of a village, recovery clearly happens within decades of village depopulation. Fire scar records of spreading surface fires after 1680 are direct evidence of the sufficient accumulation of surface fuels after depopulation.
Fuels from forest litter and duff on other archaeological sites within the 2012 CE San Juan prescribed fire and on adjacent mesas averaged 5.2 kg m−2. By contrast, in the 1970s CE, litter and duff fuel loads in southwestern ponderosa pine forests only averaged about half of this level (2.4 kg m−2) [18]. Historical (pre-suppression) fuel loads when surface fires were frequent were probably on the order of 0.1–0.75 kg m−2 of litter and duff, as they have been for repeated prescribed burning experiments [19]. This suggests at least a threefold increase in surface fuel loads by the 1970s CE and more than a fivefold increase by 2012 CE. This is consistent with modeled estimates of the impact of fire suppression, which also predicted at least a fivefold increase in fuel accumulation over the past century [20].
Previous archaeological luminescence studies support these observations of accumulating fuels and escalating fire intensities with fire suppression. For example, in the Northern Rockies, the OSL signal in ceramics that were burned in a 2003 CE “high-intensity fire” was significantly reset (52–58% of measured grains) [21]. Furthermore, TL of surface ceramics collected from the 1977 CE “high-severity” La Mesa fire to the east of our study site in Bandelier National Monument produced ages that were 10–24% younger than age estimates from tree-ring cross-dating [22]. These age underestimates suggest partial resetting of the luminescence signal under 1970s-level fuels, unlike the high percentage of reset grains at Wabakwa in modern fuels (ages were 92–99.5% younger for 10 of 12 reset sherds). Furthermore, experimental assessment of the effects of fast-moving wildfires in light fuels—analogous to historical fuel loads—had no measurable impact on luminescence properties of ceramics [23].
The fire deficit in western North America has been recognized at multiple spatial and temporal scales. At the continental scale over the last 2000 years, charcoal deposition in lakes has been closely correlated with climate variation until the 20th century, at which point fire activity declined even as warmer temperatures and drier conditions should have produced more fire activity [3,24,25]. In fire scar records across the western U.S., the frequency of widespread fire prior to 1900 CE stands in sharp contrast to the dearth of fire since [4]. In the Jemez Mountains, the 20th century fire deficit is represented by a period of uniquely low charcoal deposition over the entire Holocene [16]. Nevertheless, some doubts are expressed in the literature about the impact of fire suppression on modern fire intensities and extreme fire behavior. Some have suggested that modern, high-severity crown fires are within the historical range of variability for fire regimes in western North America [26]. Fire ecologists typically distinguish between “fire severity” and “fire intensity” because the former generally refers to ecological and soil impacts whereas the latter refers to energy released per unit of time and/or area [7]. Although these terms are distinct, they are commonly related, in that high-severity fires generally involve more area affected by high fire intensities than low-severity fires. Our work corroborates prior research on the uniqueness of the fire deficit on multi-century timescales and provides novel evidence of the magnitude of change in fuels on fire intensity created by more than a century of fire suppression.
The fire deficit is entirely human caused. In the absence of fire suppression, frequent fires that consumed fuels and thinned tree stands would have continued to be common in the dry, pine-dominated forests of western North America [3,25] and would likely have continued in other regions where fire suppression became the dominant management paradigm. The magnitude of the fire deficit continues to grow because fuel treatment and prescribed burning programs are sacrificed to support ballooning firefighting costs [27,28]. Our results indicate that we are already in a situation of elevated fuels that is without analog in the past millennium and perhaps longer. Although the changes in fire intensity that we document here are not driven by anthropogenic climate change, we recognize that global warming is a causal factor for increasing area burned, fire severity, and human health risks in multiple regions of the globe [5,27,29,30,31,32,33,34,35,36]. In regions where both fuel changes and warming/drying trends are leading to a combination of fuel and climate effects on wildfire intensity, fuel reduction [37], prescribed burning [28], and other creative solutions to coexist with evolving fire regimes take on special urgency [38,39].

4. Methods

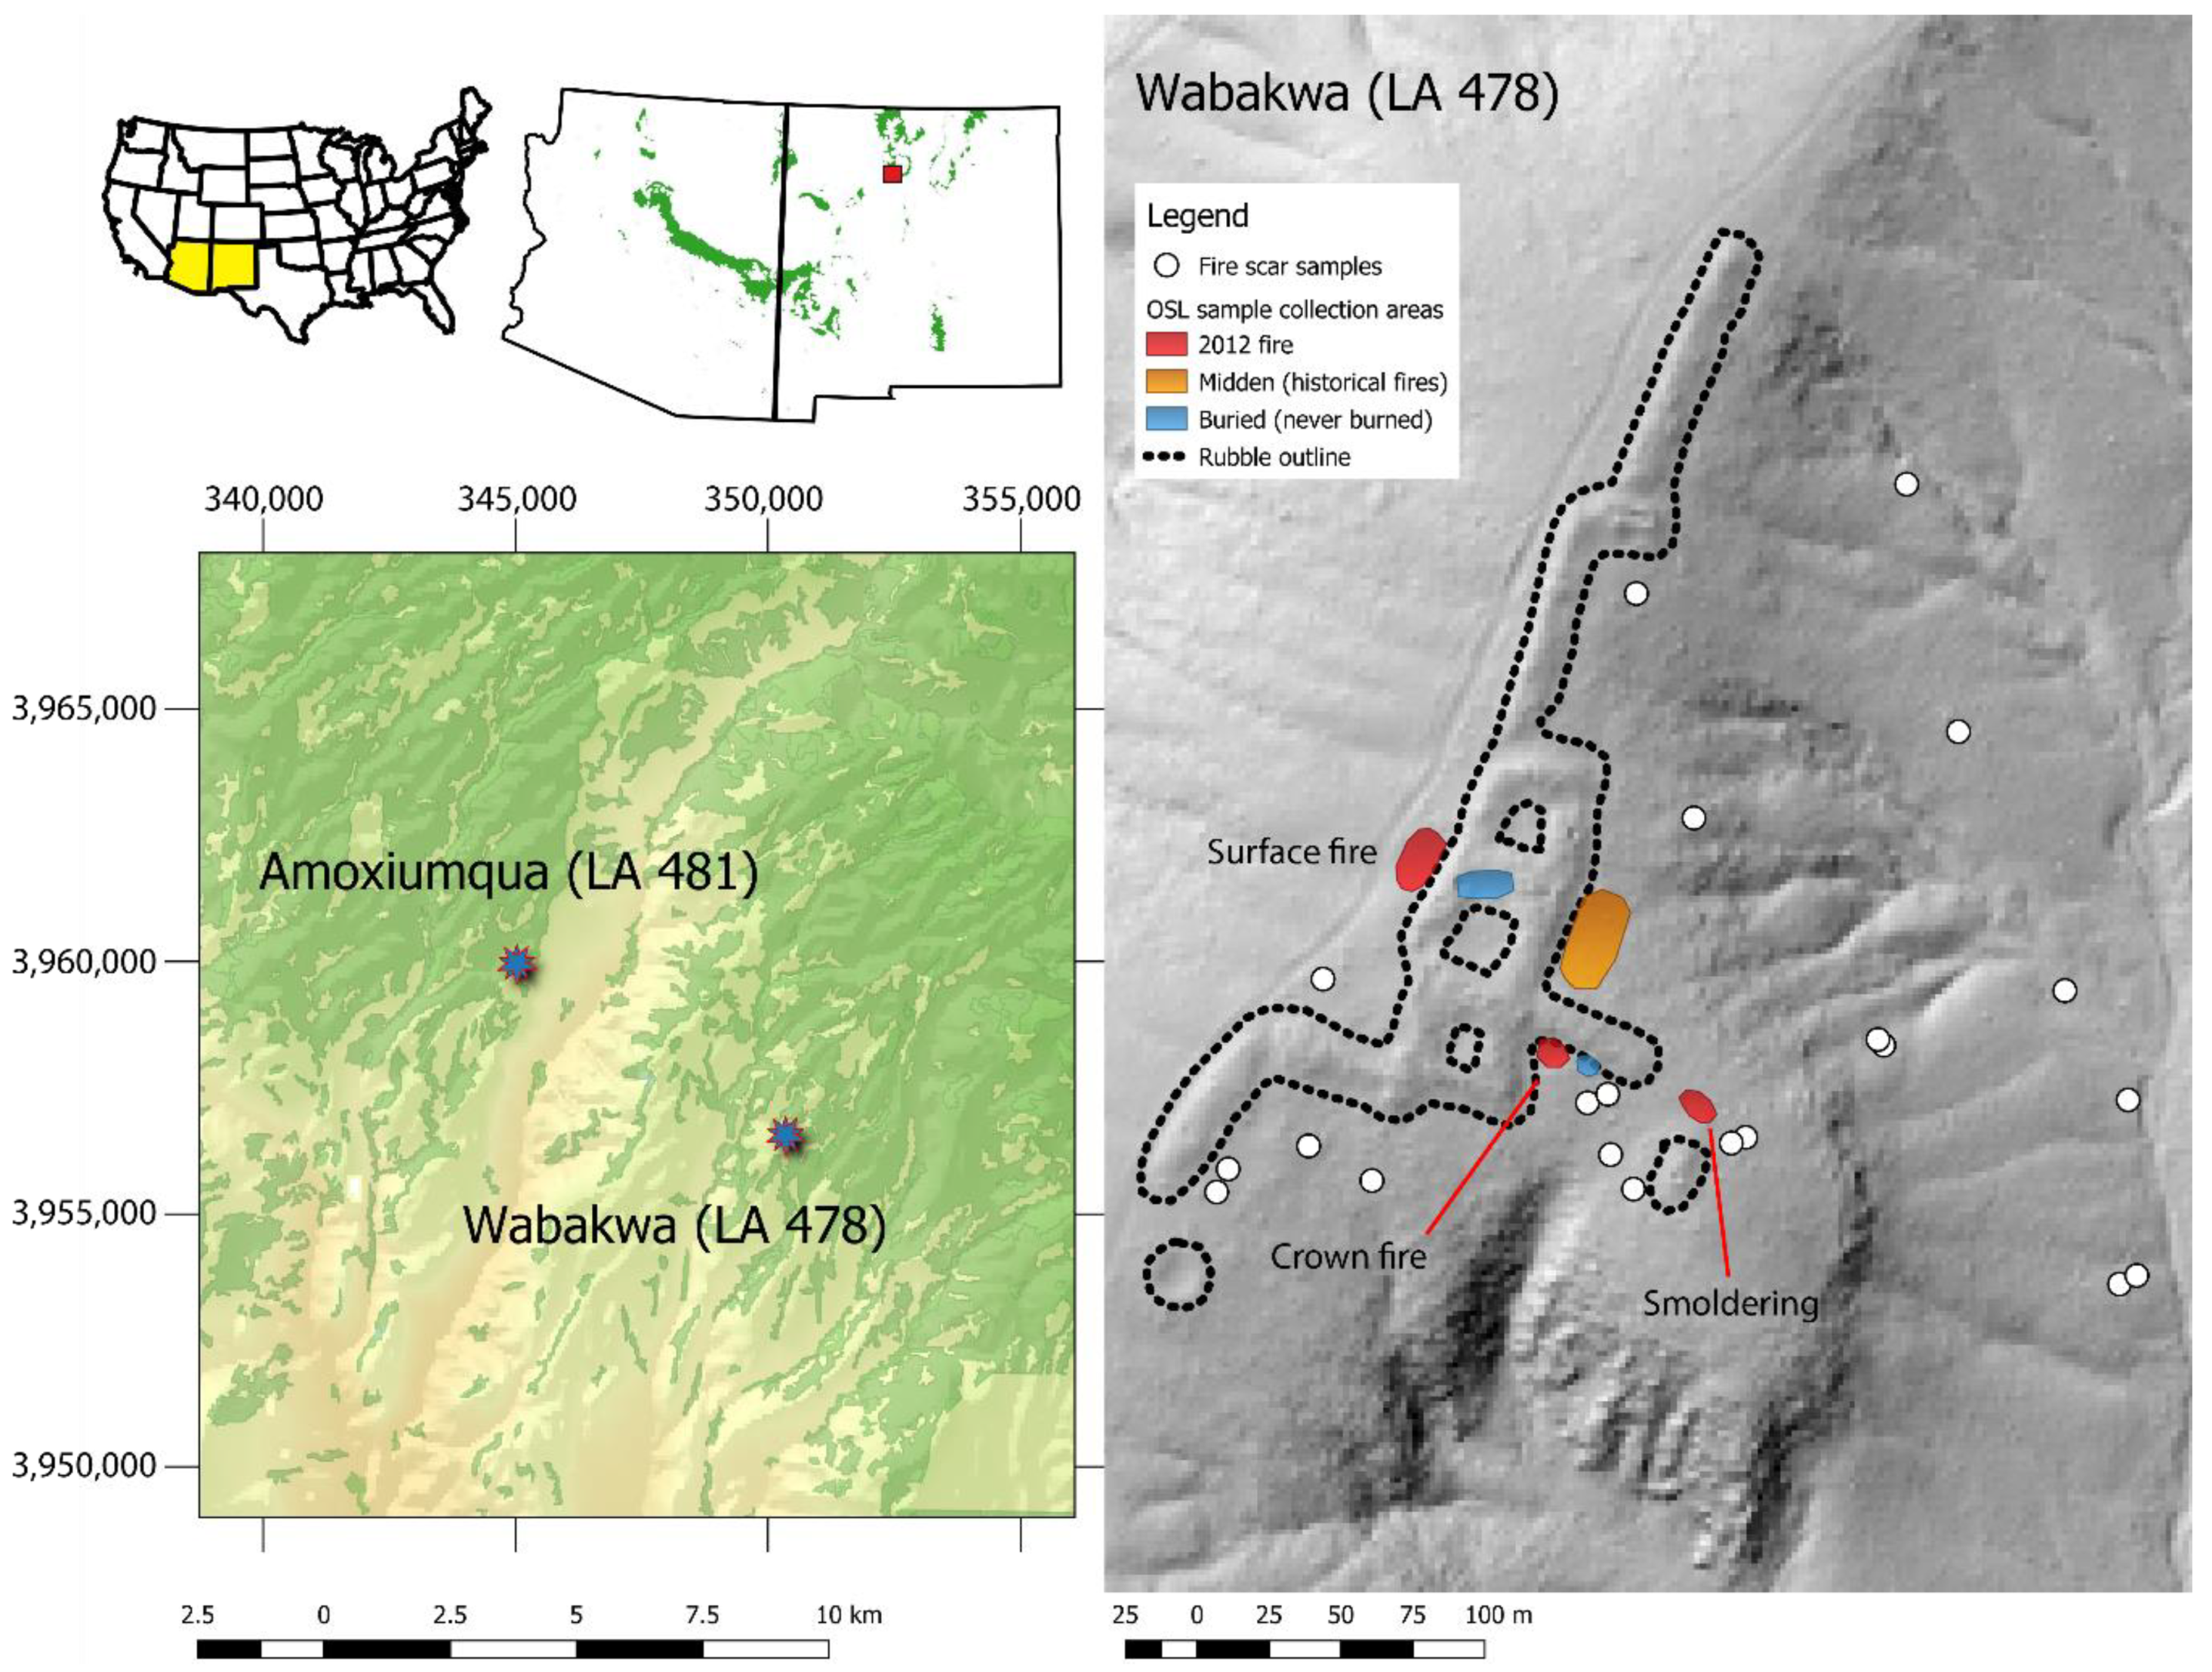
4.1. Archaeological Field Collections

On June 10 and 11, 2014, C.I.R., K.L.H., M.J.L., and D.D.R. collected archaeological ceramics exposed on the surface of Wabakwa. Surface sherds were collected in labeled polyethylene bags, and soil underneath the sherd (up to 5 cm deep and 15–20 cm in horizontal radius around the sherd) was collected in a larger bag, within which the sherd was stored during transport. The soil sample was used to calculate the environmental dose rate for each individual sherd. Charred maize cob fragments were also collected from the spoil of animal burrowing that produced ceramic samples UB-50–UB-54. These were stored in aluminum foil within a labeled polyethylene bag.

4.2. OSL Methods

All ceramic samples were processed and analyzed at Utah State University (USU) Luminescence Laboratory under dim amber safelight conditions (~590 nm). The outer ~2 mm of each sherd was removed with a small handheld drill at the lowest setting to eliminate the outer material that was exposed to light during collection. This light-exposed material was submitted for chemical analysis to calculate the dose rate contribution from the sherd. The inner ceramic material was lightly disaggregated and processed to isolate the 63–250 μm quartz sand temper for optically stimulated luminescence (OSL) dating following standard procedures: sieving, gravity separation, and acid treatments with HCl and HF (see Ideker et al. [21] for details on similar sample preparation). The purity of the quartz samples was monitored using IR depletion ratios [40].
Quartz sand temper was analyzed following the single-aliquot regenerative-dose procedures [41] on a Risø TL/OSL Model DA-20 reader with single-grain attachment and Risø single-grain disks [42]. Equivalent dose (DE) values for each grain were calculated based on a linear fit between the zero-dose and repeated first-regenerated dose step on the dose–response curve. The DE used for age determination was calculated using the central age model (CAM) [43] of the accepted aliquots; an unlogged central age model (CAMUL) [44] was used for near-modern samples (DE values <1 Gy). Grains were excluded from age calculation if they did not pass data-quality criteria: IR depletion ratio >2, recycling ratio >30%, recuperation >5% of test dose (0.5 Gy), DE> highest regenerative dose, and/or poor luminescence properties during single aliquot regenerative dose (SAR) analysis. The single-grain (SG)-OSL ages are reported at 2σ standard error and calculated by dividing the DE (in grays, Gy) by the environmental dose rate (Gy/ka) that the sample has been exposed to during burial.
Dose-rate calculations were determined by radio-elemental analysis of the U, Th, K, and Rb content using inductively coupled plasma mass spectrometer or atomic emission spectrometry (ICP-MS and ICP-AES) techniques and conversion factors from Guerin [45]. Total quartz OSL dose rates were calculated using beta and gamma dose contribution from sherds and gamma from soil dose rate samples scaled to sherd thickness. The contribution of cosmic radiation to the dose rate was calculated using sample depth, elevation, and latitude/longitude following Prescott and Hutton [46]. Dose rates were calculated based on water content, sherd and soil chemistry, and cosmic contribution [47].

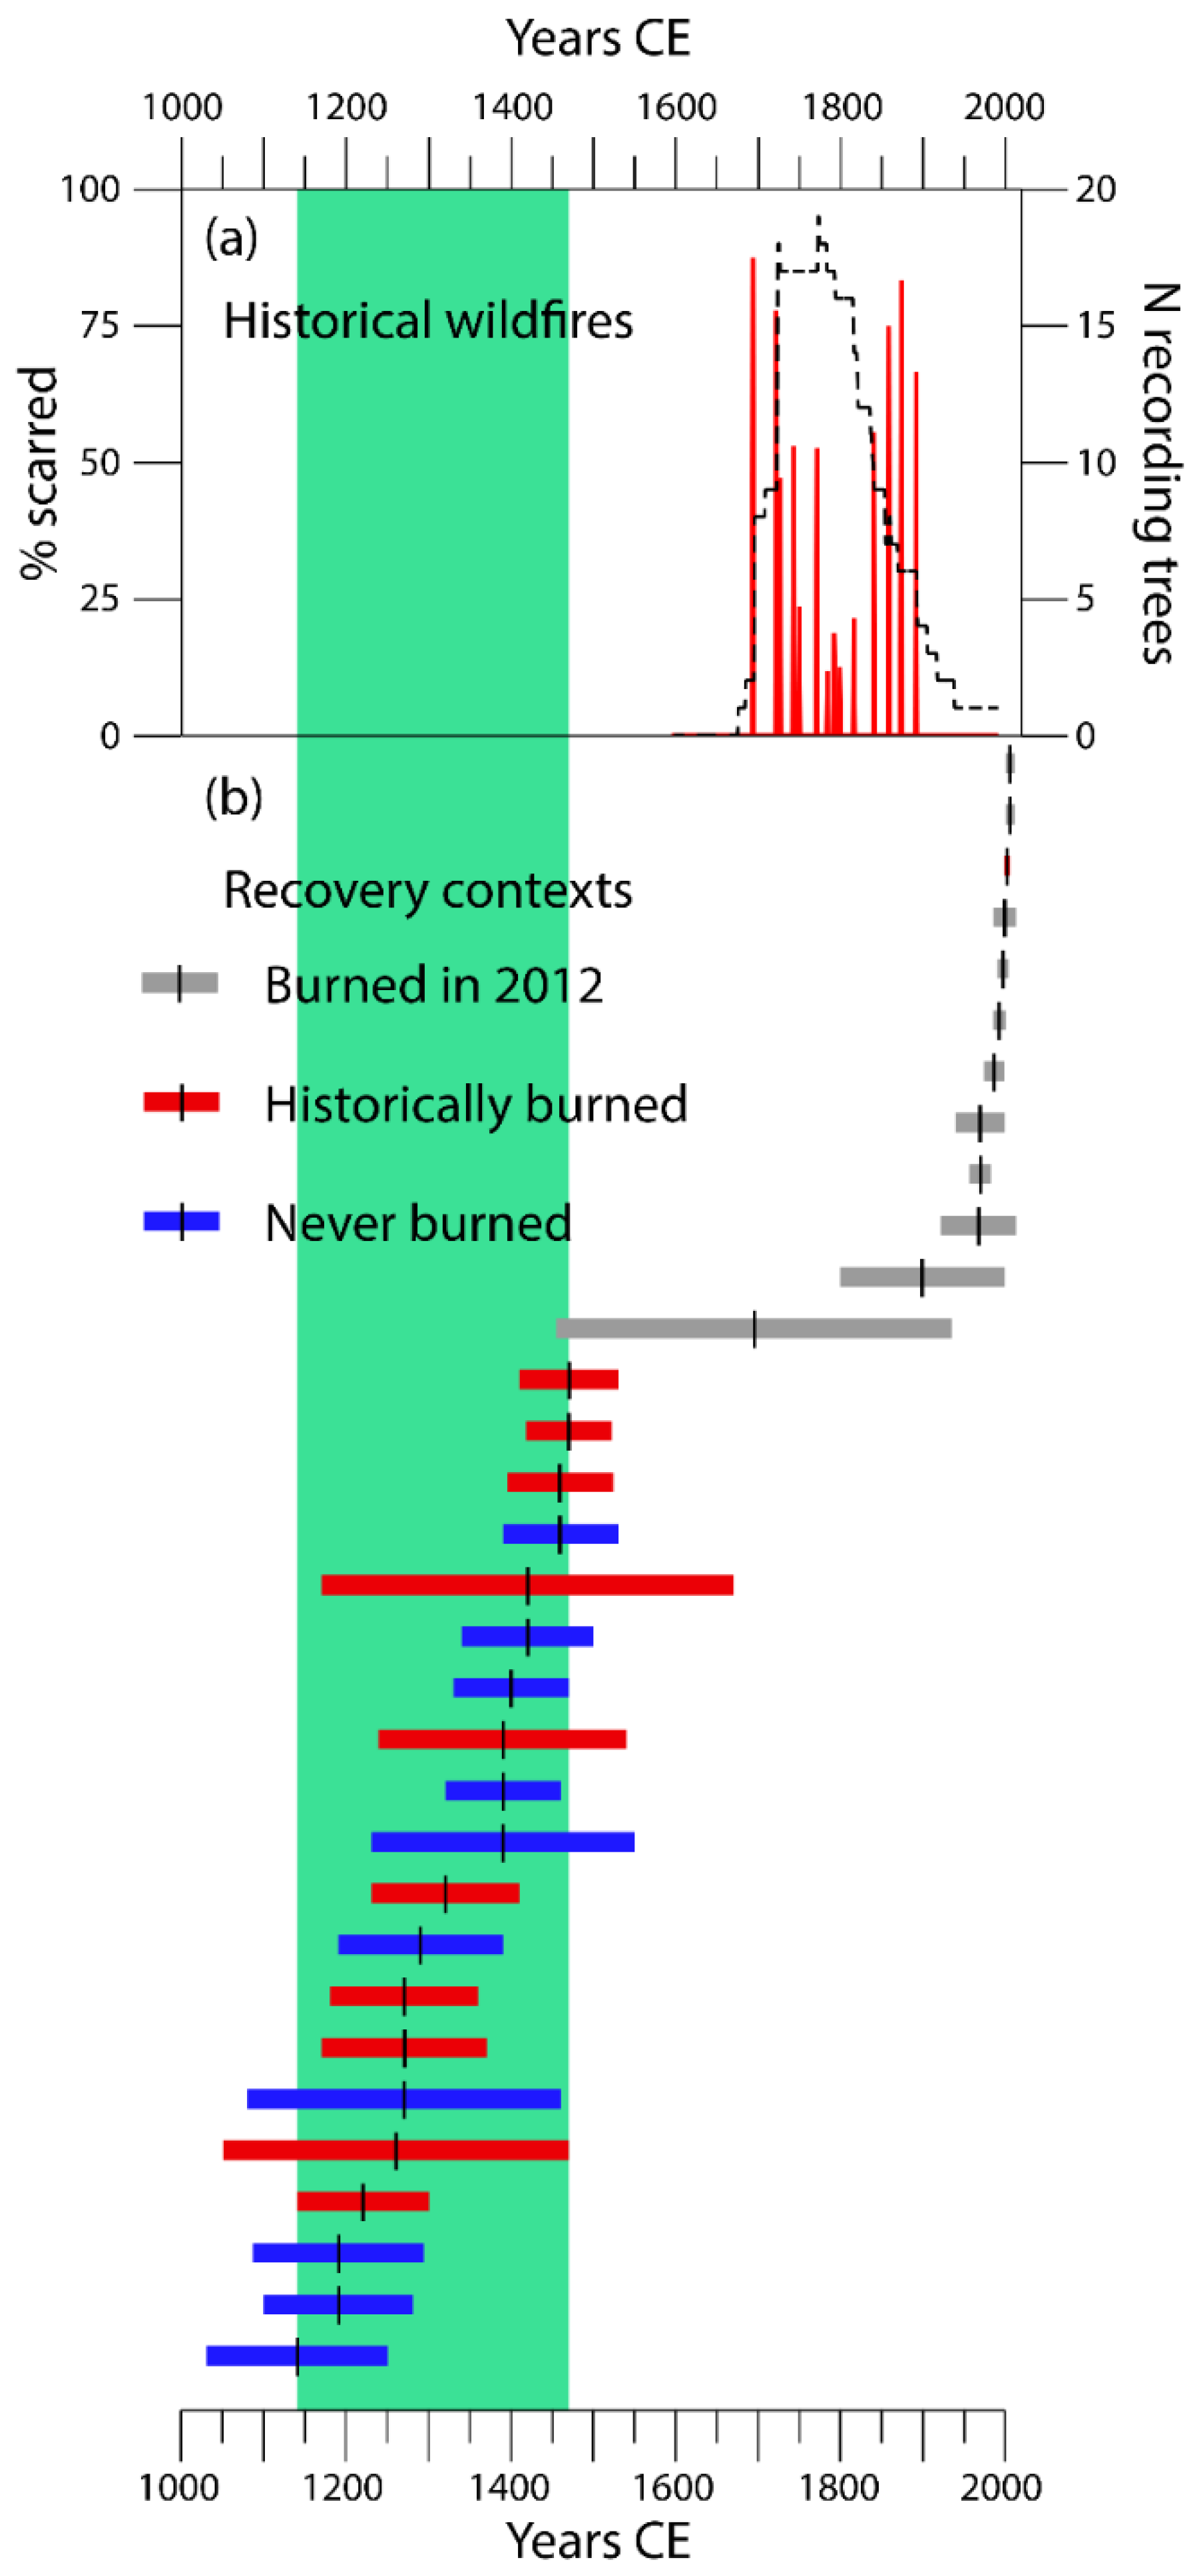
4.3. Tree-Ring Methods

We sampled 21 fire scarred trees within the nearby vicinity of the Wabakwa ruins [17]. Living and dead (stumps, logs, and snags) with the maximum number of well-preserved, visible fire scars were selected in multiple locations as near as possible to the village site. Partial and full cross sections were taken to the laboratory where they were stabilized and surfaced with belt sanders up to 400 grit. All annual rings were cross-dated using standard dendrochronology methods, and all fire scars were identified and dated to approximate season (i.e., relative position within annual rings) and year of occurrence [48].

4.4. Duff and Litter Fuel Measurement Methods

Duff and litter depths were collected from two locations each in 1 m2 plots within archaeological field house (5 plots) or pueblo (3 plots) sites on San Juan Mesa (5 plots) or the adjacent Paliza Canyon (6 plots). Archaeological sites were located within stands dominated by ponderosa pine, and site fuels were representative of 20th century management fire suppression practices but did not include activity such as fuels mastication. Duff and litter loadings were calculated by multiplying mean depths per plot (in centimeters) by bulk density factors of 1.150 or 0.3601 kg/m2, respectively [49,50].

Author Contributions

C.I.R., T.W.S., R.A.L., K.L.H., M.J.L., and D.D.R. designed the research. C.I.R., T.M.R., T.W.S., R.A.L., and D.D.R. analyzed the data. C.I.R. drafted the initial manuscript and Figure 1 and Figure 3. All authors contributed to further refinement of the manuscript. All authors have read and agreed to the published version of the manuscript.

Funding

This research received financial support from the National Science Foundation via award GEO-1114898 and Joint Fire Science Program Project 12-1-04-5.

Acknowledgments

The authors thank the Pueblo of Jemez and the Santa Fe National Forest for institutional support of this research. Thanks to Rich Halsey for use of his 2016 photos of Amoxiumqua. Many thanks to Carlie Ideker and Michelle Nelson who helped to process and analyze the OSL samples at the USU Luminescence Lab. Any use of trade, firm, or product names is for descriptive purposes only and does not imply endorsement by the U.S. Government.

Conflicts of Interest

The authors declare no conflict of interest. The funders had no role in the design of the study; in the collection, analyses, or interpretation of data; in the writing of the manuscript; or in the decision to publish the results.

Appendix A

Figure A1. Context photos of ceramic collection locations in the 2012 burn area. Orange and pink flags indicate the location of ceramic samples. (a) Surface fire with crown scorch (HS samples); (b) surface fire with heavy fuels/logs (HL samples); (c) crown and surface fire under pinyon pines (HC samples). (Photos by C. Roos.)
Fire 03 00032 g0a1
Figure A2. Context photos of (a) one of the ceramic collection locations in the midden area that was unburned in 2012 CE but would have burned historically between 1696 and 1893 CE (NM samples) and (b) the unburned fuels around sample NM-35 that was reset in 2012 indicating that it could not have burned in 2012 in this context and thus has moved from its 2012 location. Orange and pink flags indicate the location of ceramic samples. (Photos by C. Roos.)
Fire 03 00032 g0a2
Figure A3. Context photo of one of the ceramic collection locations in the spoil from animal burrowing (UB and UP samples). Orange flags indicate the location of ceramic samples on burrowing spoil from the village room block on the right of the photo. (Photo by C. Roos.)
Fire 03 00032 g0a3
Figure A4. Radial plots of OSL measurements of ceramics from the 2012 burn area.
Fire 03 00032 g0a4
Figure A5. Radial plots of OSL measurements of ceramics that were unburned in 2012 but that could have burned between 1696 and 1893 CE.
Fire 03 00032 g0a5
Figure A6. Radial plots of OSL measurements of ceramics from animal burrows or looters pits that never burned in historical or modern wildfires.
Fire 03 00032 g0a6
Table A1. Accelerator mass spectrometry measurements of maize cob fragments from Wabakwa.
SampleLabLab #Radiocarbon Age (BP)Calibrated Age (95% CI)
UB51.14C.1AKeck151908520 ± 201399 to 1437 cal CE
UB51.14C.1BKeck151909540 ± 201324 to 1344 cal CE
1394 to 1430 cal CE
UB51.14C.2Keck151910535 ± 201326 to 1342 cal CE
1395 to 1432 cal CE
UB51.14C.3Keck151911565 ± 201315 to 1354 cal CE
1389 to 1417 cal CE
UB51.14C.4Keck151912495 ± 151414 to 1439 cal CE
Pooled mean 1407 to 1425 cal CE
Table A2. Age results from single-grain optically stimulated luminescence (SG-OSL) dating of quartz sand temper from the sherds.
Sample Num.USU Num.Sherd ThicknessNum. of Grains aDE b ± 2σ (Gy)Age ± 2σ (ka)Age in Years ±2σ% Grains Reset c
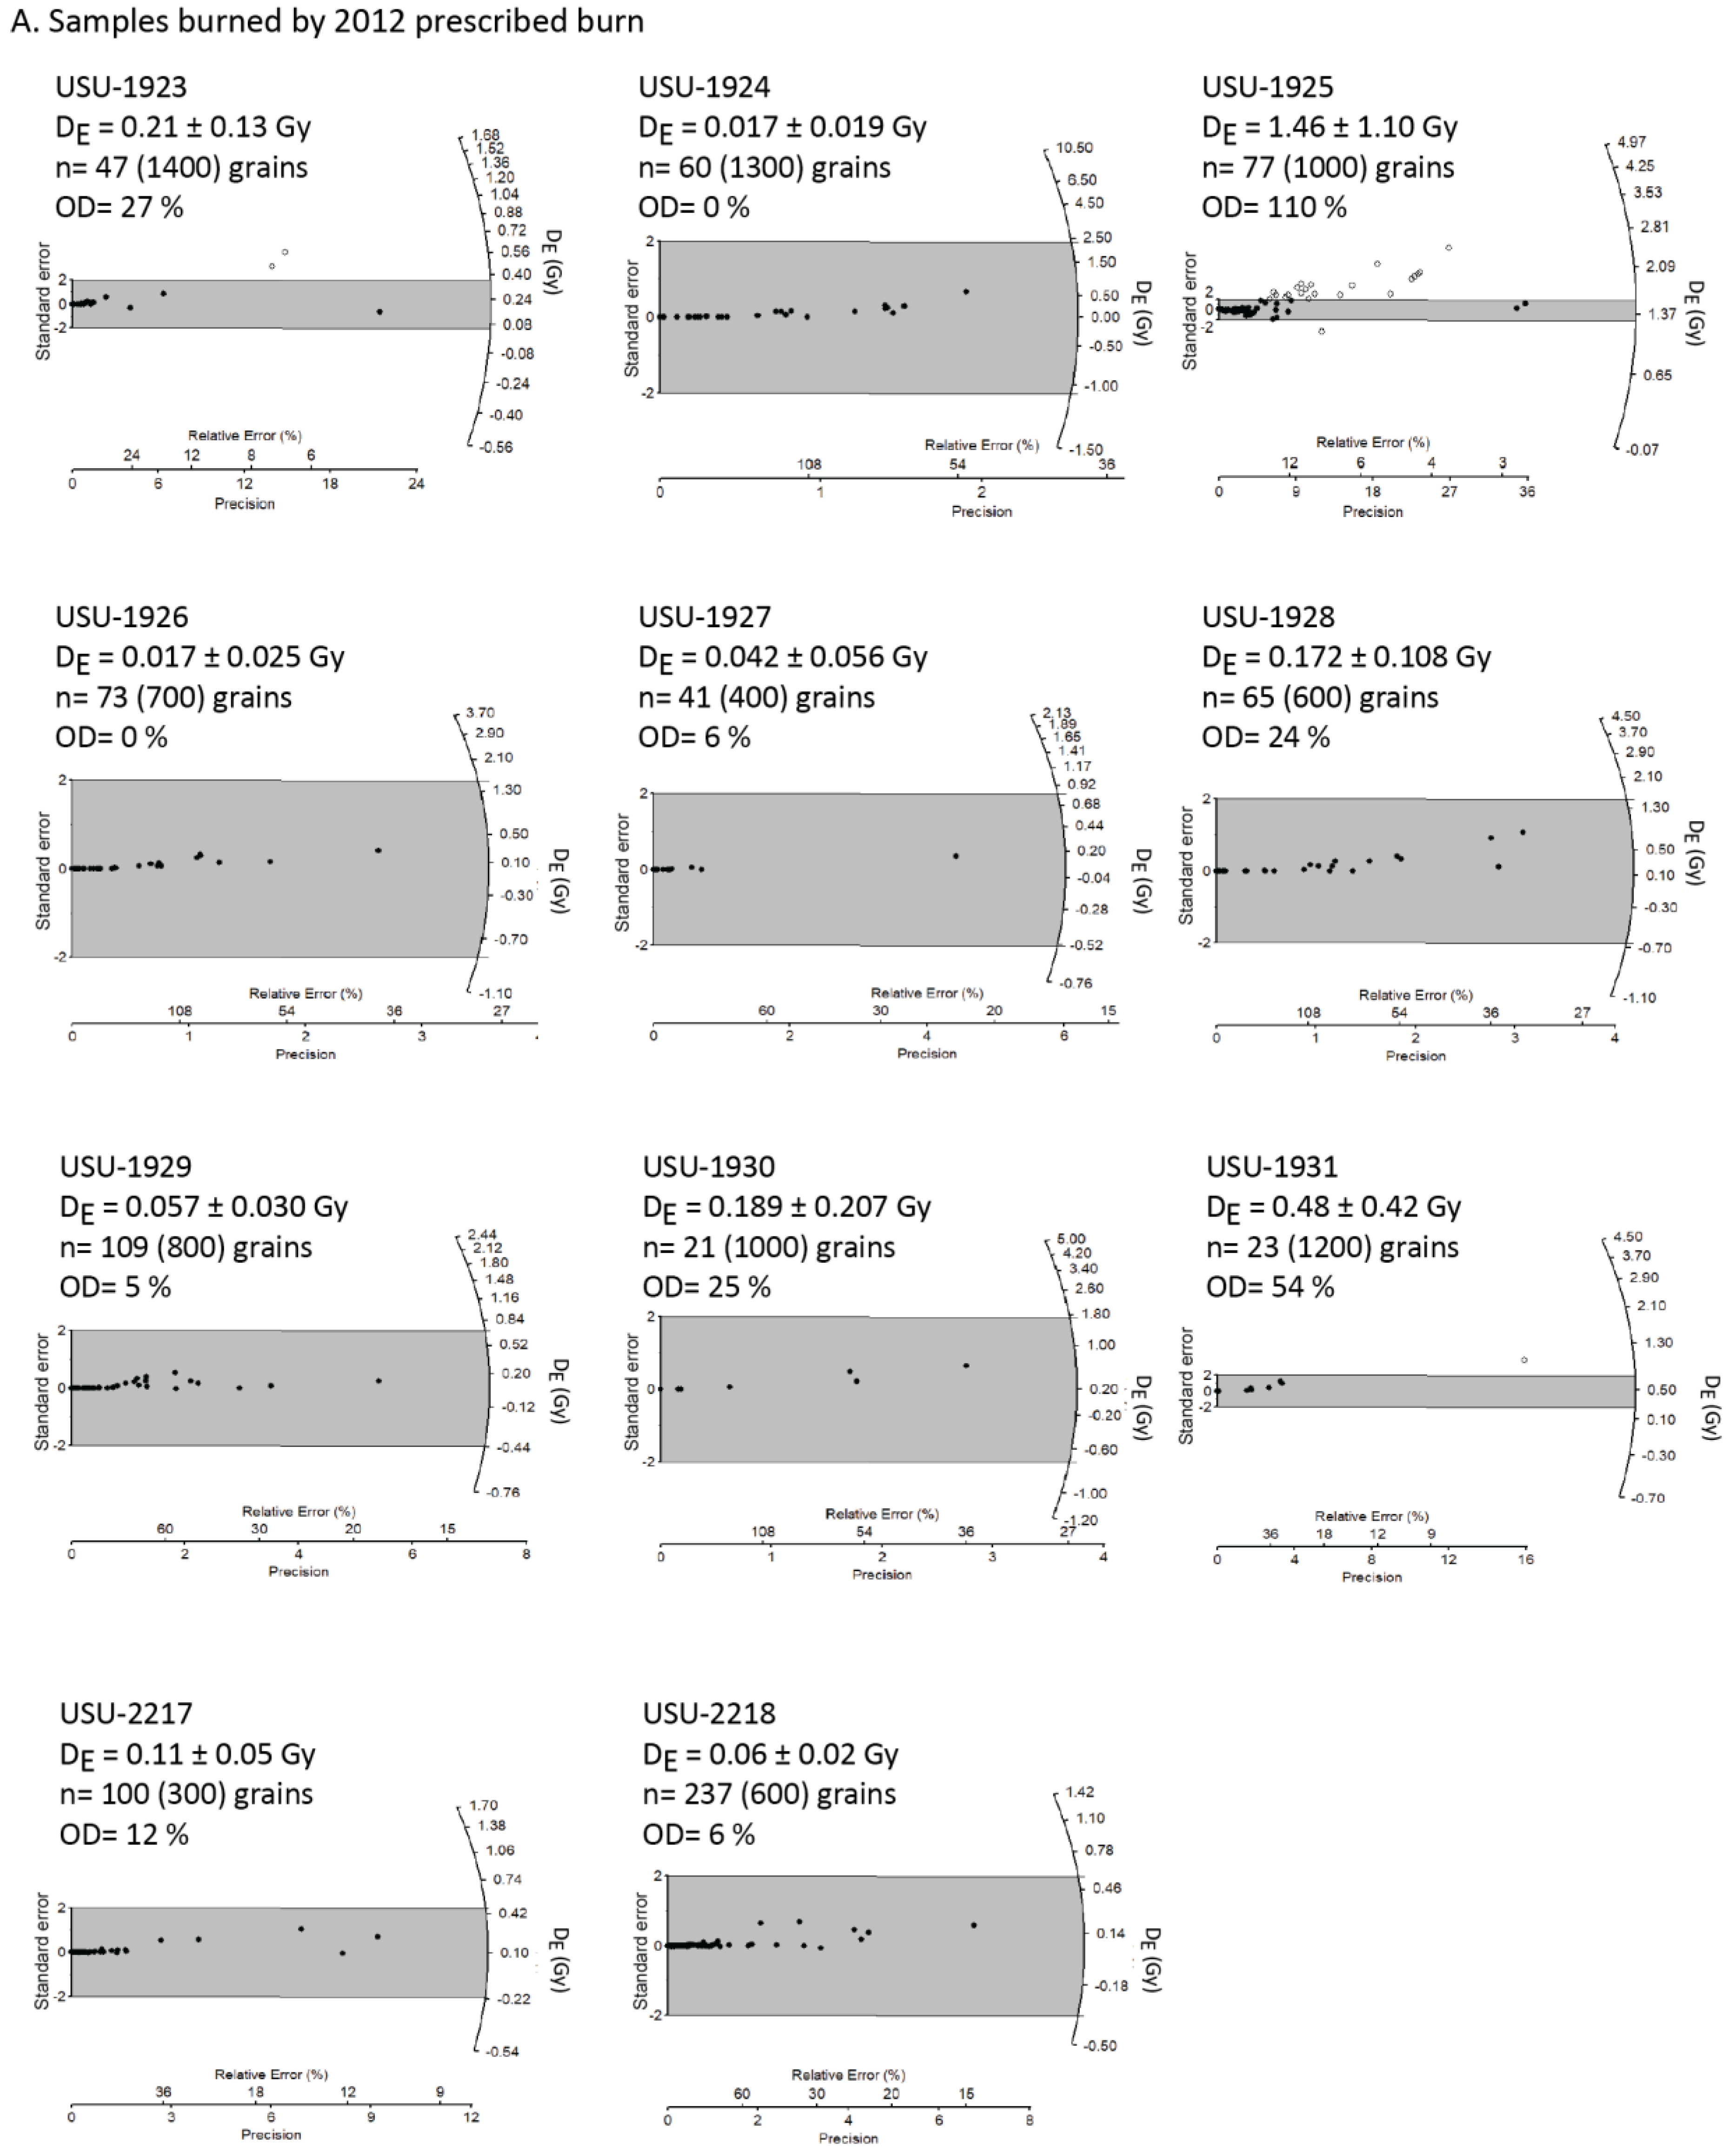
A. Samples burned by 2012 CE prescribed burn
LA 478-HC10USU-19235 mm47 (1400)0.21 ± 0.130.04 ± 0.0340 ± 30 55%
LA 478-HC13USU-19246.4 mm60 (1300)0.017 ± 0.0190.004 ± 0.0054 ± 5 60%
LA 478-HC14USU-19256.8 mm77 (1000)1.46 ± 1.100.32 ± 0.24320 ± 240 14%
LA 478-HL19USU-19265.4 mm73 (700)0.017 ± 0.0250.004 ± 0.0064 ± 6 59%
LA 478-HL20USU-19277.2 mm41 (400)0.042 ± 0.0560.010 ± 0.01410 ± 14 44%
LA 478-HL24USU-19285.7 mm65 (600)0.172 ± 0.1080.040 ± 0.02640 ± 26 58%
LA 478-HS2USU-192912.1 mm109 (800)0.057 ± 0.0300.012 ± 0.00712 ± 14 53%
LA 478-HS3USU-19305.1 mm21 (1000)0.189 ± 0.2070.042 ± 0.04642 ± 4671%
LA 478-HS4USU-19317.6 mm23 (1200)0.48 ± 0.420.11 ± 0.10110 ± 100 57%
LA 478-HS-6USU-22175.0 mm100 (300)0.11 ± 0.050.023 ± 0.01223 ± 12 39%
LA 478-HS-15USU-22186.1237 (600)0.06 ± 0.020.017 ± 0.00717 ± 7 38%
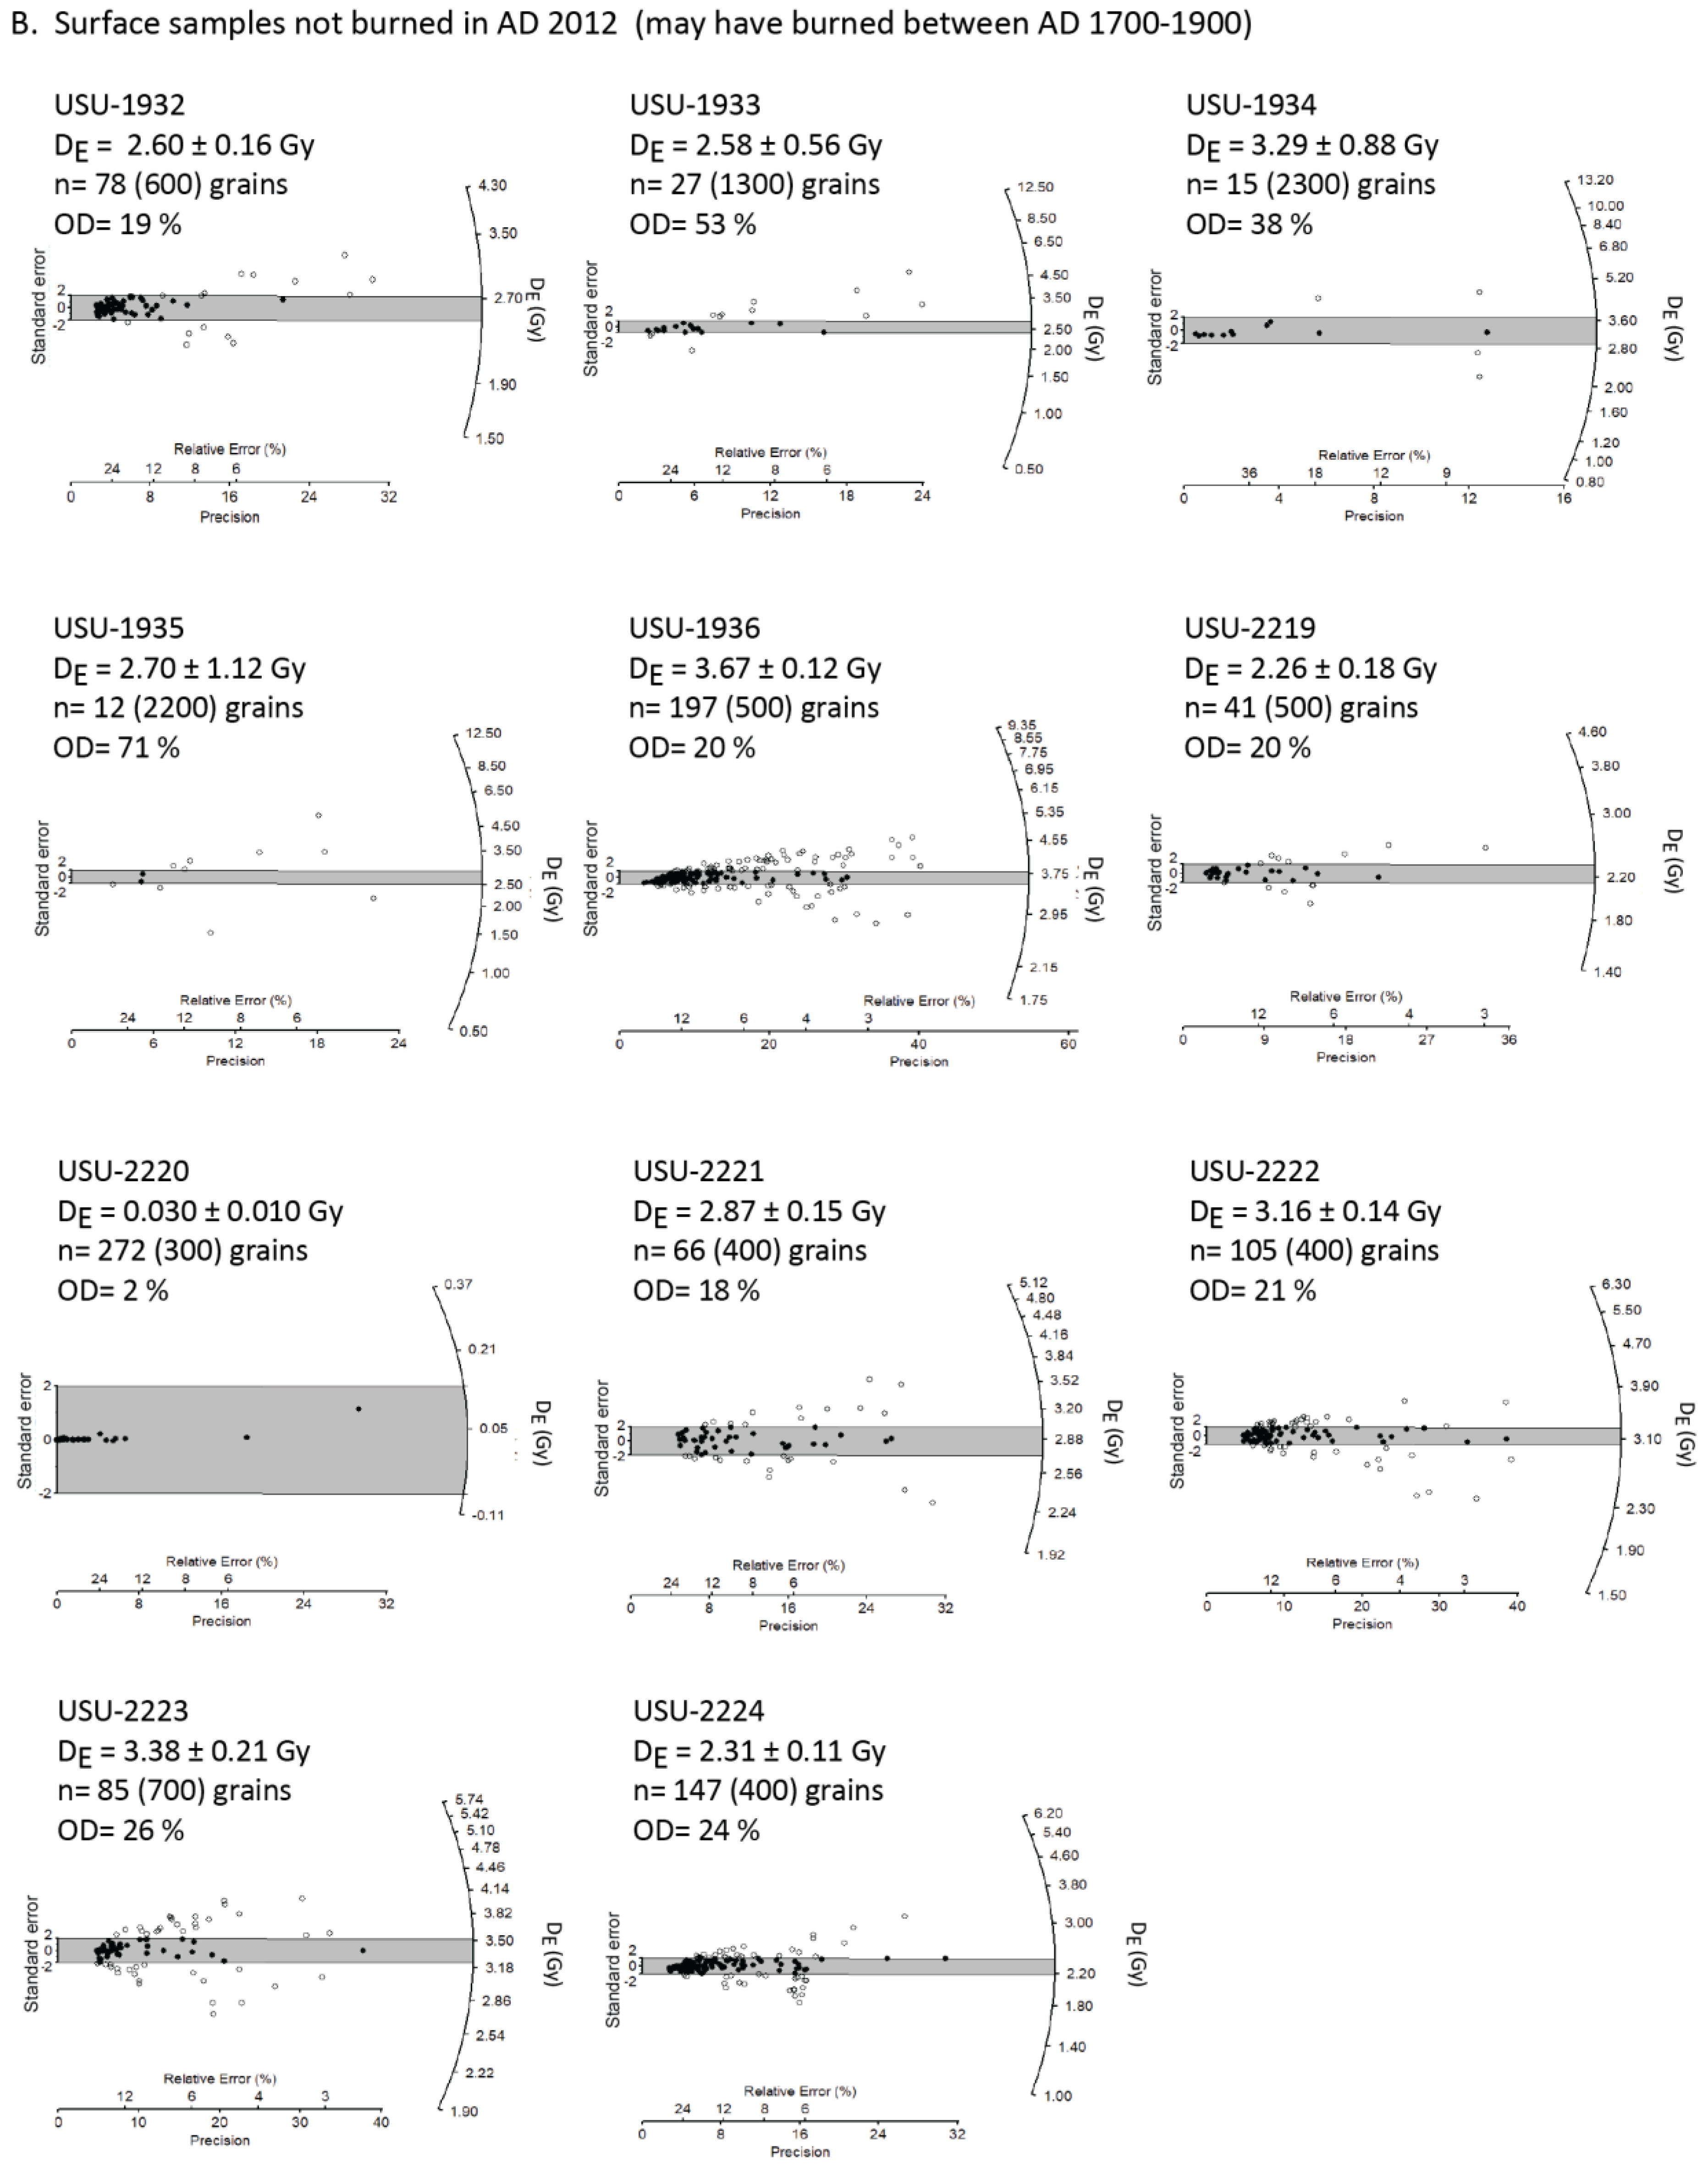
B. Surface samples not burned in 2012 CE
(may have burned between 1676 and 1898 CE)
LA 478-NM34USU-193210.6 mm78 (600)2.60 ± 0.160.55 ± 0.064550 ± 64 0%
LA 478-NM36USU-19339.1 mm27 (1300)2.58 ± 0.560.62 ± 0.15620 ± 150 0%
LA 478-NM40USU-19346.1 mm15 (2300)3.29 ± 0.880.75 ± 0.21750 ± 210 0%
LA 478-NM41USU-19358.0 mm12 (2200)2.70 ± 1.120.59 ± 0.25590 ± 250 0%
LA 478-NM45USU-19367.6 mm197 (500)3.67 ± 0.120.79 ± 0.08790 ± 80 0%
LA 478-NM33USU-22195.3 mm41 (500)2.26 ± 0.180.54 ± 0.06540 ± 60 0%
LA 478-NM-35USU-22206.9 mm272 (300)0.030 ± 0.0100.007 ± 0.0037 ± 3 15%
LA 478-NM-37USU-22216.1 mm66 (400)2.87 ± 0.150.69 ± 0.09690 ± 90 0%
LA 478-NM 39USU-22227.4 mm105 (400)3.16 ± 0.140.74 ± 0.09740 ± 90 0%
LA 478-NM42USU-22234.6 mm85 (700)3.38 ± 0.210.74 ± 0.10740 ± 100 0%
LA 478-NM43USU-22248.7 mm147 (400)2.31 ± 0.110.54 ± 0.052540 ± 52 0%
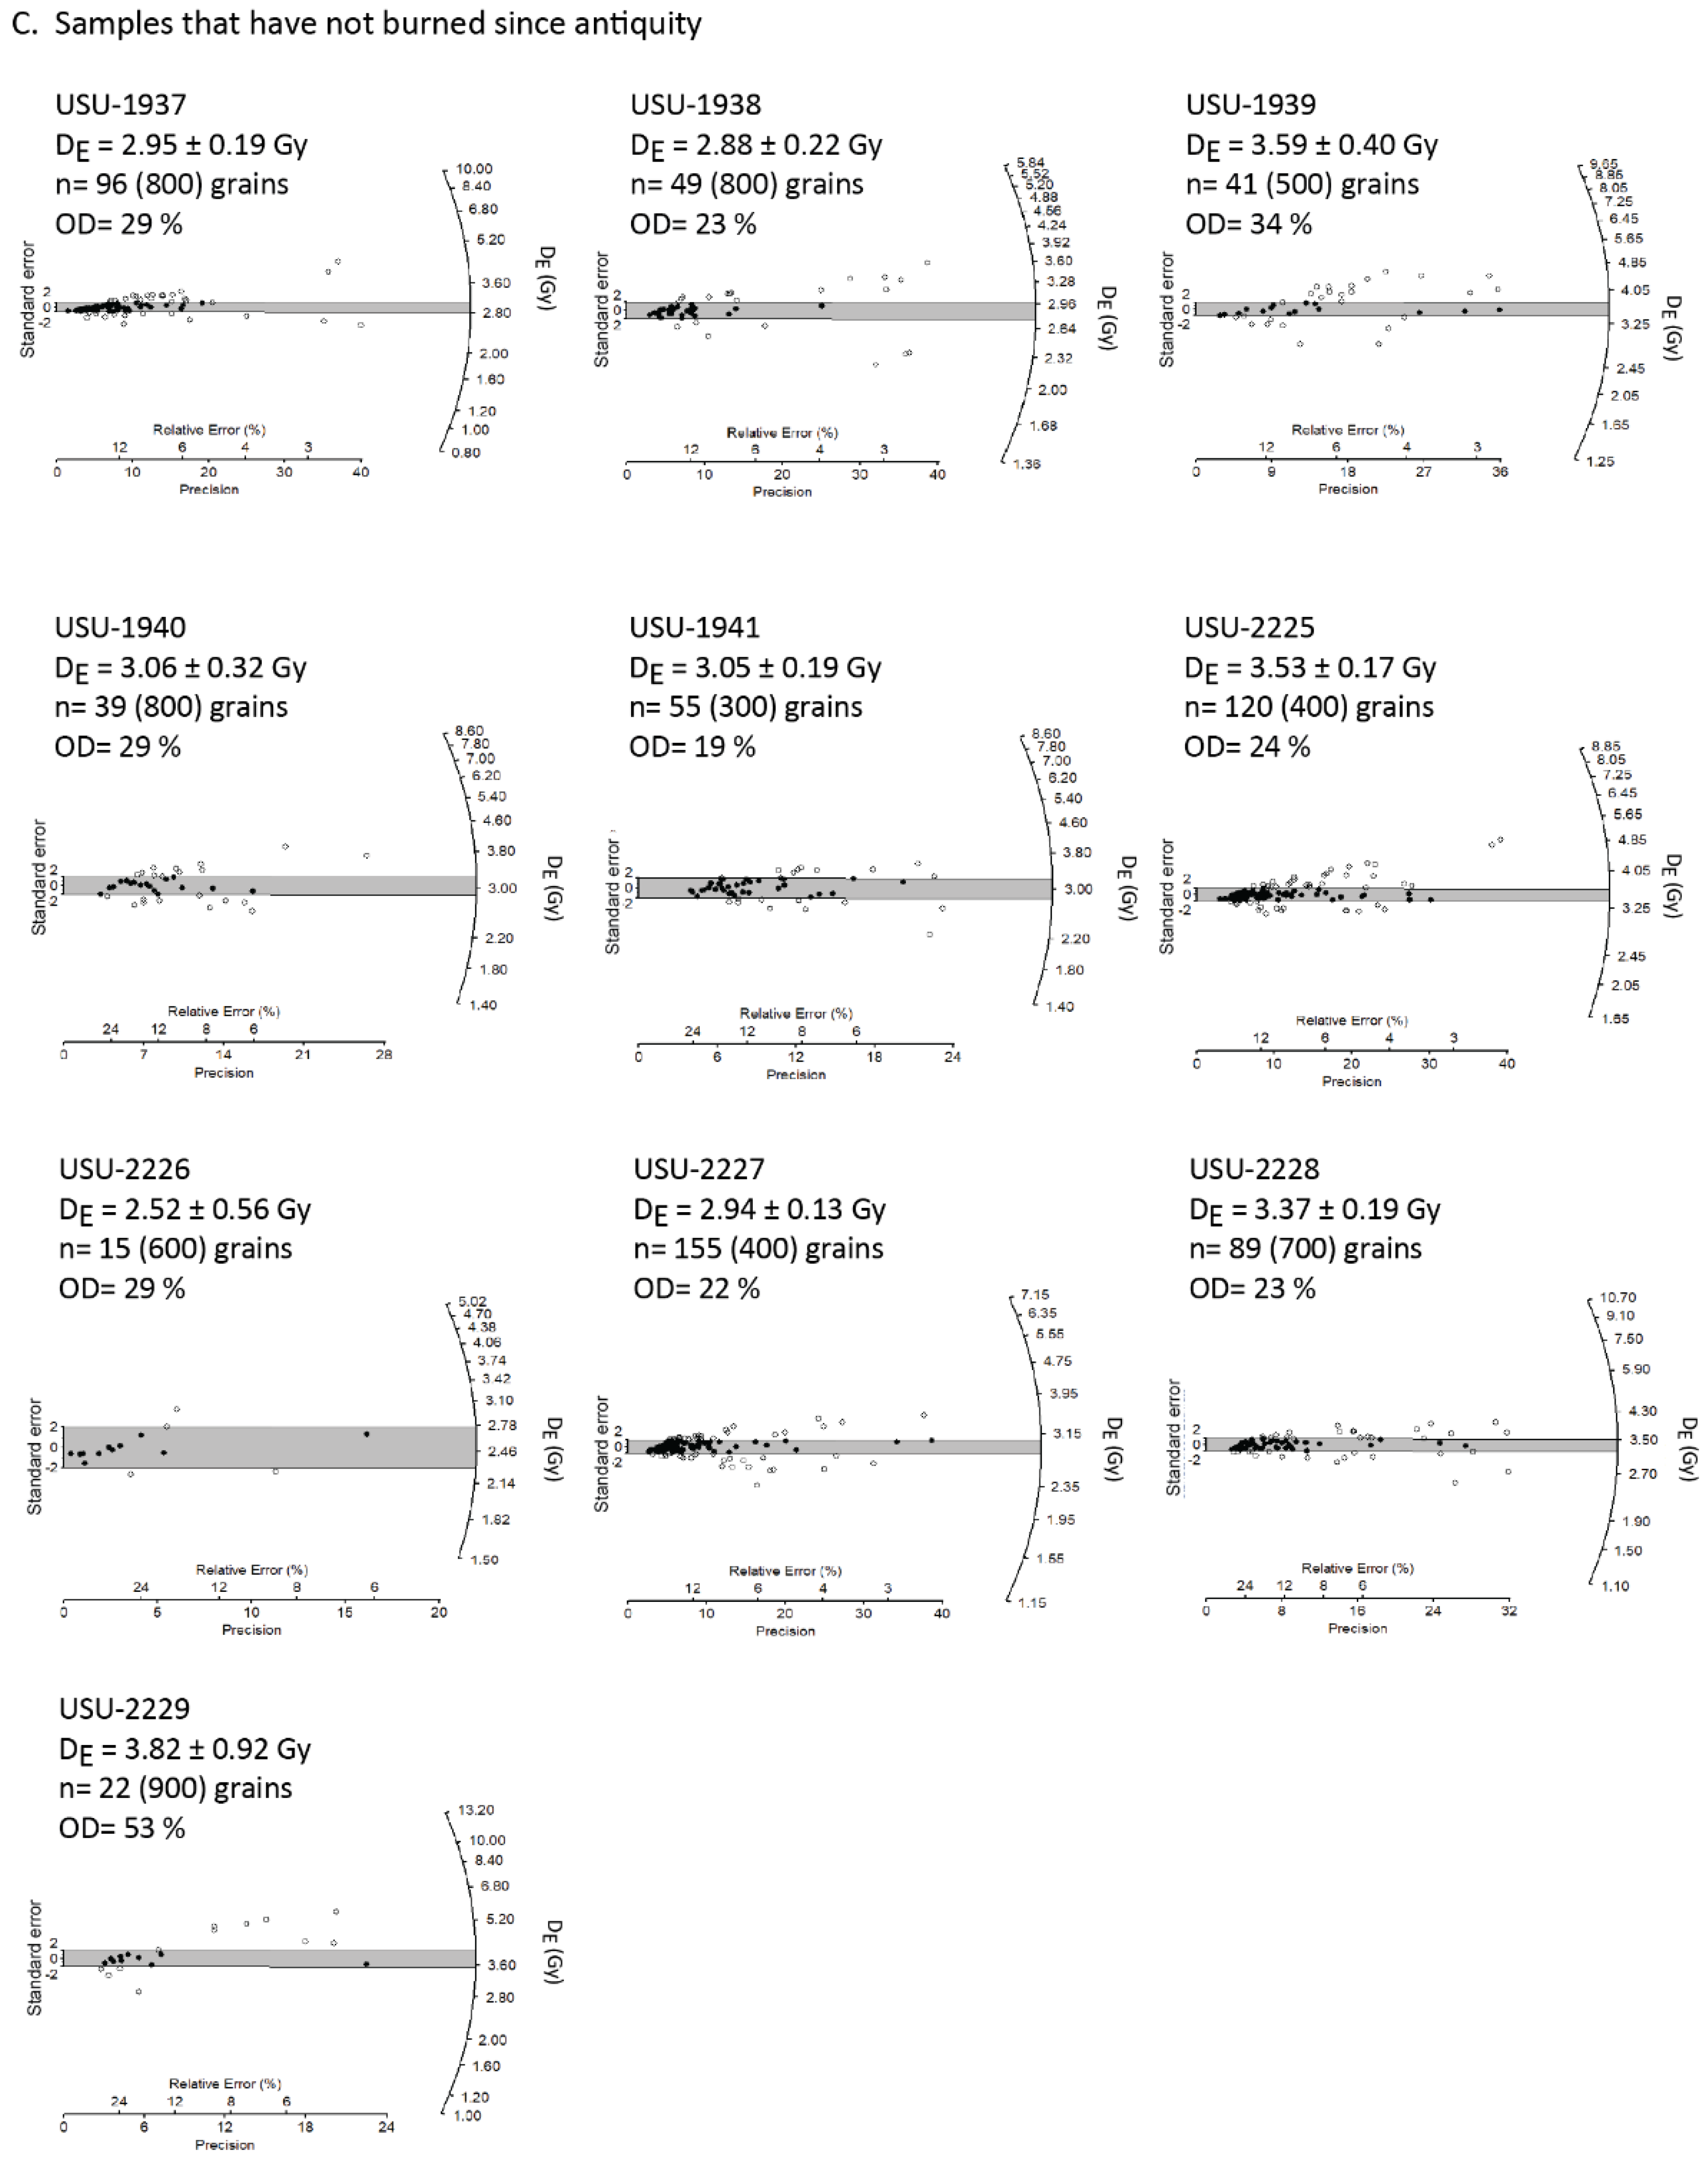
C. Samples that have not burned since antiquity
LA 478-UB26USU-19375.8 mm96 (800)2.95 ± 0.190.61 ± 0.07610 ± 70 0%
LA 478-UB31USU-19385.8 mm49 (800)2.88 ± 0.220.55 ± 0.07550 ± 70 0%
LA 478-UB51USU-19395.8 mm41 (500)3.59 ± 0.400.72 ± 0.10720 ± 100 0%
LA 478-UB54USU-19405.2 mm39 (800)3.06 ± 0.320.59 ± 0.08590 ± 80 0%
LA 478-UP48USU-19416.7 mm55 (300)3.05 ± 0.190.62 ± 0.07620 ± 70 0%
LA 478-UB-25USU-22256.0 mm120 (400)3.53 ± 0.170.82 ± 0.104820 ± 104 0%
LA 478-UB32USU-22264.9 mm15 (600)2.52 ± 0.560.62 ± 0.16620 ± 160 0%
LA 478-UB52USU-22276.2 mm155 (400)2.94 ± 0.130.82 ± 0.091820 ± 91 0%
LA 478-UB53USU-22285.7 mm89 (700)3.37 ± 0.190.87 ± 0.11870 ± 120 0%
LA 478-UP46USU-22295.9 mm22 (900)3.82 ± 0.920.74 ± 0.19740 ± 190 0%
Notes: a OSL age analysis follows the single-aliquot regenerative-dose procedure of Murray and Wintle [41] on single-grains (SG) of quartz sand [51]. Number of grains used in age calculation and number of total grains analyzed in parentheses. Grains not included in OSL age calculation were rejected if: IR depletion ratio >2, recycling ratio >30%, recuperation >5% of test dose (0.5 Gy), DE> highest regenerative dose, and/or poor luminescence properties. b Equivalent dose (DE) calculated using the central age model (CAM) of Galbraith and Roberts [43], the unlogged CAM (CAM-UL) following Arnold et al. [44] was used to calculate the DE for near-modern samples. c Percent of analyzed grains with no natural signal and, thus, apparently reset by fire.
Table A3. Radio-elemental information from sherd and soil samples.
Sample Num.USU Num.Sample TypeH2O (%) aK (%) bRb (ppm) bTh (ppm) bU (ppm) b
LA 478-HC10USU-1923soil 7.82.49 ± 0.06-14.0 ± 1.33.4 ± 0.2
sherd3.02 ± 0.08193.0 ± 7.722.1 ± 2.07.4 ± 0.5
LA 478-HC13USU-1924soil 9.82.32 ± 0.06-12.8 ± 1.23.1 ± 0.2
sherd2.51 ± 0.06148.5 ± 5.921.0 ± 1.95.8 ± 0.4
LA 478-HC14USU-1925soil 10.72.42 ± 0.06-13.5 ± 1.23.2 ± 0.2
sherd2.50 ± 0.06168.0 ± 6.725.3 ± 2.38.2 ± 0.6
LA 478-HL19USU-1926soil 10.32.53 ± 0.06-14.4 ± 1.33.5 ± 0.2
sherd2.64 ± 0.07122.0 ± 4.919.0 ± 1.75.8 ± 0.4
LA 478-HL20USU-1927soil 11.02.31 ± 0.06-13.2 ± 1.22.9 ± 0.2
sherd2.75 ± 0.07145.5 ± 5.819.2 ± 1.75.3 ± 0.4
LA 478-HL24USU-1928soil 10.72.56 ± 0.06-15.8 ± 1.43.5 ± 0.2
sherd3.00 ± 0.08155.5 ± 6.217.2 ± 1.54.1 ± 0.3
LA 478-HS2USU-1929soil 11.82.42 ± 0.06-15.2 ± 1.43.2 ± 0.2
sherd2.77 ± 0.07177.0 ± 7.123.9 ± 2.27.4 ± 0.5
LA 478-HS3USU-1930soil 8.72.42 ± 0.06-15.5 ± 1.43.4 ± 0.2
sherd3.12 ± 0.08173.5 ± 6.919.3 ± 1.74.6 ± 0.3
LA 478-HS4USU-1931soil 9.52.49 ± 0.06-15.6 ± 1.43.4 ± 0.2
sherd2.71 ± 0.07138.0 ± 5.515.5 ± 1.45.2 ± 0.4
LA 478-NM34USU-1932soil 14.82.56 ± 0.06-13.8 ± 1.23.1 ± 0.2
sherd3.14 ± 0.08173.5 ± 6.924.4 ± 2.26.6 ± 0.5
LA 478-NM36USU-1933soil 12.02.32 ± 0.06-13.7 ± 1.23.0 ± 0.2
sherd2.57 ± 0.06156.5 ± 6.321.6 ± 1.95.7 ± 0.4
LA 478-NM40USU-1934soil 13.52.44 ± 0.06-14.2 ± 1.33.2 ± 0.2
sherd3.14 ± 0.08172.0 ± 6.920.0 ± 1.84.8 ± 0.3
LA 478-NM41USU-1935soil 10.32.52 ± 0.06-13.4 ± 1.23.0 ± 0.2
sherd2.82 ± 0.07177.5 ± 7.124.7 ± 2.26.6 ± 0.5
LA 478-NM45USU-1936soil 13.72.64 ± 0.07-13.4 ± 1.23.4 ± 0.2
sherd3.59 ± 0.09174.0 ± 7.020.2 ± 1.83.8 ± 0.3
LA 478-UB26USU-1937soil 12.22.78 ± 0.07-13.8 ± 1.23.3 ± 0.2
sherd2.60 ± 0.07132.5 ± 5.318.1 ± 1.65.1 ± 0.4
LA 478-UB31USU-1938soil 12.32.53 ± 0.07-14.4 ± 1.33.4 ± 0.2
sherd3.07 ± 0.08194.5 ± 7.821.9 ± 2.05.1 ± 0.4
LA 478-UB51USU-1939soil 13.42.50 ± 0.06-13.0 ± 1.22.9 ± 0.2
sherd3.24 ± 0.08175.0 ± 7.019.3 ± 1.74.1 ± 0.3
LA 478-UB54USU-1940soil 10.72.65 ± 0.07-12.8 ± 1.12.9 ± 0.2
sherd2.93 ± 0.07173.5 ± 6.921.1 ± 1.96.3 ± 0.4
LA 478-UP48USU-1941soil 12.92.58 ± 0.06-14.1 ± 1.33.0 ± 0.2
sherd3.00 ± 0.08164.5 ± 6.618.3 ± 1.64.4 ± 0.3
LA 478-HS-6USU-2217soil11.62.84 ± 0.07-16.3 ± 1.53.4 ± 0.2
sherd2.66 ± 0.07158.0 ± 6.322.5 ± 2.07.3 ± 0.5
LA 478-HS-15USU-2218soil11.02.32 ± 0.06-12.7 ± 1.13.1 ± 0.2
sherd2.38 ± 0.06119.5 ± 4.815.2 ± 1.43.0 ± 0.2
LA 478-NM33USU-2219soil9.32.26 ± 0.06-12.4 ± 1.12.9 ± 0.2
sherd2.59 ± 0.06169.0 ± 6.824.4 ± 2.25.6 ± 0.4
LA 478-NM-35USU-2220soil11.42.47 ± 0.06-13.8 ± 1.23.3 ± 0.2
sherd2.77 ± 0.07131.0 ± 5.218.5 ± 1.73.6 ± 0.3
LA 478-NM-37USU-2221soil14.52.53 ± 0.06-14.3 ± 1.33.5 ± 0.2
sherd3.00 ± 0.08149.0 ± 6.017.9 ± 1.64.2 ± 0.3
LA 478-NM 39USU-2222soil10.52.47 ± 0.06-13.4 ± 1.22.8 ± 0.2
sherd2.66 ± 0.07139.5 ± 5.619.9 ± 1.86.2 ± 0.4
LA 478-NM42USU-2223soil10.92.52 ± 0.06-13.8 ± 1.23.1 ± 0.2
sherd2.65 ± 0.07178.0 ± 7.125.2 ± 2.37.5 ± 0.5
LA 478-NM43USU-2224soil13.82.53 ± 0.06-13.9 ± 1.23.1 ± 0.2
sherd2.93 ± 0.07149.5 ± 6.021.0 ± 1.95.0 ± 0.4
LA 478-UB-25USU-2225soil14.52.98 ± 0.07-14.4 ± 1.33.4 ± 0.2
sherd3.17 ± 0.08140.5 ± 5.617.6 ± 1.63.9 ± 0.3
LA 478-UB32USU-2226soil17.52.98 ± 0.07-14.4 ± 1.33.4 ± 0.2
sherd2.85 ± 0.07155.5 ± 6.216.1 ± 1.44.6 ± 0.3
LA 478-UB52USU-2227soil6.62.53 ± 0.06-13.0 ± 1.23.0 ± 0.2
sherd2.44 ± 0.0694.0 ± 3.813.4 ± 1.22.9 ± 0.2
LA 478-UB53USU-2228soil10.12.54 ± 0.06-14.3 ± 1.33.2 ± 0.2
sherd2.64 ± 0.07138.0 ± 5.514.3 ± 1.33.9 ± 0.3
LA 478-UP46USU-2229soil12.02.53 ± 0.06-10.5 ± 0.92.4 ± 0.2
sherd2.78 ± 0.07182.5 ± 7.329.8 ± 2.711.2 ± 0.8
Notes: a Saturated H2O content calculated from the sherd following soaking in deionized (DI) water. For sherd and soil dose rate calculation, 50% of this value was used as the environmental moisture content. b Radio-elemental concentrations determined by ICP-MS and ICP-AES techniques; dose rate is derived from concentrations by conversion factors from Guérin et al. [45].
Table A4. Dose rate information for quartz analyses.
Sample Num.USU Num.Betaa (Sherd) (Gy/Kyr)Gamma b (Sherd) (Gy/Kyr)Gamma c (Soil) (Gy/Kyr)Cosmic d (Gy/Kyr)Total Dose Rate (Gy/Kyr)
LA 478-HC10USU-19233.560.230.730.334.85 ± 0.33
LA 478-HC13USU-19242.940.210.660.334.14 ± 0.26
LA 478-HC14USU-19253.290.270.680.334.57 ± 0.37
LA 478-HL19USU-19262.970.200.730.334.23 ± 0.24
LA 478-HL20USU-19272.980.220.640.334.17 ± 0.24
LA 478-HL24USU-19282.990.180.760.334.26±0.22
LA 478-HS2USU-19293.340.340.680.334.69 ± 0.34
LA 478-HS3USU-19303.210.190.750.334.48 ± 0.25
LA 478-HS4USU-19312.890.200.740.334.16 ± 0.21
LA 478-NM34USU-19323.450.310.670.334.76 ± 0.33
LA 478-NM36USU-19332.940.250.650.334.17 ± 0.26
LA 478-NM40USU-19343.170.210.690.334.40 ± 0.26
LA 478-NM41USU-19353.320.270.680.334.60 ± 0.33
LA 478-NM45USU-19363.370.230.690.334.62 ± 0.27
LA 478-UB26USU-19372.870.191.480.334.87 ± 0.24
LA 478-UB31USU-19383.230.211.430.335.20 ± 0.29
LA 478-UB51USU-19393.150.191.320.324.98 ± 0.26
LA 478-UB54USU-19403.280.211.370.335.19 ± 0.30
LA 478-UP48USU-19413.010.201.380.334.92 ± 0.24
LA 478-HS-6USU-22173.220.220.800.334.57 ± 0.34
LA 478-HS-15USU-22182.370.150.650.333.50 ± 0.23
LA 478-NM33USU-22193.010.210.630.334.18 ± 0.22
LA 478-NM-35USU-22202.780.190.690.333.99 ± 0.27
LA 478-NM-37USU-22212.940.190.710.334.17 ± 0.33
LA 478-NM 39USU-22223.050.230.660.334.28 ± 0.30
LA 478-NM42USU-22233.310.220.700.334.57 ± 0.34
LA 478-NM43USU-22243.070.240.670.334.31 ± 0.34
LA 478-UB-25USU-22253.010.190.760.334.29 ± 0.33
LA 478-UB32USU-22262.800.160.750.334.04 ± 0.36
LA 478-UB52USU-22272.420.150.690.333.59 ± 0.18
LA 478-UB53USU-22282.650.160.720.333.86 ± 0.24
LA 478-UP46USU-22293.910.300.600.335.14 ± 0.44
a Contribution of beta radiation from radio-isotopes within the sherd is based on conversion factors of Guérin et al. [45] and scaled for beta attenuation based on mean analyzed grain size and 50% of saturated water content of the sherd following Aitken [52]. See Table A3 for contributing data. b Contribution of gamma radiation from radio-isotopes within the sherd is based on conversion factors of Guérin et al. [45] and scaled based on attenuation from water content and the proportion of gamma contribution based on sherd thickness and sample depth following attenuation factors and gradients of Aitken [52]. See Table A3 for data. c Contribution of gamma radiation from radio-isotopes from the associated soil sample is based on conversion factors of Guérin et al. [45] and scaled based on attenuation from water content and the remaining proportion of gamma contribution based on sherd thickness and sample depth following attenuation factors and gradients of Aitken [52]. See Table A3 for contributing data. d Contribution of cosmic radiation to the dose rate was calculated using sample depth, assumed sediment and ceramic density of 1.5 g/cm3, and the elevation and latitude/longitude following Prescott and Hutton [53].

References

  1. Stephens, S.L.; Collins, B.M.; Biber, E.; Fulé, P.Z. U.S. federal fire and forest policy: Emphasizing resilience in dry forests. Ecosphere 2016, 7, e01584. [Google Scholar] [CrossRef]
  2. Doerr, S.H.; Santín, C. Global trends in wildfire and its impacts: Perceptions versus realities in a changing world. Philos. Trans. R. Soc. B Biol. Sci. 2016, 371, 20150345. [Google Scholar] [CrossRef] [PubMed]
  3. Marlon, J.R.; Bartlein, P.J.; Gavin, D.G.; Long, C.J.; Anderson, R.S.; Briles, C.E.; Brown, K.J.; Colombaroli, D.; Hallett, D.J.; Power, M.J.; et al. Long-term perspective on wildfires in the western USA. Proc. Natl. Acad. Sci. USA 2012, 109, E535–E543. [Google Scholar] [CrossRef] [PubMed] [Green Version]
  4. Swetnam, T.W.; Farella, J.; Roos, C.I.; Liebmann, M.J.; Falk, D.A.; Allen, C.D. Multiscale perspectives of fire, climate and humans in western North America and the Jemez Mountains, USA. Philos. Trans. R. Soc. B Biol. Sci. 2016, 371, 20150168. [Google Scholar] [CrossRef] [PubMed]
  5. Abatzoglou, J.T.; Williams, A.P. Impact of anthropogenic climate change on wildfire across western US forests. Proc. Natl. Acad. Sci. USA 2016, 113, 11770–11775. [Google Scholar] [CrossRef] [PubMed] [Green Version]
  6. Fischer, A.P.; Spies, T.A.; Steelman, T.A.; Moseley, C.; Johnson, B.R.; Bailey, J.D.; Ager, A.A.; Bourgeron, P.; Charnley, S.; Collins, B.M.; et al. Wildfire risk as a socioecological pathology. Front. Ecol. Environ. 2016, 14, 276–284. [Google Scholar] [CrossRef] [Green Version]
  7. Keeley, J.E. Fire intensity, fire severity and burn severity: A brief review and suggested usage. Int. J. Wildland Fire 2009, 18, 116–126. [Google Scholar] [CrossRef]
  8. Rhodes, E.J. Optically Stimulated Luminescence Dating of Sediments over the Past 200,000 Years. Annu. Rev. Earth Planet. Sci. 2011, 39, 461–488. [Google Scholar] [CrossRef] [Green Version]
  9. Roberts, R.G.; Jacobs, Z.; Li, B.; Jankowski, N.R.; Cunningham, A.C.; Rosenfeld, A.B. Optical dating in archaeology: Thirty years in retrospect and grand challenges for the future. J. Archaeol. Sci. 2015, 56, 41–60. [Google Scholar] [CrossRef] [Green Version]
  10. Elliott, M.L. Large Pueblo Sites Near Jemez Springs, New Mexico; Santa Fe National Forest: Santa Fe, NM, USA, 1982.
  11. Kulisheck, J. ‘Like Butterflies on a Mounting Board’ Pueblo Mobility and Demography before 1825 Jeremy Kulisheck. In Across A Great Divide: Continuity and Change in Native North American Societies, 1400–1900; Schieber, L.L., Mitchell, M.D., Eds.; University of Arizona Press: Tucson, AZ, USA, 2010; pp. 174–191. [Google Scholar]
  12. Liebmann, M.J.; Farella, J.; Roos, C.I.; Stack, A.; Martini, S.; Swetnam, T.W. Native American depopulation, reforestation, and fire regimes in the Southwest United States, 1492–1900 CE. Proc. Natl. Acad. Sci. USA 2016, 113, E696–E704. [Google Scholar] [CrossRef] [Green Version]
  13. Falk, D.A.; Heyerdahl, E.K.; Brown, P.M.; Farris, C.; Fulé, P.Z.; McKenzie, D.; Swetnam, T.W.; Taylor, A.H.; van Horne, M.L. Multi-scale controls of historical forest-fire regimes: New insights from fire-scar networks. Front. Ecol. Environ. 2011, 9, 446–454. [Google Scholar] [CrossRef] [Green Version]
  14. Allen, C.D.; Savage, M.; Falk, D.A.; Suckling, K.F.; Swetnam, T.W.; Schulke, T.; Stacey, P.B.; Morgan, P.; Hoffman, M.; Klingel, J.T. Ecological restoration of Southwestern ponderosa pine ecosystems. Ecol. Appl. 2002, 12, 1418–1433. [Google Scholar] [CrossRef]
  15. Covington, W.W.; Moore, M.M. Southwestern ponderosa pine forest structure and resource conditions: Changes since Euro-American settlement. J. For. 1994, 92, 39–47. [Google Scholar] [CrossRef]
  16. Allen, C.D.; Anderson, R.S.; Jass, R.B.; Toney, J.L.; Baisan, C.H. Paired charcoal and tree-ring records of high-frequency Holocene fire from two New Mexico bog sites. Int. J. Wildland Fire 2008, 17, 115–130. [Google Scholar] [CrossRef]
  17. Farella, J. Terminus Ante Quem Constraint of Pueblo Occupation Periods in the Jemez Province, New Mexico; University of Arizona: Tucson, AZ, USA, 2015. [Google Scholar]
  18. Sackett, S.S. Natural Fuel Loadings in Ponderosa Pine and Mixed Conifer Forests of the Southwest; USDA Forest Service—Rocky Mountain Research Station: Fort Collins, CO, USA, 1979; Volume RM-213.
  19. Covington, W.W.; Sackett, S.S. Effect of Periodic Burning on Soil Nitrogen Concentrations in Ponderosa Pine. Soil Sci. Soc. Am. J. 1986, 50, 452–457. [Google Scholar] [CrossRef] [Green Version]
  20. Covington, W.W.; Moore, M.M. Post settlement changes in natural fire regimes and forest structure: Ecological restoration of old-growth ponderosa pine forests. J. Sustain. For. 1994, 2, 153–181. [Google Scholar] [CrossRef]
  21. Ideker, C.J.; Finley, J.B.; Rittenour, T.M.; Nelson, M.S. Single-grain optically stimulated luminescence dating of quartz temper from prehistoric Intermountain Ware ceramics, northwestern Wyoming, USA. Quat. Geochronol. 2017, 42, 42–55. [Google Scholar] [CrossRef]
  22. Rowlett, R.M. Ceramic Thermoluminescence Response Effects after the La Mesa Forest Fire, Bandelier National Monument. Archaeol. Mont. 1991, 32, 49–56. [Google Scholar]
  23. Herbert, J.M.; Feathers, J.K. Luminescence Dating Sandhills Ceramics: A Review. North Carol. Archaeol. 2015, 64, 68–103. [Google Scholar]
  24. Marlon, J.R.; Bartlein, P.J.; Carcaillet, C.; Gavin, D.G.; Harrison, S.P.; Higuera, P.E.; Joos, F.; Power, M.J.; Prentice, I.C. Climate and human influences on global biomass burning over the past two millennia. Nat. Geosci. 2008, 1, 697–702. [Google Scholar] [CrossRef]
  25. Roos, C.I.; Swetnam, T.W. A 1416-year reconstruction of annual, multi-decadal, and centennial variability in area burned for ponderosa pine forests of the southern Colorado Plateau region, Southwest US. Holocene 2012, 22, 281–290. [Google Scholar] [CrossRef]
  26. Odion, D.C.; Hanson, C.T.; Arsenault, A.; Baker, W.L.; Dellasala, D.A.; Hutto, R.L.; Klenner, W.; Moritz, M.A.; Sherriff, R.L.; Veblen, T.T.; et al. Examining historical and current mixed-severity fire regimes in ponderosa pine and mixed-conifer forests of western North America. PLoS ONE 2014, 9, e87852. [Google Scholar] [CrossRef] [Green Version]
  27. Balch, J.K.; Schoennagel, T.; Williams, A.P.; Abatzoglou, J.T.; Cattau, M.E.; Mietkiewicz, N.P.; St. Denis, L.A. Switching on the Big Burn of 2017. Fire 2018, 1, 17. [Google Scholar] [CrossRef] [Green Version]
  28. Kolden, C.A. We’re Not Doing Enough Prescribed Fire in the Western United States to Mitigate Wildfire Risk. Fire 2019, 2, 30. [Google Scholar] [CrossRef] [Green Version]
  29. Bowman, D.M.J.S.; Williamson, G.J.; Abatzoglou, J.T.; Kolden, C.A.; Cochrane, M.A.; Smith, A.M.S. Human exposure and sensitivity to globally extreme wildfire events. Nat. Ecol. Evol. 2017, 1, 0058. [Google Scholar] [CrossRef] [PubMed]
  30. Borchers Arriagada, N.; Bowman, D.M.J.S.; Palmer, A.J.; Johnston, F.H. Climate Change, Wildfires, Heatwaves and Health Impacts in Australia. In Extreme Weather Events and Human Health: International Case Studies; Akhtar, R., Ed.; Springer International Publishing: Cham, Switzerland, 2020; pp. 99–116. [Google Scholar] [CrossRef]
  31. Bowman, D.M.J.S.; Moreira-Muñoz, A.; Kolden, C.A.; Chávez, R.O.; Muñoz, A.A.; Salinas, F.; González-Reyes, Á.; Rocco, R.; de la Barrera, F.; Williamson, G.J.; et al. Human–Environmental drivers and impacts of the globally extreme 2017 Chilean fires. Ambio 2019, 48, 350–362. [Google Scholar] [CrossRef] [PubMed]
  32. Abatzoglou, J.T.; Kolden, C.A.; Williams, A.P.; Lutz, J.A.; Smith, A.M.S. Climatic influences on interannual variability in regional burn severity across western US forests. Int. J. Wildland Fire 2017, 26, 269–275. [Google Scholar] [CrossRef]
  33. Keyser, A.; Westerling, A.L. Climate drives inter-annual variability in probability of high severity fire occurrence in the western United States. Environ. Res. Lett. 2017, 12, 065003. [Google Scholar] [CrossRef]
  34. Westerling, A.L. Increasing western US forest wildfire activity: Sensitivity to changes in the timing of spring. Philos. Trans. R. Soc. B Biol. Sci. 2016, 371, 20150178. [Google Scholar] [CrossRef]
  35. Westerling, A.L.; Hidalgo, H.G.; Cayan, D.R.; Swetnam, T.W. Warming and earlier spring increase Western U.S. forest wildfire activity. Science 2006, 313, 940–943. [Google Scholar] [CrossRef] [Green Version]
  36. Abatzoglou, J.T.; Kolden, C.A. Relationships between climate and macroscale area burned in the western United States. Int. J. Wildland Fire 2013, 22, 1003–1020. [Google Scholar] [CrossRef]
  37. Stephens, S.L.; Moghaddas, J.J.; Edminster, C.; Fiedler, C.E.; Haase, S.; Harrington, M.; Keeley, J.E.; Knapp, E.E.; McIver, J.D.; Metlen, K.; et al. Fire treatment effects on vegetation structure, fuels, and potential fire severity in western U.S. forests. Ecol. Appl. 2009, 19, 305–320. [Google Scholar] [CrossRef] [Green Version]
  38. Smith, A.M.S.; Kolden, C.A.; Bowman, D.M.J.S. Biomimicry can help humans to coexist sustainably with fire. Nat. Ecol. Evol. 2018, 2, 1827–1829. [Google Scholar] [CrossRef] [PubMed]
  39. Schoennagel, T.; Balch, J.K.; Brenkert-Smith, H.; Dennison, P.E.; Harvey, B.J.; Krawchuk, M.A.; Mietkiewicz, N.; Morgan, P.; Moritz, M.A.; Rasker, R.; et al. Adapt to more wildfire in western North American forests as climate changes. Proc. Natl. Acad. Sci. USA 2017, 114, 4582–4590. [Google Scholar] [CrossRef] [PubMed] [Green Version]
  40. Duller, G.A.T. Distinguishing quartz and feldspar in single grain luminescence measurements. Radiat. Meas. 2003, 37, 161–165. [Google Scholar] [CrossRef]
  41. Murray, A.S.; Wintle, A.G. Luminescence dating of quartz using an improved single-aliquot regenerative-dose protocol. Radiat. Meas. 2000, 32, 57–73. [Google Scholar] [CrossRef]
  42. Bøtter-Jensen, L.; Andersen, C.E.; Duller, G.A.T.; Murray, A.S. Developments in radiation, stimulation and observation facilities in luminescence measurements. Radiat. Meas. 2003, 37, 535–541. [Google Scholar] [CrossRef]
  43. Galbraith, R.F.; Roberts, R.G. Statistical aspects of equivalent dose and error calculation and display in OSL dating: An overview and some recommendations. Quat. Geochronol. 2012, 11, 1–27. [Google Scholar] [CrossRef]
  44. Arnold, L.J.; Roberts, R.G.; Galbraith, R.F.; DeLong, S.B. A revised burial dose estimation procedure for optical dating of young and modern-age sediments. Quat. Geochronol. 2009, 4, 306–325. [Google Scholar] [CrossRef]
  45. Guérin, G.; Mercier, N.; Adamiec, G. Dose-rate conversion factors: Update. Anc. TL 2011, 29, 5–8. [Google Scholar]
  46. Prescott, J.R.; Hutton, J.T. Cosmic ray contributions to dose rates for luminescence and ESR dating: Large depths and long-term time variations. Radiat. Meas. 1994, 23, 497–500. [Google Scholar] [CrossRef]
  47. Aitken, M.J. Introduction to Optical Dating: The Dating of Quaternary Sediments by the Use of Photon-Stimulated Luminescence; Oxford University Press: New York, NY, USA, 1998. [Google Scholar]
  48. Dieterich, J.H.; Swetnam, T.W. Dendrochronology of a fire scarred ponderosa pine. For. Sci. 1984, 30, 238–247. [Google Scholar] [CrossRef]
  49. Garlough, E.C.; Keyes, C.R. Influences of moisture content, mineral content and bulk density on smouldering combustion of ponderosa pine duff mounds. Int. J. Wildland Fire 2011, 20, 589–596. [Google Scholar] [CrossRef]
  50. Van Wagtendonk, J.W.; Benedict, J.M.; Sydoriak, W.M. Fuel Bed Characteristics of Sierra Nevada Conifers. West. J. Appl. For. 1998, 13, 73–84. [Google Scholar] [CrossRef]
  51. Duller, G.A.T. Single-grain optical dating of Quaternary sediments: Why aliquot size matters in luminescence dating. Boreas 2008, 37, 589–612. [Google Scholar] [CrossRef]
  52. Aitken, M.J. Thermoluminescence Dating; Academic Press: London, UK, 1985. [Google Scholar]
  53. Prescott, J.R.; Hutton, J.T. Environmental dose rates and radioactive disequilibrium from some Australian luminescence dating sites. Quat. Sci. Rev. 1995, 14, 439–448. [Google Scholar] [CrossRef]
Figure 1. The geographic location of the archaeological site of Wabakwa. (a,b) The location of the study area in northern New Mexico (red square) in the Southwest USA. Green areas are the locations of ponderosa pine forests in (b). (c) The study site of Wabakwa (LA 478) and the reference site of Amoxiumqua (LA 481) are situated within the distribution of ponderosa pine forests (dark green). Tick marks record the geographic location in Northing and Easting (m) for UTM zone 13N. (d) The ceramic collection areas for optically stimulated luminescence (OSL) dating are plotted relative to the topography of the ruin and the fire scar collection locations.
Fire 03 00032 g001
Figure 2. Repeat photographs of the changing fuel load at the comparable ruin of Amoxiumqua (LA 481; see Figure 1). Figures are standing in the same excavated room; (A): Top photo mosaic from the Bureau of American Ethnology in 1910; (B): Bottom photo mosaic by Rick Halsey in 2016).
Fire 03 00032 g002
Figure 3. Optically stimulated luminescence (OSL) age estimates and fire-scar dated fire activity at Wabakwa. (a) Synchrony plot (% of trees recording a fire in a given year, red lines) with sample depth of recording trees (dashed line). Fourteen replicated historical fires (≥2 trees recording a fire) were recorded between 1696 and 1893 CE, 8 of these burned between 1724 and 1893 CE within 100 m of the midden sampling location. (b) Plot of the mean and 2σ age ranges for OSL measurements of archaeological ceramics. Gray bars are for samples in areas burned in 2012. Red bars are for samples from areas that burned in historical fires. Blue bars are for sherds from contexts that have never burned. Green background area indicates the period of occupation at Wabakwa (ca. 1140–1470 CE). Samples are ordered by mean age from youngest (top) to oldest (bottom).
Fire 03 00032 g003

