Using Digital Technology to Protect Health in Prolonged Poor Air Quality Episodes: A Case Study of the AirRater App during the Australian 2019–20 Fires

 ,
,  , , and
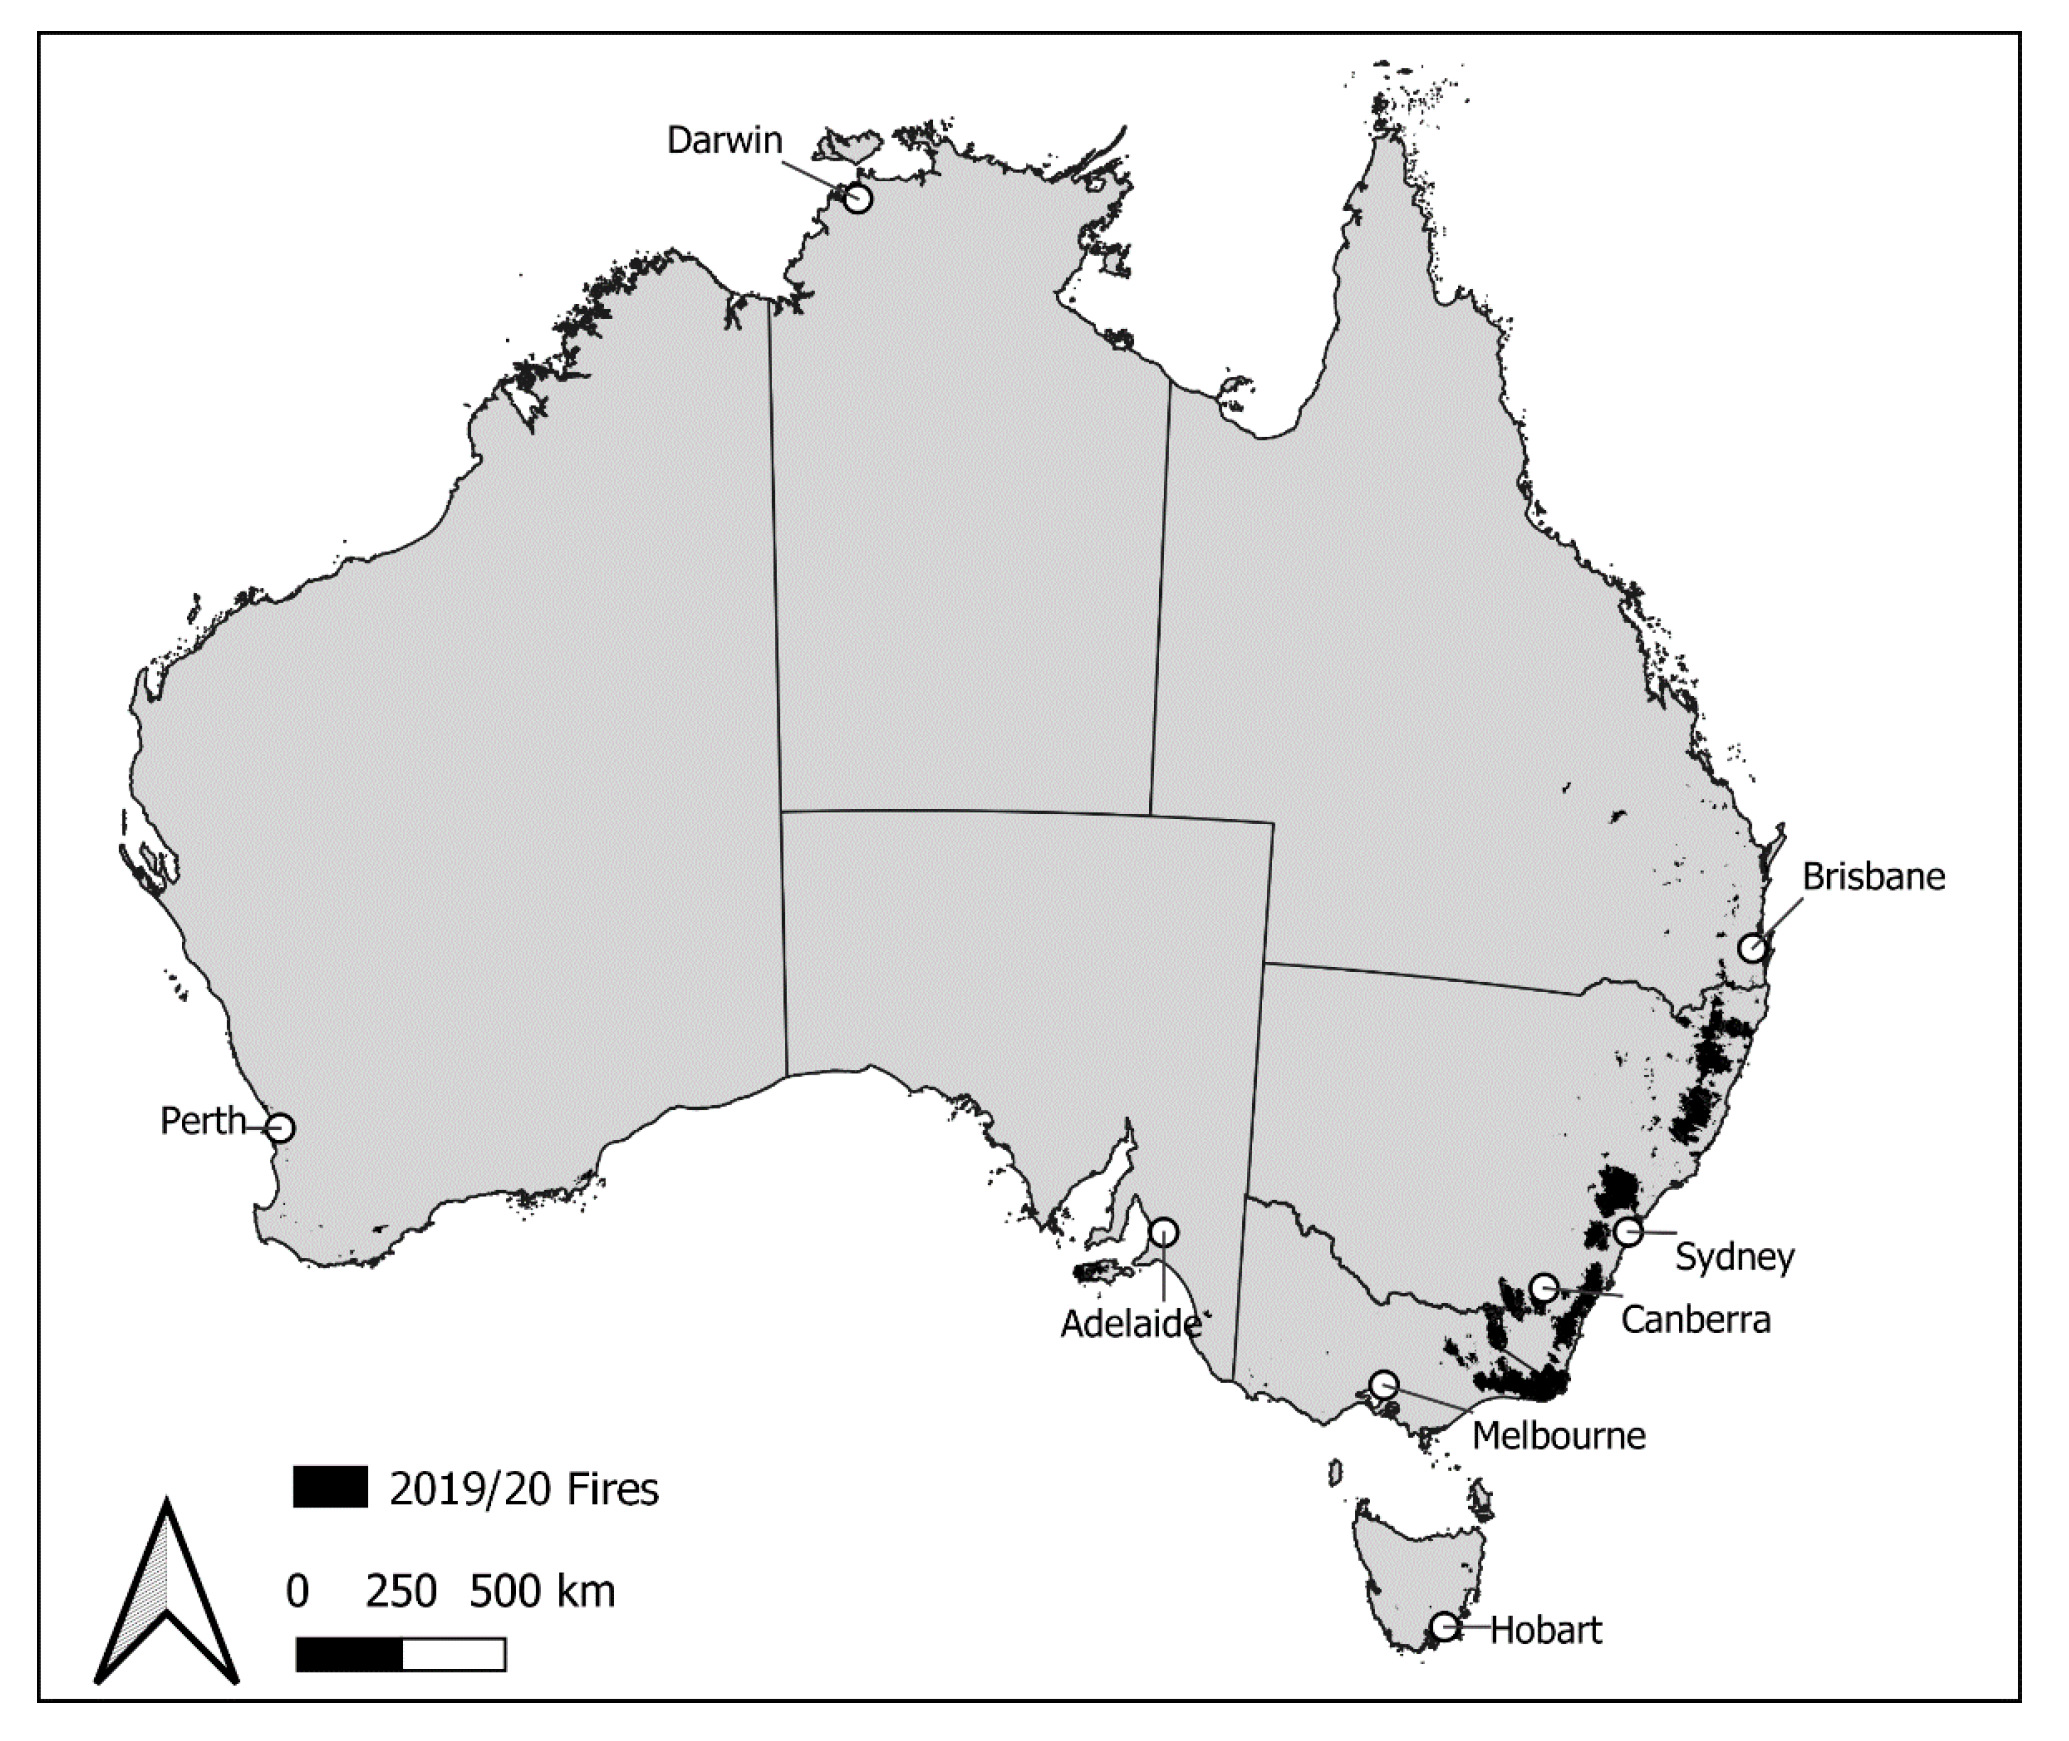
Abstract
:1. Introduction
1.1. AirRater App
1.2. Research Aim
2. Materials and Methods
2.1. Study Setting
2.2. Study Methodology
3. Results
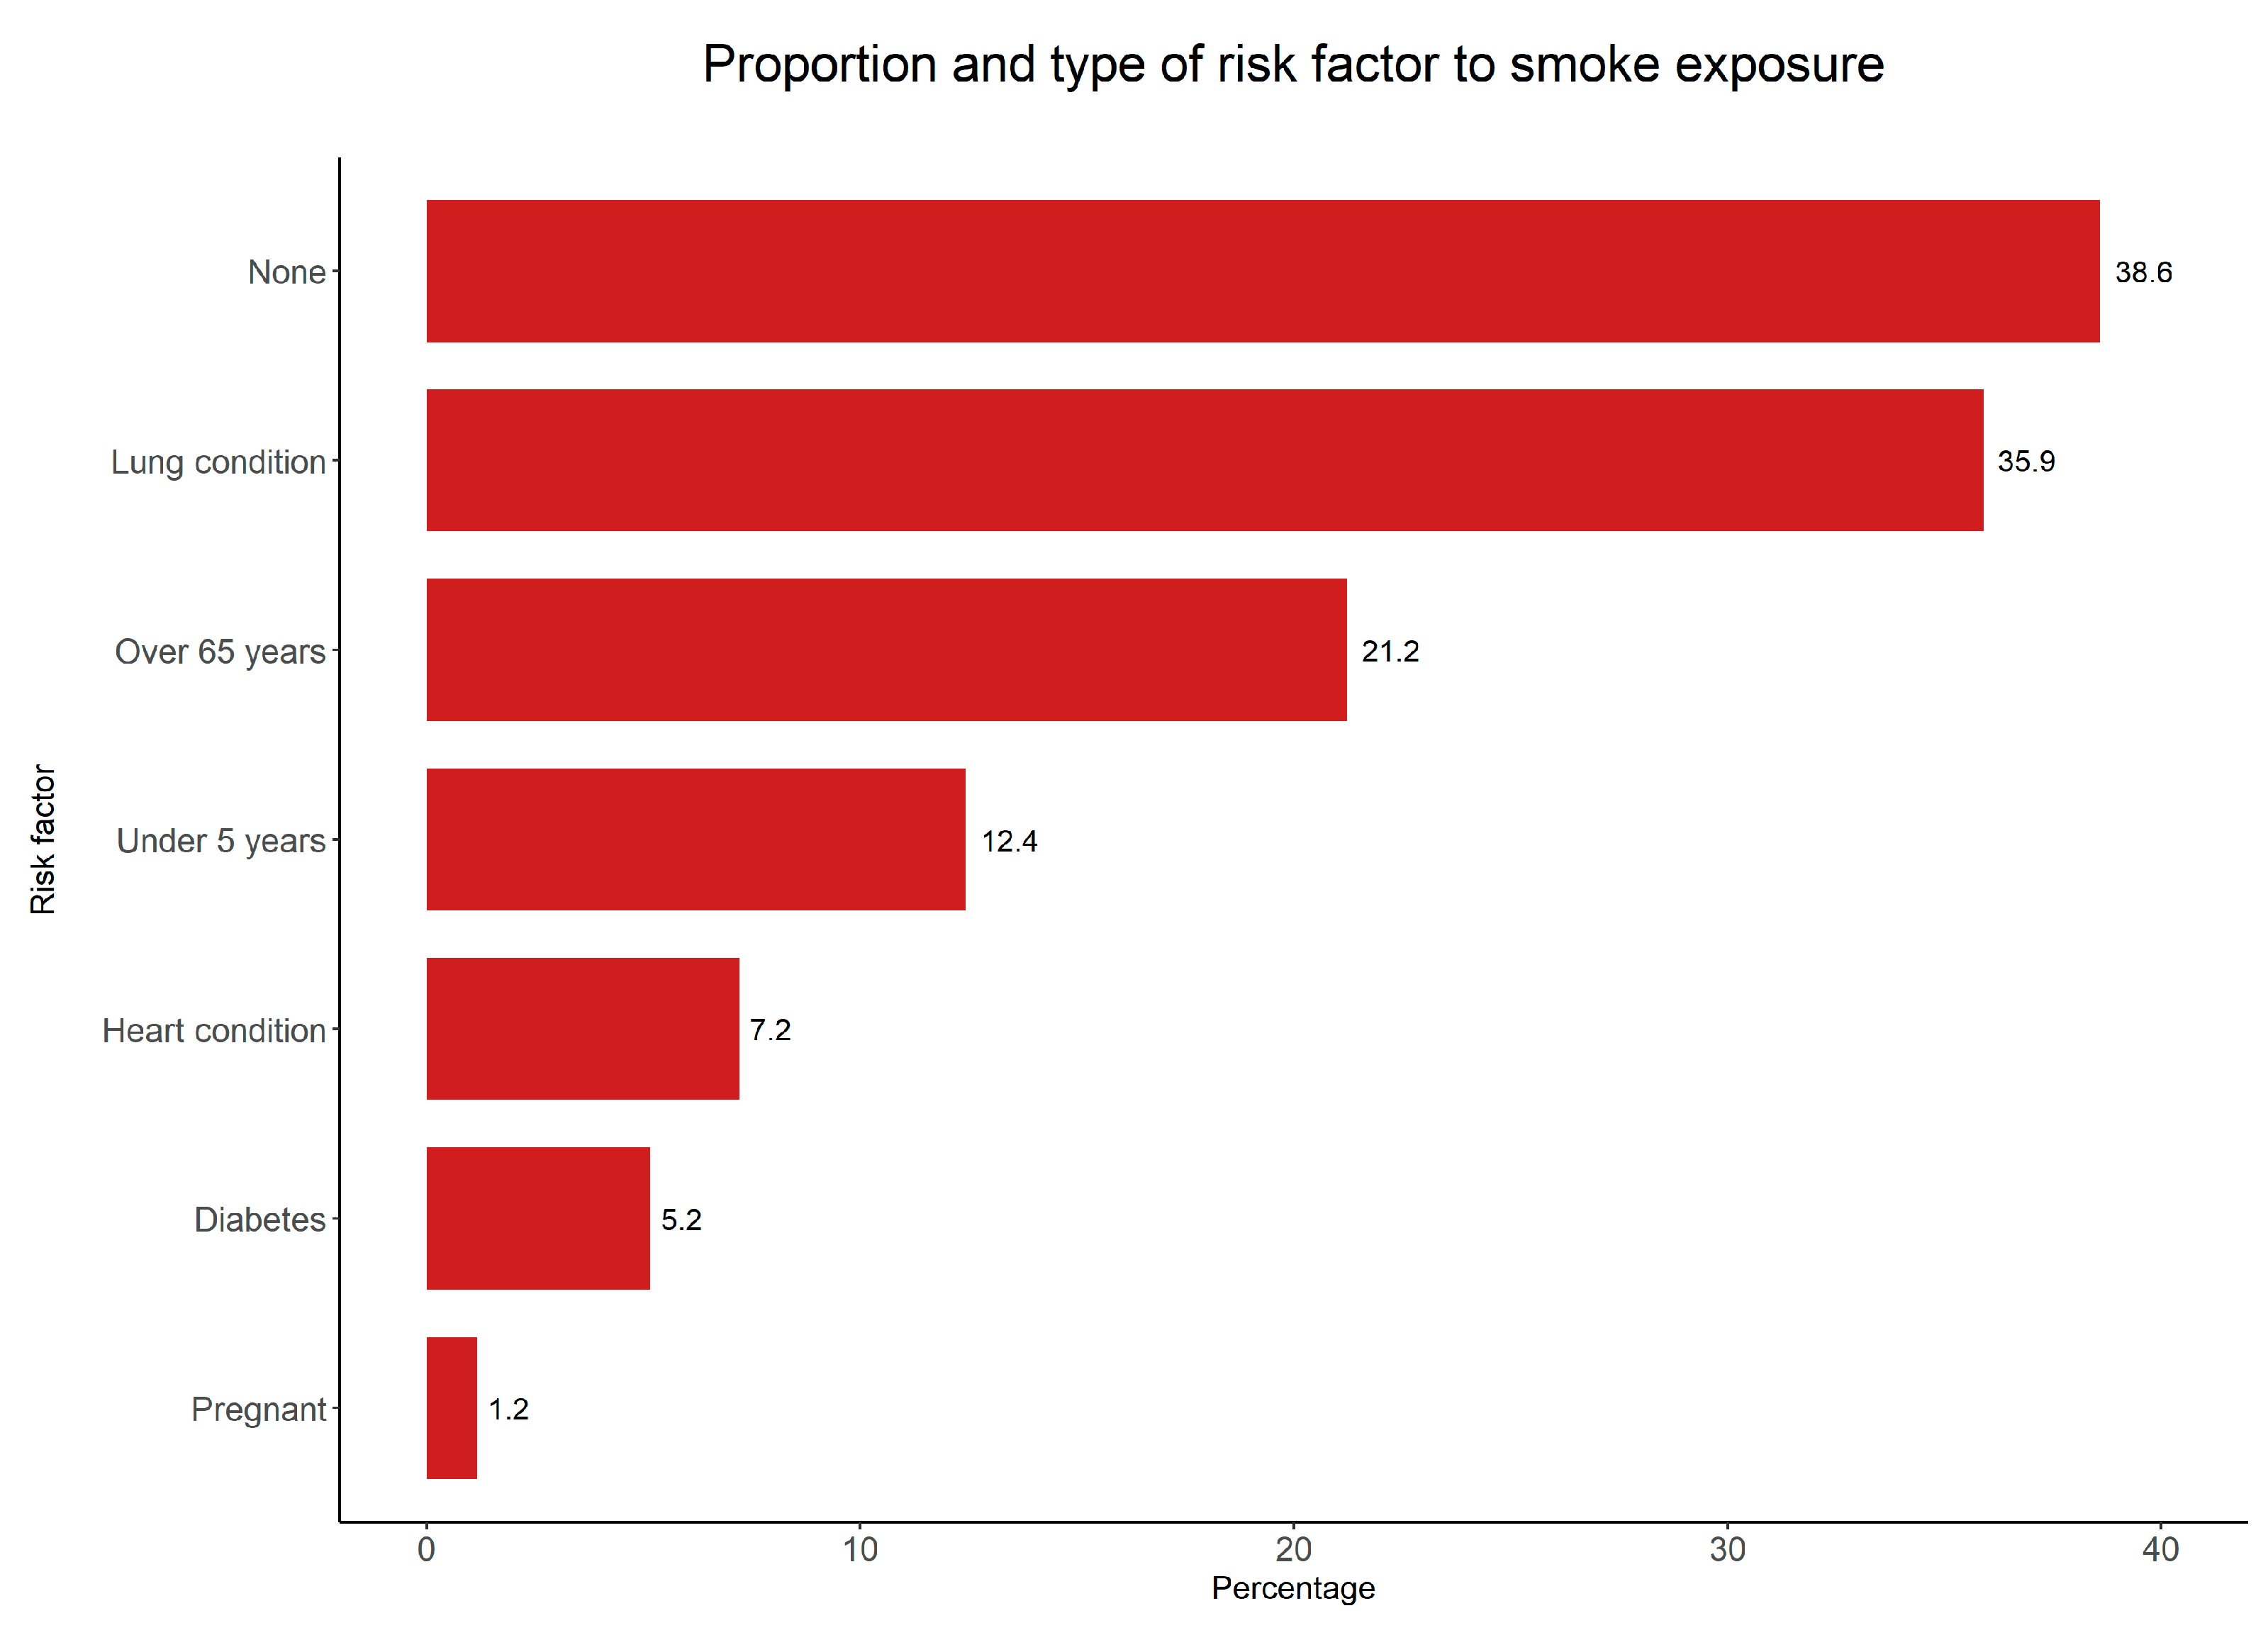
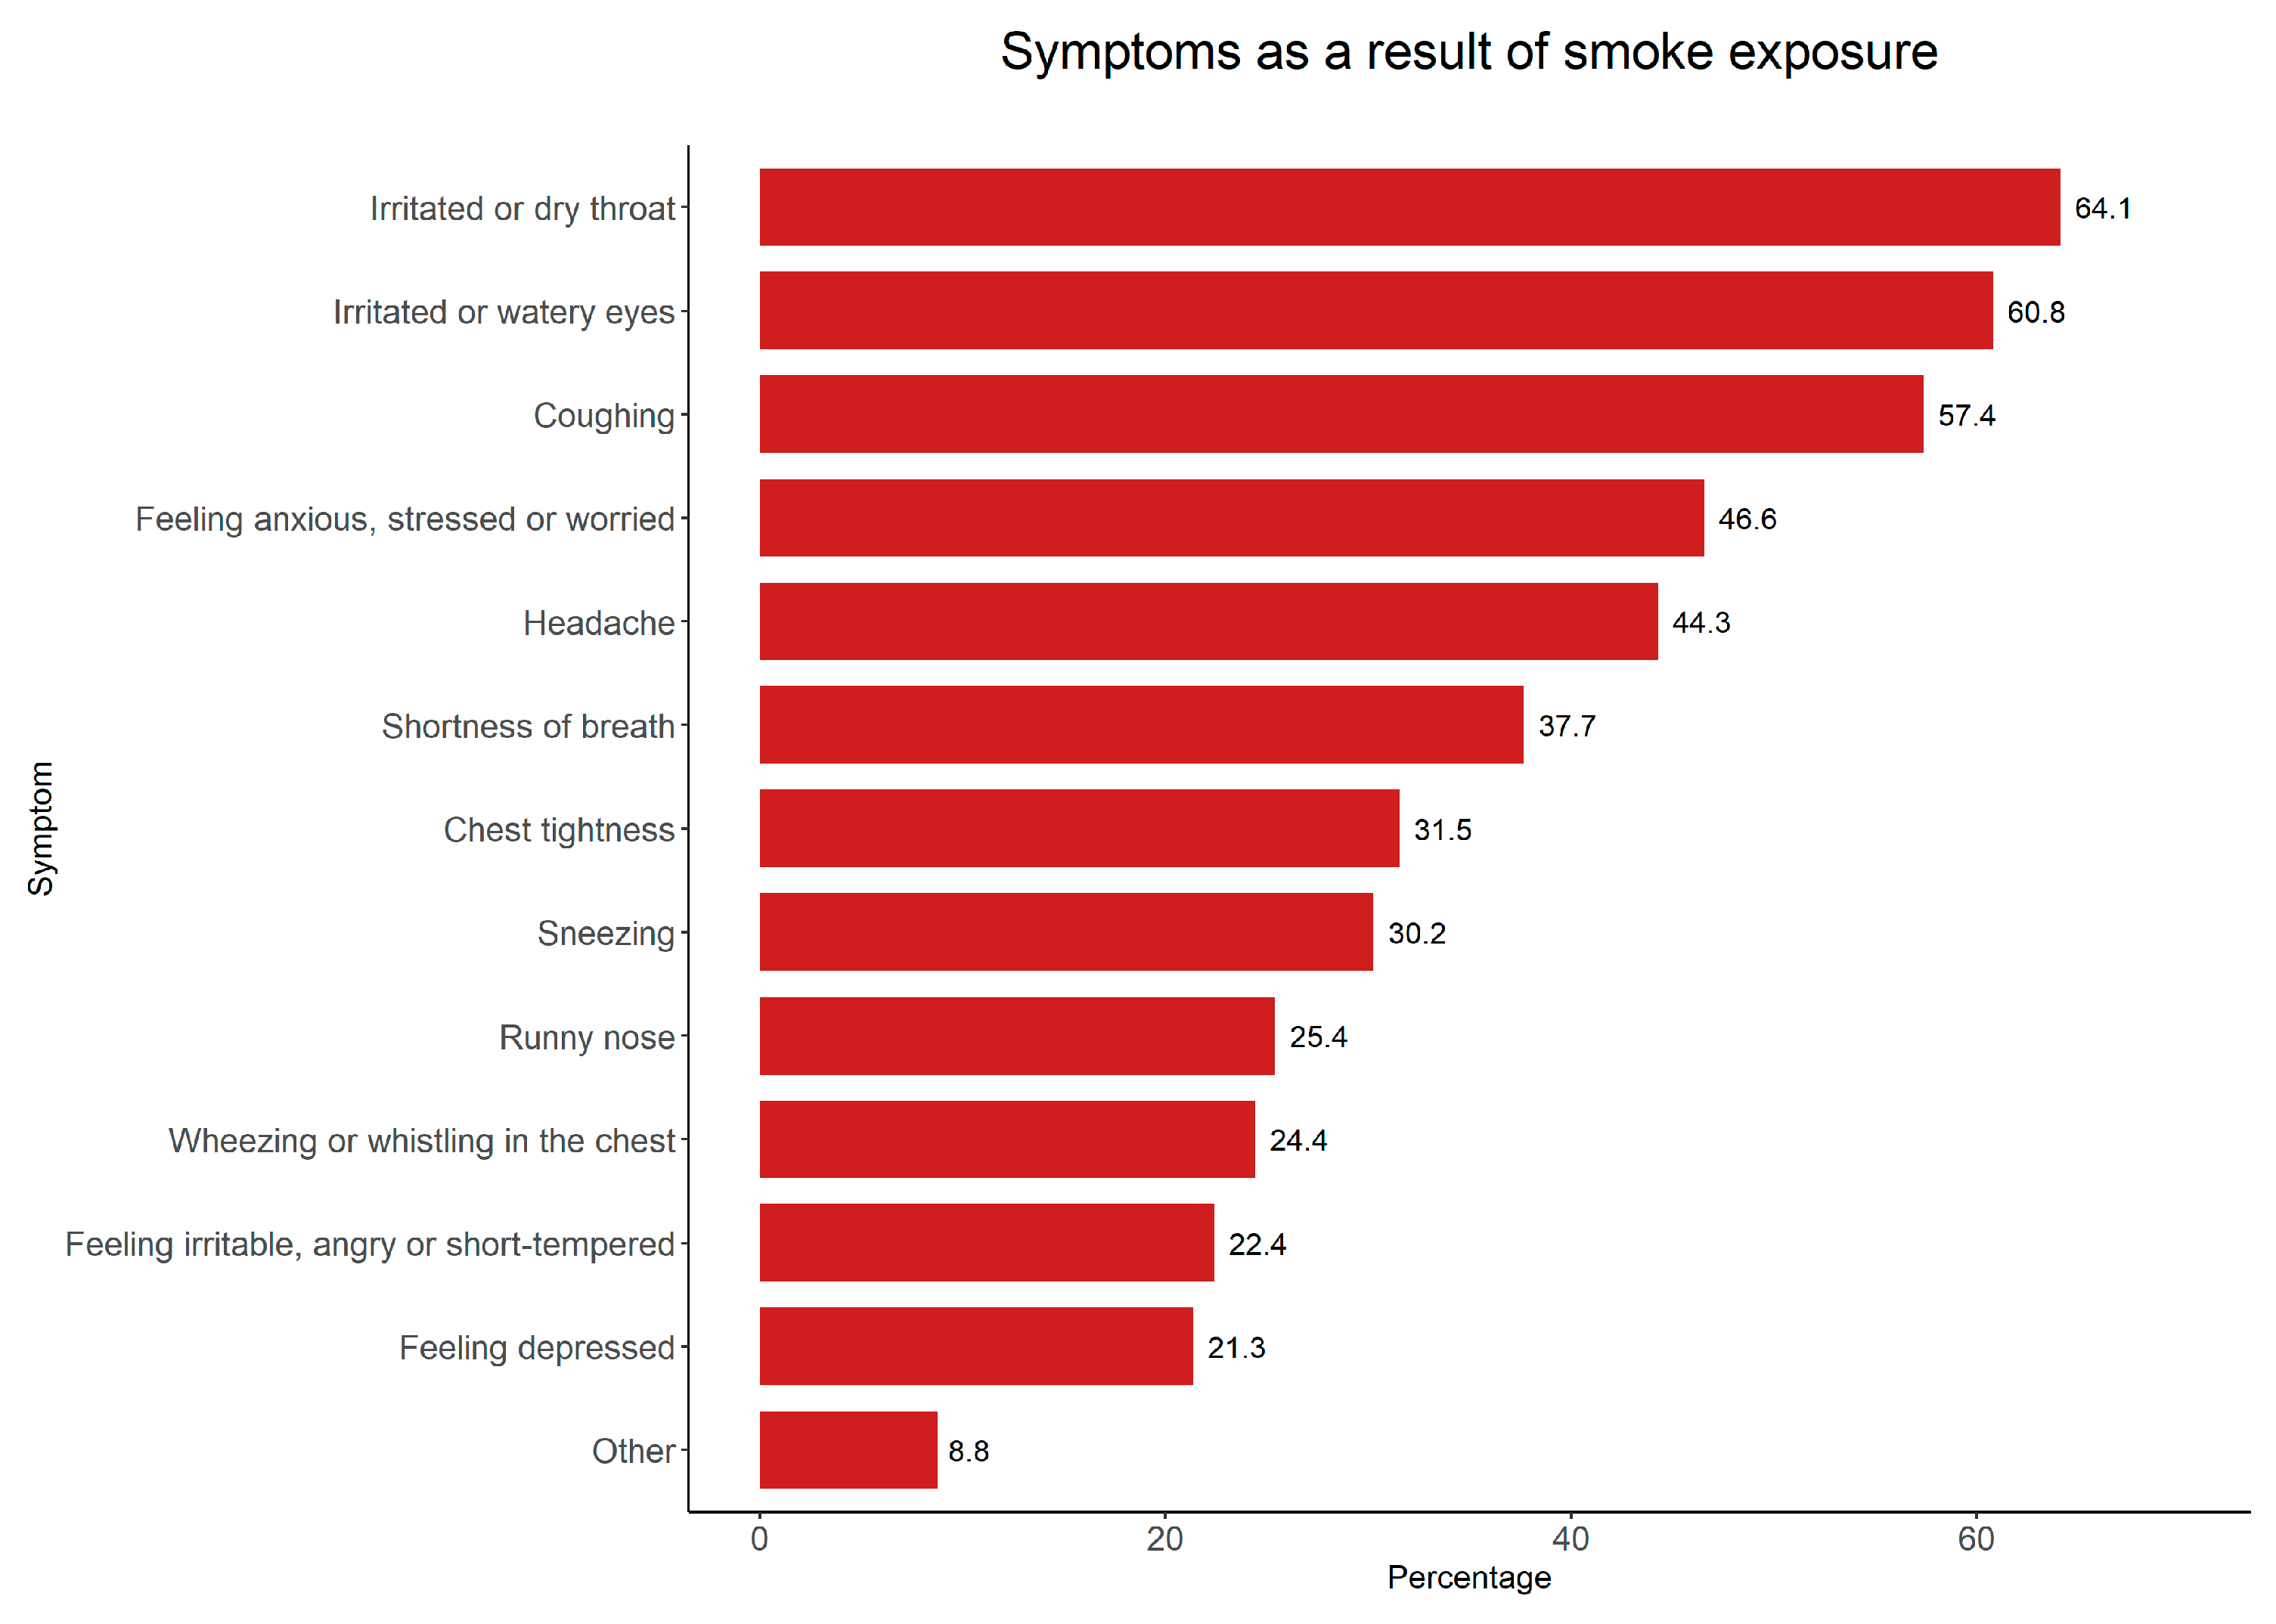
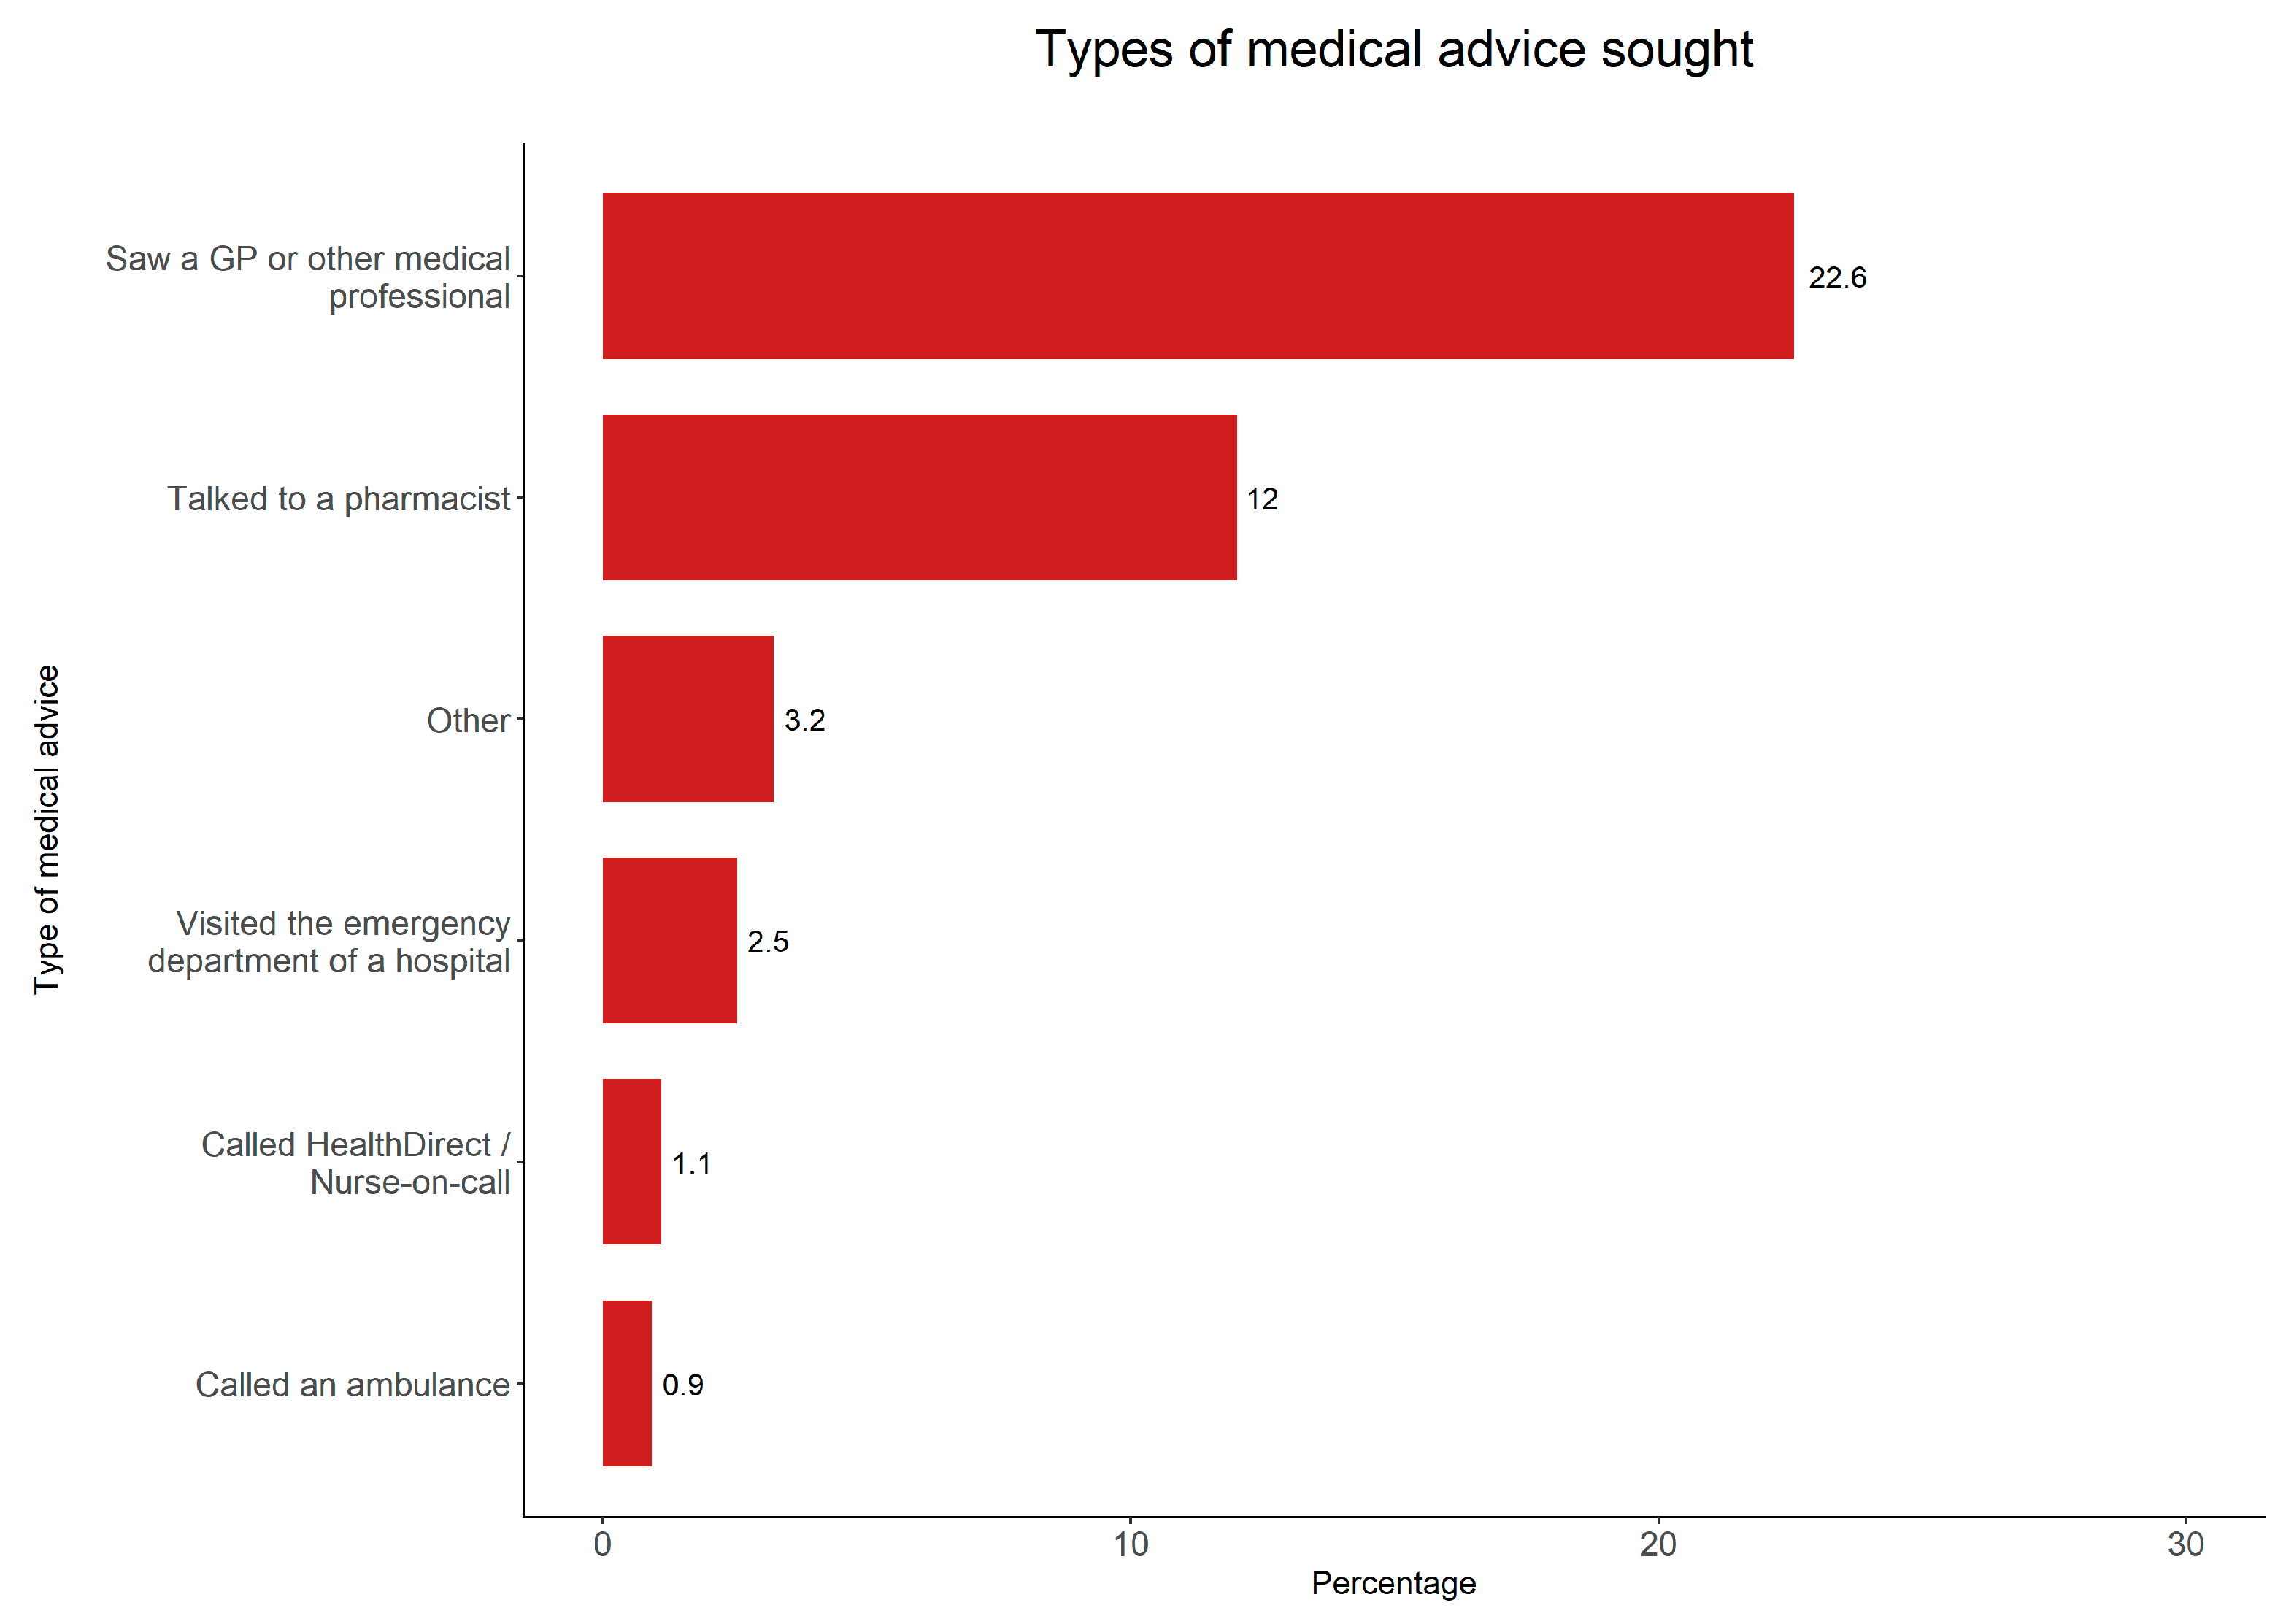
3.1. Health-Related Outcomes
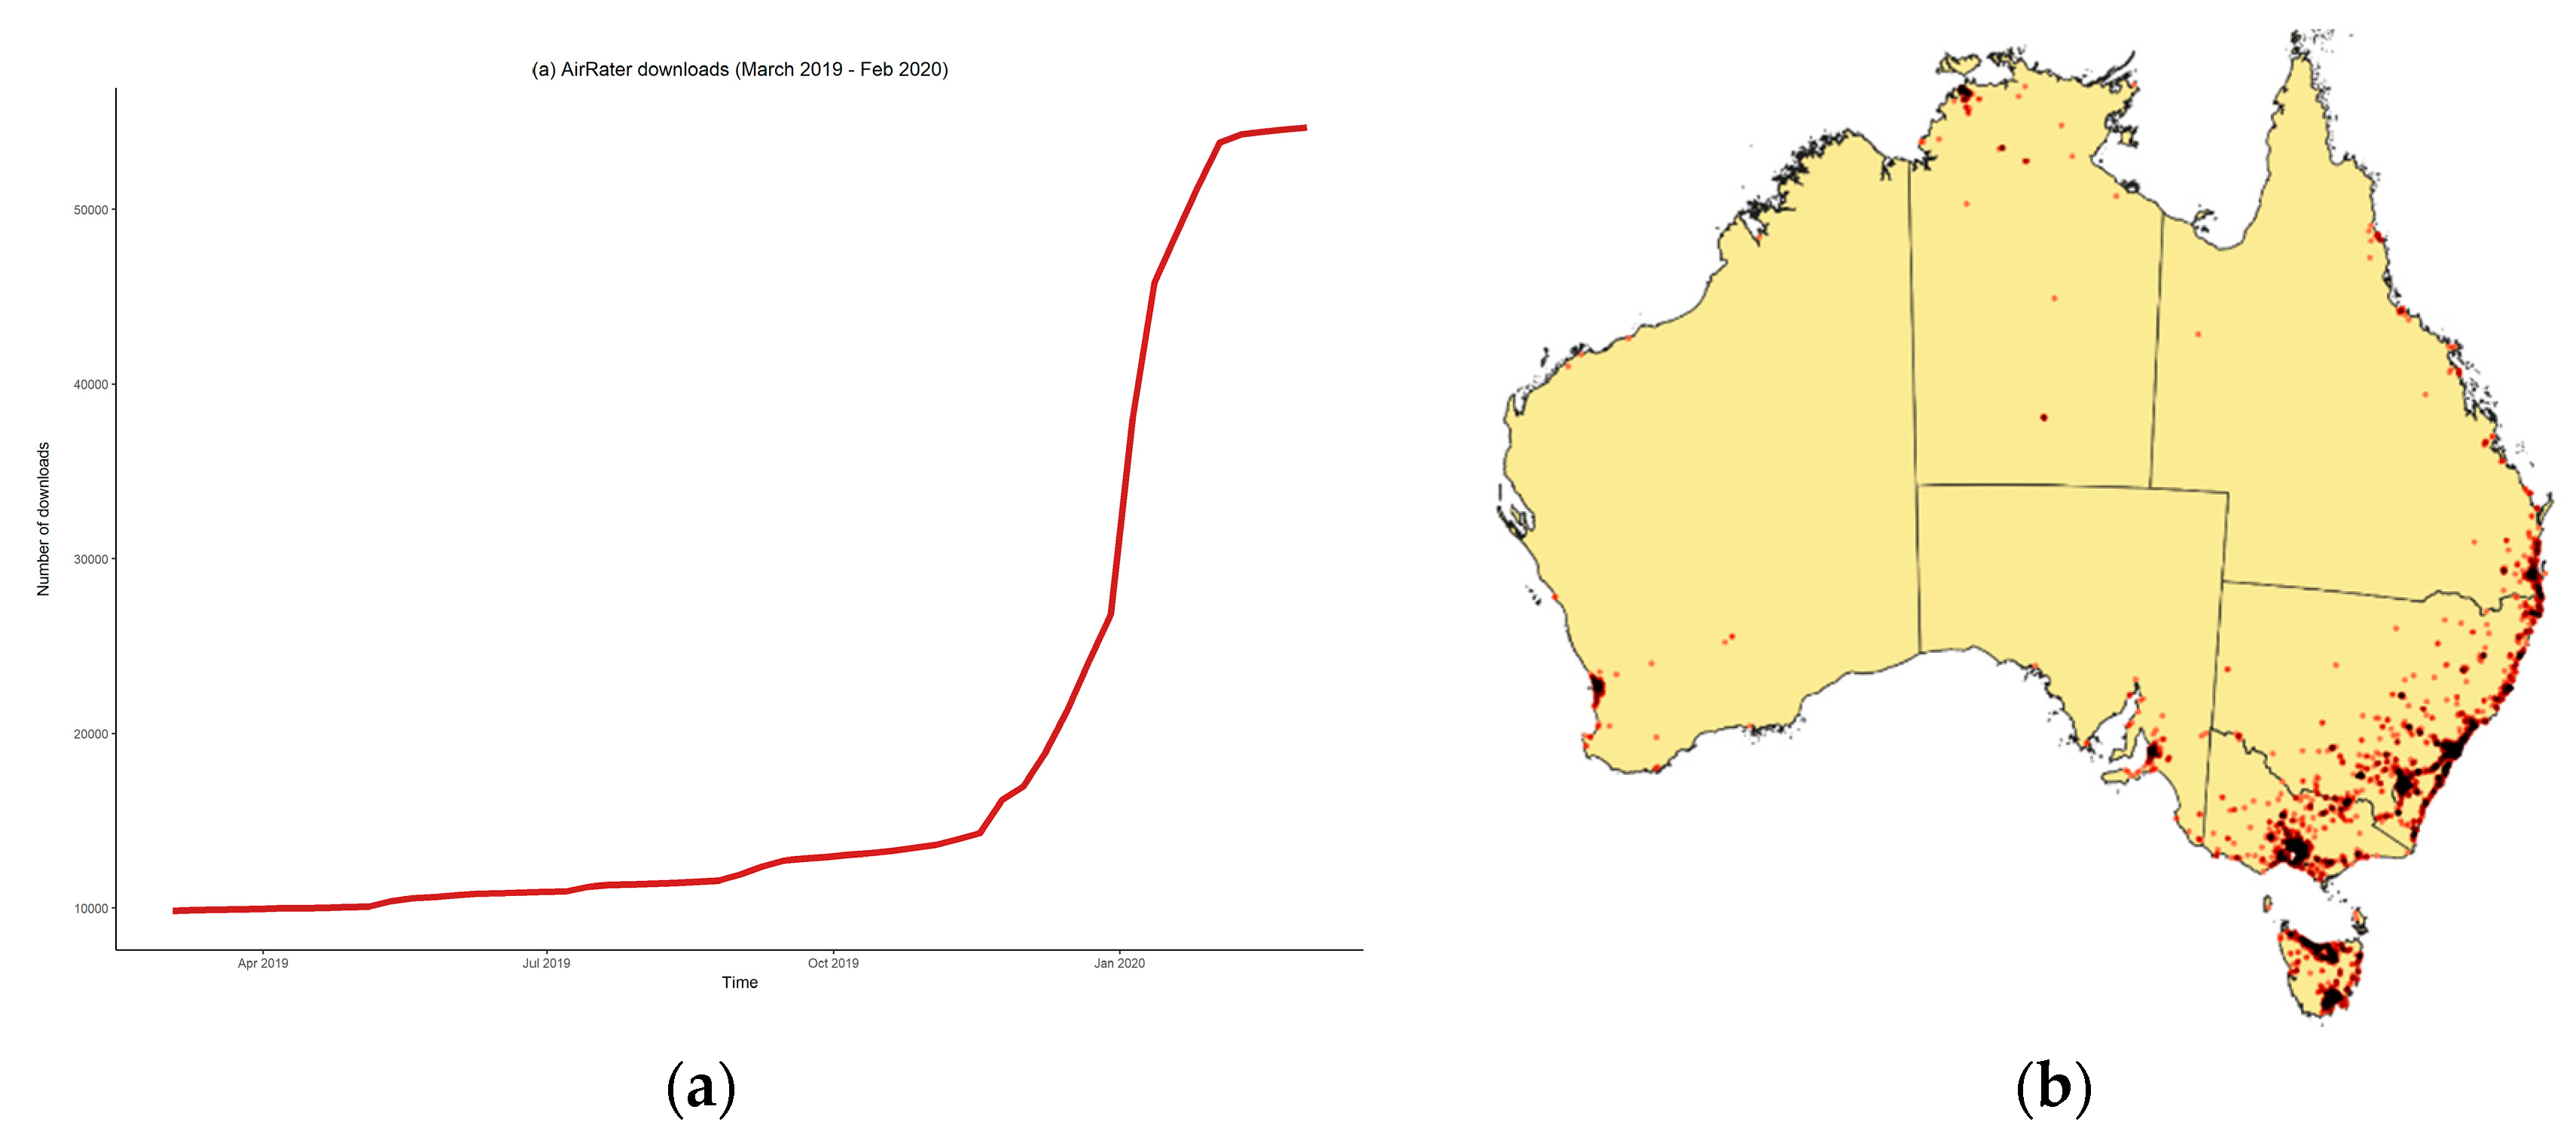
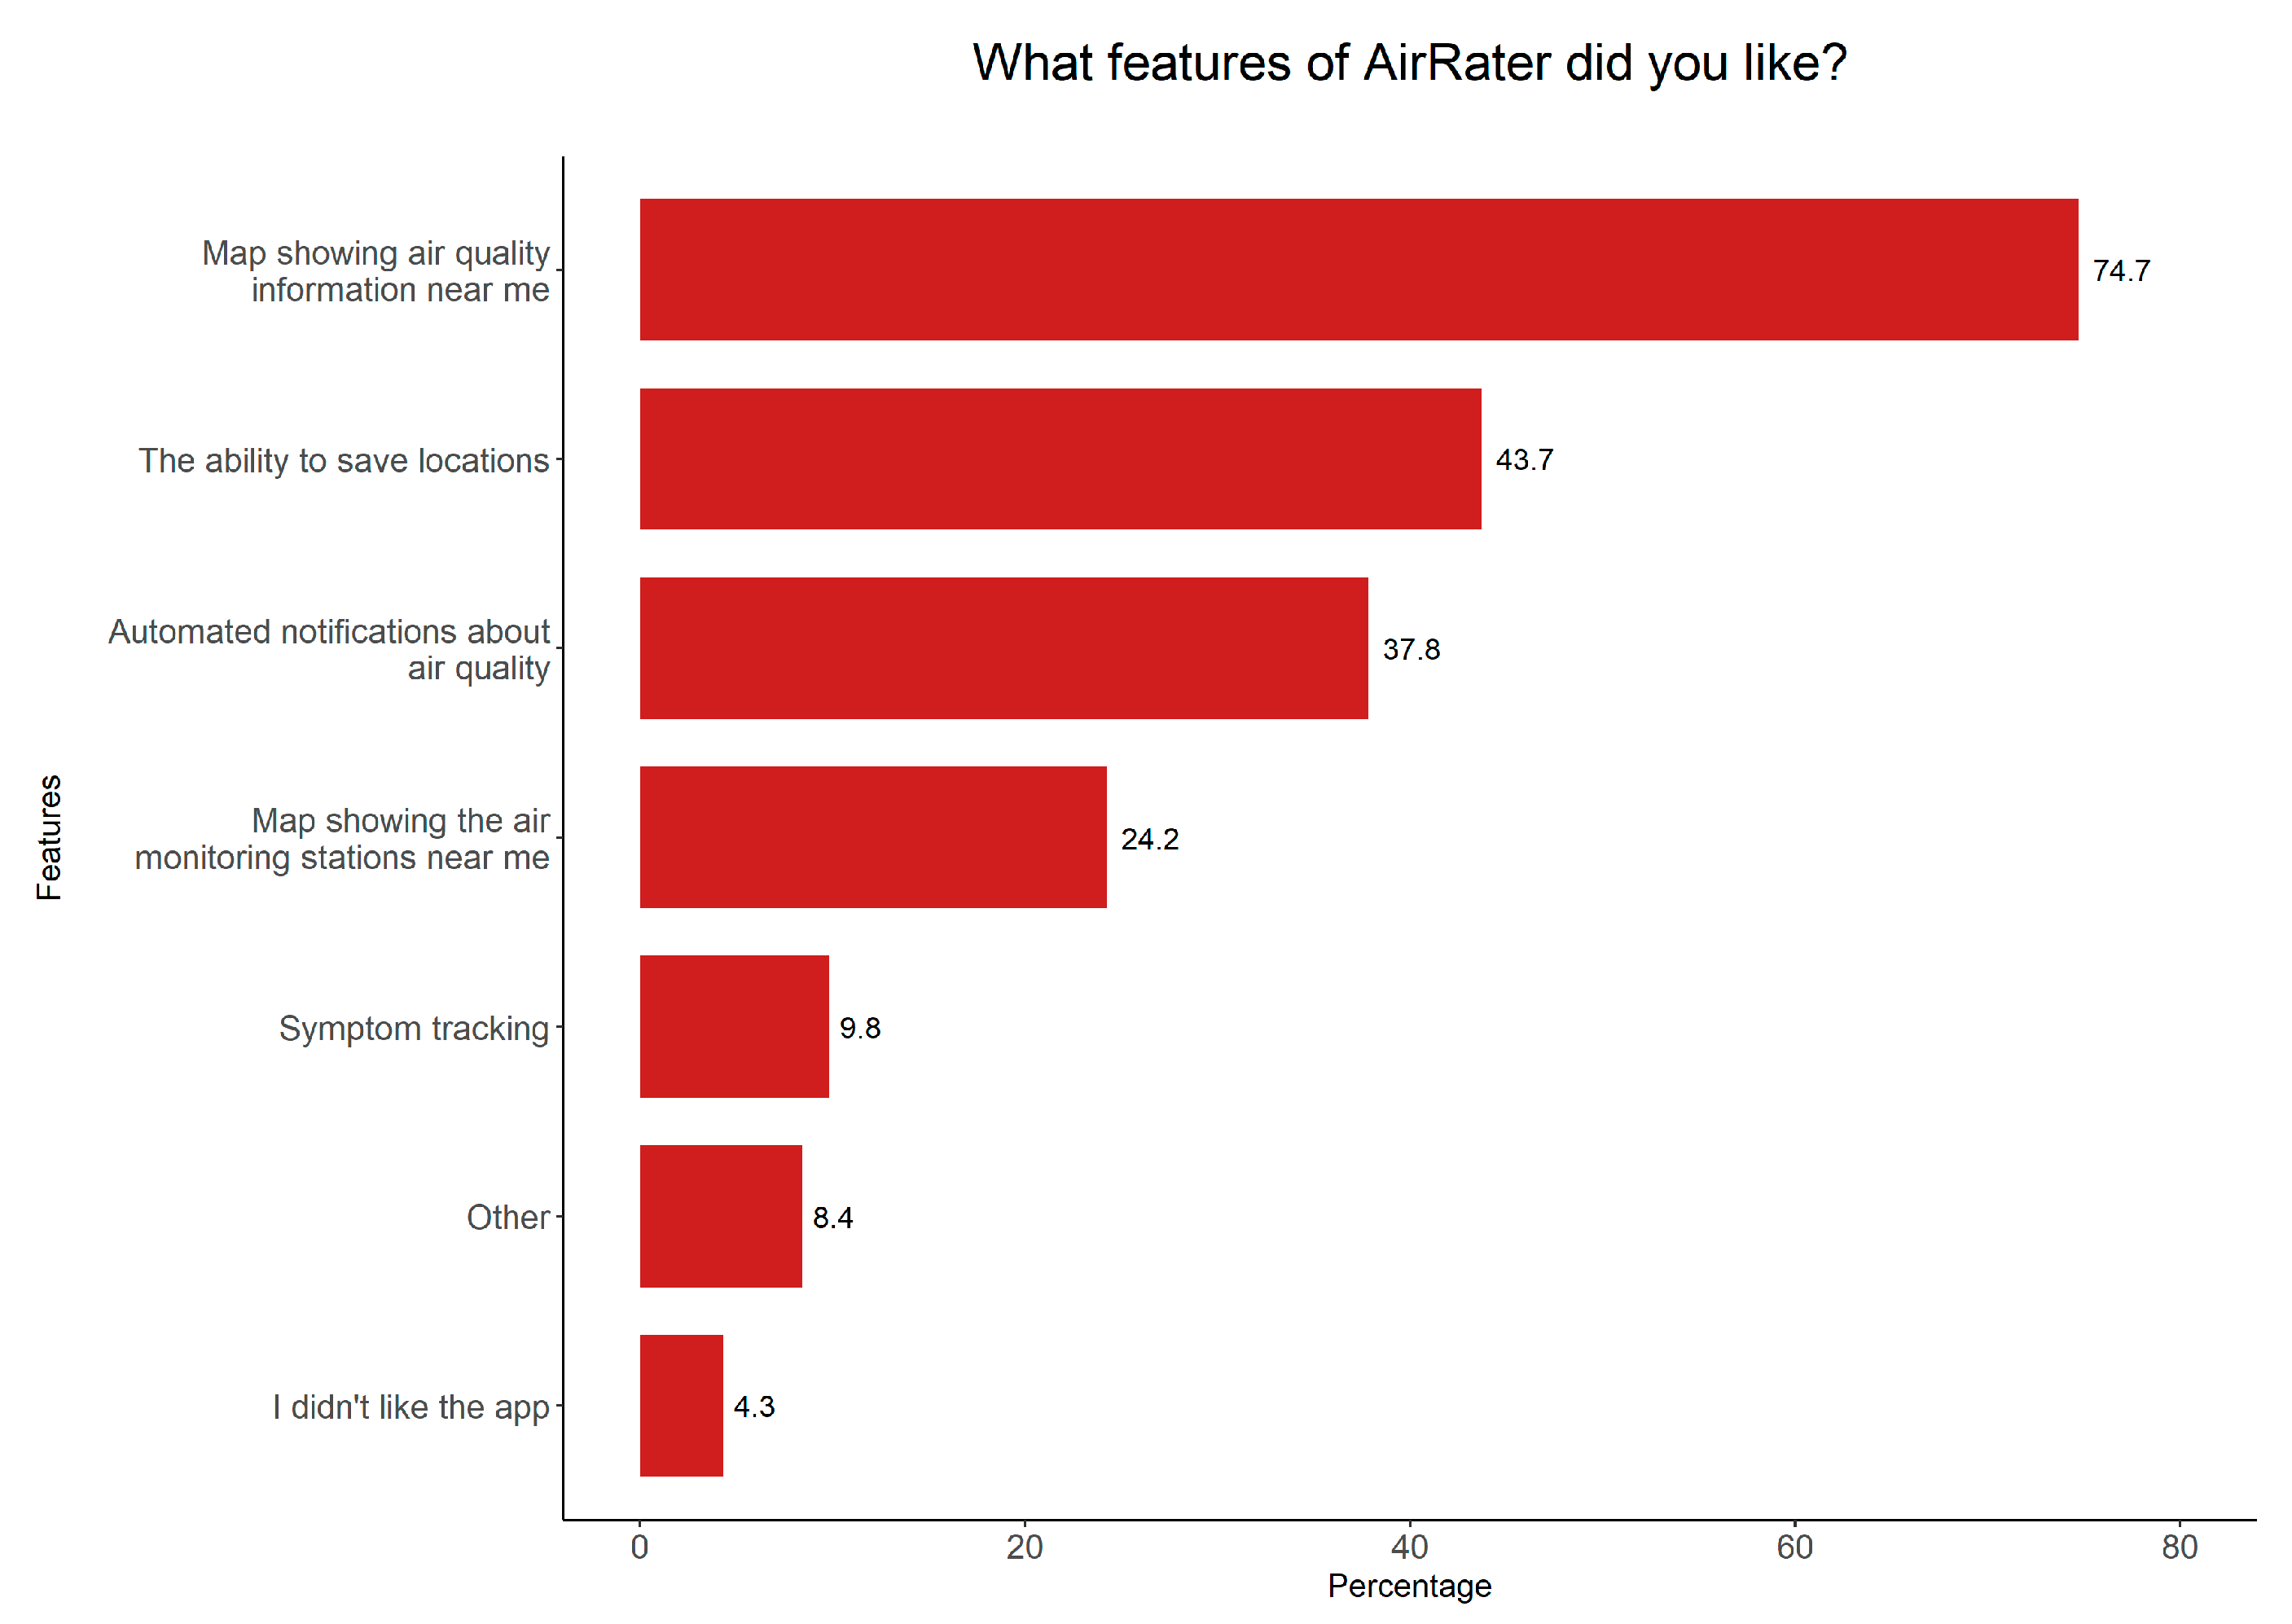
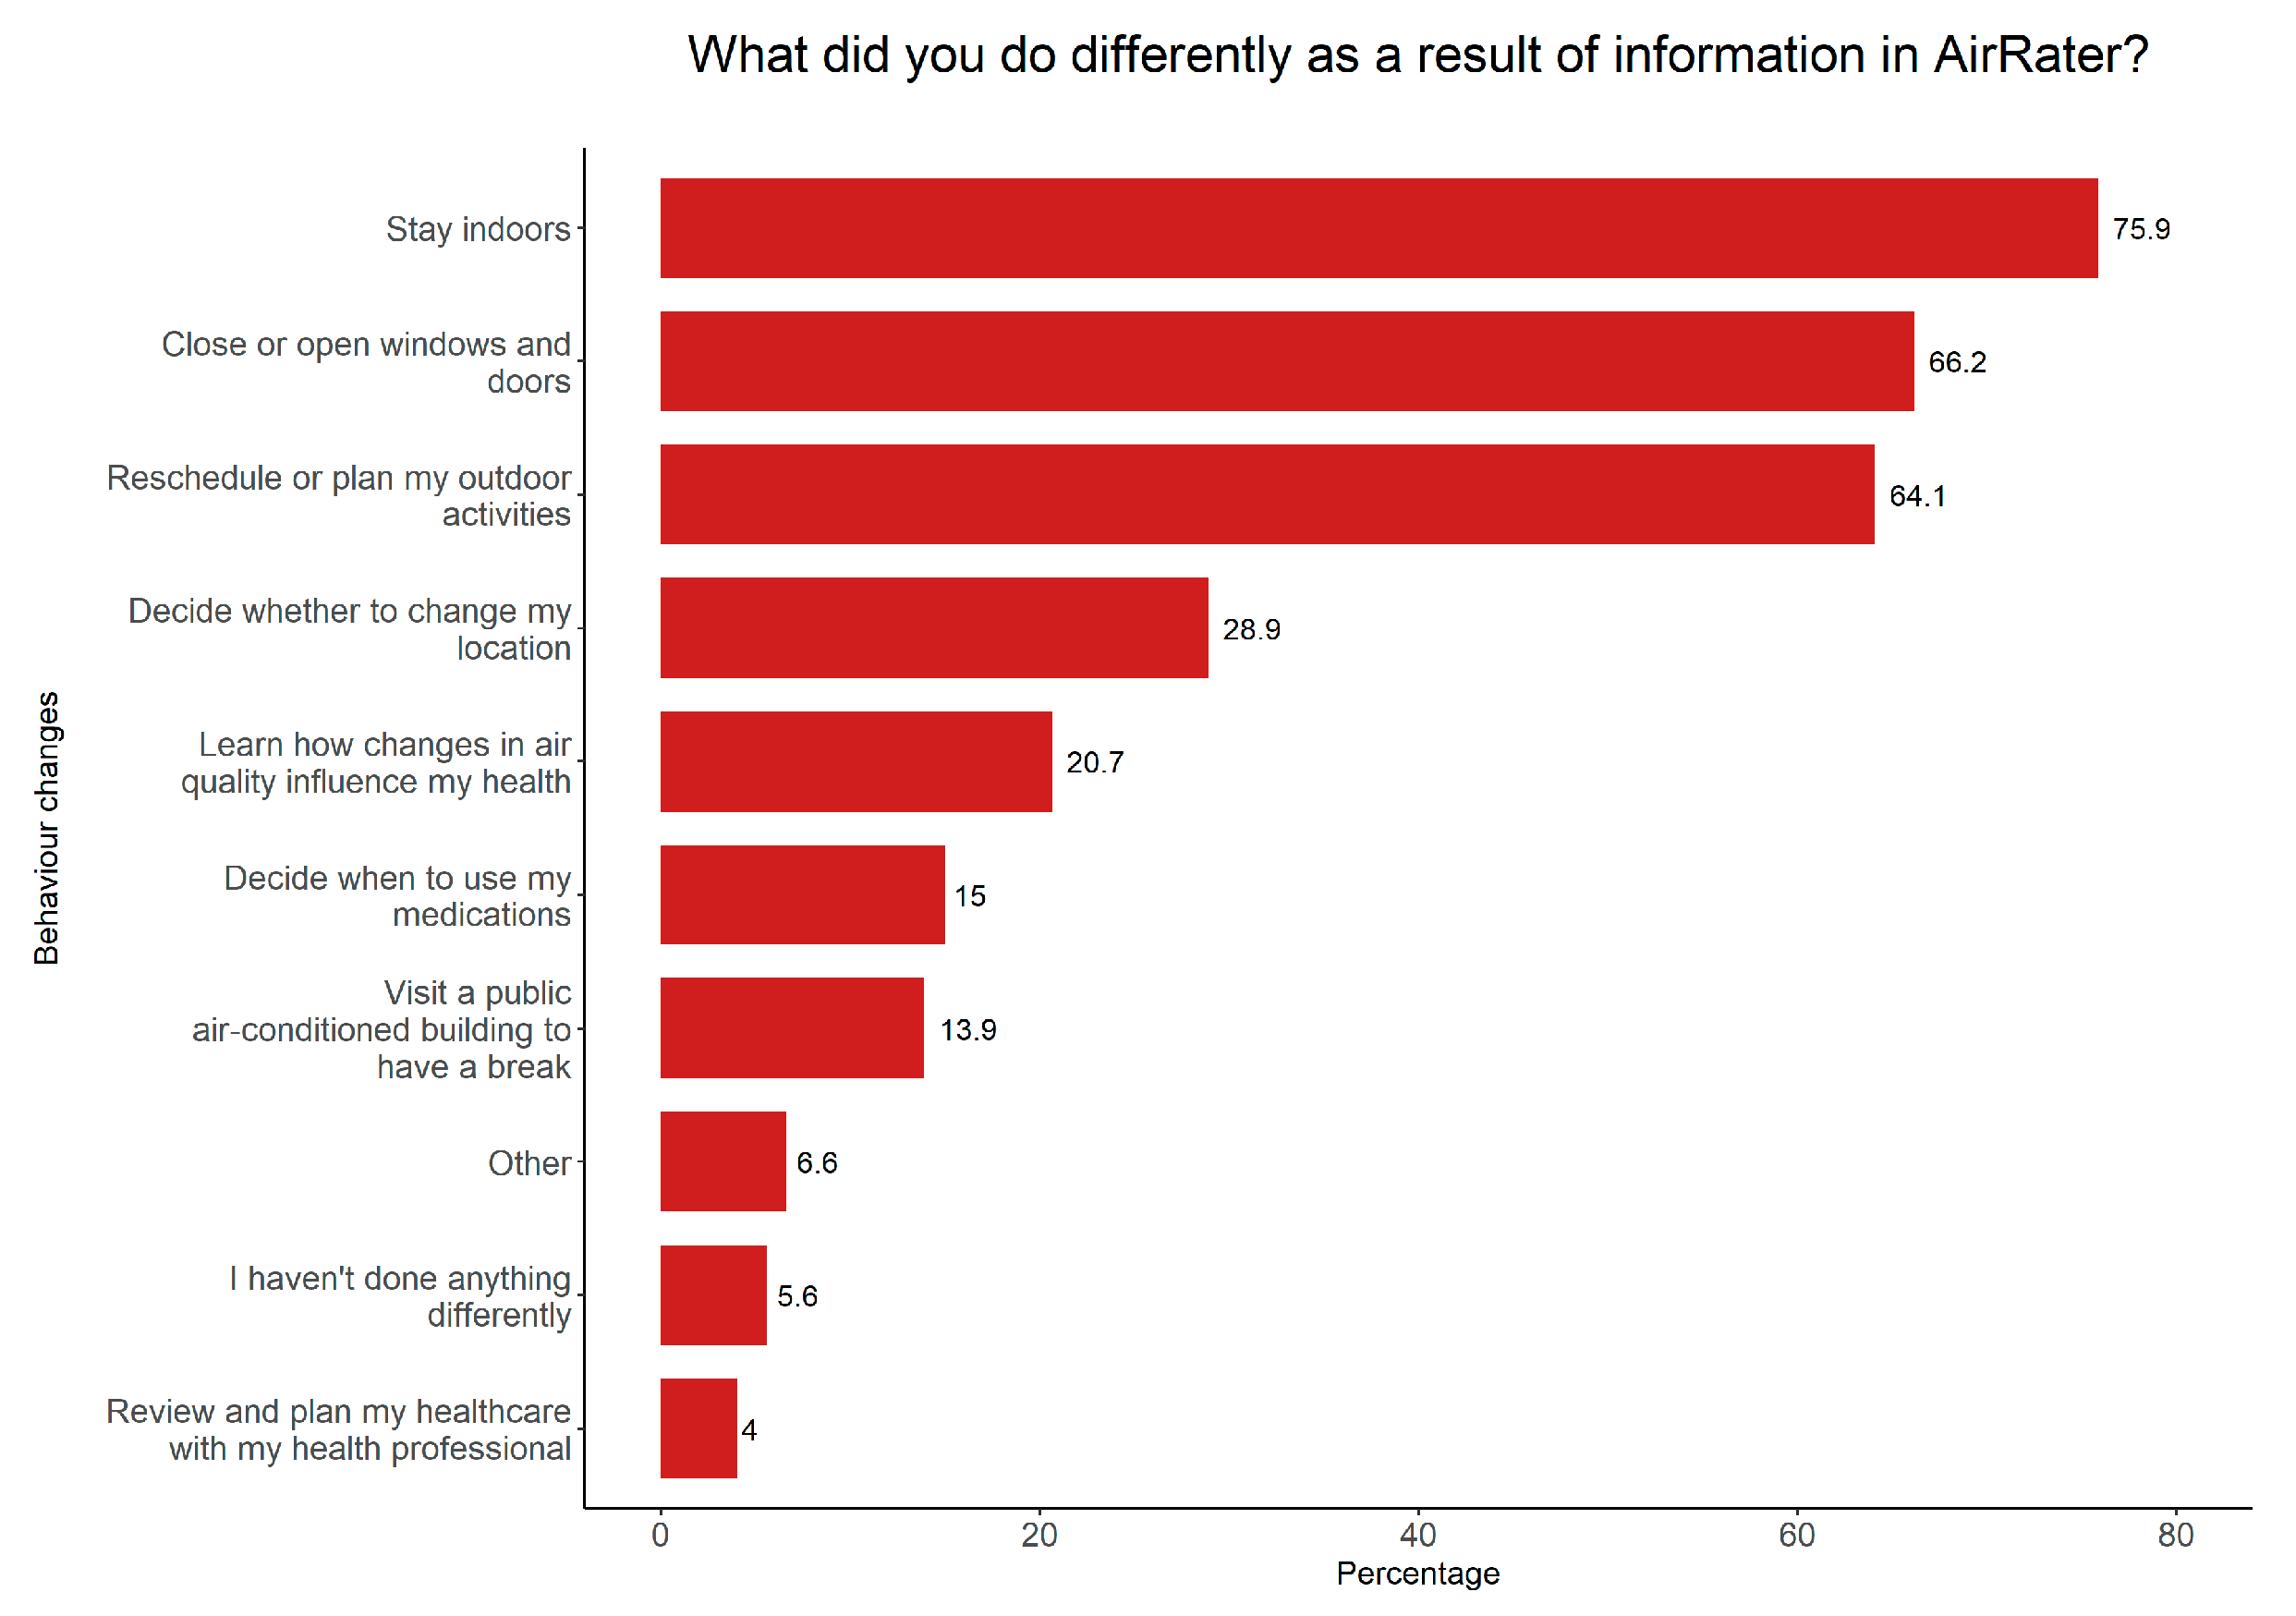
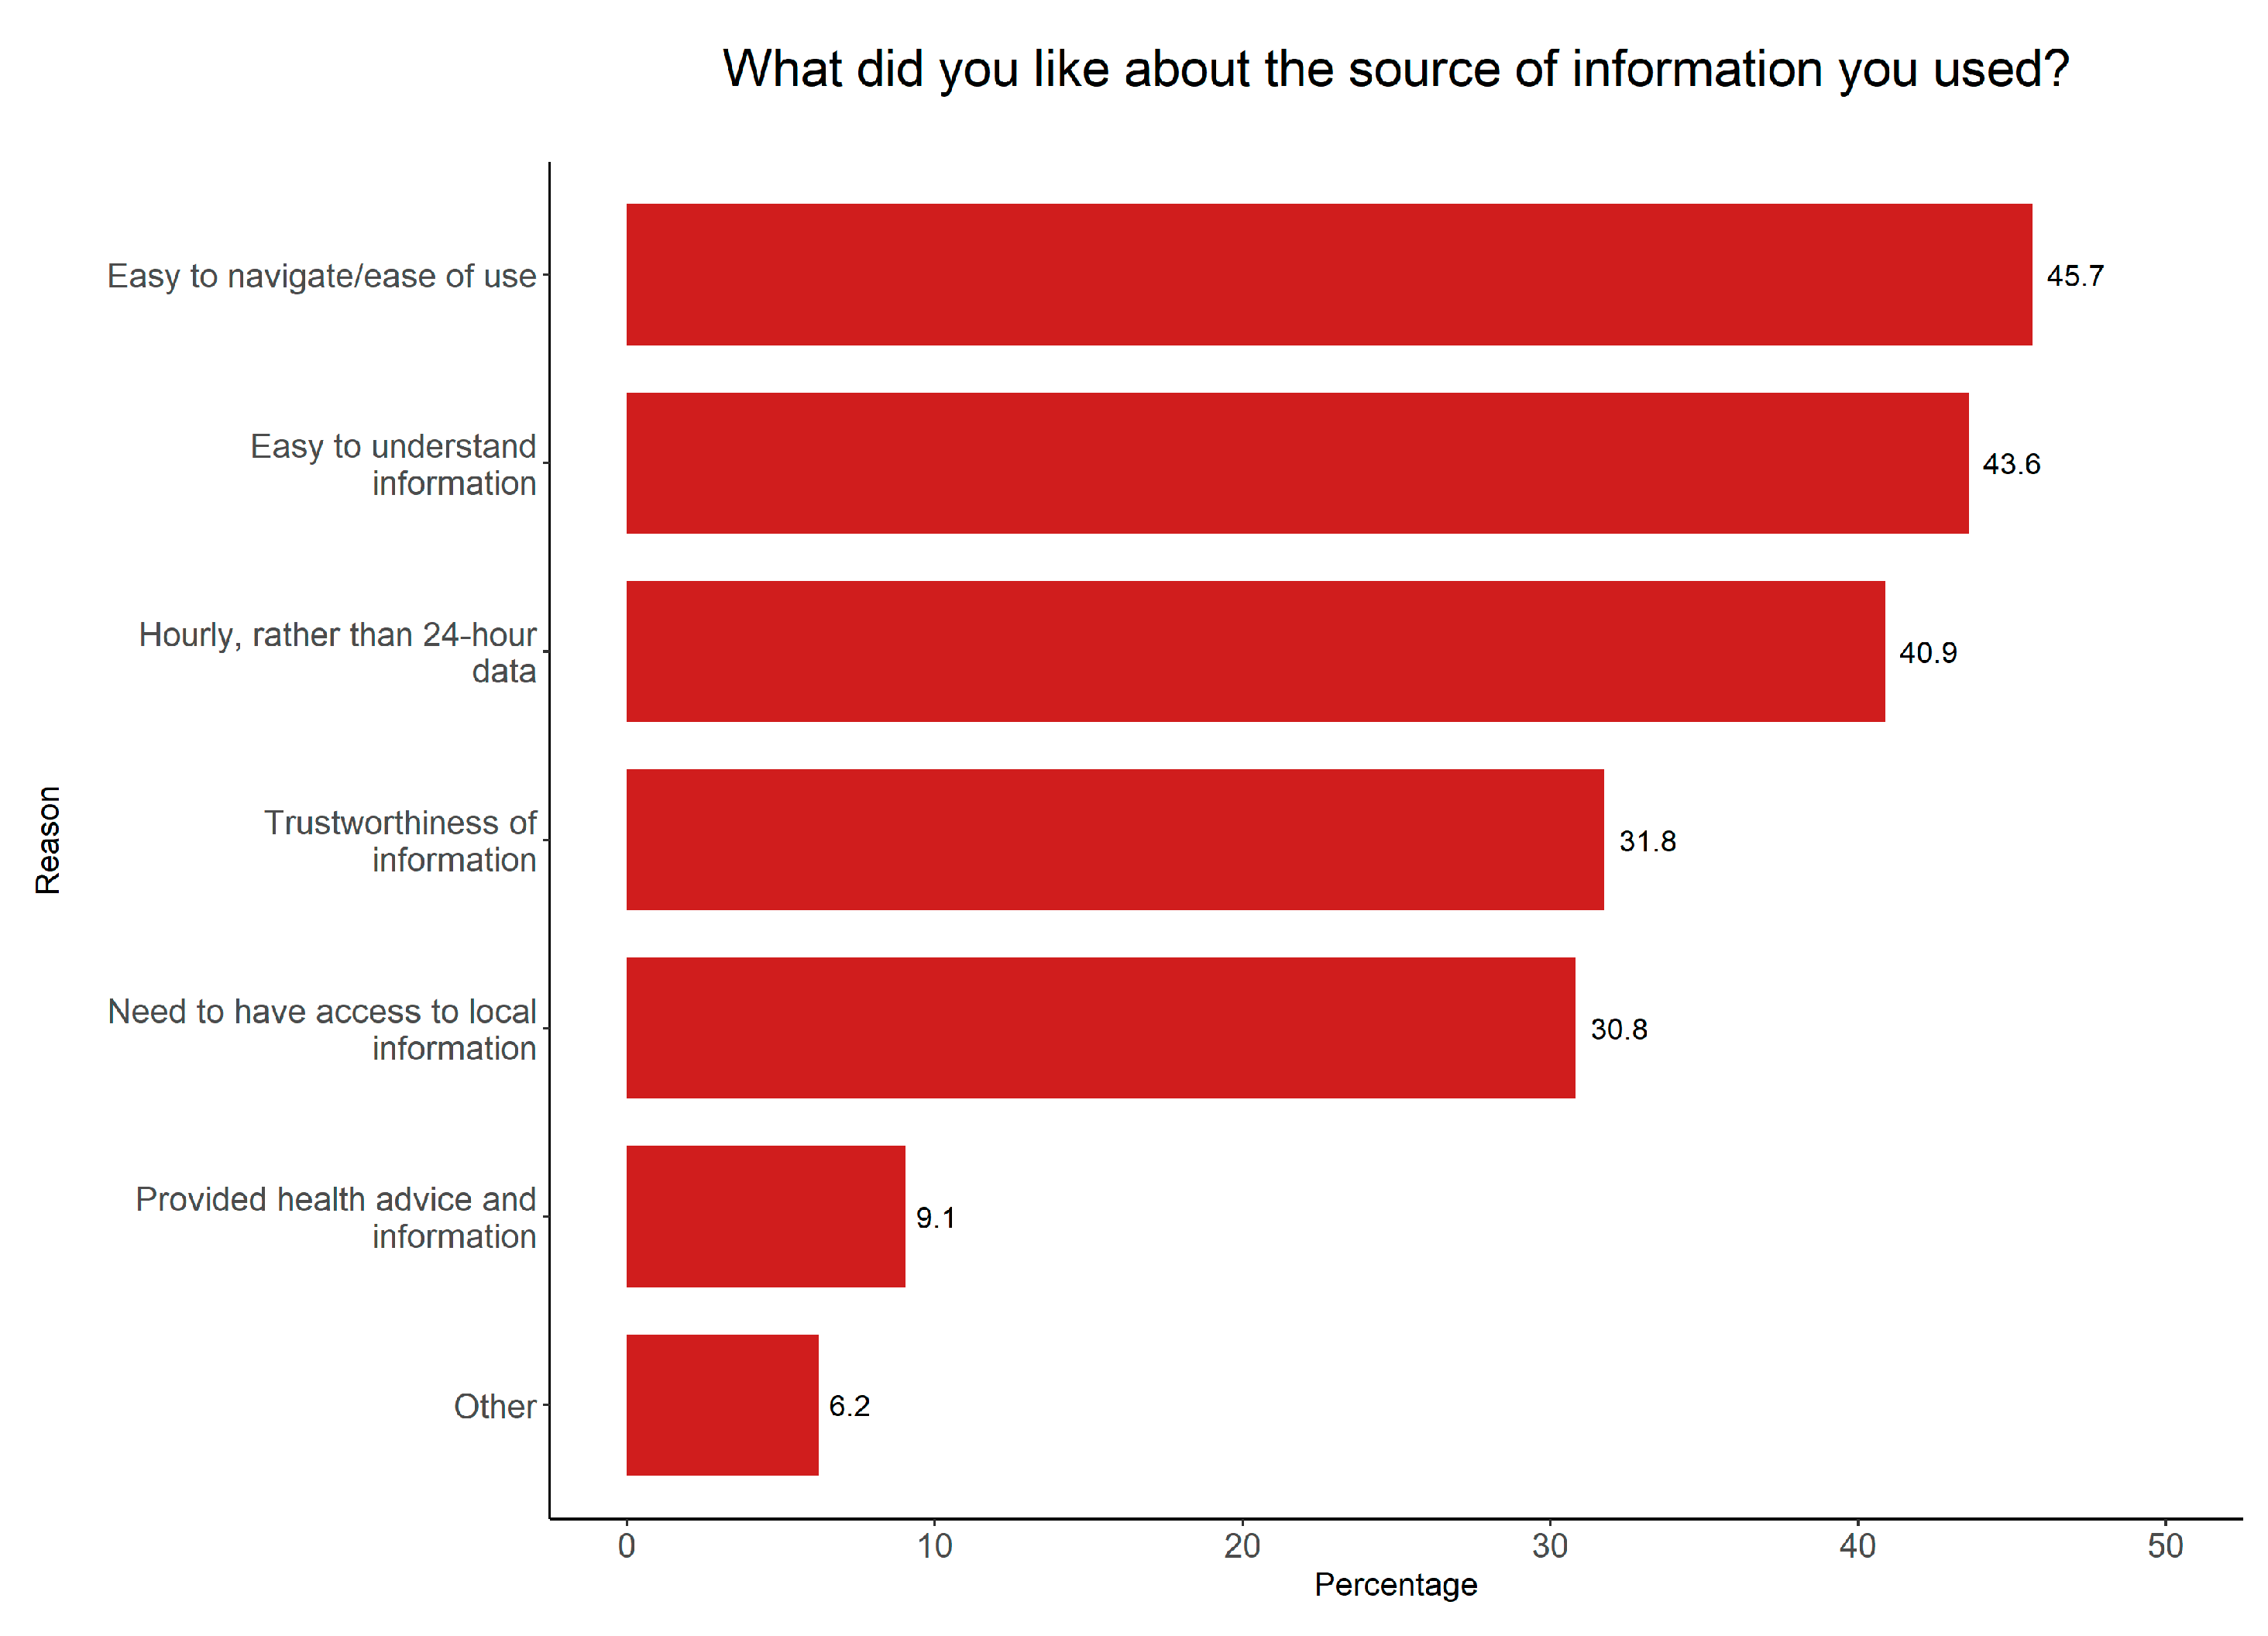
3.2. AirRater Use
4. Discussion and Conclusions
Supplementary Materials
Author Contributions
Funding
Acknowledgments
Conflicts of Interest
References
- Bowman, D.M.J.S.; Williamson, G.J.; Abatzoglou, J.T.; Kolden, C.A.; Cochrane, M.A.; Smith, A.M.S. Human exposure and sensitivity to globally extreme wildfire events. Nat. Ecol. Evol. 2017, 1, 0058. [Google Scholar] [CrossRef] [PubMed]
- Johnston, F.H.; Henderson, S.B.; Chen, Y.; Randerson, J.T.; Marlier, M.; DeFries, R.S.; Kinney, P.; Bowman, D.M.J.S.; Brauer, M. Estimated Global Mortality Attributable to Smoke from Landscape Fires. Environ. Health Perspect. 2012, 120, 695–701. [Google Scholar] [CrossRef] [PubMed]
- Dowdy, A.J.; Mills, G.A. Atmospheric States Associated with the Ignition of Lightning-Attributed Fires; The Centre for Australian Weather and Climate Research: Melbourne, Victoria, Australia, 2009. [Google Scholar]
- Nolan, R.H.; Boer, M.M.; Collins, L.; Resco de Dios, V.; Clarke, H.; Jenkins, M.; Kenny, B.; Bradstock, R.A. Causes and consequences of eastern Australia’s 2019–20 season of mega-fires. Glob. Chang. Biol. 2020, 26, 1039–1041. [Google Scholar] [CrossRef] [PubMed] [Green Version]
- Clarke, H.; Evans, J.P. Exploring the future change space for fire weather in southeast Australia. Theor. Appl. Climatol. 2019, 136, 513–527. [Google Scholar] [CrossRef] [Green Version]
- Intergovernmental Panel on Climate Change. Climate Change and Land: An IPCC Special Report on Climate Change, Desertification, Land Degradation, Sustainable Land Management, Food Security, and Greenhouse Gas Fluxes in Terrestrial Ecosystems. Available online: www.ipcc.ch/srccl/ (accessed on 23 May 2020).
- Leibel, S.; Nguyen, M.; Brick, W.; Parker, J.; Ilango, S.; Aguilera, R.; Gershunov, A.; Benmarhnia, T. Increase in Pediatric Respiratory Visits Associated with Santa Ana Wind–Driven Wildfire Smoke and PM2.5 Levels in San Diego County. Ann. Am. Thorac. Soc. 2020, 17, 313–320. [Google Scholar] [CrossRef]
- Morgan, G.; Sheppeard, V.; Khalaj, B.; Ayyar, A.; Lincoln, D.; Jalaludin, B.; Beard, J.; Corbett, S.; Lumley, T. Effects of Bushfire Smoke on Daily Mortality and Hospital Admissions in Sydney, Australia. Epidemiology 2010, 21, 47–55. [Google Scholar] [CrossRef]
- Borchers Arriagada, N.; Horsley, J.A.; Palmer, A.J.; Morgan, G.G.; Tham, R.; Johnston, F.H. Association between fire smoke fine particulate matter and asthma-related outcomes: Systematic review and meta-analysis. Environ. Res 2019, 179, 108777. [Google Scholar] [CrossRef]
- Cascio, W.E. Wildland fire smoke and human health. Sci. Total Environ. 2018, 624, 586–595. [Google Scholar] [CrossRef]
- Hystad, P.; Larkin, A.; Rangarajan, S.; AlHabib, K.F.; Avezum, Á.; Calik, K.B.T.; Chifamba, J.; Dans, A.; Diaz, R.; du Plessis, J.L.; et al. Associations of outdoor fine particulate air pollution and cardiovascular disease in 157 436 individuals from 21 high-income, middle-income, and low-income countries (PURE): A prospective cohort study. Lancet Planet. Health 2020, 4, e235–e245. [Google Scholar] [CrossRef]
- Pope, C.A.; Brook, R.D.; Burnett, R.T.; Dockery, D.W. How is cardiovascular disease mortality risk affected by duration and intensity of fine particulate matter exposure? An integration of the epidemiologic evidence. Air Qual. Atmos. Health 2011, 4, 5–14. [Google Scholar] [CrossRef]
- Doubleday, A.; Schulte, J.; Sheppard, L.; Kadlec, M.; Dhammapala, R.; Fox, J.; Busch Isaksen, T. Mortality associated with wildfire smoke exposure in Washington state, 2006–2017: A case-crossover study. Environ. Health 2020, 19, 4. [Google Scholar] [CrossRef] [PubMed] [Green Version]
- Shaposhnikov, D.; Revich, B.; Bellander, T.; Bedada, G.B.; Bottai, M.; Kharkova, T.; Kvasha, E.; Lezina, E.; Lind, T.; Semutnikova, E.; et al. Mortality Related to Air Pollution with the Moscow Heat Wave and Wildfire of 2010. Epidemiology 2014, 25, 359–364. [Google Scholar] [CrossRef] [PubMed] [Green Version]
- Holstius, D.M.; Reid, C.E.; Jesdale, B.M.; Morello-Frosch, R. Birth weight following pregnancy during the 2003 Southern California wildfires. Environ. Health Perspect. 2012, 120, 1340–1345. [Google Scholar] [CrossRef] [PubMed]
- Melody, S.M.; Ford, J.B.; Wills, K.; Venn, A.; Johnston, F.H. Maternal exposure to fine particulate matter from a large coal mine fire is associated with gestational diabetes mellitus: A prospective cohort study. Environ. Res. 2020, 183, 108956. [Google Scholar] [CrossRef] [PubMed]
- Tan, M.L.; Prasanna, R.; Stock, K.; Hudson-Doyle, E.; Leonard, G.; Johnston, D. Mobile applications in crisis informatics literature: A systematic review. Int. J. Disaster Risk Reduct. 2017, 24, 297–311. [Google Scholar] [CrossRef]
- Karagulian, F.; Barbiere, M.; Kotsev, A.; Spinelle, L.; Gerboles, M.; Lagler, F.; Redon, N.; Crunaire, S.; Borowiak, A. Review of the Performance of Low-Cost Sensors for Air Quality Monitoring. Atmosphere 2019, 10, 506. [Google Scholar] [CrossRef] [Green Version]
- Johnston, F.H.; Wheeler, A.J.; Williamson, G.J.; Campbell, S.L.; Jones, P.J.; Koolhof, I.S.; Lucani, C.; Cooling, N.B.; Bowman, D.M.J.S. Using smartphone technology to reduce health impacts from atmospheric environmental hazards. Environ. Res. Lett. 2018, 13, 044019. [Google Scholar] [CrossRef]
- Jones, P.J.; Koolhof, I.S.; Wheeler, A.J.; Williamson, G.J.; Lucani, C.; Campbell, S.L.; Bowman, D.M.J.S.; Johnston, F.H. Can smartphone data identify the local environmental drivers of respiratory disease? Environ. Res. 2020, 182, 109118. [Google Scholar] [CrossRef]
- Bradstock, R.; Gill, A.M.; Williams, R. Flammable Australia. Fire Regimes, Biodiversity and Ecosystems in a Changing World, 2nd ed.; CSIRO Publishing: Melbourne, Australia, 2012. [Google Scholar]
- Boer, M.M.; Resco de Dios, V.; Bradstock, R.A. Unprecedented burn area of Australian mega forest fires. Nat. Clim. Chang. 2020, 10, 171–172. [Google Scholar] [CrossRef]
- Ward, M.; Tulloch, A.I.T.; Radford, J.Q.; Williams, B.A.; Reside, A.E.; Macdonald, S.L.; Mayfield, H.J.; Maron, M.; Possingham, H.P.; Vine, S.J.; et al. Impact of 2019–2020 mega-fires on Australian fauna habitat. Nat. Ecol. Evol. 2020. [Google Scholar] [CrossRef]
- Australian Government. National Standards for Criteria Air Pollutants in Australia. Available online: www.environment.gov.au/protection/publications/factsheet-national-standards-criteria-air-pollutants-australia (accessed on 29 May 2020).
- Johnston, F.H.; Borchers-Arriagada, N.; Morgan, G.G.; Jalaludin, B.; Palmer, A.J.; Williamson, G.J.; Bowman, D.M.J.S. Unprecedented health costs of bushfire-related PM2.5 from the 2019-20 Australian megafires. Nat. Sustain. in press.
- Australian Government Department of Agriculture Water and the Environment. National Indicative Aggregated Fire Extent Dataset v20200525; Commonwealth of Australia: Canberra, Australia, 2020.
- United States Geological Survey. Global Land Cover Characterization; U.S. Department of the Interior: Washington, DC, USA, 2020.
- Borchers Arriagada, N.; Palmer, A.J.; Bowman, D.M.; Morgan, G.G.; Jalaludin, B.B.; Johnston, F.H. Unprecedented smoke-related health burden associated with the 2019–20 bushfires in eastern Australia. Med. J. Aust. 2020. [Google Scholar] [CrossRef] [PubMed]
- Coates, L. Bushfire Deaths in Australia, 2010–2020. Available online: https://riskfrontiers.com/bushfire-deaths-in-australia-2010-2020 (accessed on 24 May 2020).
- R Core Team. R: A Language and Environment for Statistical Computing. Available online: https://www.R-project.org/ (accessed on 1 March 2020).
- Laumbach, R.; Meng, Q.; Kipen, H. What can individuals do to reduce personal health risks from air pollution? J. Thorac. Dis. 2015, 7, 96–107. [Google Scholar] [CrossRef] [PubMed]
- Vardoulakis, S.; Jalaludin, B.B.; Morgan, G.G.; Hanigan, I.C.; Johnston, F.H. Bushfire smoke: Urgent need for a national health protection strategy. Med. J. Aust. 2020, 212, 349–353.e1. [Google Scholar] [CrossRef] [PubMed] [Green Version]
- NSW Health. Protect Yourself from Bushfire Smoke. Available online: www.health.nsw.gov.au/environment/air/Pages/bushfire-protection.aspx (accessed on 13 June 2020).
- Centre for Air Pollution Energy and Health Research. Bushfire Smoke: What are the Health Impacts and What can We do to Minimise Exposure? Centre for Air Pollution Energy and Health Research: Sydney, Australia, 2019. [Google Scholar]
- Kenner, A. Asthma on the move: How mobile apps remediate risk for disease management. Health Risk Soc. 2016, 17, 510–529. [Google Scholar] [CrossRef]
- Rappold, A.G.; Hano, M.C.; Prince, S.; Wei, L.; Huang, S.M.; Baghdikian, C.; Stearns, B.; Gao, X.; Hoshiko, S.; Cascio, W.E.; et al. Smoke Sense Initiative Leverages Citizen Science to Address the Growing Wildfire-Related Public Health Problem. GeoHealth 2019, 3, 443–457. [Google Scholar] [CrossRef] [PubMed] [Green Version]
- Howard, Z.; Carlson, S.; Baldwin, Z.; Johnston, F.; Durrheim, D.; Dalton, C. High community burden of smoke-related symptoms in the Hunter and New England regions during the 2019–2020 Australian bushfires. Public Health Res. Pract. 2020. [Google Scholar] [CrossRef]
- Asthma Australia. Bushfire Smoke Impact Survey 2019-2020; Asthma Australia: Sydney, Australia, 2020. [Google Scholar]
- Marfori, M.T.; Campbell, S.L.; Garvey, K.; McKeown, S.; Veitch, M.; Wheeler, A.J.; Borchers-Arriagada, N.; Johnston, F.H. Public health messaging during extreme smoke events: Are we hitting the mark? Front. Public Health, under review.
- Finch, K.C.; Snook, K.R.; Duke, C.H.; Fu, K.-W.; Tse, Z.T.H.; Adhikari, A.; Fung, I.C.-H. Public health implications of social media use during natural disasters, environmental disasters, and other environmental concerns. Nat. Hazards 2016, 83, 729–760. [Google Scholar] [CrossRef]


© 2020 by the authors. Licensee MDPI, Basel, Switzerland. This article is an open access article distributed under the terms and conditions of the Creative Commons Attribution (CC BY) license (http://creativecommons.org/licenses/by/4.0/).
Share and Cite
Campbell, S.L.; Jones, P.J.; Williamson, G.J.; Wheeler, A.J.; Lucani, C.; Bowman, D.M.J.S.; Johnston, F.H. Using Digital Technology to Protect Health in Prolonged Poor Air Quality Episodes: A Case Study of the AirRater App during the Australian 2019–20 Fires. Fire 2020, 3, 40. https://0-doi-org.brum.beds.ac.uk/10.3390/fire3030040
Campbell SL, Jones PJ, Williamson GJ, Wheeler AJ, Lucani C, Bowman DMJS, Johnston FH. Using Digital Technology to Protect Health in Prolonged Poor Air Quality Episodes: A Case Study of the AirRater App during the Australian 2019–20 Fires. Fire. 2020; 3(3):40. https://0-doi-org.brum.beds.ac.uk/10.3390/fire3030040
Chicago/Turabian StyleCampbell, Sharon L., Penelope J. Jones, Grant J. Williamson, Amanda J. Wheeler, Christopher Lucani, David M. J. S. Bowman, and Fay H. Johnston. 2020. "Using Digital Technology to Protect Health in Prolonged Poor Air Quality Episodes: A Case Study of the AirRater App during the Australian 2019–20 Fires" Fire 3, no. 3: 40. https://0-doi-org.brum.beds.ac.uk/10.3390/fire3030040