Article

In the Line of Fire: Consequences of Human-Ignited Wildfires to Homes in the U.S. (1992–2015)

by
Nathan Mietkiewicz
1,2,3,*,
Jennifer K. Balch
1,2,4,
Tania Schoennagel
4,
Stefan Leyk
1,4,
Lise A. St. Denis
1,2 and
Bethany A. Bradley
5
1
Earth Lab, 4001 Discovery Drive Suite S348—UCB 611, University of Colorado-Boulder, Boulder, CO 80309, USA
2
Cooperative Institute for Research in Environmental Sciences, Boulder, CO 80309, USA
3
National Ecological Observation Network, Battelle, 1685 38th Street, Boulder, CO 80301, USA
4
Department of Geography, GUGG 110, 260 UCB, University of Colorado-Boulder, Boulder, CO 80309, USA
5
Department of Environmental Conservation, 160 Holdsworth Way, University of Massachusetts-Amherst, Amherst, MA 01003, USA
*
Author to whom correspondence should be addressed.
Submission received: 21 August 2020 / Revised: 2 September 2020 / Accepted: 5 September 2020 / Published: 7 September 2020
(This article belongs to the Special Issue Wildfire Hazard and Risk Assessment)

Abstract

:
With climate-driven increases in wildfires in the western U.S., it is imperative to understand how the risk to homes is also changing nationwide. Here, we quantify the number of homes threatened, suppression costs, and ignition sources for 1.6 million wildfires in the United States (U.S.; 1992–2015). Human-caused wildfires accounted for 97% of the residential homes threatened (within 1 km of a wildfire) and nearly a third of suppression costs. This study illustrates how the wildland-urban interface (WUI), which accounts for only a small portion of U.S. land area (10%), acts as a major source of fires, almost exclusively human-started. Cumulatively (1992–2015), just over one million homes were within human-caused wildfire perimeters in the WUI, where communities are built within flammable vegetation. An additional 58.8 million homes were within one kilometer across the 24-year record. On an annual basis in the WUI (1999–2014), an average of 2.5 million homes (2.2–2.8 million, 95% confidence interval) were threatened by human-started wildfires (within the perimeter and up to 1-km away). The number of residential homes in the WUI grew by 32 million from 1990–2015. The convergence of warmer, drier conditions and greater development into flammable landscapes is leaving many communities vulnerable to human-caused wildfires. These areas are a high priority for policy and management efforts that aim to reduce human ignitions and promote resilience to future fires, particularly as the number of residential homes in the WUI grew across this record and are expected to continue to grow in coming years.

Graphical Abstract

1. Introduction

Wildfire poses a direct threat to communities and people living in fire-prone areas [1,2]. Communities that meet or intermingle with undeveloped wildland vegetation, creating zones known as the wildland-urban interface (WUI; <10% of the U.S. land area), are at the greatest risk of wildfire across the U.S. [3,4,5]. Humans’ relationship with wildfire in the WUI is a complex interaction between an increasing number of people living in flammable landscapes (increased number of at-risk communities and ignition sources) [6,7,8,9], a warmer and drier climate that is more conducive to fire [10,11,12], and increased fuels accumulated in some places due to years of fire suppression [13,14]. Elements of these interactions have been the focus of contemporary scientific debate and public discourse [15], but we still lack fine-scale estimates of homes threatened from wildfire and how WUI communities contribute to wildfire at a national scale.
The WUI has expanded in the U.S. by a third between 1990 and 2010 [7] and is projected to double by 2030 [3]. Currently, there are an estimated 2.5 million residential structures in fire-prone areas of the WUI in the coterminous U.S., equivalent to $1.4 trillion in property value at risk [5]. Importantly, only ~15% of the WUI in the west is developed while the remaining 85% is available for development and deemed potential WUI expansion areas [16], highlighting the pressing need to implement strategies now that will reduce future wildfire risk in an expanding WUI. Moreover, exposure to wildfire smoke can have profound negative health effects [17]. An estimated 17.5 million people living in these fire-prone WUI areas [5] in the western US are expected to experience longer and more intense smoke waves, in which unhealthy particulate matter from wildfire smoke persists for more than two days [18]. Displacement from wildfires due to home loss or poor air quality are expected to increase as wildfire occurrence continues to rise [15,19].
Despite the call to adapt to increasing wildfires [15], we lack yearly, fine-scale estimates at a national scale of the number of homes actually threatened by wildfire and the role of human-related ignitions in starting fires near these communities. Previous work estimated that 286,000 homes were threatened by large wildfires (small wildfires, <400 ha, were not accounted for) between 2000–2010, based on decade-interval data within census blocks [7]. Also, it has been documented that 84% of the nation’s wildfires were caused by people between 1992 and 2013 [8], but this work does not quantify the role of human-caused wildfires where people actually live. Further, it is problematic that there are no estimates of the wildfire threat to homes past 2010, as four of the top ten largest wildfire years (>32,000 km2) occurred in 2011, 2012, 2015, and 2017 [20].
Human influence on the landscape is an important predictor of wildfire ignition likelihood [4,21,22,23]. For example, proximity to roads at local scales is positively correlated with wildfire ignition density [4,22], while fire density has a hump-shaped relationship with population density, peaking around ~10 people/km2 [24]. At regional to national scales, it has been shown that proximity to WUI areas influences the occurrence of large wildfires (>40 ha) [25]. Recent work by Syphard et al. [9] has further shown that human presence is more important in wildfire ignition than climate across the conterminous US, but burned area is primarily driven by climate conditions [10,26]. Despite the prominent role of humans in igniting fires, it remains unknown how the WUI acts as a source of human ignitions as well as how much fire damage the WUI potentially sustains at fine scales and on an annual basis. Here, we investigate how human ignitions have altered fire frequency, burned area, and seasonality in the WUI compared to wildland areas. We further assess the number of residential structures threatened and the associated suppression costs of human-started wildfires within the WUI, providing a comprehensive assessment of the consequences and costs of human-started wildfire in our most vulnerable communities.
To address these questions, we utilized over 1.6 million wildfire events (1992–2015) designated as human or lightning caused [27] and a novel spatio-temporal housing dataset of over 200 million housing records derived from Zillow’s ZTRAX dataset [28] to provide a direct and improved estimate of the number of residential units threatened (defined based on being located within 1 km of the wildfire perimeter) by wildfire by year. We quantified wildfire costs from ~150,000 wildfire situation reports (1999–2014) that provide daily estimates of fire suppression costs [29]. Combining these three datasets we assessed the role of human-caused wildfires in the WUI (769,087 km2; Interface WUI = 162,368 km2; Intermix WUI = 606,719 km2), very low-density housing (VLDH; 2,283,410 km2), and wildland areas (2,565,320 km2) [7]. We also provide an estimate of the increase in the number of homes in the WUI across the study time period.

Hypotheses

We hypothesized that human-started wildfires would be the dominant type near the WUI, while the VLDH would contain a mix of human- and lightning-started wildfires, and lightning-started wildfires would dominate the wildlands. Similarly, we expected that wildfires would be more expensive in the wildlands due to the larger wildfire footprint and the difficulty in navigating the terrain during suppression efforts. Conversely, we expected the cost of wildfires near the WUI to be less per wildfire, but more expensive proportional to wildfire size due to the more proximate threat to communities and people. We further hypothesized that the distance to human settlement and the median home density were strongly related to the prevalence of human versus lightning ignitions. Fire frequency and fire season length were expected to vary with the type of ignition source (i.e., lightning versus human) and the distance from the urban core boundary. Lastly, we hypothesized that there would be important regional differences and therefore, we refined some of our analysis based on reorganized level 1 ecoregions to capture the major eastern and western U.S. patterns.

2. Datasets

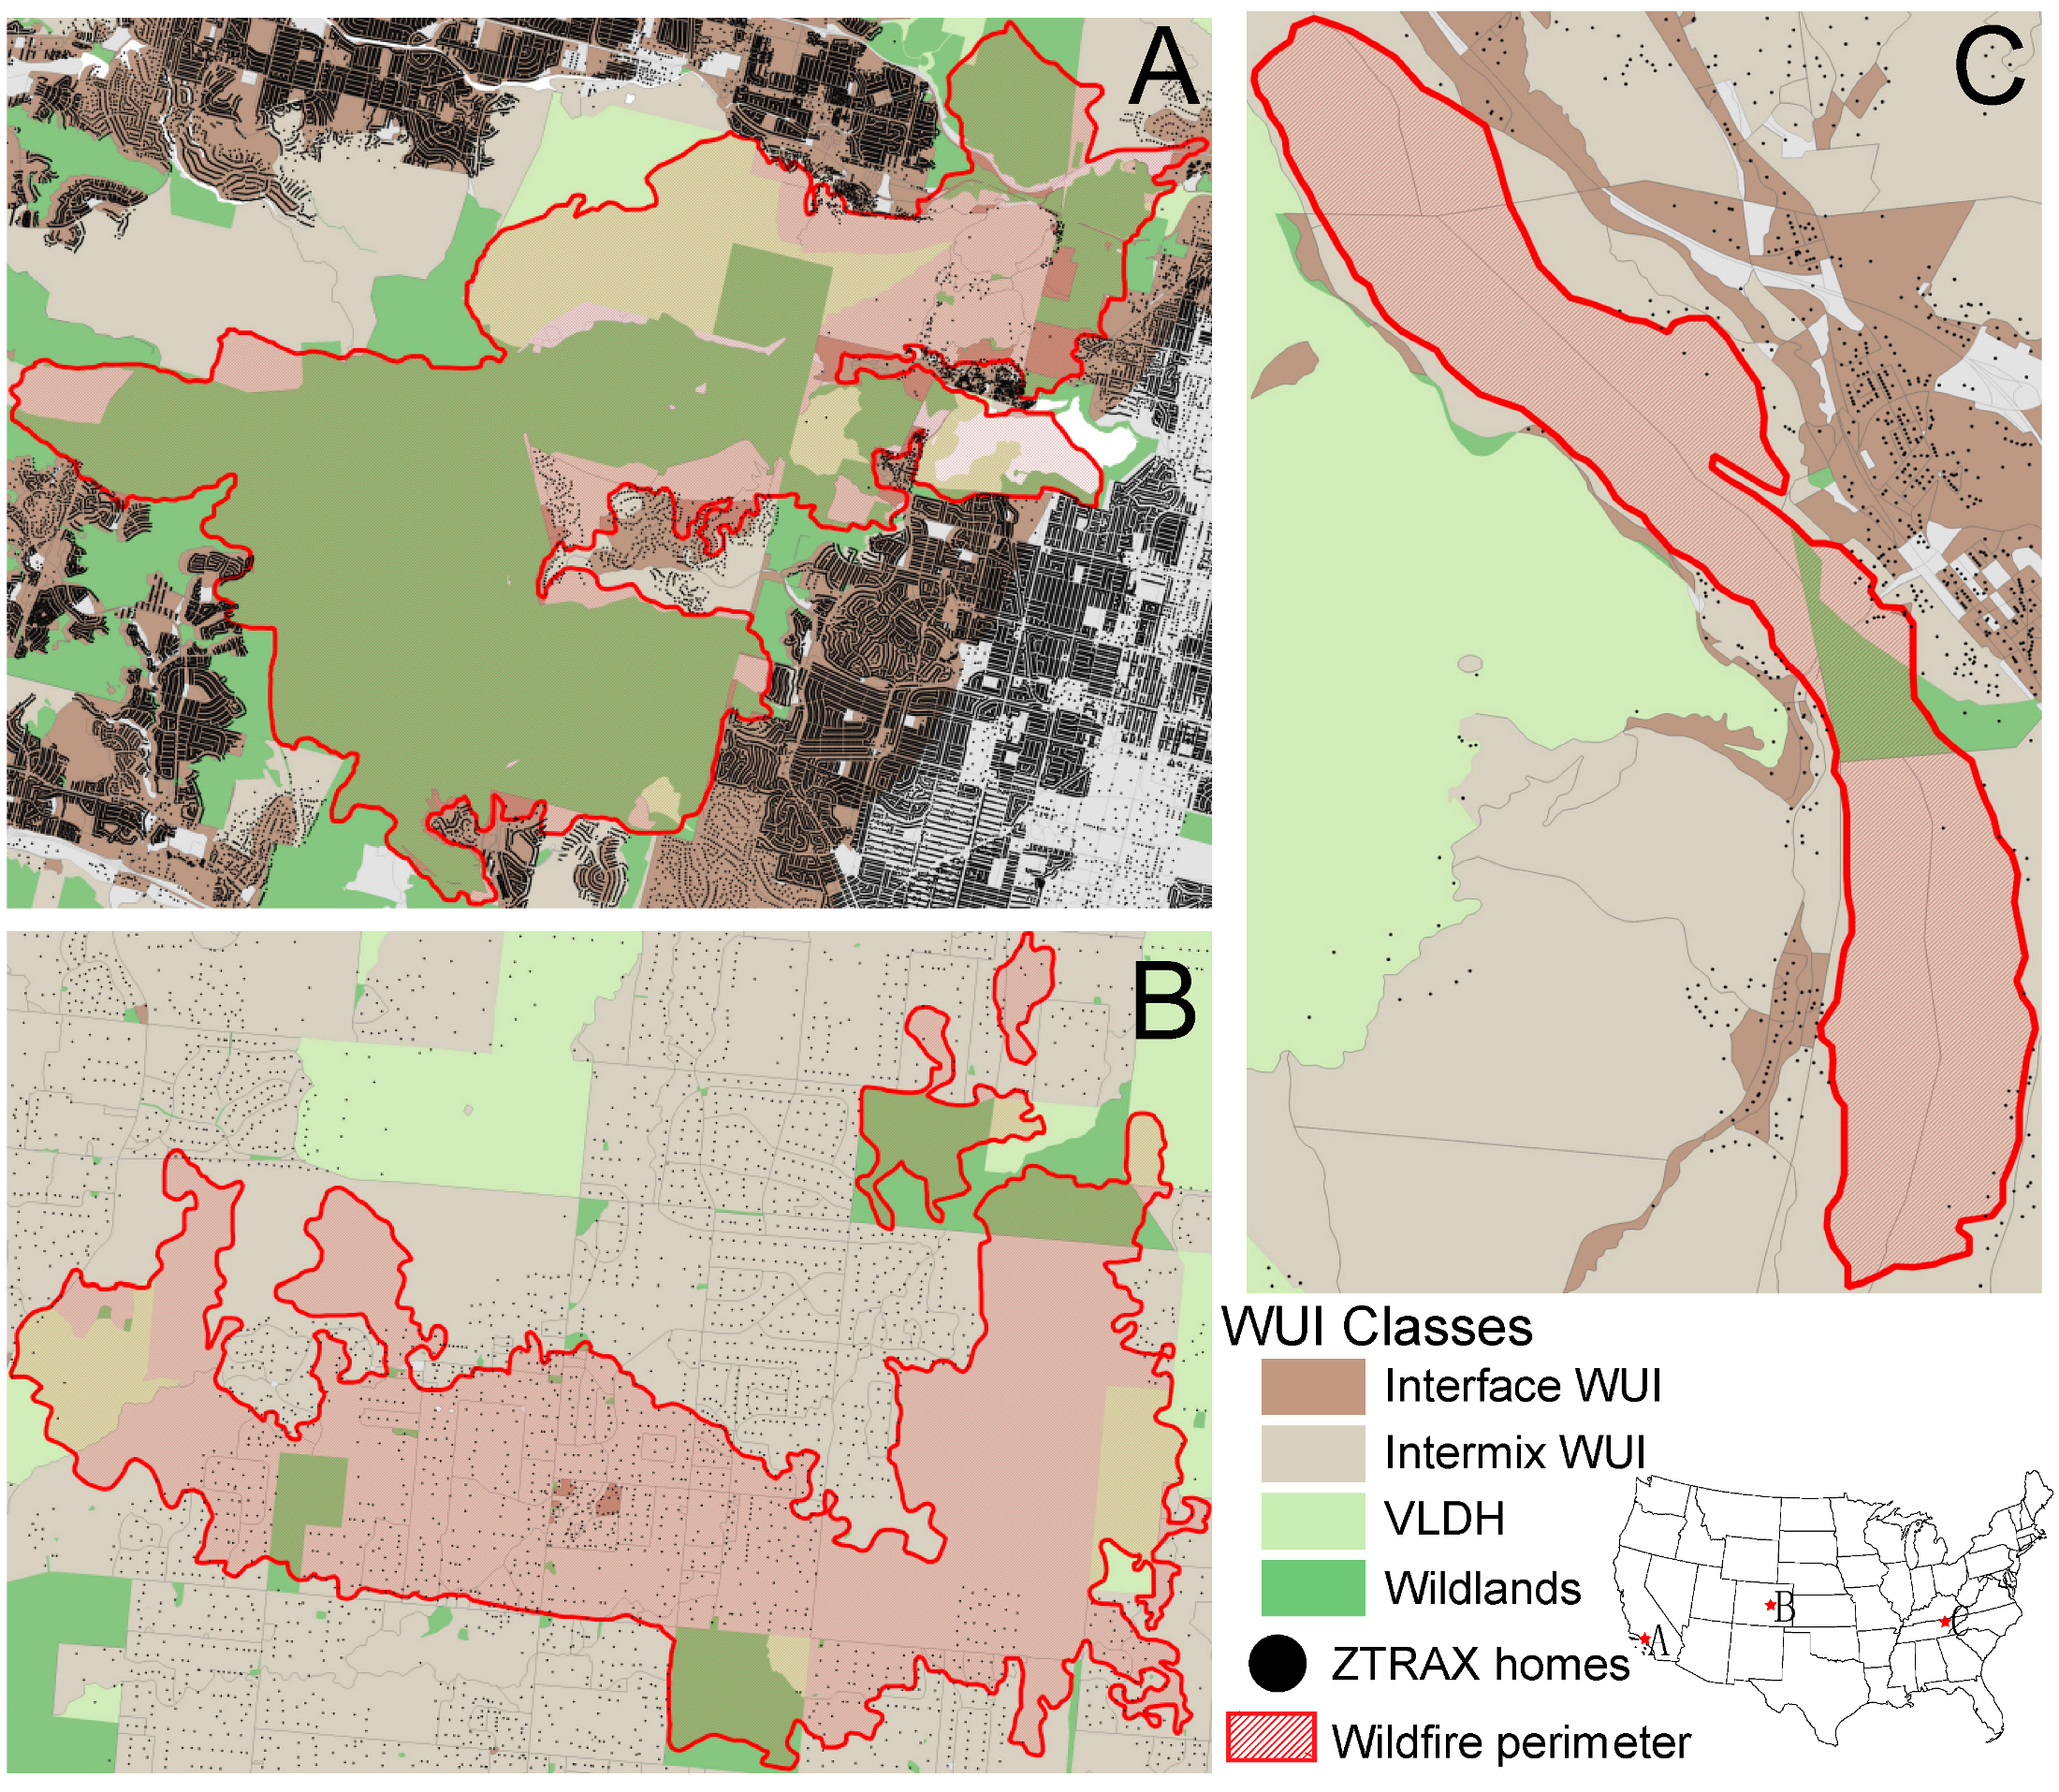
2.1. The Wildland-Urban Interface

A WUI spatial database [7] was used to assess the distribution of wildfire activity within the WUI, very low-density housing (VLDH), and wildland areas for 1990, 2000, and 2010. Each polygon within this dataset represents a U.S. census housing block group, which is defined as an interface, intermixed, or non-WUI category. Intermix WUI and Interface WUI both have census blocks that exceed 6.17 housing units per km2 and have >50% wildland vegetation or <50% wildland vegetation, respectively. Interface WUI areas must also be located within 2.4 km of an area larger than 5 km2 containing >75% wildland vegetation. We combined the interface and intermixed WUI zones to represent the total area of the WUI within the US. Very low-density housing areas were delineated based on census block groups that had <6.17 housing units per km2 and wildland vegetation that is >50%. Wildlands were defined as census block groups housing density of 0 units per km2 and wildland vegetation >50%.
Previous research has encompassed the WUI within a 2.4 km buffer based on the assumption that fire events outside of the WUI can produce firebrands that are likely to be transported ahead of a wildfire front and ignite a new wildfire in a WUI census block [30,31]. In this current work, we opted to not use this 2.4 km buffer and instead directly evaluate the wildfire activity in each of the main classes independently (e.g., Intermix WUI, Interface WUI, very-low density housing, and wildlands) [32]. In effect, the VLDH category represents a more spatially explicit and representative area between the WUI and “true” wildlands than the 2.4 km buffer zone. Additionally, we acknowledge that the wildland agricultural interface (WAI) and wildland industrial interface (WII) are important areas of wildfire risk near human settlement, the data product used in this study did not differentiate those locations from the WUI or VLDH [7].

2.2. U.S. Forest Service Fire Program Analysis-Fire-Occurrence Database

The U.S. Forest Service Fire Program Analysis-Fire-Occurrence Database (FPA-FOD) [27] documents the location, cause, discovery date across ~1.8 million wildfires from 1992–2015 from various sources, including U.S. federal, state, and local records of wildfires on public and private lands. We collapsed the US Forest Service-designated cause categories of equipment use, smoking, campfire, railroad, arson, debris burning, children, fireworks, power line, structure, and miscellaneous fires into a human-started wildfire class. All fires <0.001 acres or fires that had a missing/undefined cause were removed from the FPA-FOD dataset [8]. Wildfire size was evaluated by small (<4 km2), large (4–500 km2), and very large (>500 km2) classes. There is acknowledged reporting bias over time (e.g., completeness issues) at the state level [33] making trend analysis difficult [8].

2.3. Monitoring Trends in Burn Severity

Annual burned area and large wildfire perimeters (1992–2015) were obtained through a combination of buffering the FPA-FOD points based on the size of the fire and from the Monitoring Trends in Burn Severity (MTBS) group [34] (see http://mtbs.gov/ for information on pre-processing, specific information on index calculation, and derived dataset available). MTBS leverages the extensive Landsat TM/ETM+/OLI record to produce spatially explicit fire perimeters for all large fires (>400 ha in the western US and >200 ha in the eastern US). These data are produced using the differenced Normalized Burn Ratio (dNBR), which uses pre- and post-fire spectral response to define full extents of the disturbance events. In addition to this automated process, and to ensure consistency and precision, manual digitization is performed at on-screen display scales between 1:24,000 and 1:50,000.

2.4. Zillow Transaction and Assessment Dataset

To measure residential settlement at very fine spatial scales and annually we used the Zillow Transaction and Assessment Dataset (ZTRAX), which contains unique data on housing transactions, home values, rental estimates, spatial location, home- and property-related information as well as built-year information, for existing homes and certain other properties across the United States. The ZTRAX data are obtained from a major large third-party provider as well as through an internal initiative, called County Direct. County Direct prioritizes counties based on different characteristics and supplements the third-party coverage by collecting data directly from county Assessor and Recorder’s offices and represents a growing share of the ZTRAX dataset. The ZTRAX database over the study period includes public records and assessor data for approximately 200 million parcels in over 3100 counties in the U.S. (https://www.zillow.com/ZTRAX/). While this database is of unique nature covering most of the U.S. there are some issues related to data quality as described above, including spatial, temporal and thematic uncertainties that we assessed and measured in order to create accompanying uncertainty layers. The database is under continuous revision and will be updated regularly. The raw data and the created SQLite databases cannot be shared publicly per the established data share agreement, but there are recently published aggregations to 5-year intervals between 1810 and 2015 [28].
In this study, we measure residential land use at a given point in time using the construction year information within the ZTRAX database. Furthermore, we use the geographic information provided for each record, which represents approximate address point locations, to characterize residential land use at fine spatial and temporal resolution [28]. Using the raw ZTRAX point database, we selected only housing points that were defined as residential properties and had a defined built year to reduce temporal uncertainty. In recent research, data limitations including low spatial precision in census-based housing data [7], low classification accuracy in land cover data [35], and lack of small fires (e.g., MTBS [34]) resulted in limited accuracy of national assessments. Improved estimates of WUI-wildfire interactions are critical to assess the vulnerability of current and future housing development to wildfire risks and costs. By utilizing the novel ZTRAX data in conjunction with extensive federal fire records we were able to measure threatened homes with high spatial precision and on an annual basis, with future potential to continue to identify regions with elevated risk. These new fine-resolution data products provide unprecedented opportunities for such risk analysis at fine analytical scales, fundamentally changing the way patterns of human-fire interactions can be described.

2.5. United States National Incident Command System Historical ICS-209 Reports

We further leverage an expanded dataset mined from the United States National Incident Management System (NIMS) Incident Command System (ICS) Historical ICS-209 Reports acquired from the publicly available ICS-209 data on the Fire and Aviation Management website (https://fam.nwcg.gov/fam-web/), created by some of the co-authors. We performed systematic and reproducible data cleaning protocols to access these data in a usable form [29]. The cleaned ICS-209 database, henceforth known as ICS-209-PLUS-WF, resulted in 20,353 unique incidents compiled from over 150,000 daily records between 1999–2014, containing information on total estimated fire suppression cost, total residential and commercial structures destroyed and threatened, total fatalities, and wildfire cause. Here, we defined a community threatened by wildfire when threatened or destroyed structures for a given event were >0. These data are a spatially explicit summary of 67% of the total estimated fire suppression costs from all wildfires that required an incident management team but represents <2% of the total wildfires that actually occurred from 1999–2014. The fire suppression field is systematically underestimated [29]. Therefore, all of our cost estimates are lower than true costs, but they are proportionally similar to the total accrued costs reported by the National Interagency Fire Center (NIFC) [20].

3. Methods

The details of the WUI classes were extracted based on the point location of wildfire ignition in the FPA-FOD database. The classes within the WUI layer [7] are based on statistics and classified at the census block group level, which vary widely in size from 0.001 km2 to 3403 km2, with a mean of 0.843 km2 across the conterminous U.S. The size of the census block groups from east to central to west vary from 0.0007 km2 to 1231 km2 (mean = 0.469 km2), 0.001 km2 to 1020 km2 (mean = 0.937 km2), 0.001 km2 to 3403 km2 (mean = 1.55 km2), respectively. While the mean area of census block groups for the WUI, VLDH, and wildlands are 0.651 km2, 5.72 km2, and 1.57 km2, respectively, the classes in the WUI layer are interconnected along an urban-rural continuum characterized by large homogenous clusters of class-similar census block groups that tend to be on the order of 10 s to 1000 s km2 in size. Thus, the census block groups allow for an appropriate minimum mapping unit to satisfy the assessment from Short [33]; “The FPA FOD should provide point locations of wildfires at least as precise as a PLSS section (2.6 km2 grid)”, while retaining the finer detail in class variation across space without having to aggregate further to an arbitrary pixel unit. Given these vector mapping units of the WUI layer at fine and coarse scales, we believe that our analysis is more than appropriate for quantifying human- and lightning-caused wildfires at the WUI, VLDH, and the wildlands.
Information contained in the WUI data was spatially joined to the FPA-FOD and ICS-209-PLUS-WF point database and temporally aligned such that the discovery wildfire year was matched with the appropriate WUI delineation between 1992–2015. This resulted in an FPA-FOD + WUI and ICS-209-PLUS-WF + WUI databases totaling 1,386,595 and 23,607 wildfire ignition points, respectively. Additional ancillary data layers were subsequently intersected (e.g., level 3 ecoregions, state boundaries), allowing us to further refine boundaries into general regions (i.e., west, central, southeast, etc.). A systematic 50-km grid was imposed to quantify the relative contributions of human- vs. lightning-started wildfire ignition within Intermix WUI, Interface WUI, VLDH, and wildlands. Using these point databases, we were then able to create summary statistics across all grouping combinations (i.e., WUI classes, ignition type, seasonality, fire size, regions, 50-km grid, etc.). We calculated the frequency of wildfire ignitions, mean and 95th confidence interval of fire size, interquartile range of discovery day-of-year. Seasonality was defined as the season that fire ignition was most prevalent across all classes.
For the FPA-FOD and ICS-209-PLUS-WF database, we estimated burned area footprint by developing a circular buffer around each wildfire ignition point, equating to the total burned area associated with the fire event. For each wildfire ignition point that was not associated with an MTBS (large fires) wildfire perimeter, we used this buffering logic to estimate the burned area footprint; for all fires that did fall within the wildfire perimeter and have an association with the MTBS fire, we used the MTBS wildfire polygon. In addition, and because of known inaccuracies in the FPA-FOD point locations [33], we buffered the MTBS polygons equivalent to 2.6 km2 as suggested by Short et al. (2015), which identified only 16 MTBS wildfires outside those fire polygons, which we subsequently buffered to the fire size (see Accuracy Assessment for more details).
To create estimates of wildfire threat, buffered rings were created around the estimated wildfire polygons at distances of 250 m, 500 m, and 1 km from the wildfire perimeter edge. Three buffer distances were selected to better understand and quantify the estimated number of homes threatened than with a single metric because there are no national standard defining distances from a wildfire’s edge that determine evacuations and highest home threats. Those definitions are made at the moment and can vary across space as the wildfire event unfolds. These boundary distances were chosen to best exemplify a gradient of moderate (1 km) to high (250 m) home threat by wildfires. Homes within 1 km of a wildfire are not only at higher threat of wildfire relative to homes further than 1 km from wildfire edge, but those homes will likely fall within an evacuation zone and directly impact homeowners during the event.
We extracted all residential homes from the cleaned ZTRAX database for all years leading up to and including the year of the wildfire event that fell within the wildfire perimeter and each of the buffered FPA-FOD and ICS-209-PLUS-WF rings. We further spatially intersected the WUI census block groups with these buffered polygons to estimate the total WUI class area that was burned/threatened by wildfire. ANOVAs with a pairwise comparison of the means using the Tukey HSD function were used to test for differences between fire size, ignition type, homes threatened, and wildfire suppression costs between the WUI, VLDH, and wildlands.
To test whether wildfire ignition type, timing, and frequency is a function of the distance from human settlement and home density, we calculated the distance of all wildfires from the urban core boundary, proxied by the high-density urban class in the WUI database, and subsequently binned the data by 10-km grid cells across the contiguous US. This allowed us to more easily generalize relationships while retaining the spatial integrity of the data. We also used the 10-km grid cell to estimate the median home density. We employed generalized additive models (GAMs), a common statistical tool in wildfire science [36,37], to explore the relationship between the frequency and IQR of human versus lightning-caused wildfire against median home density and distance the WUI edge.

Accuracy Assessment

We conducted a comparative analysis to estimate a baseline accuracy metric using two datasets, (1) the MTBS polygons that were found within the FPA-FOD database and (2) the buffered burned area estimate using the FPA-FOD points that had an associated MTBS polygon. We did this assessment based on homes found in the ZTRAX database within wildfire perimeters. We found 288,846 homes threatened within buffer-estimated wildfire polygons. The raw MTBS polygons reported 156,915 homes threatened within the burned perimeter. This equates to the buffered burned area overestimating the number of homes threatened within the wildfire polygon by 84%. The major source of these differences between the buffered points and the raw MTBS polygons are due to the irregular shape of the raw wildfire polygons that tend to be more elongated and follow the topography, vegetation distribution, and wind direction while the buffered points do not take into account the underlying land structure.
Of the 17,381 wildfires found in the MTBS database from 1992–2015, 8576 were found within the FPA-FOD, which equates to 0.6% of the total wildfires (1,700,188) found in the FPA-FOD, or 60% of all fires >200 ha (14,327) in the FPA-FOD. We found that 49% of the wildfires in the MTBS product between 1992 and 2015 had an associated FPA-FOD ignition point that was located within the wildfire burned perimeter. When we buffered the perimeters equivalent to 2.6 km2, we only found 16 additional FPA-FOD points associated with the MTBS product out of the 8,864 polygons that were not found within the perimeters, suggesting that the remaining polygons that did not have an FPA-FOD ignition within the perimeter and beyond were not solely due to spatial inaccuracies but instead these fires were completely absent from the FPA-FOD product. It is known that there is a lack of overlap between the FPA-FOD when compared to satellite-based detections, which may relate to intentional burns, a lack of suppression efforts or reporting on small fires, or just the absence of actual events [38]. The additional 16 polygons that had an associated FPA-FOD ID within the 2.6 km2 buffer had a median distance from the perimeter of 76 m, with over half of those points located with 135 m from the perimeter edge further suggesting that the 2.6 km2 metric may be overestimating the inaccuracies of the FPA-FOD database. More refined assessments of this validation are needed for the wider fire community.

4. Results

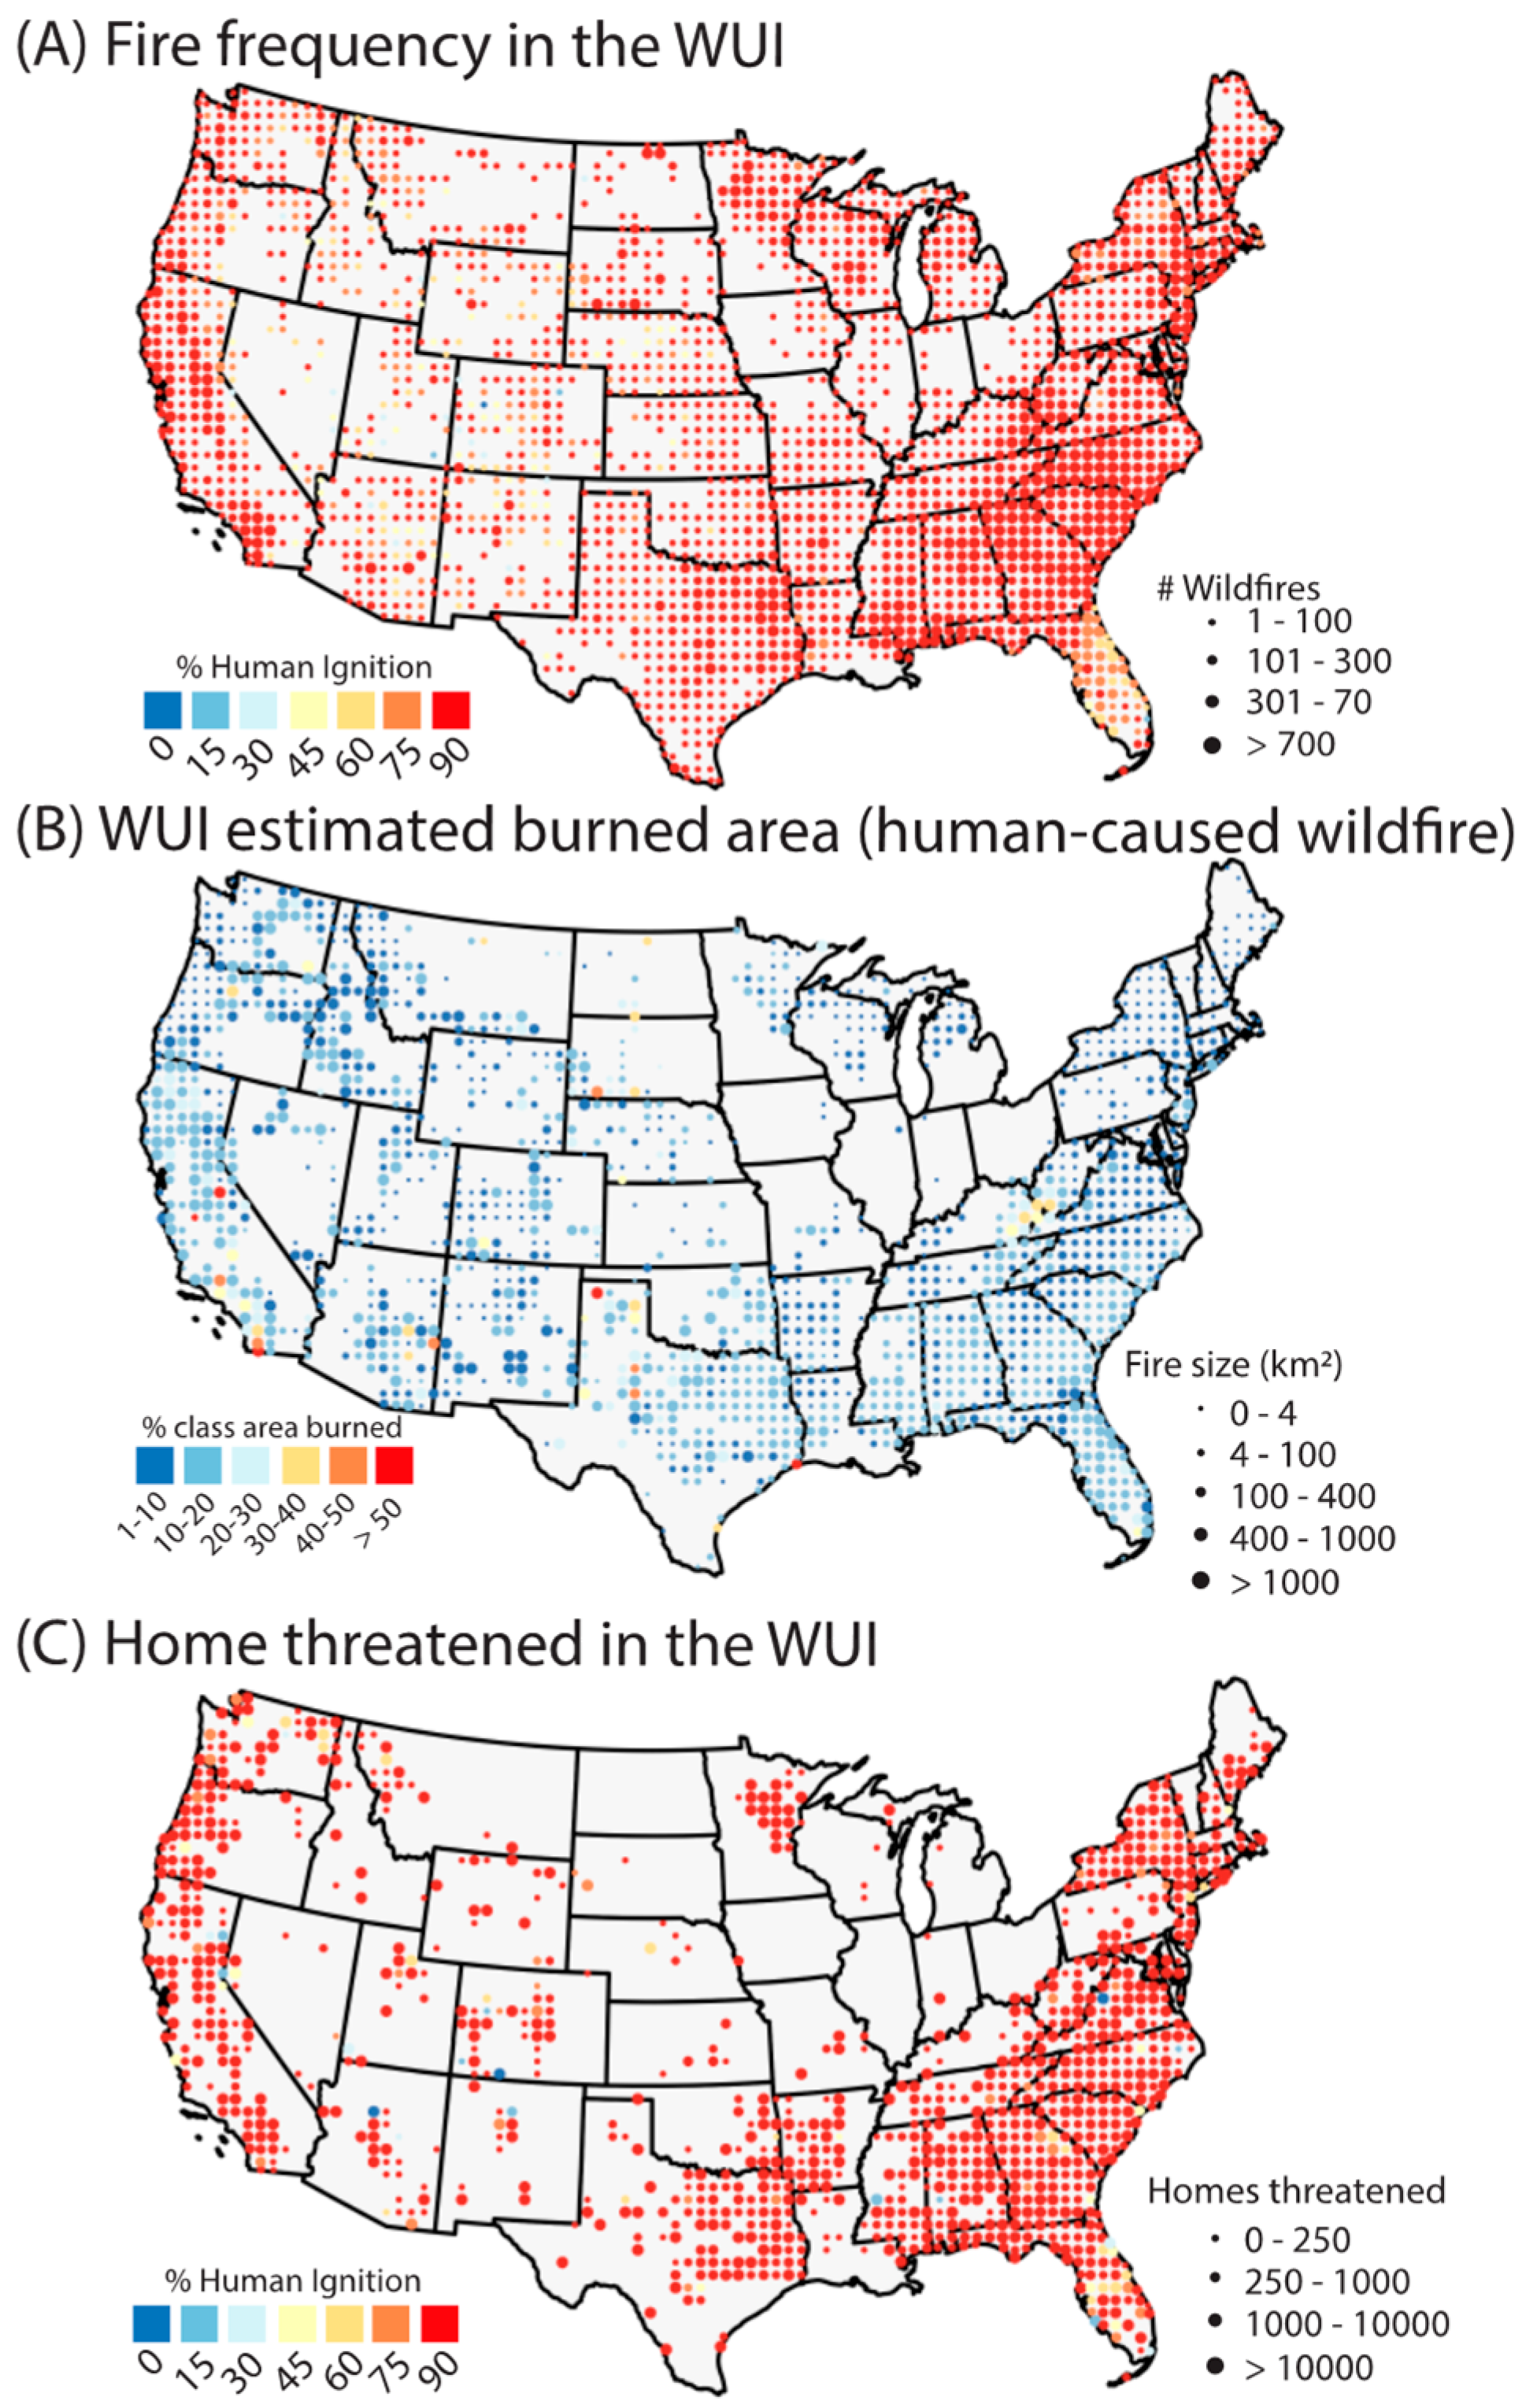
4.1. Percent of All Wildfires Originated in the WUI

The WUI represents ~10% of the total conterminous U.S. land area in 2010 (ca. 7,780,091 km2), yet 32% of all wildfires (N ~ 437,233 between 1992 and 2015) originated in the WUI. The remaining 29% and 39% of wildfire events started in very low-density housing (VLDH) and wildlands, respectively. Wildfires starting in the WUI burned a total of 16,412 km2, representing 4% of the total area burned in this record. Mean fire size in the WUI was significantly smaller (4 ha (3.3–4.3)) than in the VLDH (23.6 ha (21.8–25.9)) and wildland areas (58.3 ha (54.4–62.5); values in brackets indicate a 10,000 repeated bootstrapped 95th confidence interval around the mean). Further, across the record, the total number of residential homes in the WUI (both interface and intermix) increased by 145% with ~32 million new residential homes in the combined WUI between 1990 and 2015 (Figure S1).

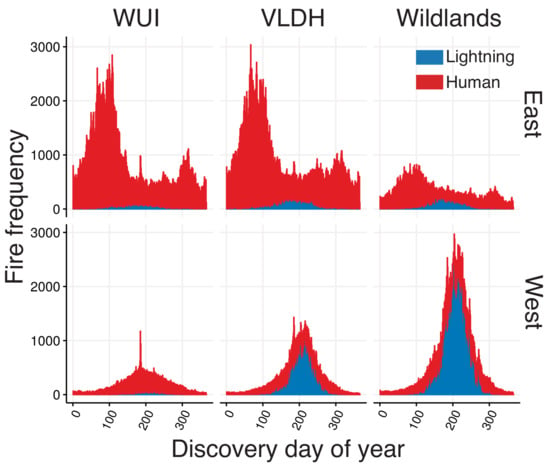
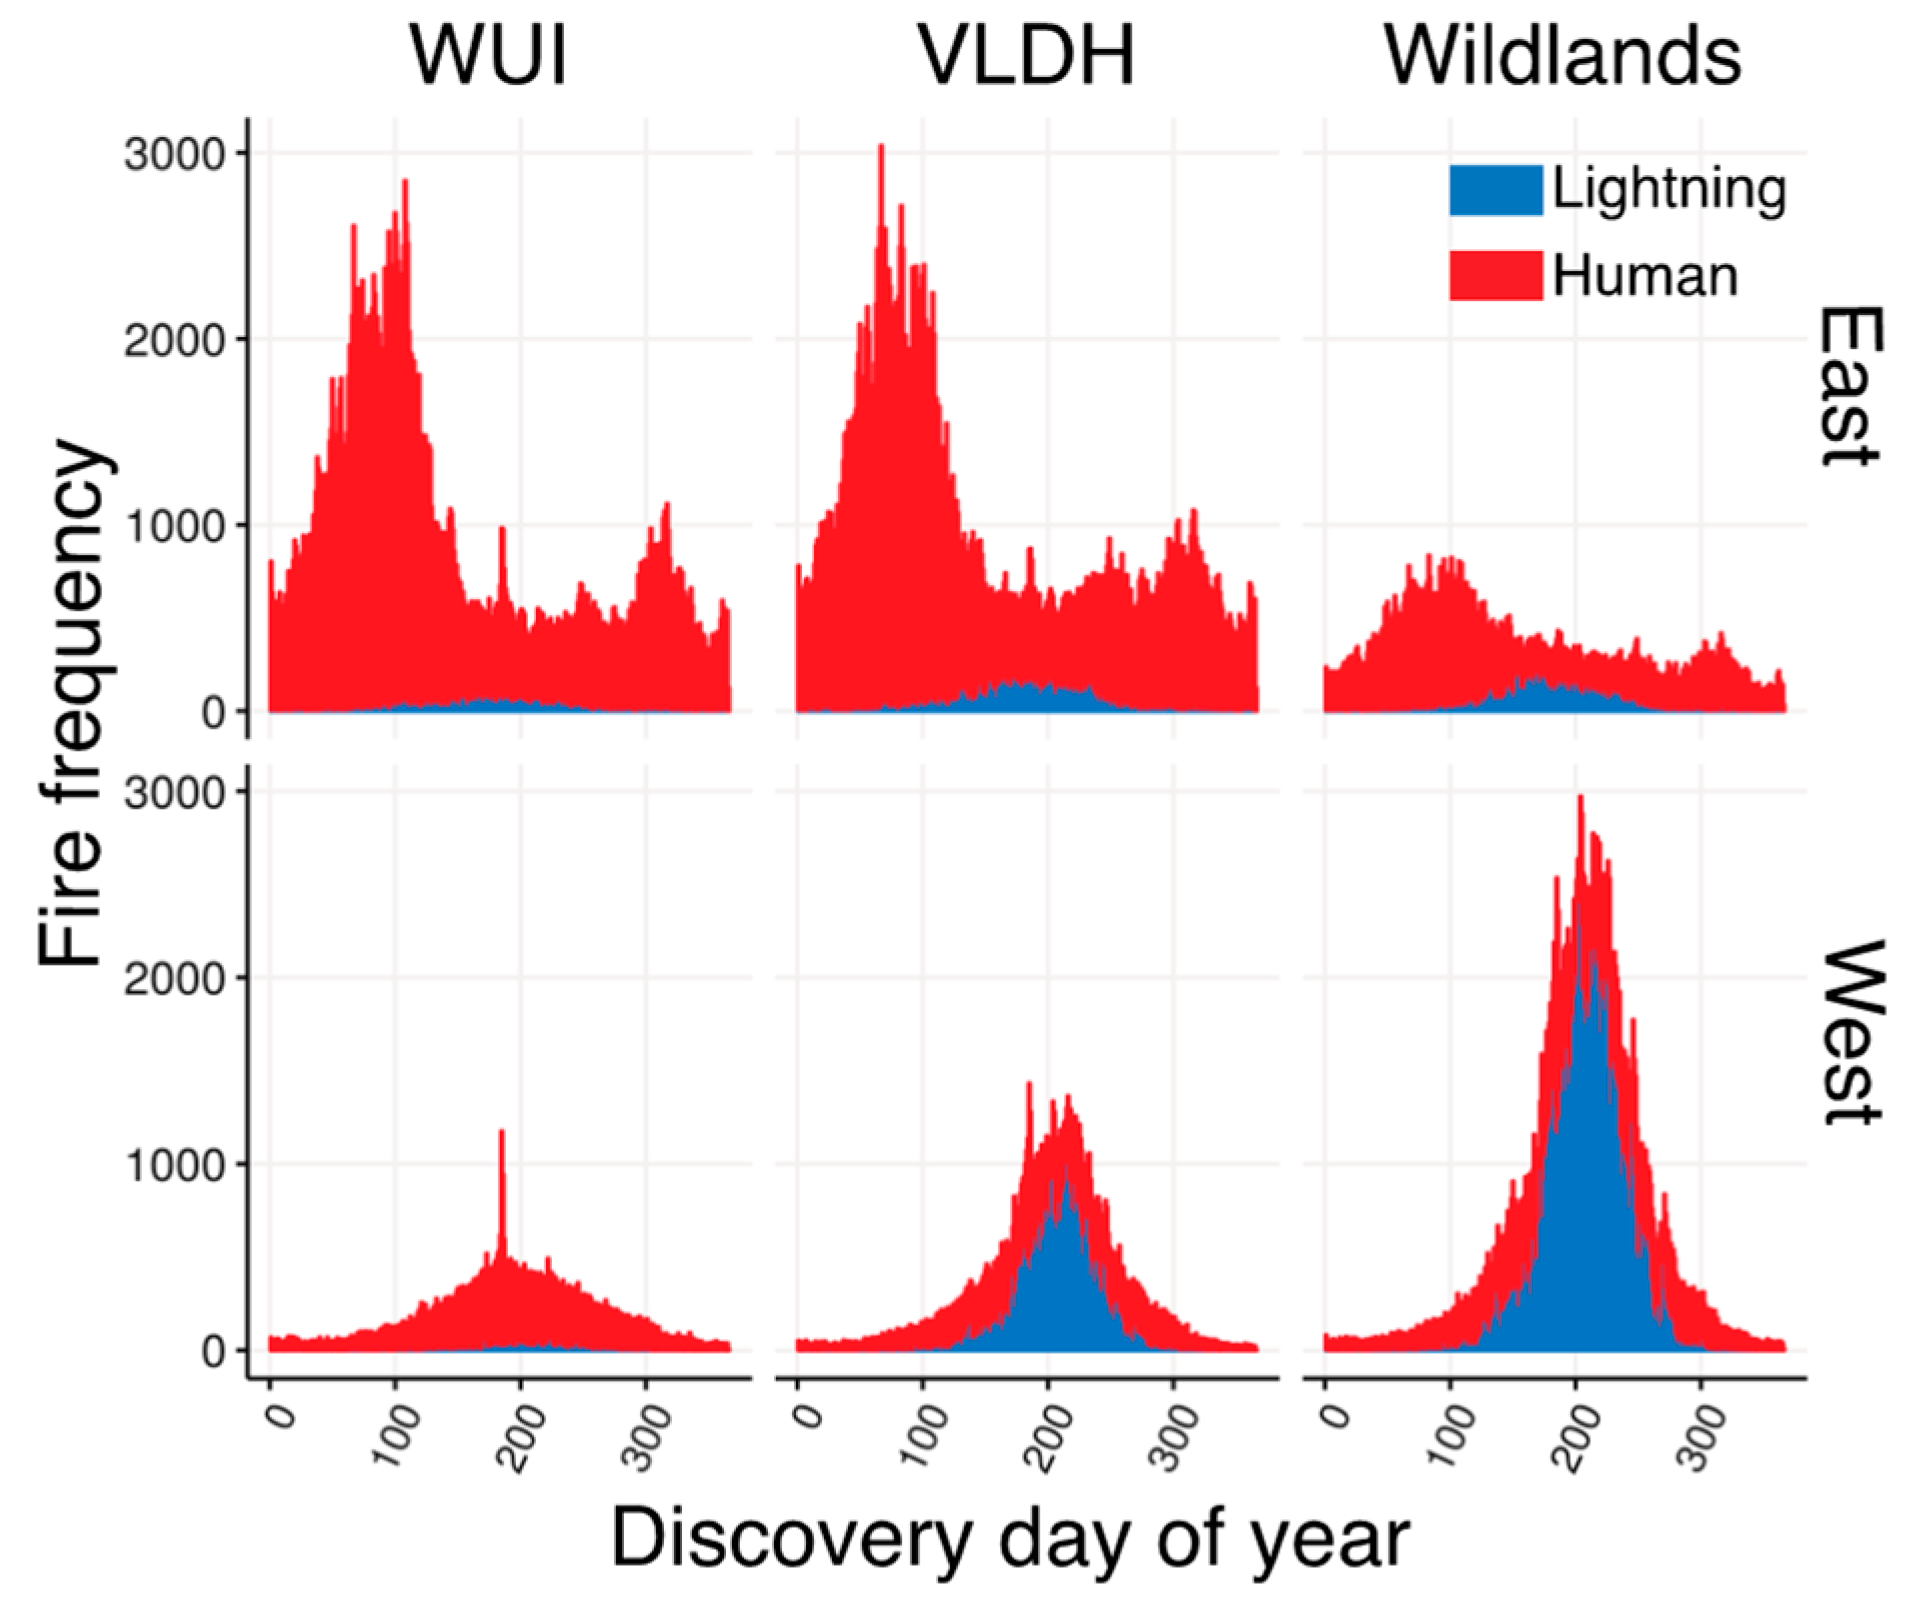
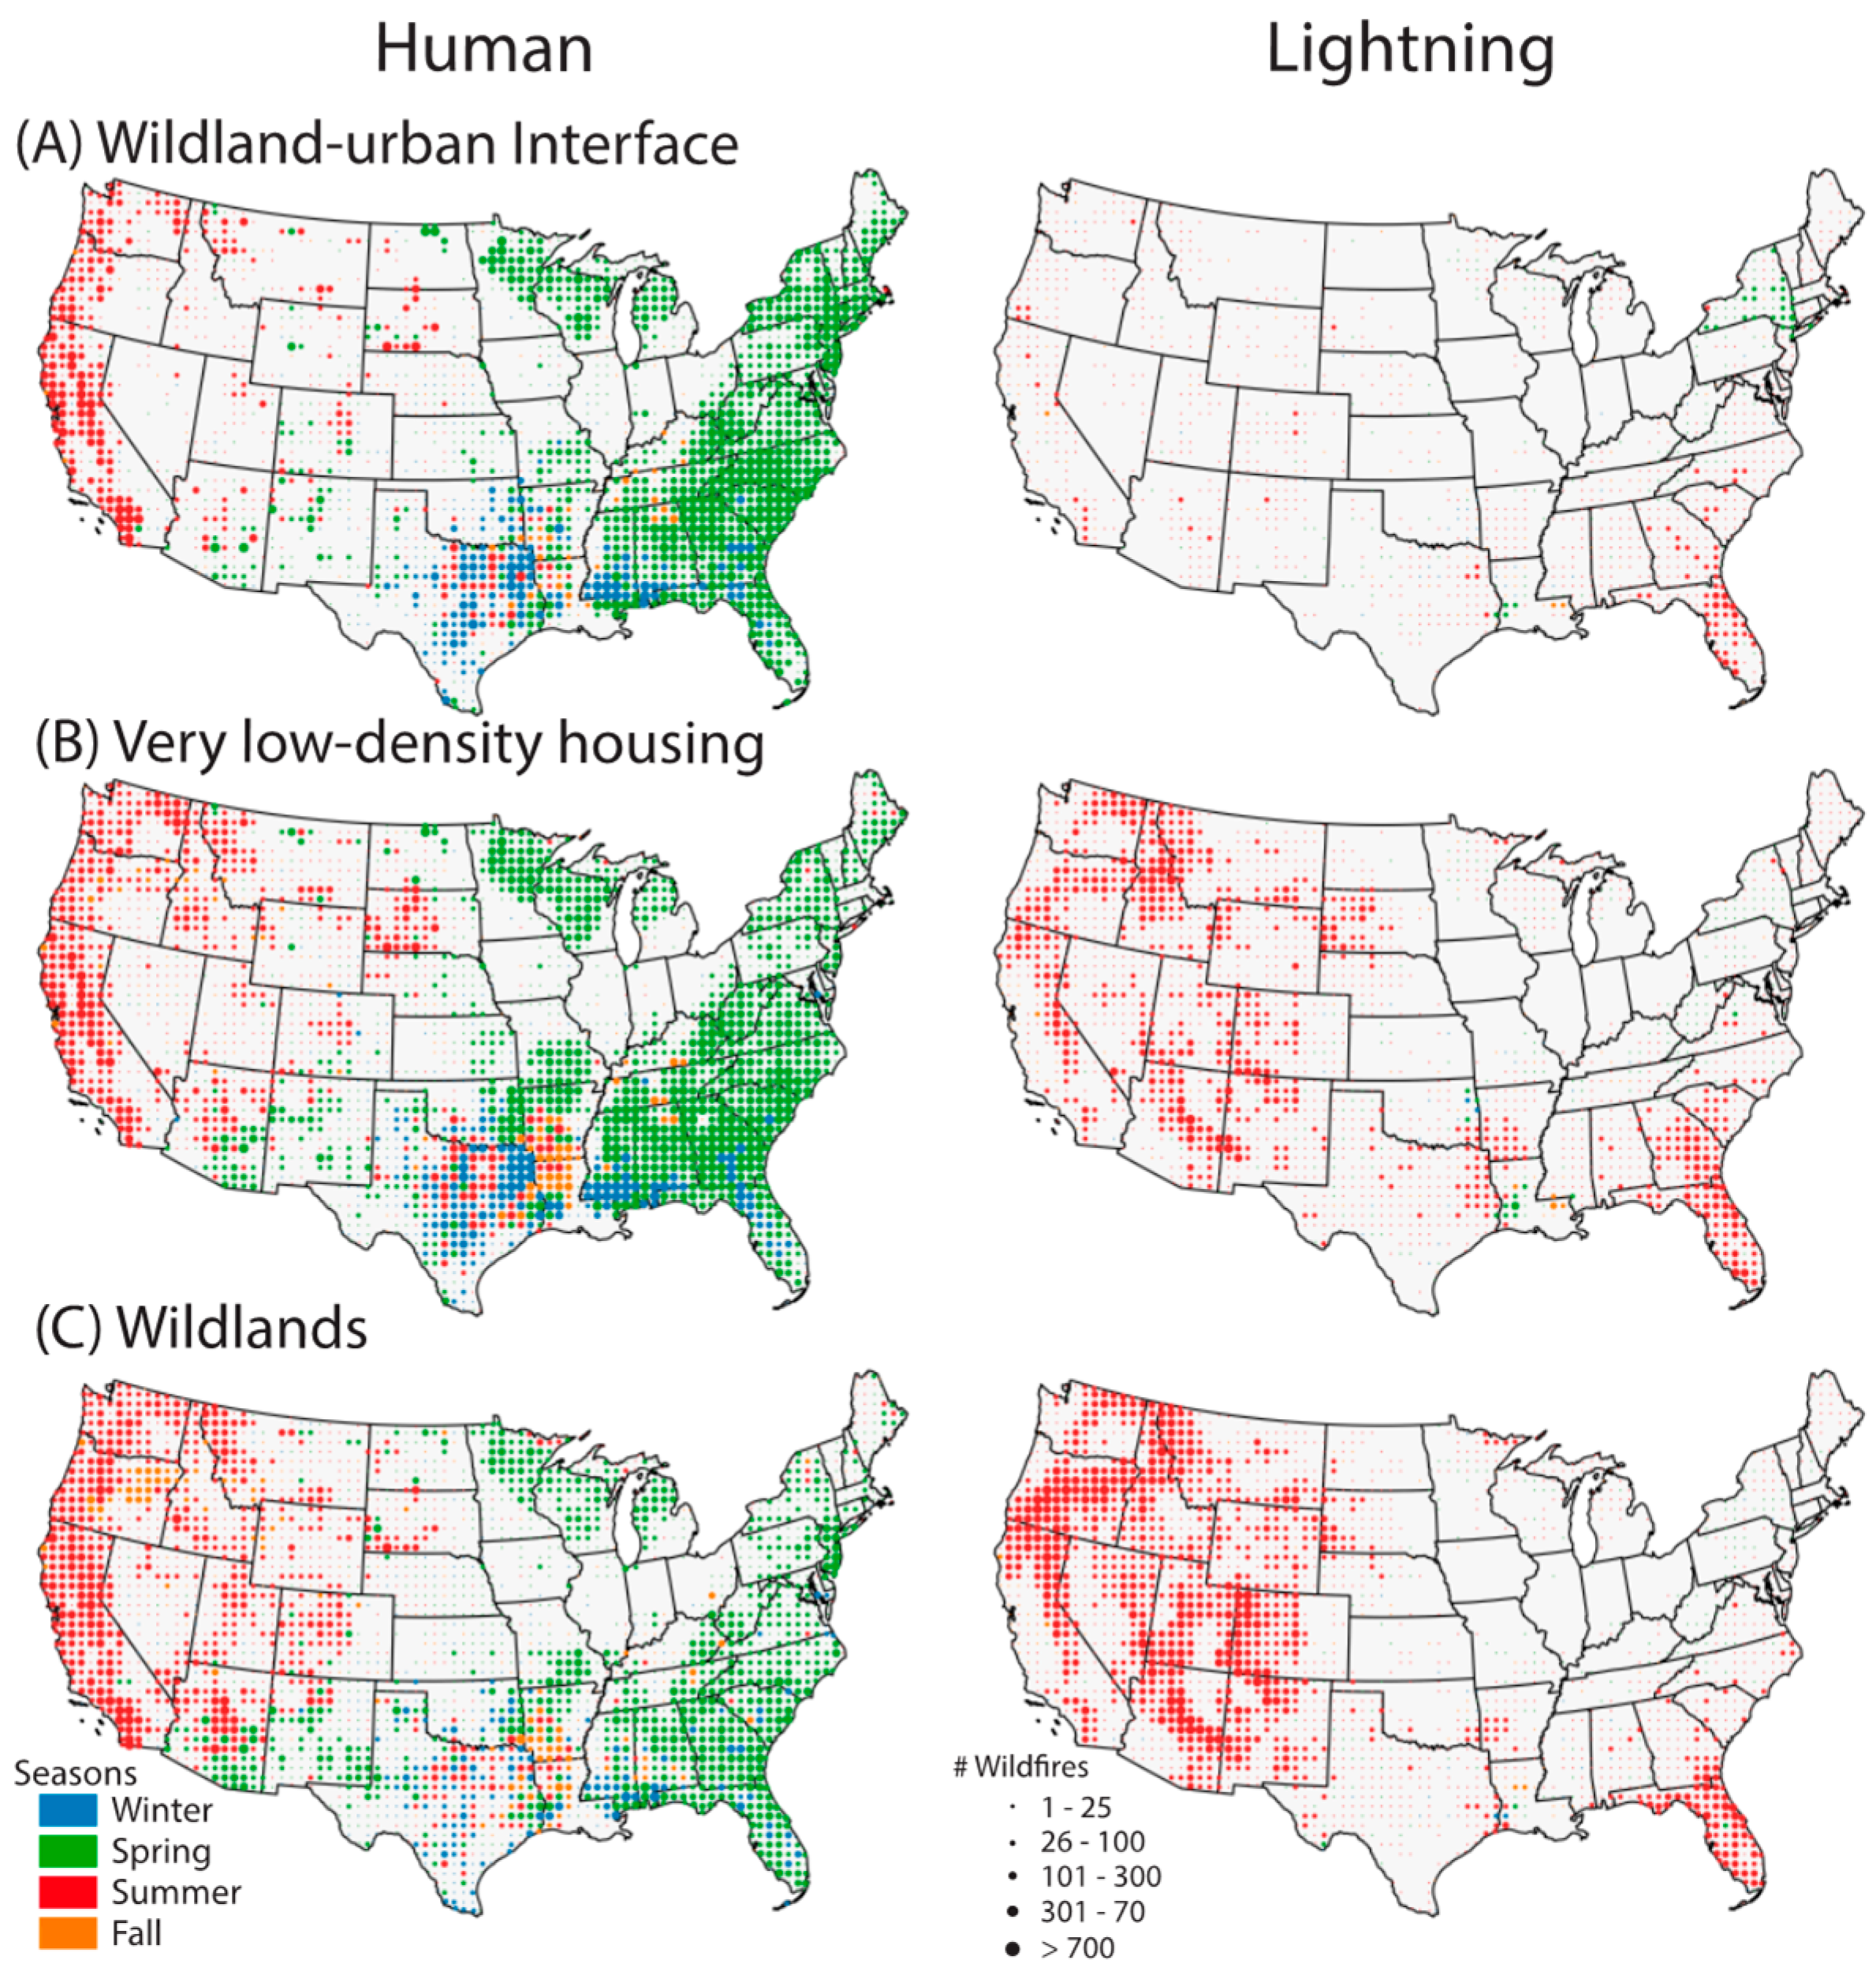
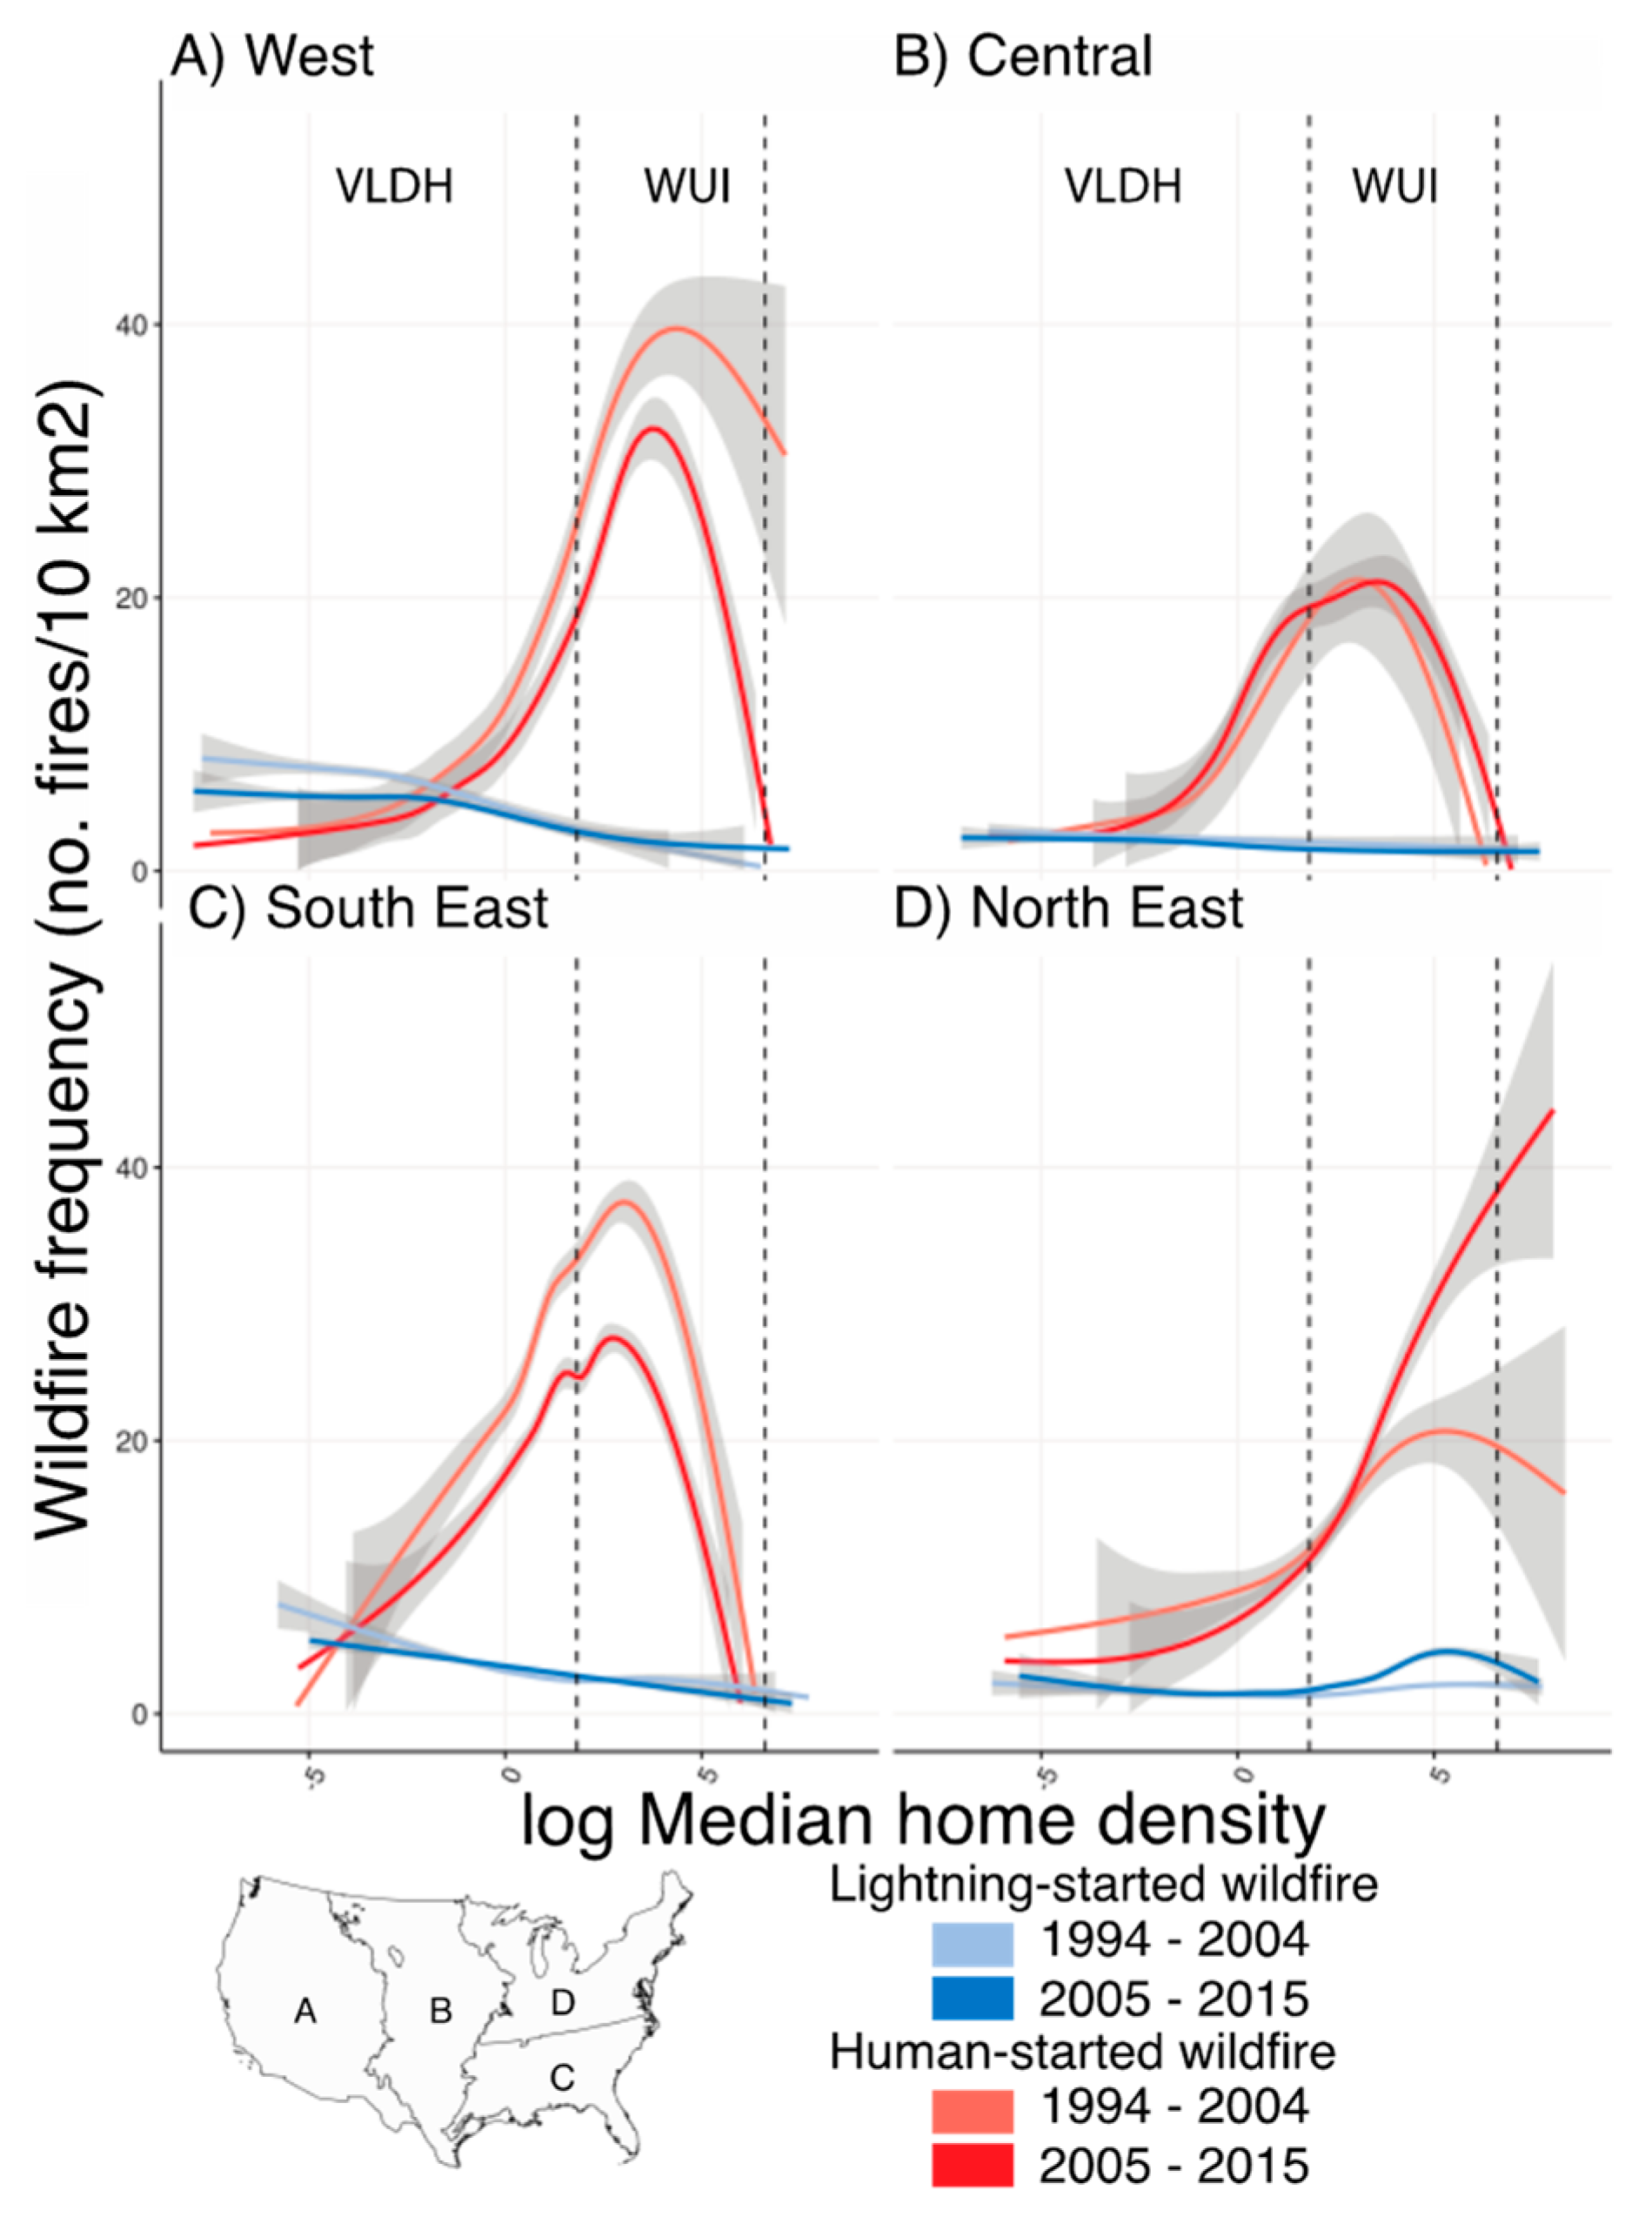
4.2. In the WUI, Humans Caused Nearly All Wildfires, Doubled Fire Season Length, and Increased the Number of Wildfires More than 20-Fold, Compared to Lightning-Started Wildfires

Humans caused 97% of all wildfires (n = 424,700) in the wildland-urban interface, 85% of all wildfires (n = 459,054) in the very-low-density housing, and 59% of all wildfires (n = 242,047) in the wildlands between 1992 and 2015 (Figure 1A, Table 1). All fires < 0.001 acres or fires that had a missing or undefined cause were removed from the dataset prior to analysis [8]. In total, human-caused wildfires, irrespective of where they were ignited, burned 12,411 km2 of the WUI (Figure 1B), 78,484 km2 of the VLDH (Figure 2B,C), and 82,934 km2 of the wildlands (Figure 2B,C). In the WUI and VLDH ~50% and ~30% of that area were burned by small fire events (< 4 km2), while in the wildlands ~62% of that area was burned by large fire events (4–500 km2). Human-caused large wildfires (4–500 km2) burned 3311 km2 of the WUI. Notably, there were no very-large wildfires (>500 km2) that started in the WUI. Large, human-caused wildfires burned >4 times more of the WUI in the western U.S. (n = 123; 1549 km2 area burned) than the eastern U.S. (n = 113; 1228 km2 area burned), while small human-caused fires were frequent and burned >7 times more land area of the WUI in the eastern U.S. (n = 327,108; 7027 km2 area burned) as compared to the west (n = 69,449; 1008 km2 area burned) (Table S1). Wildfires in the WUI were predominantly caused by people across all regions but wildfires in the WUI, VLDH, and wildlands were most abundant in the southeast and western coastal areas of the U.S. (Figure 1A and Figure 2A). Outside of the WUI, lightning-caused wildfires were most frequent and burned the most land area throughout the intermountain west, while human-caused wildfire dominated wildfire burned area and frequency along the Pacific coast and throughout the eastern U.S. (Figure 2). The eastern regions experienced the greatest growth in wildfire occurrence within the WUI, VLDH, and wildlands due to humans, by a factor of 5, 5, and 6, respectively, compared to the increase in wildfire occurrence due to lightning (Table S1).
Human-caused fires exceeded twice the length of the fire season in the WUI, VLDH, and wildlands, expanding it to 148, 164, and 141 days, respectively, compared to lightning wildfire season (WUI = 72 days, VLDH = 45 days, and wildlands = 42 days; Table 1, Figure 3). Human-caused wildfire ignitions were most prevalent during the spring months (March, April, May) in the east and the summer in the west (June, July, August) (Figure 4, Table S2). Human-caused wildfires in the WUI during the shoulder seasons caused the greatest area burned (spring = 4665 km2; fall = 4641 km2) and the highest number of fires (spring = 179,736; fall = 76,041) (Table S2a). While in the VLDH and wildlands, lightning-started wildfires in the wildlands during the summer months caused the greatest area burned (VLDH = 59,563 km2, wildlands = 135,614 km2) and the highest number of fires in the spring for VLDH area and summer for wildland areas (VLDH = 178,206, wildlands = 134,309) (Table S2). The median discovery date for human-caused fires in the WUI was over 3-mo earlier (20 May) than lightning-caused fires (26 July), in the VLDH was 2-mo earlier (9 May) than lightning-started fires (26 July), and wildlands over 3-mo earlier (22 June) than lightning-started fires (27 July) (Table S1). Humans-caused fires in the WUI resulted in a longer wildfire season, as the median discovery date for autumn fires was 33 days later for human-caused fires than for lightning-caused fires (16 October and 13 September, respectively).
Within the WUI, humans increased the number of wildfires, relative to the number of lightning-caused wildfires, 36-fold in the eastern (n = 318,163) and 23-fold in the western U.S. (n = 66,232). Human-caused ignitions at and near the WUI (WUI plus areas of very-low-density housing) resulted in 883,680 (64%) wildfire ignitions, 74,603 km2 of area burned (20%). The effect of human ignitions on wildfire frequency (Figure S2) and season length (Figure S3) is clearly evident within at least 80 km from the high-density urban areas, compared to lightning ignitions. See Tables S3 and S4 for state and level 3 ecoregion analysis.
Overall, human-caused wildfire frequency peaks at median home densities associated with the WUI in the west (40 homes/10 km2), central (34 homes/10 km2), and southeastern (14 homes/10 km2) U.S. (Figure 5), and in higher median home densities in the northeastern U.S. characteristic of urban zones (3100 homes/10 km2). There are no clear trends for lightning-caused wildfire as a function of median home density, but generally decreasing relationship with increasing home density. Across all regions, fire season length of human-caused wildfires peak at the transition between VLDH and WUI areas (Figure 5).

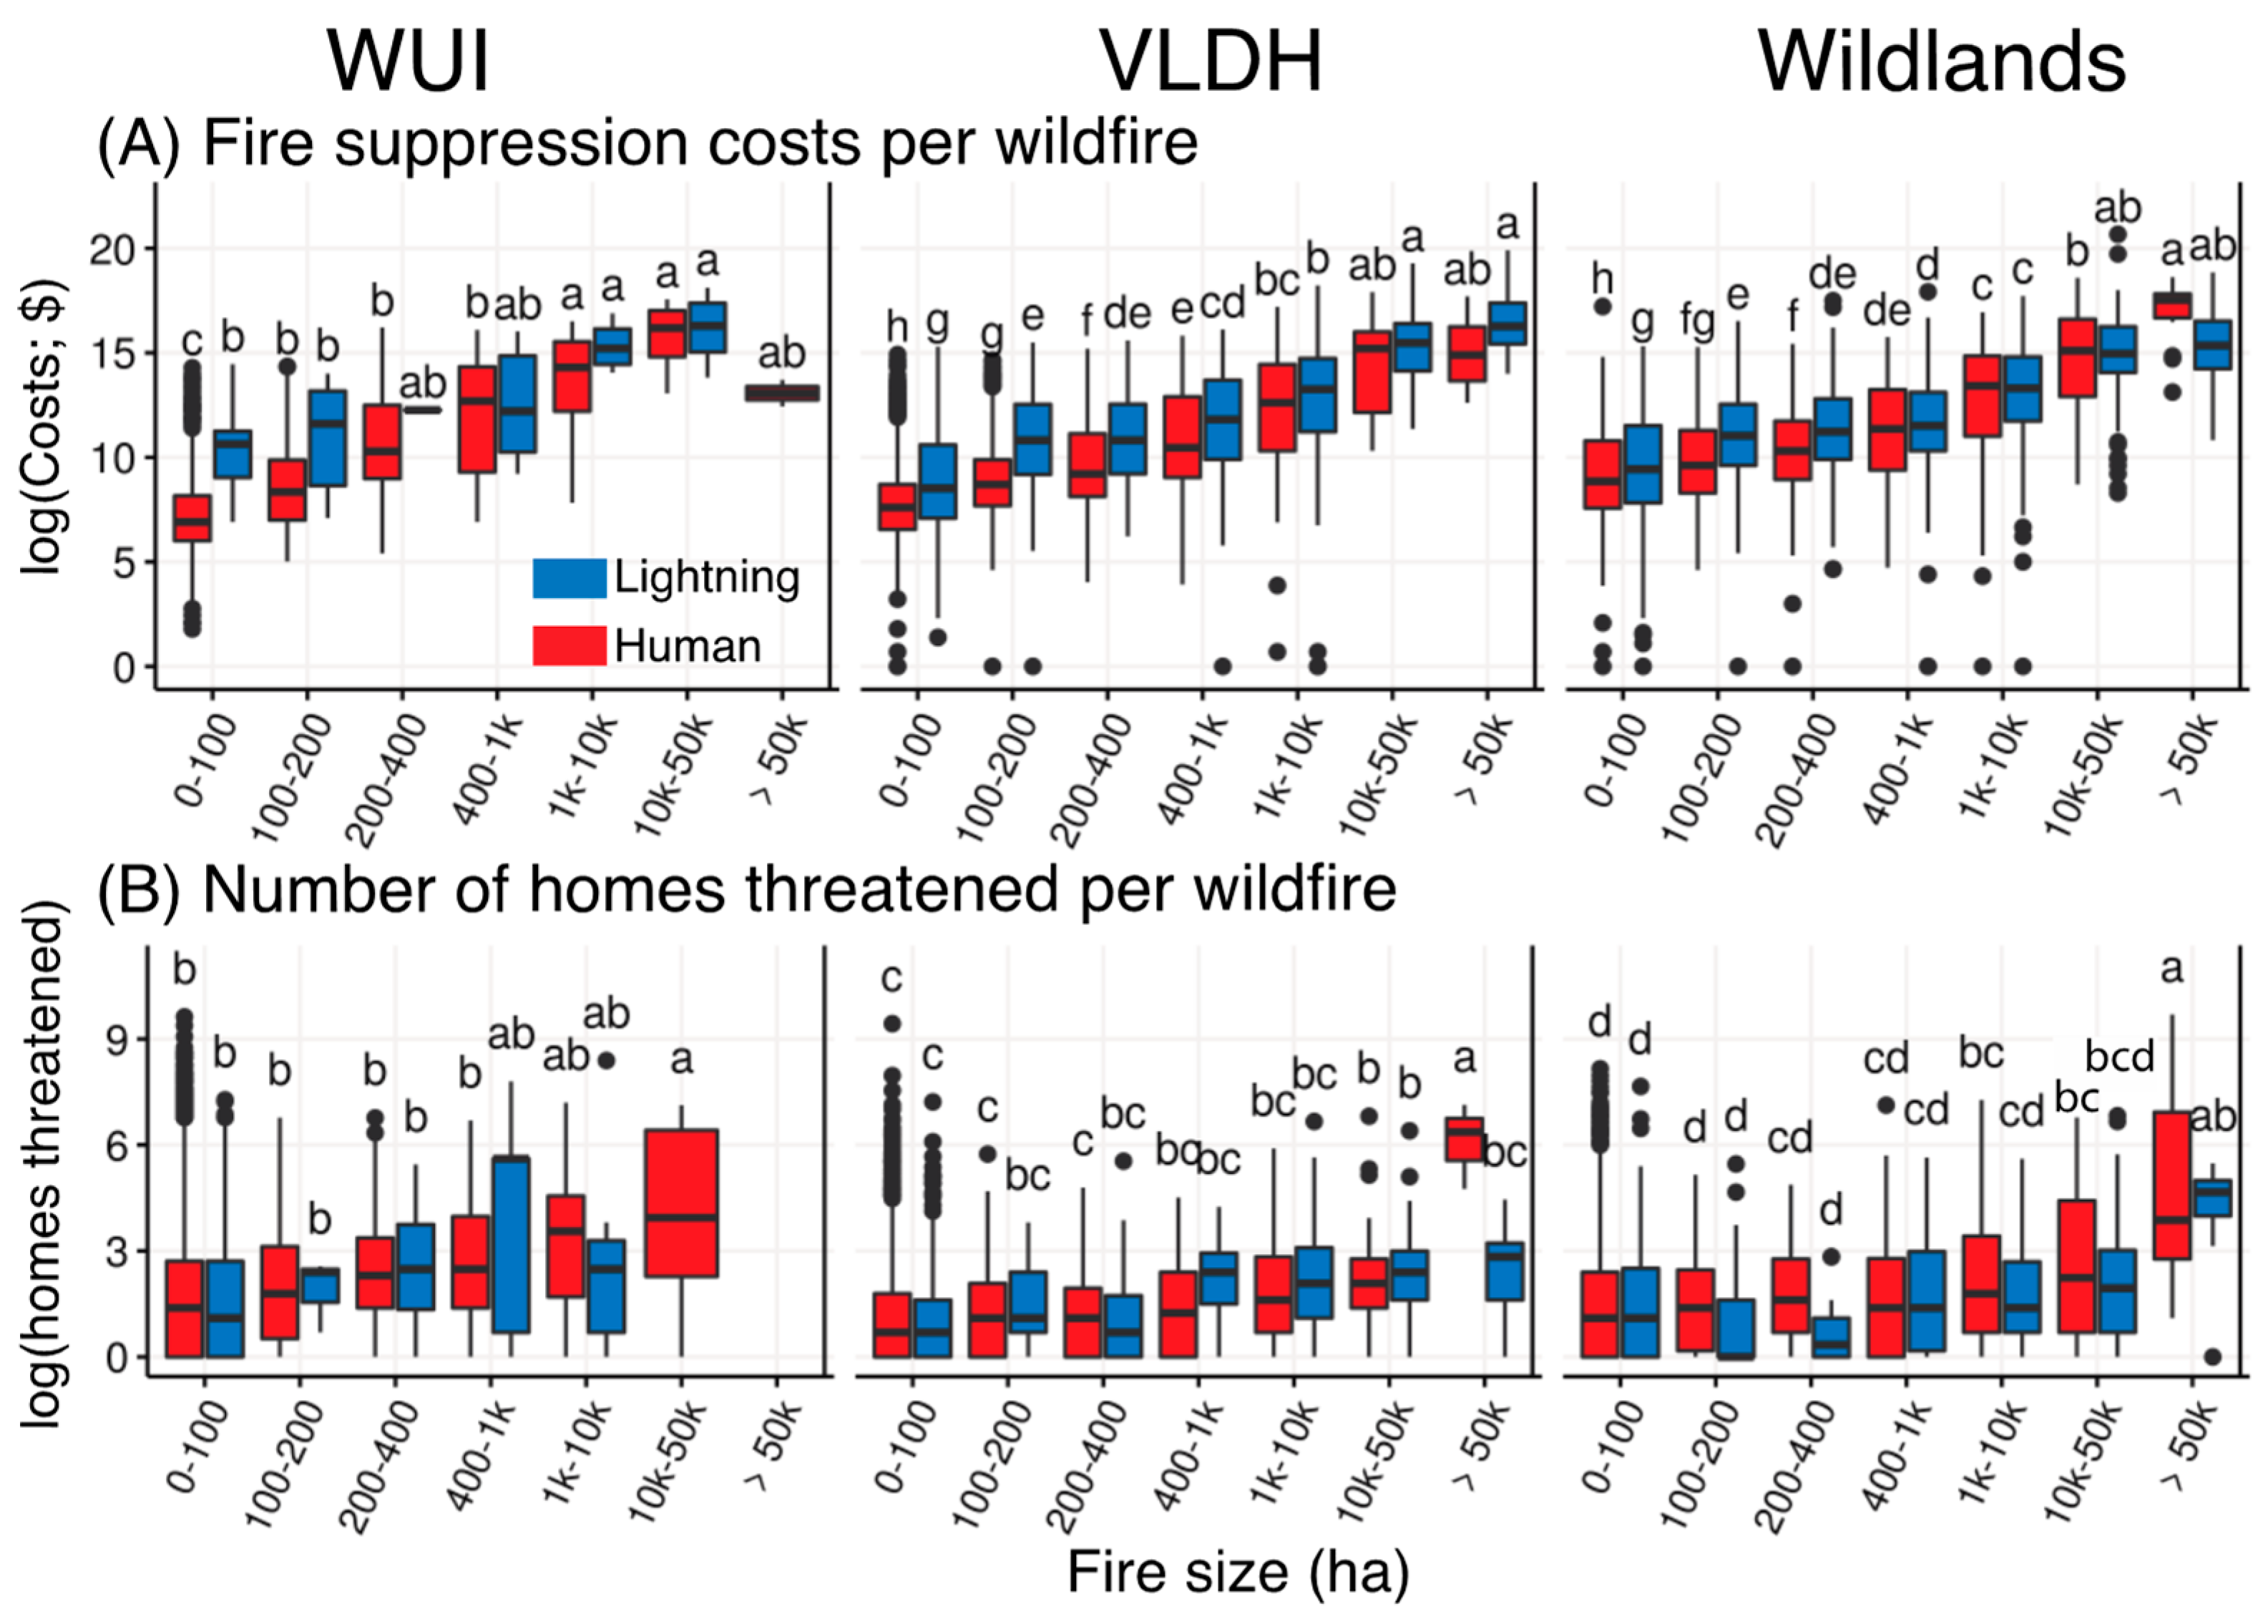
4.3. Suppression Costs were Significantly Higher When Protecting Homes

Overall suppression costs/km2 were more than ten times greater when any homes were at risk, regardless of ignition type, compared with when no homes were at risk ($57,670/km2 vs. $4076/km2). Additionally, in communities that were directly threatened by wildfires, the associated suppression costs proportionally increased with wildfire size, irrespective of ignition type (Figure 6).
The average cost of suppression in the WUI doubled ($32.5 million to $65.1 million per wildfire) and tripled in the wildlands ($559,000 to $1.7 million per wildfire) from 1999–2014. Suppression of human-caused wildfires in the WUI cost $78,105/km2 per year ($58,202–$98,682). Similarly, the per year total suppression costs of controlling human-caused wildfires in the WUI averaged $26 million ($18,875,066 – $34,843,955) (Table S5). Human-caused wildfire costs also varied geographically, with suppression of WUI fires in the West ($220,080/km2) costing twelve times more than in the eastern U.S. ($18,300/km2). Similarly, VLDH and wildlands fires in the West (VLDH = ($75,944/km2 ($52,615–$102,362), wildlands = $98,105/km2 ($72,142–$127,172)) cost six times more than the eastern U.S. (VLDH = ($9,756/km2 ($5,852–$15,222), wildlands = $21,225/km2 ($9,964–$38,665)). Regardless of where the fire originated, the yearly average costs to suppress wildfires nearly doubled from $809 million to $1.55 billion between 1999 and 2014. Further, over half of the costs to fight wildfires were spent on wildfires that threatened residential homes (53% or $8.8 billion; Table S6).

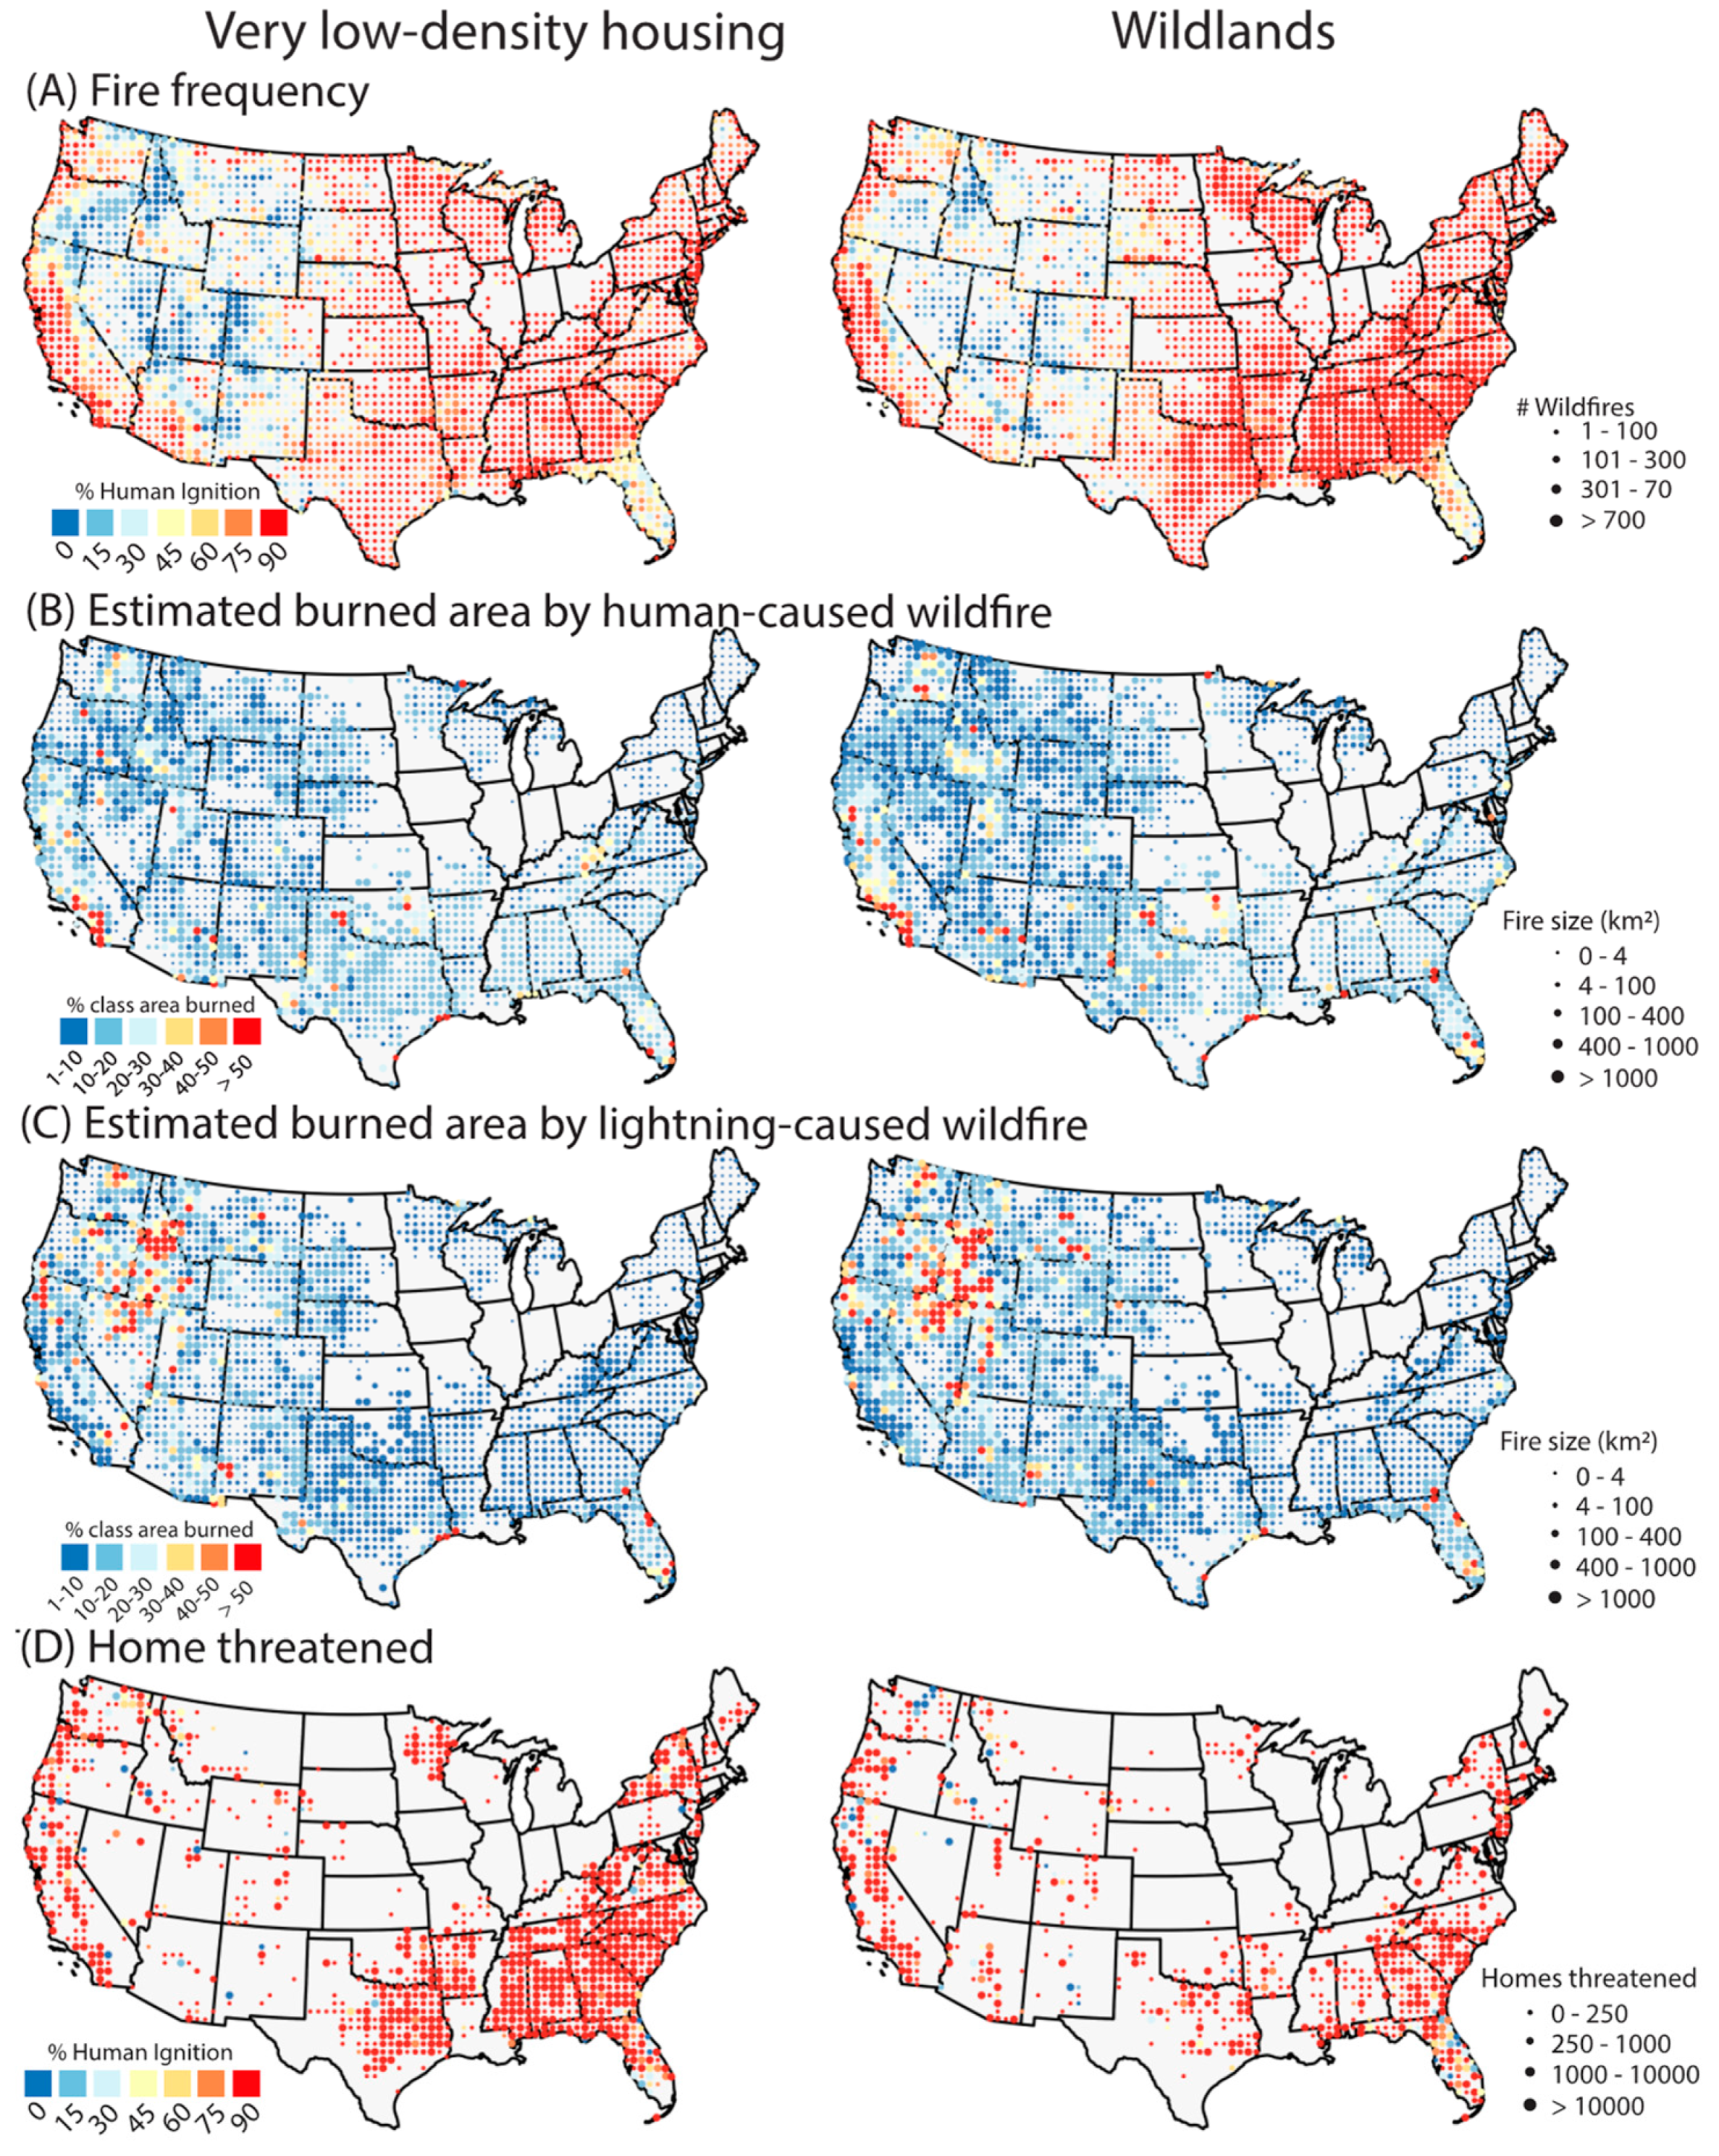
4.4. Sixty Million Residential Homes Cumulatively were Within One km of Human-Ignited Wildfires in the WUI

During the study period (1992–2015), over one million homes cumulatively were within perimeters of human-caused wildfire in the WUI, with another 58.8 million homes within 1 km of a wildfire in the WUI (see methods for accuracy assessment). Regardless of ignition location, human-caused wildfires threatened 96% (74,243,133) of all homes threatened by wildfire between 1992 and 2015, while lightning-caused wildfire threatened 2,702,625 homes. Human-caused wildfires accounted for 97% (1,037,018), 93% (127,570), 91% (133,333) of total cumulative residential homes threatened within fire perimeters that ignited in the WUI (Figure 1C), VLDH, and wildlands (Figure 2D), respectively (Table 1).
Human-caused wildfires in the WUI threatened an annual average of 2,493,730 (2,213,141–2,787,175) homes between 1999–2014 (Table S5). Human-caused wildfires in the WUI threatened 30 times more residential homes per year (51,677 (42,692–63,871)) than lightning-caused wildfire (1640 (1021–2404)). Although human-caused fires account for less than half of the overall burned area, they were the main cause of homes threatened, with over 74 million residential structures cumulatively within 1 km of human-caused wildfires. Regardless of development class, small human-caused wildfires were more prevalent and consequently the greatest aggregate threat to homes, with 92% (73,738,356) of homes within wildfire perimeters or threatened by small fires (Table S1). The average number of homes threatened was proportional to the relative size of the wildfire area (Figure 6B). For instance, the smallest wildfires (<1 km2) threatened on average 1.4 homes (1.3–1.5), while the largest wildfires (>500 km2) threatened on average 551 (71.1–1350.0) homes.

5. Discussion

This study illustrates how the WUI, which accounts for only a small portion of U.S. land area (<10%), acts as a major source of wildfires, almost exclusively human-caused (Figure 1A). WUI-originated fires also account for a disproportionate number of homes threatened and suppression costs, relative to its area, and expand to burn large areas of surrounding very low-density housing areas (Table 1). Nearly a third of all wildfires between 1992 and 2015 started in the WUI, making these areas a high priority for policy and management aimed at reducing human ignitions as well as promoting resilience to future fires. Our findings directly connect two primary aims of the U.S. Forest Service’s National Cohesive Wildland Fire Management Strategy [39], namely, protecting homes, communities and other values at risk; and managing human-caused ignitions. Furthermore, understanding that the WUI is a major source of human-caused ignitions, which pose significant threats to WUI communities, will be useful in designing more effective WUI-centric outreach programs to reduce the number of unwanted human-caused fires [40].
Human-caused ignitions increased the average fire season length two-fold and fire frequency more than two-fold relative to lightning ignitions within the WUI. Previous studies have found that early onset warming and drier conditions [41,42] from anthropogenic climate change [43] and human-caused wildfire [8] have increased the frequency and length of wildfire season across the U.S. This study found a more nuanced relationship: the vast majority of spring wildfires across the U.S. were almost exclusively anthropogenic and occurred within the WUI. By delineating where wildfires are occurring (i.e., the WUI) and at what time of the year the wildfire season is expanding (i.e., the shoulder seasons [8,44]), policy makers and government officials can more accurately assess budget allocations and risks associated with seasonal behaviors to reduce wildfire occurrence. We further found that wildfire in the WUI, where communities are at most risk, occurred throughout the entire year, solely by human-caused ignitions.
We documented that the presence of people enables human-related ignitions well beyond the WUI, but there are important regional differences (Figure 5 and Figures S2–S4)) in human-dominated fire frequency and fire season length. Human-caused wildfires are dominant from the WUI to at least 80 km from the urban core in the western U.S., and greater than 100 km in the northeast and central U.S. This result implies that the human imprint on wildfire extends far beyond the currently defined WUI boundary, that human ignitions may replace the role of lightning ignitions in some places, and that the footprint of WUI development may be underestimated, and more varied, than currently represented [7]. The very low-density housing class, which represent 29% of US land area, will be a critical transition zone for wildfires to burn into WUI areas due to their relatively close proximity to the WUI, yet are not accounted for in previous WUI analyses [3,5,7,31].
Changing climatic conditions have increased temperatures and promoted longer and more extreme precipitation events in some places [45,46] leading to an higher fuel loads, both live and dead, in many fire some systems [15]. Over the past several decades, greater fire activity and total burned area has occurred [10,11,19,43,47,48,49,50,51], which is predicted to increase in the U.S. in coming years [52,53,54]. This study found that the majority of human-caused wildfires were relatively small (<4 km2) but were responsible for the vast majority of homes threatened (92%). Of critical importance, wildfires did not have to be large to threaten homes. In the future, with more extreme climatic [55] and weather conditions [49] these small wildfires, however, have a greater potential to grow into larger wildfires [47].
Our results highlight a critical overlap between human ignitions and infrastructure assets at risk from fire. Though the ZTRAX database underestimates the total number of homes across the U.S. by roughly 30% (86.7 million properties) compared to the U.S. Census (125.8 million homes) (more detailed evaluation of the ZTRAX data and the derived HISDAC-US surfaces is described in Uhl et al. [56]), the increased spatial and temporal precision allowed us to analyze the potential impact of all wildfire sizes (Figure 7), resulting in an estimated five times more homes threatened within wildfire perimeters than previously documented [7]. Moreover, from 1990 to 2015, there were an estimated ~32 million more homes built within the WUI (145% increase), demonstrating substantial growth over this period.
We found that suppression costs are tightly linked to structures threatened, rather than simply being in the WUI, suggesting that implementing defensible spaces around homes remains a critical step in mitigating fire risk and suppression costs. While it has been suggested that the tripling in fire suppression expenses since the early 1990s has been partly due to increased wildfire risk within the WUI [16,54], we found that suppression costs from wildfires originating within the WUI were small (Table 1), likely because WUI fires tended to be small. WUI-originated fires may be likely detected, accessed, and suppressed earlier and more easily—likely resulting in smaller fires on average (mean fire size WUI = 5 ha vs. wildlands = 75 ha) without the need for an incident command response. Nonetheless, of the fires that needed an incident command response, the relatively low contribution of the WUI to fire suppression costs is counterbalanced by the significant threat of wildfires to structures in the WUI. Overall, while suppression costs within the WUI were low relative to total suppression costs across the U.S. when homes were threatened by wildfire, suppression costs were always high (Table S3).
We show that people are directly responsible for increasing wildfire risk where there are homes, highlighting the importance of policy efforts that aim to reduce ignitions in the WUI. There has been strong messaging around reducing the human-related ignitions that start forest fires, e.g., the Smokey Bear advertising campaign around campfires [57]). But it is critical to note that the primary sources of human ignitions in the WUI are debris burning, arson and equipment use; and outside the WUI the most prominent are railroads, roadways, power lines, and campsites [8,21]. There is a critical need to target messaging and efforts directed at reducing ignitions from these different and complex human activities in the WUI; we effectively need a suburban Smokey Bear. Further, given the year-round fire season—predominantly driven by human-related ignitions—it is also important to increase awareness about fire risk outside of the typical summer wildfire season, and support restrictions on debris burning in spring and fall months when fire danger is high, especially in the eastern U.S. In addition, new initiatives could focus on areas with much finer precision as an important result of employing novel settlement data products (Figure 7; [28,56]) in this study, which showed that risk across the WUI is much more varied than assumed and can be closely interlinked to the location of residential structures. Generally, more effective ways to communicate fire risk to the public and decrease ignitions near vulnerable communities is needed [58,59].
Approaches for reducing wildfire risk to communities have proposed ignition-resistant building materials and fuel-reduction treatments in and around homes in the WUI fire-prone areas of the western United States [30,31,60,61,62]. Community protection is a key priority in national firefighting strategies, but we should consider where fuel reduction strategies would be most effective—at the individual home level or focused within the WUI [15,63]. In conjunction with defensible space management, wildfire suppression that is more narrowly focused on lands surrounding communities that are most at-risk should be prioritized, allowing wildfire to burn in the wildlands where fire will have an ecological benefit and support future wildfire hazard mitigation and utilizing prescribed burns as a mechanism to mitigate extreme future fires [15,54,64,65].

Limitations

There are some limitations and observed biases in the utilized datasets that are important to acknowledge. First, the FPA-FOD database captures many small events; wildfires less than or equal to 100 ha account for 98% (1,675,166 out of 1,700,188 events) of the database. There is an implicit bias towards reporting of small fires near communities, as they are more likely to be reported than small events in the wildlands. These smaller events are also more likely to be human-caused, and because they are near human settlement, they are more likely to be shorter in duration and smaller because they are identified quickly and easier to access. Due to the smaller size, these fires are almost always overlooked when exploring wildfire presence on the U.S. landscape, particularly because one of the most commonly used fire perimeter datasets has a cut-off threshold for inclusion of 1000 acres in the west and 500 acres in the east (e.g., MTBS). Yet, there has been a longer selection bias in the wildfire literature excluding these smaller fires (e.g., [19,41,47,49,66,67]), which are responsible for the vast majority of homes threatened. Furthermore, smaller wildfires are much higher in frequency than large events, which may be a greater concern to WUI communities under a changing climate [43,44].
Second, while the FPA-FOD database is unique in that it contains critical information on the type and location of the wildfire ignition, it lacks final wildfire perimeter vector polygons. When perimeters were not available through the MTBS dataset, we used a circular buffer equal to the final size of the wildfire burn area. For FPA-FOD wildfire ignition points that had an associated MTBS wildfire ID we substituted that particular wildfire perimeter for the generalized buffer. These MTBS wildfire perimeters account for 83% (7693 out of 9260) of all large wildfires in the combined database (>400 ha). This addition of the 1 km (or 100 ha) buffer is large enough to capture the variation in wildfire perimeter due to topographic/weather/and or suppression efforts. When the wildfire was less than 100 ha, the 1-km buffer completely consumed the known perimeter, making the more preferable and detailed wildfire perimeter unnecessary for those calculations. Because wildfires less than or equal to 100 ha account for 98% of the wildfire database, we are confident that our estimates for homes threatened within 1 km of an event are reliable. Further, it has been estimated that embers can travel up to 1 mile (1.6 km) or further from a fireline, a mechanism generally explored only for larger wildfires [68]. Since the majority of the wildfires in our database are smaller fires (<100 ha; n = 1,675,166) rather than larger fires (>400; n = 7693), we chose a more conservative estimate of distance from the fireline of 1 km rather than 1 mile.
Third, based on comparisons with the US census data for 1990, 2000, and 2010, the ZTRAX data underestimate housing counts by 30%. Therefore, the estimates provided here are likely underestimating the true threat to homes. ZTRAX housing property counts and county stats on housing units are strong, >95% in urban counties and >75% in rural counties during this time period [56].

6. Conclusions

We demonstrate the remarkable effect that humans have had on introducing wildfire to all landscapes of the conterminous US, most importantly within the WUI, through changes in wildfire frequency, seasonality, burned area, and associated costs. We found that human-caused wildfire was responsible for the vast majority of residential homes threatened between 1992 and 2015. People are starting almost all of the wildfires that threaten our homes. Further, the costs to protect homes from wildfires account for over half of the suppression budget. These results have two implications; first, there is a great need to determine how best to reduce human-related ignitions that result in damaging wildfires; and second, this provides greater justification for implementing fuel treatments and prescribed burns, where safe, to mitigate the risk and threat of future wildfires, particularly near and within the WUI. A better understanding of our own relationship with fire, how we promote it, and how we are vulnerable to it, ultimately will help us live more sustainably with fire.

Supplementary Materials

The following are available online at https://0-www-mdpi-com.brum.beds.ac.uk/2571-6255/3/3/50/s1.

Author Contributions

Conceptualization, N.M., J.K.B., S.L. and B.A.B.; Data curation, N.M. and L.A.S.D.; Formal analysis, N.M.; Funding acquisition, J.K.B.; Investigation, N.M. and T.S.; Methodology, N.M., J.K.B., T.S. and S.L.; Project administration, J.K.B., T.S. and B.A.B.; Resources, J.K.B., S.L. and L.A.S.D.; Supervision, J.K.B. and T.S.; Validation, N.M.; Visualization, N.M.; Writing—original draft, N.M., J.K.B., T.S., S.L., L.A.S.D. and B.A.B.; Writing—review & editing, N.M., J.K.B., T.S. and S.L. All authors have read and agreed to the published version of the manuscript.

Funding

This research was supported by the Earth Lab through the University of Colorado, Boulder’s Grand Challenge Initiative. Partial support was provided through the Humans, Disasters, and the Built Environment program of the National Science Foundation, Award Number 1924670 to the University of Colorado Boulder.

Acknowledgments

We thank A. Mahood and R. Chelsea Nagy for valuable discussions and J. Uhl for the original processing of the ZTRAX database. We also thank A. Park Williams, Todd Hawbaker, and Melanie Vanderhoof for their detailed manuscript review. Data and materials availability: The authors were provided access to the Zillow Transaction and Assessment Dataset (ZTRAX) through a data use agreement between the University of Colorado Boulder and Zillow Inc. More information on accessing the data can be found at http://www.zillow.com/ZTRAX. The results and opinions are those of the author(s) and do not reflect the position of Zillow Group. Support by Zillow Inc. is gratefully acknowledged. The code used to analyze the data can be found at https://github.com/NateMietk/human-ignitions-wui. All data used, with the exception of raw ZTRAX, is publicly available; a gridded version of the ZTRAX data can be found here: https://dataverse.harvard.edu/dataverse/hisdacus.

Conflicts of Interest

The authors declare no conflict of interest.

References

  1. Calkin, D.E.; Cohen, J.D.; Finney, M.A.; Thompson, M.P. How risk management can prevent future wildfire disasters in the wildland-urban interface. Proc. Natl. Acad. Sci. USA 2014, 111, 746–751. [Google Scholar] [CrossRef] [PubMed] [Green Version]
  2. Knorr, W.; Arneth, A.; Jiang, L. Demographic controls of future global fire risk. Nat. Clim. Chang. 2016, 6, 781–785. [Google Scholar] [CrossRef]
  3. Theobald, D.M.; Romme, W.H. Expansion of the US wildland–urban interface. Landsc. Urban Plan. 2007, 83, 340–354. [Google Scholar] [CrossRef]
  4. Hawbaker, T.J.; Radeloff, V.C.; Stewart, S.I.; Hammer, R.B.; Keuler, N.S.; Clayton, M.K. Human and biophysical influences on fire occurrence in the United States. Ecol. Appl. 2013, 23, 565–582. [Google Scholar] [CrossRef]
  5. Thomas, D.S.; Butry, D.T. Areas of the U.S. wildland–urban interface threatened by wildfire during the 2001–2010 decade. Nat. Hazards 2014, 71, 1561–1585. [Google Scholar] [CrossRef]
  6. Bowman, D.M.J.S.; Balch, J.; Artaxo, P.; Bond, W.J.; Cochrane, M.A.; D’Antonio, C.M.; DeFries, R.; Johnston, F.H.; Keeley, J.E.; Krawchuk, M.A.; et al. The human dimension of fire regimes on Earth. J. Biogeog. 2011, 38, 2223–2236. [Google Scholar] [CrossRef] [Green Version]
  7. Radeloff, V.C.; Helmers, D.P.; Kramer, H.A.; Mockrin, M.H.; Alexandre, P.M.; Bar-Massada, A.; Butsic, V.; Hawbaker, T.J.; Martinuzzi, S.; Syphard, A.D.; et al. Rapid growth of the US wildland-urban interface raises wildfire risk. Proc. Natl. Acad. Sci. USA 2018, 115, 3314. [Google Scholar] [CrossRef] [Green Version]
  8. Balch, J.K.; Bradley, B.A.; Abatzoglou, J.T.; Nagy, R.C.; Fusco, E.J.; Mahood, A.L. Human-started wildfires expand the fire niche across the United States. Proc. Natl. Acad. Sci. USA 2017, 114, 2946–2951. [Google Scholar] [CrossRef] [Green Version]
  9. Syphard, A.D.; Keeley, J.E.; Pfaff, A.H.; Ferschweiler, K. Human presence diminishes the importance of climate in driving fire activity across the United States. Proc. Natl. Acad. Sci. USA 2017. [Google Scholar] [CrossRef] [Green Version]
  10. Abatzoglou, J.T.; Kolden, C.A.; Williams, A.P.; Lutz, J.A.; Smith, A.M.S. Climatic influences on interannual variability in regional burn severity across western US forests. Int. J. Wildland Fire 2017, 26, 269–275. [Google Scholar] [CrossRef]
  11. Jolly, W.M.; Cochrane, M.A.; Freeborn, P.H.; Holden, Z.A.; Brown, T.J.; Williamson, G.J.; Bowman, D.M. Climate-induced variations in global wildfire danger from 1979 to 2013. Nat. Commun. 2015, 6, 1–11. [Google Scholar] [CrossRef]
  12. Abatzoglou, J.T.; Williams, A.P.; Boschetti, L.; Zubkova, M.; Kolden, C.A. Global patterns of interannual climate–fire relationships. Glob. Chang. Biol. 2018. [Google Scholar] [CrossRef] [PubMed]
  13. Parks, S.A.; Holsinger, L.M.; Miller, C.; Nelson, C.R. Wildland fire as a self-regulating mechanism: The role of previous burns and weather in limiting fire progression. Ecol. Appl. 2015, 25, 1478–1492. [Google Scholar] [CrossRef] [PubMed]
  14. Higuera, P.E.; Abatzoglou, J.T.; Littell, J.S.; Morgan, P. The Changing Strength and Nature of Fire-Climate Relationships in the Northern Rocky Mountains, U.S.A., 1902–2008. PLoS ONE 2015, 10, e0127563. [Google Scholar] [CrossRef] [Green Version]
  15. Schoennagel, T.; Balch, J.K.; Brenkert-Smith, H.; Dennison, P.E.; Harvey, B.J.; Krawchuk, M.A.; Mietkiewicz, N.; Morgan, P.; Moritz, M.A.; Rasker, R.; et al. Adapt to more wildfire in western North American forests as climate changes. Proc. Natl. Acad. Sci. USA 2017, 114, 4582–4590. [Google Scholar] [CrossRef] [Green Version]
  16. Gorte, R. The Rising Cost of Wildfire Protection; Headwaters Economics: Bozeman, MT, USA, 2013; Available online: https://headwaterseconomics.org/wp-content/uploads/fire-costs-background-report.pdf (accessed on 3 September 2020).
  17. Liu, Z.; Wimberly, M.C. Direct and indirect effects of climate change on projected future fire regimes in the western United States. Sci. Total Environ. 2016, 542, 65–75. [Google Scholar] [CrossRef] [PubMed] [Green Version]
  18. Liu, J.C.; Mickley, L.J.; Sulprizio, M.P.; Dominici, F.; Yue, X.; Ebisu, K.; Anderson, G.B.; Khan, R.F.; Bravo, M.A.; Bell, M.L. Particulate air pollution from wildfires in the Western US under climate change. Clim. Chang. 2016, 138, 655–666. [Google Scholar] [CrossRef] [PubMed] [Green Version]
  19. Dennison, P.E.; Brewer, S.C.; Arnold, J.D.; Moritz, M.A. Large wildfire trends in the western United States, 1984–2011. Geophys. Res. Lett. 2014, 41, 2928–2933. [Google Scholar] [CrossRef]
  20. NIFC. Federal Firefighting Costs (Suppression Only). Available online: https://www.nifc.gov/fireInfo/fireInfo_documents/SuppCosts.pdf (accessed on 9 June 2020).
  21. Fusco, E.J.; Abatzoglou, J.T.; Balch, J.K.; Finn, J.T.; Bradley, B.A. Quantifying the human influence on fire ignition across the western USA. Ecol. Appl. 2016, 26, 2390–2401. [Google Scholar] [CrossRef] [Green Version]
  22. Syphard, A.D.; Radeloff, V.C.; Keeley, J.E.; Hawbaker, T.J.; Clayton, M.K.; Stewart, S.I.; Hammer, R.B. Human influence on California fire regimes. Ecol. Appl. 2007, 17, 1388–1402. [Google Scholar] [CrossRef] [PubMed]
  23. Syphard, A.D.; Keeley, J.E. Location, timing and extent of wildfire vary by cause of ignition. Int. J. Wildland Fire 2015, 24, 37–47. [Google Scholar] [CrossRef]
  24. Braswell, A.E.; Leyk, S.; Connor, D.; Uhl, J. Historical Development of the Coastal United States: Evolution of Areas Vulnerable to Sea Level Rise. Nat. Commun. 2020. Submitted. [Google Scholar]
  25. Modugno, S.; Balzter, H.; Cole, B.; Borrelli, P. Mapping regional patterns of large forest fires in Wildland–Urban Interface areas in Europe. J. Environ. Manag. 2016, 172, 112–126. [Google Scholar] [CrossRef] [PubMed]
  26. Malamud, B.D.; Millington, J.D.A.; Perry, G.L.W. Characterizing wildfire regimes in the United States. Proc. Natl. Acad. Sci. USA 2005, 102, 4694–4699. [Google Scholar] [CrossRef] [PubMed] [Green Version]
  27. Short, K. Spatial Wildfire Occurrence Data for the United States, 1992–2015 [FPA_FOD_20170508], 4th ed.; Forest Service Research Data Archive: Fort Collins, CO, USA, 2017. [Google Scholar] [CrossRef]
  28. Leyk, S.; Uhl, J.H. HISDAC-US, historical settlement data compilation for the conterminous United States over 200 years. Sci. Data 2018, 5, 180175. [Google Scholar] [CrossRef] [PubMed]
  29. St. Denis, L.A.; Mietkiewicz, N.P.; Short, K.C.; Buckland, M.; Balch, J.K. All-hazards dataset mined from the US National Incident Management System 1999–2014. Sci. Data 2020, 7, 64. [Google Scholar] [CrossRef] [PubMed] [Green Version]
  30. Aronson, G.; Kulakowski, D. Bark beetle outbreaks, wildfires and defensible space: How much area do we need to treat to protect homes and communities? Int. J. Wildland Fire 2012, 22, 256–265. [Google Scholar] [CrossRef]
  31. Schoennagel, T.; Nelson, C.R.; Theobald, D.M.; Carnwath, G.C.; Chapman, T.B. Implementation of National Fire Plan treatments near the wildland–urban interface in the western United States. Proc. Natl. Acad. Sci. USA 2009, 106, 10706–10711. [Google Scholar] [CrossRef] [Green Version]
  32. Martinuzzi, S.; Stewart, S.I.; Helmers, D.P.; Mockrin, M.H.; Hammer, R.B.; Radeloff, V.C. The 2010 wildland-urban interface of the conterminous United States. In Research Map NRS-8; Department of Agriculture, Forest Service, Northern Research Station: Newtown Square, PA, USA, 2015; 124p. [Google Scholar]
  33. Short, K. Sources and implications of bias and uncertainty in a century of US wildfire activity data. Int. J. Wildland Fire 2015, 24, 883–891. [Google Scholar] [CrossRef]
  34. Eidenshink, J.; Schwind, B.; Brewer, K.; Zhu, Z.-L.; Quayle, B.; Howard, S. A project for monitoring trends in burn severity. Fire Ecol. 2007, 3, 3–21. [Google Scholar] [CrossRef]
  35. Wickham, J.D.; Stehman, S.V.; Gass, L.; Dewitz, J.; Fry, J.A.; Wade, T.G. Accuracy assessment of NLCD 2006 land cover and impervious surface. Remote Sens. Environ. 2013, 130, 294–304. [Google Scholar] [CrossRef]
  36. Krawchuk, M.A.; Moritz, M.A.; Parisien, M.A.; Van Dorn, J.; Hayhoe, K. Global pyrogeography: The current and future distribution of wildfire. PLoS ONE 2009, 4. [Google Scholar] [CrossRef] [PubMed]
  37. Syphard, A.D.; Keeley, J.E.; Massada, A.B.; Brennan, T.J.; Radeloff, V.C. Housing Arrangement and Location Determine the Likelihood of Housing Loss Due to Wildfire. PLoS ONE 2012, 7, e33954. [Google Scholar] [CrossRef] [PubMed] [Green Version]
  38. Fusco, E.J.; Finn, J.T.; Abatzoglou, J.T.; Balch, J.K.; Dadashi, S.; Bradley, B.A. Detection rates and biases of fire observations from MODIS and agency reports in the conterminous United States. Remote Sens. Environ. 2019, 220, 30–40. [Google Scholar] [CrossRef]
  39. USFS. The National Strategy. 2014. Available online: https://www.forestsandrangelands.gov/strategy/documents/strategy/CSPhaseIIINationalStrategyApr2014.pdf (accessed on 3 November 2017).
  40. Wildland Fire Leadership Council. Cohesive Strategy Crosswalk and Strategic Alignment. Available online: https://www.forestsandrangelands.gov/documents/strategy/reports/cohesive_strategy_crosswalk_and_strategic_alignment_report.pdf (accessed on 9 June 2020).
  41. Westerling, A.L. Increasing western US forest wildfire activity: Sensitivity to changes in the timing of spring. Philos. Trans. R. Soc. Lond. B Biol. Sci. 2016, 371. [Google Scholar] [CrossRef]
  42. Westerling, A.L.; Hidalgo, H.G.; Cayan, D.R.; Swetnam, T.W. Warming and earlier spring increase western U.S. forest wildfire activity. Science 2006, 313, 940–943. [Google Scholar] [CrossRef] [Green Version]
  43. Abatzoglou, J.T.; Williams, A.P. Impact of anthropogenic climate change on wildfire across western US forests. Proc. Natl. Acad. Sci. USA 2016, 113, 11770–11775. [Google Scholar] [CrossRef] [Green Version]
  44. Goss, M.; Swain, D.L.; Abatzoglou, J.T.; Sarhadi, A.; Kolden, C.A.; Williams, A.P.; Diffenbaugh, N.S. Climate change is increasing the likelihood of extreme autumn wildfire conditions across California. Environ. Res. Lett. 2020, 15, 094016. [Google Scholar] [CrossRef] [Green Version]
  45. Allen, C.D.; Breshears, D.D.; McDowell, N.G. On underestimation of global vulnerability to tree mortality and forest die-off from hotter drought in the Anthropocene. Ecosphere 2015, 6, 121–155. [Google Scholar] [CrossRef]
  46. Park Williams, A.; Cook, B.I.; Smerdon, J.E.; Bishop, D.A.; Seager, R.; Mankin, J.S. The 2016 Southeastern U.S. Drought: An Extreme Departure From Centennial Wetting and Cooling. J. Geophys. Res. Atmos. 2017, 122, 10888–10905. [Google Scholar] [CrossRef]
  47. Nagy, R.C.; Fusco, E.; Bradley, B.; Abatzoglou, J.T.; Balch, J. Human-Related Ignitions Increase the Number of Large Wildfires across U.S. Ecoregions. Fire 2018, 1, 4. [Google Scholar] [CrossRef] [Green Version]
  48. Balch, J.; Schoennagel, T.; Williams, A.; Abatzoglou, J.; Cattau, M.; Mietkiewicz, N.; St. Denis, L. Switching on the Big Burn of 2017. Fire 2018, 1, 17. [Google Scholar] [CrossRef] [Green Version]
  49. Abatzoglou, J.T.; Balch, J.K.; Bradley, B.A.; Kolden, C.A. Human-related ignitions concurrent with high winds promote large wildfires across the USA. Int. J. Wildland Fire 2018, 27, 377–386. [Google Scholar] [CrossRef]
  50. Williams, A.P.; Abatzoglou, J.T.; Gershunov, A.; Guzman-Morales, J.; Bishop, D.A.; Balch, J.K.; Lettenmaier, D.P. Observed impacts of anthropogenic climate change on wildfire in California. Earth’s Future 2019, 7. [Google Scholar] [CrossRef] [Green Version]
  51. Ganteaume, A.; Barbero, R. Contrasting large fire activity in the French Mediterranean. Nat. Hazards Earth Syst. Sci. 2019, 19, 1055–1066. [Google Scholar] [CrossRef] [Green Version]
  52. Barbero, R.; Abatzoglou, J.; Larkin, N.; Kolden, C.; Stocks, B. Climate change presents increased potential for very large fires in the contiguous United States. Int. J. Wildland Fire 2015, 10, 1071. [Google Scholar] [CrossRef]
  53. Krawchuk, M.A.; Moritz, M.A. Constraints on global fire activity vary across a resource gradient. Ecology 2011, 92, 121–132. [Google Scholar] [CrossRef]
  54. Moritz, M.A.; Batllori, E.; Bradstock, R.A.; Gill, A.M.; Handmer, J.; Hessburg, P.F.; Leonard, J.; McCaffrey, S.; Odion, D.C.; Schoennagel, T.; et al. Learning to coexist with wildfire. Nature 2014, 515, 58–66. [Google Scholar] [CrossRef]
  55. Holden, Z.A.; Swanson, A.; Luce, C.H.; Jolly, W.M.; Maneta, M.; Oyler, J.W.; Warren, D.A.; Parsons, R.; Affleck, D. Decreasing fire season precipitation increased recent western US forest wildfire activity. Proc. Natl. Acad. Sci. USA 2018. [Google Scholar] [CrossRef] [Green Version]
  56. Uhl, J.; Leyk, S.; McShane, C.; Braswell, A.; Connor, D.; Balk, D. Fine-grained, spatio-temporal datasets measuring 200 years of land development in the United States. Earth Syst. Sci. Data 2020. [Google Scholar] [CrossRef]
  57. Donovan, G.H.; Brown, T.C. Be careful what you wish for: The legacy of Smokey Bear. Front. Ecol. Environ. 2007, 5, 73–79. [Google Scholar] [CrossRef] [Green Version]
  58. Brenkert-Smith, H.; Dickinson, K.L.; Champ, P.A.; Flores, N. Social Amplification of Wildfire Risk: The Role of Social Interactions and Information Sources. Risk Anal. 2013, 33, 800–817. [Google Scholar] [CrossRef] [PubMed]
  59. Anderson, S.E.; Bart, R.R.; Kennedy, M.C.; MacDonald, A.J.; Moritz, M.A.; Plantinga, A.J.; Tague, C.L.; Wibbenmeyer, M. The dangers of disaster-driven responses to climate change. Nat. Clim. Chang. 2018. [Google Scholar] [CrossRef]
  60. Cohen, J.D. Preventing disaster: Home ignitability in the wildland-urban interface. J. For. 2000, 98, 15–21. [Google Scholar]
  61. Cohen, J.D. Relating flame radiation to home ignition using modeling and experimental crown fires. Can. J. For. Res. 2004, 34, 1616–1626. [Google Scholar] [CrossRef]
  62. Syphard, A.D.; Brennan, T.J.; Keeley, J.E. The importance of building construction materials relative to other factors affecting structure survival during wildfire. Int. J. Disaster Risk Reduct. 2017, 21, 140–147. [Google Scholar] [CrossRef]
  63. Hamilton, M.; Fischer, A.P.; Guikema, S.D.; Keppel-Aleks, G. Behavioral adaptation to climate change in wildfire-prone forests. Wiley Interdiscip. Rev. Clim. Chang. 2018, 9, e553. [Google Scholar] [CrossRef]
  64. Moritz, M.A.; Knowles, S.G. Coexisting with wildfire. Am. Sci. 2016, 104, 220–227. [Google Scholar] [CrossRef]
  65. Kolden, C.A. We’re Not Doing Enough Prescribed Fire in the Western United States to Mitigate Wildfire Risk. Fire 2019, 2, 30. [Google Scholar] [CrossRef] [Green Version]
  66. Tedim, F.; Leone, V.; Amraoui, M.; Bouillon, C.; Coughlan, R.M.; Delogu, M.G.; Fernandes, M.P.; Ferreira, C.; McCaffrey, S.; McGee, K.T.; et al. Defining Extreme Wildfire Events: Difficulties, Challenges, and Impacts. Fire 2018, 1, 9. [Google Scholar] [CrossRef] [Green Version]
  67. Joseph, M.B.; Rossi, M.W.; Mietkiewicz, N.P.; Mahood, A.L.; Cattau, M.E.; St. Denis, L.A.; Nagy, R.C.; Iglesias, V.; Abatzoglou, J.T.; Balch, J.K. Understanding and predicting extreme wildfires in the contiguous United States. Ecol. Appl. 2019, 29, e01898. [Google Scholar] [PubMed] [Green Version]
  68. Koo, E.; Pagni, P.J.; Weise, D.R.; Woycheese, J.P. Firebrands and spotting ignition in large-scale fires. Int. J. Wildland Fire 2010, 19, 818–843. [Google Scholar] [CrossRef] [Green Version]
Figure 1. (A) The total number of wildfires (dot size) that originated in the wildland-urban interface stratified by the proportion of wildfires caused by humans, (B) the total fire size (dot size) as a percentage of WUI that was burned by human-caused wildfires, and (C) the total number of homes threatened in the WUI stratified by the proportion of wildfires caused by humans within each 50-km pixel between 1992 and 2015. Black lines represent state boundaries. For (A,C), reds indicate a greater proportion of human-caused wildfires, while blue indicates a greater proportion of lightning-caused wildfires. Note, only the buffer estimated burned area was used (B), not the 250/500/1000 m buffers.
Fire 03 00050 g001
Figure 2. Spatial representation of fire effects in the very-low-density housing and wildlands. (A) The total number of wildfires (dot size) stratified by the proportion of wildfires started by humans, (B) the total fire size (dot size) as a percentage of each class that was estimated burned by human-started wildfires, (C) the total fire size (dot size) as a percentage of each class that was estimated burned by lightning-started wildfires, and (D) the total number of homes threatened stratified by the proportion of wildfires started by humans within each 25-km grid cell from 1992–2015. Black lines represent state boundaries. For (A) and (D), reds indicate a greater proportion of human-started wildfires, while blue indicates a greater proportion of lightning started wildfires.
Fire 03 00050 g002
Figure 3. Frequency distributions of human- and lightning-caused wildfires by Julian discovery day of year stratified by wildfires that started either in the wildland-urban interface (WUI), Very low-density housing (VLDH), or wildlands within the eastern or western U.S. between 1992 and 2015.
Fire 03 00050 g003
Figure 4. Spatial representation of season that fire ignition was most prevalent across all classes stratified by human and lightning started wildfire in (A) WUI, (B) very-low-density housing, and (C) wildlands. Winter is defined as the months of December, January, February; Spring as March, April, May; Summer as June, July, August; Fall as September, October, December. Dot sizes indicate the total number of wildfire ignitions from 1992–2015 in a 50-km grid cell.
Fire 03 00050 g004
Figure 5. Regional relationships between human- and lightning-caused wildfire ignition frequency and the log median home density within 10-km pixel between two decades (1994–2004 and 2005–2015). Solid lines are based on the best fit Generalized Additive Model regressions with 95th confidence envelope. Dotted vertical lines indicate the division between the WUI and VLDH categories, assuming constant vegetation cover, where urban/WUI boundary equals log(741.3162) home density and the WUI/VLDH boundary equals log(6.17) home density.
Fire 03 00050 g005
Figure 6. The log mean number of (A) fire suppression costs and (B) homes threatened per human- and lightning-started wildfire event initiated within the wildland-urban interface (WUI), Very low-density housing (VLDH), and wildlands, stratified by fire size in hectares between 1992 and 2015. Error bars indicate the 95th confidence interval around the mean of each group. Tukey’s HSD pairwise comparison of the means is represented by differing letters and letter combinations indicating significant differences among groups (p < 0.0001).
Fire 03 00050 g006
Figure 7. Examples of three wildfires that were human-caused illustrating the enhanced spatial resolution of homes threatened by wildfires using the ZTRAX database compared to the information contained within the census block groups via SILVIS. (A) The Topanga wildfire was an urban, human-caused wildfire near Santa Monica, California that started on 28 September 2005. The WUI dataset estimated 7595 homes, while the ZTRAX estimated 936 homes threatened within the fire perimeter. (B) The Black Forest wildfire was an arson-caused wildfire in the suburbs of Colorado Springs, CO that started on 11 June 2013. The WUI dataset estimated 1480 homes, while the ZTRAX estimated 859 homes threatened within the fire perimeter. (C) A rural, human-caused wildfire from debris burning in northeastern Tennessee that started on 2 March 2006. The WUI dataset estimated 554 homes, while the ZTRAX estimated 54 homes threatened within the fire perimeter.
Fire 03 00050 g007
Table 1. Key wildfire metrics within the wildland-urban interface (WUI), very low-density housing (VLDH), and wildlands across the conterminous U.S. (CONUS) and stratified by ignition between 1992 and 2015.
WUIVLDHWildlands
HumanLightningHumanLightningHumanLightning
Cumulative Wildfire Ignitions424,70012,594459,05482,645242,047166,135
Cumulative Wildfire Burn Area (km2)15,511101559,35468,98382,934155,044
Cumulative Class Burn Area (km2)12,41188674,570104,286105,410221,047
Average Fire Season Length (d)148721644514142
Median Discovery Day126188129207173208
Cumulative Suppression Costs ($)$ 430,272,129$ 199,042,135$ 1,075,374,500$ 3,707,201,330$ 2,684,643,910$ 6,497,038,360
Cumulative Residential Structures
Threatened: Within Fire
1,037,01836,215127,5709,621132,70813,333
Cumulative Residential Structures
Threatened: Edge–250 m
4,496,568129,131441,82123,946366,66023,943
Cumulative Residential Structures
Threatened: 250–500 m
11,868,411349,2201,165,25561,0641,162,47077,845
Cumulative Residential Structures
Threatened: 500–1000 m
42,448,1011,273,5324,811,475277,8246,185,076426,951
Cumulative Residential Structures
Threatened: Within Fire–1000 m
59,850,0981,788,0986,546,121372,4557,846,914542,072

