The Impact on Structures of the Pedrógão Grande Fire Complex in June 2017 (Portugal)


1
Forest Fire Research Centre (CEIF/ADAI), University of Coimbra, Rua Pedro Hispano 12, 3030-289 Coimbra, Portugal
2
Military Firefighters of Minas Gerais, 31630-901 Minas Gerais, Brazil
*
Author to whom correspondence should be addressed.
Fire 2020, 3(4), 57; https://0-doi-org.brum.beds.ac.uk/10.3390/fire3040057
Submission received: 9 September 2020
/
Revised: 24 September 2020
/
Accepted: 26 September 2020
/
Published: 29 September 2020
Abstract
:On 17 June 2017, one of the most dramatic and destructive wildfires in Portugal’s History started, formed by a complex of at least five wildfires that merged together burning more than 45,000 hectares. In its aftermath, 66 persons lost their lives, most of them trying to run away from the fire, more than 250 were injured, and over 1000 structures (including 263 residential homes) were damaged or destroyed, with direct losses estimated at around 200 million euros. Shortly after the fire was extinguished, and as part of a larger analysis, the authors performed exhaustive field work to assess the fire impact on all manmade structures in the area of the Pedrógão Grande fire. A specific geodatabase was built, accounting for an extensive set of parameters aimed at characterizing: (i) The structure, (ii) the surroundings of the structure, and (iii) the arrival and impact of the fire. A total of 1043 structures were considered for the analysis, mostly support structures, like sheds or storage (38.6%), but also around 25% of dwellings (13.3% primary and 11.9% secondary). Regarding the ignitions, more than 60% of the structures were ignited due to the deposition of firebrands in different weak points. In addition, more than 60% of these ignitions occurred on the roofs, mainly because of the vulnerability associated with the structures and materials supporting them. Despite these results, and from what we observed on the structures that were not destroyed, we still consider that for the Portuguese reality houses are a good refuge, providing that they and their surroundings are managed and kept in good conditions.

1. Introduction
The year 2017 was the worst in Portugal’s history, in terms of forest fires and the damages associated with them. June and October were the months in which two of the most deadly and destructive fire episodes raged the Portuguese Mainland, killing a total of 117 persons and burning more than 200,000 hectares. That year had a record breaking 540,000 hectares of burned area across the Country. The fires of June became known as the Pedrógão Grande fires, and the authors, while members of the Forest Fire Research Centre (CEIF) of ADAI, at the University of Coimbra, were invited by the Portuguese Government to analyze in detail and produce a report on those events, covering the fatal accidents, fire behavior and propagation, and the destruction related to structures. The analysis presented here is based on that work and on the official report that the authors produced, with the remaining CEIF team [1].
The evolution of the main fires that occurred near Pedrógão Grande was analyzed in detail by our team, based on an extensive ground survey that involved the interview of hundreds of persons and the consultation of a large number of documents. The result of fire growth is shown in Figure 1, as isochrones of fire spread.
1.1. The Pedrógão Grande Fire Complex
On 17 June 2017, Portugal was under a severe drought and very high values of the fire weather risk indices. A thunderstorm system that formed in the Centre of Spain crossed part of Portugal, accompanied by lightning and strong downbursts, causing several fires. At 14h43 a fire was reported near the village of Escalos Fundeiros (blue circle in Figure 1), in the Municipality of Pedrógão Grande, in Central Portugal. Other two ignitions were reported soon after, one at 14h48, about 15 km to the northeast, near the village of Fonte Limpa, in Góis Municipality (yellow circle in Figure 1) and another at 15h41 at Moninhos (orange circle in Figure 1). The almost simultaneous occurrence of these fires in the same region, added to other fires, some of which started later, caused a dispersion of the fire suppression forces and limited the efficiency of control of some of them.
According to our research, the fire of Escalos started in a valley due to the contact between the vegetation and a 15 kV electrical line. On the initial attack, the need to protect nearby houses and the fire spread in the slopes and canyons above the valley, producing intense spotting, seriously limited the capacity of the fire fighters to control this fire. At 16h15, a second ignition was produced on the same electric line, near Regadas, 2 km Nothwest from Escalos (pink circle in Figure 1). With the limited resources available, the attack to this fire was also limited to the protection of some nearby houses.
At around 18h00 a linear downburst from the thunderstorm, which was above the fire of Góis at this time, reached both fires of Escalos and Regadas, dropping their convection columns towards the ground and inducing them to spread towards Southwest. From this time on these two fires spread freely, threatening a vast area of the Municipality and dozens of small villages in which hundreds of persons lived or stayed for holidays.
The two fires of Escalos and Regadas spread initially in diverging directions, but around 19h30 their inner flanks began to approach and merge causing the phenomenon designated as “junction fire” [2] in which very intense fires and strong convective processes are produced. The population could see a wide front of flames coming towards them from Northeast and threatening to destroy everything in its path, prompting many persons to get into their cars and run away from the fire. Given the evolution of the fire between 19h30 and 20h30 (Figure 1), the persons trying to leave the area inside the “circle” that was burning with great intensity during that period were surrounded by fire wherever they went and 62 perished while trying to run away. In a stretch of 400 m, from road N236-1, 30 persons driving their cars lost their lives. Only four persons died inside their houses, possibly due to smoke inhalation.
The need to rescue a large number of persons, many of them needing medical attention, in the context of a very large fire that continued to spread, the collapse of radio and telephone communications, as well as of the electrical and water systems, and unavailable roads, created a huge burden on the emergency command system. In the remaining hours of the 17th June, the fire continued spreading almost freely, burning an area of 13,500 ha that day. On the 19th June the fire of Góis merged with the fire of Pedrógão Grande. Both were controlled on the 22nd June with a total area of 45,000 ha, approximately 29,000 ha for the fire of Pedrógão Grande and 16,000 ha for the fire of Góis. Given its importance, this paper will be focused on the fire of Pedrógão Grande.
1.2. The Wildland Urban Interface
The wildland urban interface (WUI) can be simply defined as “the space where structures and vegetation coexist in a fire prone environment” [3], but we should also add the human component [4], because, ultimately, it is people who are affected and are often associated with the origin and/or solution of the problem. The first known definition of WUI belongs to C.P. Butler [5], an American physicist from the Stanford Research Institute (currently SRI International), that states that an interface fire is “any point where the fuel feeding a wildfire changes from natural (wildland) fuel to man-made (urban) fuel. …For this to happen, wildland fire must be close enough for its flying brands or flames to contact the flammable parts of the structure”. In this first definition, it was already recognized that it is not necessary that the fire contacts with a structure in order for it to ignite. From a pure heat transmission point of view, we can observe three mechanisms that can originate the ignition of a structure: Conduction [6], radiation [7] and convection [8]. However, the fact is that usually the ignition happens due to projections of incandescent particles (firebrands or embers) even if the fire front is still hundreds of meters or even a few kilometers away [9,10,11,12,13]. Being a major source of ignitions, firebrands have in fact received particular attention in several experimental studies, namely in the laboratory, using firebrand generators, in real scale [14,15,16,17,18] and in observed fires [11,12,19,20,21,22]. Most of these relate to the ignition of structures (or their components), but others are more broad and consider the ignition of different fuel beds [23,24,25,26,27].
Also identified in the beforementioned definition of WUI are two of the primary requirements to characterize this problem: the houses or structures as fuel and the proximity of the source of heat that can ignite them. Together with the existence of oxygen, the three form what we can call a triangle of requirements for the ignition of structures [28] by analogy with the well-known concept of fire triangle [29]. That is, structures can ignite only if these three factors exist simultaneously and in sufficient quantity.
Understandably, the possibility of having several houses or other structures burning during a wildfire may set a disaster situation in the WUI [10,30,31]. However, if on the contrary, the structures prove to be resistant, then, with high probability, the disaster will not occur [32], and they can be a place of refuge or shelter for the population. The vulnerability of structures has to do not only with the structure itself and its ease of ignition, but also with the surrounding space [33], in what is known as the Home Ignition Zone [34,35,36,37]. If the number of such vulnerable structures is so high that it exceeds the capacity of the means of protection, then that capacity and effectiveness are limited, and many will remain unprotected. On the other hand, if structures are not vulnerable then there will be no, or few, ignitions and the means of protection will not be overloaded. From this sequence of relationships, adapted from [30], it is understood that the existence of a fire with extreme conditions of propagation does not imply that there will be a disaster in the WUI. Everything is dependent on the vulnerability of the constructed space and its surroundings. This area needed around the structures that should be subjected to preventive fuel management has been usually accepted to be in a range of 30 m [28,32,33,38,39]. This value of 30 m, which is the basis for most of the recommendations all around the world (although many go further than that), was obtained through extensive computational simulation, relating the characteristics of the fire, with the properties of the structures, and also through field tests, where structures, constructed essentially with wood, were placed at different distances of the vegetation and exposed to high-intensity fires [40]. Graham et al. [32] have analyzed several cases and assert that it is very difficult for a structure to ignite by direct contact of a fire that is more than that distance, which is assumed to be the worst-case scenario, but for flat terrain or light slope. We can thus say with some certainty that the probability of ignition of a structure by the direct close effect of fire (whether by radiation, convection or conduction) can be drastically reduced if the fuels in its surroundings are eliminated or modified [11,39,41,42]. We can also say that these rules can be altered by factors such as topography or wind, which can greatly influence fire behavior and may imply the need to adapt the width of fuel management [43,44]. Some other authors suggest the extension to 100 m (e.g., [45]), although with a lower priority.
This still leaves the need to deal with the most common mechanism of structure ignition, the deposition of embers. To minimize the chance of ignition by embers, the management actions must be oriented to the structure itself, being in terms of maintenance, construction materials, or active or passive self-defense mechanisms.
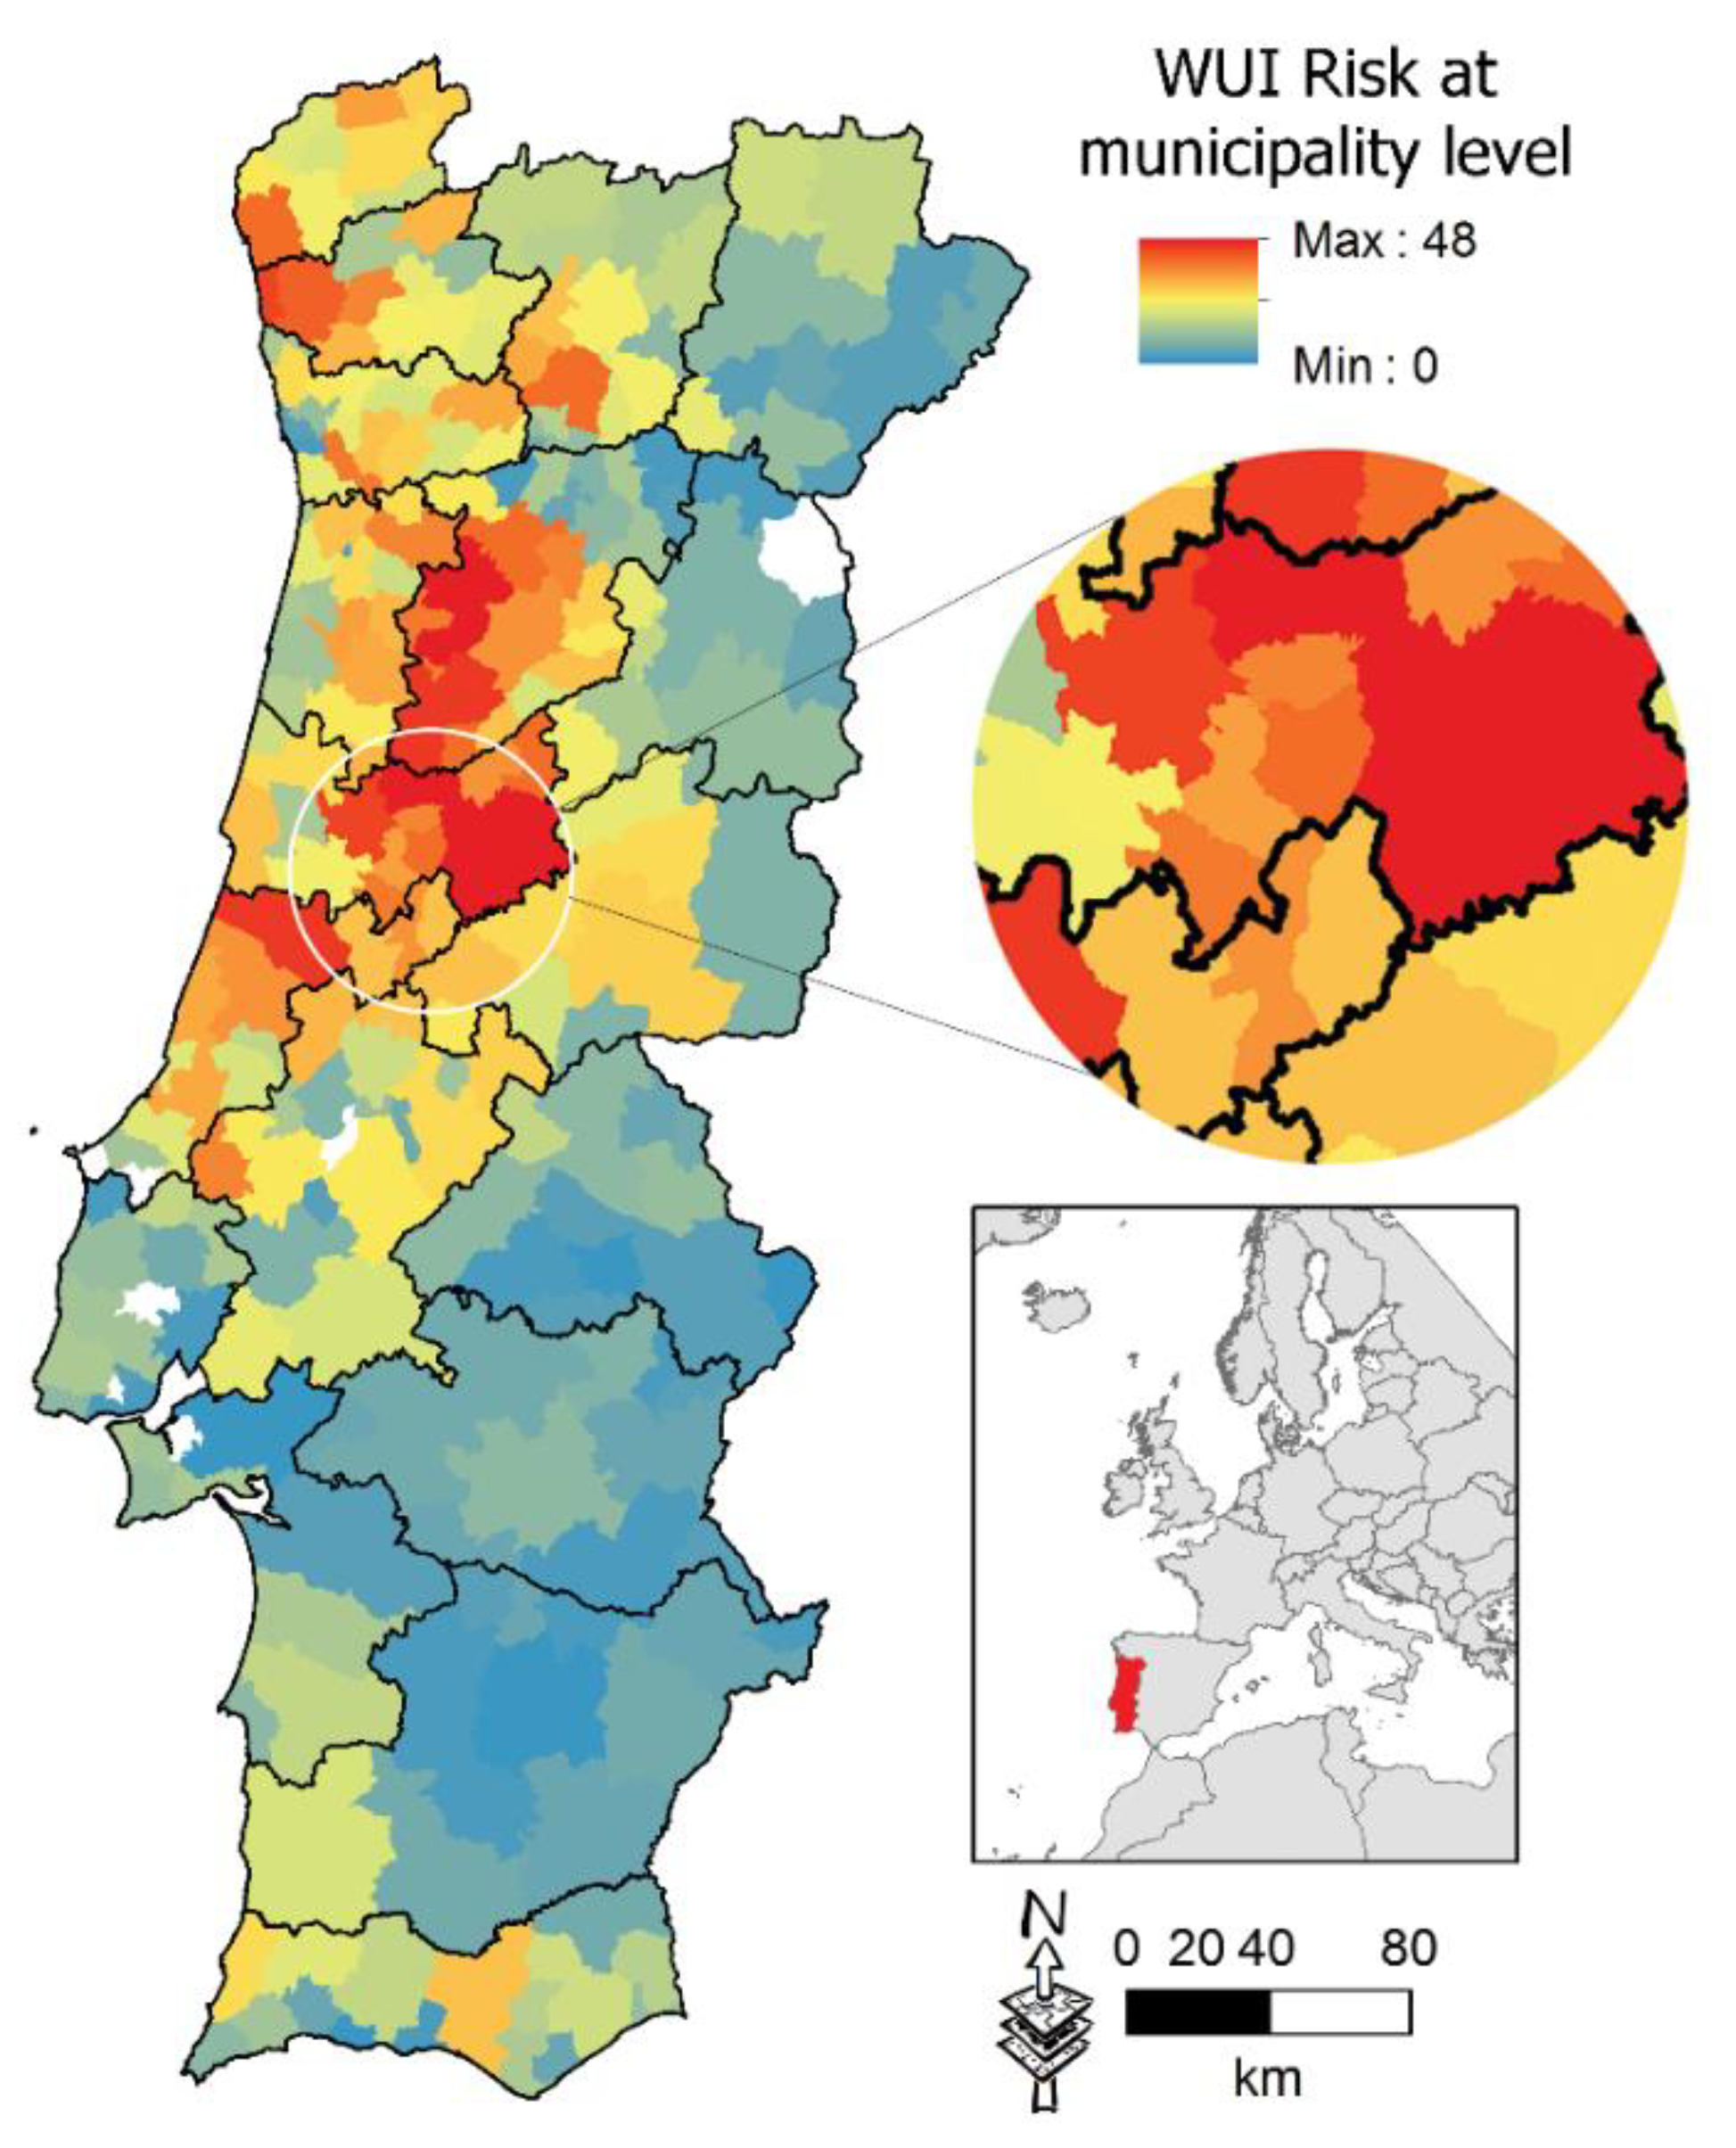
In Portugal, like in many other countries in the Mediterranean basin, there is a high degree of probability of a wildfire, along its path, finding much more than natural fuels. The country often has structures, infrastructures, and/or people scattered everywhere, mixed with vegetation. Figure 2 presents the WUI risk at the Portuguese municipality level. In a more comprehensive perspective, we consider here the definition of risk proposed by [46]: “the potential occurrence of physical losses (e.g., destruction of a house), social losses (e.g., deaths), economic (e.g., destruction of timber production, structure collapse) and environmental (e.g., damage to an ecosystem, effects on air quality) in a given area and in a given period of time, resulting from the vulnerability of socio-ecological systems to a forest fire “.
The Country has profound differences in some districts, mainly the coastal ones, that have very sharp structural inequalities [4]. For example, in the Coimbra district (Central Portugal), there is a very large difference between the municipalities that compose the western half (Baixo Mondego) and the eastern half (Pinhal Interior).
The area inside the white circle, enlarged at the right, is where the Pedrógão fire complex took place, and it corresponds to areas with very high WUI fire risk, some of them the highest found in the whole Country. Throughout this region, [4] identified some common problems, namely: Isolated houses within forest areas (high risk); interfaces of small settlements with forested areas (high risk); interfaces of small settlements with shrubs (except Castanheira de Pera) (moderate risk); and interfaces of settlements in irrigated agroforestry mosaic (moderate risk).
1.3. The Impact of Fire on Structures
The way in which the structures in the WUI are damaged by wildfires has received special attention all over the world [1,32,36,37,47,48,49,50,51,52], and efforts have been made by the scientific community, but also the operational and technical, in order to understand the ignition mechanisms of the structures and the weaknesses they present to the passage of a wildfire [39,43,53,54,55,56]. For instance, [57] carried out an historical analysis on the impact of fire on people and structures across Australia between 1901 and 2011. During this work specific databases were created to allow data harmonization and collection. Inspired by this report, we designed a customized geodatabase to allow us the systematic collection of data related to the impacts of the Pedrógão Grande wildfire complex, namely on personal accidents resulting in deaths, and on structures damaged. Although the geodatabases were relatively simple, they were designed to allow the collection of the maximum amount of detail during the fieldwork, considering the time available for its execution. Another study, recently done in California, comparing houses that survived fires to houses that were destroyed, between 2013 and 2018, was carried out state-wide and analyzed in three broad regions [56]. This study accounted for characteristics that we also used in our work, such as the role of defensible space distance, defensive actions, and the buildings’ structural characteristics. Overall, they concluded that structural characteristics (e.g., having enclosed eaves, vent screens, and multi-pane windows) probably prevented the wind-born ember penetration into structures and the multi-pane windows protected from radiative heat.
When wildfires impact communities there is usually a shift on fire management strategies that need to prioritize the protection of human life and property [58,59,60,61]. However, evaluating this impact can be hard to achieve, given the difficulty in obtaining measurable data that allows the establishment of gradations of social, economic, or even emotional and familiar impact. From a purely structural impact perspective, it becomes more feasible to gather a set of parameters that allow us to estimate how the fire has impacted the community affected. This was the main objective of this study, i.e., to develop a methodology to characterize the impact of fire on structures, deploying it in the analysis of the communities affected by the Pedrogão Grande fire complex. After an extensive field campaign, performed right after the fires took place, a detailed analysis of all the collected data was performed, and published in the respective Official Fire Report [1]. We present here what we believe to be the most important results obtained. We evaluate the impact that the fire had on man-made structures, regardless if they are dwellings, storages, sheds, or any other structure.
2. Materials and Methods
The present analysis was based on an extensive field verification of all human made structures damaged by fire, regardless of their purpose, use, or type. For this end, different tools were used, to allow an easy integration and analysis of data: ArcMap [62], a well-known Geographic Information System [63], Collector for ArcGIS, for field data collection [64], SPSS statistical package [65], and Microsoft Excel [66].
2.1. Database Design
In order to compile and register all data referring to the damaged structures, a spatial database was designed and created, using ArcMap. This database allowed the systematic collection of information, or variables, about the fire, the built structures and their surroundings, the impact of the fire on them, and the behavior of owners and users. The variables used, in total, 24, had in its majority predefined answers, in order to maximize efficiency during the field work. Table 1 presents the list of variables, grouped according to the object of their characterization.
With all the variables and options defined, ArcMap was used to create a geographic database [67] with the possibility of attaching photographs. This database was uploaded to ESRI’s ArcGIS online service [68] in order to allow remote access. Using a mobile application from the same ESRI, the ArcGIS Collector [64], installed on a field GPS, it was possible to perform all the inventory work interactively, filling in the database and attaching photographs of the structures. It was not always possible to fill all the fields, for several reasons. For example, if a structure was completely destroyed, it was not possible to measure the conservation status before the fire. Some of the fields, such as this, or when the fire hit the structure, if there was a failure in water or energy supply, or if there were people defending the structure, could only be filled if there was some local inhabitant present during the field visits that could inform us. Sometimes, it was possible to deduce some responses by observing the structure, the surroundings, or some clues related to the behavior of the fire.
2.2. Field Campaign Design and Data Collection
Taking into account the size of the affected region and the time available to carry out the survey and analysis, visiting the entire burned area searching for damaged structures would be extremely hard to accomplish. Therefore, the initial planning comprised the search for already available data sources related to the location of damaged structures. Given the social impact that this fire complex had, the Portuguese Government almost immediately announced an economical support program to help the local population rebuild or recover their lost property, namely residential homes and structures needed for any professional or subsistence activities. For this reason, many of the local inhabitants began reporting their losses to the respective local authorities, who registered those requests, and eventually subjected them to a field verification process at a later stage. To our knowledge, these surveys were carried out in all affected municipalities. Bearing this in mind, in the first stage, we requested this information from the municipalities’ authorities, having obtained it from 4 of the 11 affected by the fire: Castanheira de Pera, Figueiró dos Vinhos, Penela, and Sertã. For different reasons, it was not possible to obtain the rest in due time. Together with Pedrogão Grande, these were the five municipalities selected to carry out the fieldwork and the respective analysis. For Pedrogão Grande we managed to obtain the data from a collaborative open data web platform set up by Esri Portugal (the official distributor of the North American Esri—Environmental Systems Research Institute, world leader in the Geographic Information Systems technology), titled “FireHub 2017” [69]. Using this platform, we had access to a set of georeferenced points representing structures allegedly damaged by fire, but not validated, especially in the municipality of Pedrógão Grande, but with some cases in Castanheira de Pera and Penela. At a later stage we obtained data also from the municipality of Góis (27 houses damaged by fire), Pampilhosa da Serra (8 houses and 20 agricultural sheds), and Alvaiázere (10 structures but only one was a secondary dwelling), but they were not included in the fieldwork and therefore the analysis. The municipalities of Ansião, Arganil, and Oleiros were only marginally affected by the fire and had no registered damage in structures.
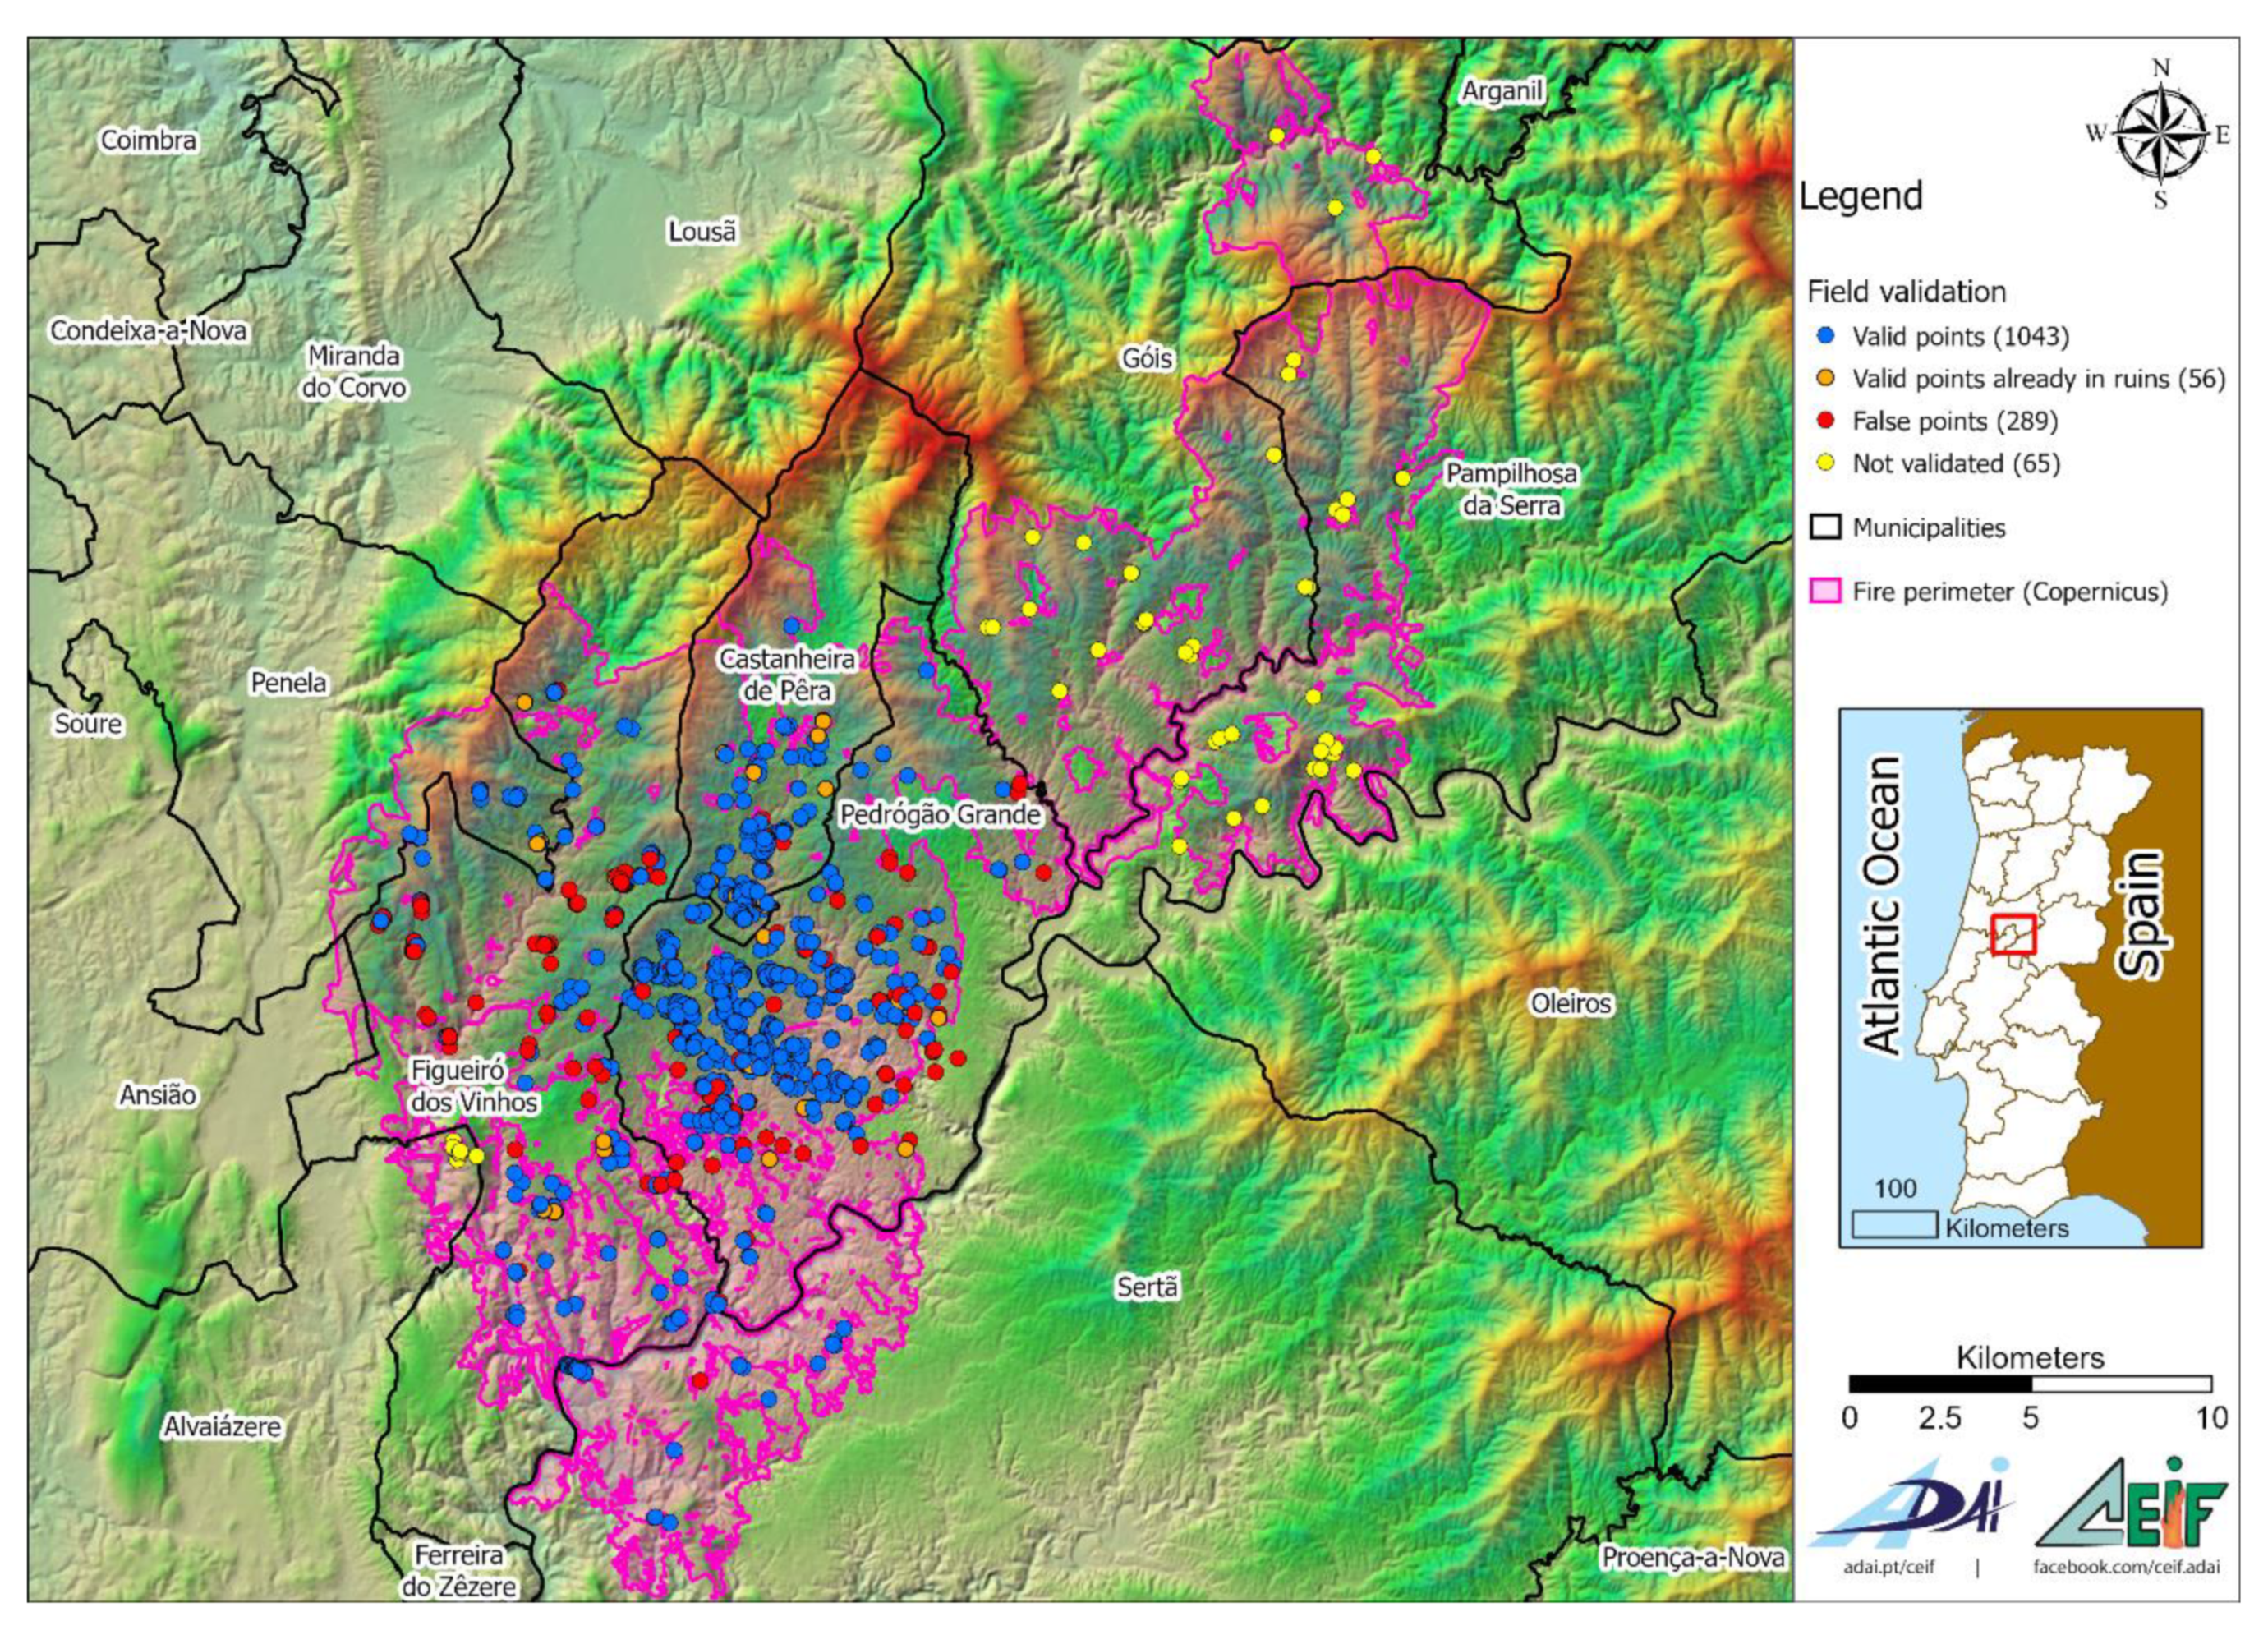
In this first stage, we obtained 704 non-validated georeferenced points (potentially damaged structures) that allowed us to plan and schedule the field visits, minimizing the travelling distances. Our initial objective was to focus on this set of points and during these visits try to search for other non-registered damaged structures, either by direct observation or with the help of the local population that proved to be the most valuable resource. In fact, most of the times we were able to declare the ignition cause by interviewing local residents that were present during the fire. Also, the team elements responsible for the survey have a large experience in the field of urban and wildfires, as, apart from researchers, two of them are experienced firefighters. This initial set of points allegedly represented, for the most part, primary housings. In the course of the fieldwork, 289 of them proved to be inaccurate. In some cases, there were not even structures in the place indicated by the georeferenced points and in others the structures had not been damaged by the fire. As we said before, we were interested in all affected structures, not only housings, so during the field work we inventoried 684 other points that were not listed initially. In total, 1453 points were visited (Figure 3), of which 1099 points were initially considered valid. At the beginning of the fieldwork, we began to identify some structures, not in the initial listing, which were clearly already in ruins before the fire. Taking into account not only the large number of such structures in the affected region but also the fact that the analysis of the impact of fire on them is very difficult, so it was decided not to record these cases any more. In total, discounting these structures in ruins (56), we finished with 1043 valid points that fulfilled the requirements for analysis.
Between 20 July and 3 September 2017, a team that included two of the authors covered a total of 2550 km, talking to the population and observing the structures, the terrain, and the impact of the fire. Some variables were of direct observation, and therefore easier to obtain, for instance those related to the structure or its surroundings. However, some of them, like the failure of water supply, electricity, or communications, implied the testimony of someone that was present during the fire. In addition, questions related to the time at which that happened, are obviously subjected to what the persons interviewed remember. In Table 1, we can see the ratio of answers that we managed to collect for all the variables. For variables 3.4 through 3.9 and 4.1 through 4.7 the answer ratio was below 25% and for this reason we decided not to include them in the analysis.
3. Results and Discussion
The data collected in the field work were synchronized daily with ArcGIS Online and then organized and analyzed in ArcMap, Microsoft Excel, and IBM SPSS Software. The described methodology foresees the visit of pre-established points. All the other structures that we were able to inventory during the fieldwork were identified while we were heading for the marked points. Although we have covered practically the entire area of the most affected municipalities, it is possible that there are damaged structures that we have missed.
Table 2 presents the distribution of the valid points considered for analysis in the three administrative divisions existing in Portugal: District (Distrito, in Portuguese, the largest one), Municipality (Concelho, intermediate), and Parish (Freguesia, the smallest). Only the last two have effective administrative power. We can observe that the municipality of Pedrógão Grande was undoubtedly the most affected one, with more than 60% (640) of the total damaged structures. Together with the other two affected municipalities from the District of Leiria (Castanheira de Pera and Figueiró dos Vinhos) they account for the vast majority of the damaged structures (95%, 990 structures). This is fairly easy to understand, as it corresponds to the area where the fire was more violent and spread more intensely, as demonstrated in [1]. This is also the area where 66 persons lost their lives, as a consequence of the fire.
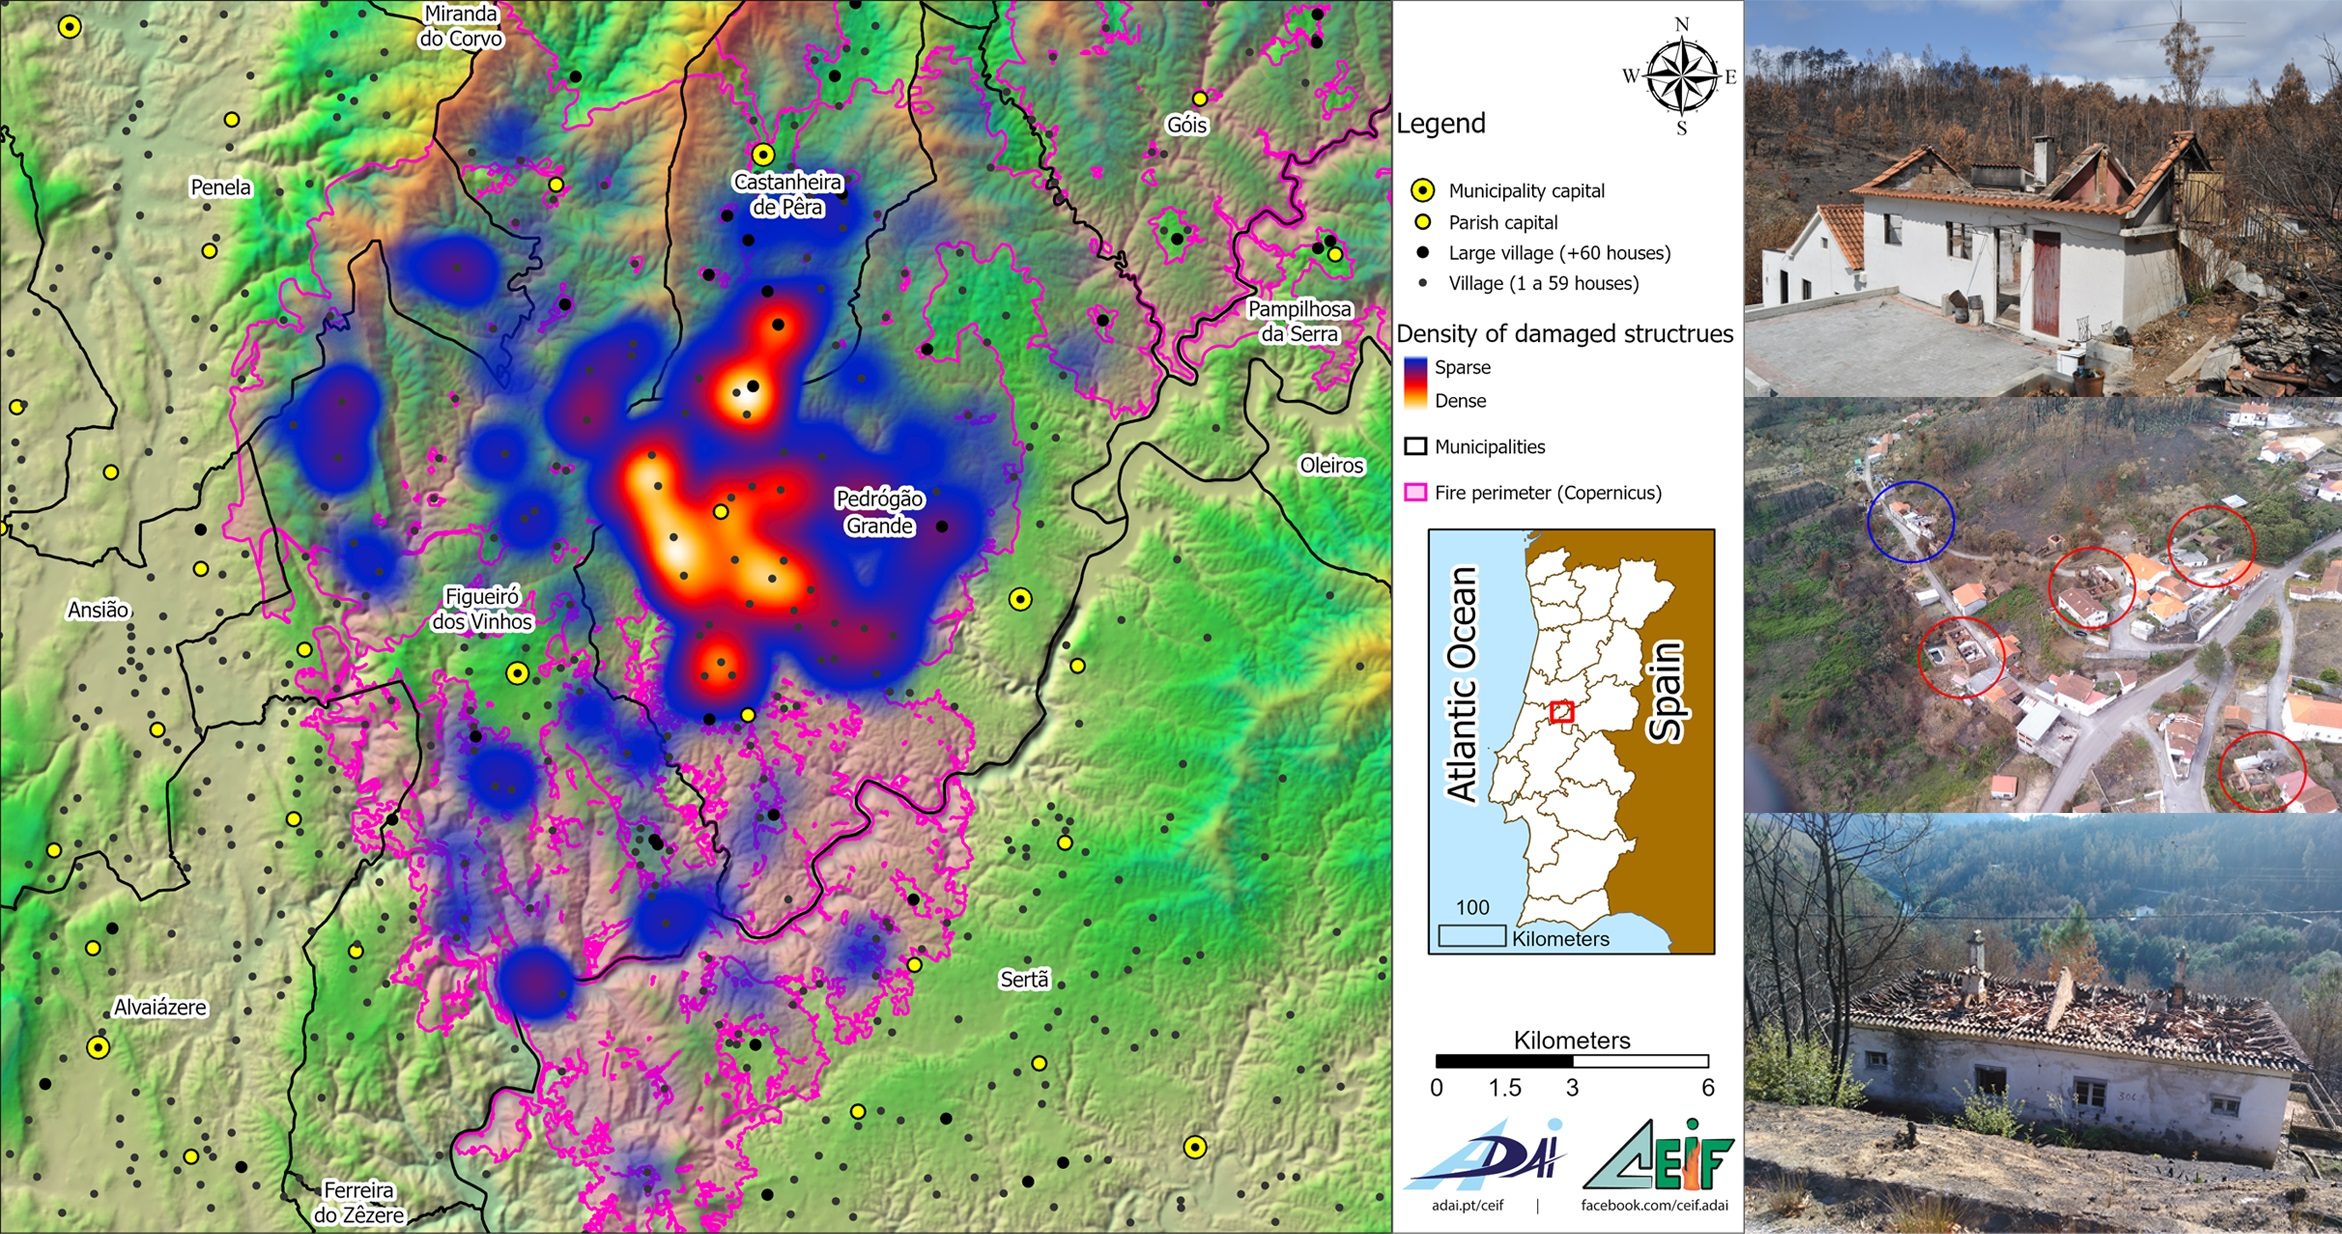
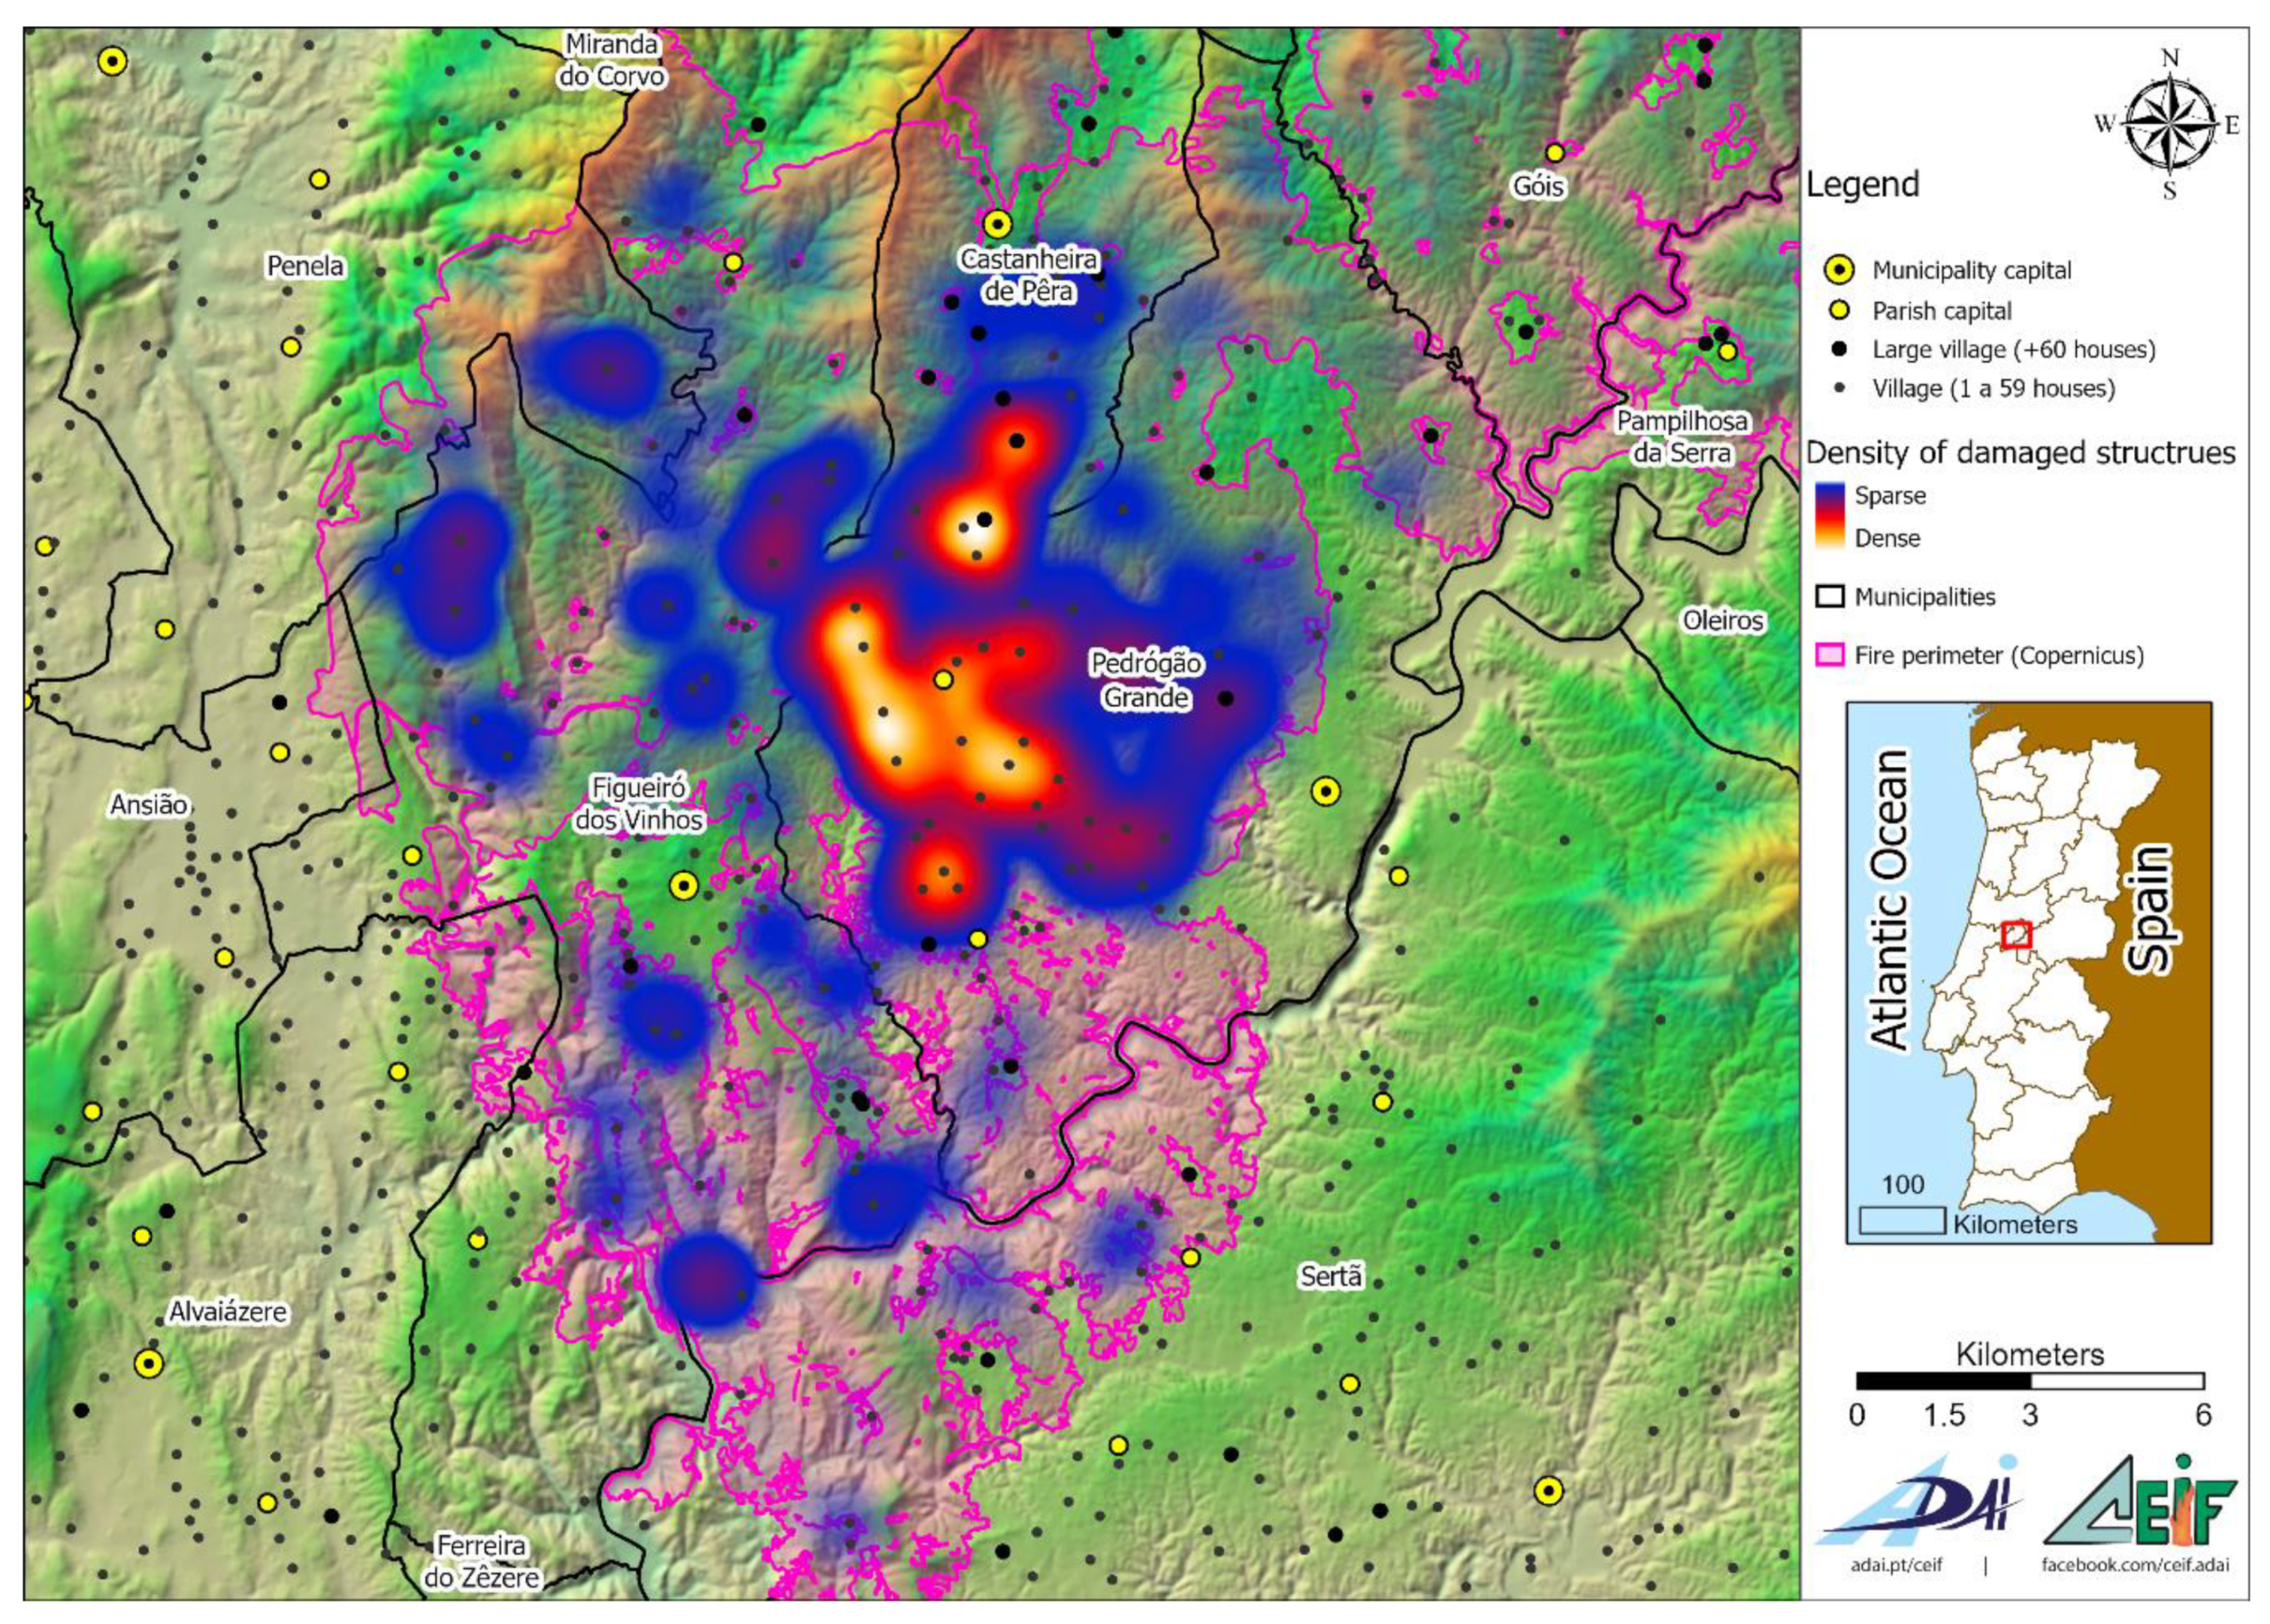
The concentration of damaged structures in the time and place of the most extreme fire propagation was obvious from the beginning. We obtained 464 answers (44.5%) pertaining to the date and time of arrival of the fire, and from these, 388 placed it between 18:30 and 20:30 of 17 June. Figure 4 is a close up on the area of the analysis and graphically presents the density of damaged structures, where the warm read/yellow colors show the concentration of the destruction in the western area of Pedrógão Grande and southern of Castanheira de Pera. In Figueiró dos Vinhos the damage was more scattered.
From the 1043 structures analyzed, an overwhelming total of 890 (85.3%) were either highly damaged or completely destroyed, as depicted in Table 3.
From now on, the results are shown grouped according to the object of their characterization, as presented earlier in Table 1. Not all variables were analyzed, mainly because the number of answers was too short, as is the case of group 4, “Human behavior towards the incoming fire”. We will hereafter present the ones deemed useful to understand how the fire impacted the affected region. To achieve this, we cross-examined the results against the condition of the structure after the passage of the fire. As two or more variables are examined simultaneously, the number of answers must be restricted to the lowest value, hence representing common answers.
3.1. Group 1—The Structure
The fire did not impact all structures equally. The impact was differentiated according to the type of structure, the type of construction, the age, or the state of conservation.
Considering the type of damaged structure (Table 4), the most affected were support structures like small agricultural sheds or storages (38.6%). Included in this category are the annexes that can be found in many houses, which serve different purposes, but do not fit into any other category. However, more important, around 25% referred to homes, either primary (13.3%) or secondary (11.9%). There is a similar distribution of damage by classes between the two, although the percentage of high damage and of destruction is slightly higher in the secondary housing. This may be explained by the fact that being temporary houses, mainly for weekends or holidays, the degree of conservation and maintenance is usually lower than in the houses with permanent occupation. This distribution of damage among classes is also similar in most of the other types of structures, i.e., the majority of structures presented high damage or were completely destroyed. It is important also to notice that 25% of primary houses only presented slight damages.
The fourth most affected type of structures referred to vacant houses (12.7%), that differ from the uninhabited by not having any signs of usage, like furniture or other contents and being in a poor condition. The remaining 23.6% include all the other categories that we managed to identify, like warehouses, garages, commerce and industry, or animal stables.
In relative terms, the highest percentage of destruction was observed in vacant structures (54.5%), agricultural warehouses (54.1%), and industry facilities (53.3%), practically with the same percentages, although the effective number of structures is very different, with 72, 40, and 8, respectively.
It is also noticeable that agricultural sheds or storage constructions were very affected, and only 8% presented slight or moderate damage. This can be explained by the fact that the construction type is often weak and even if the owners were present, their efforts were directed to try to save the houses, not the support constructions. Among the structures classified as “Other” we can highlight four, for their social importance: One kindergarten (totally destroyed), two chapels (highly damaged), and one cultural space (highly damaged).
More than the justifications given before to explain the fact that a structure was more or less damaged, there are some more objective variables that may be used. From the 1043 valid structures for analysis, we obtained answers for 1035, regarding both their condition and use before the fire (Table 5). From these, 73.6% were in fact being used or occupied, while 26.4% showed no signs of it. From these last ones, the poorly preserved structures prevail, understandably, and overall, practically all structures had high damage or were destroyed. As for the structures in use, only 219 out of 762 (28.7%) were considered to be in a good pre-fire condition and the majority of the damage occurred in structures moderately preserved (509 out of 762, 57.6%). The highest percentage in the slightly damaged class occurred in the well-preserved structures (47 out of 73, 64.4%).
It is perceptible in the results that, when the conditions are met for a structure to be destroyed, the degree of maintenance has little influence, as can be seen by the similar percentages on the totally destroyed class (although the percentage slightly increases as the conservation worsens).
The other two variables considered in this section of the analysis are the type of construction (Table 6) and its approximate age (Table 7). One of the structures was destroyed to a point where we could not identify its type, hence only 1042 values were used. Regarding the age, we could not evaluate it in six structures.
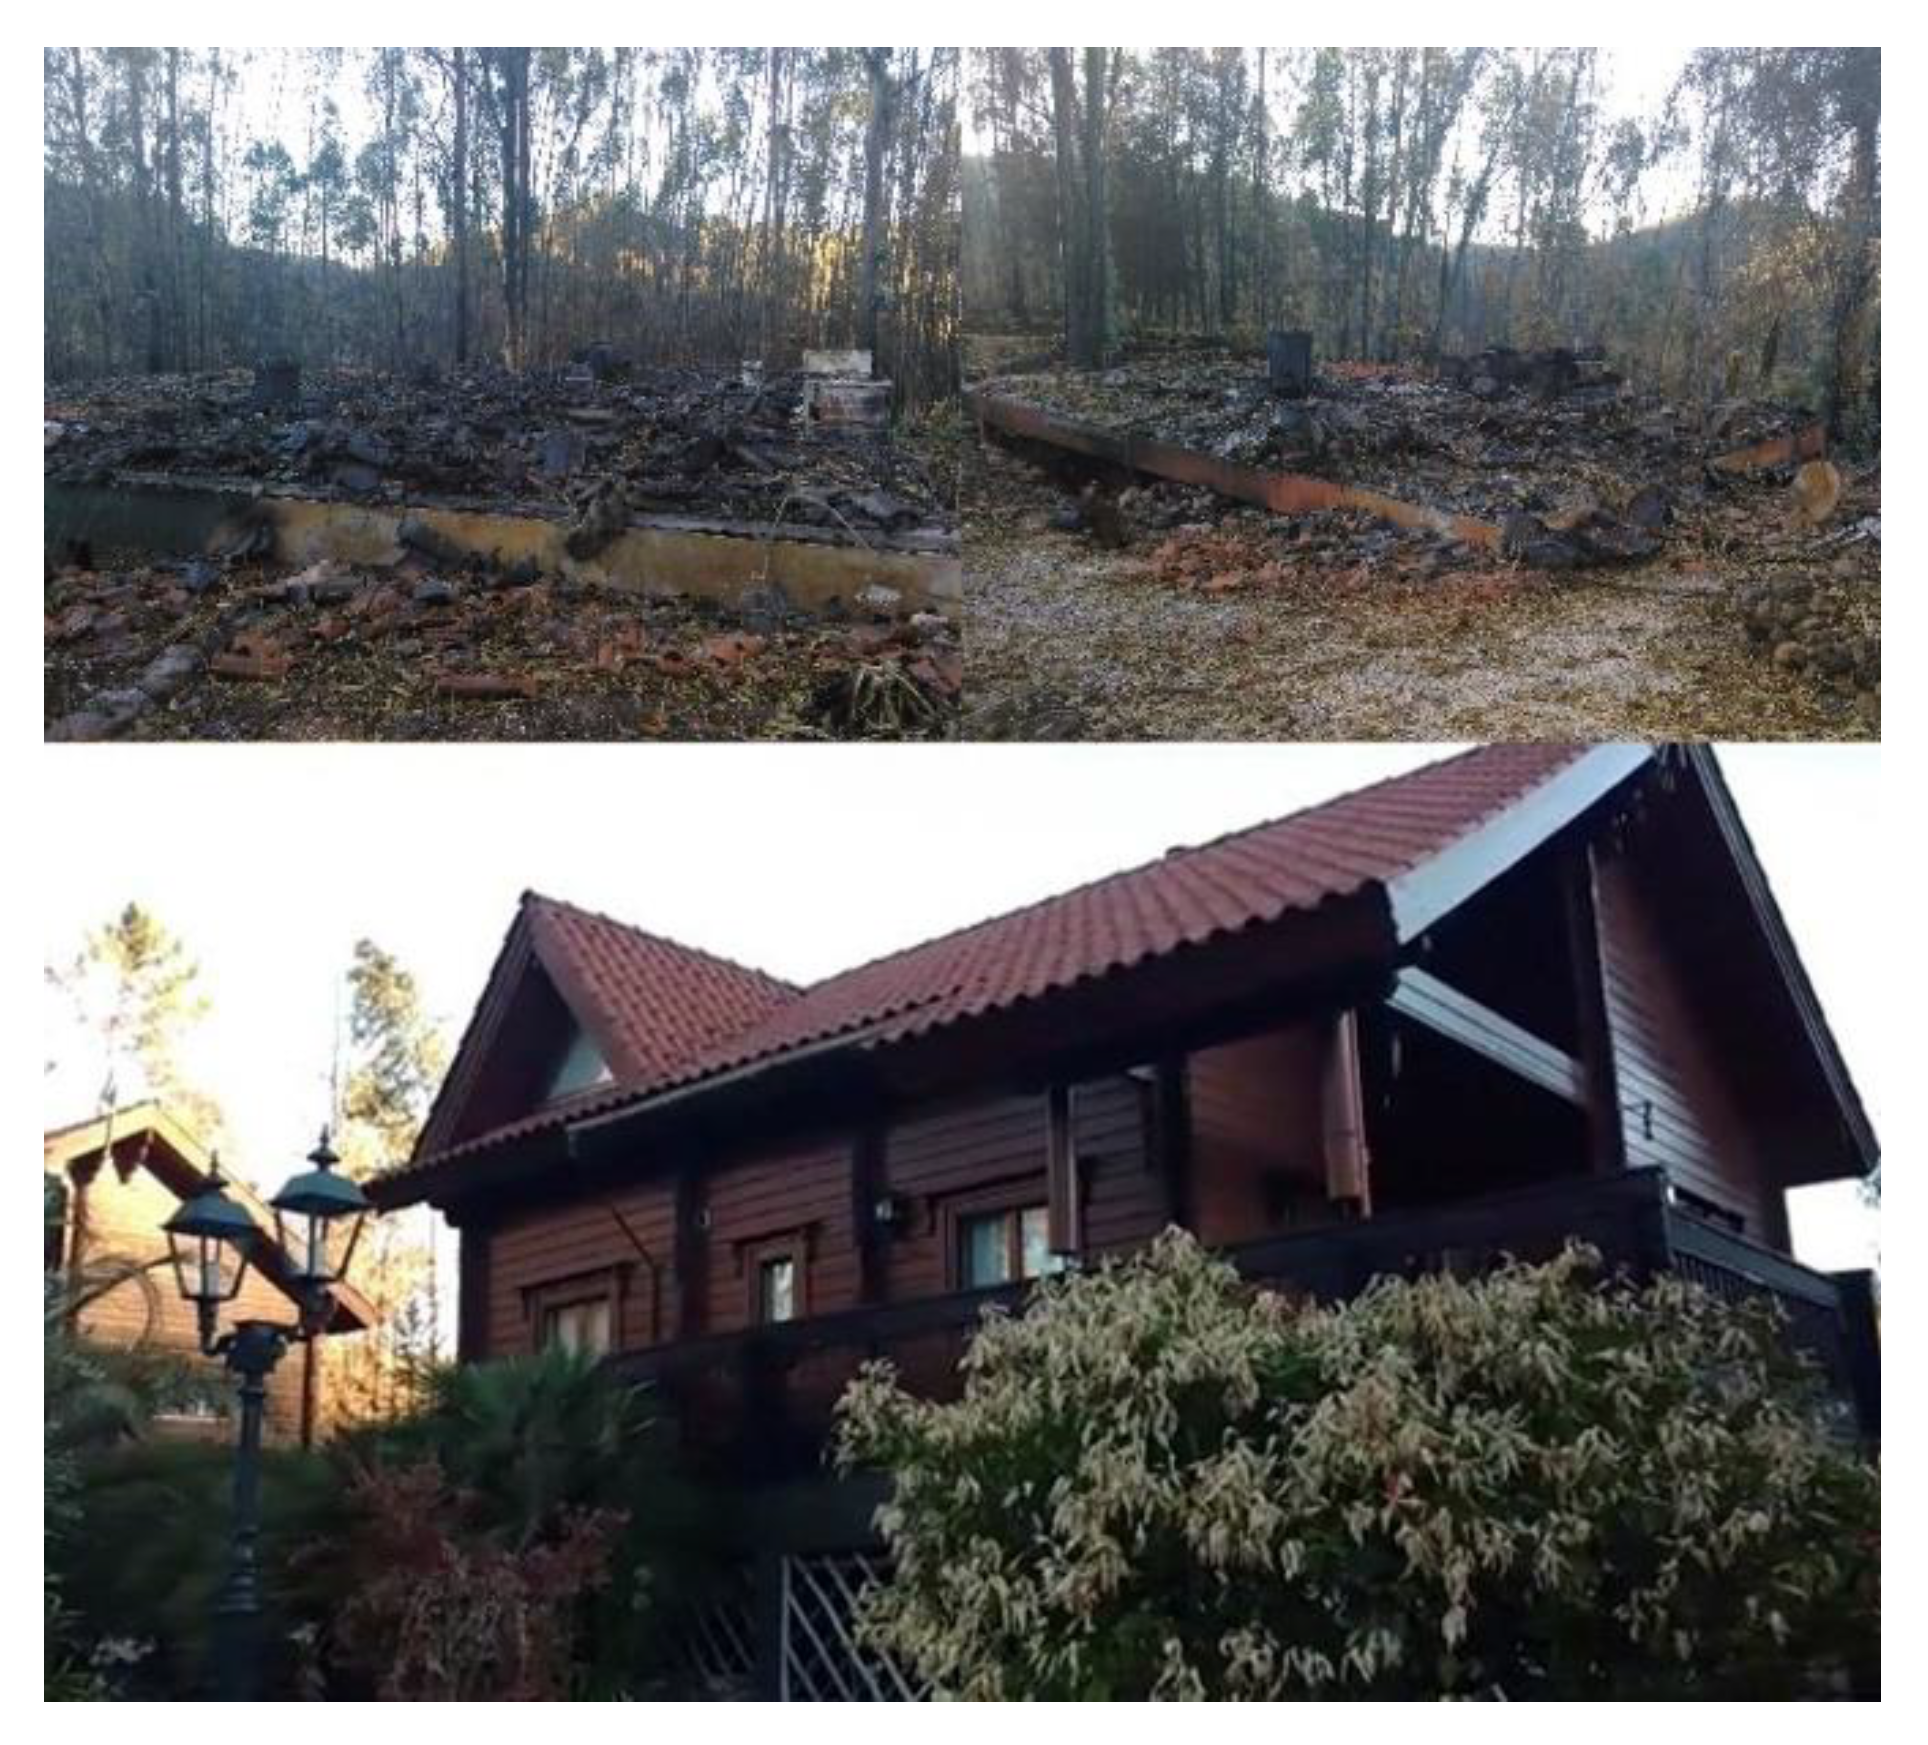
The typical construction in Portugal uses concrete and clay bricks, here identified as masonry, but in many regions either old houses or newly reconstructed ones can also be made of stone, or a mix of both. This is confirmed by the results of Table 6, where we see that more than 90% of the affected structures are built with one of these two materials. Wood construction is not very common, especially in houses, and we can see that all wooden structures affected by fire were totally destroyed (example in Figure 5).
From the 530 masonry structures damaged by fire, 176 (33.2%) refer to houses and a similar number (177) to sheds or storage constructions. Around 42% of the stone structures refer also to sheds or storages (179 out of 420). The vast majority (86.1%) of the structures are of an advanced age (more than 30 years old), as shown in Table 7. From these, 114 are residential homes (12.8%) and 356 are sheds or storage structures (39.9%). The more recent structures are clearly more resistant to the passage of the fire, especially those built in the last 10 years (only 2.5% of the 1037 considered).
3.2. Group 2—The Surroundings of the Structure
The items from group 1 are determinant to the probability of a structure being damaged or not, but we must also consider the way those structures are mixed with the natural vegetation. We consider here two aspects: The fact that the structures are isolated, or not, and the fuel management in their periphery. The need and reasoning behind fuel management in the WUI was already addressed. In Portugal, the legislation observed at the time of the Pedrógão fire complex established two buffers where fuel management was mandatory: In continuous urban areas, a fuel break of 100 meters around the perimeter, and in isolated houses located outside these areas, individual fuel breaks of 50 meters around the structures. These fuel breaks do not need to be completely clean of vegetation, and there were, at the time specific guidelines regarding surface fuels clearance or trees thinning and pruning [70]. After the 2017 fires the guidelines had some changes, especially regarding the fuel load and vertical and horizontal continuity [71]. We found 963 structures in which fuel management should be executed. If we were to be strict in observing these 50 or 100 meters, we would not have found one single structure fulfilling the requirements of the legislation. Instead, we decided to use a more flexible approach and consider three classes of fuel management. Whenever there was a fuel discontinuity in at least one side of the structure, with a width corresponding to a common road (3 meters), we considered the fuel management to be “partial”. This discontinuity could be a road, an irrigated lawn, vegetable garden, bare soil, or any type of barrier to the passage of a surface fire. If the fuel break was all around the house, we considered it to be “full”. If there were no discontinuities, we assumed it to be “absent”. Looking at Table 8, the immediate perception is that there is no clear difference in having absent or partial fuel management, as the number of damaged structures is similar. Obviously, generalizations cannot be made, since we did not analyze the structures that were not damaged by fire, but this result leads us to believe that fuel management is only effective if it is fully carried out in the surroundings of the structures.
Considering the type of construction used in Portugal, and addressed earlier, we observe that it is not common to have “structure to structure” ignition, like in other countries whenever different materials, like wood, are used [13,36,72]. Also, structures disposed in groups, as in urban areas, offer a combined protection, mainly to the ones located inside the cluster. We can combine both results from the variables “isolated structure” (structure location) and “fuel management” to produce a joint analysis, as seen in Table 9.
Overall, the number of structures that are not isolated is slightly larger (508 out 963 or 52.8%). The isolated structures should be the ones that are more in need of fuel management, but the majority of them did not have any type of management (240 out of 455 or 52.7%) or only had “partial management” (178 out of 455 or 39.1%). In the non-isolated structures, the majority are those with partial management (308 out of 508 or 60.6%), which is understandable considering that they are in clusters of structures.
3.3. Group 3—The Arrival and Impact of the Fire
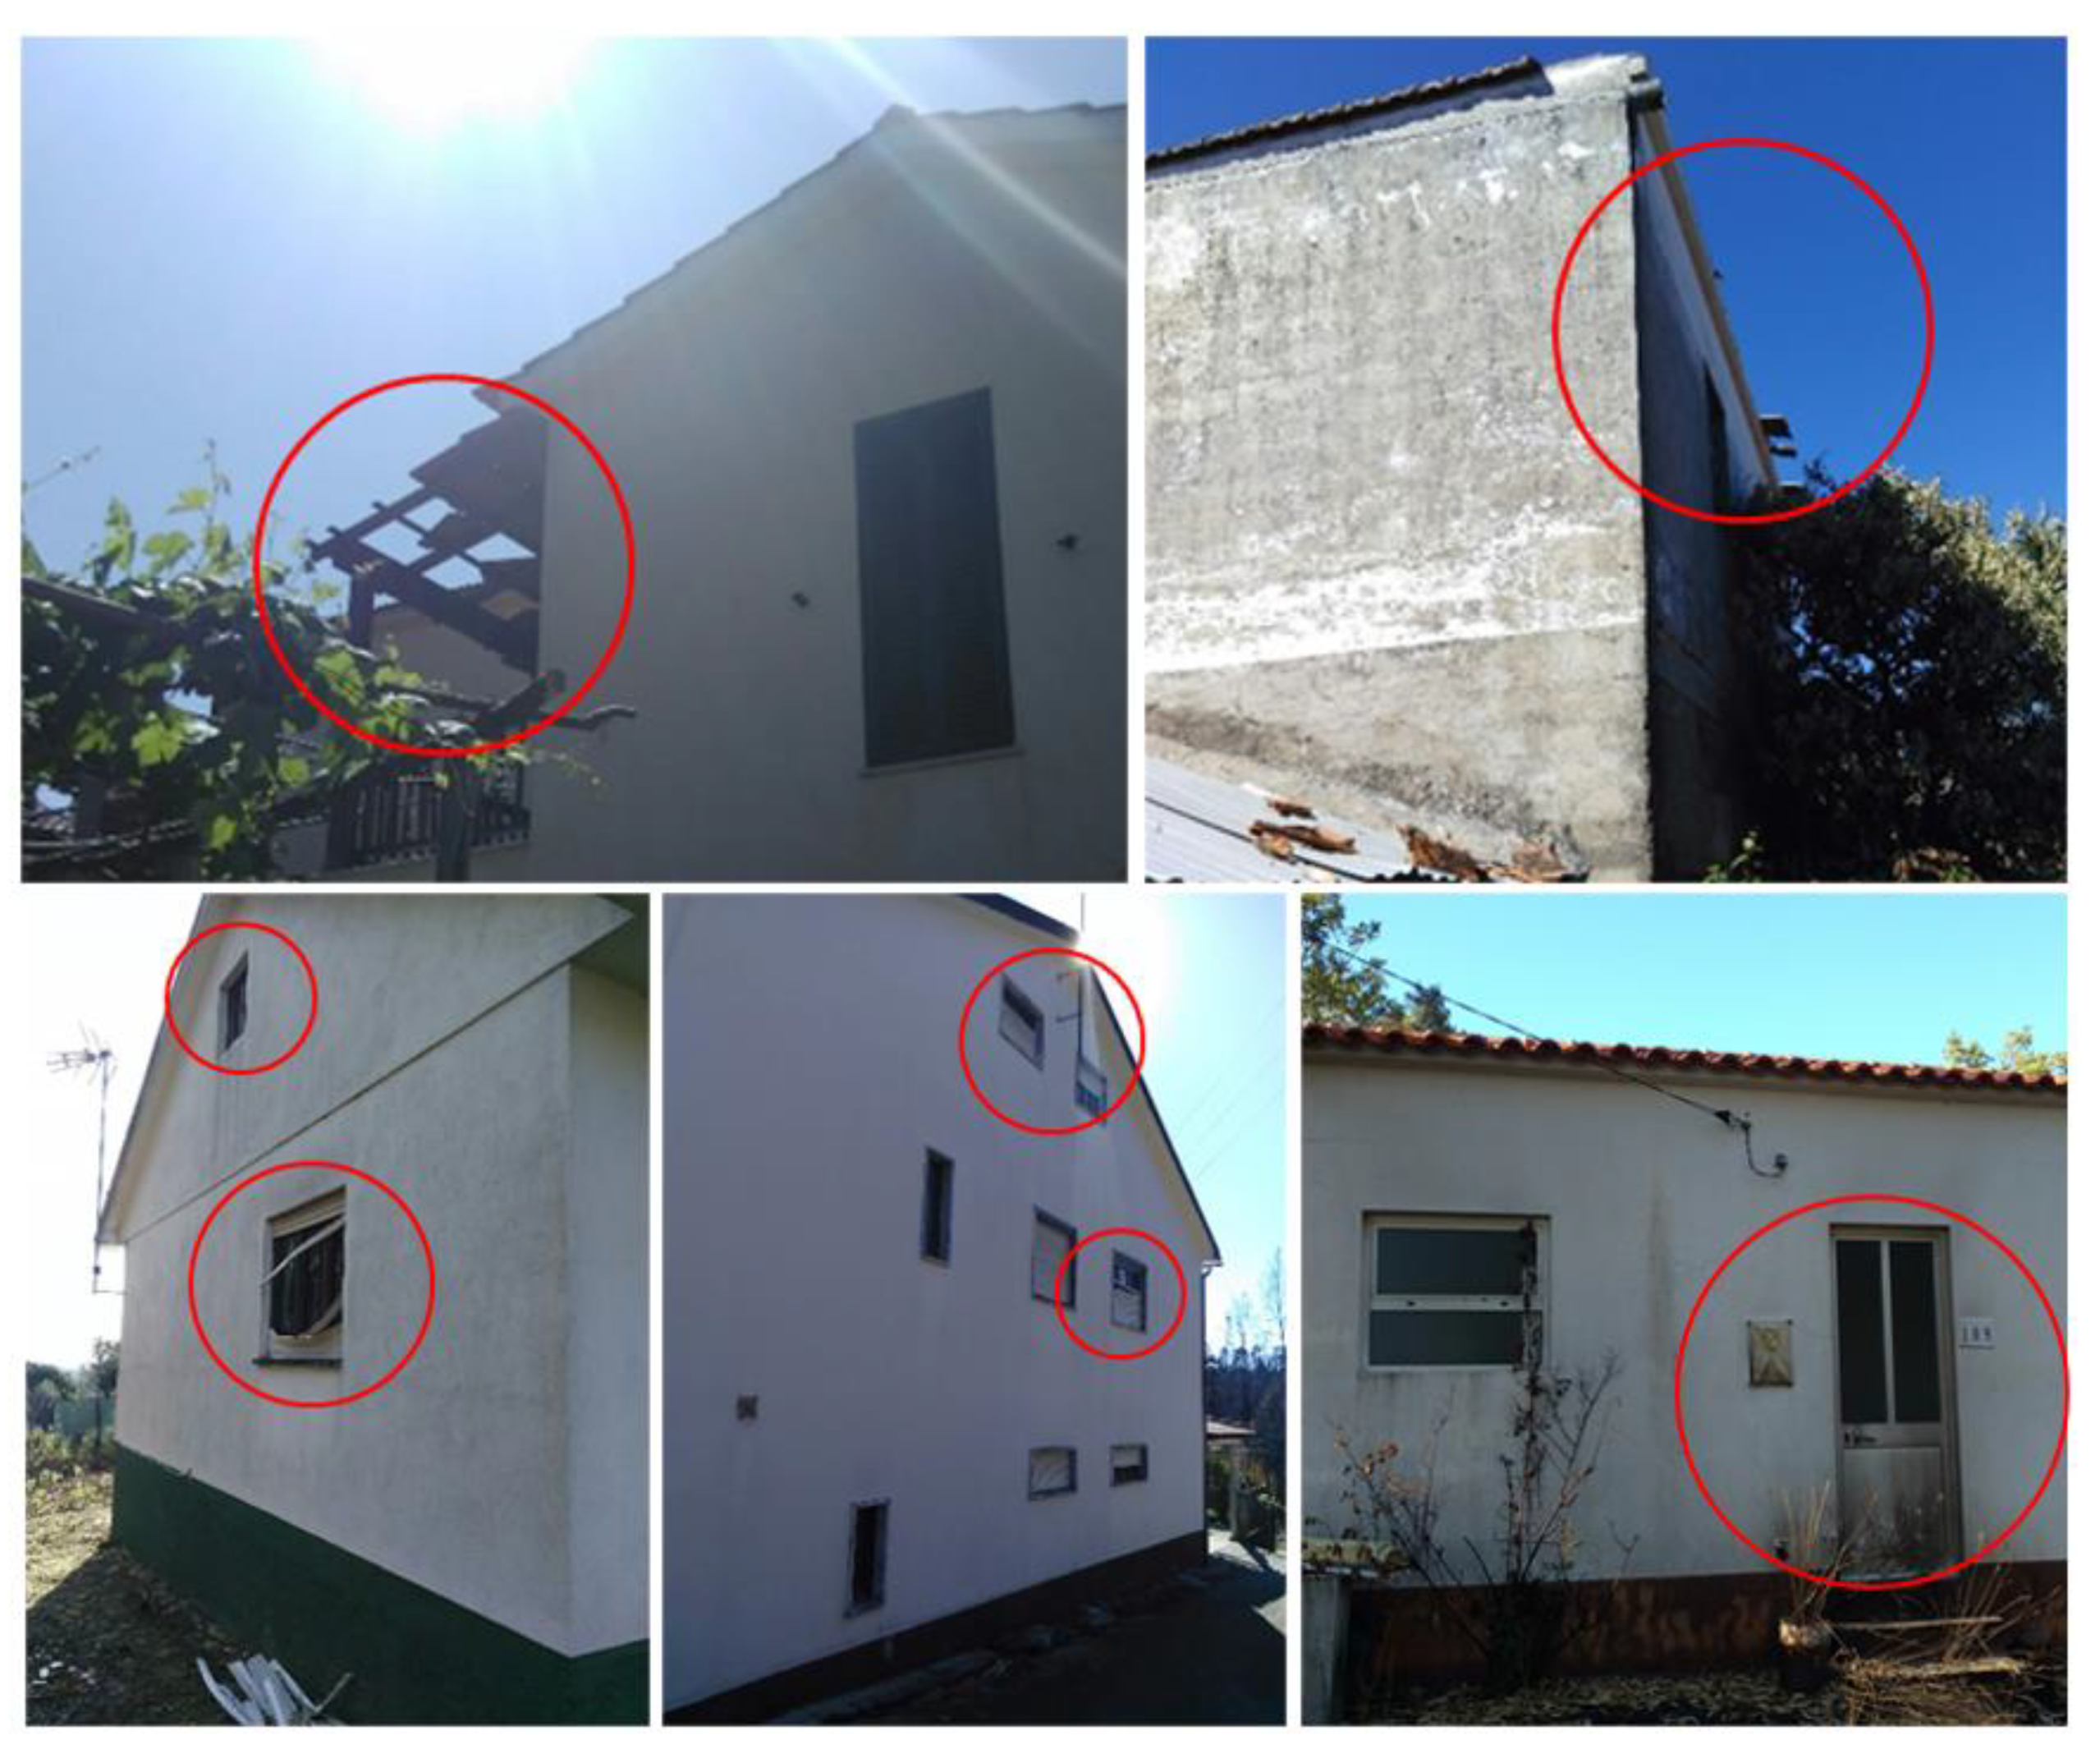
The main mechanisms of structure ignition were already explained, and in this part of the analysis we tried to identify, for each structure, precisely where and how the fire impacted, either by direct observation or by talking to the owners or neighbors of the structure. We obtained 1041 valid answers for both variables. One common answer in both variables, as shown in Table 10 and Table 11, is related to the fact that 38 structures suffered damage but did not ignite. These damages are mostly associated with the strong wind and extreme heat that accompanied the fire. We observed damaged roofs, windows, window blinds, or other small wood or plastic elements, as seen in Figure 6.
About 61% of the structures (Table 10) were damaged because of the deposition of burning embers, or firebrands, in one or more weak spots. This is in line with observations in other case studies, as identified before. This number could be potentially increased, if we added the categories “materials burning in the immediate vicinity” and “contiguous structure”, as we observed that most of these situations were also provoked by firebrands. We did not count them because the true cause of the structure ignition was not directly the firebrand, but the material that it ignited. The direct impact of fire on structures represented 21.3% of the total.
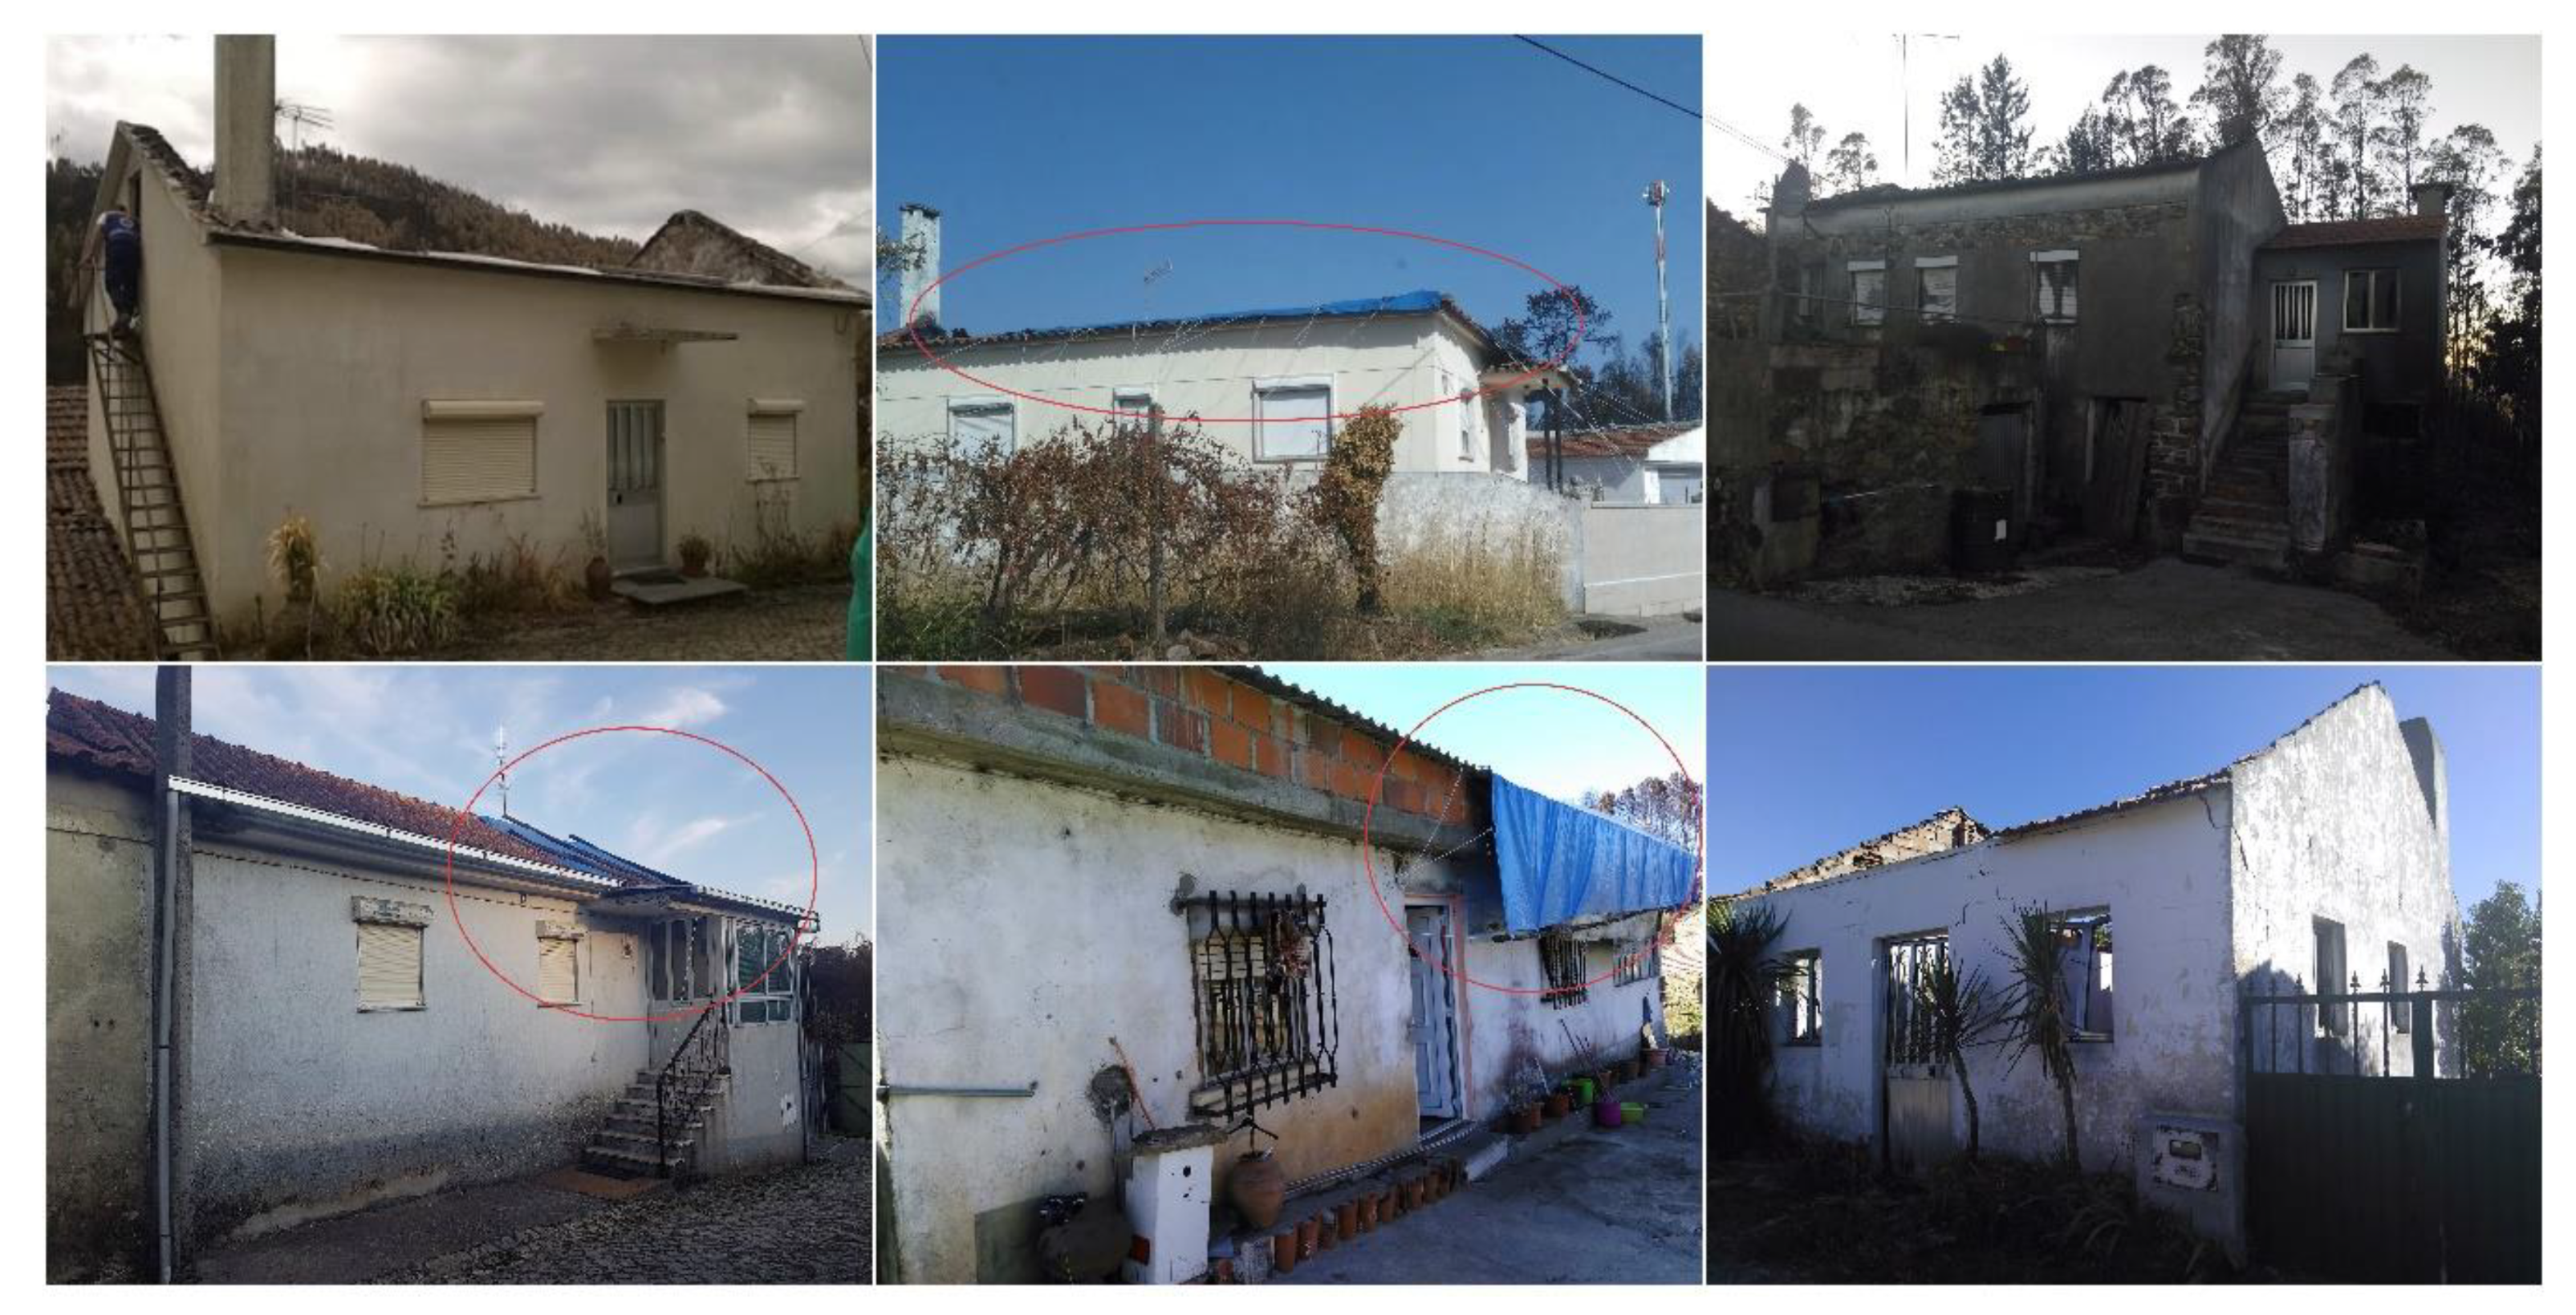
Regarding ignition location (Table 11), most of them were in the roof of the structures (61.8%, Figure 7). These ignitions were of different nature: (i) Firebrands deposited in vulnerable parts of the roofs, either where there was accumulation of fuels (leaves, twigs, etc.), or where there were structural defects, leaving sensitive elements visible (raised tiles, broken vents, holes, etc.) and (ii) the wind that was felt during the fire raised the roofs or part of them, regardless of their state of conservation, or construction materials (tiles, metal sheets, wood), leaving the interior exposed.
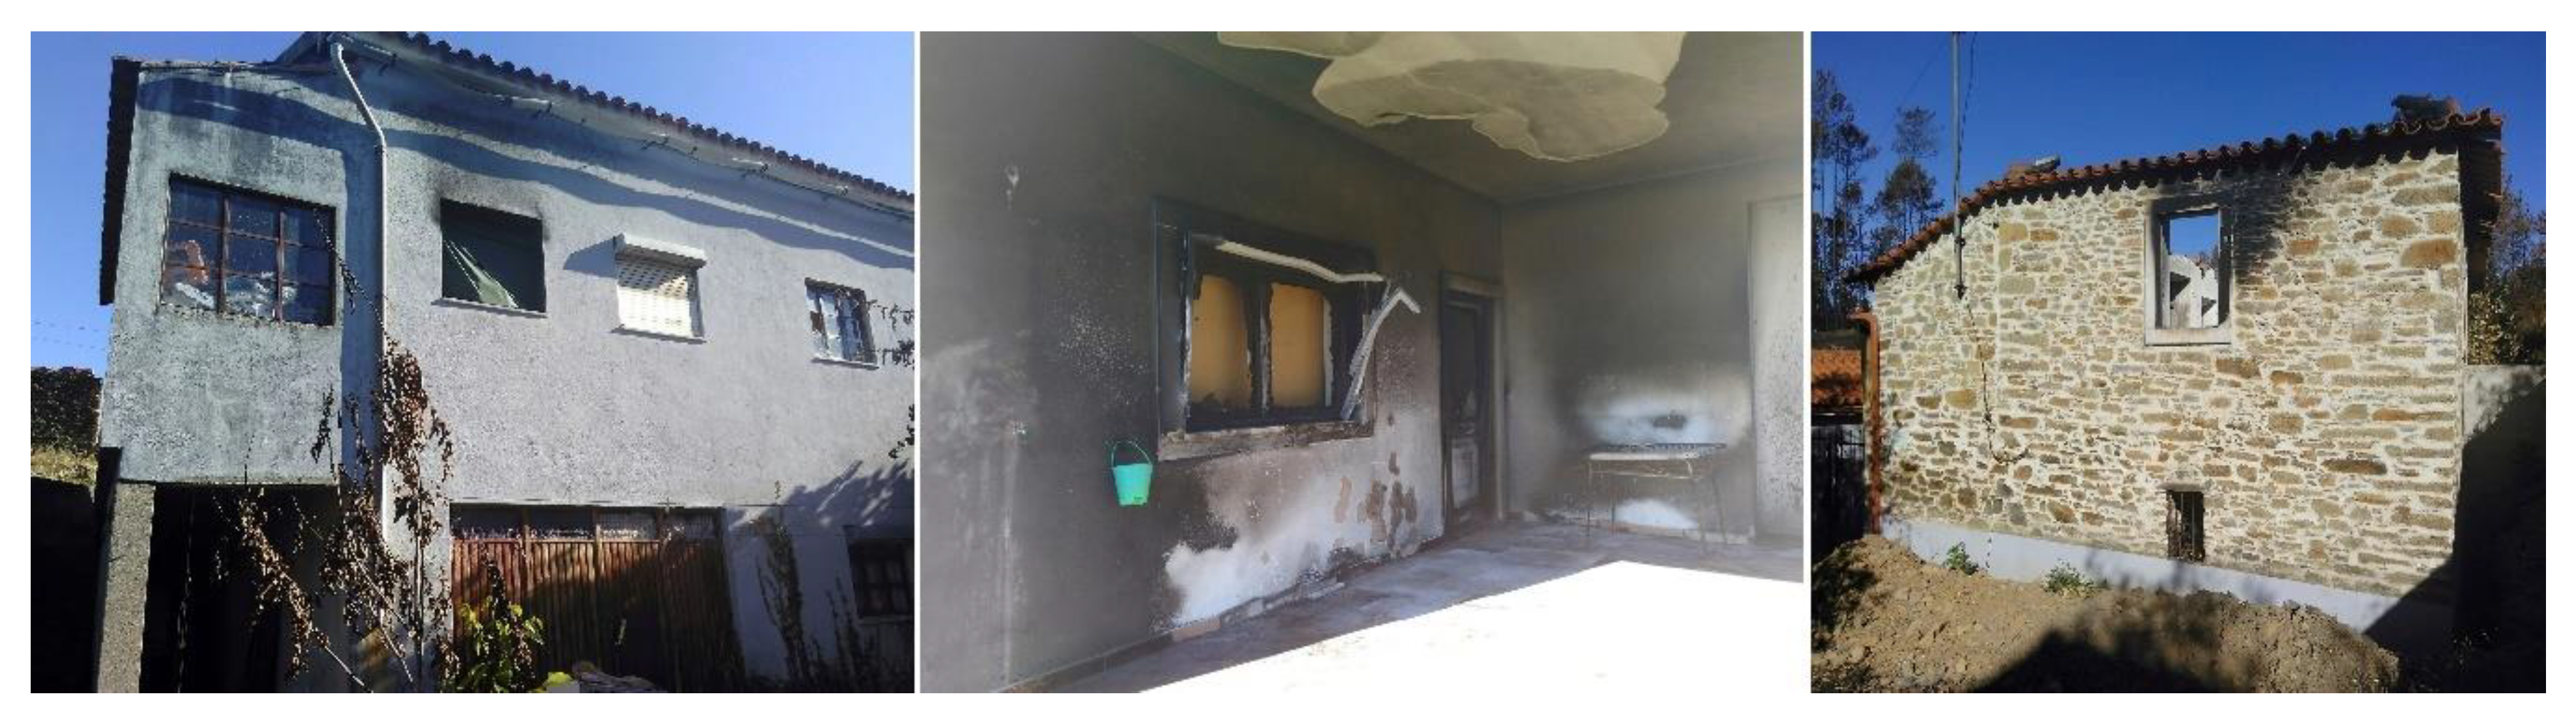
The windows were the second element most exposed to ignition, although with a much lower value (16%, Figure 8). We mainly found cases of old windows, sometimes broken, and many structures where the windows had no glass. These are mostly related to support structures, not to housing. Another aspect that deserves to be highlighted is the existence of vents, especially in older houses, without particle retention systems, which are a point of entry for firebrands (19 cases).
4. Conclusions
The initial objectives delineated for this work were extremely ambitious, as we had the goal to visit and document every single structure affected by the Pedrógão Grande fire complex, in an area of more than 45,000 ha [1]. Considering the resources and time available, we assumed the need to focus on a smaller area, in the region that was most damaged by the fire. Even so, we covered an area of around 29,000 ha, and are confident to have visited the majority, if not all, of the structures damaged by this part of the fire complex.
Although the damage caused by the fire on the structures was scattered by the entire fire area, there was a clear concentration on the central area of the western part of the fire, between the Municipalities of Castanheira de Pera and Pedrogão Grande. In this area, different phenomena of extreme fire behavior were observed, which also resulted in the death of 65 civilians and 1 firefighter [1,73]. The impact of the fire on the local population could eventually be measured by this number of fatalities [73] but also by the type of structures that were burned [74]. More than 85% of the damaged or destroyed structures are of an advanced age and the largest group, almost 40%, were used as support to different occupational activities (like agriculture), or as storage near the residential homes. The most affected part of the population was the aged rural population, typical in some inland regions of Portugal [75]. The value that this fringe of the population puts on their property is extremely high, especially when it relates to their subsistence. The damage caused in residential homes has a strong impact on the losses associated with any wildfire [76], mainly those used as primary residences, which in this case totaled 139, with 41 being destroyed and 46 severely damaged. This had a notorious social impact and gave origin to multiple solidarity campaigns as well as official programs from the Government to help those citizens recover.
Contrary to the fires of October, in the same year [47], the industrial facilities were not much affected, accounting only for 1.4% of the total damaged structures. In October, the destruction in this type of structures was much more marked, and object of a similar detailed study [52]. In that study, the mechanisms of ignition were also analyzed, and the conclusions were similar to the case of Pedrógão, with the firebrands being the main ignition source.
On a final note, during the more complete field work, performed for the production of the aforementioned Report [1] and that includes the diligences to analyze fire behavior and the fatal accidents, as well as the damaged structures, we concluded that, from the 66 fatalities registered in this fire, only 4 happened inside structures (homes). All four victims belonged to a vulnerable population group, that should have been removed to a safe place, had the conditions allowed it. Furthermore, the houses from most of the victims did not suffer sufficient damage to put their lives in risk, should they have chosen to stay. This supports the idea that, for the Portuguese reality, houses are a good refuge, providing that they and their surroundings are well-managed and kept in good conditions.
Author Contributions
Conceptualization, L.M.R., D.X.V.; Methodology, L.M.R., D.X.V.; Writing—original draft, L.M.R.; Writing—review & editing, L.M.R., A.R., D.L. and D.X.V. All authors have read and agreed to the published version of the manuscript.
Funding
This research was partially funded by a contract from the Portuguese Internal Affairs Ministry.
Acknowledgments
The Authors wish to acknowledge the contribution provided by the following research projects: WUIVIEW (www.wuiview.org), funded by European Union’s Civil Protection Mechanism (Agreement ECHO/2018/826522) and HOUSE REFUGE (www.adai.pt/houserefuge), funded by the Portuguese Science and Technology Foundation-FCT (Ref. PCIF/AGT/0109/2018). André Rodrigues is currently supported by a PhD Grant (SFRH/BD/138235/2018) from FCT.
Conflicts of Interest
The authors declare no conflict of interest.
References
- Viegas, D.X.; Figueiredo Almeida, M.; Ribeiro, L.M.; Raposo, J.; Viegas, M.T.; Oliveira, R.; Pinto, C.; Jorge, H.; Rodrigues, A.; Lucas, D. O Complexo de Incêndios de Pedrógão Grande e Concelhos Limítrofes, Iniciado a 17 de Junho de 2017; Centro de Estudos sobre Incêndios Florestais (CEIF/ADAI/LAETA): Coimbra, Portugal, 2017. [Google Scholar]
- Raposo, J.; Viegas, D.X.; Xie, X.; Almeida, M.; Figueiredo, A.R.; Porto, L.; Sharples, J. Analysis of the physical processes associated with junction fires at laboratory and field scales. Int. J. Wildland Fire 2018, 27, 52–68. [Google Scholar] [CrossRef]
- BRP. The Blue Ribbon Panel on Wildland/Urban Interface Fire. Blue Ribbon Panel; International Code Council (ICC): Washington, DC, USA, 2008. [Google Scholar]
- Ribeiro, L.M. Os Incêndios na Interface Urbano-Florestal em Portugal: Uma Análise de Diagnóstico. Dissertação para a Obtenção do Grau de Mestre em Dinâmicas Sociais, Riscos Naturais e Tecnológicos; Faculdade de Ciências e Tecnologia da Universidade de Coimbra: Coimbra, Portugal, 2016. [Google Scholar]
- Butler, C.P. The urban/wildland fire interface. In Proceedings of the Western States Section/Combustion Institute Papers; Washington State University: Spokane, WA, USA, 1974; Volume 74, p. 15. [Google Scholar]
- Restuccia, F. Conduction. In Encyclopedia of Wildfires and Wildland-Urban Interface (WUI) Fires; Springer International Publishing: Cham, Switzerland, 2019; pp. 1–6. [Google Scholar]
- Hu, L.; Delichatsios, M. Thermal Radiation. In Encyclopedia of Wildfires and Wildland-Urban Interface (WUI) Fires; Springer International Publishing: Cham, Switzerland, 2020; pp. 1004–1011. [Google Scholar]
- McAllister, S. Convection. In Encyclopedia of Wildfires and Wildland-Urban Interface (WUI) Fires; Springer International Publishing: Cham, Switzerland, 2018; pp. 1–8. [Google Scholar]
- Manzello, S.L.; Shields, J.R.; Yang, J.C.; Hayashi, Y.; Nii, D. On the use of a firebrand generator to investigate the ignition of structures in wildland-urban interface (WUI) fires. In Proceedings of the Eleventh International Fire Science and Engineering Conference (INTERFLAM), London, UK, 3–5 September 2007. [Google Scholar]
- Cohen, J.D.; Stratton, R.D. Home Destruction Examination Grass Valley Fire; R5-TP-026b; United States Department of Agriculture: Washington, DC, USA, 2008. [Google Scholar]
- Maranghides, A.; Mell, W. A Case Study of a Community Affected by the Witch and Guejito Wildland Fires. Fire Technol. 2011, 47, 379–420. [Google Scholar] [CrossRef]
- Manzello, S.L.; Foote, E.I.D. Characterizing Firebrand Exposure from Wildland–Urban Interface (WUI) Fires: Results from the 2007 Angora Fire. Fire Technol. 2014, 50, 105–124. [Google Scholar] [CrossRef]
- Caton, S.E.; Hakes, R.S.P.; Gorham, D.J.; Zhou, A.; Gollner, M.J. Review of Pathways for Building Fire Spread in the Wildland Urban Interface Part I: Exposure Conditions. Fire Technol. 2017, 53, 429–473. [Google Scholar] [CrossRef]
- Manzello, S.L.; Park, S.-H.; Cleary, T.G. Investigation on the ability of glowing firebrands deposited within crevices to ignite common building materials. Fire Saf. J. 2009, 44, 894–900. [Google Scholar] [CrossRef]
- Manzello, S.L.; Suzuki, S.; Hayashi, Y. Enabling the study of structure vulnerabilities to ignition from wind driven firebrand showers: A summary of experimental results. Fire Saf. J. 2012, 54, 181–196. [Google Scholar] [CrossRef]
- Manzello, S. Enabling the Investigation of Structure Vulnerabilities to Wind- Driven Firebrand Showers in Wildland-Urban Interface (WUI) Fires. Fire Saf. Sci. 2014, 11, 83–96. [Google Scholar] [CrossRef] [Green Version]
- Manzello, S.L.; Suzuki, S. Experimental investigation of wood decking assemblies exposed to firebrand showers. Fire Saf. J. 2017, 92, 122–131. [Google Scholar] [CrossRef]
- Suzuki, S.; Manzello, S.L. Experimental investigation of firebrand accumulation zones in front of obstacles. Fire Saf. J. 2017, 94, 1–7. [Google Scholar] [CrossRef]
- Beverly, J.L.; Bothwell, P.; Conner, J.C.R.; Herd, E.P.K. Assessing the exposure of the built environment to potential ignition sources generated from vegetative fuel. Int. J. Wildland Fire 2010, 19, 299–313. [Google Scholar] [CrossRef]
- Koo, E.; Pagni, P.J.; Weise, D.R.; Woycheese, J.P. Firebrands and spotting ignition in large-scale fires. Int. J. Wildland Fire 2010, 19, 818–843. [Google Scholar] [CrossRef] [Green Version]
- Fernandez-Pello, A.C. Wildland fire spot ignition by sparks and firebrands. Fire Saf. J. 2017, 91, 2–10. [Google Scholar] [CrossRef]
- Manzello, S.L.; Suzuki, S.; Gollner, M.J.; Fernandez-Pello, A.C. Role of firebrand combustion in large outdoor fire spread. Prog. Energy Combust. Sci. 2020, 76, 100801. [Google Scholar] [CrossRef] [PubMed]
- Gorostiaga, J.P.; Vega, J.A.; Fonturbel, M.T.; Guijarro, M.; Hernando, C.; Diez, C.; Martinez, E.; Lampin, C.; Blanc, L.; Colin, P.Y.; et al. Capability of ignition of some forest firebrands. In Proceedings of the V International Conference on Forest Fire research and wildland Fire Safety Summit, Luso Coimbra, Portugal, 18–23 November 2002; pp. 1–11. [Google Scholar]
- Manzello, S.L.; Cleary, T.G.; Shields, J.R.; Yang, J.C. Ignition of mulch and grasses by firebrands in wildland-urban interface fires. Int. J. Wildland Fire 2006, 15, 427–431. [Google Scholar] [CrossRef]
- Manzello, S.L.; Cleary, T.G.; Shields, J.R.; Yang, J.C. On the ignition of fuel beds by firebrands. Fire Mater. 2006, 30, 77–87. [Google Scholar] [CrossRef]
- Hadden, R.M.; Scott, S.; Lautenberger, C.; Fernandez-Pello, A.C. Ignition of Combustible Fuel Beds by Hot Particles: An Experimental and Theoretical Study. Fire Technol. 2010, 47, 341–355. [Google Scholar] [CrossRef] [Green Version]
- Viegas, D.X.; Almeida, M.; Raposo, J.; Oliveira, R.; Viegas, C.X. Ignition of Mediterranean Fuel Beds by Several Types of Firebrands. Fire Technol. 2014, 50, 61–77. [Google Scholar] [CrossRef]
- Cohen, J.D. What is the Wildland Fire Threat to Homes? In Thompson Memorial Lecture; School of Forestry, Northern Arizona University: Flagstaff, AZ, USA, 2000. [Google Scholar]
- Pyne, S.J.; Andrews, P.L.; Laven, R.D. Introduction to Wildland Fire; Wiley: New York, NY, USA, 1996. [Google Scholar]
- Cohen, J.D. The wildland-urban interface fire problem: A consequence of the fire exclusion paradigm. For. Hist. Today 2008, 20–26. [Google Scholar]
- Cohen, J. The wildland-urban interface fire problem. Fremontia 2010, 38, 16–22. [Google Scholar]
- Graham, R.; Finney, M.; McHugh, C.; Cohen, J.; Calkin, D.; Stratton, R.; Bradshaw, L.; Nikolov, N. Fourmile Canyon Fire Findings; USDA: Fort Collins, CO, USA, 2012.
- Mell, W.; Manzello, S.L.; Maranghides, A.; Butry, D.; Rehm, R.G. The wildland-urban interface fire problem—Current approaches and research needs. Int. J. Wildland Fire 2010, 19, 238–251. [Google Scholar] [CrossRef]
- Cohen, J.D. Structure Ignition Assessment Model (SIAM). In The Biswell Symposium: Fire Issues and Solutions in Urban Interface and Wildland Ecosystems; Walnut Creek, California. Gen. Tech. Rep. PSW-GTR-158; Weise, D.R., Martin, R.E., Eds.; Pacific Southwest Research Station, Forest Service, U.S. Department of Agriculture: Albany, CA, USA, 1994; pp. 85–92. [Google Scholar]
- Platt, R.V. Wildfire hazard in the home ignition zone: An object-oriented analysis integrating LiDAR and VHR satellite imagery. Appl. Geogr. 2014, 51, 108–117. [Google Scholar] [CrossRef]
- Gollner, M.J.; Hakes, R.; Caton, S.; Kohler, K. Pathways for Building Fire Spread at the Wildland Urban Interface; Fire Protection Research Foundation: Quincy, MA, USA, 2015. [Google Scholar]
- Westhaver, A. Why Some Homes Survived: Learning from the Fort Mcmurray Wildland/Urban Interface Fire Disaster; Research Paper Series (56); Institute for Catastrophic Loss Reduction: Toronto, ON, Canada, 2017. [Google Scholar]
- Cohen, J.D.; Butler, B.W. Modeling potential structure ignitions from flame radiation exposure with implications for wildland/urban interface fire management. In Proceedings of the 13th Fire and Forest Meteorology Conference, Lorne, Australia, 27–31 October 1996; International Association of Wildland Fire: Lorne, Australia, 1996; pp. 81–87. [Google Scholar]
- Penman, S.; Price, O.; Penman, T.D.; Bradstock, R.A. The role of defensible space on the likelihood of house impact from wildfires in forested landscapes of south eastern Australia. Int. J. Wildland Fire 2019, 28, 4–14. [Google Scholar] [CrossRef]
- Cohen, J.D. Relating flame radiation to home ignition using modeling and experimental crown fires. Can. J. For. Res. 2004, 34, 1616–1626. [Google Scholar] [CrossRef]
- Cohen, J.D. Preventing disaster: Home ignitability in the wildland-urban interface. J. For. 2000, 98, 15–21. [Google Scholar]
- Gibbons, P.; Van Bommel, L.; Gill, A.M.; Cary, G.J.; Driscoll, D.A.; Bradstock, R.A.; Knight, E.J.; Moritz, M.A.; Stephens, S.L.; Lindenmayer, D.B. Land Management Practices Associated with House Loss in Wildfires. PLoS ONE 2012, 7, e29212. [Google Scholar] [CrossRef] [PubMed]
- Gibbons, P.; Gill, A.M.; Shore, N.; Moritz, M.A.; Dovers, S.; Cary, G.J. Options for reducing house-losses during wildfires without clearing trees and shrubs. Landsc. Urban Plan. 2018, 174, 10–17. [Google Scholar] [CrossRef]
- Ribeiro, C.; Viegas, D.X.; Almeida, M.; Ribeiro, L.M.; Rodrigues, A.; Raposo, J.; Alves, D. Forest fuel management in wildland urban interface areas. In Incendios Forestales: Amenazas y Oportunidades Ante los Desafíos de un Entorno Cambiante; Colección: SINIF-Incendios Forestales, No 2; SINIF: Alicante, Spain, 2019. [Google Scholar]
- Partners in Protection. FireSmart: Protecting Your Community from Wildfire, 2nd ed.; Maryhelen Vicars & Associates: Edmonton, AB, Canada, 2003. [Google Scholar]
- Tedim, F.; Carvalho, S. A vulnerabilidade aos incêndios florestais: Reflexões em torno de aspetos conceptuais e metodológicos. Territ. Rev. Port. Riscos Prevenção Segurança 2013, 85–99. [Google Scholar] [CrossRef]
- Viegas, D.X.; Almeida, M.F.; Ribeiro, L.M.; Raposo, J.; Viegas, M.T.; Viegas, D.X.; Almeida, M.A.; Ribeiro, L.M.; Raposo, J.; Viegas, M.T.; et al. Análise dos Incêndios Florestais Ocorridos a 15 de Outubro de 2017; Centro de Estudos Sobre Incêndios Florestais (CEIF/ADAI/LAETA): Coimbra, Portugal, 2019. [Google Scholar]
- Cohen, J.D.; Saveland, J. Structure Ignition Assessment Can Help Reduce Fire Damages in the W-UI. Fire Manag. Notes 1997, 57, 19–23. [Google Scholar]
- Cohen, J.D. Preventing Residential Fire Disasters During Wildfires. In Proceedings of the International Workshop Forest Fires in the Wildland-Urban Interface and Rural Areas in Europe: An Integral Planning and Management Challenge, Athens, Greece, 15–16 May 2003; Xanthopoulos, G., Ed.; WARM Project. Publications Office of the EU: Luxembourg, 2003. [Google Scholar]
- Alcasena, F.J.; Salis, M.; Ager, A.A.; Castell, R.; Vega-Garcia, C. Assessing Wildland Fire Risk Transmission to Communities in Northern Spain. Forests 2017, 8, 30. [Google Scholar] [CrossRef] [Green Version]
- Ribeiro, L.M.; Rodrigues, A.; Lucas, D.; Viegas, D.X. The large fire of Pedrógão Grande (Portugal) and its impact on structures. In Advances in Forest Fire Research 2018; Viegas, D.X., Ed.; Imprensa da Universidade de Coimbra: Coimbra, Portugal, 2018; pp. 852–858. [Google Scholar]
- Almeida, M.; Pinto, C.; Prates, P.; Rodrigues, A.; Oliveira, R.; Ribeiro, L.M.; Viegas, D.X. Mechanisms of fire propagation to industrial facilities affected by the major wildfire events occurred in Portugal on 15/Oct/2017. In Incendios Forestales: Amenazas y Oportunidades Ante los Desafíos de un Entorno Cambiante; Colección: SINIF-Incendios Forestales, N° 2.; SINIF: Alicante, Spain, 2019. [Google Scholar]
- Syphard, A.D.; Keeley, J.E.; Bar Massada, A.; Brennan, T.J.; Radeloff, V.C. Housing Arrangement and Location Determine the Likelihood of Housing Loss Due to Wildfire. PLoS ONE 2012, 7, e33954. [Google Scholar] [CrossRef] [PubMed] [Green Version]
- Syphard, A.D.; Brennan, T.J.; Keeley, J.E. The importance of building construction materials relative to other factors affecting structure survival during wildfire. Int. J. Disaster Risk Reduct. 2017, 21, 140–147. [Google Scholar] [CrossRef]
- Alexandre, P.M.; Mockrin, M.H.; Stewart, S.I.; Hammer, R.B.; Radeloff, V.C. Rebuilding and new housing development after wildfire. Int. J. Wildland Fire 2015, 24, 138–149. [Google Scholar] [CrossRef] [Green Version]
- Syphard, A.D.; Keeley, J.E. Factors Associated with Structure Loss in the 2013–2018 California Wildfires. Fire 2019, 2, 49. [Google Scholar] [CrossRef] [Green Version]
- Blanchi, R.; Leonard, J.; Haynes, K.; Opie, K.; James, M.; Kilinc, M.; de Oliveira, F.D.; van den Honert, R. Life and House Loss Database Description and Analysis Final Report; CSIRO EP-129645; CSIRO, Bushfire CRC Report to the Attorney-General’s Department: Canberra, Australia, 2012. [Google Scholar]
- Beighley, M.; Hyde, A.C. Portugal Wildfire Management in a New Era Assessing Fire Risks, Resources and Reforms; Technical Report; 2018. [Google Scholar]
- Paveglio, T.B.; Edgeley, C.M. Fire Adapted Community. Encycl. Wildfires Wildland-Urban Interface Fires 2020, 320–328. [Google Scholar] [CrossRef]
- Thompson, M.P.; Silva, F.R.Y.; Calkin, D.E.; Hand, M.S. A review of challenges to determining and demonstrating efficiency of large fire management. Int. J. Wildland Fire 2017, 26, 562. [Google Scholar] [CrossRef] [Green Version]
- Tymstra, C.; Stocks, B.J.; Cai, X.; Flannigan, M.D. Wildfire management in Canada: Review, challenges and opportunities. Prog. Disaster Sci. 2020, 5, 100045. [Google Scholar] [CrossRef]
- ESRI. ArcMap|Documentation. 2020. Available online: https://desktop.arcgis.com/en/arcmap/ (accessed on 4 May 2020).
- de Smith, M.J.; Goodchild, M.F.; Longley, P.A. Geospatial Analysis. In A Comprehensive Guide to Principles, Techniques and Software Tools, 5th ed.; The Winchelsea Press: Winchelsea, UK, 2015. [Google Scholar]
- ESRI. Data Collection App|Collector for ArcGIS—Capture Field Data. 2020. Available online: https://www.esri.com/en-us/arcgis/products/collector-for-arcgis/overview (accessed on 29 April 2020).
- IBM Corp. IBM SPSS Statistics for Windows, Version 25.0; IBM Corp: Armonk, NY, USA, 2017. [Google Scholar]
- Microsoft Corporation. Microsoft Excel. 2017. Available online: https://office.microsoft.com/excel (accessed on 20 July 2020).
- ESRI. What is a Geodatabase?—ArcGIS Help|ArcGIS Desktop. 2020. Available online: https://desktop.arcgis.com/en/arcmap/10.3/manage-data/geodatabases/what-is-a-geodatabase.htm (accessed on 29 April 2020).
- ESRI. ArcGIS Online|Software de Mapeamento SIG Baseado na Cloud. 2020. Available online: https://www.esri.com/pt-pt/arcgis/products/arcgis-online/overview (accessed on 4 May 2020).
- Esri Portugal. FireHub 2017. 2017. Available online: http://arcg.is/2rMwc0B (accessed on 20 July 2017).
- AFN. Gestão de Combustíveis para Protecção de Edificações—Manual; Autoridade Florestal Nacional—Direcção Nacional para a Defesa da Floresta: Lisboa, Portugal, 2011. [Google Scholar]
- Faixas de Gestão de Combustíveis: Edifícios Isolados e Aglomerados Populacionais; ICNF: Lisboa, Portugal, 2018.
- Hakes, R.S.P.; Caton, S.E.; Gorham, D.J.; Gollner, M.J. A Review of Pathways for Building Fire Spread in the Wildland Urban Interface Part II: Response of Components and Systems and Mitigation Strategies in the United States. Fire Technol. 2017, 53, 475–515. [Google Scholar] [CrossRef]
- Ribeiro, L.M.; Viegas, D.X.; Almeida, M.; McGee, T.K.; Pereira, M.G.; Parente, J.; Xanthopoulos, G.; Leone, V.; Delogu, G.M.; Hardin, H. Extreme wildfires and disasters around the world: Lessons to be learned. In Extreme Wildfire Events and Disasters; Elsevier: Amsterdam, The Netherlands, 2020; pp. 31–51. [Google Scholar]
- Lampin-Maillet, C.; Jappiot, M.; Long, M.; Morge, D.; Ferrier, J.-P. Characterization and mapping of dwelling types for forest fire prevention. Comput. Environ. Urban Syst. 2009, 33, 224–232. [Google Scholar] [CrossRef] [Green Version]
- Programa Nacional para a Coesão Territorial. In Implementação, Acompanhamento e Monitorização; UMVI, 2016.
- Butry, D.; Mercer, E.; Prestemon, J. What is the price of catastrophic wildfire? J. For. 2001, 99, 9–17. [Google Scholar] [CrossRef]
Figure 1.
Estimated fire progression and main ignitions.

Figure 2.
Characterization of wildland urban interface (WUI) fire risk in Portugal at Municipality level (adapted from [4], with the area of the Pedrógão fire highlighted.
Figure 2.
Characterization of wildland urban interface (WUI) fire risk in Portugal at Municipality level (adapted from [4], with the area of the Pedrógão fire highlighted.

Figure 3.
Location of all points visited (blue, red, and orange) and not visited (yellow).

Figure 4.
Heatmap representing the density of structures damaged by the fire.

Figure 5.
Example of totally destroyed wooden houses. The picture bellow refers to one of the destroyed houses before the fire, and it was taken from Google Earth Street View.
Figure 5.
Example of totally destroyed wooden houses. The picture bellow refers to one of the destroyed houses before the fire, and it was taken from Google Earth Street View.

Figure 6.
Details of some elements that were damaged by the fire but with no ignition to the house.

Figure 7.
Example of houses that had ignitions through the roof.

Figure 8.
Example of houses that had ignitions through the windows.


Table 1.
Variables used in the field work, the corresponding answer options, and the ratio of answers obtained.
Table 1.
Variables used in the field work, the corresponding answer options, and the ratio of answers obtained.
| Variable Group | Item/Variable | Options | Answers |
|---|---|---|---|
| 1. The structure | 1.1 Type of structure | Primary housing; Secondary housing; Agricultural warehouse; Shed/Storage; Garage; Commerce; Industry; Uninhabited house; Vacant structure; Cattle shed/Stable; Outdoor kitchen; Other | 1043 (100%) |
| 1.2 Type of construction | Masonry; Stone; Wood; Metal; Other | 1042 (99.9%) | |
| 1.3 Age of construction | <10 years; between 10 and 30 years; >30 years | 1037 (99.4%) | |
| 1.4 Use of the structure before the fire | In use; Out of use | 1037 (99.4%) | |
| 1.5 Condition of the structure before the fire | Well preserved; Moderately preserved; Poorly preserved; In ruins | 1035 (99.7%) | |
| 1.6 Condition of the structure after the fire | Little damaged; Moderately damaged; Very damaged; Totally destroyed | 1043 (100%) | |
| 2. The surroundings of the structure | 2.1 Fuel management | Total; Partial; Absent | 963 (92.3%) |
| 2.2 Isolated structure? | Yes/No | 1042 (99.9%) | |
| 3. The arrival and impact of the fire | 3.1 Date of fire arrival | Date | 464 (44.5%) |
| 3.2 Time of fire arrival | Time | 464 (44.5%) | |
| 3.3 Ignition location | Roof; Window; Door; Open structure; Wall; Vent; Other; With damage but no ignition | 1041 (99.8%) | |
| 3.4 How the ignition occurred | Firebrands; Direct fire impact; Materials burning in the immediate vicinity; Contiguous structure; With damage but no ignition | 1041 (99.8%) | |
| 3.5 Did you have communications at the time of the fire? | Yes/No | 161 (15.4%) | |
| 3.6 Did the electric power fail during the fire? | Yes/No | 166 (15.9%) | |
| 3.7 Power supply failure time | Time | 133 (12.8%) | |
| 3.8 Did the water fail during the fire? | Yes/No | 162 (15.5%) | |
| 3.9 Water supply failure time | Time | 111 (10.6%) | |
| 4. Human behavior towards the incoming fire | 4.1 User of the structure ran away at the time of the fire? | Yes/No | 140 (13.4%) |
| 4.2 User of the structure survived on the run? | Yes/No | 73 (7%) | |
| 4.3 Were there people defending the structure? | Yes/No | 231 (22.1%) | |
| 4.4 Did anyone get injured defending the structure? | Yes/No | 103 (9.9%) | |
| 4.5 Number of injured persons defending the structure | Number | 8 (0.8%) | |
| 4.6 Did anyone die defending the structure? | Yes/No | 92 (8.8%) | |
| 4.7 Number of deaths defending the structure | Number | 3 (0.3%) |
Table 2.
Resume of the number and distribution of the damaged structures considered for analysis, among the three Portuguese Administrative divisions.
Table 2.
Resume of the number and distribution of the damaged structures considered for analysis, among the three Portuguese Administrative divisions.
| 1. District | Total | 2. Municipality | Total | 3. Parish/Union of Parishs | Total |
|---|---|---|---|---|---|
| Castelo Branco | 30 | Sertã | 30 | Castelo | 5 |
| Cernache do Bonjardim, Nesperal e Palhais | 25 | ||||
| Coimbra | 23 | Penela | 23 | Cumeeira | 2 |
| Espinhal | 21 | ||||
| Leiria | 990 | Castanheira de Pêra | 172 | Castanheira de Pêra e Coentral | 172 |
| Figueiró dos Vinhos | 178 | Aguda | 51 | ||
| Campelo | 57 | ||||
| Figueiró dos Vinhos e Bairradas | 70 | ||||
| Pedrogão Grande | 640 | Graça | 225 | ||
| Pedrógão Grande | 134 | ||||
| Total | 1043 |
Table 3.
Number of structures inventoried per degree of damage.
| Condition of the Structure after the Fire | |||||
|---|---|---|---|---|---|
| Slightly Damaged | Moderately Damaged | Highly Damaged | Totally Destroyed | Total | |
| Number of structures | 79 (7.6%) | 74 (7.1%) | 432 (41.4%) | 458 (43.9%) | 1043 (100%) |
Table 4.
Degree of damage according to the type of structure.
| Condition of the Structure after the Fire 1 | |||||
|---|---|---|---|---|---|
| Type of Structure | Slightly Damaged | Moderately Damaged | Highly Damaged | Totally Destroyed | Total 2 1043 (100%) |
| Primary housing | 35 (25.2%) | 17 (12.2%) | 46 (33.1%) | 41 (29.5%) | 139 (13.3%) |
| Secondary housing | 19 (15.3%) | 9 (7.3%) | 46 (37.1%) | 50 (40.3%) | 124 (11.9%) |
| Agricultural Warehouse | 1 (1.4%) | 5 (6.8%) | 28 (37.8%) | 40 (54.1%) | 74 (7.1%) |
| Shed/Storage | 12 (3%) | 20 (5%) | 179 (44.4%) | 192 (47.6%) | 403 (38.6%) |
| Garage | 5 (8.3%) | 9 (15%) | 22 (36.7%) | 24 (40%) | 60 (5.8%) |
| Commerce | 0 (0%) | 1 (100%) | 0 (0%) | 0 (0%) | 1 (0.1%) |
| Industry | 0 (0%) | 2 (13.3%) | 5 (33.3%) | 8 (53.3%) | 15 (1.4%) |
| Uninhabited house | 2 (3.4%) | 4 (6.9%) | 36 (62.1%) | 16 (27.6%) | 58 (5.6%) |
| Vacant structure | 1 (0.8%) | 3 (2.3%) | 56 (42.4%) | 72 (54.5%) | 132 (12.7%) |
| Cattle shed/Stable | 2 (10%) | 1 (5%) | 8 (40%) | 9 (45%) | 20 (1.9%) |
| Outdoor kitchen | 0 (0%) | 2 (33.3%) | 2 (33.3%) | 2 (33.3%) | 6 (0.6%) |
| Other | 2 (18.2%) | 1 (9.1%) | 4 (36.4%) | 4 (36.4%) | 11 (1.1%) |
1 Values represent the number of structures and the respective percentage in each class of damage inside each type of structure (read percentage horizontally); 2 Values represent the number of structures per type of structure and the percentage in respect to the total of damaged structures (read percentage vertically).
Table 5.
Degree of damage according to the condition of the structure and the use of the structure before the fire.
Table 5.
Degree of damage according to the condition of the structure and the use of the structure before the fire.
| Condition of the Structure after the Fire 1 | ||||||
|---|---|---|---|---|---|---|
| Use and Condition of the Structure before The Fire | Slightly Damaged | Moderately Damaged | Highly Damaged | Totally Destroyed | Total 2 (1035) | |
| In use | Well preserved | 47 (21.5%) | 27 (12.3%) | 50 (22.8%) | 95 (43.4%) | 219 |
| Moderately preserved | 25 (4.9%) | 33 (6.5%) | 224 (44%) | 227 (44.6%) | 509 | |
| Poorly preserved | 1 (2.9%) | 1 (2.9%) | 14 (41.2%) | 18 (52.9%) | 34 | |
| Sub-total | 73 (9.6%) | 61 (8%) | 288 (37.8%) | 340 (44.6%) | 762 (73.6%) | |
| Out of use | Well preserved | 1 (33.3%) | 0 (0%) | 1 (33.3%) | 1 (33.3%) | 3 |
| Moderately preserved | 1 (1.1%) | 7 (8%) | 53 (60.9%) | 26 (29.9%) | 87 | |
| Poorly preserved | 4 (2.2%) | 6 (3.3%) | 88 (48.1%) | 85 (46.4%) | 183 | |
| Sub-total | 6 (2.2%) | 13 (4.8%) | 142 (52%) | 112 (41%) | 273 (26.4%) | |
1 Values represent the number of structures and the respective percentage in each class of damage inside each class of use and condition (read percentage horizontally); 2 Values represent the number of structures per class of use inside each class of structure condition and the percentage in respect to the total of damaged structures (read percentage vertically).
Table 6.
Degree of damage according to the type of construction.
| Condition of the Structure after the Fire 1 | |||||
|---|---|---|---|---|---|
| Type of Construction | Slightly Damaged | Moderately Damaged | Highly Damaged | Totally Destroyed | Total 2 (1042) |
| Masonry | 71 (13.4%) | 57 (10.8%) | 195 (36.8%) | 207 (39.1%) | 530 (50.9%) |
| Stone | 7 (1.7%) | 14 (3.3%) | 222 (52.9%) | 177 (42.1%) | 420 (40.3%) |
| Wood | 0 (0%) | 0 (0%) | 0 (0%) | 29 (100%) | 29 (2.8%) |
| Metal | 1 (1.7%) | 2 (3.3%) | 14 (23.3%) | 43 (71.7%) | 60 (5.8%) |
| Other | 0 (0%) | 1 (33.3%) | 1 (33.3%) | 1 (33.3%) | 3 (0.3%) |
1 Values represent the number of structures and the respective percentage in each class of damage inside each class of type of construction (read percentage horizontally); 2 Values represent the number of structures per type of construction and the percentage in respect to the total of damaged structures (read percentage vertically).
Table 7.
Degree of damage according to the approximate age of the structure.
| Condition of the Structure after the Fire 1 | |||||
|---|---|---|---|---|---|
| Age of Construction | Slightly Damaged | Moderately Damaged | Highly Damaged | Totally Destroyed | Total 2 (1037) |
| <10 years | 6 (23.1%) | 5 (19.2%) | 2 (7.7%) | 13 (50%) | 26 (2.5%) |
| Between 10 and 30 years | 17 (14.4%) | 11 (9.3%) | 26 (22%) | 64 (54.2%) | 118 (11.4%) |
| >30 years | 56 (6.3%) | 58 (6.5%) | 399 (44.7%) | 380 (42.6%) | 893 (86.1%) |
1 Values represent the number of structures and the respective percentage in each class of damage inside each class of use and condition (read percentage horizontally); 2 Values represent the number of structures per class of age and the percentage in respect to the total of damaged structures (read percentage vertically).
Table 8.
Degree of damage according to the fuel management on the surroundings of the structure.
| Condition of the Structure after the Fire 1 | |||||
|---|---|---|---|---|---|
| Fuel Management | Slightly Damaged | Moderately Damaged | Highly Damaged | Totally Destroyed | Total 2 (963) |
| Absent | 17 (4%) | 20 (4.7%) | 183 (43.3%) | 203 (48%) | 423 (43.9%) |
| Partial | 37 (7.6%) | 40 (8.2%) | 198 (40.7%) | 211 (43.4%) | 486 (50.5%) |
| Full | 7 (13%) | 8 (14.8%) | 19 (35.2%) | 20 (37%) | 54 (5.6%) |
1 Values represent the number of structures and the respective percentage in each class of damage inside each class of fuel management (read percentage horizontally); 2 Values represent the number of structures per class of fuel management and the percentage in respect to the total of damaged structures (read percentage vertically).
Table 9.
Degree of damage according to the relative house location and fuel management.
| Condition of the Structure after the Fire 1 | ||||||
|---|---|---|---|---|---|---|
| Structure location and Fuel Management | Slightly Damaged | Moderately Damaged | Highly Damaged | Totally Destroyed | Total 2 (963) | |
| Isolated | Absent | 12 (5%) | 13 (5.4%) | 113 (47.1%) | 102 (42.5%) | 240 |
| Partial | 15 (8.4%) | 14 (7.9%) | 71 (39.9%) | 78 (43.8%) | 178 | |
| Full | 6 (16.2%) | 7 (18.9%) | 12 (32.4%) | 12 (32.4%) | 37 | |
| Sub-total | 33 (7.3%) | 34 (7.5%) | 196 (43.1%) | 192 (42.2%) | 455 (47.2%) | |
| Not isolated | Absent | 5 (2.7%) | 7 (3.8%) | 70 (38.3%) | 101 (55.2%) | 183 |
| Partial | 22 (7.1%) | 26 (8.4%) | 127 (41.2%) | 133 (43.2%) | 308 | |
| Full | 1 (5.9%) | 1 (5.9%) | 7 (41.2%) | 8 (47.1%) | 17 | |
| Sub-total | 28 (5.5%) | 34 (6.7%) | 204 (40.2%) | 242 (47.6%) | 508 (52.8%) | |
1 Values represent the number of structures and the respective percentage in each class of damage inside each class of fuel management and structure location (read percentage horizontally); 2 Values represent the number of structures per class of fuel management inside each class of structure location and the percentage in respect to the total of damaged structures (read percentage vertically).
Table 10.
Degree of damage according to the type of ignition.
| Condition of the Structure after the Fire 1 | |||||
|---|---|---|---|---|---|
| Type of Ignition | Slightly Damaged | Moderately Damaged | Highly Damaged | Totally Destroyed | Total 2 (1042) |
| Firebrands | 27 (4.2%) | 54 (8.5%) | 294 (46.2%) | 261 (41%) | 636 (61.1%) |
| Direct fire impact | 7 (3.2%) | 8 (3.6%) | 91 (41%) | 116 (52.3%) | 222 (21.3%) |
| Materials burning in the immediate vicinity | 7 (5.3%) | 9 (6.8%) | 43 (32.3%) | 74 (55.6%) | 133 (12.8%) |
| Contiguous structure | 2 (16.7%) | 1 (8.3%) | 3 (25%) | 6 (50%) | 12 (1.2%) |
| With damage but no ignition | 35 (92.1%) | 2 (5.3%) | 1 (2.6%) | 0 (0%) | 38 (3.7%) |
1 Values represent the number of structures and the respective percentage in each class of damage inside each type of ignition (read percentage horizontally); 2 Values represent the number of structures per type of ignition and the percentage in respect to the total of damaged structures (read percentage vertically).
Table 11.
Degree of damage according to the location of the ignition.
| Condition of the Structure after the Fire 1 | |||||
|---|---|---|---|---|---|
| Location of the Ignition | Slightly Damaged | Moderately Damaged | Highly Damaged | Totally Destroyed | Total 2 (1042) |
| Roof | 16 (2.5%) | 36 (5.6%) | 299 (46.4%) | 293 (45.5%) | 644 (61.9%) |
| Window | 14 (8.3%) | 17 (10.1%) | 70 (41.4%) | 68 (40.2%) | 169 (16.2%) |
| Door | 4 (5.3%) | 7 (9.3%) | 36 (48%) | 28 (37.3%) | 75 (7.2%) |
| Open structure | 2 (2.9%) | 6 (8.8%) | 13 (19.1%) | 47 (69.1%) | 68 (6.5%) |
| Wall | 5 (21.7%) | 4 (17.4%) | 0 (0%) | 14 (60.9%) | 23 (2.2%) |
| Vent | 0 (0%) | 1 (5.3%) | 12 (63.2%) | 6 (31.6%) | 19 (1.8%) |
| Other | 3 (60%) | 1 (20%) | 1 (20%) | 0 (0%) | 5 (0.5%) |
| With damage but no ignition | 35 (92.1%) | 2 (5.3%) | 1 (2.6%) | 0 (0%) | 38 (3.7%) |
1 Values represent the number of structures and the respective percentage in each class of damage inside each location of the ignition (read percentage horizontally); 2 Values represent the number of structures per location of the ignition and the percentage in respect to the total of damaged structures (read percentage vertically).
© 2020 by the authors. Licensee MDPI, Basel, Switzerland. This article is an open access article distributed under the terms and conditions of the Creative Commons Attribution (CC BY) license (http://creativecommons.org/licenses/by/4.0/).
Share and Cite
MDPI and ACS Style
Ribeiro, L.M.; Rodrigues, A.; Lucas, D.; Viegas, D.X. The Impact on Structures of the Pedrógão Grande Fire Complex in June 2017 (Portugal). Fire 2020, 3, 57. https://0-doi-org.brum.beds.ac.uk/10.3390/fire3040057
AMA Style
Ribeiro LM, Rodrigues A, Lucas D, Viegas DX. The Impact on Structures of the Pedrógão Grande Fire Complex in June 2017 (Portugal). Fire. 2020; 3(4):57. https://0-doi-org.brum.beds.ac.uk/10.3390/fire3040057
Chicago/Turabian StyleRibeiro, Luís M., André Rodrigues, Davi Lucas, and Domingos Xavier Viegas. 2020. "The Impact on Structures of the Pedrógão Grande Fire Complex in June 2017 (Portugal)" Fire 3, no. 4: 57. https://0-doi-org.brum.beds.ac.uk/10.3390/fire3040057