Fire Activity in Mediterranean Forests (The Algerian Case)


1
INRAE UMR RECOVER, Aix Marseille Univ, 3275 Route Cézanne-CS 4006, CEDEX 05, 13182 Aix-en-Provence, France
2
Laboratoire de Recherche en Ecologie et Environnement, Faculté des Sciences de la Nature et de la Vie, Université de Bejaia, Bejaia 06000, Algeria
3
Université Grenoble Alpes-INRAE, LESSEM, 38000 Grenoble, France
*
Author to whom correspondence should be addressed.
Fire 2020, 3(4), 58; https://0-doi-org.brum.beds.ac.uk/10.3390/fire3040058
Submission received: 17 August 2020
/
Revised: 28 September 2020
/
Accepted: 29 September 2020
/
Published: 30 September 2020
Abstract
:Algeria has high wildfire activity, albeit restricted to the northern coastal fringe. However, no study has investigated why fire is restricted to that area, and what combination of factors explains the occurrence of wildfires. Here, we describe the current fire regime of Northern Algeria from 2000 to 2019 and we correlate fire activity to a range of environmental and anthropic drivers. We found a strong north–south gradient in fire occurrence: it is maximal in the high-fueled (productive) oak forests of Northern Algeria with high annual rainfall amount, whereas it is fuel-limited in the South due to semi-arid conditions. We determined that fire is nearly absent where the bioclimate is subarid or arid, due to the steppic vegetation with summer Normalized Difference Vegetation Index (NDVI) values below 0.35. Therefore, fire occupies a narrow niche in space (the humid and subhumid areas with high productivity) and in time as most fires occur in summer after the high rainfalls from fall to spring that promote fuel growth. Humans also play a role as fire hotspots are concentrated in croplands and in built-up areas with high human density and infrastructures mixed with shrublands and forests. We discuss how the ongoing climate changes and the desertification progressing towards the North of Algeria may finally restrict forests to a narrow fringe providing less and less ecological services to the Algerian people.
1. Introduction
Algeria is the main fire hotspot on the southern rim of the Mediterranean Basin (MB). Fire is widespread in this country due to the presence of flammable fuels such as shrublands and forests [1], a climate favorable to ignition and propagation, and the frequent use or misuse of fire by the rural population or the authorities, notably at the rural–urban interfaces. However, if the scientific literature has produced a considerable amount of knowledge and models dealing with wildfires of the northern rim of the MB [2,3,4], wildfire issues remained largely disregarded in the southern part [5]. Despite recent progress in the investigation of fire causes [6], fire science and policy in Algeria still lack operational models explaining the drivers of fire occurrence [7]. In addition, fire databases are not always managed in a relevant manner [5,6], and fire danger indices are not used to assess the daily fire hazard across the country. All these approaches may support the currently lacking decision-making and the fire suppression capacity, bringing the sustainability and the current forest policy into question [7].
All countries across the Mediterranean Basin share the same bioclimate and biogeographic distribution of vegetation types [8]. They also share a part of the same fire regime, that is to say they have similar fire occurrence, frequency, size, seasonality, or intensity [9]. A set of bottom-up (fuels, human activities, topography) and top-down controls (climate and weather) drives this fire regime. It is characterized by prominent features such as variable fire activity from year to year, concentration of fires during summer (and additionally, from fall to spring), the occurrence of large or very large fires, or the preferential burning of forests, shrublands, and croplands. However, there is a growing contrast in the current fire regime between the two rims. On the northern rim, the fire regime has shifted in the past decades from fuel-limited to drought-driven [10] because rural exodus syndrome and urbanization have promoted subsequent fuel accumulation in the landscapes since the 1950s [11]. This notably favors very large fires. On the southern rim, the predominant rural lifestyle with croplands and pastoralism has limited the amounts of fuel, and the aridity is rapidly growing [12]. As aridity progresses, fuel may decrease and be at risk of fire.
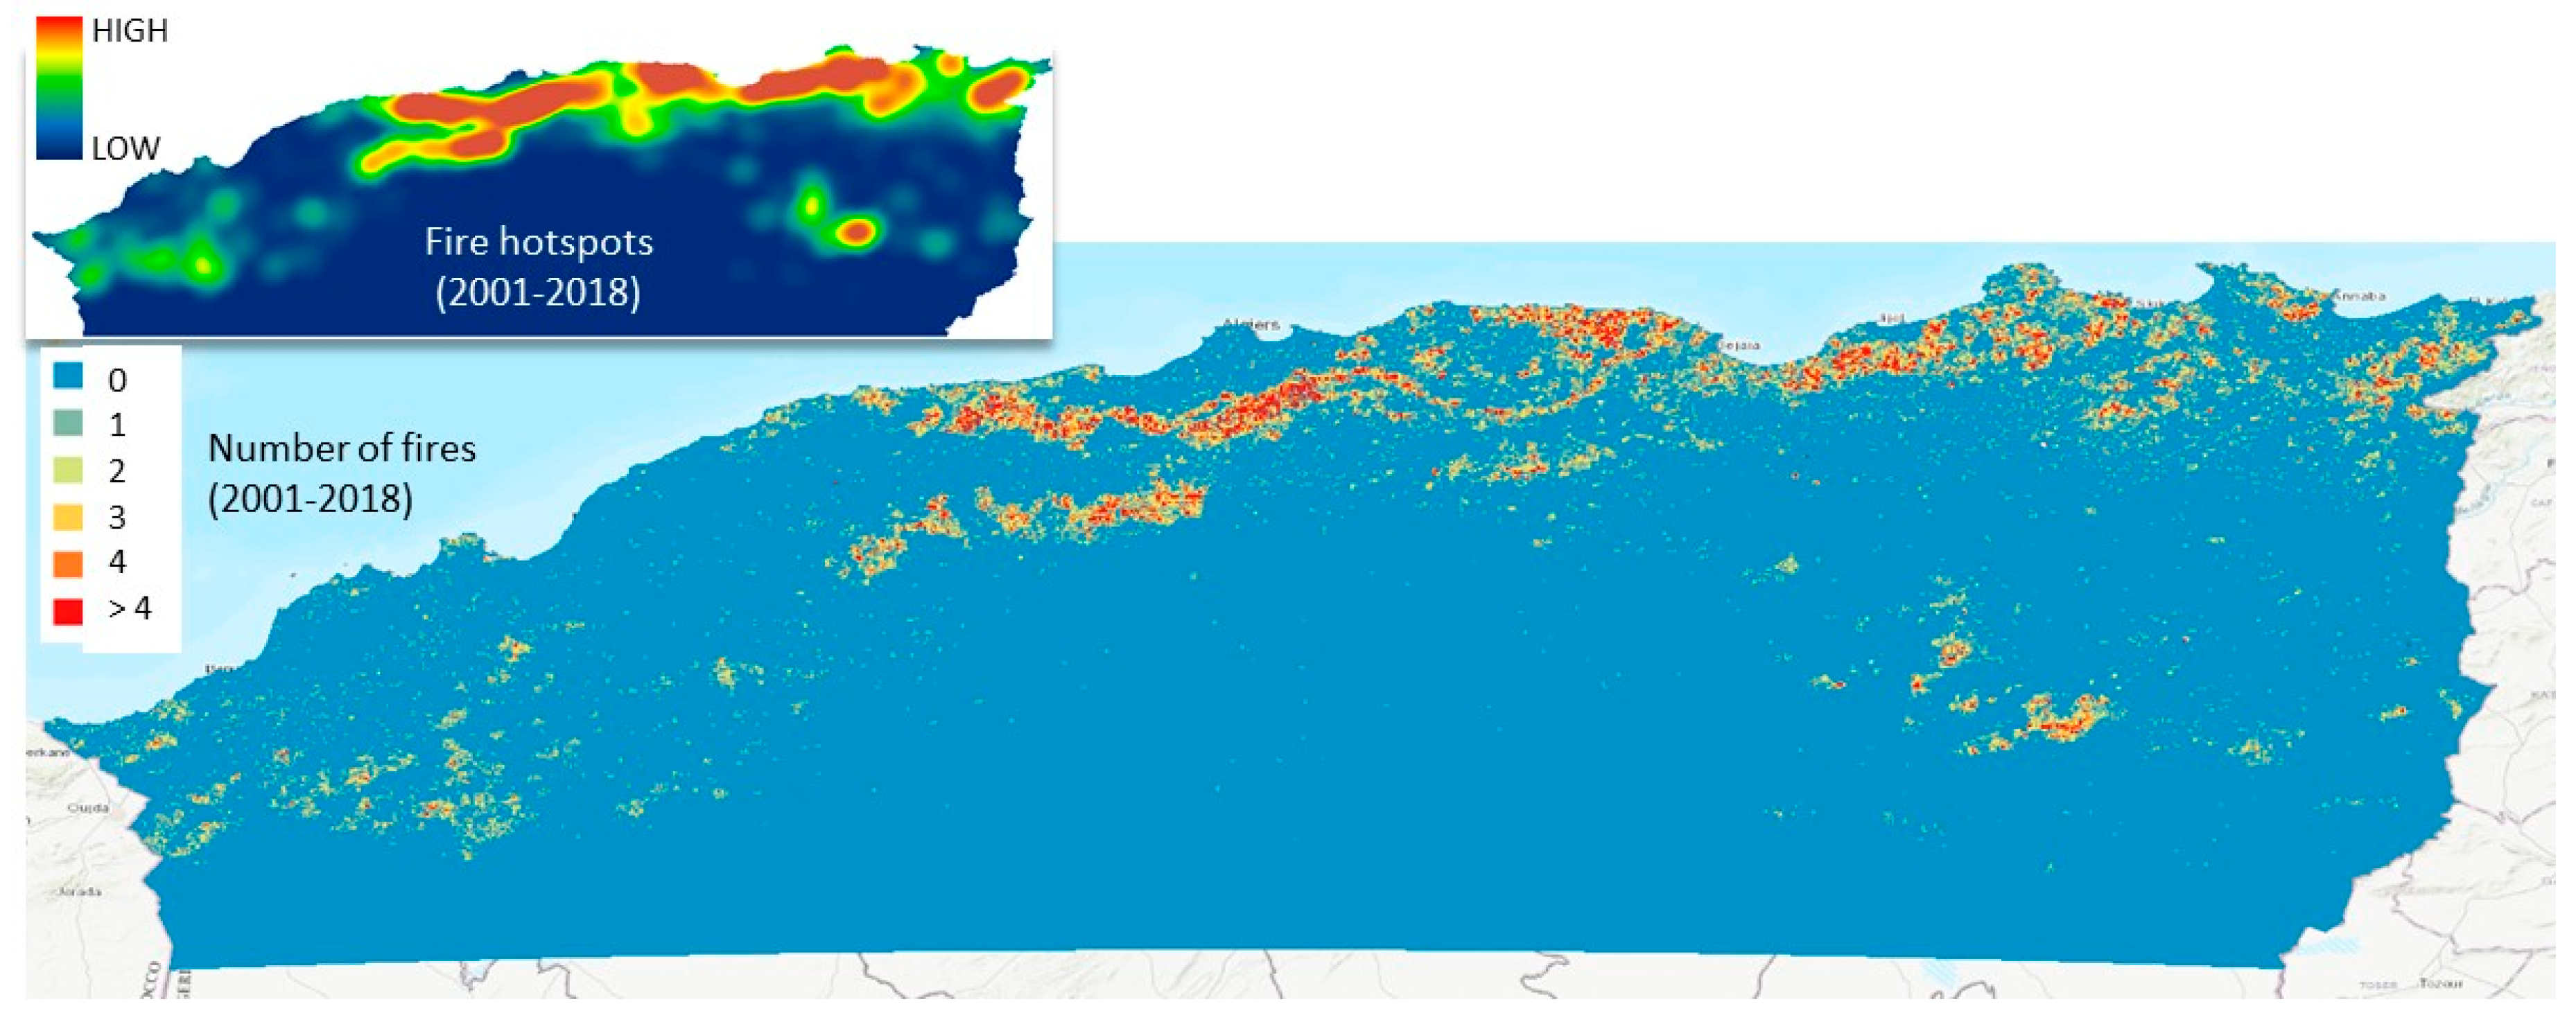
In this context, it is of great interest to investigate the current fire regime and its drivers in Algeria as the ongoing changes in landscapes and climate may create regime shifts in the coming decades [1]. Indeed, the Algerian forests of high productivity and conservation value have suffered during the recent decades of degradation and fragmentation from repeated fires, overgrazing, excessive vegetation clearing, aridification, and urban sprawl [13,14,15,16]. This consumed six times more than the productive capacity of the forest ecosystems [17], thus questioning their sustainability and the current forest policy [15]. A major challenge in Algeria is to manage forest fuels in order to limit fire hazards, while protecting the most biodiverse forests. Most wildfires are concentrated in a narrow strip along the northern coastline (Figure 1) that corresponds to forested mountains under subhumid and humid bioclimates. Therefore, we hypothesize that (i) the humid bioclimate enhances the fuel biomass and, in turn, fire activity; and that (ii) fire is fuel-limited in southern areas under sub-arid and arid bioclimates.
Based on this, we hypothesize that wildfires put high pressure on the northern Algerian forests. Climate and human density promote fire occurrence in Northern Algeria, probably mediated by fuels that vary strongly varies across latitude. In this study, we try to disentangle the roles of fuels, climate, and humans on fire occurrence along the latitudinal gradient from the sub-arid southern fringe to the humid northern coastline. Our final objective is to propose alternatives for managing forests for multiple purposes in the long-term. We hypothesized that fuels play a major role to enhance or limit fire activity, along the predominant north–south bioclimatic gradient from humid to arid regions. Bioclimate may constrain fuel productivity and, in turn, fire occurrence. Notably, we tested if there is alternation of wet and cold winter period promoting surface fuels, and a dry and hot summer period promoting ignitions and fire enlargement, and how it changes the fire regime. To test for these hypotheses, we correlated the fire frequency and the burnt areas to the main drivers of fire (i.e., fuel, weather and ignitions) with fuel types, indices of fire danger, and socioeconomic factors in Northern Algeria from 2001 to 2019. For that purpose, we used MODIS (Moderate-Resolution Imagery Spectrometer) fire hotspots and burned areas (MCD64A1v006). Remote-sensing products are increasingly abundant and accurate, and this provides valuable spatial–temporal information [18,19,20] on the fire regimes across Northern Africa, in a context where field-based fire data is often biased [5,6].
2. Materials and Methods
2.1. Study Area
The present study covers ca. 250,600 km−2 in Northern Algeria (latitude 34° N to 37° N, longitude −2° E to 9° E). This area displays environmental and socioeconomic features common to the other countries of the Maghreb (i.e., Morocco and Tunisia). This notably includes a hot and dry climate, forest fuels and their associated shrublands, a rural lifestyle persisting in hinterland, and big cities with a high density of inhabitants. Northern Algeria spans in latitude from Mediterranean-type ecosystems (MTEs) to sub-arid and arid ecosystems in only ca. 200 km. This study area is of interest because it contains all the fires registered in Algeria, and it spans in latitude from the Mediterranean humid coast to the arid (Saharan) area where fire is totally absent, and in longitude from the Moroccan border (in the west) to the Tunisian border (in the east). The mountainous part of the northern coastline (Figure 1 and Figure S1) has a humid and subhumid climate and it consists mostly of forests, infrastructures, and inhabitants. Fires lead to the fragmentation or disappearance of forest habitats, with an annual decrease rate of 0.5% of the Algerian forest area being recorded from 1990 to 2010 [18]. The central area is subarid, and the southernmost arid area displays intense degradation of vegetation (steppes), and desertification [13] and it is very unsuitable for wildfire.
Northern Algeria has environmental and anthropogenic features acknowledged as conducive to high fire activity around the MB [1,10] with high values for coverage by forests, woodlands and shrublands, agropastoralism, fire weather danger, human assets, and human pressure on ignitions near urban and densely populated areas. However, the fire suppression capacity is generally limited as in Morocco and Tunisia [6], and many areas suffer repeated fires and large fires (>500 ha).
This region has also high biodiversity and a very high conservation value. It regroups many protected areas and the richest forest heritage in Algeria with 122,500 ha of forests of cork oak (Quercus suber L.), zen oak (Quercus canariensis), green oak (Quercus ilex), Aleppo pine (Pinus halepensis), and cedar (Cedrus atlantica). This is also a hotspot for animal biodiversity harboring several biosphere reserves [16]. Most of the forests and biodiversity providing ecosystem goods and services to the population are located in the Northern Algerian rim, while Southern Algeria suffers growing aridification, desertification and soil degradation [13].
2.2. Fire Data: MODIS Fire Hotspots and Burned Areas
Algeria has long but incomplete records of fire history since the colonial period [5]: The Forest Directorate fire database (DGF) has recorded fires for decades but they are not always registered or located in a relevant and consistent manner. In particular, the fire contours are often missing or irrelevant in this database. In Tunisia, such ground-based databases have proved to be can be misleading for characterizing the fire regime and its temporal trend [5]. Therefore, we used two MODIS fire products at 1-km and 500-m spatial resolution for the 2000–2019 period (Table S1). First, we used the GlobFire dataset [18] based on the fire hotspots MCD14ML series processed in the Collection 5 temporal thermal analysis active fire dataset with data from both the TERRA and AQUA satellite (NASA- Fire Information for Resource Management System (FIRMS), 2015). We downloaded this daily set ranging from 2000 to 2019 using the FIRMS website (Fire Information for Resource Management System: Archiving and Distributing MODIS Active Fire Data, Collection 5). The MODIS MCD64A1v006 fire hotspots provided point-data on the active fires burning while the satellites pass. In total, we recorded 3091 points from 2000 to 2019. Each fire point has its own metadata including time, day, month, and year. We superimposed each fire hotspot onto land cover maps, especially in the south of the study area. This allowed detection of the fire artifacts where there is no fuel, notably dozens of false wildfires due to oil wells and flares in petrochemical plants. Keeping only accurate fire data is crucial to determining the shape of the north–south gradient of fire occurrence, and locating the southernmost fire pixels (i.e., the southern limitation to fire occurrence). Second, we used the burned area product, i.e., the MODIS MCD64A1 Version 6 Terra and Aqua Global 500 m grid monthly product containing the burnt area and quality per pixel information. We downloaded these data from the NASA website (earthdata.nasa.gov). The fire database provided the fire radiative power (FRP) that measures the energy emitted through radiative processes released during the combustion. FRP can be associated with fire intensity all throughout the fire burning process [19]. Here, we compared FRP across months. The maps of fire occurrence and of burned areas clearly display uneven distribution of fire in Northern Algeria (Figure 1). Fire concentrates within a ca. 100-km strip along the northern coastline, suggesting that fire decreases from north to south. In order to assess the Algerian fire hotspots concentrating the bulk of number of fires and burnt area (i.e., the maximal fire hazard), we computed the kernel density estimation under the R (sKDE function) (Figure 1). We also used non-parametric methods (the Mann–Kendall and the Sen’s slope estimator) to determine whether there was a positive or negative trend in fire occurrence, based on the annual number of fires. This approach has proved efficient in many fire studies [20].
2.3. Vegetation Fuels and Land Uses
We recovered land use and land cover types from the General Directorate for Forests of Algeria, and from the ESA (European Space Agency) land cover types (https://www.esa-landcover-cci.org/). This latter data came from high-resolution Landsat TM satellite images (30 m) of 2016 submitted to a supervised classification. These sources allowed us to obtain the land covers types existing in Algeria (forests, woodlands, croplands, pastures, urban, aso). Northern Algeria displays high bioclimatic gradients, and this may affect the fuel biomass present in each cover type, and subsequently their likelihood to burn, or to produce large fires. In order to assess the fuel biomass across all land covers and locations, we used the Normalized Difference Vegetation Index (NDVI) from 2001 to 2016, with 1-km spatial resolution. We derived these data from observations recorded by the MODIS TERRA sensor (MOD13). MODIS monthly NDVI data is generated using the 16-day vegetation index aggregated using a weighted average to produce a monthly composite. NDVI was based on the premise that vegetation is highly reflective in the near infrared and absorptive in the visible red. The NDVI has been widely used for estimating the fraction of the photosynthetically active radiation (FPAR) absorbed by the canopy, and it fits well for estimating forest productivity and dieback in Mediterranean ecosystems [21]. As the there is little preventive management of forest fuels and harvesting in Algeria [15], the NDVI reflected well the aridity of the four bioclimates. We also used a global tree-cover percentage map using MODIS data [22] in order to estimate the coverage by forests fuels. Due to the strong north–south bioclimatic gradient of fire activity and land cover types across Northern Algeria, we estimated the NDVI value corresponding to this latitudinal limit for each land cover type. Fire also follows a longitudinal gradient, but this is very low in comparison to that of latitude.
2.4. Bioclimatic Data and Estimation of Fire Weather Danger
To this date, the weather and fire services of Algeria do not use fire danger indices such as FWI in order to predict the daily probability of ignition or the behavior of fire [23]. This is notably due to the rarity of weather stations. We computed the daily FWI and its sub-indices (drought code, DC; duff moisture code, DMC; fine fuel moisture code, FFMC; built-up index, BUI; initial spread index, ISI) throughout the study from 2000 to 2019. For that purpose, we used monthly cumulative datasets for rainfall and temperature, derived from high resolution CHELSA Climate Data (Climatologies at high resolution for the earth’s land surface areas) from January 2001 to December 2015 at 30-arc sec (~1 km) spatial resolution, and from the NASA Power Data (power.larc.nasa.gov) for air humidity and wind speed. We computed the FWI and the five associated sub-indices, in order to correlate them with fire occurrences. We finally chose the FWI as the fire rating index because it performed better that the fine fuel moisture code (FFMC) and the drought index (DC) in the modelling part (data not shown). We suggest that because the FWI is more integrative (i.e., it combines all the five sub-indices). In our study, the FWI fitted better than the FFMC which reflects the dryness and flammability of fine fuels (needles, grass), or than the DC which reflects long-term variations in duff fuels [23].
2.5. Topographic Features
Northern coastal Algeria is a mix of remote terrains and plains. It comprises the Tellian Mountains (maximal elevation 1500 m) which are almost parallel to the coast. Steep slopes and ridges are numerous, with agropastoral plains. The hinterland is made of high plains or mid-elevation mountains. At lower latitudes and in the western part, the topography becomes flatter and more monotonous with plains and salt marshes. The topography may affect fire activity through the land cover types, the solar radiation, and the subsequent fuel dryness, and the slope may affect fire propagation. We downloaded a digital elevation model ASTER GDEM V2 imagery (30 m) from the NASA Earth data site. From these data, we calculated elevation, slope, and aspect on a 500 × 500 m grid.
2.6. Fire Causes and Controls
About 80% of the fire causes are still unknown in Algeria, because there is no systematic inquiry on fire ignitions [6]. However, based on the well-known causes (i.e., those investigated), almost all ignitions are caused by humans [6,15]. Indeed, studies on fire causes around the MB show that human-caused ignitions account for up to 90% of all ignitions [24]. The World Lightning Strikes Map (geology.com) shows that lightning strikes are rare in Northern Algeria.
Humans play a major role in fire activity of the MB since they manage the land covers in the landscape, they burn them selectively, because they generate unwanted, accidental or intentional ignitions at the vicinity of their activities (e.g., roads, houses, power lines, aso), and because they also suppress fires [7,25]. In Algeria as in most of the MB, ignitions are frequent in wildland and near wildland–urban interfaces. For example, [15] have shown that the most fire-prone areas covered with forests and shrublands are due to deliberate ignitions in order to clear vegetation to urbanize. Politically motivated fires are frequent in forest massifs [7,15]. In agricultural lands and groves, people ignite most fires on purpose for clearing the vegetation and burning the residues of agriculture. Pastoral fires are also frequent: shepherds burn the pastures or the shrublands in order to favor the regrowth of grasses. Charcoal production from fires is also frequent. Beside these rural fires, many ignitions occur near infrastructures such as houses, roads, power lines or garbage dumps as in most of the MB [25,26,27]. Consequently, the density of habitations, infrastructures, railways and many other built-up features is a good surrogate for the human pressure on ignitions. We obtained the road network and the presence of habitations from Sentinel-2 images with a resolution of 10 m (https://sentinel.esa.int/). We also used the global human footprint index (HFI), which represents the relative influence of Humans worldwide (Version 2, 2005 LWP-2 Wildlife Conservation Society and Columbia University Center for International Earth Science Information Network). This index is a global dataset of 1-km grid cells, created from nine global data layers covering human population pressure (population density), human land use and infrastructure (built-up areas, nighttime lights, land use/land cover), and human access (coastlines, roads, railroads, navigable rivers). The wildest areas had values close to zero while the areas with high human pressure had values close to one. Each 500-m gridpoint was assigned a value of human footprint index, and more specifically, a value of built-up density (i.e., density of built-up features like houses, roads, or railways).
2.7. Preparation of the Datasets
Our objective was to model fire occurrence based on the MODIS fire hotspots and the burned areas as target variables, and the initial set of 12 environmental and socioeconomic variables presented above as explanative variables. For this purpose, the fire hotspots were georeferenced using ArcMap 10.6 on a regular cell grid (raster) with a spatial resolution of 500-m using the ArcGis fishnet tool. The whole study area thus included a matrix of 244,804 cells. The number of cells with fire was 24,299 (ca. 10% of the total number), and the number of non-fire cells was 220,505 (ca. 90%). We applied the 244,804 pixels grid to all the other data layers in order to capture the predominant value (e.g., the percentage of each land cover type) or the mean value (e.g., mean elevation). From 2001 to 2019, we registered 32,204 fires in Northern Algeria. Using the fire pixels collected from MODIS, we created automatically polygons with ArcMap 10.6. For that purpose, we regrouped the contiguous pixels burnt which had the same date and time within a same fire perimeter using the ‘merge’ spatial function of ArcMap.
2.8. Modelling Fire Hazard
In a first step, we calculated the main features of fire regime based on the MODIS hotspots and burned areas. These fire features were the number of fires from 2001 to 2019, the seasonal and interannual distribution of fire number, and the distribution of burned areas in different fire size classes (<1 ha, 1–10 ha, 10–50 ha, 50–100 ha, and >100 ha). We also computed the incidence of fires in Northern Algeria as the total area burned in reference to the total area of flammable land covers.
In a second step, we modelled fire occurrence based on the MODIS fire hotspots and the burned areas as target variables, and a first complete set of 12 environmental and socioeconomic explanative variables related to the three main controls of fire: fuel, weather, and ignitions. The variables (above-mentioned) were the land cover type, the normalized difference vegetation index, the summer rainfall, the mean annual rainfall, the fire weather index, the fine fuel moisture code, the drought code, the initial spread index, the buildup index, the elevation, the slope, and the aspect. As the 6 fire danger indices were redundant, we kept the FWI as the only fire danger index, and the most explanative.
We first conducted principal component analysis (PCA) in order to test for correlation among variables. Then, we modelled the presence/absence of fire using a boosted regression tree analysis (BRT). BRTs are efficient machine-learning techniques [28] well suited for assessing how environmental or anthropogenic factors drive the different sizes of fires. They can enhance prediction in comparison to classical statistical methods such as logistic regression (Rodrigues and de la Riva, 2014). BRTs model fire occurrence based on using binary data (presence/absence). BRTs explore environmental data without the restrictive assumptions of parametric statistics such as in [28,29], optimize the predictive performance [30], are flexible and easy to interpret, and account for collinearity [30]. In this study, we computed the BRT models using the ‘gbm’ R package [31] with a Bernoulli logistic error structure. Half of the data were used for building the model (i.e., training dataset), and half to evaluate the accuracy of the classification (i.e., validation dataset). Using the recommendation of [31]: the number of trees in each BRT was set automatically to 20-fold cross-validation. We selected a bag fraction (training data randomly selected for computing each tree) of 0.5, a shrinkage or learning rate of 0.005 which controls the learning speed of the algorithm, and a tree complexity (or tree size) of 5. This generated a minimum of 3000 trees. We evaluated the quality of the models and their predictive performance using the area under the receiving operator curve (AUC [32,33,34]). The predictive performance was considered moderately good for an AUC ranging from 0.6 to 0.9, and excellent for an AUC > 0.9.
We also performed with R an additional test using the MODIS burned areas to determine if fires selectively burned certain land cover types more or less than expected according to their total coverage in the study area. For this purpose, we first tested the null hypothesis that states that fire does not differ according to land cover, by randomly repositioning the MODIS fire points actually observed in each land cover type (10,000 Monte Carlo tests). Then, we compared the distribution of number of fires to that of randomly placed fires. For each land cover type, we compared the real distribution to the random distribution. p-values thus indicated how the real distribution differs from randomness. Finally, we performed a BRT analysis using the same 12 environmental and socioeconomic variables in order to determine the drivers of fire. As the north-to-south bioclimatic gradient is preponderant in Northern Algeria, we examined fire activity together with fire danger, fuels, NDVI, and the density of human assets along this gradient, in order to determine the latitudinal threshold for the presence of fire.
3. Results
3.1. Main Characteristics of Fire Regime in Northern Algeria
The four bioclimatic areas of Northern Algeria had different features of fire regime, land cover, climate, and human activities (Table 1). Fire activity clearly decreases from the humid to the arid bioclimate in parallel to NDVI and precipitation, whereas the fire danger and the temperature increased over the same time.
During the 2001–2019 period, Northern Algeria experienced 32,204 fires, which burned 16,954 km−2, that is to say 6.8% of the total study area and a mean annual area burnt of 0.38%. Fire occurred only in 10% of grid cells across the study area. The fire hotspots (ca. 10% of the study area; Figure 1) regrouped 75% of the fires and of the area burnt and had high fire radiative power (FRP; Figure S2). Most hotspots were located along the northern Mediterranean coastline, in a narrow strip of ca. 100 km (between 36.3° N and 37° N; Figure 1). This corresponds to the two mountain ranges of the Tellian Atlas (humid bioclimate), covered with forest massifs and their associated shrublands.
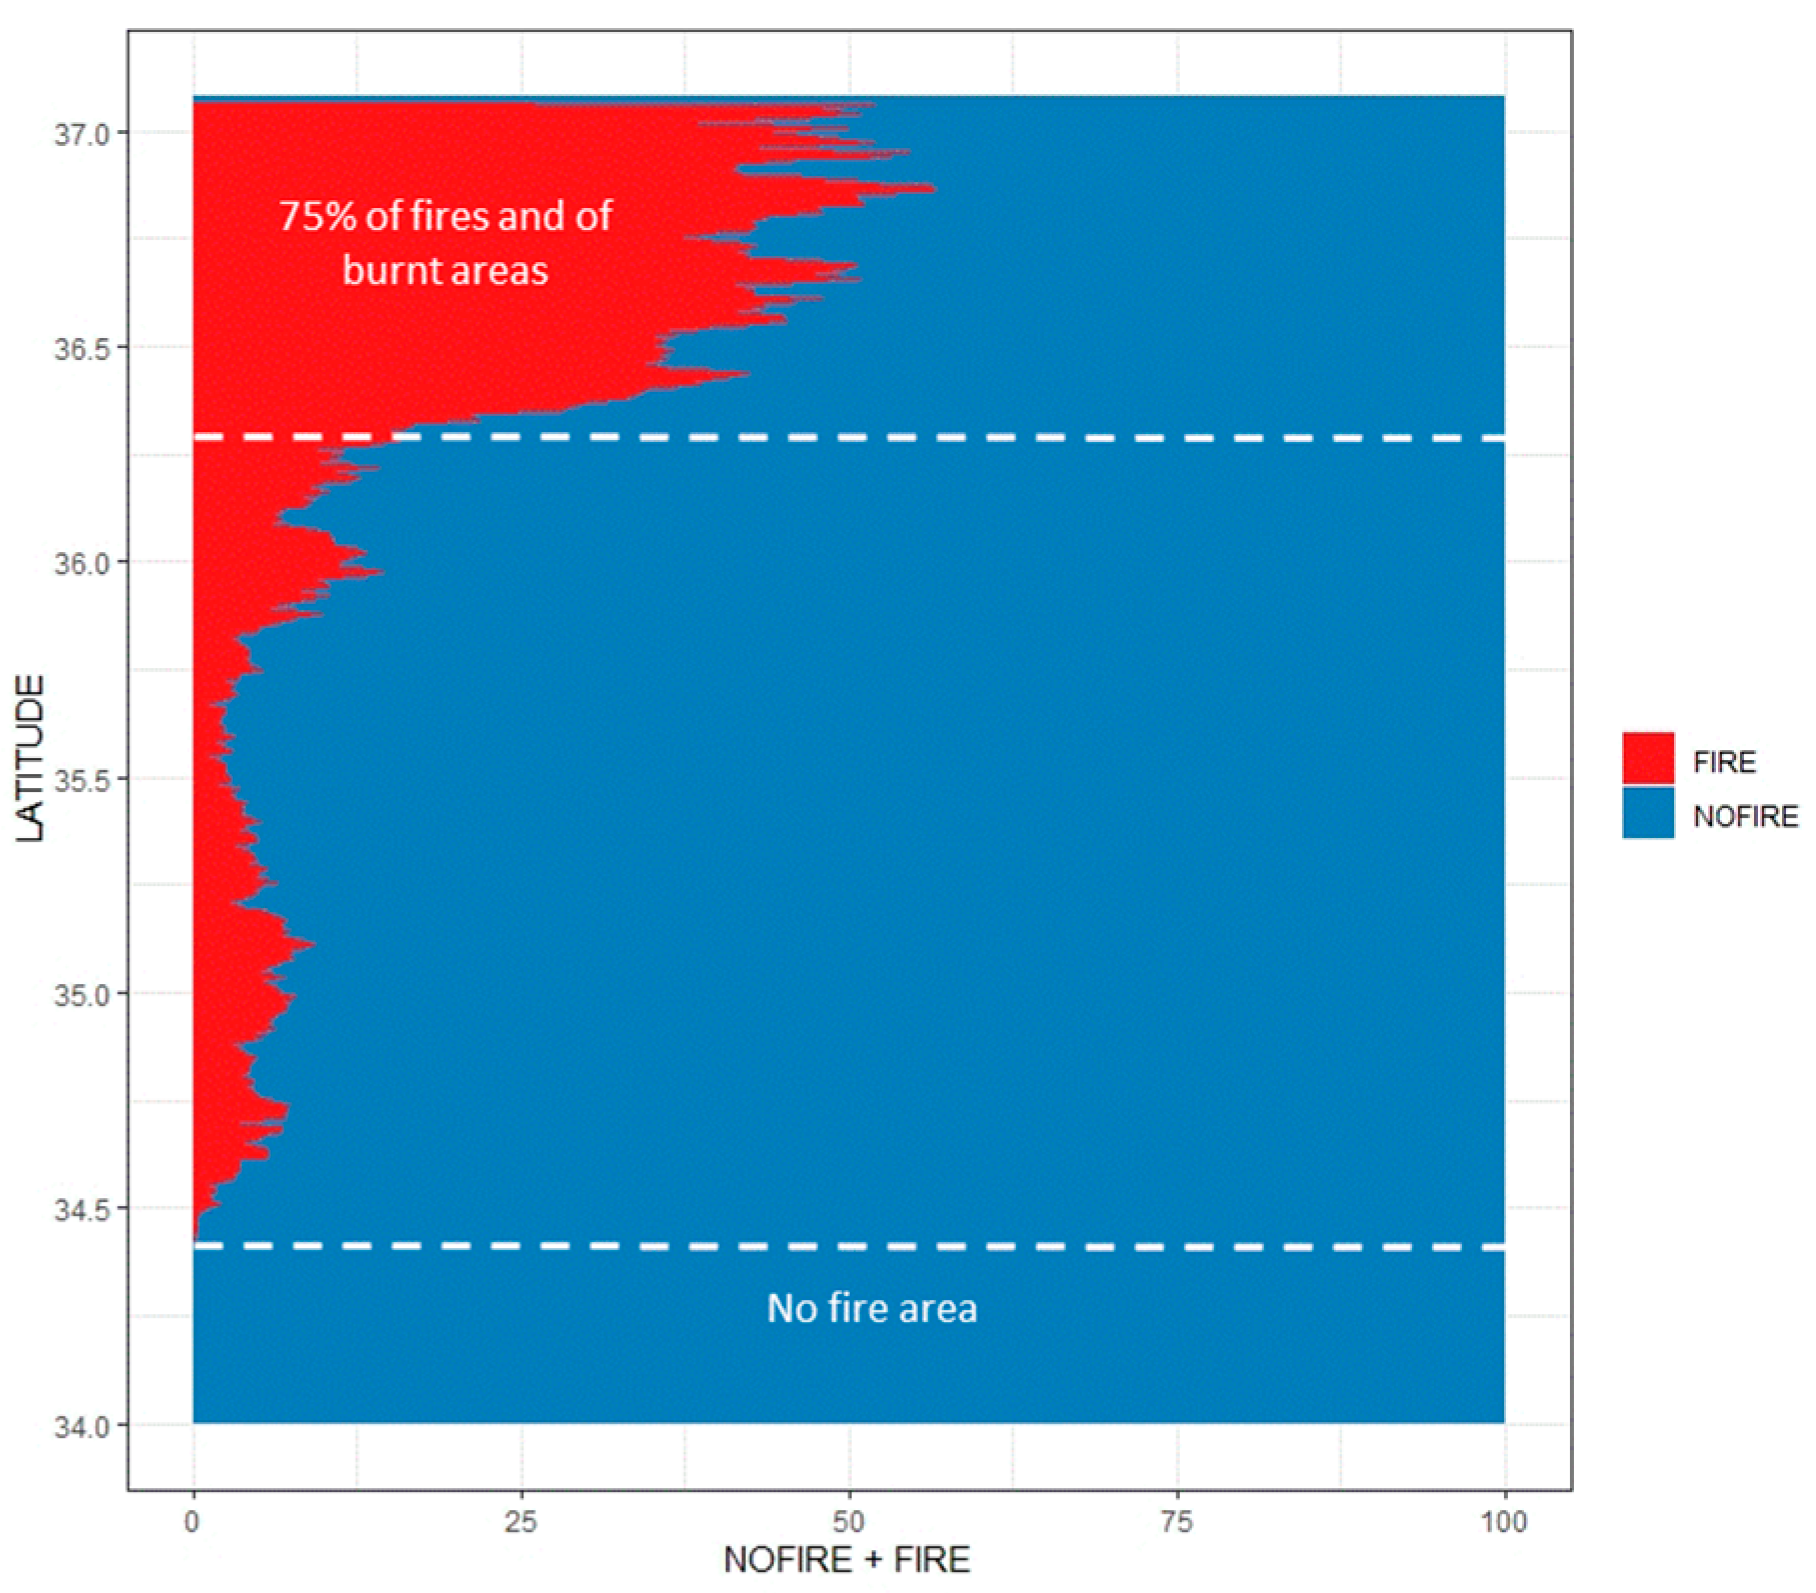
Fire hotspots and fire activity rapidly decreased from north to south, and to a much lesser degree from east to west. The southernmost fire on record was located at ca. 34.5° N, at ca. 300 km from the northern coastline (Figure 2 and Figure S2). Many southern fire hotspots are ignited by military forces in shrublands and low-stature forests [15].
Fire activity and the total area burned annually varied strongly across the years but we detected no temporal trend using a Mann–Kendall tests and Sen’s slope on the burned area as in [35]. Fire activity was almost restricted to summer and early fall, with more than 70% of fire hotspots and of the total area burned concentrated from July to October (Figure S3). Fire size distribution is highly asymmetric with many small fires and few large fires. The median annual fire size is 21 ha ± 140 ha, and the largest fire on record is of 7229 ha. The 10% largest fires (i.e., 3204 fires larger than 102 ha) burned 58% of the total area from 2001 to 2019.
3.2. The Latitudinal Gradient: Bioclimate-Fuel-Fire Relationships
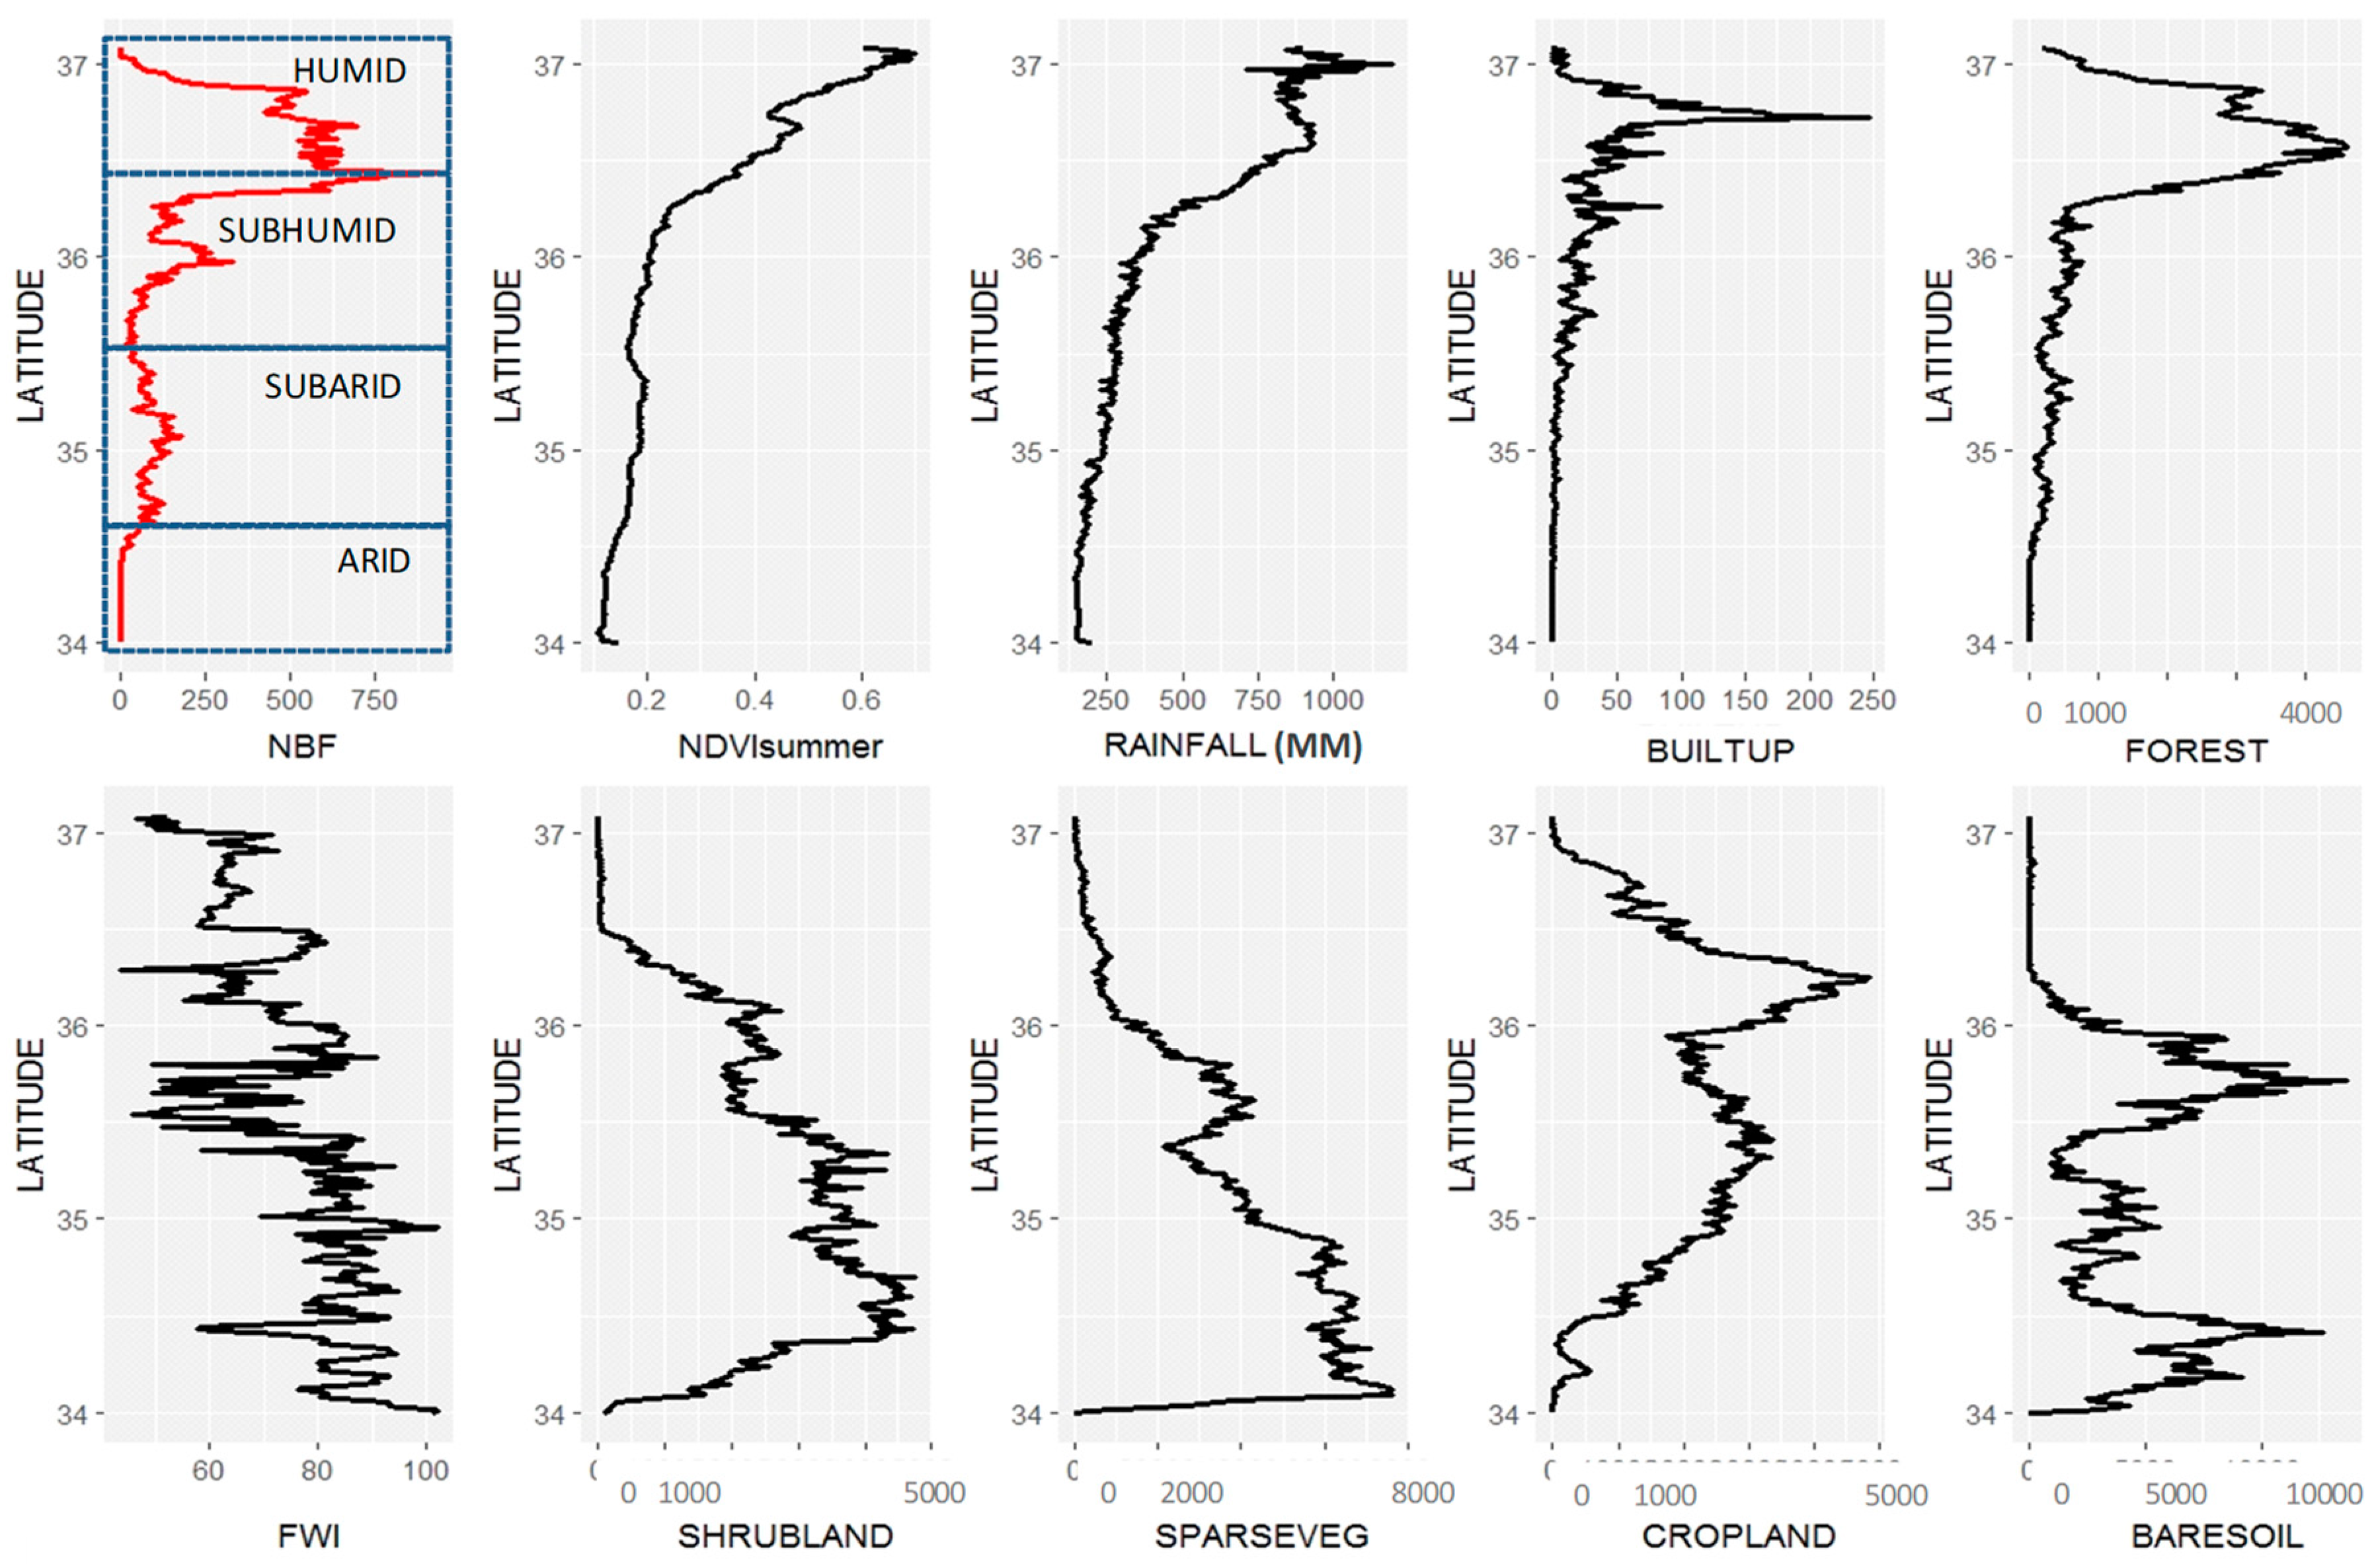
Figure 3 shows that the main drivers of fire occurrence follow a predominant latitudinal gradient. Fire peaked in the north of the study area (ca 37° N to 36.5° N) then decreased almost continuously towards the south (36.5° N to 34° N). Fire is very rare in the south (<34.5° N), which is covered with sparse vegetation and degraded forests with low stature and low fuel biomass (NDVI < 0.15). The NDVI, the mean annual rainfall, the built-up index and the coverage by forests followed the same north–south gradient (Figure 3, upper panel), whereas an inverse gradient was roughly observed for the FWI and the coverages by shrublands, sparse vegetation, croplands, and bare soil (Figure 3, lower panel). The fire danger based on the FWI (but also the sub-indices, data not shown) is minimal in the north under sub-humid bioclimate, and it increases toward the south and the southwest under sub-arid and arid bioclimates.
There is clear fire selectivity for some land cover (i.e., fuel) types in Northern Algeria (Figure 4). The Monte Carlo tests showed that the shrublands and the forests burned more frequently than expected according to their surface in the study area, with a probability higher than 0.01 and 0.04, respectively. Conversely, the croplands, the bare soils and the sparse vegetation (steppic) burned less than expected. The northern forests are at maximal risk: they cover only ca. 12% of the study area but they account for 54% of all fire occurrences. Forests have high fire frequency with up to 17 fire ignitions in the same 3 × 3 km pixel during the 18 years under study (Figure 1), thus corresponding to a fire incidence of ca. 4 fires per yr.km−2. These forests are dominated by oaks (predominantly cork oak, Quercus suber L. and green oak, Quercus ilex), and by Aleppo pine (Pinus halepensis Mill.). The croplands had moderate fire activity with a maximum of 10–12 fires during the period studied. In the sparse (steppic) vegetation and on bare soils of southern arid area, fire activity was very low with only 4 % of all fires and a maximum of three to nine fires from 2001 to 2019.
We found high linkage between bioclimate, fuels types, fuel productivity, and fire occurrence in Northern Algeria. Figure 3 shows that the fire pixels that burned from 2000 to 2019 are located throughout the gradient of longitude and of NDVI. The bulk of the “no-fire pixels” are concentrated at low NDVI values (<0.25) whatever the longitude and latitude, even if some pixels have higher values. The NDVIsummer was much higher for fire pixels (median NDVI = 0.45) than for no-fire pixels (median NDVI = 0.2) (Figure 4). Fire activity thus followed a clear decreasing latitudinal gradient parallel to the NDVI gradient, from forests to shrublands, agropastoral lands, and sparse vegetation (Figure 4).
Figure 5 jointly displays the density distribution of NDVIsummer and of FWI (i.e., the fire danger index) for fire and no-fire pixels. It clearly shows that fire pixels span over a moderate-to-high range of both summer NDVI and of FWI, whereas no-fire pixels are concentrated at high FWI values but are restricted to very low summer NDVI values.
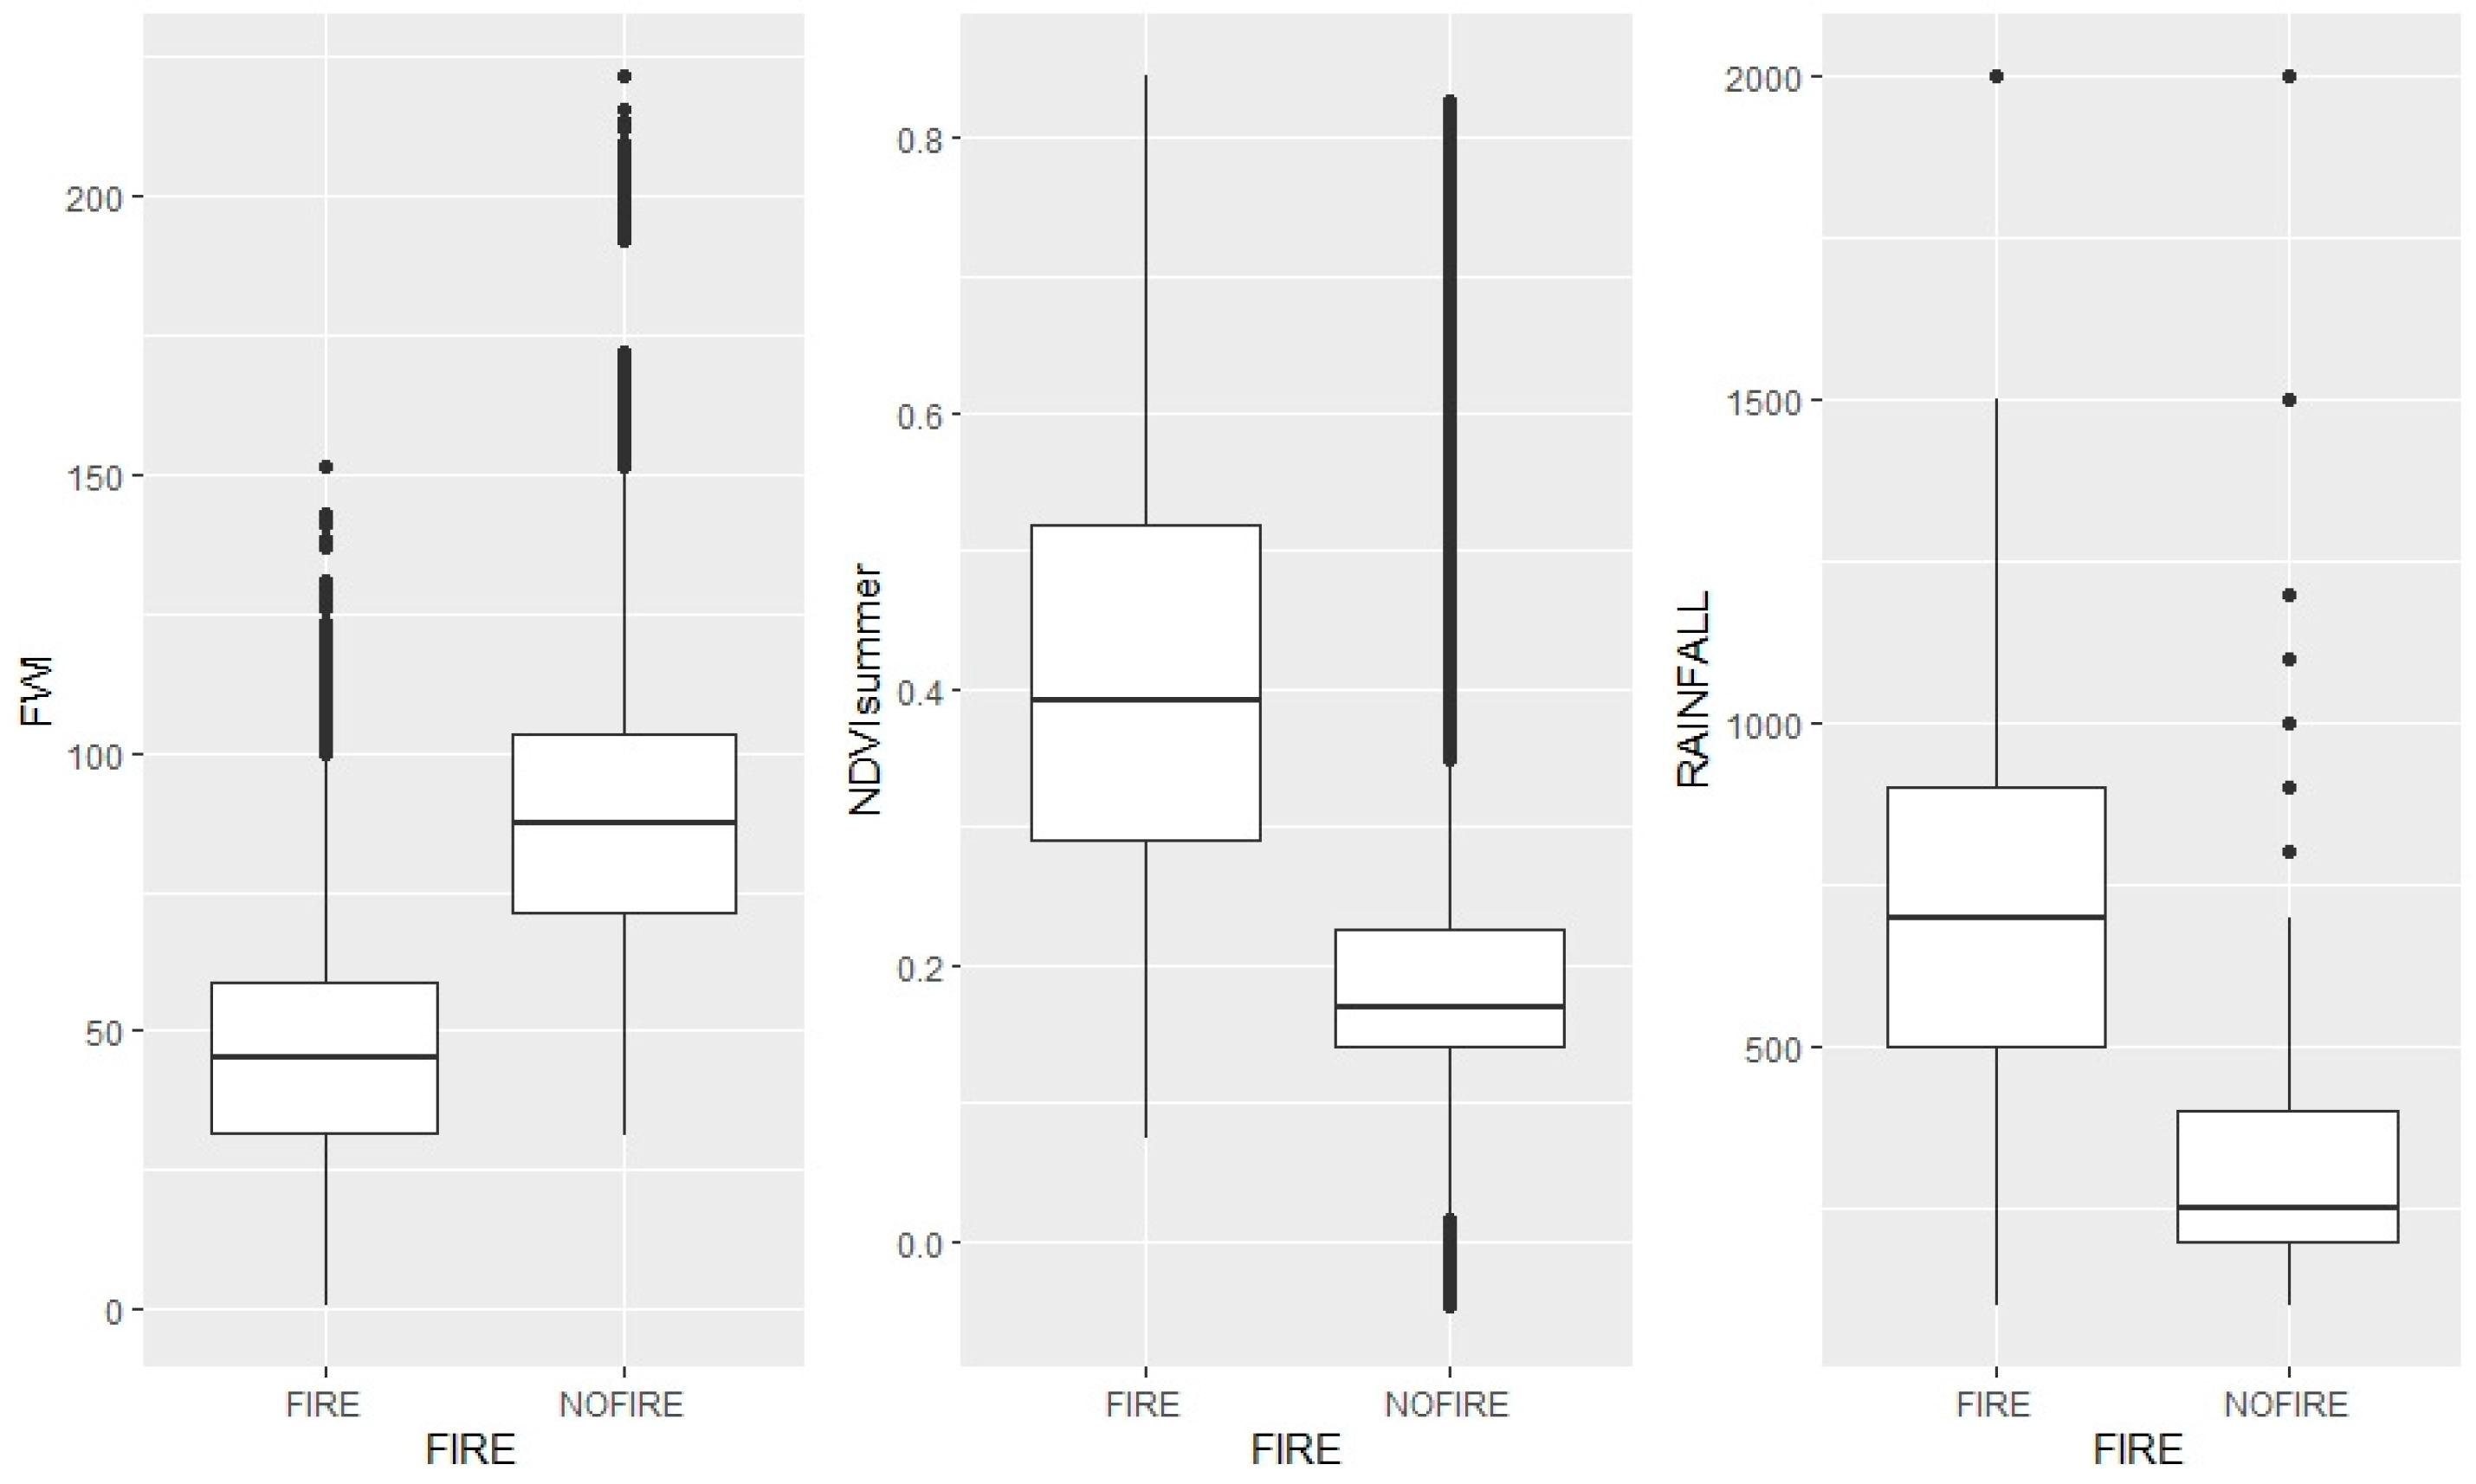
The boxplots (Figure 6) indicate that NDVIsummer and the total annual rainfall are much higher for no-fire pixels, whereas the FWI is much lower.
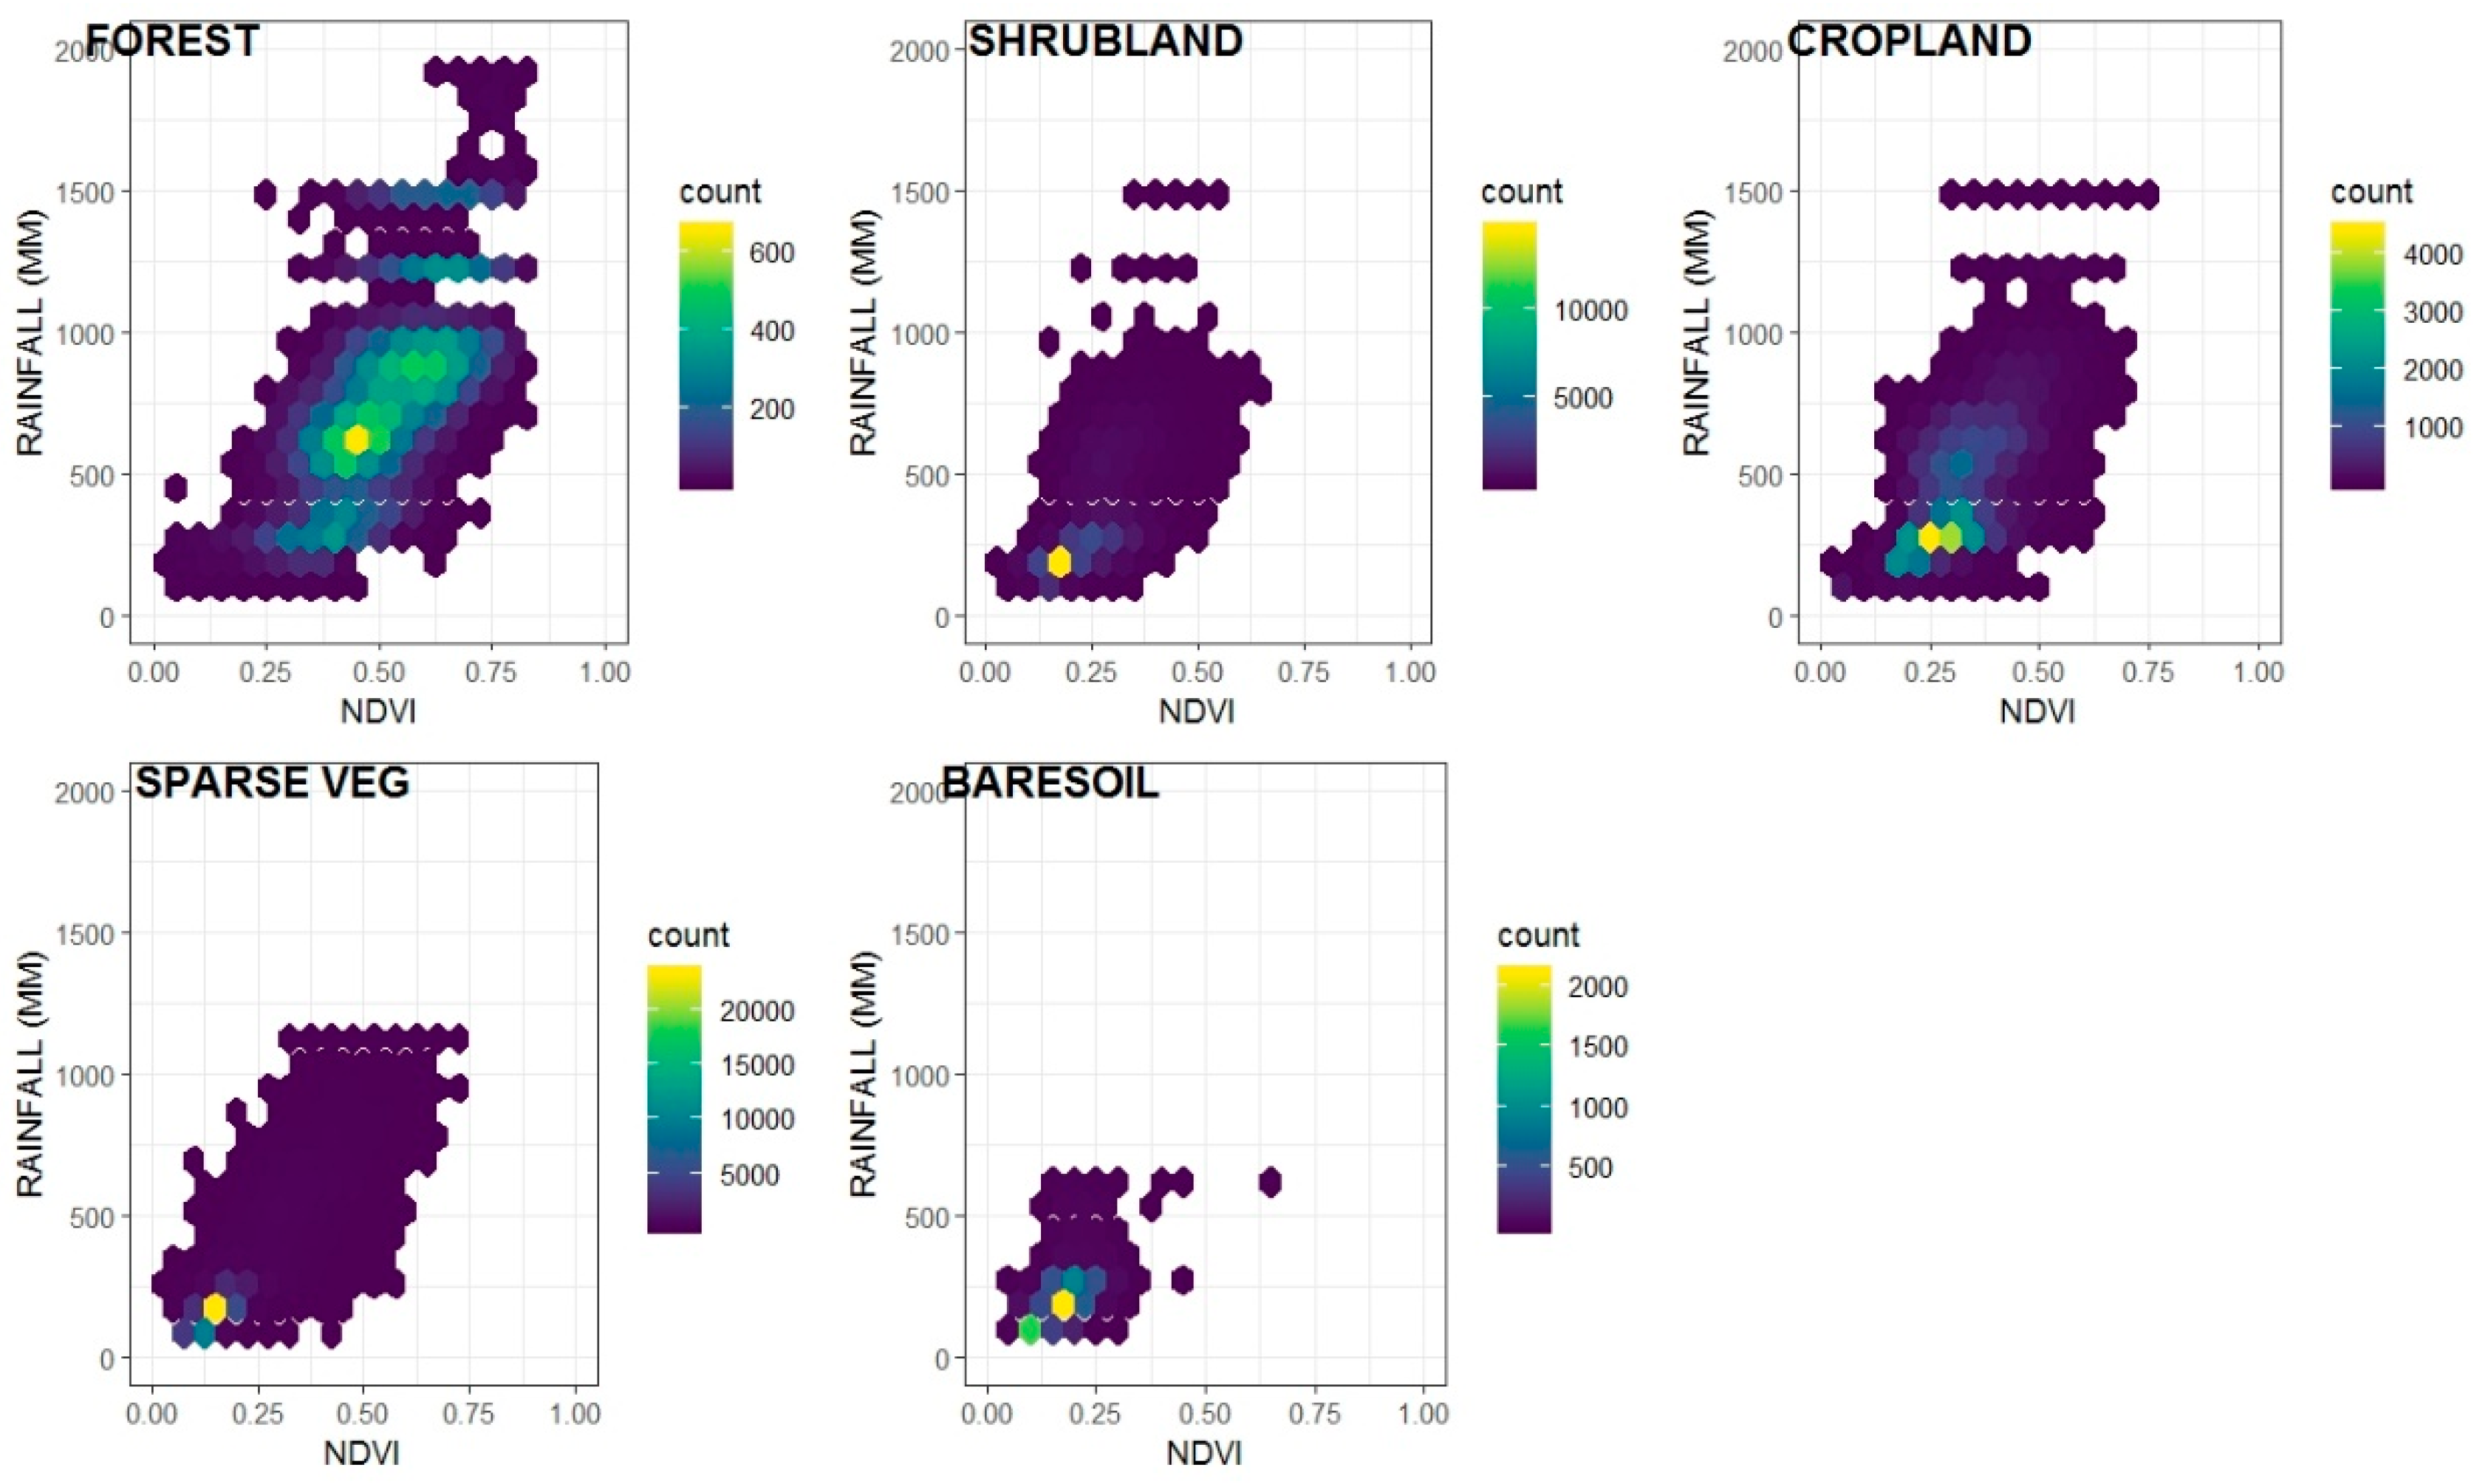
Figure 7 shows the frequency distribution of fuel biomass (NDVI) and annual rainfall amount across the main fuel types. Only the forests show high NDVI together with high rainfall. All the other fuel types are more frequent when both NDVI and rainfall are low.
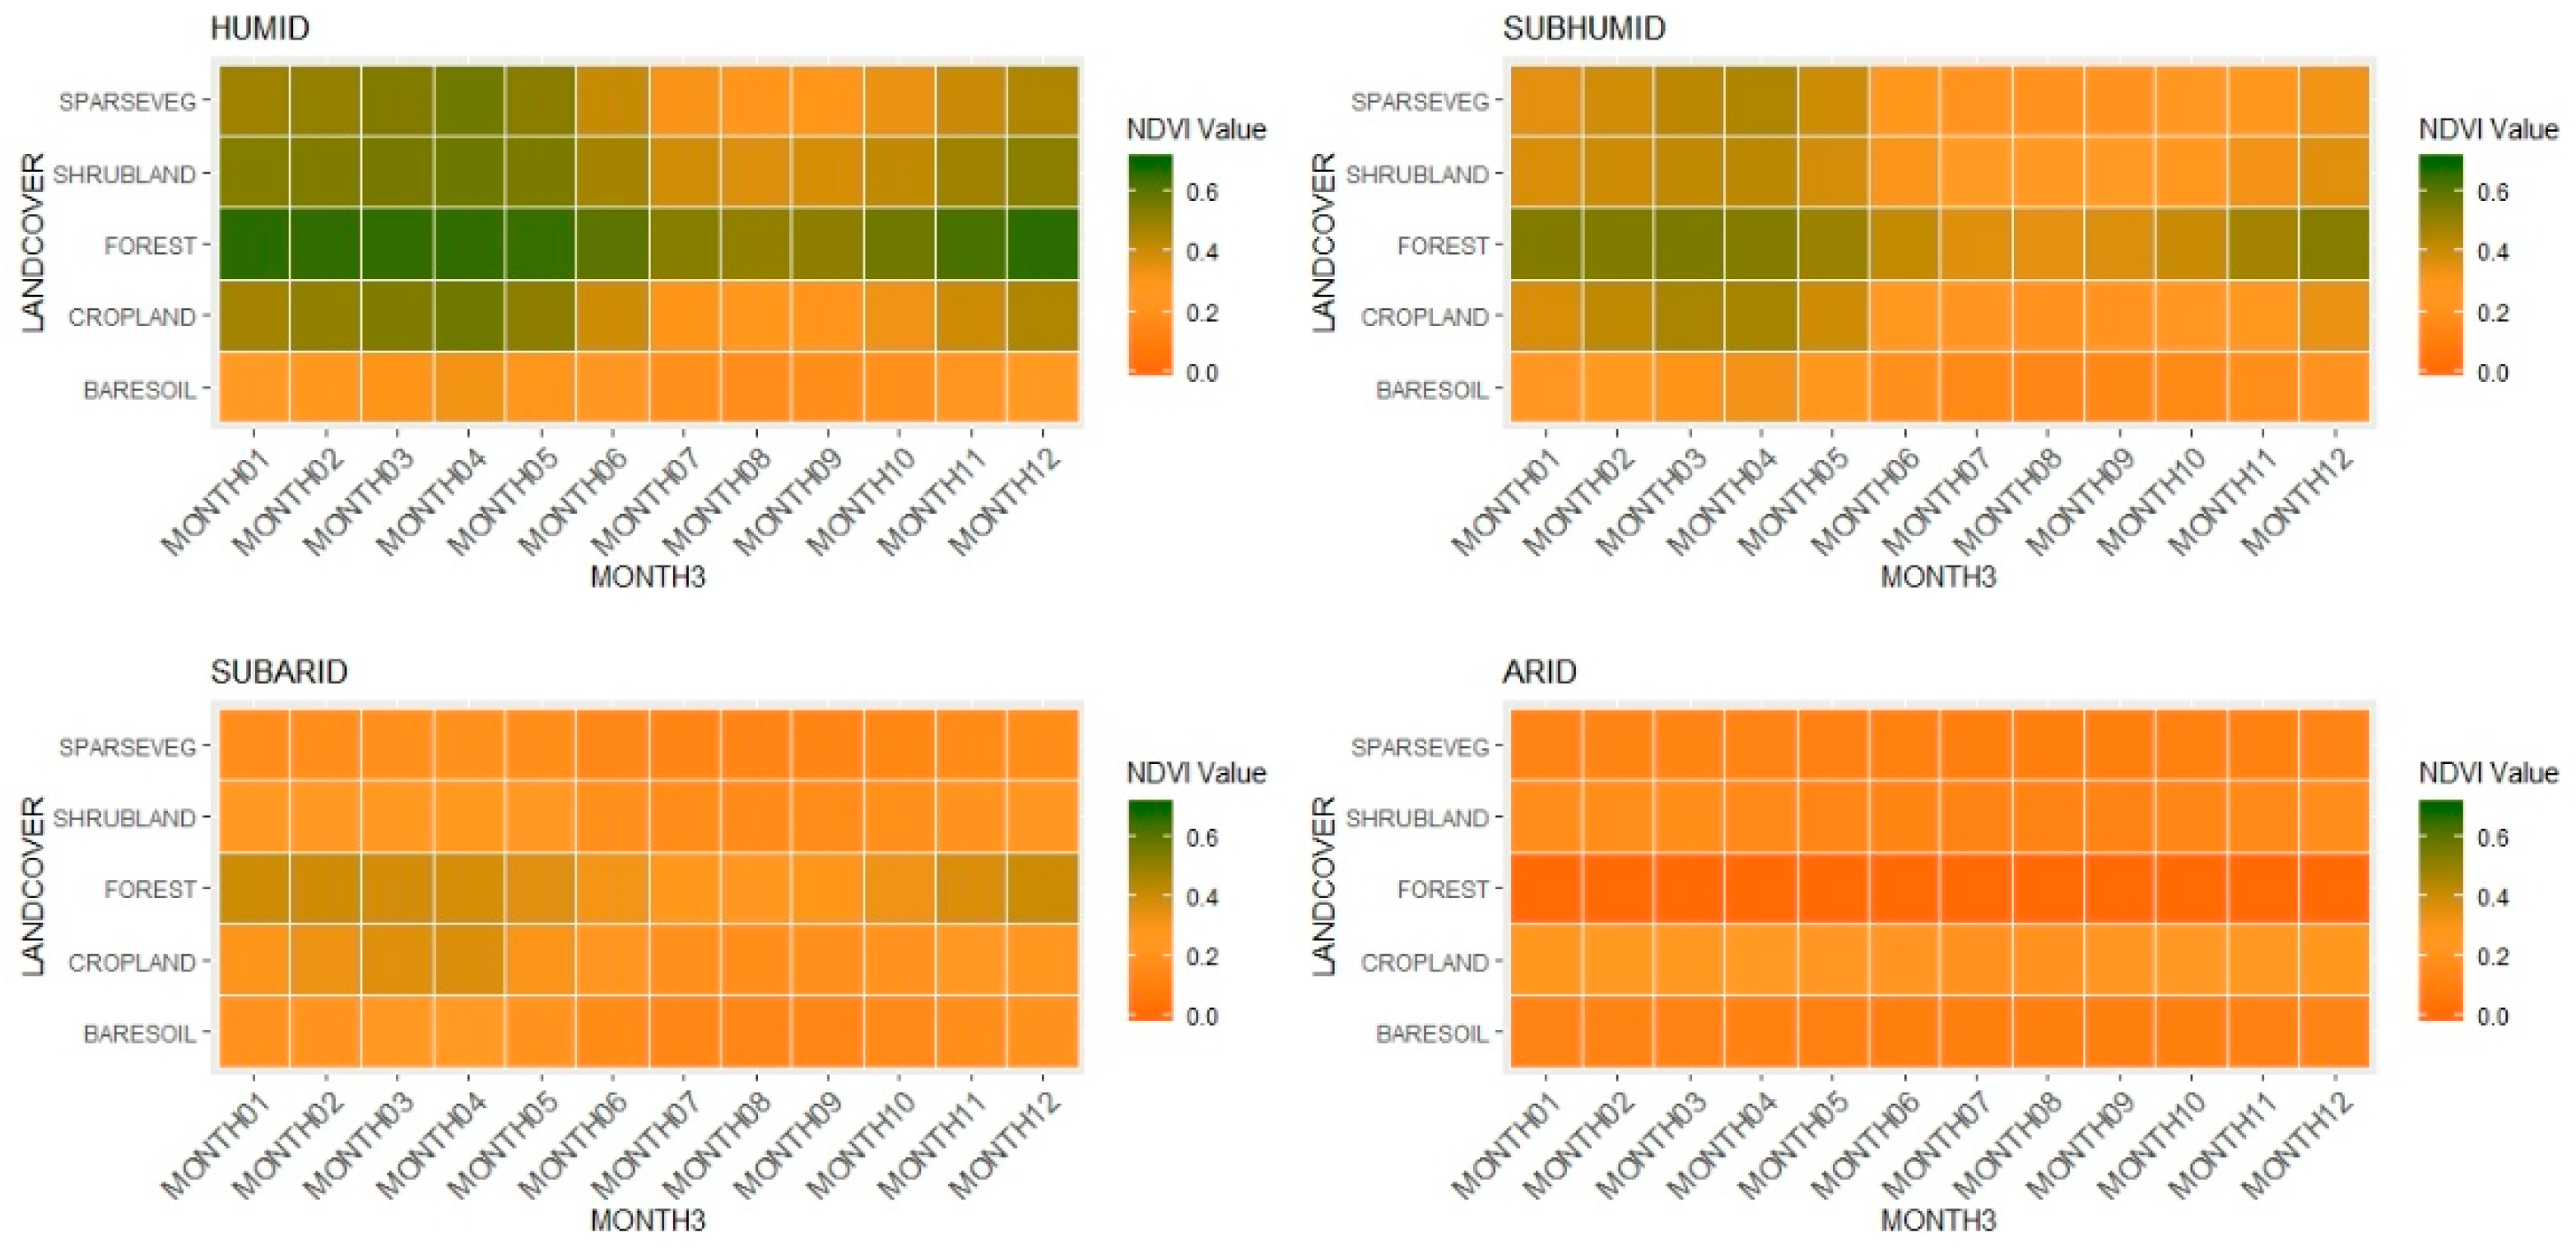
The seasonal course of NDVI (Figure 8) for the land cover types across the four bioclimatic regions shows high contrast between the humid and subhumid regions with productive fuels, and the subarid and arid ones with low-productive fuels (often steppic) all year long. The northern productive forests under humid and sub-humid bioclimate—and additionally the shrublands and croplands—can regrow fuel from fall to spring due to high rainfall (Figure 8), and then become drier (i.e., flammable) during the summer. The seasonal alternation of fuel regrowth and fuel desiccation render these fuels flammable during summer. Contrastingly, the southern sub-arid forests have much less biomass than the northern ones and are thus fuel-limited. Bare soils and sparse vegetation in sub-arid and arid regions always display low NDVI whatever the season.
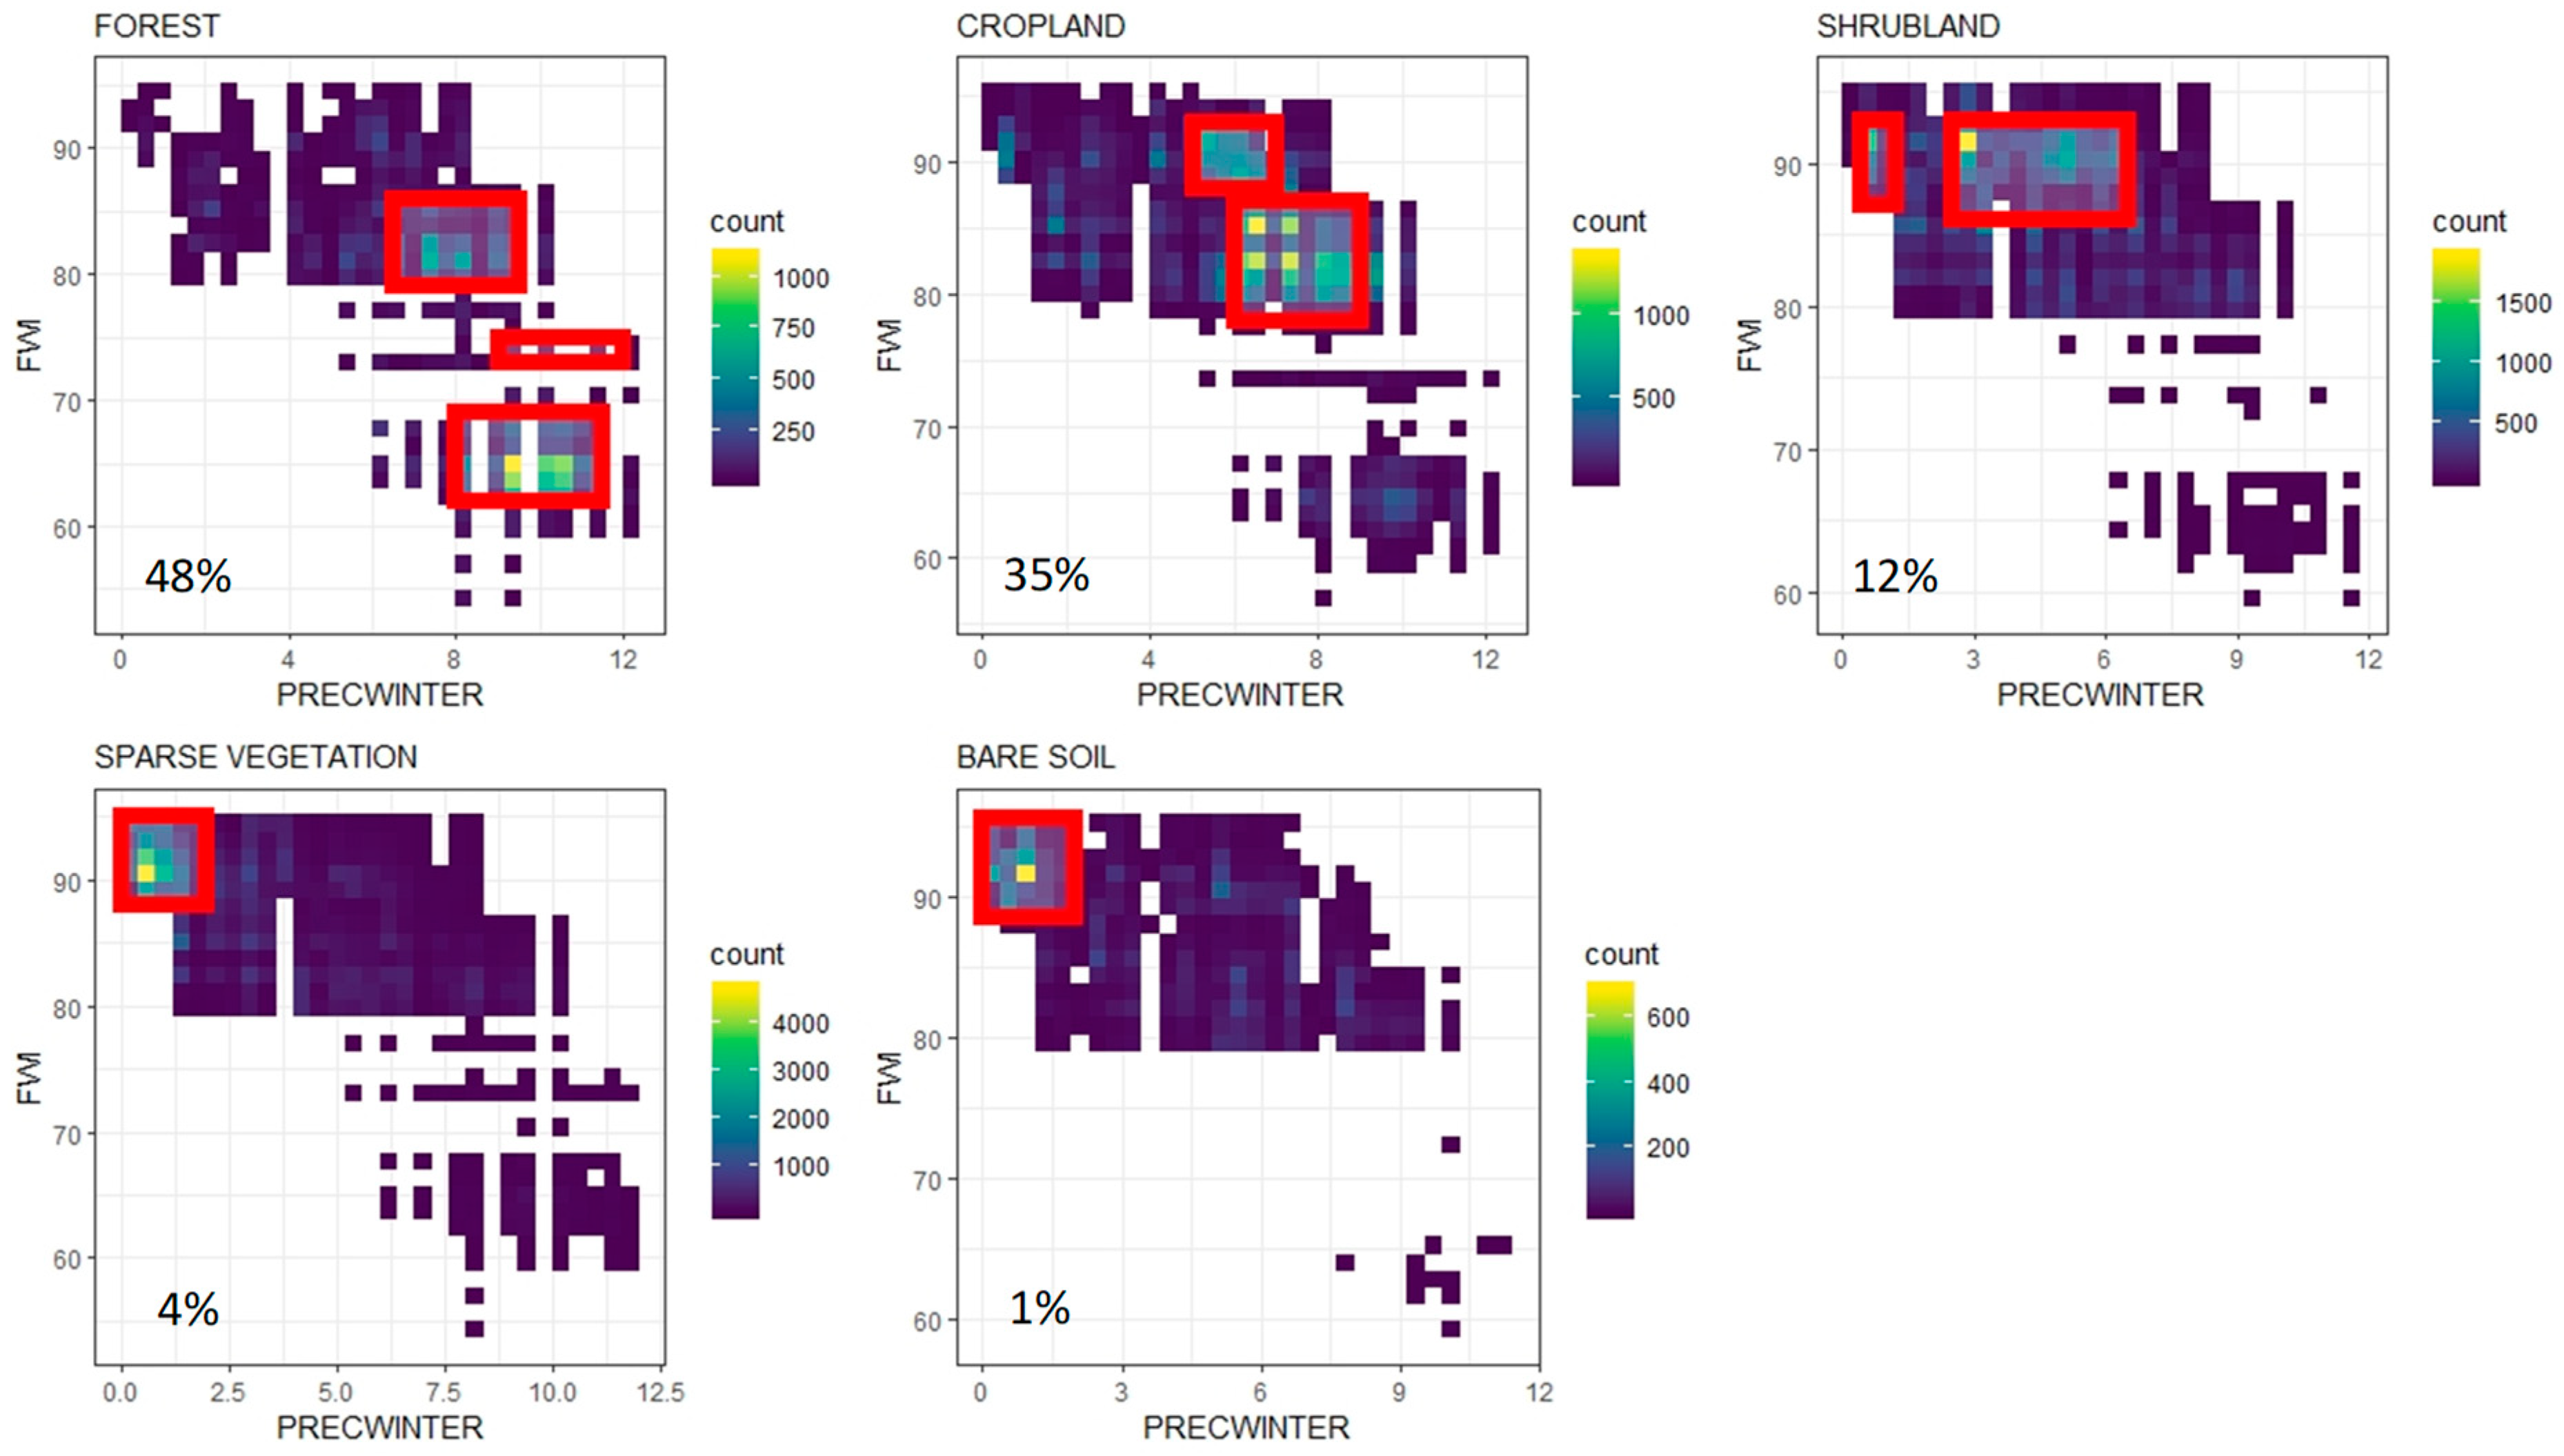
Finally, Figure 9 displays the density of fires according to FWI and to the winter rainfall for each of the main land cover types. Red rectangles indicate the fire hotspots, with 75% of fires. These Figures indicate that the fire activity is maximal in forests when the winter rainfall is high and the FWI is moderate and in croplands when both rainfall and FWI are high. In low-stature and unproductive vegetation fuels (shrublands, sparse vegetation, and bare soil) the fire hotspots concentrate where the FWI is maximal and the rainfall is minimal. It is noteworthy that results were similar when accounting for rainfall from fall to spring (data not shown).
3.3. The Anthropogenic Part of Fire
Bioclimate and fuels severely constrain the presence of fires in Algeria. However, as most fires are ignited voluntarily or in an unwanted manner by humans in Algeria [15], we logically found that the built-up index including roads, power lines, or railways promotes fire. We found that high HFI values on the northern coastline correspond to high fire occurrence (Figure 3). The HFI rapidly decreases in the southern (desert) part of the study area due to the absence of humans, almost in parallel to bioclimates.
3.4. Model of Fire Occurrence
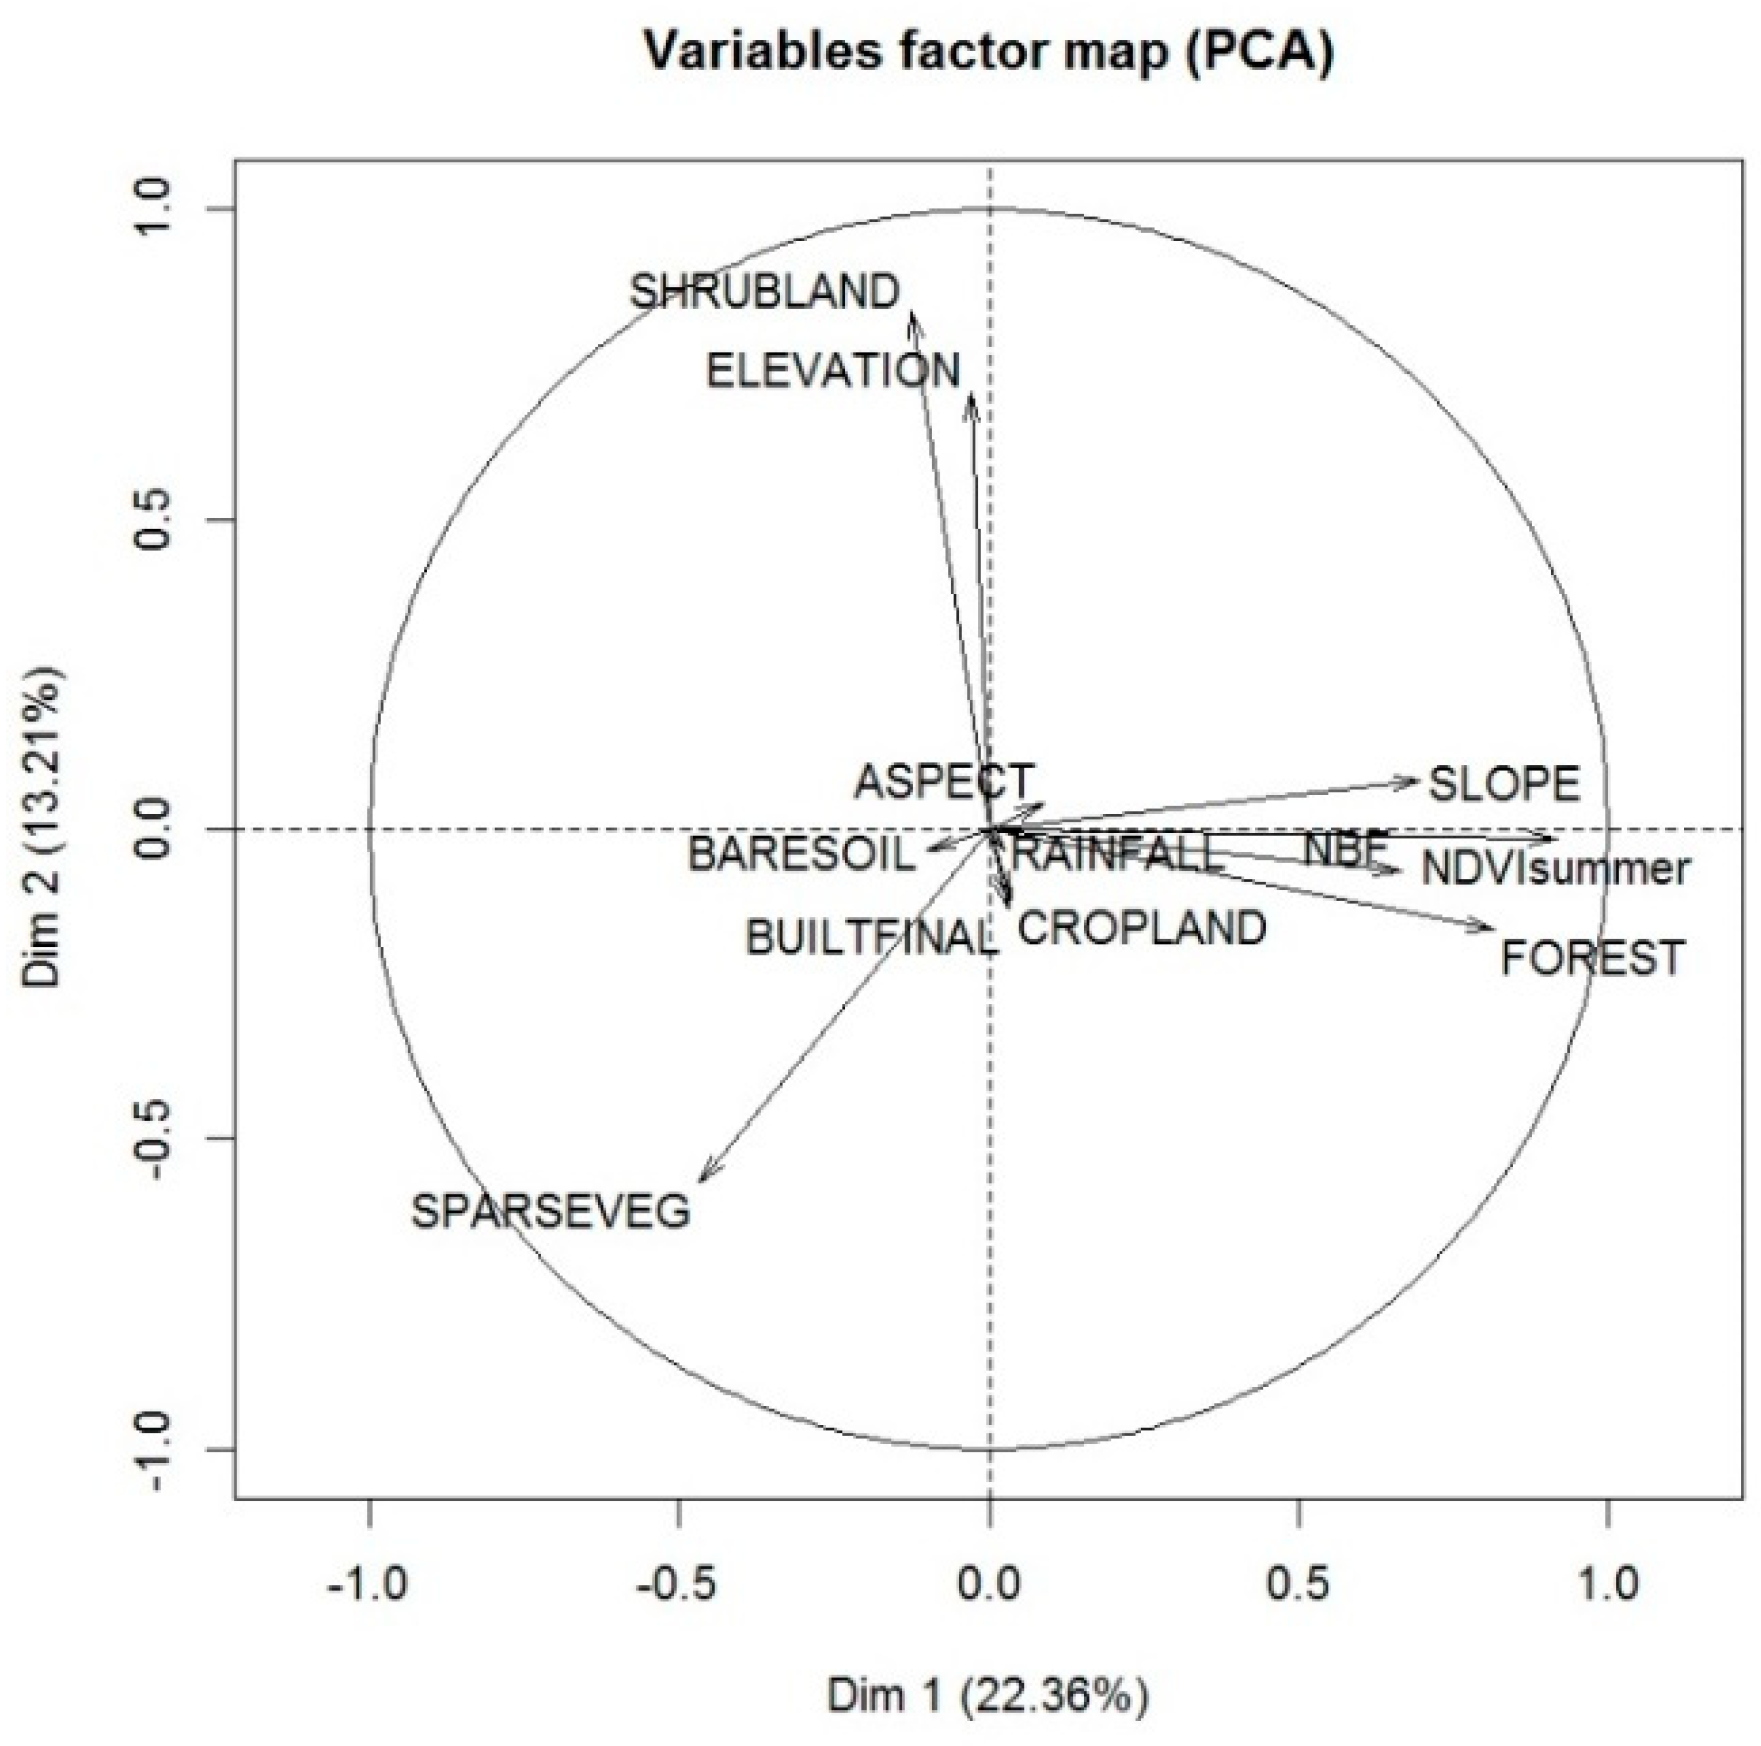
The PCA analysis gave a first overview of interactions among fire drivers. Figure 10 shows that the number of fires superposes with the presence of forests, the NDVI value, the rainfall amount, the slope angle, and to a lesser degree, the amount of croplands. The reverse axis corresponds to bare soils, to areas with sparse vegetation and those with high built-up values (roads, urbanization, infrastructures, aso). The shrublands are associated to high elevation areas.
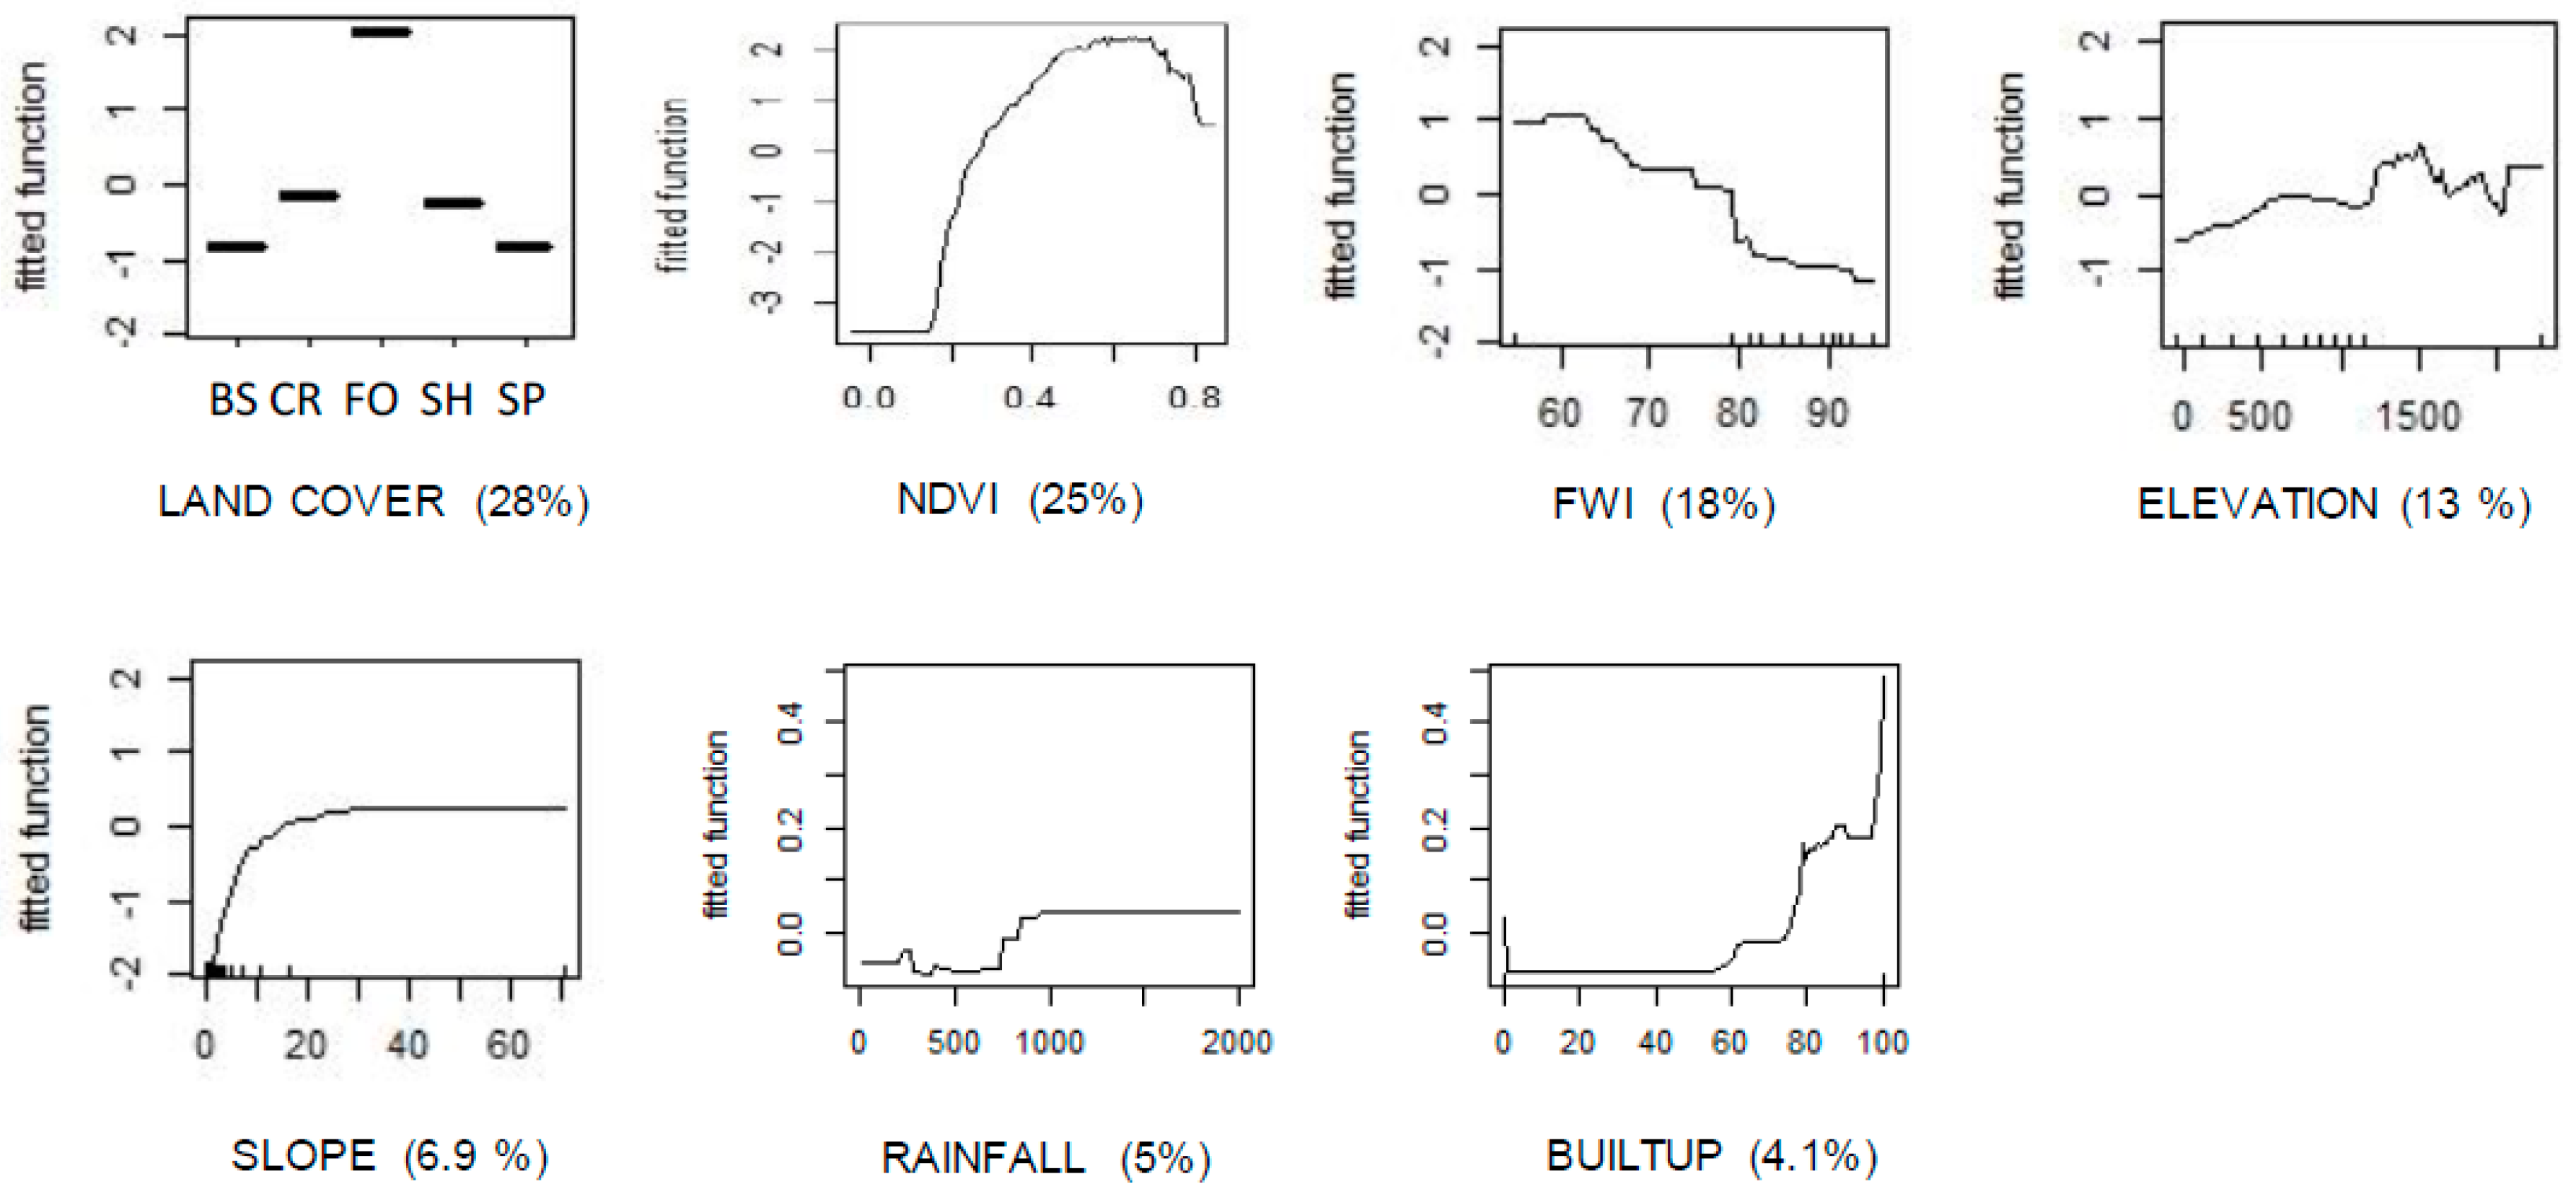
The BRT model (Figure 11) showed that fire was mainly present in forests, shrublands and croplands, in areas with high fuel biomass (NDVI > 0.35), relatively low fire danger (mean annual FWI < 75), high rainfall (>1000 mm.yr−1) on remote terrain with slopes higher than 10°, and elevation higher than 500 m. This mainly corresponds to mountain landscapes of the northernmost part of Algeria, in contrast with the sub-arid–arid flat areas of the south. The built-up index had low effect in this model, but it clearly shows that high density of built-up features promotes fire (Figure 11).
4. Discussion
This study provided the first model explaining wildfire occurrence in Northern Algeria. We determined the predominant environmental and anthropic drivers of fire occurrence and what limits fire. Here we give functional explanations of fire activity according to interactions among bioclimate, fuel biomass, fire danger, and human activities. Understanding why forests are preferentially burning may help to protect them in a context of aridification and increasing human footprint.
4.1. Maximal Fire Risk in Northern Biodiverse Forests
The Algerian fire regime varies dramatically from north to south. Both latitude and elevation govern the sharp fire–weather–fuel gradient parallel to the bioclimatic gradient. We found high linkage between bioclimate, fuel types (their biomass and greenness, i.e., the NDVI), and the occurrence of fire in Algeria. The northern forests—and to a lesser degree, their associated shrublands—are the vegetation types burnt the most frequently from 2000 to 2019 (Figure 11). These biodiverse forests cover only 12% of the study area but they account for 52% of all fire ignitions, and some of them burned up to 17 times in 18 years. This prevalence of fire in high-fueled forests under humid and sub-humid bioclimates first results from the fact that bioclimate controls the type of vegetation fuels, their biomass, their productivity, and their desiccation or greenness across seasons. In forests, high rainfall amounts from fall to spring (or during winter) promote fuel growth or its regrowth after fires. During summer, these forests become dry, highly flammable, and highly hazardous. This yearly weather cycle produces an alternation of a season propitious to fuel recharge followed by a season propitious to fuel flammability. This is a typical fire-fuel syndrome that is common around the MB [1,36]. This process explains the Algerian fire paradox in which the maximal fire activity does not occur in areas with maximal annual fire danger (i.e., the sub-arid and arid regions with mean FWI > 80) but in those with moderate FWI and high rainfall amount (i.e., the humid and sub-humid regions with mean FWI below 70; Table 1). This counterintuitive finding may be explained by the fact that fire danger remains high most of the year (FWI up to 200; Figure S2), and that a moderate level of fire danger (e.g., FWI > 22 according to the EFFIS European Forest Fire Information System; effis.jrc.ec.europa.eu) [37] is sufficient for igniting fires in most Mediterranean forests.
The Northern Algeria ‘fire rim’ is restricted to a narrow fringe because the steep north–south bioclimatic gradient rapidly limits fuels and sets fire activity to zero at latitudes lower than 34.5° N (Figure 3). This study suggested that a NDVI value lower than 0.25 strongly limits fire, as it is frequent in the southern part of the study area. This southern area has very high fire danger almost all year long (Figure S2, bioclimates 3–4), and the aridity proportionally reduces fuel biomass. Therefore, the steppic vegetation or the bare soils are often unable to carry fires. Similar fuel limitation exists near arid fringes in Southern Africa [38] or in sub-Saharan Africa [39]. At the global scale, fire peaks at intermediate aridity/productivity values according to the ‘intermediate fire-productivity’ hypothesis (IFP; [36]). In this study, we showed that fire peaks in high productivity areas where fuel is sufficient to carry fire, and fire danger is high during summer.
Humans play a part in igniting fires in Algerian forests. First, humans intentionally ignite fires in forests (53% of total ignitions whose cause is known; [15]) for land speculation, urbanization, charcoal production, or for counter-terrorism and security reasons [6]. This selective burning has led to a decrease in Algerian forests by ca. 50,000 ha per year during the recent period [15]. Protecting forest biodiversity hotspots in the long-term is arduous because many areas are not under surveillance during summer, and firefighting equipment and fire crews are limited [15]. The northern forests provide many ecological services, but they account for 70% of the total area burned annually. Many forests have turned into shrublands and may become degraded for decades due to the ongoing increase in aridity, and to desertification [13]. Second, many ignitions are caused by humans near houses and infrastructures (the built-up) to account for the human-set fires in Northern Algeria, and it is likely that ignition may increase in parallel to the built-up density [11].
4.2. Implication for Fire Risk Management in the Long-Term
The Algerian forests are home to many species and protected areas [14], and they provide many goods and services to the population [16]. However, they burn frequently due to increased urban sprawl and density [7]. In spite of recent efforts to improve the protection of forests against fire [15], the suppression capacity remains limited. In these forests located in the most populated areas, applying forest fuel management, informing about fire prevention, and enhancing surveillance are of paramount importance. Similar policies on the northern rim of the MB have proved efficient to slow down fire activity [40]). Northern Algeria remains predominantly rural, with many (predominantly small) agricultural and pastoral fires. Rural activities may help in limiting fuel accumulation in the landscape, and creating fuel breaks on the landscape-scale that could limit the extension of fires [41,42]. This could prevent the fuel accumulation syndrome common on the northern rim of the MB [1,10] due to the collapse of rural practices and the banning of traditional fire uses for decades [11,12].
Algeria is also under threat of increasing desertification, overgrazing, and aridification, which progress towards the north. These processes can progressively make fuel more flammable and increase vegetation mortality in the northern forests, while it can decrease fuel biomass in the south, thus limiting wildfires. Desertification is critically increasing (200,000 ha.year−1) in Algeria at the interface of steppic vegetation of the sub-arid zone and the southern forests or agropastoral areas of the Tellian area [13]. Fire may increase or decrease in the Mediterranean-type ecosystems worldwide depending upon the drier versus wetter future weather [43]. Warmer–drier conditions in the future should result in decreased fire activity in countries around the MB, whereas warmer–wetter conditions should result in increased fire activity, where there is fuel limitation [43]. The increase in aridity due to lower rainfall and higher temperature threatens the survival and diversity of many ecosystems, notably within Algeria [44,45].
5. Conclusions
In Algeria, high fire occurrence is almost restricted entirely to the northern mountain forest fringe under humid and sub-humid bioclimates. These forests provide many goods and services to the population but they are clearly under high fire threat, due to growing human activities and to limited forest fuel management. Applying the principles of sustainable forest management in order to reconcile ecological and economic functions [40] may be of interest in this context. This study may help decision-makers to prevent unwanted fires (especially large ones), to predict the location of future wildfires, and to forecast the areas with high fire danger. Together with a good knowledge of fire causes [7,15] and of the location of assets, this may help limit fire impacts in the future.
Supplementary Materials
The following are available online at https://0-www-mdpi-com.brum.beds.ac.uk/2571-6255/3/4/58/s1, Figure S1: Main environmental and anthropic variables in Northern Algeria, Figure S2: Main weather-related variables in Northern Algeria, Figure S3: Density distribution of fire and no-fire pixels as a function of latitude and longitude in Northern Algeria, Table S1: Collection of environmental and anthropic variables.
Author Contributions
Conceptualization, T.C.; methodology, T.C.; software, T.C., A.A.; validation, T.C., S.D.; formal analysis, T.C., S.D.; investigation, T.C., A.A.; resources, T.C.; data curation, T.C.; writing—original draft preparation, T.C.; writing—review and editing, T.C., S.D.; T.C., S.D.; visualization, T.C.; supervision, T.C.; project administration, T.C.; funding acquisition, T.C. All authors have read and agreed to the published version of the manuscript.
Funding
This research received no external funding.
Conflicts of Interest
The authors declare no conflict of interest.
References
- Keeley, J.; Bond, W.; Bradstock, R.; Pausas, J.; Rundel, P. Fire in Mediterranean Ecosystems. In Ecology, Evolution and Management; Cambridge University Press: Cambridge, UK, 2012; p. 450. [Google Scholar]
- Oliveira, S.; Félix, F.; Nunes, A.; Lourenço, L.; Laneve, G.; Sebastián-López, A. Mapping wildfire vulnerability in Mediterranean Europe. Testing a stepwise approach for operational purposes. J. Environ. Manag. 2019, 206, 158–169. [Google Scholar] [CrossRef] [PubMed]
- Cardil, A.; Vega-Garcia, C.; Ascoli, D.; Molina-Terren, D.M.; Silva, C.A.; Rodrigues, M. How does drought impact burned area in Mediterranean vegetation communities? Sci. Total Environ. 2019, 693, 11. [Google Scholar] [CrossRef] [PubMed]
- Turco, M.; Jerez, S.; Augusto, S.; Tarín-Carrasco, P.; Ratola, N.; Jimenez-Guerrero, P.; Trigo, R. Climate drivers of the 2017 devastating fires in Portugal. Sci. Rep. 2019, 9, 1–8. [Google Scholar] [CrossRef]
- Belhadj-Khedher, C.; Koutsias, N.; Karamitsou, A.; EI-Melki, T.; Ouelhazi, B.; Hamdi, A.; Nouri, H.; Mouillot, F. A Revised Historical Fire Regime Analysis in Tunisia (1985–2010) from a Critical Analysis of the National Fire Database and Remote Sensing. Forests 2019, 9, 59. [Google Scholar] [CrossRef] [Green Version]
- Meddour-Sahar, O. Wildfires in Algeria: Problems and challenges. iForest Biogeosci. For. 2015, 8, 818–826. [Google Scholar] [CrossRef] [Green Version]
- Aini, A.; Curt, T.; Bekdouche, F. Modelling fire hazard in the southern Mediterranean fire rim (Bejaia region, northern Algeria). Environ. Monit. Assess. 2019, 191, 747. [Google Scholar] [CrossRef]
- Rivas-Martinez, S.; Rivas-Saenz, S.; Penas Merino, A. Worldwide Bioclimatic Classification System. Glob. Geobot. 2011, 1, 1–634. [Google Scholar]
- Heyerdahl, E.K.; Brubaker, L.B.; Agee, J.K. Spatial controls of historical fire regimes: A multiscale example from the interior west, USA. Ecology 2001, 82, 660–678. [Google Scholar] [CrossRef]
- Pausas, J.; Fernandez-Munoz, S. Fire regime changes in the Western Mediterranean Basin: From fuel-limited to drought-driven fire regime. Clim. Chang. 2012, 110, 215–226. [Google Scholar] [CrossRef] [Green Version]
- Moreira, F.; Viedma, O.; Arianoutsou, M.; Curt, T.; Koutsias, N.; Rigolot, E.; Barbati, A.; Corona, P.; Vaz, P.; Xanthopoulos, G. Landscape–wildfire interactions in southern Europe: Implications for landscape management. J. Environ. Manag. 2011, 92, 2389–2402. [Google Scholar] [CrossRef] [Green Version]
- Chergui, B.; Fahd, S.; Santos, X.; Pausas, J.G. Socioeconomic Factors Drive Fire-Regime Variability in the Mediterranean Basin. Ecosystems 2019, 21, 619–628. [Google Scholar] [CrossRef] [Green Version]
- Benslimane, M.; Hamimed, A.; El Zerey, W.; Khaldi, A.; Mederbal, K. Analyse et suivi du phénomène de la désertification en Algérie du nord. VertigO—la Rev. Electron. en Sci. de L’environ. [En ligne] 2008, 8, 1–9. [Google Scholar] [CrossRef]
- MFRA, E. Mediterranean Forest Research Agenda (MFRA); FAO—European Forest Institute Mediterranean Regional Office (EFIMED, Barcelona): Barcelona, Spain, 2010; p. 32. [Google Scholar]
- Meddour-Sahar, O. Les feux de forêts en Algérie: Analyse du Risque, étude des Causes, évaluation du Dispositif de Défense et des Politiques de Gestion. Ph.D. Thesis, University of Tizi Ouzou, Tizi-Ouzou, Algeria, 2014; p. 195. [Google Scholar]
- WWF. An analysis of key issues that underlie forest fires and shape subsequent fire management strategies in 12 countries in the Mediterranean basin. In FIREFIGHT Mediterranean Region; Final Report; WWF Project 9Z0731.01; WWF Mediterranean Programme Office: Gland, Switzerland, 2001; p. 66. [Google Scholar]
- GFN Report of Mediterranean Ecological Footprint Trends; Plan Bleu Edition: Paris, France, 2012; p. 44. Available online: www.footprintnetwork.org (accessed on 5 September 2020).
- Artés, T.; Oom, D.; de Rigo, D.; Durrant, T.H.; Maianti, P.; Libertà, G.; San-Miguel-Ayanz, J. A global wildfire dataset for the analysis of fire regimes and fire behaviour. Sci. Data 2019, 6, 296. [Google Scholar] [CrossRef] [PubMed]
- Laurent, P.; Mouillot, F.; Yue, C.; Ciais, P.; Moreno, M.V.; Nogueira, J.M.P. FRY, a global database of fire patch functional traits derived from space-borne burned area products. Sci. Data 2019, 5, 180132. [Google Scholar] [CrossRef] [PubMed] [Green Version]
- Rodrigues, M.; San Miguel, J.; Oliveira, S.; Moreira, F.; Camia, A. An Insight into Spatial-Temporal Trends of Fire Ignitions and Burned Areas in the European Mediterranean Countries. J. Earth Sci. Eng. 2013, 3, 497–505. [Google Scholar]
- FAO Global Forest Resources Assessment 2010; Food and Agriculture Organization of the United Nations: Rome, Italy, 2010; p. 80.
- Kobayashi, T.; Tsend-Ayush, J.; Tateishi, R. A new global tree-cover percentage map using MODIS data. Int. J. Remote Sens. 2016, 37, 969–992. [Google Scholar] [CrossRef]
- van Wagner, C. Development and Structure of the Canadian Forest Fire Weather Index System; Forestry Technical Report, Report 35; Canadian Forestry Service Headquarters: Ottawa, ON, Canada, 1987. [Google Scholar]
- Meddour-Sahar, O.; Meddour, R.; Leone, V.; Lovreglio, R.; Derridj, A. Analysis of forest fires causes and their motivations in northern Algeria: The Delphi method. Iforest Biogeosci. For. 2013, 6, 247–254. [Google Scholar] [CrossRef]
- Curt, T.; Borgniet, L.; Bouillon, C. Wildfire frequency varies with the size and shape of fuel types in southeastern France: Implications for environmental management. J. Environ. Manag. 2013, 117, 150–161. [Google Scholar] [CrossRef] [Green Version]
- Rodrigues, M.; de la Riva, J. An insight into machine-learning algorithms to model human-caused wildfire occurrence. Environ. Model. Softw. 2014, 57, 192–201. [Google Scholar] [CrossRef]
- Curt, T.; Frejaville, T.; Lahaye, S. Modelling the spatial patterns of ignition causes and fire regime features in southern France: Implications for fire prevention policy. Int. J. Wildland Fire 2016, 25, 785–796. [Google Scholar] [CrossRef] [Green Version]
- Gonzalez-Olabarria, J.R.; Brotons, L.; Gritten, D.; Tudela, A.; Teres, J.A. Identifying location and causality of fire ignition hotspots in a Mediterranean region. Int. J.Wildland Fire 2012, 21, 905–914. [Google Scholar] [CrossRef]
- Viedma, O.; Urbieta, I.R.; Moreno, J.M. Wildfires and the role of their drivers are changing over time in a large rural area of west-central Spain. Sci. Rep. 2019, 8, 17797. [Google Scholar] [CrossRef] [PubMed] [Green Version]
- De’ath, G. Boosted trees for ecological modeling and prediction. Ecology 2007, 88, 243–251. [Google Scholar] [CrossRef]
- Elith, J.; Leathwick, J.R.; Hastie, T. A working guide to boosted regression trees. J. Anim. Ecol. 2008, 77, 802–813. [Google Scholar] [CrossRef] [PubMed]
- Ridgeway, G. Generalized Boosted Models: A Guide to the Gbm Package; 2013; p. 34. Available online: http://cran.r-project.org/ (accessed on 5 September 2020).
- Pearce, J.; Ferrier, S. Evaluating the predictive performance of habitat models developed using logistic regression. Ecol. Model. 2000, 133, 225–245. [Google Scholar] [CrossRef] [Green Version]
- Aertsen, W.; Kint, V.; van Orshoven, J.; Özkan, K.; Muys, B. Comparison and ranking of different modelling techniques for prediction of site index in Mediterranean mountain forests. Ecol. Model. 2010, 221, 1119–1130. [Google Scholar] [CrossRef]
- Rodrigues, M.; Costafreda-Aumedes, S.; Comas, C.; Vega-Garcia, C. Spatial stratification of wildfire drivers towards enhanced definition of large-fire regime zoning and fire seasons. Sci. Total Environ. 2019, 689, 634–644. [Google Scholar] [CrossRef]
- Pausas, J.G.; Ribeiro, E. The global fire–productivity relationship. Glob. Ecol. Biogeogr. 2013, 22, 728–736. [Google Scholar] [CrossRef]
- EFFIS Forest Fires in Europe. Joint Report of JRC and Directorate-General Environment; Middle East and North Africa 2015 European Commission: Brussels, Belgium, 2016; p. 122. Available online: http://effis.jrc.ec.europa.eu/ (accessed on 5 September 2020).
- Kahiu, M.N.; Hanan, N.P. Fire in sub-Saharan Africa: The fuel, cure and connectivity hypothesis. Global Ecol. Biogeogr. 2019, 27, 946–957. [Google Scholar] [CrossRef] [Green Version]
- Mayr, M.J.; Vanselow, K.A.; Samimi, C. Fire regimes at the arid fringe: A 16-year remote sensing perspective (2000–2016) on the controls of fire activity in Namibia from spatial predictive models. Ecol. Indic 2019, 91, 324–337. [Google Scholar] [CrossRef]
- Rego, F.; Moreno, J.; Vallejo, V.; Xanthopoulos, G. Forest fires. Sparking firesmart policies in the EU. In Research & Innovation Projects for Policy. Directorate-General for Research and Innovation Climate Action and Resource Efficiency; Faivre, N., Ed.; European Commission: Brussels, Belgium, 2019; p. 48. [Google Scholar]
- Fernandes, P.M.; Barros, A.M.G.; Pinto, A.; Santos, J.A. Characteristics and controls of extremely large wildfires in the western Mediterranean Basin. J. Geophys. Res. Biogeosci. 2016, 121, 2141–2157. [Google Scholar] [CrossRef]
- Ruffault, J.; Curt, T.; Martin St-Paul, N.K.; Moron, V.; Trigo, R.M. Extreme Wildfire occurrence in response to Global Change type Droughts in the Northern Mediterranean. Nat. Hazards Earth Syst. Sci. Discuss. 2017, 2017, 1–21. [Google Scholar]
- Batllori, E.; Parisien, M.A.; Krawchuk, M.A.; Moritz, M.A. Climate change-induced shifts in fire for Mediterranean ecosystems. Glob. Ecol. Biogeogr. 2013, 22, 1118–1129. [Google Scholar] [CrossRef]
- Gouveia, C.M.; Trigo, R.M.; Begueria, S.; Vicente-Serrano, S.M. Drought impacts on vegetation activity in the Mediterranean region: An assessment using remote sensing data and multi-scale drought indicators. Glob. Planet. Chang. 2017, 151, 15–27. [Google Scholar] [CrossRef] [Green Version]
- DGF (2019) Les Feux de Forêts en Algérie: Analyses et Perspectives. Direction Générale des Forêts. Available online: www.interieur.gov.dz (accessed on 5 September 2020).
Figure 1.
Maps of fire occurrence in Northern Algeria (number of fires, 2001–2019). The enclosed Figure (upper left) indicates the fire hotspots and their level of density.
Figure 1.
Maps of fire occurrence in Northern Algeria (number of fires, 2001–2019). The enclosed Figure (upper left) indicates the fire hotspots and their level of density.

Figure 2.
Percentage of pixels burnt (‘fire’) and unburnt (‘nofire’) according to the latitude in Northern Algeria. The northern area (latitude > 36.3° N) regroups 75% of all fires and of the areas burnt from 2001 to 2019. The southern ‘no fire area’ (latitude < 34.4° N) indicates the southernmost limit of fires from 2001 to 2019.

Figure 3.
Latitudinal distribution of fires and of fire drivers in Northern Algeria (latitude ranging from 34° N to 37.5° N). NBF is for the fire frequency (number of fires); NDVI summer is the NDVI value for each pixel from June to October; RAINFALL is the mean annual rainfall amount (mm); BUILT-UP is the built-up index which sums up the population density, the housing density, and the density of human infrastructures promoting ignitions; FOREST is the coverage by forests; FWI is the mean fire weather index during summer; SHRUBLAND is the coverage by shrublands; SPARSEVEG is the coverage by sparse vegetation (steppic); CROPLAND is the coverage by croplands and agropastoral lands; BARESOIL is the coverage by bare soils and rock outcrops. For all land cover types, the values are the number of pixels. The mean latitudinal limits of the four bioclimates are indicated on the upper left panel (NBF).

Figure 4.
Density distribution of summer NDVI indices for the pixels burnt from 2001 to 2019 (“FIRE PIXELS”) and the unburnt pixels (“NON-FIRE PIXELS”) in Northern Algeria according to the main land cover types. The right panel compares the NDVI distribution of fire versus no-fire pixels (Tukey HSD test; p < 0.0001). The mean value is the central bar. AGROPAST are agricultural and pastoral fuel types; FOREST corresponds to all forest types; SHRUBLAND corresponds to shrublands; SPARSEVEG is for sparse and low-stature vegetation types (herbaceous steppic).

Figure 5.
Density distribution of FWI (fire weather index) and summer NDVI indices for the pixels burnt from 2001 to 2019 (left) and the unburnt pixels (right, ‘no fire’) in Northern Algeria.
Figure 5.
Density distribution of FWI (fire weather index) and summer NDVI indices for the pixels burnt from 2001 to 2019 (left) and the unburnt pixels (right, ‘no fire’) in Northern Algeria.

Figure 6.
Boxplots of fire weather index (FWI), summer NDVI (NDVIsummer) and mean annual rainfall (RAINFALL) for the pixels burnt (‘FIRE’) and the unburnt pixels (‘NOFIRE’) in Northern Algeria from 2001 to 2019. All the boxplots had statistically significant differences between the FIRE and NOFIRE modalities (p < 0.001).

Figure 7.
Distribution density of mean annual rainfall (mm) and mean annual normalized difference vegetation index (NDVI) across the main land cover types in Northern Algeria (2001–2019). FOREST is the coverage by forests; SHRUBLAND is the coverage by shrublands; CROPLAND is the coverage by croplands and agropastoral lands; SPARSEVEG is the coverage by sparse vegetation (herbaceous steppic); BARESOIL is the coverage by bare soils and rock outcrops.

Figure 8.
Mean monthly NDVI value for the main land cover types and the four bioclimatic regions in Northern Algeria (humid, sub-humid, sub-arid, arid).
Figure 8.
Mean monthly NDVI value for the main land cover types and the four bioclimatic regions in Northern Algeria (humid, sub-humid, sub-arid, arid).

Figure 9.
Mean daily FWI density for the fire pixels (i.e., the pixels burned from 2001 to 2019) plotted against the density of the mean daily precipitation during winter (PRECWINTER, December to February) for the five main land cover types in Northern Algeria and. For each land cover type, the red rectangle corresponds to the fire hotspots regrouping 75% of the total number of fires. The percentage of the total number of fires is indicated for each land cover type (lower left).

Figure 10.
Variable factor map for the Principal Component Analysis (PCA) of fire in Northern Algeria.
Figure 10.
Variable factor map for the Principal Component Analysis (PCA) of fire in Northern Algeria.

Figure 11.
Variables of the Boosted Regression Tree analysis for the modelling of fire occurrence in Northern Algeria. The percentage of explanation (%) is displayed for each variable. For the land cover types, BS is for bare soils, CR for croplands, FO for forests, SH for shrublands, and SP for sparse vegetation (steppic).


Table 1.
Main characteristics of fire regime for the four bioclimates of Northern Algeria.
| Bioclimatic Zone | NBF | FWI | BUILT-UP | NDVI | PREC | Main Land Cover Types | % Total Area | % Burned |
|---|---|---|---|---|---|---|---|---|
| Humid | 1.07 ± 0.01 | 64.5 ± 2.3 | 17.7 ± 0.6 | 0.56 ± 0.1 | 1050 ± 320 | Forests | 7 | 40 |
| Subhumid | 0.53 ± 0.001 | 70.1 ± 6.6 | 4.7 ± 0.2 | 0.40 ± 0.1 | 580 ± 250 | Forests Shrublands | 15 | 33 |
| Subarid | 0.010 ± 0.001 | 87 ± 0.41 | 0.9 ± 0.003 | 0.23 ± 0.08 | 350 ± 180 | Shrublands Sparse vegetation | 55 | 25 |
| Arid | 0.001 ± 0.001 | 91 ± 1.7 | 0.02 ± 0.003 | 0.15 ± 0.05 | 239 ± 240 | Bare soils | 23 | 2 |
NBF is the number of fires per 3 × 3 km pixel; FWI is the fire weather index (unitless); BUILT-UP is the density of human-made infrastructures; NDVI is the normalized difference vegetation index (a surrogate for fuel biomass, varying from 0 to 1); PREC is the mean annual rainfall (mm.yr−1); for each main land cover type, we provided the percentage in the study area, then the percentage burnt, respectively.
© 2020 by the authors. Licensee MDPI, Basel, Switzerland. This article is an open access article distributed under the terms and conditions of the Creative Commons Attribution (CC BY) license (http://creativecommons.org/licenses/by/4.0/).
Share and Cite
MDPI and ACS Style
Curt, T.; Aini, A.; Dupire, S. Fire Activity in Mediterranean Forests (The Algerian Case). Fire 2020, 3, 58. https://0-doi-org.brum.beds.ac.uk/10.3390/fire3040058
AMA Style
Curt T, Aini A, Dupire S. Fire Activity in Mediterranean Forests (The Algerian Case). Fire. 2020; 3(4):58. https://0-doi-org.brum.beds.ac.uk/10.3390/fire3040058
Chicago/Turabian StyleCurt, Thomas, Aissa Aini, and Sylvain Dupire. 2020. "Fire Activity in Mediterranean Forests (The Algerian Case)" Fire 3, no. 4: 58. https://0-doi-org.brum.beds.ac.uk/10.3390/fire3040058