Evaluating Socioecological Wildfire Effects in Greece with a Novel Numerical Index


1
Department of Geography, University of the Aegean, University Hill, Mytilene, 81100 Lesvos Island, Greece
2
USDA Forest Service, Rocky Mountain Research Station, 3200 SW Jefferson Way, Corvallis, OR 97331, USA
*
Author to whom correspondence should be addressed.
Fire 2020, 3(4), 63; https://doi.org/10.3390/fire3040063
Submission received: 21 October 2020
/
Accepted: 3 November 2020
/
Published: 6 November 2020
Abstract
:Large-scale wildfires have become more frequent in Greece and coupled with the country’s limited economic resources, investments in both pre-fire planning and post-fire rehabilitation for most affected areas are not feasible. From the perspective of forest and fire management agencies, the severity and importance of fire effects are evaluated based only on total area burned, while from a societal standpoint, by the number of fatalities and destroyed houses. A holistic approach to rank wildfires with an inclusive assessment of all their effects is missing. We developed a new evaluation and ranking index based on expert judgment, the study of 50 large-scale fire events in Greece and a detailed review of the literature, to develop a set of categories and criteria to assess ecological and socioeconomic effects of wildfires. The Fire Inventory and Ranking of Effects (FIRE) Index provides a comprehensive and easy-to-use semi-numeric framework that combines scores from seven fire effects categories and 56 criteria through a user-friendly web-platform. The seven categories include fire effects on landscape and vegetation, general environmental impacts, regeneration potential and vegetation recovery, casualties and fatalities, destruction and damages to infrastructure, economic losses, and firefighting and wildfire suppression. Each of the 56 criteria within these categories describes a different anticipated fire effect. The magnitude of each fire effect criterion is estimated by predefined ranked choices by one or more persons/assessors in a multi-level evaluation procedure. We apply the FIRE Index assessment to a significant 5900-ha wildfire that occurred in 2011 in northern Greece, including a sensitivity analysis of how different category weights impact the final index score. More diverse metrics to assess wildfire effects will help address the complex social and biophysical dimensions of the wildfire governance challenge and help guide pre- and post-fire management actions.

1. Introduction
As wildfires become more frequent and larger, and burn at higher intensities, their effects on natural and human systems have also amplified [1,2]. Across Europe and elsewhere, the most common way to assess wildfire severity is by estimating the final burned area, but this information alone tells us little about suppression costs, economic losses, ecosystem dis-services and the loss of landscape aesthetics. Given the growing wildfire problem, re-examining how we assess wildfire effects is needed. Measures of wildfire policy success must be expanded in most cases, from targets emphasizing only reductions in area burned to metrics more closely related to reducing negative fire impacts including the use of multi-dimensional and socioecological components, to provide a more diverse and useful assessment of fire impacts than a single and limiting statistic such as burned area [3].
In Greece, government agencies in charge of post-fire rehabilitation seem to have difficulty incorporating diverging information on area burned and the consequences of fire location and severity, such that a low consequence event with a high burned area is given equal consideration in post-fire governance as a smaller fire with high levels of impact. If land management agencies could reliably assess what really happened during fire propagation, and predict short-term post-fire conditions, they could rank and prioritize post-wildfire mitigation investments. This is especially important in places such as Greece and elsewhere, where post-fire rehabilitation funding is limited due to economic constraints. However, we lack an accepted methodology on how to evaluate and prioritize post-wildfire investments based on the importance of fire effects, whether they are detrimental or beneficial. In addition, knowing where to expect a wildfire, especially those that will cause the greatest impact, or have the most complex firefighting or suppression histories, can help public agencies to prioritize preemptive actions to mitigate the effects from a potential event and provide much needed decision support.
In general, the effects of a hazardous event span both environmental and socioeconomic conditions [4] including property damage, lost value of disrupted activities, emergency response expenses, cost of recovery, morbidity and mortality, environmental effects, and cultural and historical effects. Wildfire effects apply to all these groups, producing large costs from firefighting and prevention efforts, post-fire landscape rehabilitation, repairs of affected houses and infrastructure, and economic compensation that burden the national budgets of all fire affected countries [5,6]. Wildfires also accelerate phenomena such as erosion, desertification, land use changes, species extinction, degradation of the natural environment and air quality [7,8,9], which require mitigation investments to moderate their negative impacts.
Developing assessment methodologies that can include this wide diversity of effects, which vary both spatially and temporally, is critical to informing a robust fire and forest management decision support system aligned with ecological and socioeconomic realities. For example, McFayden et al. [10] developed a modelling framework for Canada to spatially score the impacts from wildland fire effects on specific resources and assets using social, economic, and emergency response fire impact categories. Previous research efforts from Scott et al. [11] created a spatial framework for fire effects analysis that captures both fire-related benefits and losses quantified in terms of value change. Kaloudis et al. [12] created a composite index to assess fire destruction danger by considering the probability of fire incidence, fire severity, fire severity levels, values threatened and the fire sensitivity of values, using hierarchically structured rules.
There are several approaches to estimate the magnitude of individual fire effects, each with specific challenges, shortcomings, temporal and spatial scales, time, and financial requirements. For example, burn severity is a time- and cost-efficient method to estimate or predict some of the first-order fire effects on ecosystem properties and services. Recently (ca. 2005), the Monitoring Trends in Burn Severity (MTBS) program started to consistently map burn severity and perimeters of large fires across the United States, using satellite images to produce a map with four burn severity classes [13]. Currently, there is not yet an official European or Greek public program to consistently map burn severity with fine spatial resolution.
First-order fire effects, which concern the direct or immediate consequences of the combustion process, such as biomass consumption, crown scorch, bole damage, and smoke production, form an important basis for predicting secondary effects [14,15]. There is extensive literature on how these first-order fire effects can be estimated, including their impacts on animals, vegetation and soils [16,17,18,19], and specialized software can spatially estimate these effects with a minimum set of inputs [14,20]. Secondary fire effects include tree regeneration, plant succession and changes in site productivity, but require accurate estimation of first-order fire effects and involve interactions with many other non-fire variables, such as weather or human interference in the affected area, and may take place a few hours to many decades after a fire [15].
Despite all this progress in the assessment of first-order effects, the application of these methods to each fire requires an investment in personnel (training and time) and data (preparation of inputs), which seems unlikely to occur in the short term in Greece. In addition, it is unclear how second-order effects can be accurately estimated or predicted in a timely process (six months to two years after the fire), and thus requires inference from past fire occurrence and expert knowledge on the affected area.
We developed a Fire Inventory and Ranking of Effects (FIRE) Index to provide a comprehensive and easy-to-use semi-numeric framework for fire effects-based decision support that can be used to achieve three goals: (1) prioritize post-fire mitigation actions and investments, (2) provide a systematic assessment of past large-scale fire event resource and mobilization needs to improve fire management decision support for future fire events, and to help guide investments in fire prevention for the most problematic areas, and (3) promote community learning by objectively informing the public and policymakers about the socioeconomic impacts of each fire to prevent misinformation, and guide fire adaptation actions to enhance community resilience.
The FIRE Index allows the classification of each wildfire event based on evaluations of a suite of fire effects criteria, grouped into ecological and socioeconomic fire effects categories, combined in a single score that can easily inform and educate the public on whether a hazard has become a disaster by causing large-scale consequences, regardless of wildfire size. In addition to the overall FIRE Index score, individual category scores can guide specific pre-fire planning and post-fire policies. A more systematic and diverse assessment of large fire events can better reflect the complex social and biophysical dimensions of wildfire effects and help improve pre- and post-fire management.
2. The FIRE Index
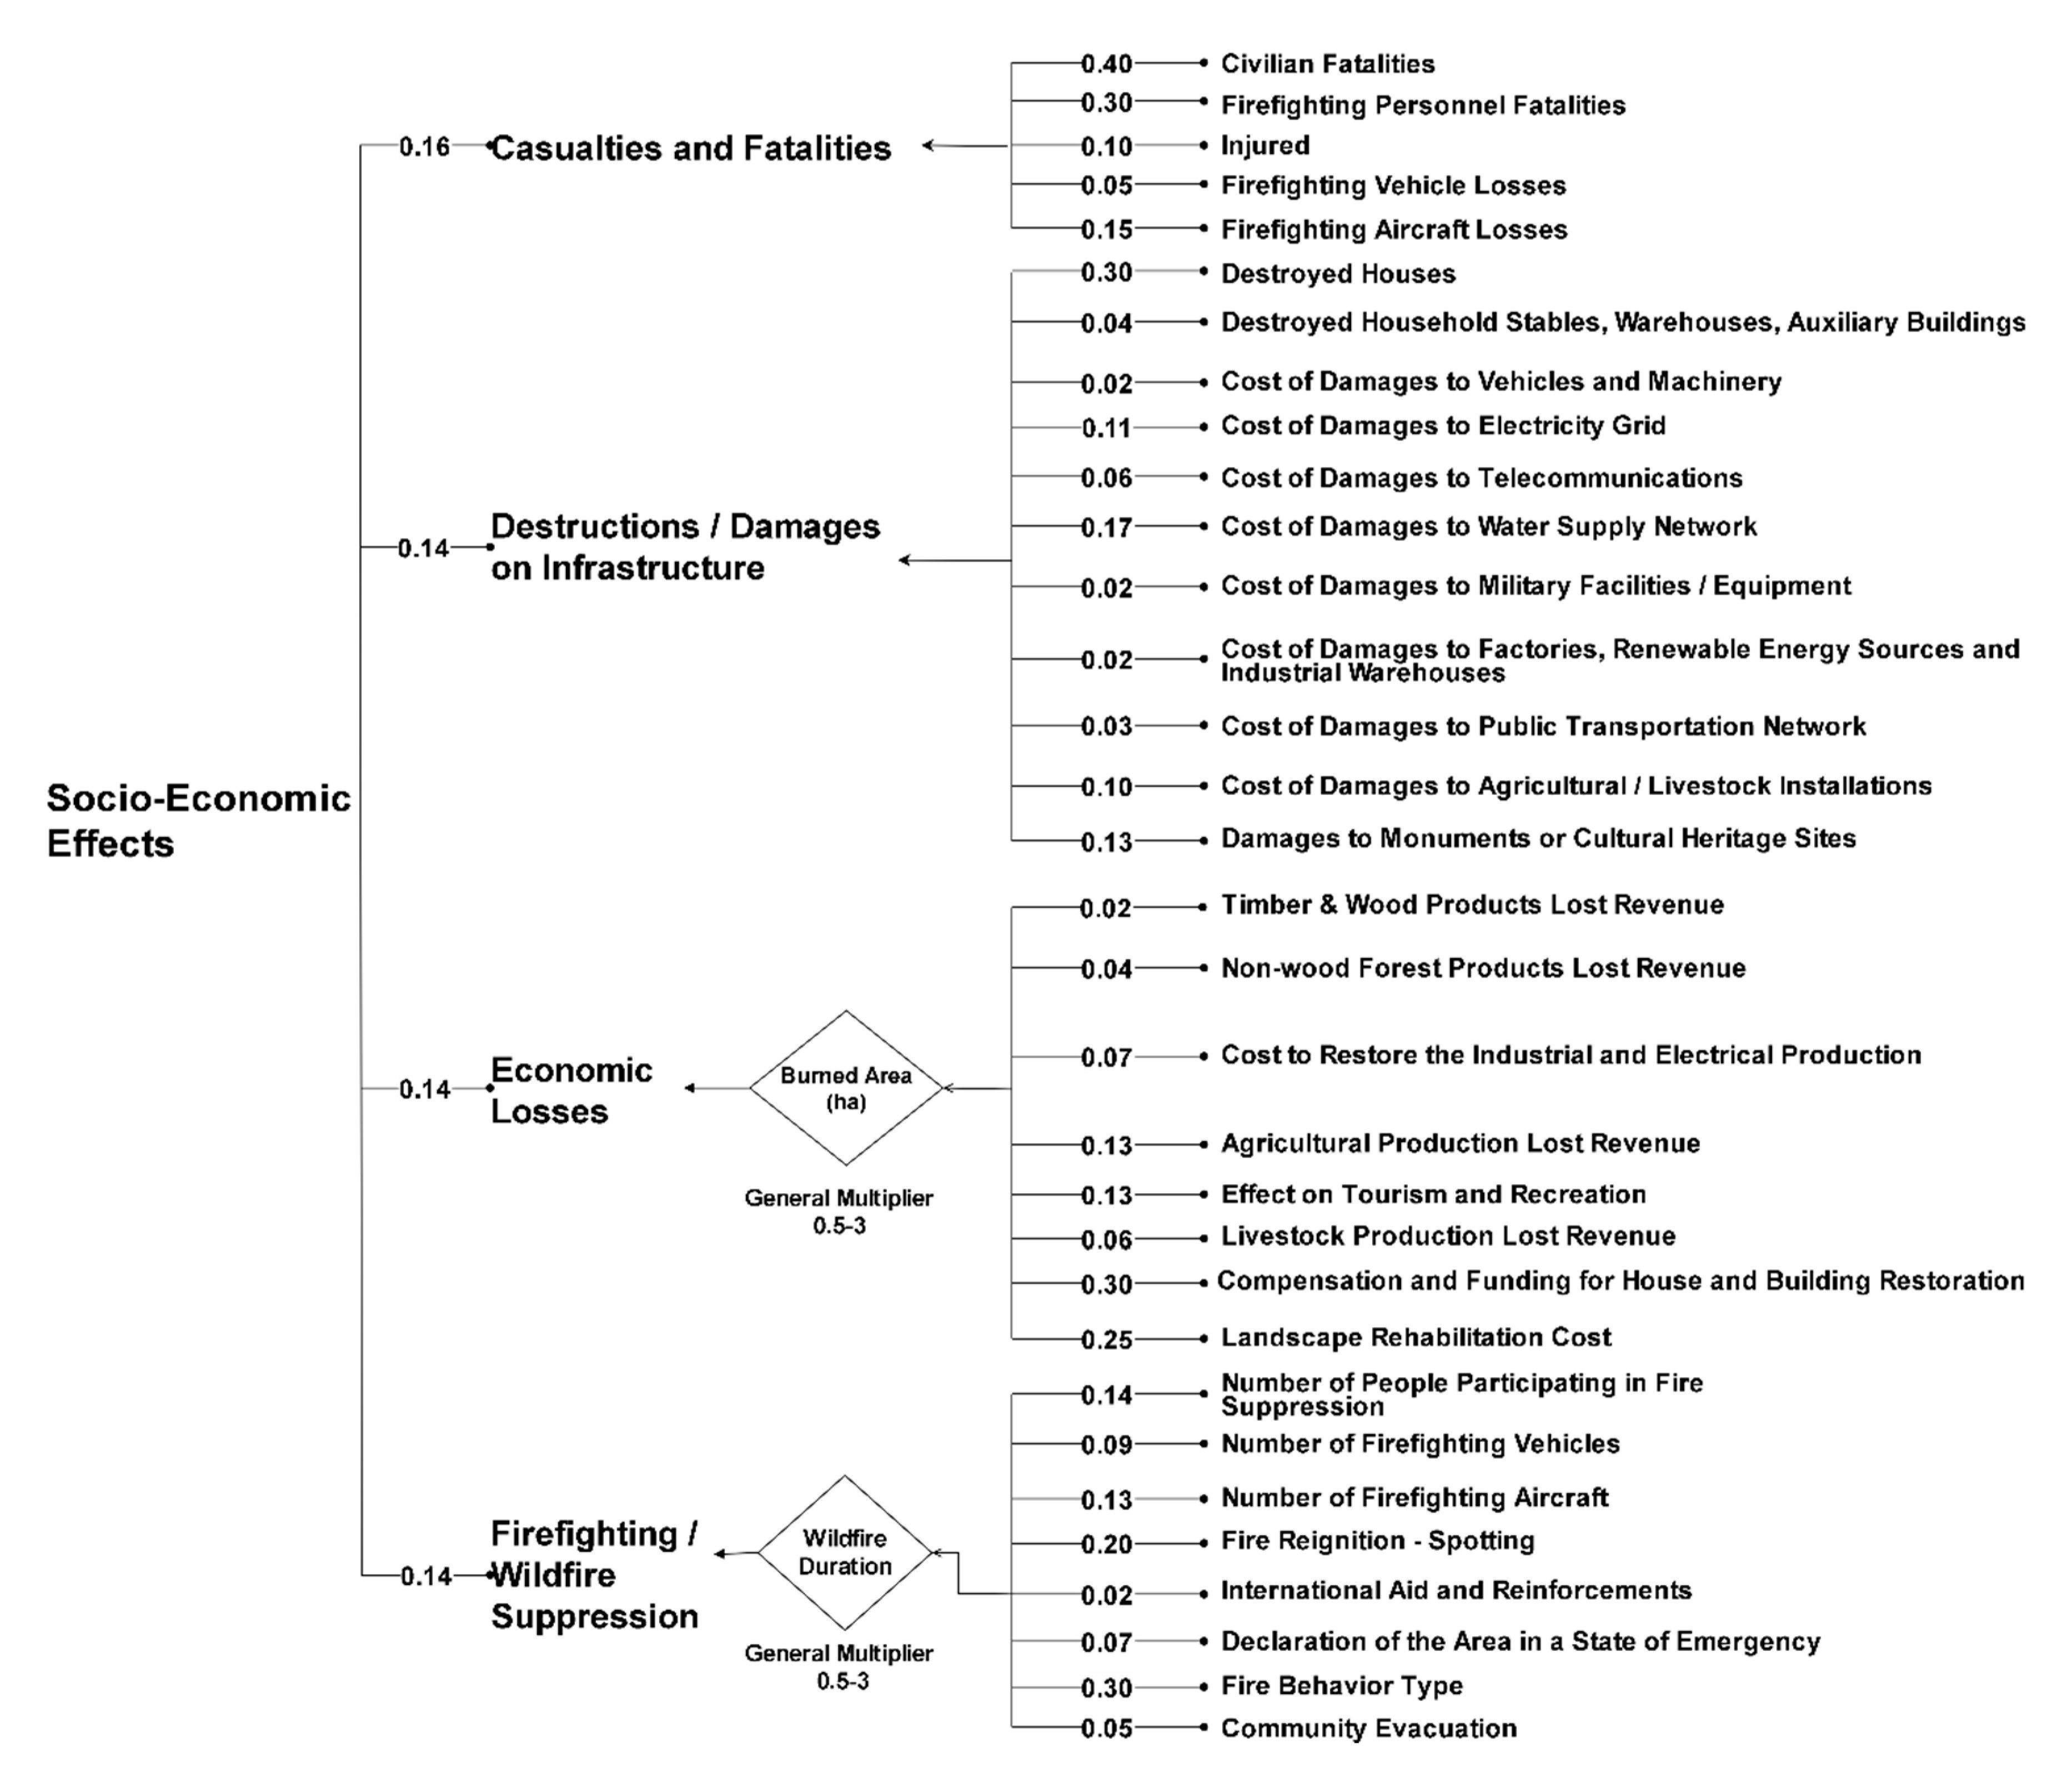
The FIRE Index was designed to assess environmental and socioeconomic fire effects including firefighting and suppression resources. The index is country specific, designed exclusively for the assessment of fire effects in Greece and only for large-scale wildfires (>100 ha; on average 20 incidents per year). It was designed as an easy-to-use semi-numeric framework. The index includes two broad groups of effects: environmental fire effects (Figure 1) and socioeconomic fire effects (Figure 2). Within these two broad groupings, effects are grouped into seven categories: (1) landscape and vegetation, (2) general environmental impacts, (3) regeneration potential and vegetation recovery, (4) firefighting and wildfire suppression, (5) causalities and fatalities, (6) destruction and damages to infrastructure and (7) economic losses.
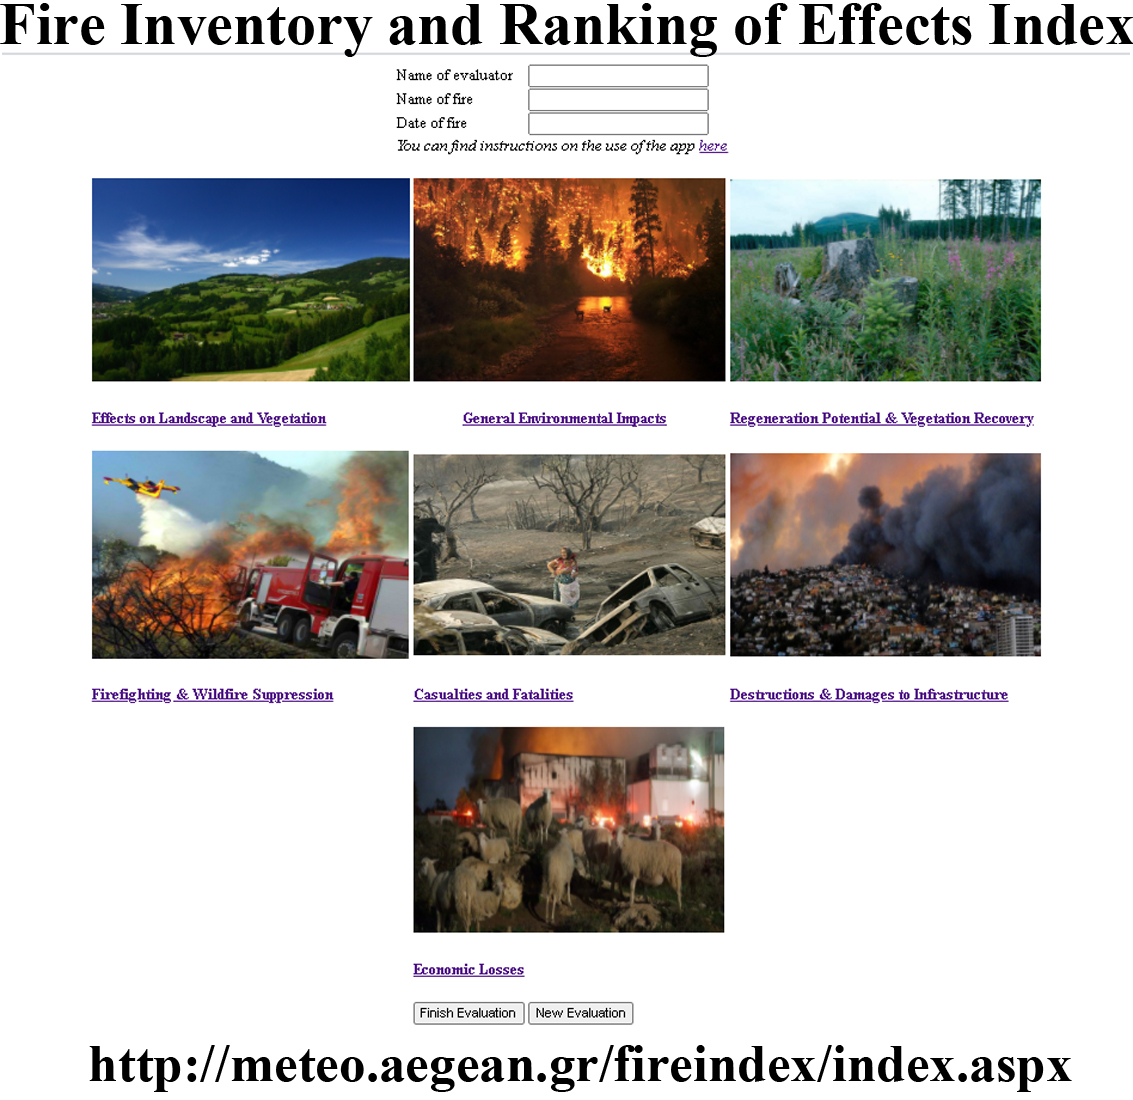
The groups contain a total of 56 criteria developed based on a rigorous review of 50 wildfires in Greece (1974–2019), and a detailed review of the relevant Greek and international literature (>150 published studies; as well as from expert knowledge. Each criterion has its own set of choices, defining the magnitude of fire effects for a given wildfire event on a scale of 0 (no effect) to 100 (high effect). A web application was built to automate the calculation process of the final FIRE Index score, as well as to report the values of each fire effect category, and can be accessed at http://meteo.aegean.gr/fireindex/index.aspx (see also the available web user manual for additional details on how to complete the assessment).
2.1. Fire Effects Categories and Criteria
2.1.1. Effects on Landscape and Vegetation
Wildfire effects within the landscape and vegetation category were assessed based on five criteria (Table 1; Appendix A Table A1), describing the impact a fire can have on how societies perceive and interact with the landscape, vegetation and natural environment, covering issues such as aesthetics, smoke impacts and air quality and land degradation. Wildfire smoke inhalation is known to cause and exacerbate a wide range of human health problems, including asthma, emphysema, and heart disease [21].
Post-fire recreation and aesthetic losses include recreational activity decline, degradation of scenic values, compromised hunting, fishing, hiking, camping, and wildlife viewing experiences, recreation-related structural repair or rehabilitation, and reduced business income, jobs, and tax revenues [21]. Since human responses to the environment are shaped partially by aesthetic experiences, the appearance of ecological phenomena may influence people’s opinions and attitudes and translate into decisions and actions [22]. Under the theory of people–place relationships, which examines the interaction of physical attributes, conceptions, and activities [23], people understand the aesthetics of mountainous ecosystems and wildland–urban interface areas as a sign of good ecological management. The wildland–urban interface is of the highest importance from a societal standpoint and its expansion in forested lands, with a parallel increase in wildfire size and number, has made homeowners savvy observers of landscape conditions, which act as “feedbacks” that enhance homeowners’ concerns about wildfire hazards and motivate them to take mitigative action [24].
Other criteria describe the vegetation types that were affected and are assessed based on dominant vegetation types or landscape categories or the proportion of the landscape in dominant types. When the dominant land use or land cover type is forest, it is considered of higher importance especially when the forest is comprised of rare conifer or broadleaf species that require decades to regenerate and re-establish in the affected area. If the affected area is under legal protection status it can further indicate the importance of fire effects. Examination of historical fires in Greece showed increased firefighting resources when old growth forests or national parks were threatened. For example, the lake or seashore forests that are part of the NATURA 2000 network of protected areas, while covering a relatively small area, provide important ecosystem services such as flood protection, water purification, recreation and soil stabilization, and provide habitats for numerous flora and fauna species. Old-growth forests, such as the Frakto Virgin forest in northern Greece, protect a unique assemblage of mixed deciduous and coniferous montane species including some of the southernmost autochthonous populations of spruce (Picea abies) in Europe. Important ecosystem services are provided by the 19 Greek recreational forests, while the 25 National Parks and Forests cover approximately 1.5 million ha, each with unique ecological value with millions of visitors each year. Aside from protected forested types, the literature clearly identifies the importance of the criteria included in this category (Table 1).

Table 1.
Relative importance, assessment scale and relevant literature for each criterion for the effects on landscape and vegetation fire effects category.
Table 1.
Relative importance, assessment scale and relevant literature for each criterion for the effects on landscape and vegetation fire effects category.
| Criterion | Contribution to the FIRE Index Score (%) | Relative Importance | Assessment Scale | References |
|---|---|---|---|---|
| Ecosystem location/type | 7.34 | Mountainous and wildland urban interface ranked highest | Dominant type of the affected landscape | [22,24,25,26,27,28,29,30] |
| Dominant land use/land cover type | 1.88 | Higher elevation conifer and cold climate broadleaf forests ranked highest | Portion of landscape relative to dominant species type | [31,32,33,34,35,36,37,38,39,40] |
| Protected forested area type | 1.15 | Old-growth and national parks weighted highest, with recreational areas also considered | Landscape-level ratio of protected to non-protected | [41,42,43,44,45,46] |
| Air quality and smoke impacts | 0.46 | Smoke impacts or visibility reduction in proximity to populated large areas weighted higher than lower or no impacts on population | Broad landscape categories | [47,48,49,50,51,52,53,54] |
| Probability of land degradation, erosion, and soil loss | 3.17 | The higher the proportion of any of these categories, especially associated with high burned area proportion, the higher the weight | Proportion of landscape relative to burned area | [55,56,57,58,59,60,61,62,63,64] |
2.1.2. General Environmental Impacts
Wildfire effects on fauna and flora, environmental quality and biodiversity are assessed based on eight criteria (Table 2; Appendix A Table A2). In addition to the landscape aesthetic changes or the burning of the dominant vegetation types, wildfires affect the general environment where animal and plant species develop, survive, compete, and cooperate. Plant and animal responses can be classified based on the strategies they use to respond to fire, which include resistance, refugia, avoidance, dormancy, recolonization, crypsis and intolerance [65]. The effects of fire on their habitats and populations vary across species based on the success of their fire response strategies.
The relative importance of all criteria was weighted based on broad loss categories, while the assessment scale was based on broad landscape categories. The losses (if any) of important fauna habitats for five criteria (insects and invertebrates, small mammals/reptiles, fish, birds, and large-size mammals) are included. The habitats of many of these species will be affected, during and after the fire, and negative (or positive) impacts can occur on species populations. In Greece, there are numerous endemic flora species (16% of all known species), while 473 species are vulnerable to extinction [39,66]. Regarding alien plant species, some increase fire activity such as Eucalyptus spp., while Opuntia spp., Centaurea maculosa and Acacia saligna reduce fire spread rate and intensity [67].
Table 2.
Relative importance, assessment scale and relevant literature for each criterion for the general environmental impacts fire effects category.
Table 2.
Relative importance, assessment scale and relevant literature for each criterion for the general environmental impacts fire effects category.
| Criterion | Contribution to the FIRE Index Score (%) | Relative Importance | Assessment Scale | References |
|---|---|---|---|---|
| Insect and invertebrate habitat losses | 2.13 | Weighted based on broad loss categories | Broad landscape categories | [68,69,70,71,72,73,74] |
| Small sized mammal/reptile habitat losses | 1.56 | Weighted based on broad loss categories | Broad landscape categories | [70,75,76,77,78,79,80,81,82,83] |
| Fish habitat losses | 0.37 | Weighted based on broad loss categories | Broad landscape categories | [84,85,86,87,88,89,90,91,92,93] |
| Bird habitat losses | 3.06 | Weighted based on broad loss categories | Broad landscape categories | [70,94,95,96,97,98,99,100] |
| Large sized mammal habitat losses | 0.66 | Weighted based on broad loss categories | Broad landscape categories | [70,76,101,102,103,104] |
| Losses of Important/Rare Flora Habitats | 4.29 | Weighted based on broad loss categories | Broad landscape categories | [66,105,106,107] |
| Threat from Alien Species/Changes in Species Composition (Flora) | 1.07 | Weighted based on broad change categories | Broad landscape categories | [67,104,108,109,110,111,112,113] |
| Threat from Alien Species/Changes in Species Composition (Fauna) | 0.86 | Weighted based on broad change categories | Broad landscape categories relative to the proportion of reserve area | [114,115,116,117,118] |
2.1.3. Regeneration Potential and Vegetation Recovery
Wildfire effects on regeneration potential and vegetation recovery include fire history, pre-fire landscape and vegetation conditions, soil type and human pressures on the affected area, with 11 criteria (Table 3; Appendix A Table A3). This category incorporates both positive and negative effects of wildfire. For example, fires in predominantly older fire-adapted conifer stands receive a very low value, as older cone bearing trees will survive fire directly or via refugia and provide the opportunity for regeneration and improvement of overall forest health [119,120,121]. The age of conifer species that existed in the area prior to the fire (if present) is included, as well as the age of broadleaf/evergreen shrublands. Regeneration within younger conifer forests is more difficult as reproductive maturity is not reached until five years of age for low-elevation conifer species and 15 years for cold-tolerant conifer species [120,121,122,123], as well as older (or very young) broadleaf forest/evergreen shrublands [124,125]. For these two criteria, it is important to consider the average age of the dominant vegetation types across the whole burned area.
The topography of the area in terms of slope also impacts the magnitude of fire effects [126,127], and thus information about the portions of the landscape that have a certain slope are considered in the index. It is assumed that the more rugged the landscape and the higher the slope, the lower the likelihood of successful regeneration. Additionally, grazing limits the conditions for potential successful vegetation regeneration [128,129].
Recent fire activity is an important parameter that has a substantial effect on regeneration. Research has shown the probability of successful regeneration increases for longer fire return intervals [130]. Frequently, post-fire vegetation recovery is dependent on unburned forest patches and individual trees, providing a seed bank to colonize and repopulate the burned area. More dispersed and abundant unburned patches lead to more successful regeneration [131,132]. Illegal activities that may cause land use changes or modify formerly vegetated areas can have a substantial negative effect, (e.g., illegal logging, construction of buildings, roads and houses, conversion of forests into agricultural lands, etc.) [133]. Human influence can also impact fire effects through urban or tourism pressures, such as frequent tourism trips into burned forests and recreational activities [134], usually into the wildland–urban interface [135].
Fire smoldering can cause serious implications for vegetation recovery, mainly by modifying significant soil properties that prevent seeds from germinating or resprouting [136]. Disease outbreaks or the expansion of harmful insect populations can have negative impacts on surviving vegetation [137,138]. Often, seeds and genetic material are transferred to nearby burned areas, colonizing the landscape and reestablishing vegetation. If surviving areas or individual large trees are negatively affected by fire, then forest regeneration processes can be halted or lead to changes in vegetation type [139].
Finally, soil type plays an important role in resprouting and seed germination capacity. Deep soils with small amounts of rocks are preferable for regeneration compared to shallow skeletal soils (steep slopes or exposed parent material) [140,141,142]. This category also includes a metric similar to the Composite Burn Index from Key and Benson [143], which assessed the percentage of burned, scorched and unburned vegetation (black, brown and green) of the overstory vegetation, used as a general multiplier in the category (see Section 2.2.3).
Table 3.
Relative importance, assessment scale and relevant literature for each criterion for the regeneration potential and vegetation recovery fire effects category.
Table 3.
Relative importance, assessment scale and relevant literature for each criterion for the regeneration potential and vegetation recovery fire effects category.
| Criterion | Contribution to the FIRE Index Score (%) | Relative Importance | Assessment Scale | References |
|---|---|---|---|---|
| Conifer forest age | 1.41 | Regeneration more difficult in younger forests | Age at stand level | [119,120,121,123,144,145,146] |
| Broadleaf/evergreen shrubland forest age | 1.09 | Regeneration more difficult in older or very young forests | Age at stand level | [147,148,149,150,151,152] |
| Slope (°) | 2.25 | Lower likelihood of successful regeneration in more rugged (steep) landscapes | Portion of landscape in slope category | [59,126,127,153,154,155] |
| Recent fire activity | 1.77 | Higher regeneration success with longer fire return intervals | Broad landscape categories | [156,157,158,159,160] |
| Unburned forest patches and individual trees | 0.33 | Higher regeneration success in more dispersed and abundant unburned patches (fire refugia), thus the lower the weight | Broad landscape categories | [131,161,162,163,164,165] |
| Grazing/browsing threat | 3.63 | The higher the grazing frequency or rate, the lower the regeneration success | Amount of livestock within or near burned area | [128,152,166,167] |
| Illegal activities/land use changes | 1.51 | The higher the level, estimated from pre-fire conditions, the greater the weight | Broad landscape categories | [133,168,169,170] |
| Urban/tourism pressure | 0.66 | The higher the level, estimated from pre-fire conditions, the greater the weight | Broad landscape categories | [64,134,135,171] |
| Smoldering | 0.37 | Negative effects on soil properties decrease seed germination and resprouting | Broad landscape categories | [136,172,173,174] |
| Threat from insects and disease | 0.16 | Negative effect on surviving vegetation | Broad landscape categories | [138,139,175,176,177,178,179] |
| Soil type | 0.81 | Deeper soils more correlated with successful regeneration of vegetation than skeletal soils | Proportion of landscape in broad categories relative to proportion of burned, scorched or unburned area | [141,142,180,181] |
2.1.4. Firefighting and Wildfire Suppression
The evaluation of firefighting activities and the implemented wildfire suppression strategy to infer operational costs (i.e., equipment and machinery wear, fuel, and logistics) includes eight criteria (Table 4; Appendix A Table A4). These criteria aid in evaluating the extent and complexity of firefighting. The fire behavior type, both duration and area affected, can be derived from observations, remote sensing products or from the firefighting personnel. Higher intensity fires with crown fire activity are considered the most difficult to suppress, while surface fires are usually those with the highest early response and suppression effectiveness [182]. The extent of spotting or fire reignition, i.e., when a flaming fire rekindles through the smoldering-to-flaming transition of an undetected smoldering fire or glowing embers [183], reflects the difficulty of successfully containing the fire [184].
Counts of the number of people, vehicles and aircraft that participated during firefighting operations all indicate suppression difficulty and complexity. The available choices were derived from Greek Fire Service historical data and records for the period 2000–2019 [185] and are in proportion to fire severity and suppression costs, i.e., the higher their number, the higher the costs and fire severity (see Supplementary Table S1).
International aid and reinforcements of personnel, vehicles, and aircraft, as well as the declaration of the affected area as in a state of emergency, or the need to evacuate communities are other important indicators of wildfire suppression difficulty, as well as associated costs [186]. The European Union through the rescEU Civil Protection Mechanism has the objective of enhancing both the protection of citizens from disasters and the management of emerging risks, supporting member states by co-financing the development of rescEU capacities, including their rental, leasing or acquisition of firefighting means. Fire duration can also amplify suppression resource expenditures as indicated from historical Greek Fire Service records.
Table 4.
Relative importance, assessment scale and relevant literature for each criterion for the firefighting and wildfire suppression fire effects category.
Table 4.
Relative importance, assessment scale and relevant literature for each criterion for the firefighting and wildfire suppression fire effects category.
| Criterion | Contribution to the FIRE Index Score (%) | Relative Importance | Assessment Scale | References |
|---|---|---|---|---|
| Fire behavior type | 4.19 | Active crown fire weighted higher than passive or surface | Broad landscape categories | [136,182,187,188] |
| Fire reignition—spotting | 2.81 | The higher the spotting and reignition the higher the weight | Broad landscape categories | [189,190] |
| Number of people participating in fire suppression | 1.91 | The higher the number the higher the weight | Broad incident categories | Table S1; [36,191] |
| Number of firefighting vehicles | 1.22 | The higher the number the higher the weight | Broad incident categories | Table S1; [36,191] |
| Number of firefighting aircraft | 1.80 | The higher the number the higher the weight | Broad incident categories | Table S1; [36,191] |
| International aid and reinforcements | 0.34 | Aircraft weighted higher than vehicles or personnel | Broad incident categories | [186] |
| Declaration of the area in a state of emergency | 1.01 | Binary with yes weighted higher | Yes/No | [192] |
| Community evacuation | 0.73 | The higher the number the higher the weight | Broad incident categories relative to fire duration | [36,191] |
2.1.5. Casualties and Fatalities
The main operational priority for most firefighting agencies across the world is focused on the protection of civilian and personnel lives, followed by the protection of firefighting infrastructure, private and public property, and the natural environment. The relative importance of all criteria was weighted based on raw values (e.g., the higher the number of firefighter vehicle losses, the higher the weight), while the assessment scale was based on broad incident categories.
Societies often evaluate the importance of a wildfire from the number of fatalities it has caused and the total burned area [193]. Thus, a category with criteria able to estimate what has happened in terms of casualties is extremely important. This category determines the human death toll caused by the fire, along with the number of injured individuals and the number of destroyed firefighting vehicles and aircraft. It is composed of five criteria—three of them describe fire effects on human lives, and two on firefighting vehicle and aircraft losses [194] (Table 5; Appendix A Table A5). In addition, the destruction of firefighting aircraft decreases the future operational capabilities of the Greek Fire Service, and thus lowers the probability of successful containment of current and future fires.
The choices for each criterion were derived from historical fire records (see Supplementary Material, Tables S2 and S3). Historical data indicate that from a single fire event, firefighting personnel losses reached a maximum of four fatalities in 1998 in Karea in the Attica fire, while the highest number of civilian fatalities occurred in 2018 in Mati, also in the Attica fire, with 102 deceased and 31 injured. It is more common to have destroyed firefighting vehicles compared to aircraft (maximum two aircraft in a single year—ca. 2000), but the impact of a lost aircraft on suppression capabilities is greater.
2.1.6. Destruction and Damages to Infrastructure
This category is composed of 11 criteria and estimates the magnitude of destruction and damages caused by a fire event on property, public infrastructure, monuments, and capital (Table 6; Appendix A Table A6). Peri-urban communities in fire-prone regions around the world are at increasing risk from unplanned fires (wildfires) because of population growth and climate change [200]. The potential consequences of these factors were illustrated by major wildfires in southern Greece in 2007, with 847 houses completely destroyed and 672 damaged, 41 public buildings completely destroyed and 817 destroyed household stables, warehouses, or auxiliary buildings [201]. Close to the Greek capital Athens, from a single event (i.e., Mati fire) in 2018, 835 houses and more than 250 vehicles were destroyed or damaged with a cost exceeding EUR 1.5 million [202].
Post-fire monument and cultural heritage losses include heritage site rehabilitation and repair costs, devaluation of cultural and spiritual assets, the loss of traditional uses and heritage, lost research opportunities to gather limited and fragile information, and heritage-related business, job, and tax revenue declines [21,203]. Recent examples of World Heritage monuments affected by wildfires in Greece include the archaeological sites of Olympia and Mycenae during the 2007 and 2020 fire seasons, respectively. The cost of damages to the electricity grid can result from transmission line shutdowns and resultant loss of metered power sales, destruction and damage to energy production and transmission systems, and loss of biomass energy supplies [21,204].
In Greece, it is common for greenhouses and agricultural installations to be damaged or destroyed due to their location in the rural interface, even from smaller scale and lower intensity fire events. During the prefecture of Ilia fire in 1998, 85 livestock buildings were destroyed. The large dispersal of military equipment, facilities and weapons across the Greek landscape increase the accident risk, and although all necessary fire protection measures are applied, it is expected that in the case of an accident the cost will be very high. Damage to the telecommunication grid is rare due to frequent fuel management around installations and the wireless nature of the grid; however, it has been an important fire effect globally. Wildfire related damages to factories, renewable energy sources and industrial warehouses are also rare, but would be highly costly if they occur. Finally, damage to water supply networks have been documented for the majority of fire events since the network is extensive and the water transfer tubes are made of plastic, with networks extending to remote areas and in contact with vegetation.
Table 6.
Relative importance, assessment scale and relevant literature for each criterion for the destruction and damages to infrastructure fire effects category.
Table 6.
Relative importance, assessment scale and relevant literature for each criterion for the destruction and damages to infrastructure fire effects category.
| Criterion | Contribution to the FIRE Index Score (%) | Relative Importance | Assessment Scale | References |
|---|---|---|---|---|
| Destroyed houses | 4.17 | The higher the number the higher the weight | Broad incident categories | [36,191] |
| Destroyed household stables, warehouses, or auxiliary buildings | 0.58 | The higher the number the higher the weight | Broad incident categories | [36,191] |
| Damage to monuments or cultural heritage sites | 1.86 | World Heritage Sites weighted higher than historic or recent monuments | Broad landscape categories | [203,205] |
| Cost of damages to vehicles and machinery | 0.24 | The higher the cost the higher the weight | Broad incident categories | [36,191] |
| Cost of damages to electricity grid | 1.55 | The higher the cost the higher the weight | Broad incident categories | [204,206,207] |
| Cost of damages to telecommunications | 0.83 | The higher the cost the higher the weight | Broad incident categories | n/a |
| Cost of damages to water supply network | 2.42 | The higher the cost the higher the weight | Broad incident categories | [208,209] |
| Cost of damages to public transportation network | 0.45 | The higher the cost the higher the weight | Broad incident categories | [52,199,210,211] |
| Cost of damages to military facilities/equipment | 0.24 | The higher the cost the higher the weight | Broad incident categories | n/a |
| Cost of damages to factories, renewable energy sources and industrial warehouses | 0.33 | The higher the cost the higher the weight | Broad incident categories | n/a |
| Cost of damages to agricultural/livestock installations | 1.33 | The higher the cost the higher the weight | Broad incident categories | [212] |
2.1.7. Economic Losses
Wildfire effects on economic losses account for changes that are expected to occur to local or regional economies, emphasizing the market price drop of some valued items/products, the inability to produce or collect them and the amount of money that will be spent to restore or compensate for lost productivity [213,214]. Estimates of the relative cost of post-fire landscape treatment investments that will be applied to the affected area, and the cost of anticipated rehabilitation investments and future economic losses are important wildfire effects and can vary substantially across events. This category is composed of eight criteria (Table 7; Appendix A Table A7).
Timber production and wood harvesting practices in the affected area, and whether the area was under management status with frequent or scheduled timber harvests, are indicators of probable economic losses. Several industries as well as private individuals utilize non-timber forest products, such as game, honey production, resin extraction, pharmaceutical products, wild food, etc., developing small scale local or regional economies around these activities. In Greece, it is very common for a wildfire to cause negative impacts to agricultural and livestock production [9,168], usually through losses directly from fire (animal deaths, burning of crops or orchards, destruction of infrastructure such as greenhouses, etc.).
The FIRE Index also considers the cost of possible compensation and future revenue losses due to destruction of resources (e.g., in case of destroyed orchards). To restore industrial and electricity production, or to repair infrastructure and public property, compensation or funding must be paid from state or insurance companies, otherwise negative effects balloon across communities. The same principle also applies for houses and buildings. To evaluate fire effects on tourism and recreation, aesthetic resources, and tourism infrastructure potential and the kind of recreational activities that take place in the broader affected landscape are critical elements to consider [134]. A link must also be established between the real estate value of the burned area and its importance for tourism purposes, along with the predicted revenue losses. Finally, the cost of landscape rehabilitation investments that are expected to be applied to the affected area are included in the index. Usually, their type and extent depend on resources the state is willing to allocate [215].
Table 7.
Relative importance, assessment scale and relevant literature for each criterion for the economic losses fire effects category.
Table 7.
Relative importance, assessment scale and relevant literature for each criterion for the economic losses fire effects category.
| Criterion | Contribution to the FIRE Index Score (%) | Relative Importance | Assessment Scale | References |
|---|---|---|---|---|
| Timber and wood products lost revenue | 0.26 | The higher the losses the higher the weight | Broad landscape categories | [5,207,216,217] |
| Non-wood forest products lost revenue | 0.55 | The higher the losses the higher the weight | Broad landscape categories | [218,219] |
| Agricultural production lost revenue | 1.85 | The higher the losses the higher the weight | Broad landscape categories | [212] |
| Livestock production lost revenue | 0.92 | The higher the losses the higher the weight | Broad landscape categories | [212] |
| Cost to restore industrial and electricity production | 0.92 | The higher the losses the higher the weight | Broad landscape categories | [204,220] |
| Compensation and funding for house and building restoration | 4.18 | The higher the losses the higher the weight | Broad landscape categories | [207,221,222,223,224] |
| Effect on tourism and recreation | 1.85 | Forested area use weighted higher than scenery, ocean tourism and non-tourist areas | Broad landscape categories | [31,225,226] |
| Landscape rehabilitation cost | 3.47 | The higher the scale of loss the higher the weight | Broad landscape categories relative to the area of the landscape burned | [63,227] |
2.2. FIRE Index Design
The conceptual design and implementation of the FIRE Index was inspired by three distinct ranking approaches: (1) a methodology used to estimate and assess burn severity and first-order fire effects in the field (Composite Burn Index, CBI) from Key and Benson [143]; (2) the ranking of academic institutions across the globe (The World University Rankings from Thomson Reuters) [228]; and (3) the Global Competitiveness Index (GCI—version 4.0) [229,230]. These three examples of indexing and ranking are applications of general methodological innovations that were incorporated into the FIRE Index methodology, namely the evaluation of preselected choices from CBI, and the varying weighting of different categories and indicators to describe their contribution to the final index score from The World University Rankings and GCI.
The CBI attempts to assess how ecologically significant the consequences of a given fire are, or how much fire has altered the biophysical conditions of a site, by providing a numeric scale for gauging such changes. CBI uses field observations to capture the magnitude of fire effects combined across all vegetation strata per sample area, by evaluating independently each stratum by several criteria and giving a rating falling between zero and three on a set of preselected choices positioned on that scale, spanning the possible range of fire severity between unburned and highest burn effects. All vegetation strata have equal contribution to the final CBI score. However, given the CBI approach equally ranks all criteria, we adapted the academic ranking methodology to vary the contribution that each fire effects criterion has on the final FIRE Index score.
The academic ranking method weights five categories, i.e., teaching (the learning environment—30% of final score), research (volume, income and reputation—30% of final score), citations (research influence—30% of final score), international outlook (staff, students, research—7.5% of final score) and industry income (knowledge transfer—2.5% of final score), allowing each category a different contribution to the final score [231].
The GCI is a weighted index composed of 98 indicators grouped in 12 categories of competitiveness expressed on a 0 to 100 scale, each category reflecting one aspect of the complex reality of the national production potential [230]. The overall GCI score is the simple average of the 12 pillars, so each pillar’s implicit weight is 8.3% (1/12), while the normalization of all 98 individual indicators is based on a min–max approach [230].
The FIRE Index is composed of criteria grouped into fire effect categories (as described in Section 2.1). The backbone of the ranking method among the different criteria that comprise each fire effects category is the analytical hierarchical process (See Section 2.3) [232]. An expert evaluation of relative criterion importance was conducted using social survey tools and their responses were the inputs of Analytic Hierarchy Process (AHP, see Section 2.4). Criteria weights were adjusted by additive terms, criterion descriptors and general multipliers (see example in Table 8; and described below) during the assessment process to account for the complexity of several criteria (see Section 2.2.1, Section 2.2.2 and Section 2.2.3). The majority of criteria and multipliers can be evaluated by simply selecting one from the available choices or providing a user defined value, some have a particular logic behind the available choices that is noted in their description in Section 2.1.
2.2.1. Additive Terms
Additive terms (AT) were used to adjust weights for two criteria to aid in a more detailed description of the dominant land use/land cover types by specifying the vegetation species affected by the fire and to what extent, and define the type of protected forested area and its percentage inside the affected area. The criterion value is modified by the additive term value, but eventually the final value will fall in the range of 0 to 100, due to an average estimation of the two values.
2.2.2. Criterion Descriptors
Similar to additive terms, given the FIRE Index is conducted at the scale of a large fire event, the use of a criterion descriptor allows the attribution of a percentage value for a given criterion choice, to more accurately assess the effects across the entire landscape. For example, to account for steep slopes, one single value for the slope could not describe an entire large fire event; therefore, the discrete descriptor classes allow assessment based on the percentage of the landscape in slope categories.
2.2.3. General Multipliers
When variation occurs in the size or duration of fire events, some of the categories required an adjustment of the score to account for this variation. This adjustment was implemented with a general multiplier (GM) value based on a scale of 0.5 to 3, with a 0.5 interval. GM adjustments provide the ability to decrease (by selecting a value from 0.5 to 0.9), keep the same (values equal to one) or increase (values greater than one) the overall category’s score to account for the different scales of the fire effects. For example, the final category’s score cannot be the same if for two different fire events all criteria receive the highest scores, but area burned in the first fire is 100 ha and in the second 7000 ha. Additive terms were also assigned to two general multipliers and their value is defined by the average of all responses.
2.3. Prioritization of Criteria Using the Analytical Hierarchical Process
For each criterion, weights were derived to prioritize effects based on their relative importance in the category and final index levels using the AHP method developed by Saaty [232] and applied in a variety of scientific disciplines and case studies [233,234,235,236]. AHP is a structured technique for organizing and analyzing complex decisions where each respondent must compare the relative importance between two items with a specially designed questionnaire, usually on a five-point Likert scale. In Appendix B, we provide the context and results of the AHP application for each fire effects category, with criteria ranking derived from the social survey (see Section 2.4). For the final FIRE Index score estimation, the calculation of all criteria and multiplier values was required. Each criterion was weighted and then summed with the others from the same category using the fundamental multi-criteria analysis—Equation (1) [237] (Appendix C).
where Si is the score of each category, and Wj is the weight of criterion Sij. If a general multiplier existed, it was applied on the weighted sum (Si).
Then, a normalization of the outcome was performed on a scale of 0 to 100 by using the highest and lowest value that each category can achieve with Equation (2):
where, Ki is the outcome weighted value of category i, Rmin and Rmax are the lowest and highest values, respectively, the category can achieve, and SR is the standardized range (i.e., 100). Finally, the value from each of the seven categories was also weighted and then summed with the others to derive the final FIRE Index score on a scale of 1–100.
2.4. Expert Evaluation of Relative Criterion Importance
We conducted a web-based survey of professionals in wildfire management, research, and academia, as well as other engaged stakeholders interested in wildfire management (local government officials, non-governmental organizations, community members etc.) [238]. The survey was conducted during the winter of 2017–2018 (December through February), after we selected the criteria and formed the fire effects categories based on a literature review and analysis of 50 large-scale historical fire events. All respondents were anonymous, but we estimated that approximately 200 survey recipients were working in central government, the Fire Service, Forest Service and research organizations and received the questionnaire by e-mail (personal communication), while another 100 individuals (non-governmental organizations, community members and civil protection volunteers) were contacted through social networks. Respondents could choose to see the questions in either Greek or English.
We received 106 properly completed responses, representing a 33% response rate. We asked the participants to rate which factors they believed influenced how burned areas regenerate, which post-fire environmental issues they considered the most important, which factors reduce the aesthetic quality and attractiveness of the affected lands, how much they would be personally impacted by fatalities and firefighting casualties, and under which conditions wildfire suppression is considered difficult and complex. In addition, we asked for their views on which types of economic losses and infrastructure damage (or destruction) could impact the lives of people living in their community.
The questionnaire was constructed with Qualtrics (Qualtrics, Provo, UT, USA) using matrix type questions measured on a five-point Likert-scale in which subjects were asked to express their views with statements that ranged from no effect (assigning the value of zero) to very high effect (value of four). Experts were those respondents that experienced at least three fire incidents during their lives (either witnessed them or through their professional career), and had good or excellent working experience on at least two of the following fire related activities: suppression, fuel management, research and academia, post-fire rehabilitation, and effects of wildfires.
To derive the importance of each criterion, we summed the percentages of high and very high responses and we ranked the criteria from the highest to the lowest value. Then, we created a matrix where we estimated the percentage difference of each criterion in relation to each other. For example, in the regeneration potential and vegetation recovery category, 65% of all respondents rated post-fire grazing threat as the most important, followed by steep slopes with 58%, and thus their difference was 7% (three points—see Table 9).
The importance of grazing compared to the threat from insects and disease (10% of all respondents responded high and very high, respectively) had a difference of 55% (nine points). These differences were converted to the 1–9 scale used in AHP (Table 9) to construct the pair-wise comparison reciprocal matrix (Appendix B).
2.5. Fire Effects Assessment
The FIRE Index assessor should be a designated person or group of experts, preferably employees from the Greek Forest Service or the General Secretariat for Civil Protection or any government research institution that specializes in wildfires and forest management, with adequate knowledge of what has happened during and after the fire event, as well as of the landscape and vegetation conditions prior to the fire, such as fauna and flora composition, soil properties, fire history and regimes. Since the FIRE index is meant to encapsulate socioeconomic effects, we strongly encourage the assessment team to consult or include members from local organizations that have a better understanding of the current socioeconomic issues that may be exacerbated by a fire. The FIRE Index was designed so that only one assessor or assessment group should evaluate a wildfire event, but in case of multiple evaluations, we advise averaging the scores into a single FIRE Index score. To successfully complete an assessment, a choice must be made for all 56 criteria.
Ideally, two evaluations during two different time periods should be conducted, with the initial assessment taking place one week to one month following the incident, and the second assessment one year after the fire. The initial assessment is adequate to guide where post-fire investment should be directed and will serve as a quick guide to rank the event compared to the other events during the same fire season. The second assessment could correct potential errors or lack of information during the initial assessment, account for delayed mortality, and might better address long-term ecological consequences such as impacts to sensitive communities or species, or risk factors such as erosion and future fire potential [143].
Between the two assessments, spatial data, such as burn severity, soil erodibility, or post-fire vegetation recovery through satellite image processing, can be collected and used to correct errors. We also suggest that at least one visit to the affected area from the assessor or the assessment group takes place, and if possible an inventory of the affected area with 5–10 plots using the Composite Burn Index to estimate some of the first-order fire effects [143]. We estimated that for a large-scale fire such as the 2011 Evros fire in Greece (see Section 2.7), a full working week is required to complete the initial assessment, and another week for the second assessment, including the time required for field work.
2.6. Sensitivity Analysis
A sensitivity analysis was conducted by using four alternative weight assignment scenarios on the seven fire effect categories to test how they affect the final FIRE Index score (Table 10): (1) equal weights, (2) author weights, (3) emphasis on environmental weights, and (4) emphasis on socioeconomic weights. Criteria weights were not changed. We tested the influence of the four scenario weights on the evaluation of the Evros fire by keeping all category scores the same as evaluated in Appendix C and changing only the category weights (overall score).
For example, the firefighting and wildfire suppression category was evaluated with a value of 72 out of 100. To derive the final FIRE Index score this value was held constant. For the equal weight scenario, it was multiplied by 0.14, for the author weight scenario by 0.05, for the environmental weight scenario by 0.06, and for the socioeconomic weight scenario by 0.20, as they appear in Table 10.
Then, after maximizing the value of each fire effects category one at a time and keeping all other fire effects category scores the same, we tested the effect on the FIRE Index score for each of these four weighting scenarios. We chose to use the maximum value to correct for that fact that not all fire effect categories had a high value to allow us to test its influence. For example, there were no casualties or fatalities during the Evros fire, and this category had a zero value.
The equal weight scenario is the one that is used in the final version of the FIRE index, including its web version, with all categories having equal weights except for the casualties and fatalities with a slightly higher weight, but note the expert survey was used to derive criteria weights. The author weights scenario was developed by the authors setting large differences among category weights based on their working experience of what is considered important based on Greek societal norms. The environmental and socioeconomic scenarios place more importance on these groupings, with equal weights on the categories of these groups. Again, for all four scenarios, criteria weights were unchanged as derived from the expert evaluation of relative criterion importance analysis with the AHP process (Figure 1 and Figure 2).
2.7. Example Application of the FIRE Index
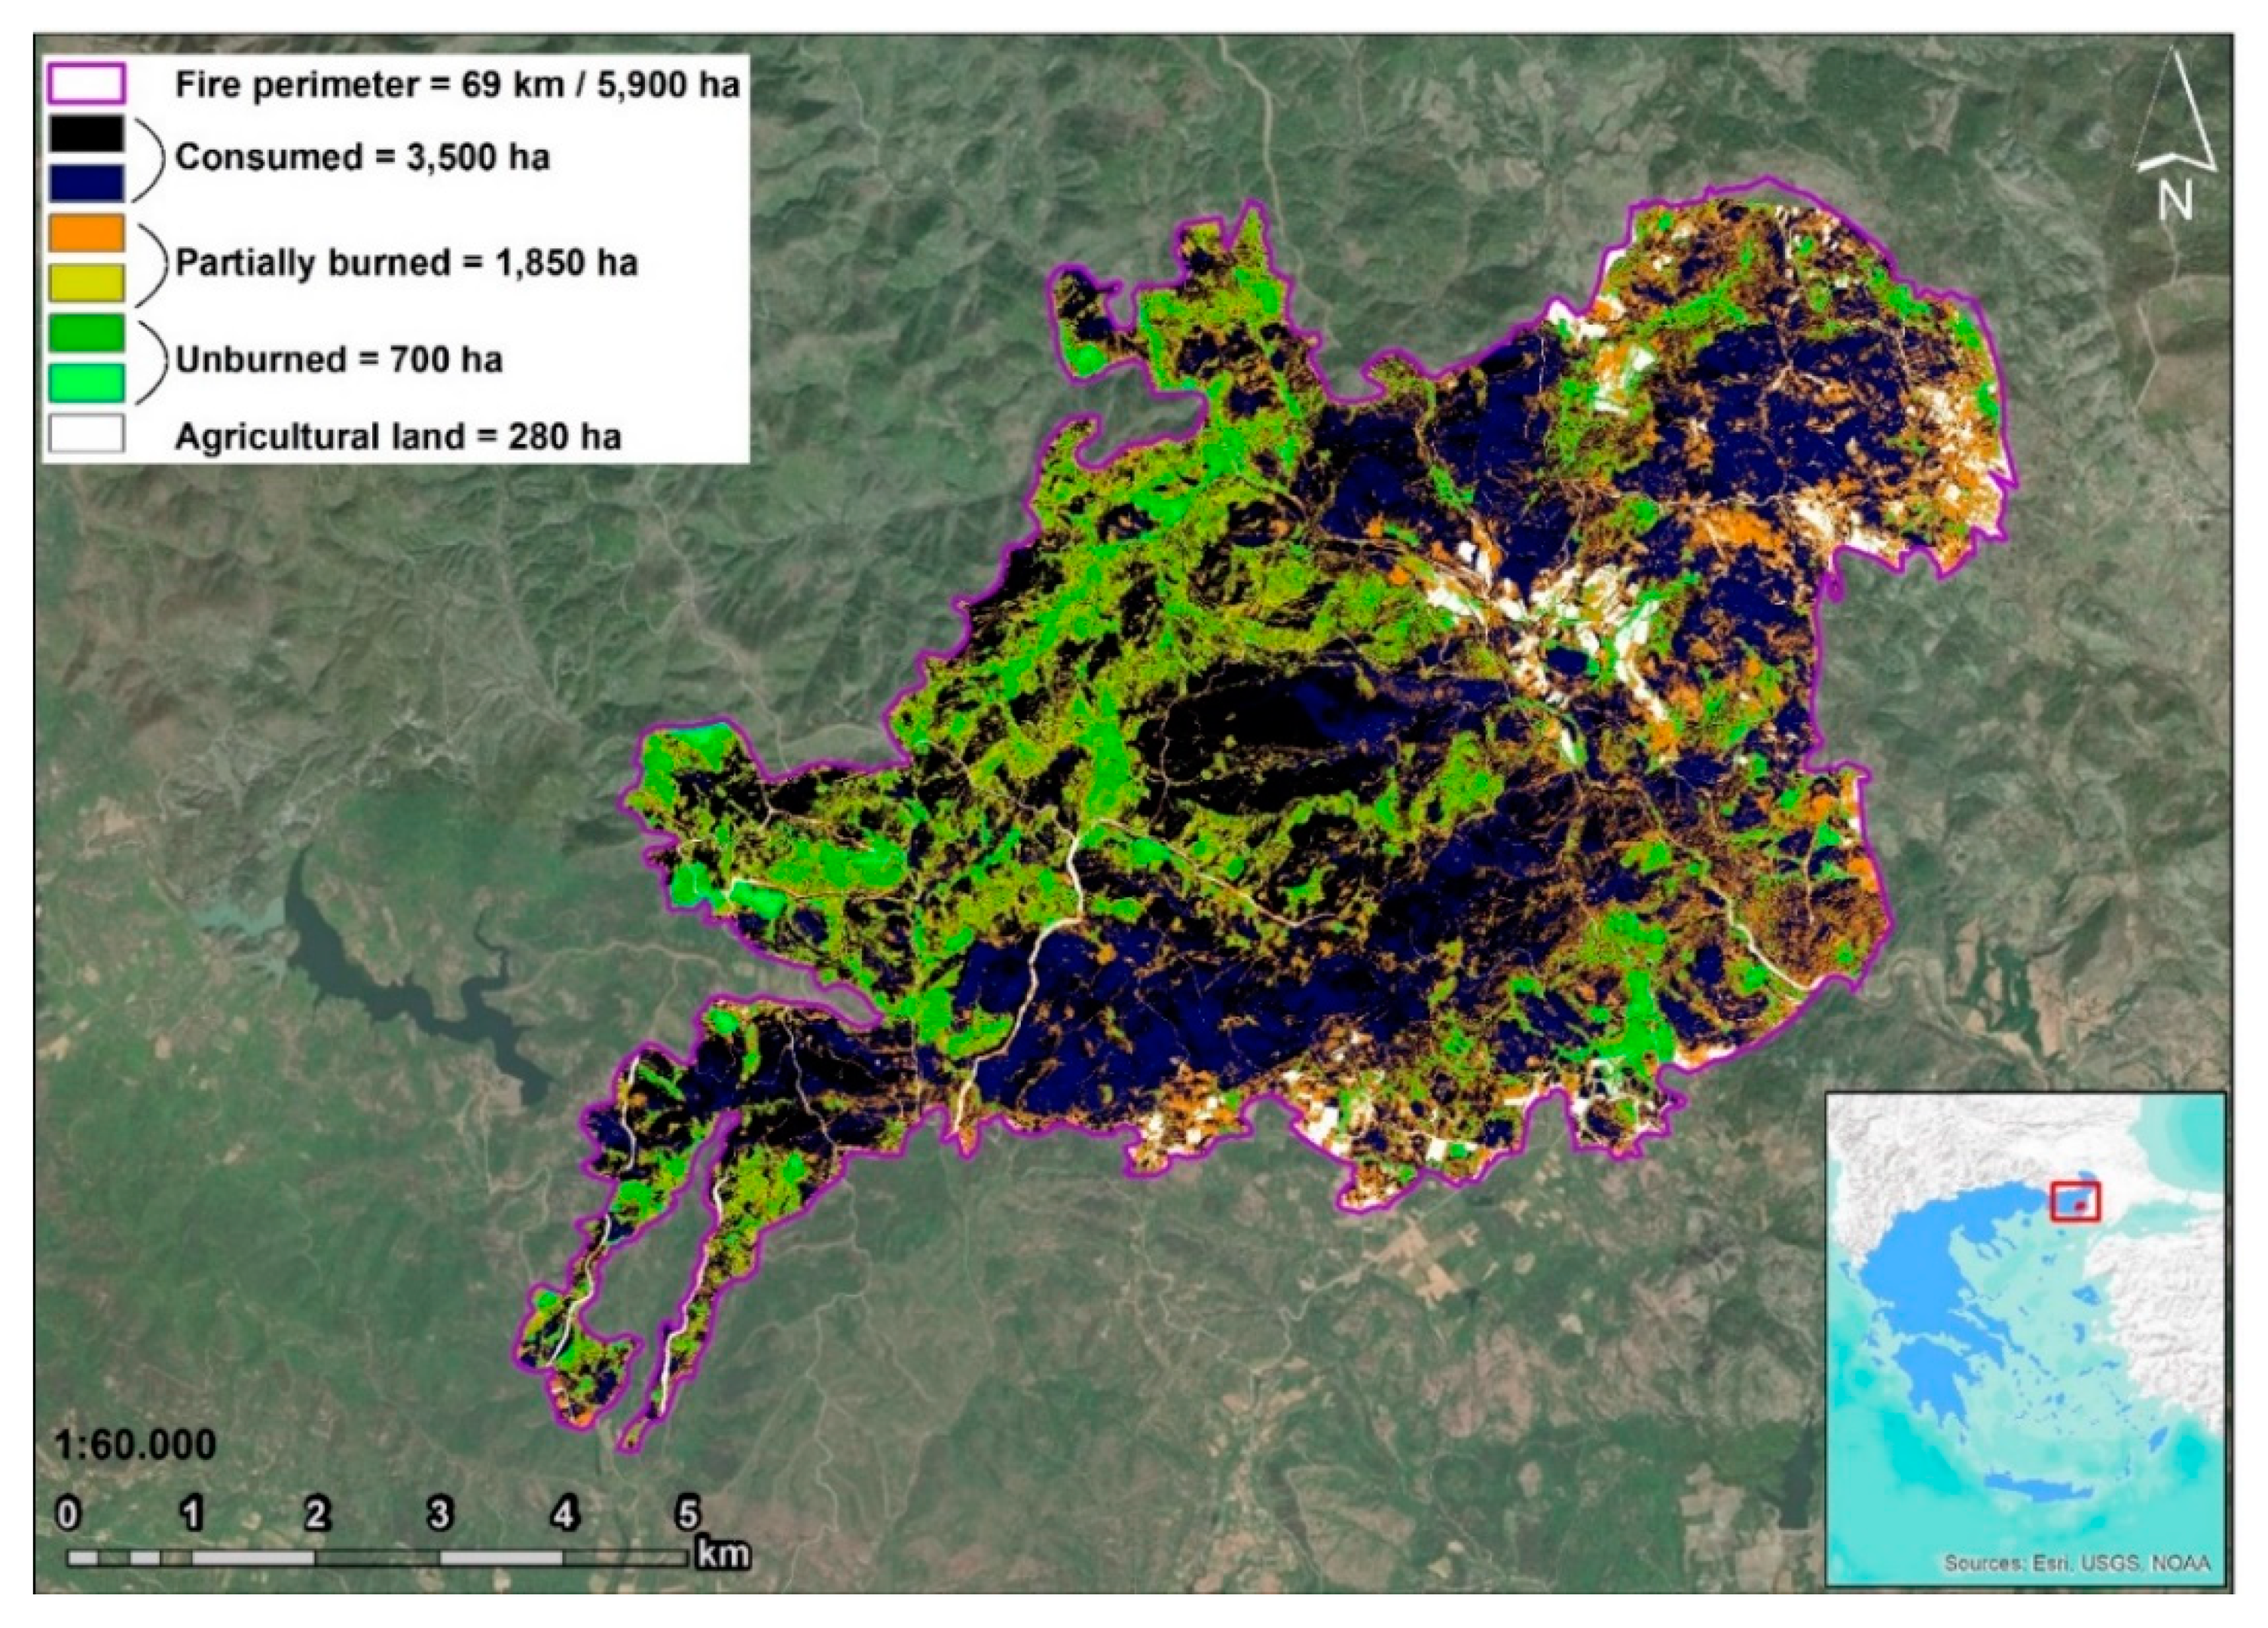
The Evros fire started on the afternoon of 24 August 2011, and under the influence of strong northeastern winds quickly expanded towards the southwest (Figure 3). The vegetation consisted mainly of Pinus brutia stands with an understory composed of shrubs and broadleaf trees (Phillyrea media, Quercus coccifera, Laurus nobilis, Acer spp., Juniperus oxycedrus, Erica malipuliflora, Arbutus andrachne). The active fire period lasted for four days, resulting in burned conifer forests, oak stands, shrublands, grasslands and agricultural areas, in low elevation lands with gentle slopes (between 120 m and 385 m and 5° to 25°). The Evros fire was the 36th largest wildfire in Greece (5900 ha) for the period 1974–2019 (Tables S4 and S5).
A large part of the burned area was covered by reforested conifer areas conducted 50 years ago by the local Forest Service. At that time, the area was dominated by shrubs and oaks, which were removed by mechanical means and replaced by conifer species planted in manmade terraces. The existence of fuel breaks and vegetation free zones helped fire containment efforts, which in turn enabled the survival of forested enclaves, creating a mosaic of burned and unburned patches. We visited the affected area twice after the event (2011 for the initial assessment and 2012 for the extended assessment) to sample and inventory the most prominent and noticeable fire effects, including first-order fire effects and insect response to fires [239,240]. Suppression activities were at the highest level of personnel and firefighting deployment, including considerable international aid. In addition, its proximity to the Dadia-Lefkimi-Soufli Forest National Park raised important ecological concerns on potential effects on fauna and flora, while the potential lost revenue from timber sources was the main concern of local communities and timber mills.
3. Results
3.1. Sensitivity Analysis
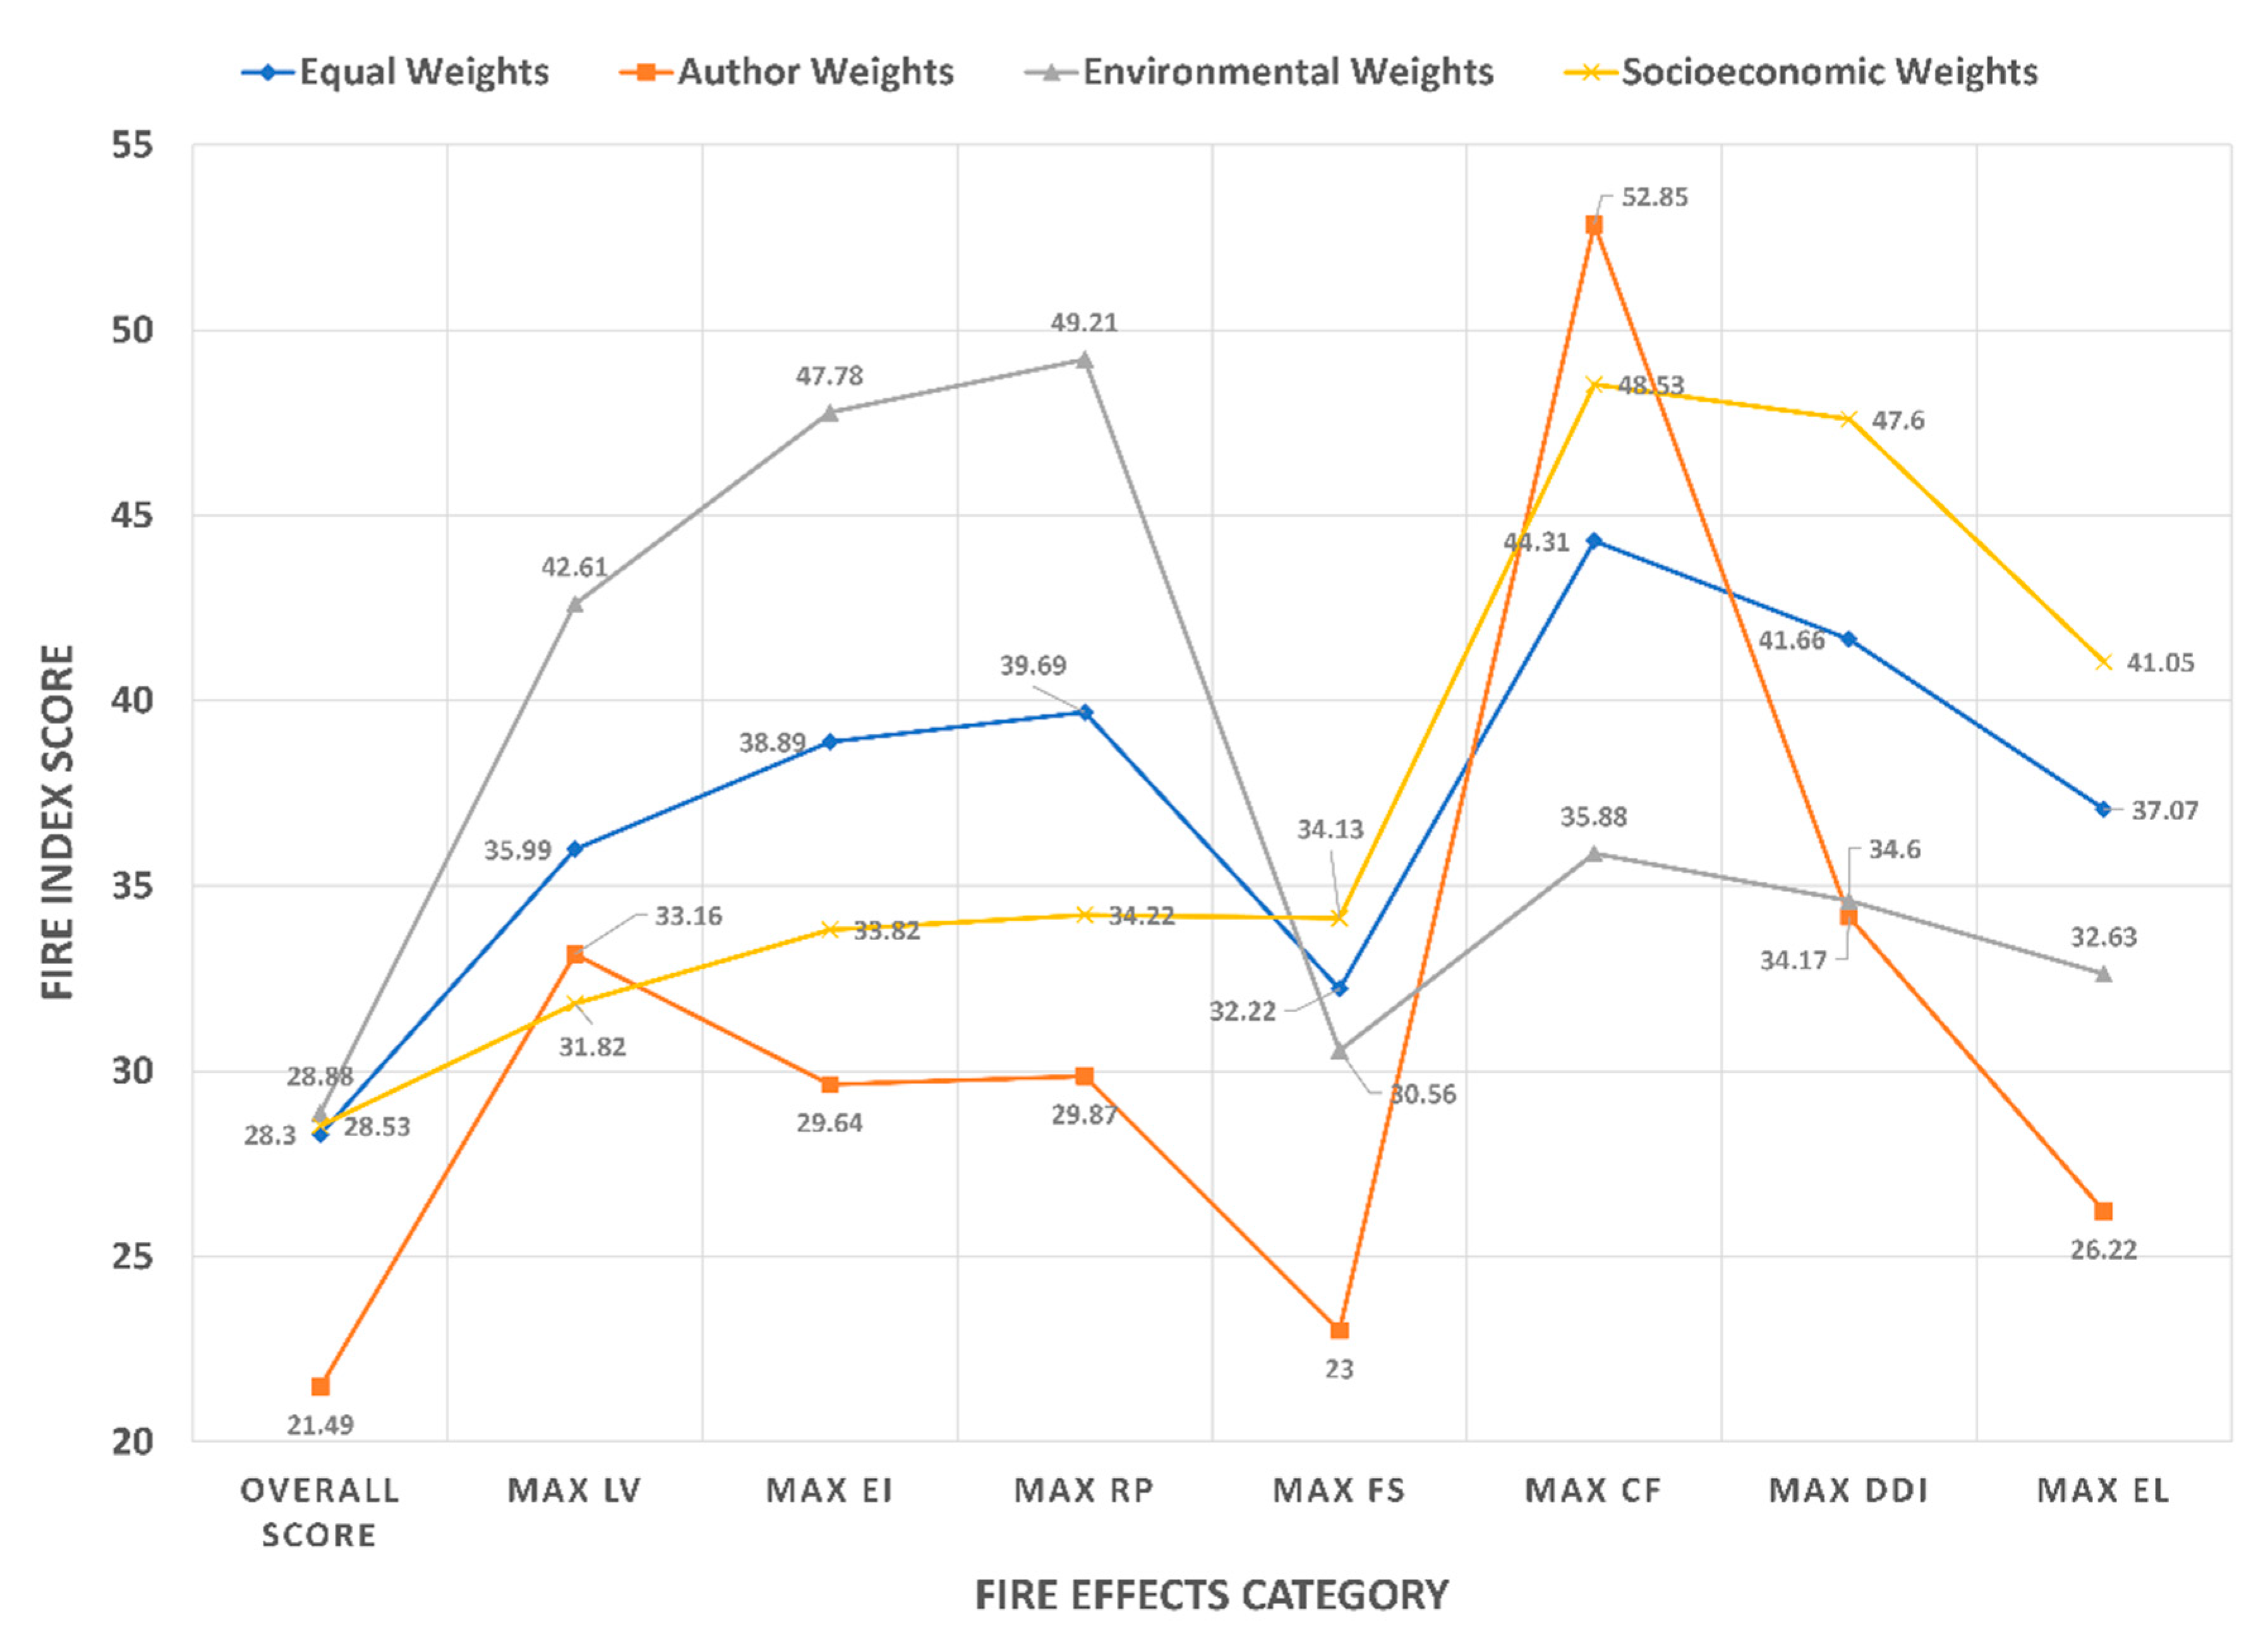
From the evaluation described in detail in Appendix C, the overall FIRE Index score for the Evros fire was 28.3/100 (Figure 4—equal weights line on first column). Criteria weights were unaltered among the four weighting scenarios (Figure 1 and Figure 2). The top five criteria influencing the FIRE Index score were ecosystem location/type (7.3% of the total FIRE index score), civilian fatalities (6.4%) and personnel casualties (4.9%), loss of important or rare flora habitats (4.3%), and fire behavior type (4.2%), all accounting for 27% of the total FIRE Index score (Appendix A Table A1, Table A2, Table A3, Table A4, Table A5, Table A6 and Table A7). The next three most important criteria were the cost of compensation for house and building restoration (4.2%), the number of destroyed houses (4.2%), and grazing threat to regeneration (3.6%). In total, these eight criteria accounted for approximately 40% of the total FIRE Index score and were those that also contributed the most to each individual category score.
The author weight scenario (red line) had the lowest FIRE Index score for the Evros fire evaluation, approximately 25% lower than the other three weighting scenarios that all had similar values (Figure 4). Overall, the author weighting scenario had the lowest scores compared to the other three scenarios even when the different category scores were maximized, with the exception of the casualties and fatalities category, which received the highest score compared to the other three scenarios. The average difference in the author weights scenario score from the highest score of each Max column (i.e., overall score and the seven maximum values of categories) was 30%, similar to its average difference from the equal weighting scenario scores, which was 28% (compared at each Max column scale).
As expected, the environmental weights scenario had higher index scores when the environmental group categories were maximized, and much lower scores for the four socioeconomic group categories. Its average difference from the equal weighting scenario scores was 15%. The socioeconomic weighting scenario had an average difference from the equal weighting scenario of 10%, with higher scores for the socioeconomic group categories except for casualties and fatalities. Overall, the equal weights scenario was the most balanced, falling between the environmental and socioeconomic weight scenarios. The author weight scenario was mismatched with the other three scenarios, producing large differences in the final FIRE Index score.
3.2. Connecting Governance Actions and Post-Fire Mitigation Measures with Fire Effects Category Scores
Different combinations of high values of the two fire effect categories can suggest the application of different governance actions and post-fire mitigation measures (Table 11). By selecting certain choices for the different criteria of each category (see Appendix D) derived from the assessment of the 50 historical large-scale wildfire events, we were able to derive high category score thresholds. When more than two categories are combined, a combination of measures and actions might be needed.
The proposed measures and actions include large-scale landscape rehabilitation and promoting vegetation recovery and regeneration, disaster relief in communities, enhanced suppression and increased firefighting capacity, protection of ecological values-at-risk and restoration of ecosystem services, and financial aid to stabilize local economies and investment to rebuild infrastructure. The list of measures and actions can be translated into more site-specific actions from government and local agencies that meet the needs of the affected area.
4. Discussion
The FIRE Index is the first fire effects evaluation index developed and applied in Greece, and to the best of our knowledge, elsewhere, establishing an evaluation process using a categorical hierarchy with criteria, choices and rules that determine the combination of evaluation scores. The index incorporates a synthesis of the peer-reviewed literature concerning fire effects (see Table 1, Table 2, Table 3, Table 4, Table 5, Table 6 and Table 7) and analysis of historical fire events in Greece. Since a systematic assessment of each large-scale event is missing, the knowledge acquired after each event by state agencies is lost or forgotten after a few years since the only officially documented information that is publicly available concerns suppression resources for each event and the total area burned.
Given its limitations and assumptions, the FIRE Index attempts to better evaluate post-fire conditions and prioritize rehabilitation actions and investments in the affected area, relative to other wildfire events in each fire season. In addition, the index can be used to mitigate the effects from a potential future fire event. If state agencies can access a database of past fires with information on locations of accelerated desertification or where suppression activities were complex and required mobilization of large forces, they can be better prepared to reduce negative fire impacts and improve response.
The FIRE Index can systematically quantify and record what has happened for a large number of fire effects, while for some others, it can estimate what is projected to occur. Among the multiple fire events that occur each year in Greece, and the limited amount of money to fund rehabilitation projects, a more inclusive evaluation of each fire’s effects could help the central government prioritize investments to wildfires that have the greatest socioecological impacts. It is worth noting the extensive effort taken to assess the impact of the 50 historical fires used in developing the FIRE Index criteria, with most fires limited to a few available fire effects metrics. It is not possible to reconstruct a wide suite of fire effects information from past events, necessitating a more comprehensive approach to better inform pre- and post-fire governance.
Two fires can hypothetically achieve the same FIRE Index score from the combination of high values of different categories, e.g., the first from higher values on regeneration potential and suppression activities and the second from economic losses, but wildfire events can be contrasted based on individual category scores. We suggest that results should be interpreted at both scales, first by comparing the final FIRE Index score among fires to gain an overall understanding of the collective effect of all fire effects categories, but also to report and understand which categories most influence the final value and compare fires based on one fire effects category score at a time. We also suggest potential governance actions and post-fire mitigation measures that could be taken when two categories with high scores for a single fire are combined. The systematic use of the FIRE Index could support a database of scores that can be used to fine-tune what values are considered high for each category and for the overall FIRE Index score, and will enable a better linkage with mitigation actions and measures. Potentially, a greater sample can enable these measures to be geographically specific, reflecting the post-fire conditions and needs of different Greek regions and ecosystems.
Despite the large number of criteria assessed with the FIRE Index, many can be evaluated using readily available spatial data, thus simplifying the evaluation process and increasing assessment accuracy. For example, the size and perimeter of burned areas are usually available shortly after a wildfire event by the European Forest Fire Information System (EFFIS) [241]. As we did for the evaluation of the Evros fire, several spatial datasets can be utilized inside geographic information systems (GIS) to accurately generate the necessary inputs for the FIRE Index including the Coordination of Information on the Environment (CORINE) land cover data [242], Landsat satellite images to estimate burn severity, WorldView-2 satellite images to estimate post-fire vegetation conditions, soil maps and erosion assessments, fire behavior modelling simulation software, and soil burn effects. In addition to spatial data, visiting the affected area immediately after the fire can provide useful information to complete the FIRE Index evaluation, similar to operations of Burned Area Emergency Response (BAER) teams in the US [243]. Personal communication with local Fire Service and Forest Service personnel can also provide invaluable information and knowledge on not only what happened during the event, but also how the conditions were before the fire and what they anticipate or expect, based on personal experience, for the future.
Wildfires can cause a number of positive effects, including soil heating and cracking of seed coats that trigger germination, the triggering of woody seed pods held in the canopy to open and release seed onto fresh and fertile ash beds, clearing thick understory and in turn, reducing competition for seedlings, encouraging new vegetation growth and pollination [239], which provides food for many animals, and creation of hollows in logs and trees that can be used by animals for nesting and shelter. The design of the FIRE Index does not directly allow for positive fire effects; however, attributing very low scores to a category nullifies its influence on the final FIRE Index score. For example, for the prevention of future devastating fires, the value for the criterion ‘recent fire activity for a fire occurring after 100 years’ is zero, and no additional value is added to the final FIRE Index score. The same applies for the criterion conifer forest age, where older conifer forests receive a very low value since they usually are no limited by regeneration potential. An expected pulse in insect and invertebrate population growth can be reflected by selecting “None” for the criterion insect and invertebrate habitat losses. The positive effects on regeneration potential or on the environment are reflected if the assessor makes choices with lower or zero values.
As noted, while the FIRE Index is a comprehensive fire effects index, there are assumptions and limitations inherent to its evaluation context. The main assumption is that each fire effect can be evaluated by a single criterion that has predefined choices on a scale from 0 to 100; therefore, providing a numerical value for its significance. This is less problematic for criteria with straightforward value assignments, such as burned area, but applying a value on fatalities may seem arbitrary and could be a source of disagreement. However, choices were derived from detailed studies on the effects of 50 historical fire events [36,191] (fire names can be found in the Supplementary Material Tables S4–S6, in bold), and the placement on the 0–100 scale is more a descriptive/qualitative approach rather than a numerical one. The current approach scales the choices from lowest to highest impact, and thus they are rated within this context. The resulting numerical values were used primarily for the calculations, but their contribution to the FIRE Index is defined by the choice on the predefined scale (lowest to highest effect).
One potential limitation of the FIRE Index is about fire effects that are more subjective in nature, such as aesthetic quality. We believe we have minimized this by using more objective parameters such as real estate value, presence of rare vegetation, proximity to tourism and recreation sites, and legal protection status (for example, see Section 2.1.1) to reduce variation among assessors. Likewise, for more objective metrics, there are limitations in the use of the FIRE Index; for example, with the application of market values (see Section 2.1.6 on destruction and damage to infrastructure). The main shortcoming of this approach is that damage costs can greatly exceed the predefined choices and there is no option to apply extra costs.
During the sensitivity analysis, the authors compared the equal category weights used in the FIRE Index with three other weighting scenarios (authors decisions, environmental focus, socioeconomic focus). We found that the equal weights scenario is the most balanced in terms of fire effect category scores compared to the other three scenarios that were more extreme or biased towards specific categories. Finally, the AHP method used to derive criteria weights requires user inputs to set a hierarchy among the criteria, and thus it is vulnerable to subjective judgment. Different people can rank criteria differently and this will lead to variation in weights for a single wildfire event. Our approach of using expert knowledge and judgement from a large number of survey participants minimizes the uncertainty regarding which criteria are the most important, but if the FIRE Index were applied in a different country, a wide synthesis of recommendations by the country’s fire experts would be necessary to rank the importance of different criteria, and results are expected to be different from ours.
Finally, the evaluation of the Evros fire revealed that three fire effect categories achieved high scores, i.e., landscape and vegetation with 45/100, firefighting and suppression with 72/100 and economic losses with 37/100. The local Forest Service agency during the first two years following the fire implemented large-scale landscape rehabilitation measures, including salvage logging, opening of roads and soil stabilization within the affected area. As estimated from the low score for the regeneration potential category (19/100), natural regeneration was achieved without requiring human interference. The high score of the firefighting and suppression category is indicative of how difficult fires can be in the future in this region, suggesting the enhancement of pre-suppression infrastructure and facilities such as fuel breaks, opening and cleaning of roads and increased water availability. Finally, economic losses were mitigated by government support of the local timber mills, enabling regional logging associations to immediately perform salvage logging and sell the retrieved timber to nearby mills.
5. Conclusions
Assessing the environmental and socioeconomic effects of wildfire events is critical in informing a robust fire and forest management decision support system. We developed the FIRE Index as an easy-to-use semi-numeric framework to classify wildfire events based on evaluations of a suite of fire effects criteria, grouped into ecological and socioeconomic fire effects categories, combined in a single score that can easily inform and educate the public on whether a hazard has become a disaster by causing large-scale consequences, beyond a simple estimate of the burned area itself. A wide and official use of the FIRE Index by state agencies could aid in the transparent documentation and assessment of each large-scale fire event, creating a fire effects history database that will enable researchers and policy makers in the future to understand what happened during a specific fire event to better inform future wildfire governance.
Supplementary Materials
The following are available online at https://0-www-mdpi-com.brum.beds.ac.uk/2571-6255/3/4/63/s1, Table S1: Number of firefighting personnel, vehicles and aircraft that participated in historical fire events (2011–2019), Table S2: Number of civilian and firefighter personnel fatalities during historical wildfire events, Table S3: Number of aircraft casualties and personnel fatalities during historical wildfire events, Table S4: Wildfire events with a total burned area greater than 7000 hectares. In bold are the fires that were examined to derive the FIRE Index criteria and choices, Table S5: Wildfire events with a total burned area between 2000 and 7000 hectares. In bold are the fires that were examined to derive the FIRE Index criteria and choices, Table S6: Wildfire events with a total burned area between 500 and 2000 hectares. In bold are the fires that were examined to derive the FIRE Index criteria and choices.
Author Contributions
Conceptualization, K.K. and P.P.; methodology, P.P.; validation, K.K. and M.A.D.; writing—original draft preparation, P.P.; writing—review and editing, M.A.D., K.K. and P.P.; visualization, P.P.; funding acquisition, K.K.; Software, V.K. All authors have read and agreed to the published version of the manuscript.
Funding
This research was funded by Action ARISTEIA (project name: “AEGIS: Wildfire Prevention and Management Information System”) of the Operational Program “Education and Lifelong Learning”, co-financed by the European Union (European Social Fund) and the Greek State.
Acknowledgments
We would like to thank Nikolaos Athanasis for his work in preparing the web interface that enables the calculation of the FIRE Index scores.
Conflicts of Interest
The authors declare no conflict of interest.
Appendix A
Table A1.
Criteria, choices, and weights for the effects on landscape and vegetation fire effects category. CR: criterion; CRD: criterion descriptor; AT: additive term; GM: general multiplier. Light gray: Choices with no effect; Dark gray: N/a, denotes a non-applicable or not available selection; Green: Choices with low effect; Yellow: Choices with moderate effect; Red: Choices with high effect.
| Weight | Total Weight (%) | ID | Type | Name/Details | No Effect | Low | Moderate | High | |||
|---|---|---|---|---|---|---|---|---|---|---|---|
| General Multiplier Value | 0 | 0.5 | 1 | 1.5 | 2 | 2.5 | 3 | ||||
| Criterion Value (0–100) | 0 | 10 | 20 | 40 | 60 | 80 | 100 | ||||
| 0.524 | 7.34 | A.1 | CR | Ecosystem location/type | n/a | n/a | Flat terrain/Agricultural land | Highlands | Wildland-urban interface | Mountainous | |
| 0.134 | 1.88 | A.2 | CR | Dominant land use/land cover type | n/a | Bare soil | Grass or short shrub | Shrubland | Agricultural land or orchard | Mixed or broadleaf forest | Conifer forest |
| CRD | Cover (0–100%)- Sum must be = 100% | n/a | 0–100% | 0–100% | 0–100% | 0–100% | 0–100% | 0–100% | |||
| AT | Broadleaf/evergreen shrubland species | n/a | Quercus spp. or Olea sylvestris | Juglans regia or Castanea spp. | Fagus spp. or cold climate broadleaf evergreens | Mixed conifer/broadleaf forest | |||||
| AT | Conifer forest dominant species | n/a | Pinus brutia or Pinus halepensis | Juniperus spp. or Cupressus spp. | Pinus nigra or Pinus pinea | Abies spp. or mixed Fir/Pine forest or Pinus sylvestris or Pinus heldreichii | |||||
| 0.082 | 1.15 | A.3 | CR | Protected forested area type | None | Lake or seashore forests | Recreational forests | National parks | Old-growth forest | ||
| AT | Ratio of protected forested area vs. non-protected area inside the burned perimeter | n/a | <10% | 11–20% | 21–30% | 31–40% | 41–50% | >50% | |||
| 0.033 | 0.46 | A.4 | CR | Air quality and smoke impacts | Away from settlements | Small-scale visibility reduction and smoke impacts near small villages | Visibility reduction inside medium sized populated areas | Visibility reduction inside large sized populated areas | Severe smoke impacts inside medium sized populated areas | Severe smoke impacts inside large sized populated areas | |
| 0.226 | 3.17 | A.5 | CR | Probabilities of land degradation, erosion, and soil loss | None | Low | Moderate | High | |||
| CRD | Cover (0–100%)- Sum must be = 100% | 0–100% | 0–100% | 0–100% | 0–100% | ||||||
| GM | Burned area (ha) | n/a | <10 | 10–100 | >100–500 | >500–2000 | >2000–7000 | >7000 | |||
Table A2.
Criteria, choices, and weights for the general environmental impacts fire effects category. CR: criterion; AT: additive term; GM: general multiplier. Light gray: Choices with no effect; Dark gray: N/a, denotes a non-applicable or not available selection; Green: Choices with low effect; Yellow: Choices with moderate effect; Red: Choices with high effect.
| Weight | Total Weight (%) | ID | Type | Name/Details | No Effect | Low | Moderate | High | |||
|---|---|---|---|---|---|---|---|---|---|---|---|
| General Multiplier Value | 0 | 0.5 | 1 | 1.5 | 2 | 2.5 | 3 | ||||
| Criterion Value (0–100) | 0 | 10 | 20 | 40 | 60 | 80 | 100 | ||||
| 0.152 | 2.13 | Β.1 | CR | Insect and invertebrate habitat losses | None | Few | Several | Extended | |||
| 0.111 | 1.56 | Β.2 | CR | Small sized mammal/reptile habitat losses | None | Few | Several | Extended | |||
| 0.026 | 0.37 | Β.3 | CR | Fish habitat losses | None | Few | Several | Extended | |||
| 0.219 | 3.06 | Β.4 | CR | Bird habitat losses | None | Few | Several | Extended | |||
| 0.047 | 0.66 | Β.5 | CR | Large sized mammal habitat losses | None | Few | Several | Extended | |||
| 0.306 | 4.29 | Β.6 | CR | Losses of important/rare flora habitats | Zero due to the lack of important/rare species | Few with regeneration potential | Extended with alteration on habitat conditions and strong population stresses | Intense, with possible species extinction or disappearance from the area | |||
| 0.076 | 1.07 | Β.7 | CR | Threat from alien species/Changes in species composition (Flora) | None | Local | Extended | Intense | |||
| 0.062 | 0.86 | Β.8 | CR | Threat from alien species/Changes in species composition (Fauna) | None | Local | Extended | Intense | |||
| GM | Affected area under protection status | None | Wildlife habitats/NATURA 2000 areas | Protected natural areas | Areas of complete and strict protection | Biogenetic/biosphere reserves | |||||
| AT | Cover (0–100%) | <10% | 11–20% | 21–30% | 31–40% | 41–50% | >50% | ||||
Table A3.
Criteria, choices, and weights for the regeneration potential and vegetation recovery fire effects category. CR: criterion; CRD: criterion descriptor; GM: general multiplier. Light gray: Choices with no effect; Dark gray: N/a, denotes a non-applicable or not available selection; Green: Choices with low effect; Yellow: Choices with moderate effect; Red: Choices with high effect.
| Weight | Total Weight (%) | ID | Type | Name/Details | No Effect | Low | Moderate | High | |||
|---|---|---|---|---|---|---|---|---|---|---|---|
| General Multiplier Value | 0 | 0.5 | 1 | 1.5 | 2 | 2.5 | 3 | ||||
| Criterion Value (0–100) | 0 | 10 | 20 | 40 | 60 | 80 | 100 | ||||
| 0.101 | 1.41 | C.1 | CR | Conifer forest age | Not applicable | 60–100 | 20–60 | >100 | 15–20 | <15 | |
| 0.078 | 1.09 | C.2 | CR | Broadleaf/evergreen shrubland forest age | Not applicable | 20–60 | 15–20 | 10–15 | 60–80 | >80 ή < 10 | |
| 0.161 | 2.25 | C.3 | CR | Slope (°) | 0–5 | 5–10 | 10–15 | 15–20 | 20–30 | 30–45 | >45 |
| CRD | Cover (0–100%)- Sum must be = 100% | 0–100% | 0–100% | 0–100% | 0–100% | 0–100% | 0–100% | 0–100% | |||
| 0.127 | 1.77 | C.4 | CR | Recent fire activity | >100 years | >50 years | >30 years | >20 years | <10 years | ||
| 0.023 | 0.33 | C.5 | CR | Unburned forest patches and individual trees | Many (dispersed) | Many (Clustered) | Few (dispersed) | Few (Clustered) | None | ||
| 0.259 | 3.63 | C.6 | CR | Grazing/browsing threat | None | Partial | Extended | Intense | |||
| 0.108 | 1.51 | C.7 | CR | Illegal activities/land use changes | None | Partial | Extended | Intense | |||
| 0.047 | 0.66 | C.8 | CR | Urban/tourism pressure | None | Partial | Extended | Intense | |||
| 0.026 | 0.37 | C.9 | CR | Smoldering | None | Partial | Extended | Intense | |||
| 0.012 | 0.16 | C.10 | CR | Threat from Insects and Disease | None | Partial | Extended | Intense | |||
| 0.058 | 0.81 | C.11 | CR | Soil type | Deep soils with small amount of rocks | Deep soils with moderate amount of rocks | Moderate depth soils with small amount of rocks | Moderate depth soils with moderate amount of rocks | Shallow soils with moderate amount of rocks | Shallow exposed soils with large amount of rocks | |
| CRD | Cover (0–100%)- Sum must be = 100% | 0–100% | 0–100% | 0–100% | 0–100% | 0–100% | 0–100% | 0–100% | |||
| GM | Define the percentage of burned, scorched and unburned vegetation (black, brown and green); average value of the three responses below | ||||||||||
| Burned (Black) | None | 5–20% | 60% | >85% | 100% with consumed branches | ||||||
| Scorched (Brown) | None | 5–20% | 40–80% | <40 ή >80% | Non due to torching | ||||||
| Unburned (Green) | 100% | 80% | 40% | <10% | None | ||||||
Table A4.
Criteria, choices, and weights for the firefighting and wildfire suppression fire effects category. CR: criterion; GM: general multiplier. Light gray: Choices with no effect; Dark gray: N/a, denotes a non-applicable or not available selection; Green: Choices with low effect; Yellow: Choices with moderate effect; Red: Choices with high effect.
| Weight | Total Weight (%) | ID | Type | Name/Details | No Effect | Low | Moderate | High | |||
|---|---|---|---|---|---|---|---|---|---|---|---|
| General Multiplier Value | 0 | 0.5 | 1 | 1.5 | 2 | 2.5 | 3 | ||||
| Criterion Value (0–100) | 0 | 10 | 20 | 40 | 60 | 80 | 100 | ||||
| 0.299 | 4.19 | D.1 | CR | Fire behavior type | Surface fire | Torching/passive crown fire | Active crown fire | ||||
| 0.201 | 2.81 | D.2 | CR | Fire reignition - spotting | None | Few | Constant | ||||
| 0.136 | 1.91 | D.3 | CR | Number of people participating in fire suppression | <10 | 10–24 | 25–39 | 40–54 | 55–69 | >70 | |
| 0.087 | 1.22 | D.4 | CR | Number of firefighting vehicles | 1–4 | 5–9 | 10–14 | 15–19 | 20–24 | >25 | |
| 0.128 | 1.80 | D.5 | CR | Number of firefighting aircraft | 0 | <=2 | 3–5 | 6–10 | >10 | ||
| 0.024 | 0.34 | D.6 | CR | International aid and reinforcements | None | Personnel | Vehicles | Aircraft | |||
| 0.072 | 1.01 | D.7 | CR | Declaration of the area in a state of emergency | No | Yes | |||||
| 0.052 | 0.73 | D.8 | CR | Community evacuation | No | <2 communities | 2 to 5 communities | >5 communities | |||
| GM | Fire duration | 0–3 h | >3–15 h | >15–24 h | >24–48 h | >48–72 h | > 72h | ||||
Table A5.
Criteria, choices, and weights for the casualties and fatalities fire effects category. CR: criterion. Light gray: Choices with no effect; Dark gray: N/a, denotes a non-applicable or not available selection; Green: Choices with low effect; Yellow: Choices with moderate effect; Red: Choices with high effect.
| Weight | Total Weight (%) | ID | Type | Name/Details | No Effect | Low | Moderate | High | |||
|---|---|---|---|---|---|---|---|---|---|---|---|
| Criterion Value (0–100) | 0 | 10 | 20 | 40 | 60 | 80 | 100 | ||||
| 0.401 | 6.28 | Ε.1 | CR | Civilian fatalities | 0 | 1 | 2–5 | 6–10 | >10 | ||
| 0.303 | 4.76 | Ε.2 | CR | Firefighting personnel fatalities | 0 | 1 | 2–3 | 4–5 | >5 | ||
| 0.104 | 2.12 | Ε.3 | CR | Injured | 0 | 1 | 2–5 | 6–10 | 11–20 | 21–30 | >30 |
| 0.044 | 0.71 | Ε.4 | CR | Firefighting vehicle losses | 0 | 1 | 2 | 3 | 4–5 | >5 | |
| 0.147 | 2.12 | Ε.5 | CR | Firefighting aircraft losses | 0 | 1 | 2 | >2 | |||
Table A6.
Criteria, choices, and weights for the destruction and damages on infrastructure fire effects category. CR: criterion. Light gray: Choices with no effect; Dark gray: N/a, denotes a non-applicable or not available selection; Green: Choices with low effect; Yellow: Choices with moderate effect; Red: Choices with high effect.
| Weight | Total Weight (%) | ID | Type | Name/Details | No Effect | Low | Moderate | High | |||
|---|---|---|---|---|---|---|---|---|---|---|---|
| Criterion Value (0–100) | 0 | 10 | 20 | 40 | 60 | 80 | 100 | ||||
| 0.298 | 4.17 | F.1 | CR | Destroyed houses | 0 | 1 | 3 | 5 | 6–10 | >10 | |
| 0.041 | 0.58 | F.2 | CR | Destroyed household stables, warehouses, or auxiliary buildings | 0 | 1 | 3 | 5 | 6–10 | 11–20 | >20 |
| 0.133 | 1.86 | F.3 | CR | Damage to monuments or cultural heritage sites | None | Recent monuments aged <200 years | Historic monuments aged >200 years | World heritage sites and monuments | |||
| 0.017 | 0.24 | F.4 | CR | Cost of damages to vehicles and machinery | None | Minor (<15,000 €) | Small (<30,000 €) | Medium (<100,000 €) | Important high cost damages (>200,000 €) | ||
| 0.111 | 1.55 | F.5 | CR | Cost of damages to electricity grid | None | Minor (<15,000 €) | Small (<30,000 €) | Medium (<100,000 €) | Important high cost damages (>200,000 €) | ||
| 0.059 | 0.83 | F.6 | CR | Cost of damages to telecommunications | None | Minor (<15,000 €) | Small (<30,000 €) | Medium (<100,000 €) | Important high cost damages (>200,000 €) | ||
| 0.173 | 2.42 | F.7 | CR | Cost of damages to water supply network | None | Minor (<15,000 €) | Small (<30,000 €) | Medium (<100,000 €) | Important high cost damages (>200,000 €) | ||
| 0.032 | 0.45 | F.8 | CR | Cost of damages to public transportation network | None | Minor (<15,000 €) | Small (<30,000 €) | Medium (<100,000 €) | Important high cost damages (>200,000 €) | ||
| 0.017 | 0.24 | F.9 | CR | Cost of damages to military facilities/equipment | None | Minor (<50,000 €) | Small (<100,000 €) | Medium (<200,000 €) | Important high cost damages (>300,000 €) | ||
| 0.024 | 0.33 | F.10 | CR | Cost of damages to factories, renewable energy sources and industrial warehouses | None | Minor (<50,000 €) | Small (<100,000 €) | Medium (<200,000 €) | Important high cost damages (>300,000 €) | ||
| 0.095 | 1.33 | F.11 | CR | Cost of damages to agricultural/livestock installations | None | Minor (<50,000 €) | Small (<100,000 €) | Medium (<200,000 €) | Important high cost damages (>300,000 €) | ||
Table A7.
Criteria, choices, and weights for the economic losses, compensation, and revenue losses fire effects category. CR: criterion; GM: general multiplier. Light gray: Choices with no effect; Dark gray: N/a, denotes a non-applicable or not available selection; Green: Choices with low effect; Yellow: Choices with moderate effect; Red: Choices with high effect.
| Weight | Total Weight (%) | ID | Type | Name/Details | No Effect | Low | Moderate | High | |||
|---|---|---|---|---|---|---|---|---|---|---|---|
| General Multiplier Value | 0 | 0.5 | 1 | 1.5 | 2 | 2.5 | 3 | ||||
| Criterion Value (0–100) | 0 | 10 | 20 | 40 | 60 | 80 | 100 | ||||
| 0.019 | 0.26 | G.1 | CR | Timber and wood products lost revenue | None | Minor | Small | Moderate | High | Complete destruction | |
| 0.039 | 0.55 | G.2 | CR | Non-wood forest products lost revenue | None | Minor | Small | Moderate | High | Complete destruction | |
| 0.132 | 1.85 | G.3 | CR | Agricultural production lost revenue | None | Minor | Small | Moderate | High | Complete destruction | |
| 0.066 | 0.92 | G.4 | CR | Livestock production lost revenue | None | Minor | Small | Moderate | High | Complete destruction | |
| 0.066 | 0.92 | G.5 | CR | Cost to restore industrial and electricity production | No cost | Minor | Small | Moderate | High | Very high | |
| 0.298 | 4.18 | G.6 | CR | Compensation and funding for house and building restoration | No cost | Minor | Small | Moderate | High | ||
| 0.132 | 1.85 | G.7 | CR | Effect on tourism and recreation | Non tourism area | Sea related tourism area | Scenery landscape close to intensely developed tourism areas | Forested area used for recreational or tourism purposes | |||
| 0.248 | 3.47 | G.8 | CR | Landscape rehabilitation cost | No Investments | Small scale reforestation and flood or erosion prevention measures | Moderate scale reforestation and flood or erosion prevention measures | Large scale reforestation and flood or erosion prevention measures | |||
| GM | Burned area (ha) | <10 | 10–100 | 100–500 | 500–2000 | 2000–7000 | >7000 | ||||
Appendix B
Initially, a pair-wise comparison reciprocal matrix was designed (Equation (A1)), where the relative importance between two criteria is measured according to a numerical scale from one to nine, where one denotes equal importance and nine denotes that the first is absolutely more important than the second criterion (Table A8, Table A9, Table A10, Table A11, Table A12, Table A13 and Table A14).
where, αjk = 1/akj and k,j = 1, …, n.
Once the reciprocal matrix was built, we derived a normalized pair-wise comparison matrix (i.e., Anorm) where the sum of the entries on each column was equal to 1 [244]. Each entry ājk was computed by Equation (A2):
where m is the evaluation criteria and each entry ajk represents the importance of jth criterion with respect to kth criterion. Then, the criteria weight vector w (that is an m-dimensional column vector) was built by averaging the entries on each row of the Anorm matrix. Results were checked to ensure that they were consistent, with Equation (A3):
The final stage was to calculate a consistency ratio (CR) [232] to measure how consistent the judgments have been relative to large samples of purely random judgments, and if the CR was >0.1 the judgments were considered untrustworthy as they were too close to random. The consistency ratio was calculated by dividing the consistency index (Equation (A4)) for the set of judgments by the random consistency index (RCI—see Saaty [232] for the table of values) for the corresponding random matrix.
where λmax is the principal eigenvalue (i.e., sum of the consistency eigenvectors) and n is the number of criteria. CR was calculated with Equation (A5):
Table A8.
Pair-wise comparison reciprocal matrix for the effects on landscape and vegetation fire effects category. RCI: random consistency index; CI: consistency index; CR: consistency ratio; λmax: principal eigenvalue.
Table A8.
Pair-wise comparison reciprocal matrix for the effects on landscape and vegetation fire effects category. RCI: random consistency index; CI: consistency index; CR: consistency ratio; λmax: principal eigenvalue.
| Rank | Criteria | Weight | ||||
|---|---|---|---|---|---|---|
| R1 | Ecosystem location/type | 0.524 | ||||
| R2 | Probability of land degradation, erosion, and soil loss | 0.226 | ||||
| R3 | Dominant land use/land cover type | 0.135 | ||||
| R4 | Protected forested area type | 0.082 | ||||
| R5 | Air quality and smoke impacts | 0.033 | ||||
| R1 | R2 | R3 | R4 | R5 | ||
| R1 | 1.00 | 4.00 | 6.00 | 7.00 | 8.00 | |
| R2 | 0.25 | 1.00 | 3.00 | 4.00 | 7.00 | |
| R3 | 0.17 | 0.33 | 1.00 | 3.00 | 6.00 | |
| R4 | 0.14 | 0.25 | 0.33 | 1.00 | 5.00 | |
| R5 | 0.13 | 0.14 | 0.17 | 0.20 | 1.00 | |
| SUM | 1.7 | 5.7 | 10.5 | 15.2 | 27.0 | |
| N = 5 | RCI = 1.12; CI = 0.126; CR = 0.112; λmax = 5.50 | |||||
Table A9.
Pair-wise comparison reciprocal matrix for the general environmental impacts fire effects category. RCI: random consistency index; CI: consistency index; CR: consistency ratio; λmax: principal eigenvalue.
Table A9.
Pair-wise comparison reciprocal matrix for the general environmental impacts fire effects category. RCI: random consistency index; CI: consistency index; CR: consistency ratio; λmax: principal eigenvalue.
| Rank | Criteria | Weight | ||||||
|---|---|---|---|---|---|---|---|---|
| R1 | Losses of important/rare flora habitats | 0.306 | ||||||
| R2 | Bird habitat losses | 0.219 | ||||||
| R3 | Insect and invertebrate habitat losses | 0.152 | ||||||
| R4 | Small sized mammal/reptile habitat losses | 0.112 | ||||||
| R5 | Threat from alien species/Changes in species composition (Flora) | 0.076 | ||||||
| R6 | Threat from alien species/Changes in species composition (Fauna) | 0.062 | ||||||
| R7 | Large sized mammal habitat losses | 0.047 | ||||||
| R8 | Fish habitat losses | 0.026 | ||||||
| R1 | R2 | R3 | R4 | R5 | R6 | R7 | R8 | |
| R1 | 1.00 | 2.00 | 3.00 | 4.00 | 4.00 | 5.00 | 5.00 | 6.00 |
| R2 | 0.50 | 1.00 | 2.00 | 3.00 | 4.00 | 4.00 | 4.00 | 6.00 |
| R3 | 0.33 | 0.50 | 1.00 | 2.00 | 3.00 | 3.00 | 4.00 | 5.00 |
| R4 | 0.25 | 0.33 | 0.50 | 1.00 | 2.00 | 3.00 | 3.00 | 5.00 |
| R5 | 0.25 | 0.25 | 0.33 | 0.50 | 1.00 | 2.00 | 2.00 | 4.00 |
| R6 | 0.20 | 0.25 | 0.33 | 0.33 | 0.50 | 1.00 | 2.00 | 4.00 |
| R7 | 0.20 | 0.25 | 0.25 | 0.33 | 0.50 | 0.50 | 1.00 | 3.00 |
| R8 | 0.17 | 0.17 | 0.20 | 0.20 | 0.25 | 0.25 | 0.33 | 1.00 |
| SUM | 2.9 | 4.8 | 7.6 | 11.4 | 15.3 | 18.8 | 21.3 | 34.0 |
| N = 8 | RCI = 1.41; CI = 0.063; CR = 0.044; λmax = 8.43 | |||||||
Table A10.
Pair-wise comparison reciprocal matrix for the regeneration potential and vegetation recovery fire effects category. RCI: random consistency index; CI: consistency index; CR: consistency ratio; λmax: principal eigenvalue.
Table A10.
Pair-wise comparison reciprocal matrix for the regeneration potential and vegetation recovery fire effects category. RCI: random consistency index; CI: consistency index; CR: consistency ratio; λmax: principal eigenvalue.
| Rank | Criteria | Weight | |||||||||
|---|---|---|---|---|---|---|---|---|---|---|---|
| R1 | Grazing/browsing threat | 0.259 | |||||||||
| R2 | Slope (°) | 0.161 | |||||||||
| R3 | Recent fire activity | 0.127 | |||||||||
| R4 | Illegal activities/land use changes | 0.108 | |||||||||
| R5 | Conifer forest age | 0.101 | |||||||||
| R6 | Broadleaf/evergreen shrubland forest age | 0.078 | |||||||||
| R7 | Soil type | 0.058 | |||||||||
| R8 | Urban/tourism pressure | 0.047 | |||||||||
| R9 | Smoldering | 0.026 | |||||||||
| R10 | Unburned forest patches and individual trees | 0.023 | |||||||||
| R11 | Threat from insects and disease | 0.012 | |||||||||
| R1 | R2 | R3 | R4 | R5 | R6 | R7 | R8 | R9 | R10 | R11 | |
| R1 | 1.00 | 3.00 | 3.00 | 4.00 | 4.00 | 4.00 | 5.00 | 5.00 | 7.00 | 7.00 | 9.00 |
| R2 | 0.33 | 1.00 | 2.00 | 2.00 | 3.00 | 3.00 | 4.00 | 4.00 | 6.00 | 6.00 | 8.00 |
| R3 | 0.33 | 0.50 | 1.00 | 2.00 | 2.00 | 2.00 | 3.00 | 4.00 | 6.00 | 6.00 | 8.00 |
| R4 | 0.25 | 0.50 | 0.50 | 1.00 | 2.00 | 2.00 | 3.00 | 3.00 | 6.00 | 6.00 | 8.00 |
| R5 | 0.25 | 0.33 | 0.50 | 0.50 | 1.00 | 2.00 | 3.00 | 5.00 | 6.00 | 6.00 | 8.00 |
| R6 | 0.25 | 0.33 | 0.50 | 0.50 | 0.33 | 1.00 | 2.00 | 3.00 | 5.00 | 6.00 | 8.00 |
| R7 | 0.20 | 0.25 | 0.33 | 0.33 | 0.50 | 0.50 | 1.00 | 2.00 | 4.00 | 5.00 | 7.00 |
| R8 | 0.20 | 0.25 | 0.25 | 0.33 | 0.20 | 0.33 | 0.50 | 1.00 | 4.00 | 4.00 | 7.00 |
| R9 | 0.14 | 0.17 | 0.17 | 0.17 | 0.17 | 0.20 | 0.25 | 0.25 | 1.00 | 2.00 | 6.00 |
| R10 | 0.14 | 0.17 | 0.17 | 0.17 | 0.17 | 0.17 | 0.20 | 0.25 | 0.50 | 1.00 | 6.00 |
| R11 | 0.11 | 0.13 | 0.13 | 0.13 | 0.13 | 0.13 | 0.14 | 0.14 | 0.17 | 0.17 | 1.00 |
| SUM | 3.21 | 6.63 | 8.54 | 11.13 | 13.49 | 15.33 | 22.09 | 27.64 | 45.67 | 49.17 | 76.00 |
| N = 11 | RCI = 1.51; CI = 0.127; CR = 0.084; λmax = 12.26 | ||||||||||
Table A11.
Pair-wise comparison reciprocal matrix for the firefighting and wildfire suppression fire effects category. RCI: random consistency index; CI: consistency index; CR: consistency ratio; λmax: principal eigenvalue.
Table A11.
Pair-wise comparison reciprocal matrix for the firefighting and wildfire suppression fire effects category. RCI: random consistency index; CI: consistency index; CR: consistency ratio; λmax: principal eigenvalue.
| Rank | Criteria | Weight | ||||||
|---|---|---|---|---|---|---|---|---|
| R1 | Fire behavior type | 0.299 | ||||||
| R2 | Fire reignition—spotting | 0.201 | ||||||
| R3 | Number of people participating in firefighting | 0.136 | ||||||
| R4 | Number of firefighting aircraft | 0.129 | ||||||
| R5 | Number of ground vehicles | 0.087 | ||||||
| R6 | Declaration of the area in a state of emergency | 0.072 | ||||||
| R7 | Community evacuation | 0.052 | ||||||
| R8 | International aid and reinforcements | 0.024 | ||||||
| R1 | R2 | R3 | R4 | R5 | R6 | R7 | R8 | |
| R1 | 1.00 | 2.00 | 3.00 | 3.00 | 4.00 | 4.00 | 5.00 | 6.00 |
| R2 | 0.50 | 1.00 | 2.00 | 2.00 | 3.00 | 3.00 | 4.00 | 6.00 |
| R3 | 0.33 | 0.50 | 1.00 | 1.00 | 2.00 | 3.00 | 3.00 | 6.00 |
| R4 | 0.33 | 0.50 | 1.00 | 1.00 | 2.00 | 2.00 | 3.00 | 6.00 |
| R5 | 0.25 | 0.33 | 0.50 | 0.50 | 1.00 | 2.00 | 2.00 | 5.00 |
| R6 | 0.25 | 0.33 | 0.33 | 0.50 | 0.50 | 1.00 | 2.00 | 5.00 |
| R7 | 0.20 | 0.25 | 0.33 | 0.33 | 0.50 | 0.50 | 1.00 | 4.00 |
| R8 | 0.17 | 0.17 | 0.17 | 0.17 | 0.20 | 0.20 | 0.25 | 1.00 |
| SUM | 3.0 | 5.1 | 8.3 | 8.5 | 13.2 | 15.7 | 20.3 | 39.0 |
| N = 8 | RCI = 1.41; CI = 0.051; CR = 0.036; λmax = 8.35 | |||||||
Table A12.
Pair-wise comparison reciprocal matrix for the casualties and fatalities fire effects category. RCI: random consistency index; CI: consistency index; CR: consistency ratio; λmax: principal eigenvalue.
Table A12.
Pair-wise comparison reciprocal matrix for the casualties and fatalities fire effects category. RCI: random consistency index; CI: consistency index; CR: consistency ratio; λmax: principal eigenvalue.
| Rank | Criteria | Weight | |||
|---|---|---|---|---|---|
| R1 | Civilian fatalities | 0.401 | |||
| R2 | Firefighting personnel fatalities | 0.304 | |||
| R3 | Firefighting aircraft losses | 0.147 | |||
| R4 | Injured | 0.104 | |||
| R5 | Firefighting vehicle losses | 0.044 | |||
| R1 | R2 | R3 | R4 | R5 | |
| R1 | 1.00 | 2.00 | 3.00 | 4.00 | 6.00 |
| R2 | 0.5 | 1.00 | 3.00 | 4.00 | 6.00 |
| R3 | 0.3 | 0.3 | 1.00 | 2.00 | 4.00 |
| R4 | 0.3 | 0.3 | 0.5 | 1.00 | 4.00 |
| R5 | 0.2 | 0.2 | 0.3 | 0.3 | 1.00 |
| SUM | 2.3 | 3.8 | 7.8 | 11.3 | 21.0 |
| N = 5 | RCI = 1,12; CI = 0.053; CR = 0.047; λmax = 5.21 | ||||
Table A13.
Pair-wise comparison reciprocal matrix for the destruction and damages to infrastructure fire effects category. RCI: random consistency index; CI: consistency index; CR: consistency ratio; λmax: principal eigenvalue.
Table A13.
Pair-wise comparison reciprocal matrix for the destruction and damages to infrastructure fire effects category. RCI: random consistency index; CI: consistency index; CR: consistency ratio; λmax: principal eigenvalue.
| Rank | Criteria | Weight | |||||||||
|---|---|---|---|---|---|---|---|---|---|---|---|
| R1 | Destroyed houses | 0.298 | |||||||||
| R2 | Cost of damages to water supply network | 0.173 | |||||||||
| R3 | Damages to monuments cultural heritage sites | 0.133 | |||||||||
| R4 | Cost of damages to electricity grid | 0.111 | |||||||||
| R5 | Cost of damages to agricultural/livestock installations | 0.095 | |||||||||
| R6 | Cost of damages to telecommunications | 0.059 | |||||||||
| R7 | Cost of damages to factories, renewable energy sources installations and industrial warehouses | 0.041 | |||||||||
| R8 | Cost of damages to public transportation network | 0.032 | |||||||||
| R9 | Cost of damages to factories, renewable energy sources and industrial warehouses | 0.024 | |||||||||
| R10 | Cost of damages to military facilities/equipment | 0.017 | |||||||||
| R11 | Destroyed household stables, warehouses, or auxiliary buildings | 0.017 | |||||||||
| R1 | R2 | R3 | R4 | R5 | R6 | R7 | R8 | R9 | R10 | R11 | |
| R1 | 1.00 | 4.00 | 4.00 | 5.00 | 5.00 | 6.00 | 7.00 | 7.00 | 7.00 | 8.00 | 8.00 |
| R2 | 0.25 | 1.00 | 2.00 | 3.00 | 3.00 | 5.00 | 6.00 | 6.00 | 6.00 | 7.00 | 7.00 |
| R3 | 0.25 | 0.50 | 1.00 | 2.00 | 2.00 | 4.00 | 5.00 | 6.00 | 6.00 | 6.00 | 6.00 |
| R4 | 0.20 | 0.33 | 0.50 | 1.00 | 2.00 | 4.00 | 4.00 | 5.00 | 6.00 | 6.00 | 6.00 |
| R5 | 0.20 | 0.33 | 0.50 | 0.50 | 1.00 | 3.00 | 4.00 | 5.00 | 5.00 | 6.00 | 6.00 |
| R6 | 0.17 | 0.20 | 0.25 | 0.25 | 0.33 | 1.00 | 2.00 | 3.00 | 4.00 | 5.00 | 5.00 |
| R7 | 0.14 | 0.17 | 0.20 | 0.25 | 0.25 | 0.50 | 0.20 | 2.00 | 3.00 | 4.00 | 4.00 |
| R8 | 0.14 | 0.17 | 0.17 | 0.20 | 0.20 | 0.33 | 0.50 | 1.00 | 2.00 | 3.00 | 3.00 |
| R9 | 0.14 | 0.17 | 0.17 | 0.17 | 0.20 | 0.25 | 0.33 | 0.50 | 1.00 | 2.00 | 2.00 |
| R10 | 0.13 | 0.14 | 0.17 | 0.17 | 0.17 | 0.20 | 0.25 | 0.33 | 0.50 | 1.00 | 1.00 |
| R11 | 0.13 | 0.14 | 0.17 | 0.17 | 0.17 | 0.20 | 0.25 | 0.33 | 0.50 | 1.00 | 1.00 |
| SUM | 2.7 | 7.2 | 9.1 | 12.7 | 14.3 | 24.5 | 29.5 | 36.2 | 41.0 | 49.0 | 49.0 |
| N = 11 | RCI = 1.51; CI = 0.096; CR = 0.064; λmax = 11.96 | ||||||||||
Table A14.
Pair-wise comparison reciprocal matrix for economic losses, compensation, and revenue losses fire effects category. RCI: random consistency index; CI: consistency index; CR: consistency ratio; λmax: principal eigenvalue.
Table A14.
Pair-wise comparison reciprocal matrix for economic losses, compensation, and revenue losses fire effects category. RCI: random consistency index; CI: consistency index; CR: consistency ratio; λmax: principal eigenvalue.
| Rank | Criteria | Weight | ||||||
|---|---|---|---|---|---|---|---|---|
| R1 | Compensation and funding for house and building restoration | 0.298 | ||||||
| R2 | Landscape rehabilitation measures cost | 0.248 | ||||||
| R3 | Agricultural production lost revenue | 0.132 | ||||||
| R4 | Effect on tourism and recreation | 0.132 | ||||||
| R5 | Cost to restore industrial and electricity production | 0.066 | ||||||
| R6 | Livestock production lost revenue | 0.066 | ||||||
| R7 | Non-wood forest products lost revenue | 0.039 | ||||||
| R8 | Timber and wood products lost revenue | 0.019 | ||||||
| R1 | R2 | R3 | R4 | R5 | R6 | R7 | R8 | |
| R1 | 1.00 | 2.00 | 3.00 | 3.00 | 5.00 | 5.00 | 6.00 | 8.00 |
| R2 | 0.50 | 1.00 | 3.00 | 3.00 | 5.00 | 5.00 | 6.00 | 8.00 |
| R3 | 0.33 | 0.33 | 1.00 | 1.00 | 3.00 | 3.00 | 5.00 | 7.00 |
| R4 | 0.33 | 0.33 | 1.00 | 1.00 | 3.00 | 3.00 | 5.00 | 7.00 |
| R5 | 0.20 | 0.20 | 0.33 | 0.33 | 1.00 | 1.00 | 3.00 | 6.00 |
| R6 | 0.20 | 0.20 | 0.33 | 0.33 | 1.00 | 1.00 | 3.00 | 6.00 |
| R7 | 0.17 | 0.17 | 0.20 | 0.20 | 0.33 | 0.33 | 1.00 | 5.00 |
| R8 | 0.13 | 0.13 | 0.14 | 0.14 | 0.17 | 0.17 | 0.20 | 1.00 |
| SUM | 2.9 | 4.4 | 9.0 | 9.0 | 18.5 | 18.5 | 29.2 | 48.0 |
| N = 8 | RCI = 1.41; CI = 0.088; CR = 0.062; λmax = 8.61 | |||||||
Appendix C. Evaluation of the FIRE Index for the 2011 Evros Fire
Appendix C.1. Landscape and Vegetation Fire Effects Category
The Evros fire burned mostly on highlands (>70%), with smaller parts in flat terrain and agricultural lands (almost 30%) (Criterion A.1). Burned area was comprised of 14% of agricultural lands, 12% of shrubland, 1% of bare soil, 23% of mixed or broadleaf forests and the remaining 50% was covered with conifers. The criterion A.2 received the following values and summed scores (SC), weighted by their cover 0.14 × 60 + 0.12 × 40 + 0.01 × 10 = 13.3 (SC0), and 0.23 × 80 = 18.4 and 0.5 × 100 = 50 (SC1 and SC4; Table A15). Since the broadleaf forests were comprised of Quercus spp., to estimate the first additive term (SC2), we multiplied its cover with the choice value (40) and averaged the sum of SC1 and SC2. Similarly, we estimated the second additive term (SC5) for the cover of Pinus brutia conifer forest (choice value: 40) and averaged the sum of SC4 and SC5. The final value of A.2 is the sum of the two additive terms and SC0. Approximately 50% of the affected area is a national park (Criterion A.3), and small-scale visibility reduction and smoke impacts were recorded near small villages (Criterion A.4). Erosion risk was mapped using methods described in Fox, Berolo, Carrega and Darboux [59] and we estimated 7% of the affected area had erosion risk less than low, 37% less than moderate, 33% moderate to high and 23% high. As a result, the criterion A.5 value is 0.07 × 10 + 0.37 × 40 + 0.33 × 70 + 0.23 × 100 = 61.6. Finally, the total burned area is 5900 ha receiving a 2.5 value as the general multiplier. The sum of all weighted values of these five criteria was 55.40 (138.5 after the general multiplier was applied) (Table A15), transformed to 45.08 out of 100 after normalization with Equation (2).
Table A15.
Evaluation table of fire effects on landscape and vegetation after the Evros fire. CR: criterion; CRD: criterion descriptor; AT: additive term; SC: Summed score. Original matching table: A1. Gray color: denotes a non-applicable or not available selection.
Table A15.
Evaluation table of fire effects on landscape and vegetation after the Evros fire. CR: criterion; CRD: criterion descriptor; AT: additive term; SC: Summed score. Original matching table: A1. Gray color: denotes a non-applicable or not available selection.
| Weight | ID | Type | Evaluation | 1st Value | 2nd Value | 3rd Value | Value | Weighted Value |
|---|---|---|---|---|---|---|---|---|
| 0.524 | A.1 | CR | 70% Highlands/30% flat terrain/agricultural land | 50 | 26.20 | |||
| 0.134 | A.2 | CR | 14% Agricultural land, 12% Shrubland, 1% Bare soil, 23% Mixed or broadleaf forest, 50% Conifer forest | 62.1 | 8.35 | |||
| CRD | 14% Agricultural land, 12% Shrubland, 1% Bare soil | 0.14 × 60; 0.12 × 40; 0.01 × 10 | 13.3 (SC0) | |||||
| AT | 23% Quercus spp. or Olea sylvestris | 0.23 × 80 = 18.4 (SC1) | 0.23 × 40 = 9.2 (SC2) | SC1+ SC2 = 27.6 (SC3) | SC3/2 = 13.8 | |||
| AT | 50% Pinus brutia or Pinus halepensis | 0.5 × 100 = 50 (SC4) | 0.5 × 40 = 20 (SC5) | SC1+ SC2 = 70 (SC6) | SC6/2 = 35 | |||
| 0.082 | A.3 | CR | National park | 80 (SC7) | (SC7+ SC8)/2 = 80 | 80 | 6.58 | |
| AT | 41–50% | 80 (SC8) | ||||||
| 0.033 | A.4 | CR | Small-scale visibility reduction and smoke impacts near small villages | 10 | 0.33 | |||
| 0.226 | A.5 | CR | 61.6 | 13.94 | ||||
| CRD | 7% less than low; 37% less than moderate; 33% more than moderate; 23% high | 0.07 × 10; 0.37 × 40; 0.33 × 70; 0.23 × 100 | ||||||
| Sum (A.1–A.5) | 55.40 | |||||||
| General Multiplier | 5900 ha | 2.5 | 2.5 × 55.40 = 138.5 | |||||
| Higher Value | 300 | Lower Value | 5.91 | |||||
| Final Category Score = 45.08/100 | ||||||||
Appendix C.2. General Environmental Impacts Fire Effects Category
After visiting the affected area, we noticed that although the remnants of burned insects and invertebrates could be found in low or moderate burn severity areas (Criterion B.1), the response of bees, sawflies, and wasps was unimodal, whereas flies and beetles showed a negative response to burn severity in terms of abundance, diversity and species richness [239], and no endangered or rare species have been recorded or are expected to be further threatened by the Evros fire. More than 40 different species of reptiles and amphibians reside in the area (Criterion B.2), and they are very important as they constitute the basic food source for birds of prey, storks and herons, and 53 small-sized mammals, including 24 bat species. Only a small number of carcasses were found during our inventories and samplings and the local Forest Service branch (personal communication) has not noticed long-term changes in species richness or habitat losses. In the affected area, 10 fish species have been identified (Criterion B.3), with one endemic, with their habitats being in streams and creeks that are extended and cross the burned area from north to south. Close to those aquatic habitats, we recorded low burn severity, and we expect few losses. The broader area is one of the most prominent bird habitats in Greece with a total of 202 bird species of various families (Criterion B.4). Furthermore, 36 out of the 38 European diurnal birds of prey species reside in Evros [245], with the coexistence of three out of the four species of European vultures [246]. We estimated some species of birds were impacted and experienced habitat loss during the first few post-fire years, while other opportunistic species thrived. These effects were moderated by the presence of unburned forested patches. Larger sized mammals, in particular wolves (Canis lupus) and wildcats (Felis silvestris), were noticed in unburned areas north of the affected areas, and thus the fire effects on their population are limited (Criterion B.5). Two floral species of the broader area are endemic to Greece (Minuartia greuteriana and Onosma kittanae), and three are rare (Cephalanthera epipactoides, Salix xanthicolakai, Zygophyllum album), while 29 are under protection (Criterion B.6). Their populations were partly affected by the Evros fire since they had widespread habitat, and their regeneration potential was not substantially affected. Salvage logging was extended and changed the vegetation composition of the area for a short-term, from conifer dominated lands to dense shrublands (Criterion B.7). Finally, we estimated the risk of fauna species composition changes or alien fauna species invasion as low (Criterion B.8). The affected area was 50% of the NATURA 2000 network (SC1 and SC2; Table A16). The sum of all weighted values of all eight criteria was 36.60 (73.21 after the general multiplier was applied) (Table A16), transformed to 24.40 out of 100 after normalization with Equation (2).
Table A16.
Evaluation table of general environmental impacts after the Evros fire. CR: criterion; AT: additive term; SC: Summed score. Original matching table: A2. Gray color: denotes a non-applicable or not available selection.
Table A16.
Evaluation table of general environmental impacts after the Evros fire. CR: criterion; AT: additive term; SC: Summed score. Original matching table: A2. Gray color: denotes a non-applicable or not available selection.
| Weight | ID | Type | Evaluation | 1st Value | Value | Weighted Value |
|---|---|---|---|---|---|---|
| 0.152 | B.1 | CR | More than few | 30 | 4.57 | |
| 0.111 | B.2 | CR | Few | 20 | 2.22 | |
| 0.026 | B.3 | CR | Few | 20 | 0.53 | |
| 0.219 | B.4 | CR | Several to extended | 80 | 17.49 | |
| 0.047 | B.5 | CR | Few to none | 10 | 0.47 | |
| 0.306 | B.6 | CR | Few with regeneration potential | 20 | 6.13 | |
| 0.076 | B.7 | CR | Extended | 60 | 4.58 | |
| 0.062 | B.8 | CR | Local | 10 | 0.62 | |
| Sum (B.1–B.8) | 36.60 | |||||
| General Multiplier | NATURA 2000 | 1.5 (SC1) | SC1 + SC2/2 = 2 | 2 × 36.60 = 73.21 | ||
| AT | 41–50% | 2.5 (SC2) | ||||
| Higher Value | 300 | Lower Value | 0 | |||
| Final Category Score = 24.40/100 | ||||||
Appendix C.3. Regeneration Potential and Vegetation Recovery Fire Effects Category
The average age range of the conifers was between 45–65 years old, since most were planted as the result of a vast reforestation effort that started 60 years ago by the local Forest Service (Criterion C.1). The broadleaf and evergreen shrubland forest age was between 40–60 years old (Criterion C.2). Using GIS analysis, we found the percentage of each slope class, with 25% being steeper than 15 degrees (Criterion C.3). The values were estimated using the criterion descriptor for the cover of each class (see Table A17). The most recent fire within the affected area occurred 50 years ago, burning a smaller portion of the 2011 affected area (Criterion C.4). Many unburned or partially burned forested patches, mostly clustered (Criterion C.5), formed a mosaic of burn severity (Figure 3). The grazing or animal browsing threat to regeneration success was limited since it is applied mostly by cattle and inside broadleaf forests or shrublands (Criterion C.6). The broader area has a strict protection status since it is both a national park and a NATURA 2000 area, and despite it not being illegal, the extended salvage logging caused important land use changes since new extended roads were opened to retrieve the timber and the entire landscape was heavily affected (Criterion C.7). The affected area experienced no urban or tourism pressure, especially in terms of influence in regeneration and vegetation recovery (Criterion C.8). Smoldering and severe surface and ground burning was extended (Criterion C.9), while the threat from insects and disease was partially non-existent due to the widespread salvage logging (Criterion C.10). Finally, using GIS on soil maps of the area, we found the percentages of the different soil types, and using the criterion description for C.11, we estimated its value (see Table A17). Using a WorldView satellite image (Figure 3), we estimated the percentage of the landscape that was burned (black—58%), scorched (brown—20%) and partially burned or unburned (green—22%). These values were used to estimate the value of the general multiplier, which is the average of SC1, SC2 and SC3 (Table A17). The sum of all weighted values of the 11 criteria was 31.99 (55.98 after the general multiplier was applied) (Table A17), transformed to 18.66 out of 100 after normalization with Equation (2).
Table A17.
Evaluation table of regeneration potential and vegetation recovery after the Evros fire. CR: criterion; CRD: criterion descriptor; SC: Summed score. Original matching table: A3. Gray color: denotes a non-applicable or not available selection.
Table A17.
Evaluation table of regeneration potential and vegetation recovery after the Evros fire. CR: criterion; CRD: criterion descriptor; SC: Summed score. Original matching table: A3. Gray color: denotes a non-applicable or not available selection.
| Weight | ID | Type | Evaluation | 1st value | Value | Weighted Value |
|---|---|---|---|---|---|---|
| 0.101 | C.1 | CR. | 45–65 years | 40 | 4.04 | |
| 0.078 | C.2 | CR. | 40–60 years | 20 | 1.56 | |
| 0.161 | C.3 | CR. | 20 | 3.22 | ||
| CRD | 19.5% (0–5°); 29% (5–10°); 26% (10–15°); 17% (15–20°); 8.5% (20–30°) | 0.195Χ0 + 0.29Χ10 + 0.26 Χ20 + 0.17Χ40 + 0.085Χ60 = 20 | ||||
| 0.127 | C.4 | CR. | 50 years | 20 | 2.53 | |
| 0.023 | C.5 | CR. | Many (Clustered) | 20 | 0.46 | |
| 0.259 | C.6 | CR. | Partial | 20 | 5.19 | |
| 0.108 | C.7 | CR. | Intense | 100 | 10.76 | |
| 0.047 | C.8 | CR. | None | 0 | 0.00 | |
| 0.026 | C.9 | CR. | Extended | 60 | 1.59 | |
| 0.012 | C.10 | CR. | Partial to None | 10 | 0.12 | |
| 0.058 | C.11 | CR. | 43.4 | 2.52 | ||
| CRD | 36% Deep soils with small amount of rocks; 38% Moderate depth soils with small amount of rocks; 26% Shallow soils with moderate amount of rocks | 0.36 × 10 + 0.38 × 50 + 0.26 × 80 = 43.4 | ||||
| Sum (C.1–C.11) | 31.99 | |||||
| General Multiplier | Burned 58% | 2 (SC1) | SC1 + SC2+ SC3/3 = 1.75 | 55.98 | ||
| Scorched 20% | 1 (SC2) | |||||
| Unburned 22% | 2.25 (SC3) | |||||
| Higher Value | 300 | Lower Value | 0 | |||
| Final Category Score = 18.66/100 | ||||||
Appendix C.4. Firefighting and Wildfire Suppression Activities Fire Effects Category
The Evros fire type was a combination of passive crown fire (i.e., torching) with active crown burns and smaller parts with only surface spread (Criterion D.1). Regarding new ignitions from spotting activity and fire reignition, they were evident and multiple due to intense wind gusts (Criterion D.2). During the suppression activities, 14 teams with 288 firefighters (Criterion D.3) and more than 25 vehicles (Criterion D.4) operated with the aid of more than 10 aircraft (Criterion D.5), including four Canadair CL-415 from France and Spain (Criterion D.6). The area was declared to be in a state of emergency (Criterion D.7), and the senior residents of two communities were moved to a safe location, although the Evros fire eventually did not affect these communities (Criterion D.8). The active fire spread lasted for approximately 72 h. The sum of all weighted values of the eight criteria was 89.95 (217.19 after the general multiplier was applied), transformed to 72.01 out of 100 after normalization with Equation (2) (Table A18).
Table A18.
Evaluation table of firefighting and wildfire suppression activities for the Evros fire. CR: criterion. Original matching Table A4.
Table A18.
Evaluation table of firefighting and wildfire suppression activities for the Evros fire. CR: criterion. Original matching Table A4.
| Weight | ID | Type | Evaluation | Value | Weighted Value |
|---|---|---|---|---|---|
| 0.299 | D.1 | CR | Torching/passive crown fire with active crown fire | 80 | 23.95 |
| 0.201 | D.2 | CR | Few | 80 | 16.07 |
| 0.136 | D.3 | CR | More than 70 people | 100 | 13.63 |
| 0.087 | D.4 | CR | More than 25 vehicles | 100 | 8.71 |
| 0.128 | D.5 | CR | More than 10 aircraft | 100 | 12.83 |
| 0.024 | D.6 | CR | Aircraft | 100 | 2.42 |
| 0.072 | D.7 | CR | Yes | 100 | 7.19 |
| 0.052 | D.8 | CR | 2 communities—partial evacuation | 40 | 2.08 |
| Sum (D.1–D.8) | 89.95 | ||||
| General Multiplier | 72 h | 2.5 | 217.19 | ||
| Higher Value | 300 | Lower Value | 4.11 | ||
| Final Category Score = 72.01/100 | |||||
Appendix C.5. Fatalities and Casualties Fire Effects Category
The number of fatalities from the Evros fire was zero, and no casualties on ground or aerial firefighting means occurred. As a result, this category has a score of 0 out of 100.
Appendix C.6. Destruction and Damages to Infrastructure Fire Effects Category
No house losses were recorded after the Evros fire (Criterion F.1), with only one destroyed auxiliary building—a warehouse/barn used for cattle (Criterion F.2). The area was mostly forested with no important monuments or cultural heritage sites within the burned perimeter (Criterion F.3). Minor damages were recorded on vehicles and other machinery used during fire suppression (Criterion F.4). Small damages also occurred to the electricity grid, mostly around roads on the grid poles and some burned cables (Criterion F.5). No damages were recorded to the telecommunication network (Criterion F.6), and minor damages were reported to the water supply network, mostly on plastic tubes used to transfer water across the landscape (Criterion F.7). Small fractions and damages occurred on the road network, mostly due to the use of heavy machinery, but additional roads were opened to aid the suppression efforts (Criterion F.8). We recorded no important damages to military facilities or equipment (Criterion F.9), factories, renewable energy sources and industrial warehouses (F.10), and agricultural or livestock installations (Criterion F.11). The sum of all weighted values of the 11 criteria was 4.62 out of 100 and no normalization was required since we did not use a general multiplier (Table A19).
Table A19.
Evaluation table of destruction and damages to infrastructure from the Evros fire. CR: criterion. Original matching Table A6.
Table A19.
Evaluation table of destruction and damages to infrastructure from the Evros fire. CR: criterion. Original matching Table A6.
| Weight | ID | Type | Evaluation | Value | Weighted Value |
|---|---|---|---|---|---|
| 0.298 | F.1 | CR | None | 0 | 0.00 |
| 0.041 | F.2 | CR | 1 | 10 | 0.41 |
| 0.133 | F.3 | CR | None | 0 | 0.00 |
| 0.017 | F.4 | CR | Minor (<15,000 €) | 10 | 0.17 |
| 0.111 | F.5 | CR | Minor (<15,000 €) to Small (<30,000 €) | 15 | 1.67 |
| 0.059 | F.6 | CR | None | 0 | 0.00 |
| 0.173 | F.7 | CR | Minor (<15,000 €) | 10 | 1.73 |
| 0.032 | F.8 | CR | Minor (<15,000 €) to Small (<30,000 €) | 20 | 0.64 |
| 0.017 | F.9 | CR | None | 0 | 0.00 |
| 0.024 | F.10 | CR | None | 0 | 0.00 |
| 0.095 | F.11 | CR | None | 0 | 0.00 |
| Sum (F.1–F.11) | 4.62 | ||||
| Higher Value | 100 | Lower Value | 0 | ||
| Final Category Score = 4.62/100 | |||||
Appendix C.7. Economic Losses, Compensation, and Revenue Losses Fire Effects Category
The Evros fire burned in an area with commercial conifer timber plantations and the lost revenue for the local timber company, the Forest Service and the logging associations was considered as high (Criterion G.1). Due to extended salvage logging, with oak timber being sold mostly as firewood and conifer timber to sawmills to produce particle boards, some of these economic losses were mitigated. We estimated high revenue losses from non-timber products (Criterion G.2), especially from game and foraging (e.g., mushrooms). Small revenue losses were estimated in agricultural production since there were burned agricultural lands, mostly wheat cultivations (Criterion G.3). Regarding livestock production revenue loss (Criterion G.4), they were estimated as moderate to small since the cattle raisers will have restricted access inside the burned lands for at least a decade, which will reduce grazing and increase the feeding costs. It was estimated that the costs for restoring industrial and electricity production will be small (Criterion G.5). No compensation for repair costs will be required for housing restoration (Criterion G.6). Since the area experiences a seasonal tourism influx for bird watching, if the bird populations decline this will probably have an impact on tourism and recreation revenue, but the lack of large tourism infrastructure and the kind of tourism suggests that the losses will be moderate (Criterion G.7). Finally, large scale reforestation and flood prevention investments were applied immediately after the Evros fire by the local Forest Service (Criterion G.8). Due to the size of the burned area (5900 ha), the general multiplier received a value of 2.5. The sum of all weighted values of the eight criteria was 44.89 (112.23 after the general multiplier was applied), transformed to 37.41 out of 100 after normalization with Equation (2) (Table A20).
Table A20.
Evaluation table of economic losses, compensation, and revenue losses from the Evros fire. CR: criterion. Original matching Table A7.
Table A20.
Evaluation table of economic losses, compensation, and revenue losses from the Evros fire. CR: criterion. Original matching Table A7.
| Weight | ID | Type | Evaluation | Value | Weighted Value |
|---|---|---|---|---|---|
| 0.019 | G.1 | CR | Moderate losses | 60 | 1.12 |
| 0.039 | G.2 | CR | High losses | 80 | 3.15 |
| 0.132 | G.3 | CR | Small losses | 20 | 2.64 |
| 0.066 | G.4 | CR | Moderate losses | 40 | 2.63 |
| 0.066 | G.5 | CR | Small cost | 20 | 1.31 |
| 0.298 | G.6 | CR | No cost | 0 | 0.00 |
| 0.132 | G.7 | CR | Scenery landscape and Forested area used for recreational/tourism purposes | 70 | 9.24 |
| 0.248 | G.8 | CR | Large scale reforestation and flood or erosion prevention measures | 100 | 24.79 |
| Sum (G.1–G.8) | 44.89 | ||||
| General Multiplier | 5900 ha | 2.5 | 112.23 | ||
| Higher Value | 300 | Lower Value | 0 | ||
| Final Category Score = 37.41/100 | |||||
Appendix D
- High landscape and vegetation fire effects category score: mountainous landscape where conifer forests cover >80% of the area with Pinus nigra or Pinus pinea, with a national park/forest >30% inside the burned perimeter, visibility reduction inside large sized populated areas and moderate probabilities of land degradation, erosion, and soil losses, from a fire that burned >100 ha.
- High environmental impacts fire effects category score: habitat losses of insects and invertebrates—several; small sized mammals/reptiles—few; fish—several; birds—several; large sized mammals—few. Extended losses of important/rare flora habitats, threat from alien species/changes in species composition for flora extended and for fauna local, with burned perimeter of >50% wildlife habitat or NATURA 2000 area.
- High regeneration potential fire effects category score: conifer forest age is 15–20 years, broadleaf/evergreen shrubland forest age is 15–20 years, slope is 15–20 degrees, the recent fire activity was >20 years but <30 years, with few clustered patches of unburned vegetation, with extended grazing pressure, and a history of illegal activities in the area, few tourism or urban pressures, extended smoldering, a small threat from insects and disease and shallow soils with moderate amount of rocks, and >85% burned vegetation.
- High firefighting and suppression fire effects category score: torching/passive crown fire, limited fire reignition–spotting, >55 people participated in fire suppression with more than 20 firefighting vehicles and three aircraft, with international aid in aircraft and declaration of the area to be in a state of emergency, >2 evacuated communities and a fire duration of at least 48 h.
- High casualties and fatalities fire effects category score: more than five fatalities, including at least one fatality from the firefighting personnel, more than 10 injured and at least one destroyed firefighting vehicle.
- High destruction and damages of infrastructure fire effects category score: >10 houses, 10 household stables, warehouses, or auxiliary buildings, high cost damages on vehicles and machinery, minor cost to electricity grid, small cost to water supply network, minor damages on public transportation network, moderate damages on agricultural/livestock installations.
- High economic losses fire effects category score: high losses of timber and wood products, high losses of non-wood forest products and high lost revenue from agricultural production, moderate losses of livestock production, moderate cost of compensations and funding for house and building restoration, where the fire burned close to a scenery landscape close to intensely developed tourism areas and with moderate scale reforestation and flood or erosion prevention measures, from a fire that burned >100 ha.
References
- DeBano, L.F.; Neary, D.G.; Ffolliott, P.F. Fire Effects on Ecosystems; John Wiley & Sons: New York, NY, USA, 1998. [Google Scholar]
- Viegas, D.X.; Ribeiro, L.M.; Viegas, M.T.; Pita, L.P.; Rossa, C. Impacts of Fire on Society: Extreme Fire Propagation Issues. In Earth Observation of Wildland Fires in Mediterranean Ecosystems; Chuvieco, E., Ed.; Springer: Berlin/Heidelberg, Germany, 2009; pp. 97–109. [Google Scholar]
- Moreira, F.; Ascoli, D.; Safford, H.; Adams, M.A.; Moreno, J.M.; Pereira, J.M.C.; Catry, F.X.; Armesto, J.; Bond, W.; González, M.E.; et al. Wildfire management in Mediterranean-type regions: Paradigm change needed. Environ. Res. Lett. 2020, 15, 011001. [Google Scholar] [CrossRef]
- Ellingwood, B.; Corotis, R.B.; Boland, J.; Jones, N.P. Assessing cost of dam failure. J. Water Resour. Plan. Manag. 1993, 119, 64–82. [Google Scholar] [CrossRef]
- Butry, D.T.; Mercer, E.D.; Prestemon, J.P.; Pye, J.M.; Holmes, T.P. What Is the price of catastrophic wildfire? J. For. 2001, 99, 9–17. [Google Scholar]
- Steelman, T.A.; Burke, C.A. Is wildfire policy in the United States sustainable? J. For. 2007, 105, 67–72. [Google Scholar] [CrossRef]
- Shakesby, R.; Doerr, S. Wildfire as a hydrological and geomorphological agent. Earth Sci. Rev. 2006, 74, 269–307. [Google Scholar] [CrossRef]
- Pausas, J.G.; Llovet, J.; Rodrigo, A.; Vallejo, R. Are wildfires a disaster in the Mediterranean basin?—A review. Int. J. Wildland Fire 2008, 17, 713–723. [Google Scholar] [CrossRef]
- Moreira, F.; Viedma, O.; Arianoutsou, M.; Curt, T.; Koutsias, N.; Rigolot, E.; Barbati, A.; Corona, P.; Vaz, P.; Xanthopoulous, G.; et al. Landscape—Wildfire interactions in southern Europe: Implications for landscape management. J. Environ. Manag. 2011, 92, 2389–2402. [Google Scholar] [CrossRef] [PubMed] [Green Version]
- McFayden, C.B.; Boychuk, D.; Woolford, D.G.; Wheatley, M.J.; Johnston, L. Impacts of wildland fire effects on resources and assets through expert elicitation to support fire response decisions. Int. J. Wildland Fire 2019, 28, 885–900. [Google Scholar] [CrossRef]
- Scott, J.H.; Thompson, M.P.; Calkin, D.E. A Wildfire Risk Assessment Framework for Land and Resource Management; RMRS-GTR-315; USDA Forest Service, Rocky Mountain Research Station: Fort Collins, CO, USA, 2013; p. 83. [Google Scholar]
- Kaloudis, S.; Tocatlidou, A.; Lorentzos, N.A.; Sideridis, A.B.; Karteris, M. Assessing wildfire destruction danger: A decision support system incorporating uncertainty. Ecol. Model. 2005, 181, 25–38. [Google Scholar] [CrossRef]
- Eidenshink, J.; Schwind, B.; Brewer, K.; Zhu, Z.; Quayle, B.; Howard, S. A project for monitoring trends in burn severity. Fire Ecol. 2007, 3, 3–21. [Google Scholar] [CrossRef]
- Lutes, D.C. FOFEM 6.5. First Order Fire Effects Model; USDA Forest Service: Washington, DC, USA, 2018; p. 84. [Google Scholar]
- Reinhardt, E.D.; Keane, R.E.; Brown, J.K. Modeling fire effects. Int. J. Wildland Fire 2001, 10, 373–380. [Google Scholar] [CrossRef]
- Stephan, K.; Miller, M.; Dickinson, M.B. First-order fire effects on herbs and shrubs: Present knowledge and process modeling needs. Fire Ecol. 2010, 6, 95–114. [Google Scholar] [CrossRef]
- Reinhardt, E.D.; Dickinson, M.B. First-order fire effects models for land management: Overview and issues. Fire Ecol. 2010, 6, 131–142. [Google Scholar] [CrossRef]
- Massman, W.J.; Frank, J.M.; Mooney, S.J. Advancing investigation and physical modeling of first-order fire effects on soils. Fire Ecol. 2010, 6, 36–54. [Google Scholar] [CrossRef]
- Engstrom, R.T. First-order fire effects on animals: Review and recommendations. Fire Ecol. 2010, 6, 115–130. [Google Scholar] [CrossRef]
- Prichard, S.J.; Karau, E.C.; Ottmar, R.D.; Kennedy, M.C.; Cronan, J.B.; Wright, C.S.; Keane, R.E. Evaluation of the CONSUME and FOFEM fuel consumption models in pine and mixed hardwood forests of the eastern United States. Can. J. For. Res. 2014, 44, 784–795. [Google Scholar] [CrossRef]
- Zybach, B.; Dubrasich, M.; Brenner, G.; Marker, J. US Wildfire Cost-Plus-Loss Economics Project: The ‘One-Pager’ Checklist. Available online: http://wildfire-economics.org/Library/Zybach_et_al_2009a.pdf (accessed on 1 September 2020).
- López-Rodríguez, A.; Escribano-Bombín, R.; Hernández-Jiménez, V.; Bell, S. Perceptions of ecological and aesthetic quality by natural resource professionals and local people. A qualitative exploration in a mountainous landscape (La Rioja, Spain). Landsc. Res. 2019, 44, 241–255. [Google Scholar] [CrossRef]
- Canter, D. The Psychology of Place; The Architectural Press Ltd.: London, UK, 1977. [Google Scholar]
- Olsen, C.S.; Kline, J.D.; Ager, A.A.; Olsen, K.A.; Short, K.C. Examining the influence of biophysical conditions on WUI homeowners’ wildfire risk mitigation activities in fire-prone landscapes. Ecol. Soc. 2017, 22, 20. [Google Scholar] [CrossRef] [Green Version]
- Lampin-Maillet, C.; Jappiot, M.; Long, M.; Bouillon, C.; Morge, D.; Ferrier, J.P. Mapping wildland-urban interfaces at large scales integrating housing density and vegetation aggregation for fire prevention in the South of France. J. Environ. Manag. 2010, 91, 732–741. [Google Scholar] [CrossRef] [Green Version]
- Beriatos, E. Urban forests, the green “walls” of greek cities: A policy for their protection and management (In Greek). Ser. Geogr. Res. 2002, 8, 420–427. [Google Scholar]
- Blondel, J.; Aronson, J. Biology and Wildlife of the Mediterranean Region; Oxford University Press: Oxford, UK, 1999. [Google Scholar]
- Darra, A.; Kavouras, M.; Tzelepis, N. Characterization of Greek municipalities and sub-municipalities according to their topographic relief. Geogr. Tech. 2010, 8, 12–19. [Google Scholar]
- Darra, A.; Kavouras, M.; Tzelepis, N. A rational characterization and visualization of topographic relief into mountainous, semi-mountainous and plane terrain. In Proceedings of the 21st International Cartographic Conference (ICC), Durban, South Africa, 10–16 August 2003. [Google Scholar]
- Christopoulou, O.; Polyzos, S.; Minetos, D. Peri-urban and urban forests in Greece: Obstacle or advantage to urban development? Manag. Environ. Qual. Int. J. 2007, 18, 382–395. [Google Scholar] [CrossRef]
- Stamou, Z.; Xystrakis, F.; Koutsias, N. The role of fire as a long-term landscape modifier: Evidence from long-term fire observations (1922–2000) in Greece. Appl. Geogr. 2016, 74, 47–55. [Google Scholar] [CrossRef]
- Arianoutsou, M. Landscape changes in Mediterranean ecosystems of Greece: Implications for fire and biodiversity issues. J. Mediterr. Ecol. 2001, 2, 165–178. [Google Scholar]
- Konstantinidis, P.; Tsiourlis, G.; Xofis, P.; Buckley, G.P. Taxonomy and ecology of Castanea sativa Mill. forests in Greece. Plant Ecol. 2008, 195, 235–256. [Google Scholar] [CrossRef]
- Tsiourlis, G.; Konstantinidis, P.; Xofis, P. Taxonomy and ecology of phryganic communities with Sarcopoterium spinosum (L.) Spach of the Aegean (Greece). Isr. J. Plant Sci. 2007, 55, 15–34. [Google Scholar] [CrossRef]
- Konstantinidis, P.; Chatziphilippidis, G.; Tsiourlis, G.; Tsiontsis, A. Taxonomy and ecology of plant communities of Quercus frainetto Ten.(Q. conferta Kit.) forests in Greece. Isr. J. Plant Sci. 2002, 50, 145–154. [Google Scholar] [CrossRef]
- Kailidis, D.; Karanikola, P. Forest Fires 1900–2000; Giahoudi Press: Thessaloniki, Greece, 2004; p. 434. (In Greek) [Google Scholar]
- Rodrigo, A.; Quintana, V.; Retana, J. Fire reduces Pinus pinea distribution in the northeastern Iberian Peninsula. Ecoscience 2007, 14, 23–30. [Google Scholar] [CrossRef]
- Chrysopolitou, V.; Apostolakis, A.; Avtzis, D.; Avtzis, N.; Diamandis, S.; Kemitzoglou, D.; Papadimos, D.; Perlerou, C.; Tsiaoussi, V.; Dafis, S. Studies on forest health and vegetation changes in Greece under the effects of climate changes. Biodivers. Conserv. 2013, 22, 1133–1150. [Google Scholar] [CrossRef]
- Arianoutsou, M.; Leone, V.; Moya, D.; Lovreglio, R.; Delipetrou, P.; de las Heras, J. Management of threatened, high conservation value, forest hotspots under changing fire regimes. In Post-Fire Management and Restoration of Southern European Forests; Springer: Berlin, Germany, 2012; pp. 257–291. [Google Scholar]
- Touchan, R.; Baisan, C.; Mitsopoulos, I.D.; Dimitrakopoulos, A.P. Fire history in European black pine (Pinus nigra Arn.) forests of the Valia Kalda, Pindus mountains, Greece. Tree Ring Res. 2012, 68, 45–50. [Google Scholar] [CrossRef] [Green Version]
- Papageorgiou, K.; Vogiatzakis, I.N. Nature protection in Greece: An appraisal of the factors shaping integrative conservation and policy effectiveness. Environ. Sci. Policy 2006, 9, 476–486. [Google Scholar] [CrossRef]
- Kokkoris, I.P.; Drakou, E.G.; Maes, J.; Dimopoulos, P. Ecosystem services supply in protected mountains of Greece: Setting the baseline for conservation management. Int. J. Biodivers. Sci. Ecosyst. Serv. Manag. 2018, 14, 45–59. [Google Scholar] [CrossRef] [Green Version]
- Jones, N.; Malesios, C.; Ioannidou, E.; Kanakaraki, R.; Kazoli, F.; Dimitrakopoulos, P.G. Understanding perceptions of the social impacts of protected areas: Evidence from three NATURA 2000 sites in Greece. Environ. Impact Assess. Rev. 2018, 73, 80–89. [Google Scholar] [CrossRef]
- Christensen, V.; Ferdana, Z.; Steenbeek, J. Spatial optimization of protected area placement incorporating ecological, social and economical criteria. Ecol. Model. 2009, 220, 2583–2593. [Google Scholar] [CrossRef]
- Parviainen, J. Virgin and natural forests in the temperate zone of Europe. For. Snow Landsc. Res. 2005, 79, 9–18. [Google Scholar]
- Eleftheriadou, E.; Raus, T. The vascular flora of the nature reserve Frakto Virgin Forest of Nomos Dramas (E Makedonia, Greece). Willdenowia 1996, 25, 455–485. [Google Scholar]
- Barbosa, P.; Camia, A.; Kucera, J.; Liberta, G.; Palumbo, I.; San-Miguel-Ayanz, J.; Schmuck, G. Assessment of forest fire impacts and emissions in the European Union based on the European forest fire Information System. Dev. Environ. Sci. 2008, 8, 197–208. [Google Scholar]
- Lazaridis, M.; Latos, M.; Aleksandropoulou, V.; Hov, Ø.; Papayannis, A.; Tørseth, K. Contribution of forest fire emissions to atmospheric pollution in Greece. Air Qual. Atmos. Health 2008, 1, 143–158. [Google Scholar] [CrossRef] [Green Version]
- Van Kamp, I.; Leidelmeijer, K.; Marsman, G.; De Hollander, A. Urban environmental quality and human well-being: Towards a conceptual framework and demarcation of concepts; a literature study. Landsc. Urban Plan. 2003, 65, 5–18. [Google Scholar] [CrossRef]
- Sastry, N. Forest fires, air pollution, and mortality in Southeast Asia. Demography 2002, 39, 1–23. [Google Scholar] [CrossRef] [PubMed]
- Sandberg, D.V.; Ottmar, R.D.; Peterson, J.L. Wildland Fire in Ecosystems: Effects of Fire on Air; CreateSpace Independent Publishing Platform RMRS-GTR-42-vol. 5; US Department of Agriculture, Forest Service, Rocky Mountain Research Station: Ogden, UT, USA, 2002; p. 79. [Google Scholar]
- Vedal, S.; Dutton, S.J. Wildfire air pollution and daily mortality in a large urban area. Environ. Res. 2006, 102, 29–35. [Google Scholar] [CrossRef]
- Ward, D.E.; Hardy, C.C. Smoke emissions from wildland fires. Environ. Int. 1991, 17, 117–134. [Google Scholar] [CrossRef] [Green Version]
- Sofiev, M.; Lanne, M.; Vankevich, R.; Prank, M.; Karppinen, A.; Kukkonen, J. Impact of wild-land fires on European air quality in 2006–2008. WIT Trans. Ecol. Environ. 2008, 119, 353–361. [Google Scholar]
- Robichaud, P.R. Fire effects on infiltration rates after prescribed fire in Northern Rocky Mountain forests, USA. J. Hydrol. 2000, 231–232, 220–229. [Google Scholar] [CrossRef]
- Parsons, A.; Robichaud, P.; Lewis, S.; Napper, C.; Clark, J.; Jain, T. Field Guide for Mapping Post-Fire Soil Burn Severity; Gen. Tech. Rep. RMRS-GTR-243; US Department of Agriculture, Forest Service, Rocky Mountain Research Station: Fort Collins, CO, USA, 2010. [Google Scholar]
- Myronidis, D.I.; Emmanouloudis, D.A.; Mitsopoulos, I.A.; Riggos, E.E. Soil erosion potential after fire and rehabilitation treatments in Greece. Environ. Modeling Assess. 2010, 15, 239–250. [Google Scholar] [CrossRef]
- Mallinis, G.; Gitas, I.Z.; Tasionas, G.; Maris, F. Multitemporal monitoring of land degradation risk Due to soil loss in a fire-prone Mediterranean landscape using multi-decadal Landsat imagery. Water Resour. Manag. 2016, 30, 1255–1269. [Google Scholar] [CrossRef]
- Fox, D.; Berolo, W.; Carrega, P.; Darboux, F. Mapping erosion risk and selecting sites for simple erosion control measures after a forest fire in Mediterranean France. Earth Surf. Process. Landf. J. Br. Geomorphol. Res. Group 2006, 31, 606–621. [Google Scholar] [CrossRef]
- Meneses, B.M. The impact of forest fires on soil loss from water erosion in Sierra de Sante Helena. Rev. Geográfica de Am. Cent. 2013, 51, 215–232. [Google Scholar]
- Flanagan, D.C.; Frankenberger, J.R.; Cochrane, T.A.; Renschler, C.S.; Elliot, W.J. Geospatial application of the water erosion prediction project WEPP model. Am. Soc. Agric. Biol. Eng. 2013, 56, 591–601. [Google Scholar]
- Myronidis, D.; Arabatzis, G. Evaluation of Greek post-fire erosion mitigation policy through spatial analysis. Pol. J. Environ. Stud. 2009, 18, 865–872. [Google Scholar]
- Raftoyannis, Y.; Spanos, I. Evaluation of log and branch barriers as post-fire rehabilitation treatments in a Mediterranean pine forest in Greece. Int. J. Wildland Fire 2005, 14, 183–188. [Google Scholar]
- Anthopoulou, B.; Panagopoulos, A.; Karyotis, T. The impact of land degradation on landscape in Northern Greece. Landslides 2006, 3, 289–294. [Google Scholar] [CrossRef]
- Pausas, J.G. Generalized fire response strategies in plants and animals. Oikos 2019, 128, 147–153. [Google Scholar] [CrossRef] [Green Version]
- Phitos, D.; Strid, A.; Snogerup, S.; Greuter, W. The Red Data Book of Rare and Threatened Plants of Greece; World Wide Fund for Nature: Athens, Greece, 1995. [Google Scholar]
- Arianoutsoua, M.; Vilà, M. Fire and invasive plant species in the Mediterranean basin. Isr. J. Ecol. Evol. 2012, 58, 195–203. [Google Scholar]
- Lazarina, M.; Sgardelis, S.P.; Tscheulin, T.; Devalez, J.; Mizerakis, V.; Kallimanis, A.S.; Papakonstantinou, S.; Kyriazis, T.; Petanidou, T. The effect of fire history in shaping diversity patterns of flower-visiting insects in post-fire Mediterranean pine forests. Biodivers. Conserv. 2017, 26, 115–131. [Google Scholar] [CrossRef]
- Swengel, A.B. A literature review of insect responses to fire, compared to other conservation managements of open habitat. Biodivers. Conserv. 2001, 10, 1141–1169. [Google Scholar] [CrossRef]
- Lyon, L.J.; Huff, M.H.; Hooper, R.G.; Telfer, L.S.; Schreiner, D.S.; Smith, J.K. Wildland Fire in Ecosystems: Effects of Fire on Fauna; RMRS-GTR-42; U.S. Department of Agriculture, Forest Service: Ogden, UT, USA, 2000; Volume 1, p. 83. [Google Scholar]
- Kaynas, B.Y.; Gurkan, B. Species richness and abundance of insects during post-fire succession of Pinus brutia forest in Mediterranean region. Pol. J. Ecol. 2008, 56, 165. [Google Scholar]
- Radea, C.; Arianoutsou, M. Cellulose decomposition rates and soil arthropod community in a Pinus halepensis Mill. forest of Greece after a wildfire. Eur. J. Soil Biol. 2000, 36, 57–64. [Google Scholar] [CrossRef]
- Moretti, M.; Duelli, P.; Obrist, M.K. Biodiversity and resilience of arthropod communities after fire disturbance in temperate forests. Oecologia 2006, 149, 312–327. [Google Scholar] [CrossRef] [Green Version]
- Izhaki, I. The impact of fire on vertebrates in the Mediterranean Basin: An overview. Isr. J. Ecol. Evol. 2012, 58, 221–233. [Google Scholar]
- Legakis, A.; Maragou, P. The Red Data Book of Threatened Animals of Greece; Greek Zoological Society: Yalou Spata, Athens, Greece, 2009; p. 528. [Google Scholar]
- Soyumert, A.; Tavsanoglu, C.; Macar, O.; Kainas, B.Y.; Gürkan, B. Presence of large and medium-sized mammals in a burned pine forest in southwestern Turkey. Hystrix Ital. J. Mammal. 2010, 21, 97–102. [Google Scholar]
- Sokos, C.; Birtsas, P.; Papaspyropoulos, K.G.; Tsachalidis, E.; Giannakopoulos, A.; Milis, C.; Spyrou, V.; Manolakou, K.; Valiakos, G.; Iakovakis, C. Mammals and habitat disturbance: The case of brown hare and wildfire. Curr. Zool. 2016, 62, 421–430. [Google Scholar] [CrossRef] [Green Version]
- Ford, W.M.; Menzel, M.A.; McGill, D.W.; Laerm, J.; McCay, T.S. Effects of a community restoration fire on small mammals and herpetofauna in the southern Appalachians. For. Ecol. Manag. 1999, 114, 233–243. [Google Scholar] [CrossRef]
- Hailey, A. The effects of fire and mechanical habitat destruction on survival of the tortoise Testudo hermanni in northern Greece. Biol. Conserv. 2000, 92, 321–333. [Google Scholar] [CrossRef]
- Sanz-Aguilar, A.; Anadón, J.D.; Giménez, A.; Ballestar, R.; Graciá, E.; Oro, D. Coexisting with fire: The case of the terrestrial tortoise Testudo graeca in mediterranean shrublands. Biol. Conserv. 2011, 144, 1040–1049. [Google Scholar] [CrossRef]
- Russell, K.R.; Van Lear, D.H.; Guynn, D.C. Prescribed fire effects on herpetofauna: Review and management implications. Wildlife Soc. Bull. (1973–2006) 1999, 27, 374–384. [Google Scholar]
- Gibbons, J.W.; Scott, D.E.; Ryan, T.J.; Buhlmann, K.A.; Tuberville, T.D.; Metts, B.S.; Greene, J.L.; Mills, T.; Leiden, Y.; Poppy, S. The Global Decline of Reptiles, Déjà Vu Amphibians: Reptile species are declining on a global scale. Six significant threats to reptile populations are habitat loss and degradation, introduced invasive species, environmental pollution, disease, unsustainable use, and global climate change. BioScience 2000, 50, 653–666. [Google Scholar]
- Torre, I.; Díaz, M. Small mammal abundance in Mediterranean post-fire habitats: A role for predators? Acta Oecologica 2004, 25, 137–142. [Google Scholar] [CrossRef]
- Kottelat, M.; Barbieri, R. Pseudophoxinus laconicus, a new species of minnow from Peloponnese, Greece, with comments on the West Balkan Pseudophoxinus species (Teleostei: Cyprinidae). Ichthyol. Explor. Freshw. 2004, 15, 147–160. [Google Scholar]
- Economidis, P.S.; Banarescu, P.M. The distribution and origins of freshwater fishes in the Balkan Peninsula, especially in Greece. Inter. Rev. Gesamten Hydrobiol. Hydrogr. 1991, 76, 257–284. [Google Scholar] [CrossRef]
- Economou, A.; Giakoumi, S.; Vardakas, L.; Barbieri, R.; STOUMBOUDI, M.Τ.; Zogaris, S. The freshwater ichthyofauna of Greece-an update based on a hydrographic basin survey. Mediterr. Mar. Sci. 2007, 8, 91–166. [Google Scholar] [CrossRef] [Green Version]
- Economou, A.N.; Barbieri, R.; Stoumboudi, M.T. Threatened fishes of the world: Leuciscus keadicus (Stephanidis 1971) (Cyprinidae). Environ. Biol. Fishes 2005, 73, 252. [Google Scholar] [CrossRef]
- Economidis, P.S.; Dimitriou, E.; Pagoni, R.; Michaloudi, E.; Natsis, L. Introduced and translocated fish species in the inland waters of Greece. Fish. Manag. Ecol. 2000, 7, 239–250. [Google Scholar] [CrossRef]
- Reynolds, J.D.; Webb, T.J.; Hawkins, L.A. Life history and ecological correlates of extinction risk in European freshwater fishes. Can. J. Fish. Aquat. Sci. 2005, 62, 854–862. [Google Scholar] [CrossRef]
- Minshall, G.W. Responses of stream benthic macroinvertebrates to fire. For. Ecol. Manag. 2003, 178, 155–161. [Google Scholar] [CrossRef]
- Rieman, B.E.; Hessburg, P.F.; Luce, C.; Dare, M.R. Wildfire and management of forests and native fishes: Conflict or opportunity for convergent solutions? BioScience 2010, 60, 460–468. [Google Scholar] [CrossRef] [Green Version]
- Rieman, B.; Clayton, J. Wildfire and native fish: Issues of forest health and conservation of sensitive species. Fisheries 1997, 22, 6–15. [Google Scholar] [CrossRef]
- Dunham, J.B.; Young, M.K.; Gresswell, R.E.; Rieman, B.E. Effects of fire on fish populations: Landscape perspectives on persistence of native fishes and nonnative fish invasions. For. Ecol. Manag. 2003, 178, 183–196. [Google Scholar] [CrossRef] [Green Version]
- Apfelbaum, S.; Haney, A. Bird populations before and after wildfire in a Great Lakes pine forest. Condor 1981, 83, 347–354. [Google Scholar] [CrossRef]
- Pons, P.; Clavero, M. Bird responses to fire severity and time since fire in managed mountain rangelands. Anim. Conserv. 2010, 13, 294–305. [Google Scholar] [CrossRef]
- Zozaya, E.L.; Brotons, L.; Vallecillo, S. Bird community responses to vegetation heterogeneity following non-direct regeneration of Mediterranean forests after fire. Ardea 2011, 99, 73–84. [Google Scholar] [CrossRef] [Green Version]
- Smucker, K.M.; Hutto, R.L.; Steele, B.M. Changes in bird abundance after wildfire: Importance of fire severity and time since fire. Ecol. Appl. 2005, 15, 1535–1549. [Google Scholar] [CrossRef] [Green Version]
- Izhaki, I.; Adar, M. The effects of post-fire management on bird community succession. Int. J. Wildland Fire 1997, 7, 335–342. [Google Scholar] [CrossRef]
- Williams, D.R.; Pople, R.G.; Showler, D.A.; Dicks, L.V.; Child, M.F.; Zu Ermgassen, E.K.; Sutherland, W.J. Bird Conservation: Global Evidence for the Effects of Interventions; Pelagic Publishing: Exeter, UK, 2013; Volume 2. [Google Scholar]
- Robinson, N.M.; Leonard, S.W.; Bennett, A.F.; Clarke, M.F. Refuges for birds in fire-prone landscapes: The influence of fire severity and fire history on the distribution of forest birds. For. Ecol. Manag. 2014, 318, 110–121. [Google Scholar] [CrossRef]
- Bond, M.L. Chapter 4—Mammals and Mixed- and High-severity Fire. In The Ecological Importance of Mixed-Severity Fires; DellaSala, D.A., Hanson, C.T., Eds.; Elsevier: Amsterdam, The Netherlands, 2015; pp. 89–117. [Google Scholar]
- Papageorgiou, N.; Vlachos, C.; Sfougaris, A.; Tsachalidis, E. Status and diet of wolves in Greece. Acta Theriol. 1994, 39, 411–416. [Google Scholar] [CrossRef] [Green Version]
- Karaiskou, N.; Tsakogiannis, A.; Gkagkavouzis, K.; Park, O.o.P.N.; Papika, S.; Latsoudis, P.; Kavakiotis, I.; Pantis, J.; Abatzopoulos, T.J.; Triantaphyllidis, C. Greece: A Balkan subrefuge for a remnant red deer (Cervus elaphus) population. J. Hered. 2014, 105, 334–344. [Google Scholar] [CrossRef] [PubMed] [Green Version]
- Mertzanis, G.A. Brown Bear in Greece: Distribution, Present Status: Ecology of a Northern Pindus Subpopulation. Bears Biol. Manag. 1994, 187–197. [Google Scholar] [CrossRef]
- Brown, J.K.; Smith, J.K. Wildland Fire in Ecosystems: Effects of Fire on Flora; Gen. Tech. Rep. RMRS-GTR-42; US Department of Agriculture, Forest Service, Rocky Mountain Research Station: Ogden, UT, USA, 2000; Volume 2, p. 257. [Google Scholar]
- Georghiou, K.; Delipetrou, P. Patterns and traits of the endemic plants of Greece. Bot. J. Linn. Soc. 2010, 162, 130–153. [Google Scholar] [CrossRef] [Green Version]
- De Montmollin, B.; Strahm, W. The Top 50 Mediterranean Island Plants: Wild Plants at the Brink of Extinction, and What Is Needed to Save Them; IUCN/SSC; Mediterranean Islands Plant Specialist Group: Cambridge, UK, 2005. [Google Scholar]
- Vitousek, P.M. Biological invasions and ecosystem processes: Towards an integration of population biology and ecosystem studies. In Ecosystem Management; Springer: New York, NY, USA, 1990; pp. 183–191. [Google Scholar]
- D’Antonio, C.M.; Vitousek, P.M. Biological invasions by exotic grasses, the grass/fire cycle, and global change. Annu. Rev. Ecol. Syst. 1992, 23, 63–87. [Google Scholar] [CrossRef]
- Majumdar, S.K.; Brenner, F.J.; Lovich, J.E.; Schalles, J.F.; Miller, E.W. Biological Diversity: Problems and Challenges; Native plant biodiversity vs. the introduced invaders: Status of the conflict and future management options; Pennsylvania Academy of Science: Easton, PA, USA, 1994; pp. 92–113. [Google Scholar]
- Wilcove, D.S.; Rothstein, D.; Dubow, J.; Phillips, A.; Losos, E. Quantifying threats to imperiled species in the United States. BioScience 1998, 48, 607–615. [Google Scholar] [CrossRef] [Green Version]
- Pimentel, D. Biological Invasionseconomic and Environmental Costs of Alien Plant, Animal, and Microbe Species; CRC Press: Boca Raton, FL, USA, 2011. [Google Scholar]
- Lambdon, P.; Pyšek, P.; Basnou, C.; Hejda, M.; Arianoutsou, M.; Essl, F.; Jarošík, V.; Pergl, J.; Winter, M.; Anastasiu, P. Alien flora of Europe: Species diversity, temporal trends, geographical patterns and research needs. Preslia 2008, 80, 101–149. [Google Scholar]
- Payne, C.J.; Ritchie, E.G.; Kelly, L.T.; Nimmo, D.G. Does fire influence the landscape-scale distribution of an invasive mesopredator? PLoS ONE 2014, 9, e107862. [Google Scholar] [CrossRef]
- Robinson, N.M.; Leonard, S.W.; Ritchie, E.G.; Bassett, M.; Chia, E.K.; Buckingham, S.; Gibb, H.; Bennett, A.F.; Clarke, M.F. Refuges for fauna in fire-prone landscapes: Their ecological function and importance. J. Appl. Ecol. 2013, 50, 1321–1329. [Google Scholar] [CrossRef]
- Adamopoulou, C.; Legakis, A. First account on the occurrence of selected invasive alien vertebrates in Greece. BioInvasions Rec. 2016, 5, 189–196. [Google Scholar] [CrossRef]
- Salata, S.; Georgiadis, C.; Borowiec, L. Invasive ant species (Hymenoptera: Formicidae) of Greece and Cyprus. North West. J. Zool. 2018, 15, 13–23. [Google Scholar]
- Demertzis, K.; Iliadis, L. The impact of climate change on biodiversity: The ecological consequences of invasive species in Greece. In Handbook of Climate Change Communication: Vol. 1: Theory of Climate Change Communication; Leal Filho, W., Manolas, E., Azul, A.M., Azeiteiro, U.M., McGhie, H., Eds.; Springer International Publishing: Cham, Switzerland, 2018; pp. 15–38. [Google Scholar] [CrossRef]
- Thanos, C.A.; Daskalakou, E.N.; Nikolaidou, S. Early post-fire regeneration of a Pinus halepensis forest on Mount Párnis, Greece. J. Veg. Sci. 1996, 7, 273–280. [Google Scholar] [CrossRef]
- Tapias, R.; Gil, L.; Fuentes-Utrilla, P.; Pardos, J.A. Canopy seed banks in Mediterranean pines of south-eastern Spain: A comparison between Pinus halepensis Mill., P. pinaster Ait., P. nigra Arn. and P. pinea L. J. Ecol. 2001, 629–638. [Google Scholar] [CrossRef]
- Ne’eman, G.; Goubitz, S.; Nathan, R. Reproductive traits of Pinus halepensis in the light of fire—A critical review. Plant Ecol. 2004, 171, 69–79. [Google Scholar] [CrossRef]
- Thanos, C.A.; Daskalakou, E.N. Reproduction in Pinus halepensis and P. brutia. In Ecology, Biogeography and Management of Pinus halepensis and P. brutia Forest Ecosystems in the Mediterranean Basin; Ne’eman, G., Trabaud, L., Eds.; Backhuys Publishers: Leiden, The Netherlands, 2000; pp. 79–90. [Google Scholar]
- Climent, J.; Prada, M.A.; Calama, R.; Chambel, M.R.; De Ron, D.S.; Alía, R. To grow or to seed: Ecotypic variation in reproductive allocation and cone production by young female Aleppo pine (Pinus halepensis, Pinaceae). Am. J. Bot. 2008, 95, 833–842. [Google Scholar] [CrossRef] [PubMed]
- Stroempl, G. Thinning Clumps of Northern Hardwood Stump Sprouts to Produce High Quality Timber; Ontario Ministry of Natural Resources: Peterborough, ON, Canada, 1983; Volume 104. [Google Scholar]
- Van Lear, D.H. Fire and oak regeneration in the southern Appalachians. In Proceedings of the Fire and the Environment: Ecological and Cultural Perspectives, Knoxville, TN, USA, 20–24 March 1990; pp. 15–21. [Google Scholar]
- Sohrabi, H.; Jourgholami, M.; Tavankar, F.; Venanzi, R.; Picchio, R. Post-harvest evaluation of soil physical properties and natural regeneration growth in steep-slope terrains. Forests 2019, 10, 1034. [Google Scholar] [CrossRef] [Green Version]
- Broncano, M.J.; Retana, J. Topography and forest composition affecting the variability in fire severity and post-fire regeneration occurring after a large fire in the Mediterranean basin. Int. J. Wildland Fire 2004, 13, 209–216. [Google Scholar] [CrossRef]
- Perevolotsky, A.; Haimov, Y. The effect of thinning and goat browsing on the structure and development of Mediterranean woodland in Israel. For. Ecol. Manag. 1992, 49, 61–74. [Google Scholar] [CrossRef]
- Campbell, K.; Donlan, C.J. Feral goat eradications on islands. Conserv. Biol. 2005, 19, 1362–1374. [Google Scholar] [CrossRef]
- Agee, J. The historical role of fire in Pacific Northwest forests. In Natural and Prescribed Fire in Pacific Northwest Forests; Walstead, J., Radosevich, S., Sandberg, D., Eds.; Oregon State University Press: Corvallis, OR, USA, 1990; pp. 25–38. [Google Scholar]
- Lentile, L.B.; Smith, F.W.; Shepperd, W.D. Patch structure, fire-scar formation, and tree regeneration in a large mixed-severity fire in the South Dakota Black Hills, USA. Can. J. For. Res. 2005, 35, 2875–2885. [Google Scholar] [CrossRef]
- Arianoutsou, M.; Christopoulou, A.; Kazanis, D.; Tountas, T.; Ganou, E.; Bazos, I.; Kokkoris, Y. Effects of fire on high altitude coniferous forests of Greece. In Proceedings of the VI International Forest Fire Research Conference, Coimbra, Portugal, 15–18 November 2010. [Google Scholar]
- Tacconi, L.; Boscolo, M.; Brack, D. National and International Policies to Control illegal Forest Activities. A Report for the Ministry of Foreign Affairs, Government of Japan; Center for International Forestry Research: Jakarta, Indonesia, 2003. [Google Scholar]
- Kuvan, Y. The use of forests for the purpose of tourism: The case of Belek Tourism Center in Turkey. J. Environ. Manag. 2005, 75, 263–274. [Google Scholar] [CrossRef]
- Atmiş, E.; Özden, S.; Lise, W. Urbanization pressures on the natural forests in Turkey: An overview. Urban. For. Urban. Green. 2007, 6, 83–92. [Google Scholar] [CrossRef]
- Ryan, K.C.; Noste, N.V. Evaluating Prescribed Fires; General Technical Report INT-182; USDA Forest Service Intermountain Forest and Range Experiment Station: Ogden, Utah, USA, 1985; pp. 230–238. [Google Scholar]
- De Dios, V.R.; Fischer, C.; Colinas, C. Climate change effects on Mediterranean forests and preventive measures. New For. 2007, 33, 29–40. [Google Scholar] [CrossRef]
- Hansen, E.M. Alien forest pathogens: Phytophthora species are changing world forests. Boreal Environ. Res. 2008, 13, 33–41. [Google Scholar]
- Winder, R.; Shamoun, S. Forest pathogens: Friend or foe to biodiversity? Can. J. Plant Pathol. 2006, 28, S221–S227. [Google Scholar] [CrossRef]
- López-Soria, L.; Castell, C. Comparative genet survival after fire in woody Mediterranean species. Oecologia 1992, 91, 493–499. [Google Scholar] [CrossRef]
- Minotta, G.; Pinzauti, S. Effects of light and soil fertility on growth, leaf chlorophyll content and nutrient use efficiency of beech (Fagus sylvatica L.) seedlings. For. Ecol. Manag. 1996, 86, 61–71. [Google Scholar] [CrossRef]
- Spanos, I.A.; Radoglou, K.M.; Raftoyannis, Y. Site Quality effects on post-fire regeneration of pinus brutia forest on a Greek Island. Appl. Veg. Sci. 2001, 4, 229–236. [Google Scholar] [CrossRef]
- Key, C.H.; Benson, N.C. Landscape assessment (LA). In FIREMON: Fire Effects Monitoring and Inventory System; Lutes, D.C., Keane, R.E., Caratti, J.F., Key, C.H., Benson, N.C., Sutherland, S., Gangi, L.J., Eds.; Gen. Tech. Rep. RMRS-GTR-164-CD, LA-1-55; US Department of Agriculture, Forest Service, Rocky Mountain Research Station: Fort Collins, CO, USA, 2006; p. 164. [Google Scholar]
- Thanos, C.Á.; Doussi, M.A. Post-fire regeneration of Pinus brutia forests. In Ecology, Biogeography and Management of Pinus Halepensis and P. brutia Forest Ecosystems in the Mediterranean Basin; Ne’eman, G., Trabaud, L., Eds.; Backhuys Publishers: Leiden, The Netherlands, 2000; pp. 291–301. [Google Scholar]
- Arianoutsou, M. Aspects of demography in post-fire Mediterranean plant communities of Greece. In Landscape Disturbance and Biodiversity in Mediterranean-Type Ecosystems; Rundel, P., Montenegro, G., Jaksic, F.M., Eds.; Springer: New York, NY, USA, 1998; pp. 273–295. [Google Scholar]
- Ordóñez, J.L.; Retana, J.; Espelta, J.M. Effects of tree size, crown damage, and tree location on post-fire survival and cone production of Pinus nigra trees. For. Ecol. Manag. 2005, 206, 109–117. [Google Scholar] [CrossRef]
- Konstantinidis, P.; Tsiourlis, G.; Galatsidas, S. Effects of wildfire season on the resprouting of kermes oak (Quercus coccifera L.). For. Ecol. Manag. 2005, 208, 15–27. [Google Scholar] [CrossRef]
- Konstantinidis, P.; Tsiourlis, G.; Xofis, P. Effect of fire season, aspect and pre-fire plant size on the growth of Arbutus unedo L.(strawberry tree) resprouts. For. Ecol. Manag. 2006, 225, 359–367. [Google Scholar] [CrossRef]
- Cruz, A.; Pérez, B.; Quintana, J.R.; Moreno, J.M. Resprouting in the Mediterranean-type shrub Erica australis afffected by soil resource availability. J. Veg. Sci. 2002, 13, 641–650. [Google Scholar]
- Pausas, J.G. Resprouting of Quercus suber in NE Spain after fire. J. Veg. Sci. 1997, 8, 703–706. [Google Scholar] [CrossRef] [Green Version]
- Espelta, J.M.; Barbati, A.; Quevedo, L.; Tárrega, R.; Navascués, P.; Bonfil, C.; Peguero, G.; Fernández-Martínez, M.; Rodrigo, A. Post-fire management of mediterranean broadleaved forests. In Post-Fire Management and Restoration of Southern European Forests; Moreira, F., Arianoutsou, M., Corona, P., De las Heras, J., Eds.; Springer: Dordrecht, The Netherlands, 2012; pp. 171–194. [Google Scholar] [CrossRef]
- Vallejo, V.R.; Arianoutsou, M.; Moreira, F. Fire Ecology and Post-Fire Restoration Approaches in Southern European Forest Types. In Post-Fire Management and Restoration of Southern European Forests; Moreira, F., Arianoutsou, M., Corona, P., De las Heras, J., Eds.; Springer: Dordrecht, The Netherlands, 2012; pp. 93–119. [Google Scholar] [CrossRef]
- Tsitsoni, T. Conditions determining natural regeneration after wildfires in the Pinus halepensis (Miller, 1768) forests of Kassandra Peninsula (North Greece). For. Ecol. Manag. 1997, 92, 199–208. [Google Scholar] [CrossRef]
- Miller, M.E.; MacDonald, L.H.; Robichaud, P.R.; Elliot, W.J. Predicting post-fire hillslope erosion in forest lands of the western United States. Int. J. Wildland Fire 2011, 20, 982–999. [Google Scholar] [CrossRef]
- Pausas, J.; Ribeiro, E.; Vallejo, R. Post-fire regeneration variability of Pinus halepensis in the eastern Iberian Peninsula. For. Ecol. Manag. 2004, 203, 251–259. [Google Scholar] [CrossRef]
- Goudelis, G.; Ganatsas, P.; Spanos, I.; Karpi, A. Effect of repeated fire on plant community recovery in Penteli, central Greece. In Eco-and Ground Bio-Engineering: The Use of Vegetation to Improve Slope Stability; Springer: Dordrecht, The Netherlands, 2007; pp. 337–343. [Google Scholar]
- Papanastasis, V.P. Effects of season and frequency of burning on a phryganic rangeland in Greece. Rangel. Ecol. Manag. J. Range Manag. Arch. 1980, 33, 251–255. [Google Scholar] [CrossRef]
- Malkisnon, D.; Wittenberg, L.; Beeri, O.; Barzilai, R. Effects of repeated fires on the structure, composition, and dynamics of Mediterranean maquis: Short-and long-term perspectives. Ecosystems 2011, 14, 478–488. [Google Scholar] [CrossRef]
- Eugenio, M.; Lloret, F. Effects of repeated burning on mediterranean communities of the northeastern Iberian Peninsula. J. Veg. Sci. 2006, 17, 755–764. [Google Scholar] [CrossRef]
- Abella, S.R.; Covington, W.W.; Fulé, P.Z.; Lentile, L.B.; Sanchez Meador, A.J.; Morgan, P. Past, present, and future old growth in frequent-fire conifer forests of the Western United States. Ecol. Soc. 2007, 12, 16. [Google Scholar] [CrossRef] [Green Version]
- Turner, M.G.; Romme, W.H.; Tinker, D.B. Surprises and lessons from the 1988 Yellowstone fires. Front. Ecol. Environ. 2003, 1, 351–358. [Google Scholar] [CrossRef]
- Ordóñez, J.L.; Molowny-Horas, R.; Retana, J. A model of the recruitment of Pinus nigra from unburned edges after large wildfires. Ecol. Model. 2006, 197, 405–417. [Google Scholar] [CrossRef]
- Meddens, A.J.H.; Kolden, C.A.; Lutz, J.A.; Smith, A.M.S.; Cansler, C.A.; Abatzoglou, J.T.; Meigs, G.W.; Downing, W.M.; Krawchuk, M.A. Fire Refugia: What are they, and why do they matter for global change? Bioscience 2018, 68, 944–954. [Google Scholar] [CrossRef]
- Coop, J.D.; DeLory, T.J.; Downing, W.M.; Haire, S.L.; Krawchuck, M.A.; Miller, C.; Parisien, M.A.; Walker, R.B. Contributions of fire refugia to resilient ponderosa pine and dry mixed-conifer forest landscapes. Ecosphere 2019, 10, e02809. [Google Scholar] [CrossRef]
- Christopoulou, A.; Fyllas, N.M.; Andriopoulos, P.; Koutsias, N.; Dimitrakopoulos, P.G.; Arianoutsou, M. Post-fire regeneration patterns of Pinus nigra in a recently burned area in Mount Taygetos, Southern Greece: The role of unburned forest patches. For. Ecol. Manag. 2014, 327, 148–156. [Google Scholar] [CrossRef]
- Carmel, Y.; Kadmon, R. Effects of grazing and topography on long-term vegetation changes in a Mediterranean ecosystem in Israel. Plant. Ecol. 1999, 145, 243–254. [Google Scholar] [CrossRef]
- Bergmeier, E. Combined effects of fire and grazing on phrygana vegetation-a case study in SW Crete (Greece). Ecol. Mediterr. 1997, 23, 1–10. [Google Scholar] [CrossRef]
- Henderson, M.; Kalabokidis, K.; Marmaras, E.; Konstantinidis, P.; Marangudakis, M. Fire and society: A comparative analysis of wildfire in Greece and the United States. Hum. Ecol. Rev. 2005, 12, 169–182. [Google Scholar]
- Tsilimigkas, G.; Kizos, T.; Gourgiotis, A. Unregulated urban sprawl and spatial distribution of fire events: Evidence from Greece. Environ. Hazards 2018, 17, 436–455. [Google Scholar] [CrossRef]
- Lekakis, J.N.; Kousis, M. Economic crisis, Troika and the environment in Greece. South. Eur. Soc. Politics 2013, 18, 305–331. [Google Scholar] [CrossRef] [Green Version]
- Stavros, S.; Fani, S.; Stergios, T.; Ioannis, S.; Olga, C. The environmental pressures and perspectives of tourism on coastal and insular zone. The case of Greece. Nat. Environ. Pollut. Technol. 2016, 15, 1009–1020. [Google Scholar]
- Morgan, P.; Neuenschwander, L.F. Shrub response to high and low severity burns following clearcutting in northern Idaho. West. J. Appl. For. 1988, 3, 5–9. [Google Scholar] [CrossRef]
- Varner, J.M.; Putz, F.E.; O’Brien, J.J.; Hiers, J.K.; Mitchell, R.J.; Gordon, D.R. Post-fire tree stress and growth following smoldering duff fires. For. Ecol. Manag. 2009, 258, 2467–2474. [Google Scholar] [CrossRef]
- Watts, A.C.; Kobziar, L.N. Smoldering combustion and ground fires: Ecological effects and multi-scale significance. Fire Ecol. 2013, 9, 124–132. [Google Scholar] [CrossRef]
- Markalas, S. Insects attacking burnt pine trees (Pinus halepensis, P. brutia, and P. nigra) in Greece. Anz. Schaedlingskunde Pflanzenschutz Umweltschutz 1991, 64, 72–75. [Google Scholar] [CrossRef]
- Krawchuk, M.A.; Meigs, G.W.; Cartwright, J.M.; Coop, J.D.; Davis, R.; Holz, A.; Kolden, C.; Meddens, A.J.H. Disturbance refugia within mosaics of forest fire, drought, and insect outbreaks. Front. Ecol. Environ. 2020, 18, 235–244. [Google Scholar] [CrossRef]
- McCullough, D.G.; Werner, R.A.; Neumann, D. Fire and insects in northern and boreal forest ecosystems of North America. Annu. Rev. Entomol. 1998, 43, 107–127. [Google Scholar] [CrossRef] [Green Version]
- Parmeter, J.R., Jr. Effects of fire on pathogens. In Proceedings of the Symposium on Environmental Consequences of Fire and Fuel Management in Mediterranean Ecosystems, Palo Alto, Ca, USDA Forest Service Gen tech rep WO-3, Washington, DC, USA, 1–5 August 1977; pp. 58–64. [Google Scholar]
- Trabaud, L. Fire as an agent of plant invasion? A case study in the French mediterranean vegetation. In Biological Invasions in Europe and the Mediterranean Basin; Castri, F.D., Hansen, A.J., Debussche, M., Eds.; Kluwer Academic Publishers: Dordrecht, The Netherlands, 1990; pp. 417–437. [Google Scholar]
- Tsitsoni, T.; Karagiannakidou, V. Site quality and stand structure in Pinus halepensis forests of north Greece. Forestry 2000, 73, 51–64. [Google Scholar] [CrossRef]
- Nakos, G. Forest soils of Greece: Physical, chemical and biological properties. For. Ecol. Manag. 1979, 2, 35–51. [Google Scholar] [CrossRef]
- Sanderlin, J.C.; Van Gelder, R.J. A simulation of fire behavior and suppression effectiveness for operation support in wildland fire management. In Proceedings of the 1st International Conference on Mathematical Modeling, St. Louis, MO, USA, 29 August–1 September 1977; pp. 619–630. [Google Scholar]
- Santoso, M.A.; Christensen, E.G.; Yang, J.; Rein, G. Review of the Transition from Smouldering to Flaming Combustion in Wildfires. Front. Mech. Eng. 2019, 5. [Google Scholar] [CrossRef]
- Koo, E.; Pagni, P.J.; Weise, D.R.; Woycheese, J.P. Firebrands and spotting ignition in large-fires. Int. J. Wildland Fire 2010, 19, 818–843. [Google Scholar] [CrossRef] [Green Version]
- Hellenic Republic, M.o.I. Greek Fire Service Incidence Records. Available online: https://www.fireservice.gr/el_GR/synola-dedomenon (accessed on 21 July 2020).
- European Union. rescEU—Decision No 1313/2013/EU on a Union Civil. Protection Mechanism; Directorate-General for European Civil Protection and Humanitarian Aid Operations (ECHO); European Union Civil Protection Mechanism: Brussels, Belgium, 2019; p. 20. [Google Scholar]
- Scott, J.H.; Reinhardt, E.D. Assessing Crown Fire Potential by Linking Models of Surface and Crown Fire Behavior; RMRS-RP-29; USDA Forest Service, Rocky Mountain Research Station: Fort Collins, CO, USA, 2001; p. 59. [Google Scholar]
- Dimitrakopoulos, A.P. Mediterranean fuel models and potential fire behaviour in Greece. Int. J. Wildland Fire 2002, 11, 127–130. [Google Scholar] [CrossRef]
- Fernandez-Pello, A.C. Wildland fire spot ignition by sparks and firebrands. Fire Saf. J. 2017, 91, 2–10. [Google Scholar] [CrossRef]
- Manzello, S.L.; Cleary, T.G.; Shields, J.R.; Maranghides, A.; Mell, W.; Yang, J.C. Experimental investigation of firebrands: Generation and ignition of fuel beds. Fire Saf. J. 2008, 43, 226–233. [Google Scholar] [CrossRef]
- Tsagari, K.; Karetsos, G.; Proutsos, N. Forest Fires in Greece, 1983–2008; WWF Hellas: Athens, Greece, 2011; p. 112. [Google Scholar]
- Nivolianitou, Z.; Synodinou, B. Towards emergency management of natural disasters and critical accidents: The Greek experience. J. Environ. Manag. 2011, 92, 2657–2665. [Google Scholar] [CrossRef]
- Haynes, K.; Handmer, J.; McAneney, J.; Tibbits, A.; Coates, L. Australian bushfire fatalities 1900–2008: Exploring trends in relation to the ‘Prepare, stay and defend or leave early’policy. Environ. Sci. Policy 2010, 13, 185–194. [Google Scholar] [CrossRef]
- Mangan, R. Wildland Firefighter Fatalities in the United States: 1990–2006; National Wildfire Coordinating Group. Safety and Health Working Team, National Interagency Fire Center, NWCG PMS: Missoula, MT, USA, 2007; p. 841. [Google Scholar]
- Diakakis, M.; Xanthopoulos, G.; Gregos, L. Analysis of forest fire fatalities in Greece: 1977–2013. Int. J. Wildland Fire 2016, 25, 797–809. [Google Scholar] [CrossRef]
- Molina-Terrén, D.M.; Xanthopoulos, G.; Diakakis, M.; Ribeiro, L.; Caballero, D.; Delogu, G.M.; Viegas, D.X.; Silva, C.A.; Cardil, A. Analysis of forest fire fatalities in southern Europe: Spain, Portugal, Greece and Sardinia (Italy). Int. J. Wildland Fire 2019, 28, 85–98. [Google Scholar] [CrossRef] [Green Version]
- Cardil, A.; Delogu, G.M.; Molina-Terrén, D.M. Fatalities in wildland fires from 1945 to 2015 in Sardinia (Italy). Cerne 2017, 23, 175–184. [Google Scholar] [CrossRef] [Green Version]
- Alexander, M.E.; Buxton-Carr, P. Wildland fire suppression related fatalities in Canada, 1941–2010: A preliminary report. In Proceedings of the 11th International Wildland Fire Safety Summit, Missoula, MT, USA, 4–8 April 2011; p. 15. [Google Scholar]
- Mitsakis, E.; Stamos, I.; Papanikolaou, A.; Aifadopoulou, G.; Kontoes, H. Assessment of extreme weather events on transport networks: Case study of the 2007 wildfires in Peloponnesus. Nat. Hazards 2014, 72, 87–107. [Google Scholar] [CrossRef]
- Gibbons, P.; Van Bommel, L.; Gill, A.M.; Cary, G.J.; Driscoll, D.A.; Bradstock, R.A.; Knight, E.; Moritz, M.A.; Stephens, S.L.; Lindenmayer, D.B. Land management practices associated with house loss in wildfires. PLoS ONE 2012, 7, e29212. [Google Scholar] [CrossRef]
- Boustras, G.; Boukas, N.; Katsaros, E.; Ziliaskopoulos, A. Wildland fire preparedness is Greece and Cyprus: Lessons learned from the catastrophic fires of 2007 and beyond. In Wildfire and Community: Facilitating Preparedness and Resilience; Paton, D., Tedim, F., Eds.; Charles C Thomas Publisher, LTD.: Springfield, IL, USA, 2012; pp. 151–168. [Google Scholar]
- Goldammer, J.; Xanthopoulos, G.; Eytixidis, G.; Mallinis, G.; Mitsopoulos, I.; Dimitrakopoulos, A. Prospects for the Management of Forest and Landscape Fires in Greece; The Global Fire Monitoring Center (GFMC); Secretariat of the Global Wildland Fire Network; UNISDR Wildland Fire Advisory Group; International Wildfire Preparedness Mechanism; International Fire Aviation Working Group: Athens, Greece, 2019; p. 80. [Google Scholar]
- Johnson, C. Archaeological sites and fire-induced changes. In Proceedings of the 6th Biennial Rocky Mountain Anthropological Conference, Estes Park, CO, USA, 20–26 September 2003; pp. 1–16. [Google Scholar]
- Johnson, J.M. Quantifying the Economic Risk Wildfires and Power Lines in San Diego County; Duke University: Durham, NC, USA, 2014; p. 31. [Google Scholar]
- Mallinis, G.; Mitsopoulos, I.; Beltran, E.; Goldammer, J. Assessing wildfire risk in cultural heritage properties using high spatial and temporal resolution satellite imagery and spatially explicit fire simulations: The case of Holy Mount Athos, Greece. Forests 2016, 7, 46. [Google Scholar] [CrossRef] [Green Version]
- Kousky, C.; Greig, K.; Lingle, B.; Kunreuther, K. Wildfire cost in California: The role of electric utilities. Changes 2018, 114, 4582–4590. [Google Scholar]
- Diaz, J.M. Economic impacts of wildfire. South. Fire Exch. 2012, 498, 2012–2017. [Google Scholar]
- Smith, H.G.; Sheridan, G.J.; Lane, P.N.; Nyman, P.; Haydon, S. Wildfire effects on water quality in forest catchments: A review with implications for water supply. J. Hydrol. 2011, 396, 170–192. [Google Scholar] [CrossRef]
- Rodrigues, E.L.; Jacobi, C.M.; Figueira, J.E.C. Wildfires and their impact on the water supply of a large neotropical metropolis: A simulation approach. Sci. Total Environ. 2019, 651, 1261–1271. [Google Scholar] [CrossRef]
- Habermann, N.; Hedel, R. Damage functions for transport infrastructure. Int. J. Disaster Resil. Built Environ. 2018, 9, 420–434. [Google Scholar] [CrossRef] [Green Version]
- Fraser, A.M.; Chester, M.V.; Underwood, B.S. Wildfire risk, post-fire debris flows, and transportation infrastructure vulnerability. Sustain. Resilient Infrastruct. 2020, 5, 1–13. [Google Scholar] [CrossRef]
- Stougiannidou, D.; Zafeiriou, E.; Raftoyannis, Y. Forest fires in Greece and their economic impacts on agriculture. KnE Soc. Sci. 2020, 54–70. [Google Scholar] [CrossRef] [Green Version]
- Donovan, G.H.; Rideout, D.B. A reformulation of the cost plus net value change (C+ NVC) model of wildfire economics. For. Sci. 2003, 49, 318–323. [Google Scholar]
- Calkin, D.E.; Hyde, K.D.; Robichaud, P.R.; Jones, J.G.; Ashmun, L.E.; Dan, L. Assessing Post-Fire Values-at-Risk with a New Calculation Tool; Gen. Tech. Rep. RMRS-GTR-205; US Department of Agriculture, Forest Service, Rocky Mountain Research Station: Fort Collins, CO, USA, 2007; p. 32. [Google Scholar]
- Napper, C. Burned Area Emergency Response Treatments Catalog (BAERCAT); USDA Forest Service, National Technology and Development Program, Watershed, Soil, Air Management, San Dimas Technology & Development Center: San Dimas, CA, USA, 2006. [Google Scholar]
- Koulelis, P. Greek timber industries and wood product markets over the last century. Development constraints and future directions. Ann. For. Res. 2010, 54, 229–240. [Google Scholar]
- y Silva, F.R.; Molina, J.R.; González-Cabán, A.; Machuca, M.Á.H. Economic vulnerability of timber resources to forest fires. J. Environ. Manag. 2012, 100, 16–21. [Google Scholar] [CrossRef]
- Croitoru, L. Valuing the non-timber forest products in the Mediterranean region. Ecol. Econ. 2007, 63, 768–775. [Google Scholar] [CrossRef]
- Masiero, M.; Pettenella, D.M.; Secco, L. From failure to value: Economic valuation for a selected set of products and services from Mediterranean forests. For. Syst. 2016, 25, 6. [Google Scholar] [CrossRef] [Green Version]
- Hay, C.; Chhabra, M. The impact of wildfires and beneficial electrification on electricity rates in PG&E’s service territory. Electr. J. 2020, 33, 106710. [Google Scholar]
- Thomas, D.; Butry, D.; Gilbert, S.; Webb, D.; Fung, J. The costs and losses of wildfires. NIST Spec. Publ. 2017, 1215, 72. [Google Scholar]
- Stephenson, C.; Handmer, J.; Betts, R. Estimating the economic, social and environmental impacts of wildfires in Australia. Environ. Hazards 2013, 12, 93–111. [Google Scholar] [CrossRef]
- Mercer, D.E.; Pye, J.M.; Prestemon, J.P.; Butry, D.T.; Holmes, T.P. Economic Effects of Catastrophic Wildfires; Unpublished final report, USDA; Forest Service, Southern Research Station Forestry Sciences Laboratory: Research Triangle Park, NC, USA, 2000; p. 27709. [Google Scholar]
- González-Cabán, A. The economic dimension of wildland fires. In Vegetation Fires and Global Change–Challenges for Concerted International Action; A white paper directed to the United Nations and international organizations; Kassel Publishing House: Remagen, Germany, 2013; pp. 229–237. [Google Scholar]
- Boustras, G.; Boukas, N. Forest fires’ impact on tourism development: A comparative study of Greece and Cyprus. Manag. Environ. Qual. 2013, 24, 498–511. [Google Scholar] [CrossRef]
- Molina, J.R.; González-Cabán, A.; y Silva, F.R. Wildfires impact on the economic susceptibility of recreation activities: Application in a Mediterranean protected area. J. Environ. Manag. 2019, 245, 454–463. [Google Scholar] [CrossRef] [PubMed]
- Leverkus, A.B.; Puerta-Pinero, C.; Guzmán-Alvarez, J.R.; Navarro, J.; Castro, J. Post-fire salvage logging increases restoration costs in a Mediterranean mountain ecosystem. New For. 2012, 43, 601–613. [Google Scholar] [CrossRef]
- Baty, P. The times higher education world university rankings, 2004–2012. Ethics Sci. Environ. Politics 2014, 13, 125–130. [Google Scholar] [CrossRef] [Green Version]
- Sala-i-Martin, X.; Blanke, J.; Hanouz, M.D.; Geiger, T.; Mia, I.; Paua, F. The global competitiveness index: Prioritizing the economic policy agenda. Glob. Compet. Rep. 2008, 2009, 3–41. [Google Scholar]
- Schwab, K. The Global Competitiveness Report 2018. Available online: http://reports.weforum.org/global-competitiveness-report-2018/chapter-3-benchmarking-competitiveness-in-the-fourth-industrial-revolution-introducing-the-global-competitiveness-index-4-0/ (accessed on 1 September 2020).
- Times Higher Education. THE World University Rankings 2020: Methodology. Available online: https://www.timeshighereducation.com/world-university-rankings/world-university-rankings-2020-methodology (accessed on 1 September 2020).
- Saaty, T.L. Multicriteria Decision Making: The Analytic Hierarchy Process; McGraw-Hill: New York, NY, USA, 1980. [Google Scholar]
- Zahedi, F. The Analytic Hierarchy Process—A Survey of the Method and its Applications. INFORMS J. Appl. Anal. 1986, 16, 96–108. [Google Scholar] [CrossRef]
- LaValle, I.H.; Bard, J.F. Reviewed Work: The Analytic Hierarchy. Interfaces 1991, 21, 94–98. [Google Scholar]
- Vaidya, O.S.; Kumar, S. Analytic hierarchy process: An overview of applications. Eur. J. Oper. Res. 2006, 169, 1–29. [Google Scholar] [CrossRef]
- Liberatore, M.J.; Nydick, R.L. The analytic hierarchy process in medical and health care decision making: A literature review. Eur. J. Oper. Res. 2008, 189, 194–207. [Google Scholar] [CrossRef]
- Keeney, R.L.; Raiffa, H. Decisions with Multiple Objectives: Preferences and Value Trade-offs; Cambridge University Press: Cambridge, UK, 1993. [Google Scholar]
- Palaiologou, P.; Kalabokidis, K.; Ager, A.A.; Nielsen-Pincus, M.; Bailey, J.; Xanthopoulos, G. Obstacles to improving wildfire risk governance in Greece. In Proceedings of the Fire Continuum Conference, Missoula, MT, USA, 21–24 May 2018; pp. 318–324. [Google Scholar]
- Lazarina, M.; Devalez, J.; Neokosmidis, L.; Sgardelis, S.P.; Kallimanis, A.S.; Tscheulin, T.; Tsalkatis, P.; Kourtidou, M.; Mizerakis, V.; Nakas, G.; et al. Moderate fire severity is best for the diversity of most of the pollinator guilds in Mediterranean pine forests. Ecology 2019, 100, e02615. [Google Scholar] [CrossRef]
- Vasilakos, C.; Tsekouras, G.E.; Palaiologou, P.; Kalabokidis, K. Neural-Network Time-Series Analysis of MODIS EVI for Post-Fire Vegetation Regrowth. ISPRS Int. J. Geo Inf. 2018, 7, 420. [Google Scholar] [CrossRef] [Green Version]
- San-Miguel-Ayanz, J.; Barbosa, P.; Schmuck, G.; Liberta, G.; Schulte, E.; Viegas, D. Towards a coherent forest fire information system in Europe: The European Forest Fire Information System (EFFIS). In Proceedings of the IV International Conference on Forest Fire Research 2002 Wildland Fire Safety Summit, Coimbra, Portugal, 18–23 November 2002; pp. 5–16. [Google Scholar]
- Corine Land Cover (CLC) 2018; Copernicus Land Monitoring Service: European Environment Agency (EEA) and the Joint Research Centre (JRC); European Union: Brussels, Belgium, 2018; version 2020_20u1.
- National Interagency Fire Center. Burned Area Emergency Response (BAER). Available online: https://www.nifc.gov/BAER/ (accessed on 13 November 2019).
- Zevenbergen, C.; Fu, D.; Pathirana, A. Sponge Cities: Emerging Approaches, Challenges and Opportunities; MDPI: Basel, Switzerland, 2018. [Google Scholar]
- Poirazidis, K.; Catsadorakis, G.; Hristov, H.; Eastham, C.; Ruiz, C.; Schindler, S.; Kakalis, E.; Bakaloudis, D.; Scandolara, C. Diurnal birds of prey in the Dadia-Lefkimi-Soufli Forest National Park. In The Dadia-Lefkimi-Soufli Forest National Park, Greece: Biodiversity, Management and Conservation; Aristotle University of Thessaloniki: Thessaloniki, Greece, 2009; pp. 151–167. [Google Scholar]
- Catsadorakis, G.; Kati, V.; Liarikos, C.; Poirazidis, K.; Skartsi, T.; Vasilakis, D.; Karavellas, D. Conservation and Management Issues for the Dadia–Lefkimi–Soufli Forest National Park; WWF Greece: Athens, Greece, 2010. [Google Scholar]
Figure 1.
Flowchart of how the 24 criteria attributed to the evaluation of environmental fire effects group were assigned to the three fire effects categories. Numbers denote the weight of each criterion and category, as derived by the expert evaluation of relative criterion importance analysis with the analytical hierarchical process (see Section 2.3 and Section 2.4). General multipliers are described in Section 2.2.3.

Figure 2.
Flowchart of how the 32 criteria attributed to the evaluation of socioeconomic fire effects group were assigned to the three fire effect categories. Numbers denote the weight of each criterion and category, as derived by the expert evaluation of relative criterion importance analysis with the analytical hierarchical process (see Section 2.3 and Section 2.4). General multipliers are described in Section 2.2.3.

Figure 3.
The August 2011 Evros fire in northern Greece, with the different burn effects on vegetation highlighted with different colors. Black: consumed; orange: scorched or partially burned; green: unburned.
Figure 3.
The August 2011 Evros fire in northern Greece, with the different burn effects on vegetation highlighted with different colors. Black: consumed; orange: scorched or partially burned; green: unburned.

Figure 4.
Fire Inventory and Ranking of Effects (FIRE) Index scores as derived from sensitivity analysis on the four alternative weight assignment scenarios on the Evros fire. In the overall score column, we used the values of each fire effects category as derived from the evaluation of the Evros fire in Appendix C. The four lines show the FIRE Index score after changing category weights based on the four scenarios. The Max columns show the final FIRE Index score after maximizing one at a time, and the value of each fire effects category while keeping all other category scores constant. LV: landscape and vegetation; EI: environmental impacts; RP: regeneration potential; FS: firefighting and suppression; CF: casualties and fatalities; DDI: destruction and damages of infrastructure; EL: economic losses.

Table 5.
Relative importance, assessment scale and relevant literature for each criterion for the casualties and fatalities fire effects category.
Table 5.
Relative importance, assessment scale and relevant literature for each criterion for the casualties and fatalities fire effects category.
| Criterion | Contribution to the FIRE Index Score (%) | Relative Importance | Assessment Scale | References |
|---|---|---|---|---|
| Civilian fatalities | 6.42 | The higher the number the higher the weight | Broad incident categories | Table S2; [195,196,197] |
| Firefighting personnel fatalities | 4.86 | The higher the number the higher the weight | Broad incident categories | Table S2; [194,198] |
| Injured | 1.67 | The higher the number the higher the weight | Broad incident categories | [196,199] |
| Firefighting vehicle losses | 0.71 | The higher the number the higher the weight | Broad incident categories | n/a |
| Firefighting aircraft losses | 2.35 | The higher the number the higher the weight | Broad incident categories | Table S3 |
Table 8.
Example evaluation for the effects on landscape and vegetation fire effects category. The scale of criteria values ranges from 0 (no effect) to 100 (high effect), while for the general multiplier value from 0 (no effect) to 3 (high effect). Light gray: Choices with no effect; Dark gray: N/a, denotes a non-applicable or not available selection; Green: Choices with low effect; Yellow: Choices with moderate effect; Red: Choices with high effect.
| No Effect | Low | Moderate | High | ||||||
|---|---|---|---|---|---|---|---|---|---|
| Criterion Value | 0 | 10 | 20 | 40 | 60 | 80 | 100 | ||
| General Multiplier Value | 0 | 0.5 | 1 | 1.5 | 2 | 2.5 | 3 | ||
| Criterion (A.3.): | Protected forested area type | None | Lake or seashore forests | Recreational forests | National parks | Old-growth forest | |||
| Additive Term | Ratio of protected forested area vs. non-protected area inside the burned perimeter | n/a | <10% | 11–20% | 21–30% | 31–40% | 41–50% | >50% | |
| Criterion (A.5) | Probability of land degradation, erosion, and soil loss | None | Low | Moderate | High | ||||
| Criterion Descriptor | Cover (0–100%)- Sum must be = 100% | 0–100% | 0–100% | 0–100% | 0–100% | ||||
| General Multiplier | Burned area (ha) | n/a | <10 | 10–100 | >100–500 | >500–2000 | >2000–7000 | >7000 | |
Table 9.
Conversion of the average percent difference in the number of respondents rating each criterion as high and very high between two criteria, to the 1–9 scale using the analytical hierarchical process to construct the pair-wise comparison reciprocal matrix.
Table 9.
Conversion of the average percent difference in the number of respondents rating each criterion as high and very high between two criteria, to the 1–9 scale using the analytical hierarchical process to construct the pair-wise comparison reciprocal matrix.
| <1% -> 1 point | <5% -> 2 points | >5–10% -> 3 points |
| >10–15% -> 4 points | >15–20% -> 5 points | >20–30% -> 6 points |
| >30–40% -> 7 points | >40–50% -> 8 points | >50% -> 9 points |
Table 10.
The four alternative weight assignment scenarios tested during sensitivity analysis for the seven fire effects categories.
Table 10.
The four alternative weight assignment scenarios tested during sensitivity analysis for the seven fire effects categories.
| Fire Effects Category | Grouping | Equal Weights | Author Weights | Environmental Weights | Socioeconomic Weights |
|---|---|---|---|---|---|
| Landscape and Vegetation | Environmental | 0.14 | 0.21 | 0.25 | 0.06 |
| Environmental Impacts | 0.14 | 0.11 | 0.25 | 0.07 | |
| Regeneration Potential | 0.14 | 0.10 | 0.25 | 0.07 | |
| Firefighting & Suppression | Socioeconomic | 0.14 | 0.05 | 0.06 | 0.20 |
| Casualties & Fatalities | 0.16 | 0.31 | 0.07 | 0.20 | |
| Destruction & Damages to Infrastructure | 0.14 | 0.13 | 0.06 | 0.20 | |
| Economic Losses | 0.14 | 0.09 | 0.06 | 0.20 |
Table 11.
Potential governance actions and post-fire mitigation measures that can be applied after each fire, based on which fire effect categories scored high values (highlighted with green color).
Table 11.
Potential governance actions and post-fire mitigation measures that can be applied after each fire, based on which fire effect categories scored high values (highlighted with green color).
| High Fire Effect Category Scores | Potential Governance Actions and Post-Fire Mitigation Measures | ||||
|---|---|---|---|---|---|
| Large-Scale Landscape Rehabilitation; PROMOTE Vegetation Recovery and Regeneration | Disaster Relief in Communities | Enhance Suppression and Increase Firefighting Capacity | Protection of Ecological Values-at-Risk and Restoration of Ecosystem Services | Financial Aid to Stabilize Local Economies and Investments to Rebuild Infrastructure | |
| LV values (>40) | |||||
| EI values (>40) | |||||
| RP values (>40) | |||||
| FS values (>45) | |||||
| CF values (>50) | |||||
| DDI values (>40) | |||||
| EL values (>30) | |||||
LV: landscape and vegetation; EI: environmental impacts; RP: regeneration potential; FS: firefighting and suppression; CF: casualties and fatalities; DDI: destruction and damages of infrastructure; EL: economic losses.
Publisher’s Note: MDPI stays neutral with regard to jurisdictional claims in published maps and institutional affiliations. |
© 2020 by the authors. Licensee MDPI, Basel, Switzerland. This article is an open access article distributed under the terms and conditions of the Creative Commons Attribution (CC BY) license (http://creativecommons.org/licenses/by/4.0/).
Share and Cite
MDPI and ACS Style
Palaiologou, P.; Kalabokidis, K.; Day, M.A.; Kopsachilis, V. Evaluating Socioecological Wildfire Effects in Greece with a Novel Numerical Index. Fire 2020, 3, 63. https://0-doi-org.brum.beds.ac.uk/10.3390/fire3040063
AMA Style
Palaiologou P, Kalabokidis K, Day MA, Kopsachilis V. Evaluating Socioecological Wildfire Effects in Greece with a Novel Numerical Index. Fire. 2020; 3(4):63. https://0-doi-org.brum.beds.ac.uk/10.3390/fire3040063
Chicago/Turabian StylePalaiologou, Palaiologos, Kostas Kalabokidis, Michelle A. Day, and Vasilis Kopsachilis. 2020. "Evaluating Socioecological Wildfire Effects in Greece with a Novel Numerical Index" Fire 3, no. 4: 63. https://0-doi-org.brum.beds.ac.uk/10.3390/fire3040063