Towards the Development of a Probabilistic Approach to Informal Settlement Fire Spread Using Ignition Modelling and Spatial Metrics

 ,
,  , , , and
Abstract
:1. Introduction
- Further investigate the semi-probabilistic model of informal settlement fire spread using B-RISK, as proposed by Reference [10], by
- investigating the effect of the ignition properties (i.e. the Flux-Time Product (FTP) index, FTP value and the critical heat flux (CHF)) assigned to ISDs in B-RISK, by comparing the simulation results to a full-scale 20-dwelling informal settlement fire experiment [8];
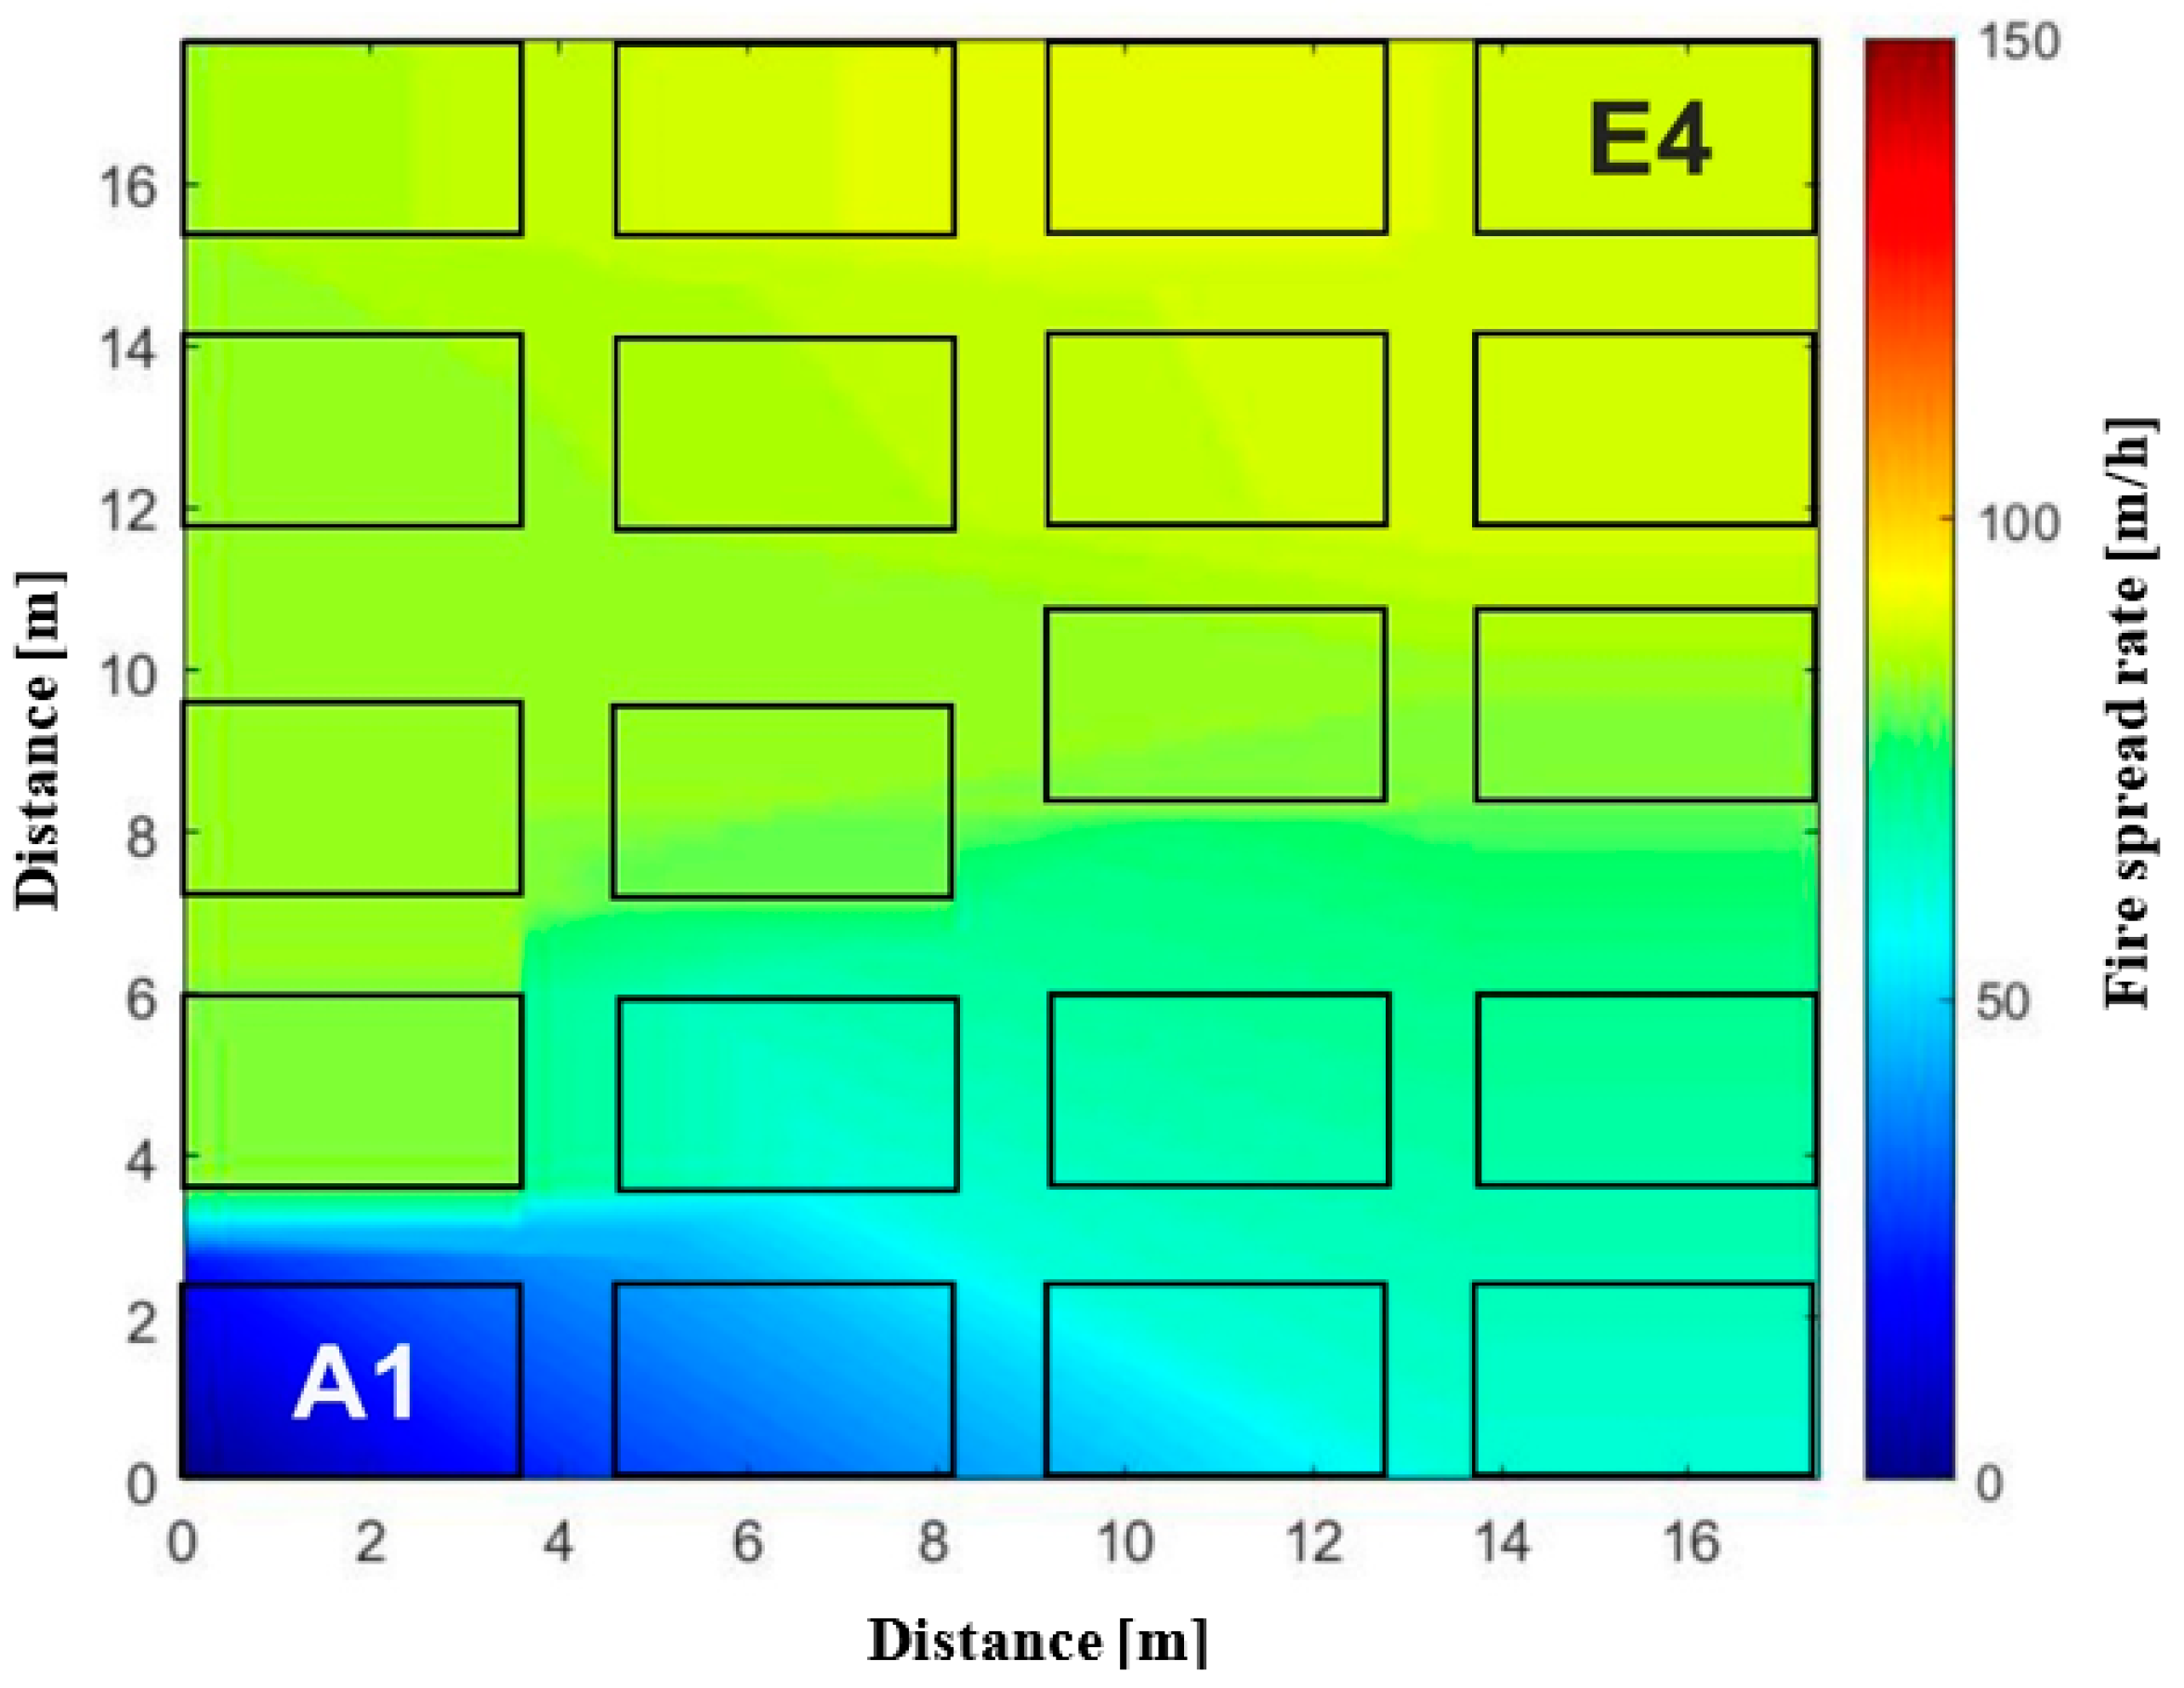
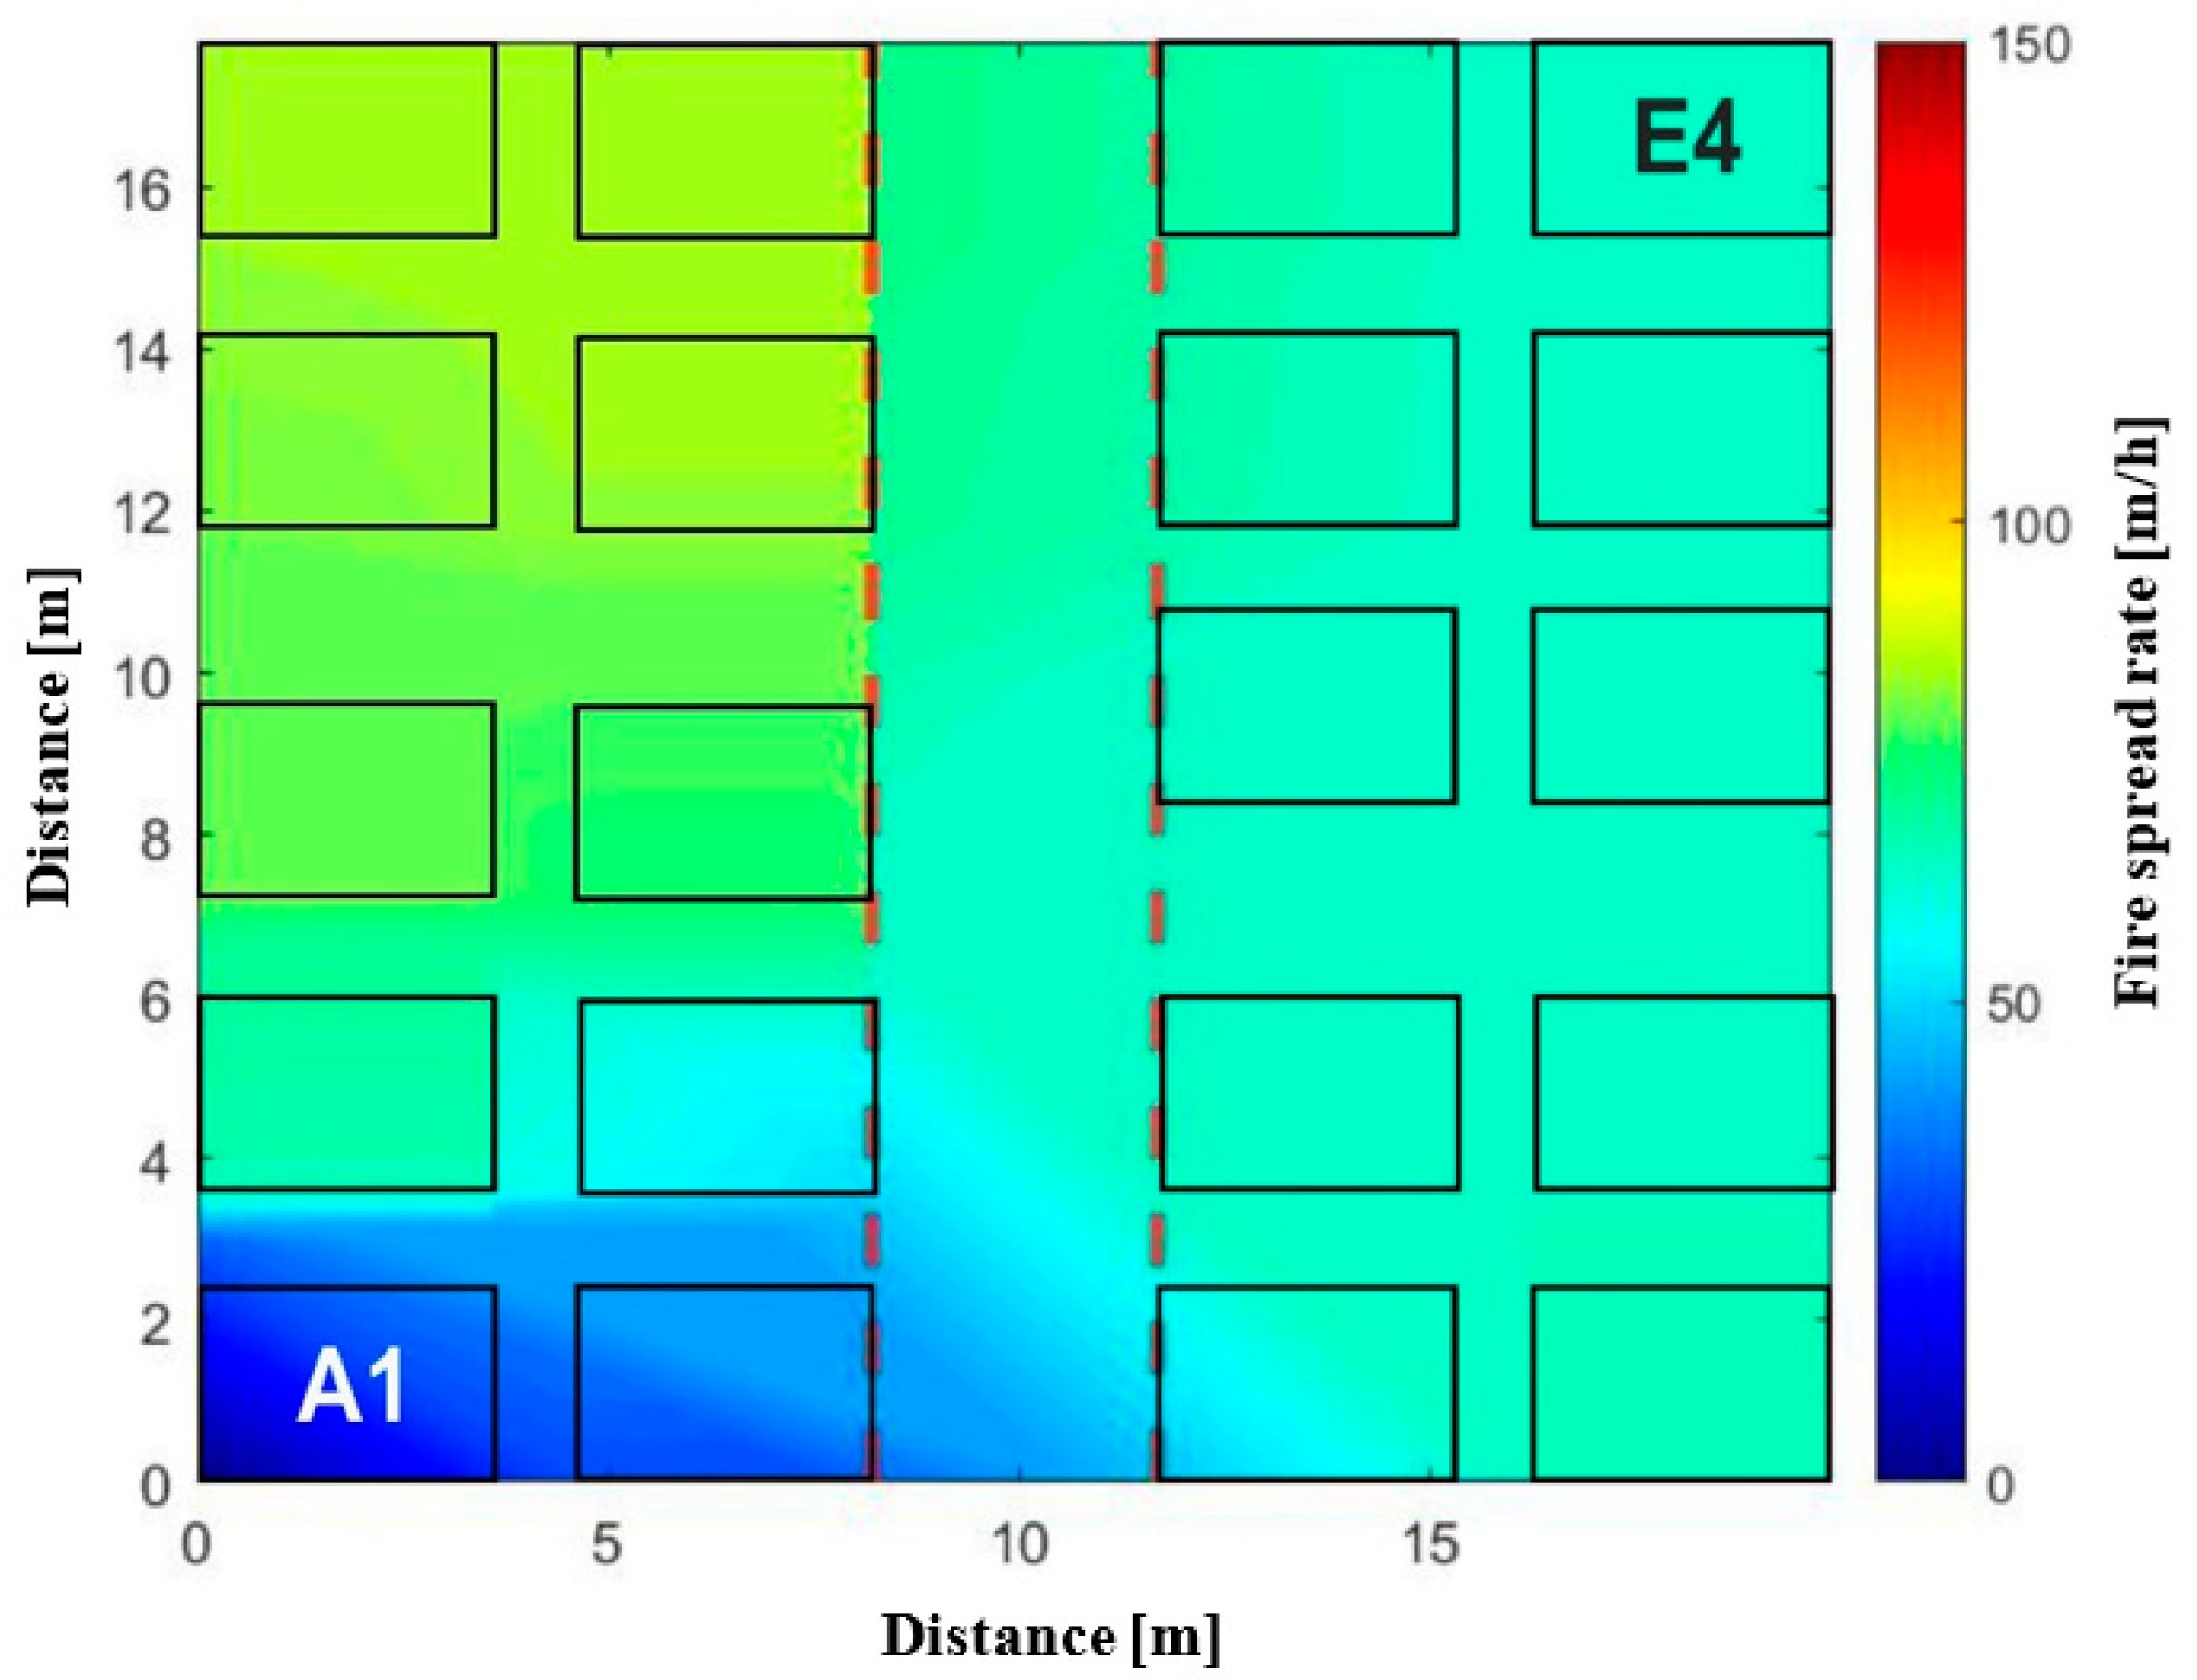
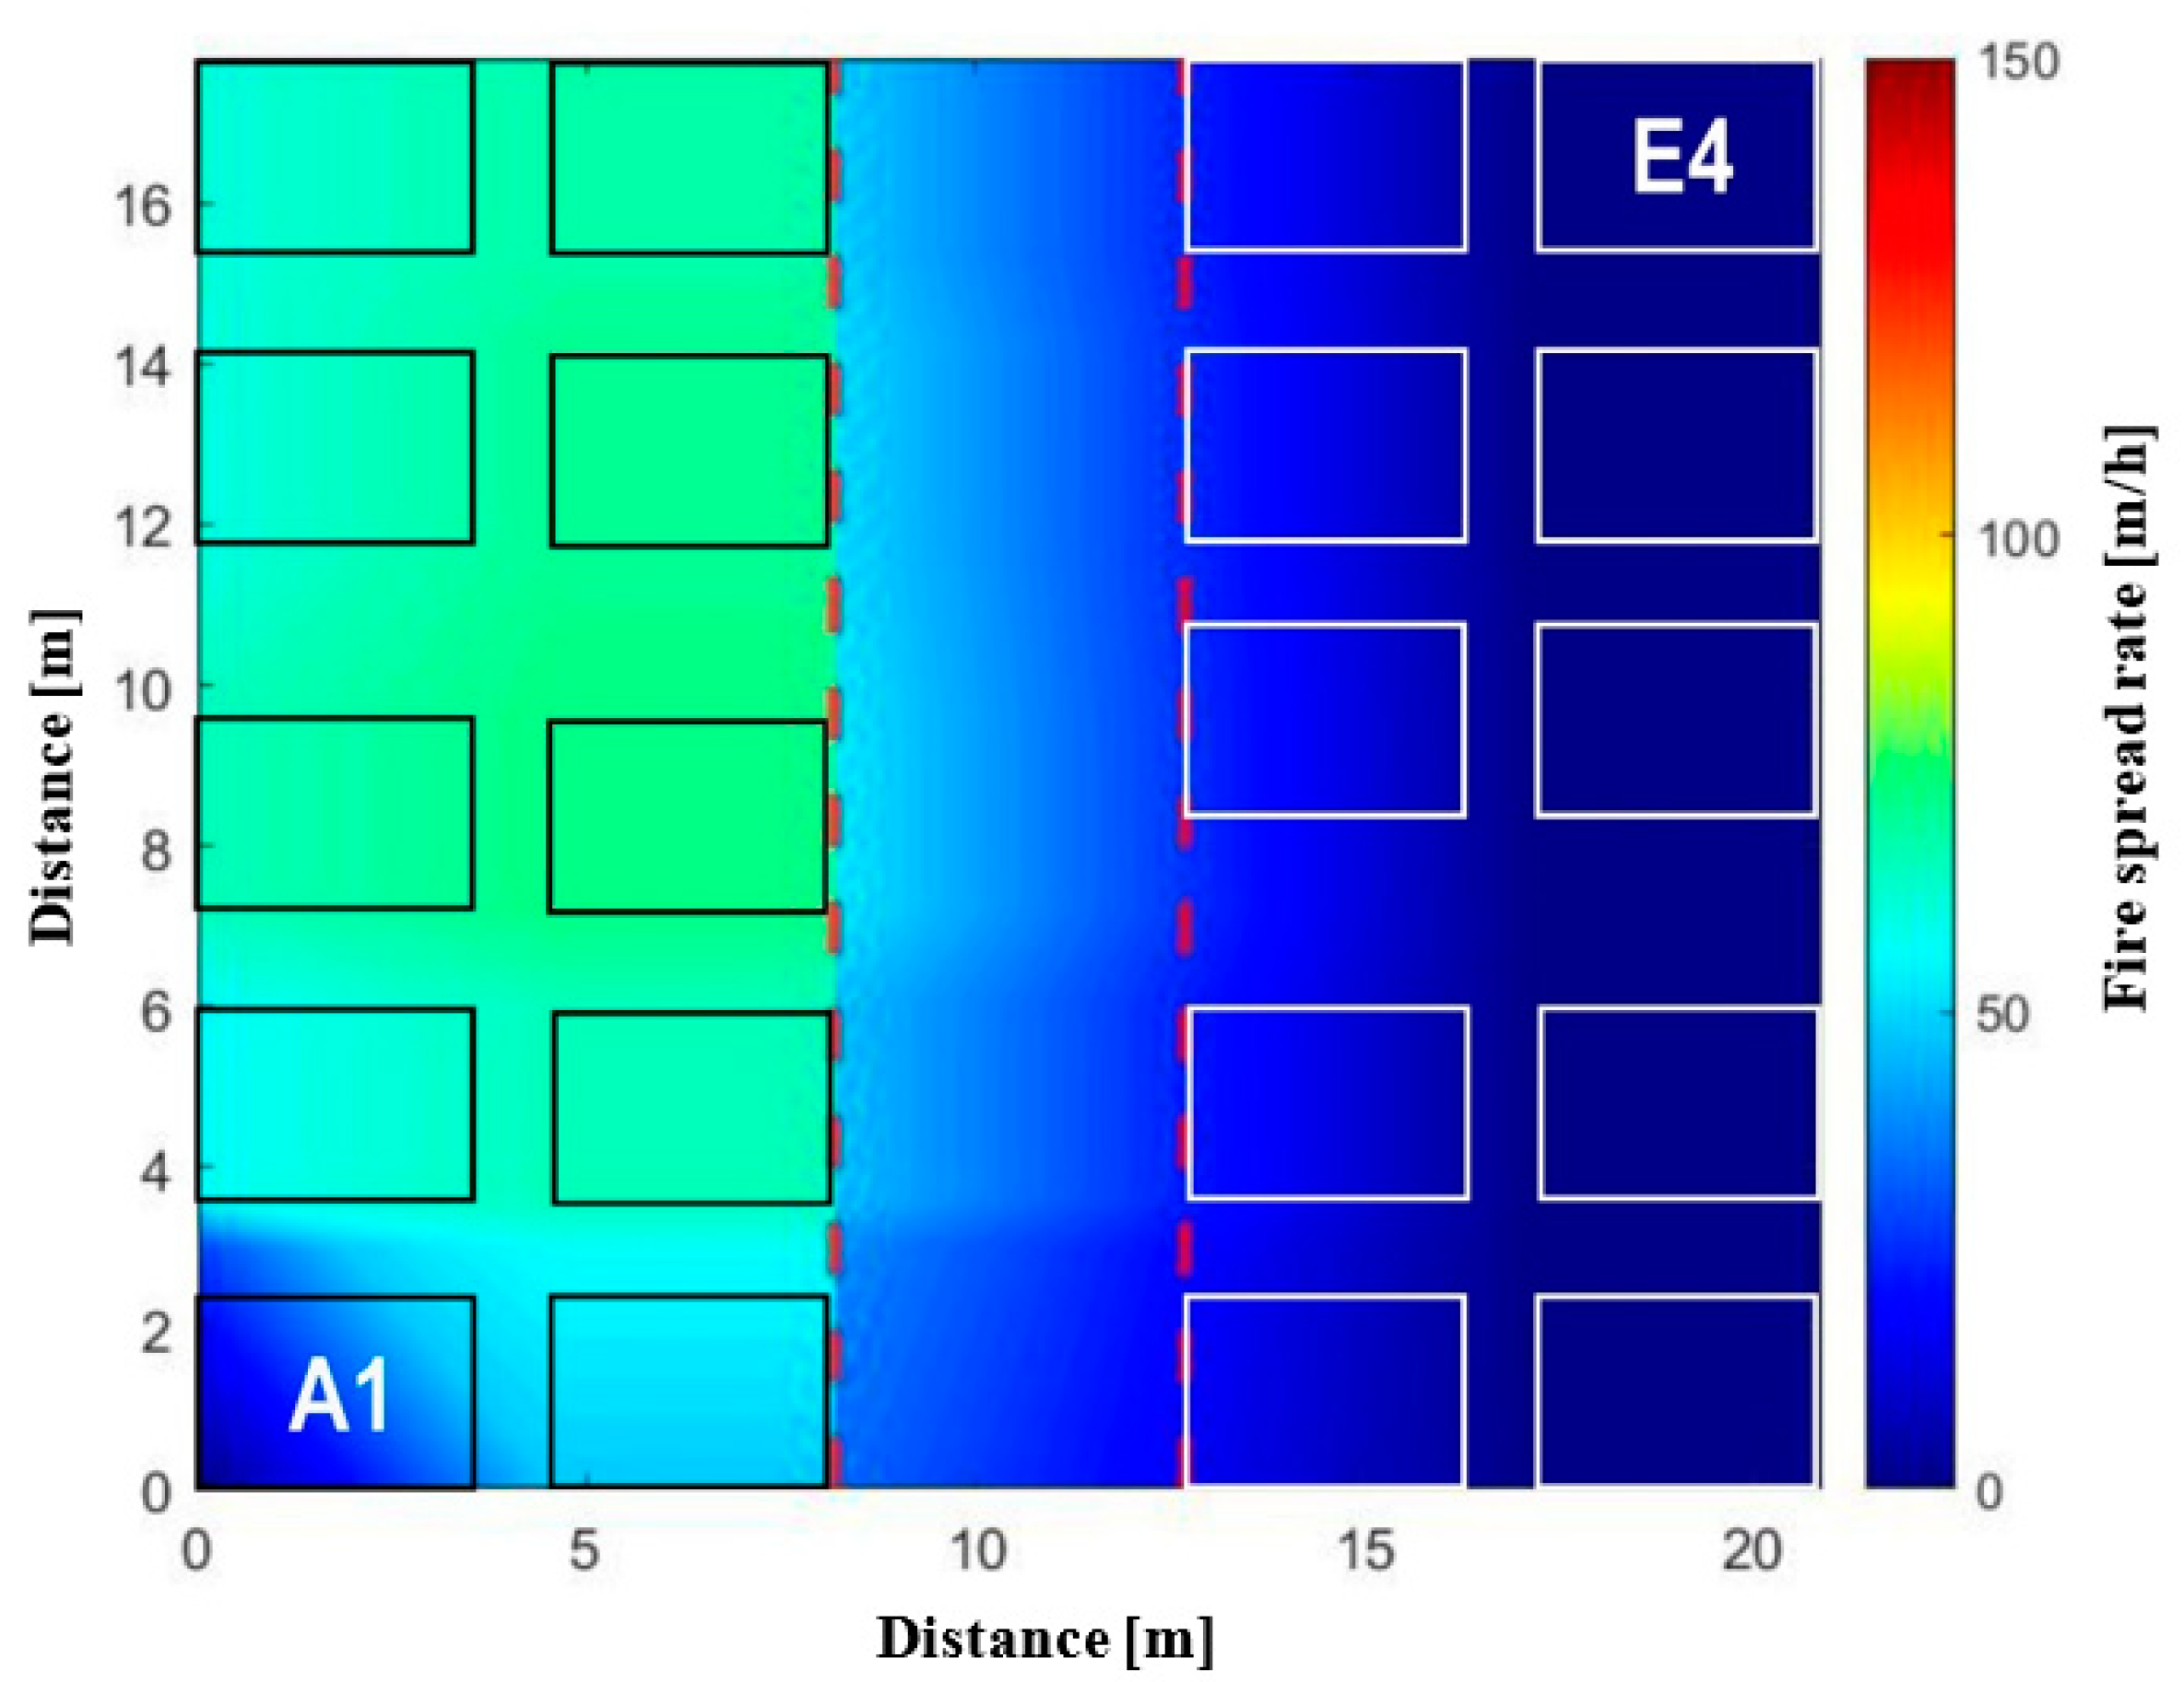
- post-processing the B-RISK time-to-ignition output data, to plot colour maps of the fire spread rates of the settlement under consideration, allowing end users to better interpret the results.
- Derive an equation for potential fire spread rate as a function of the settlement spatial metrics by
- applying the semi-probabilistic approach using B-RISK (i.e., randomly populating different informal settlement scenarios) to determine which spatial metrics (i.e., dwelling density, edge density, etc.) pose the highest risk to informal settlement fire spread, which are then used to derive a fire spread rate equation;
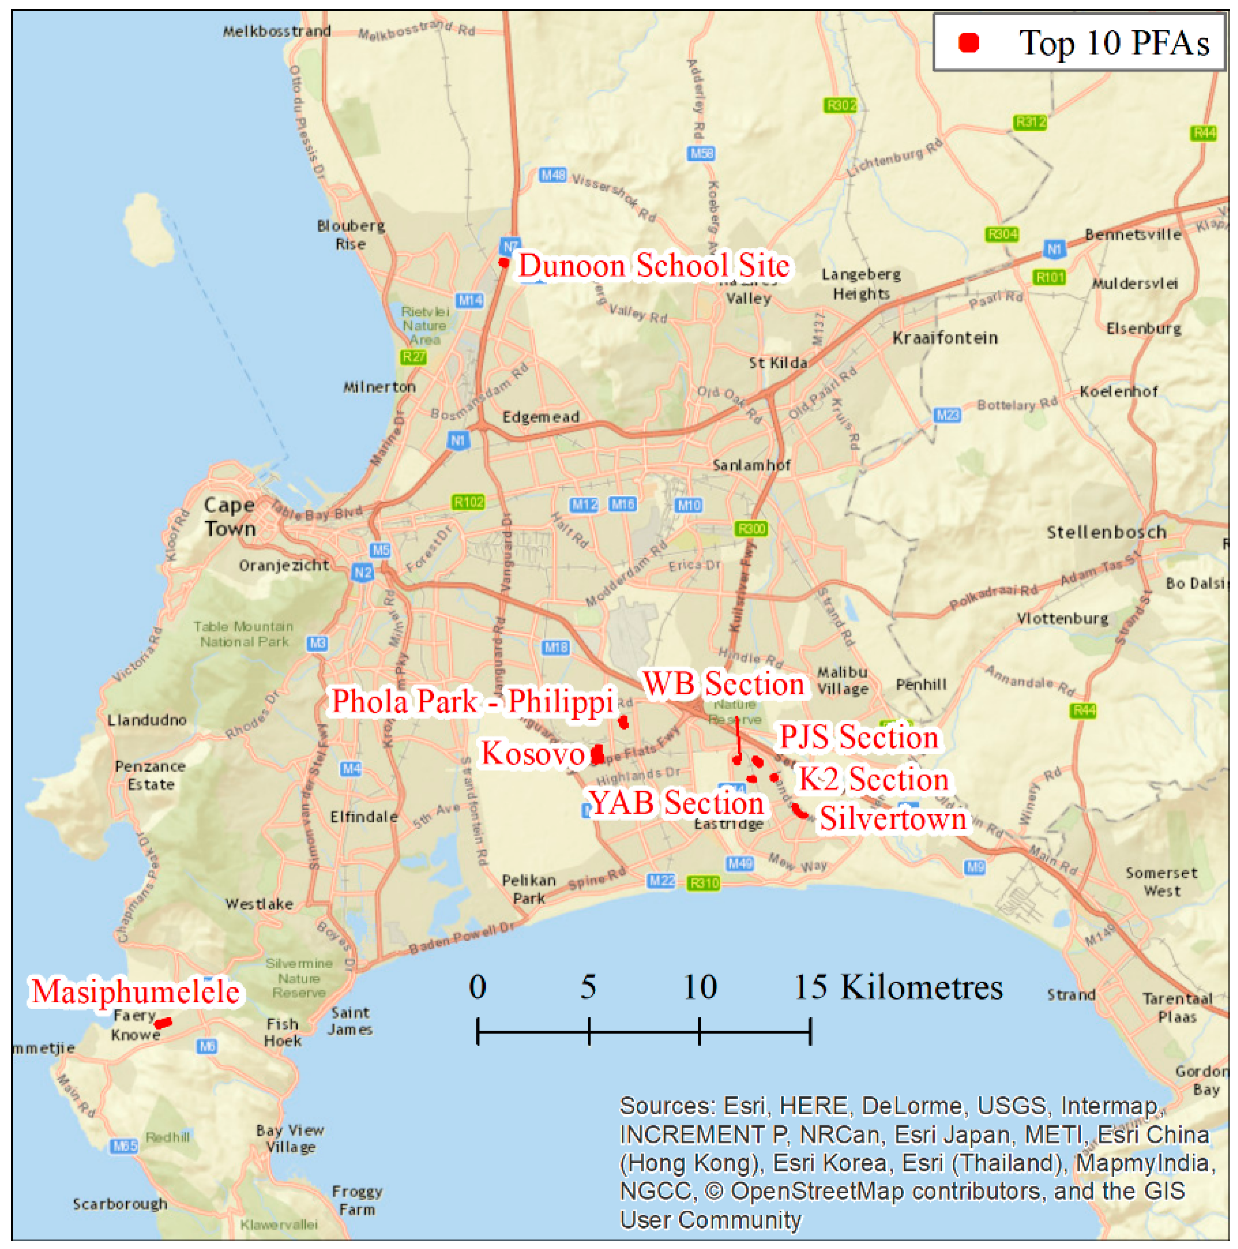
- applying the equation to all informal settlements across the whole of Cape Town, to identify the ten, larger than 1 ha, that are most at risk of fire spread, based on this semi-probabilistic approach.
2. Radiation and Ignition of Secondary Items in B-RISK
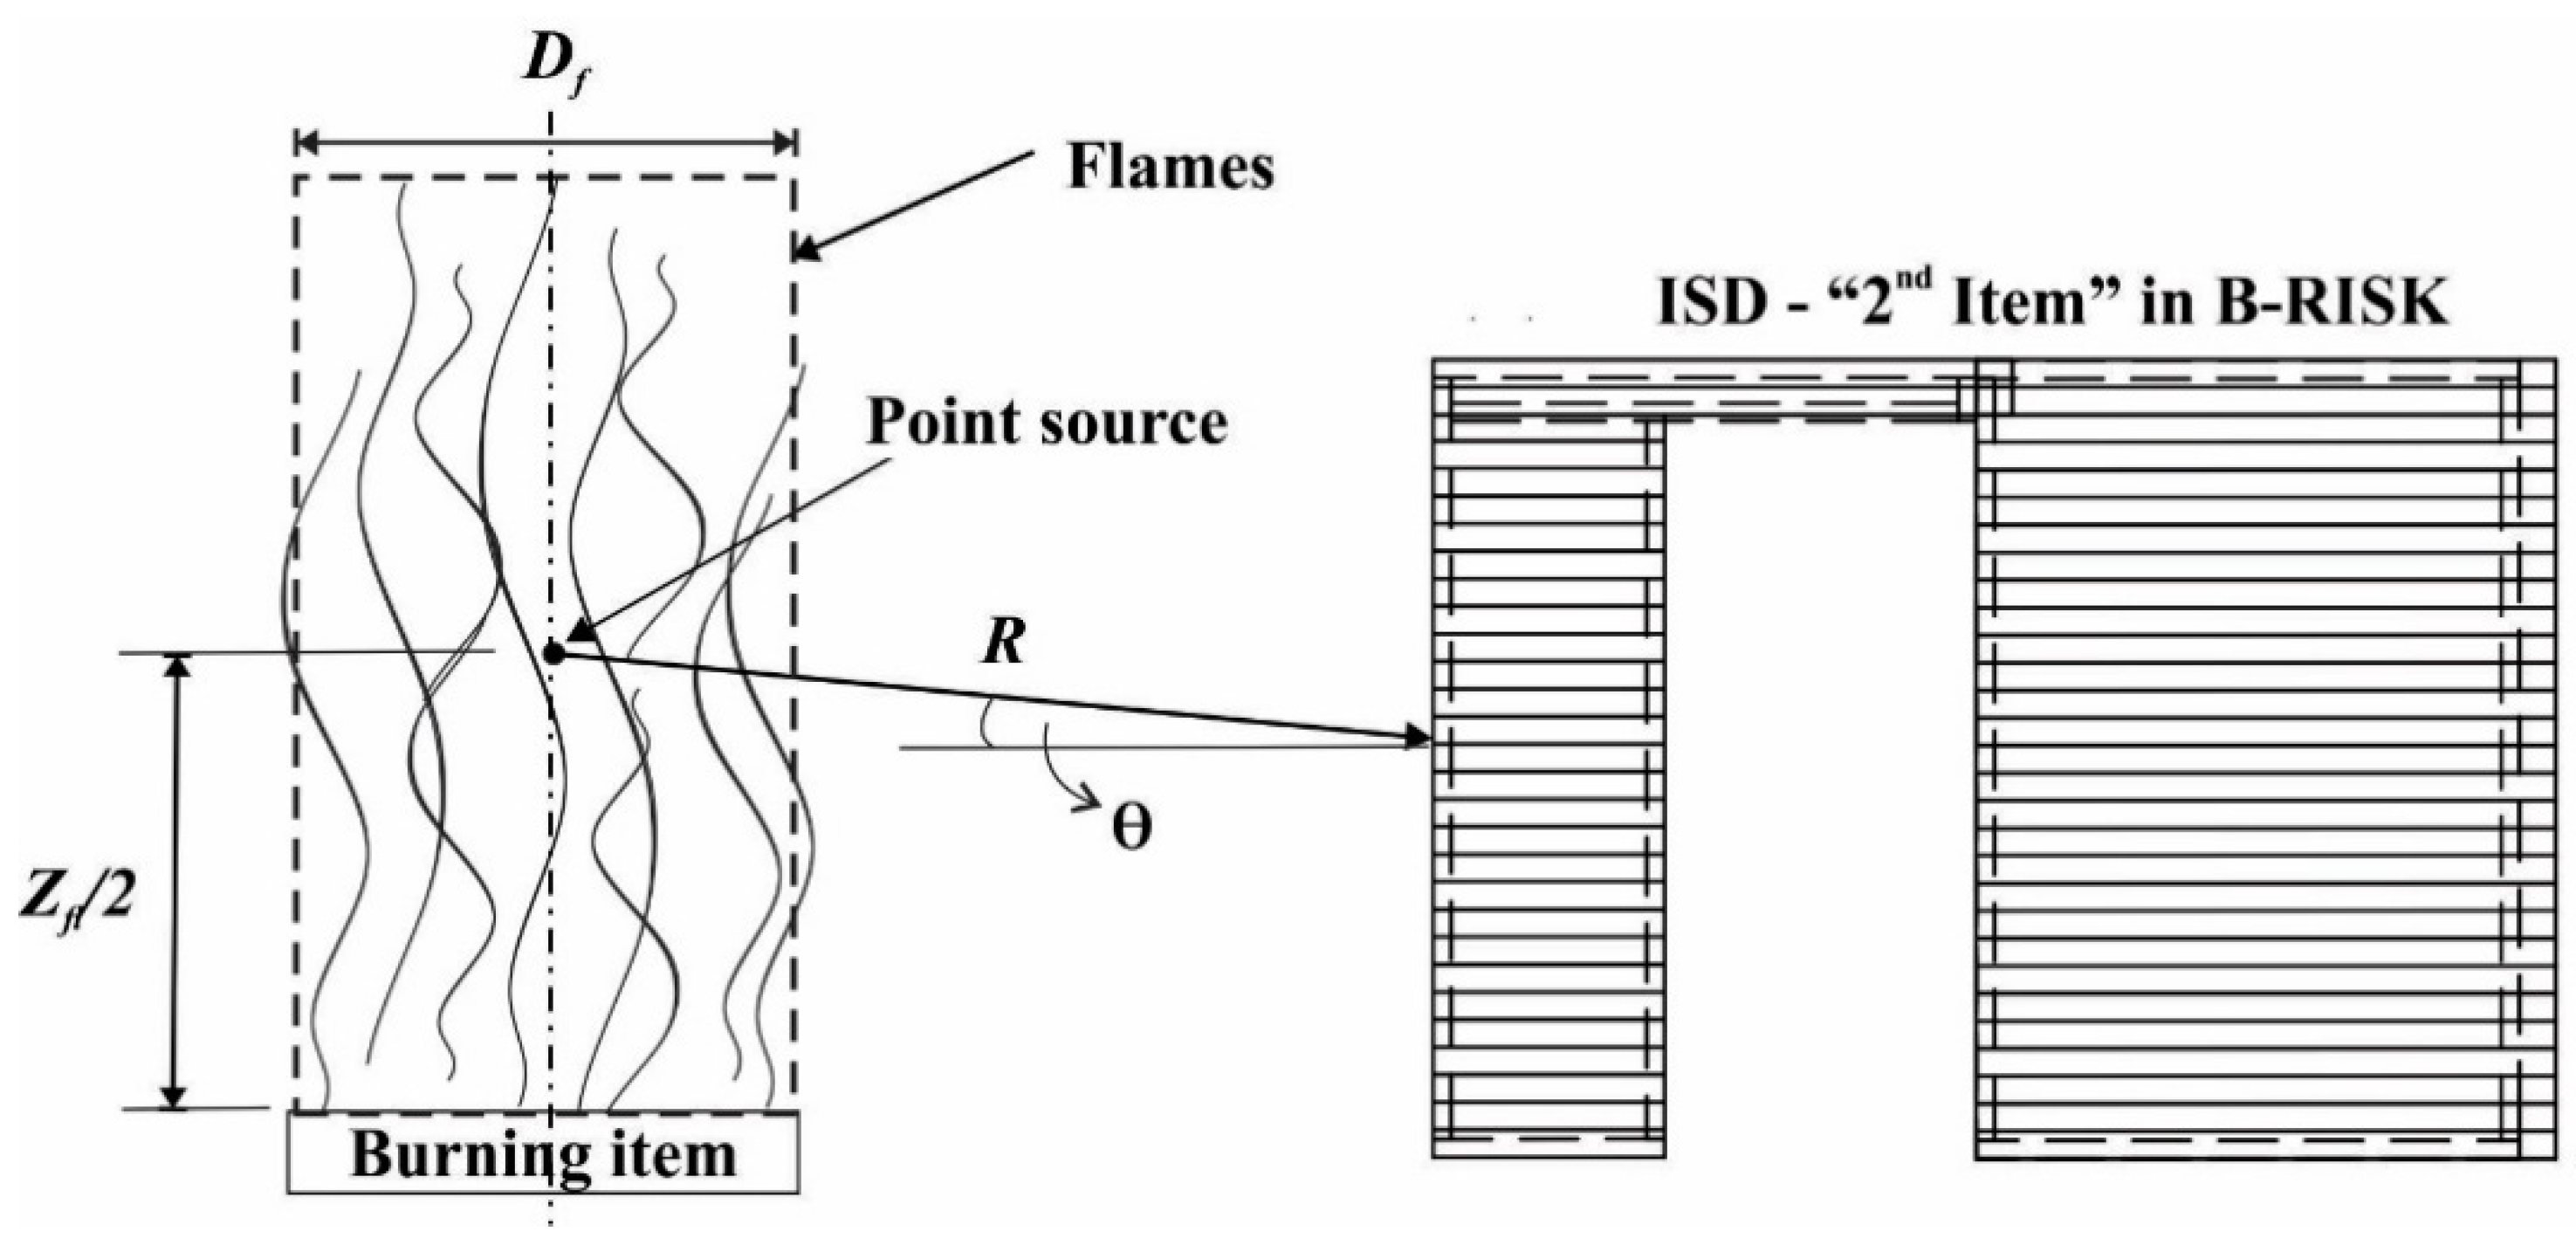
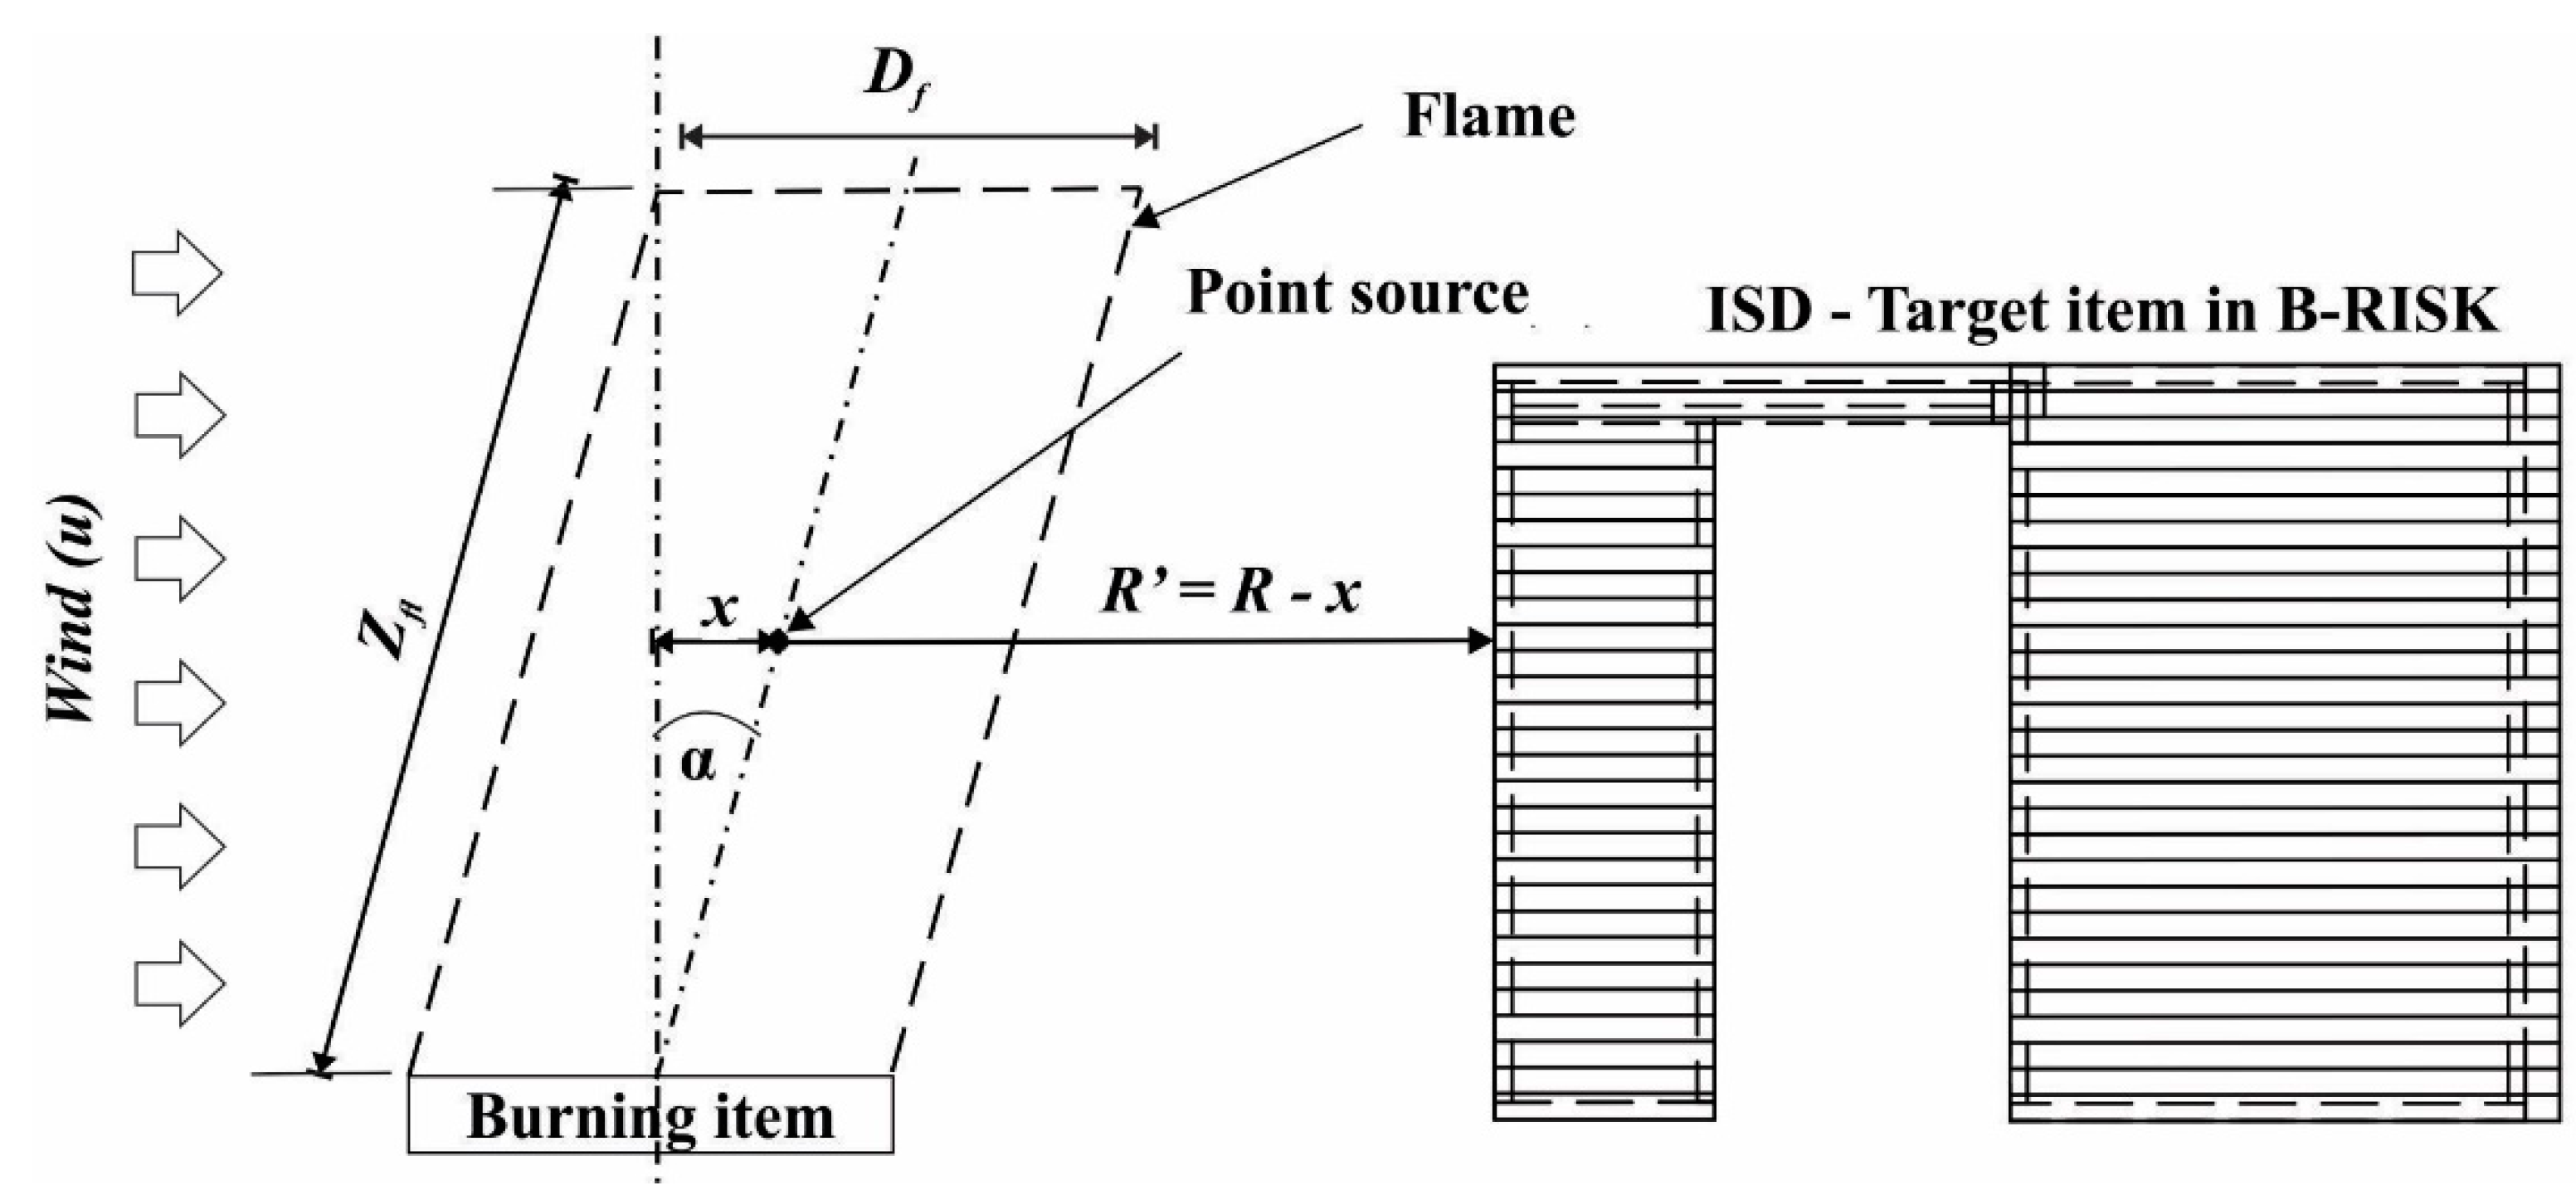
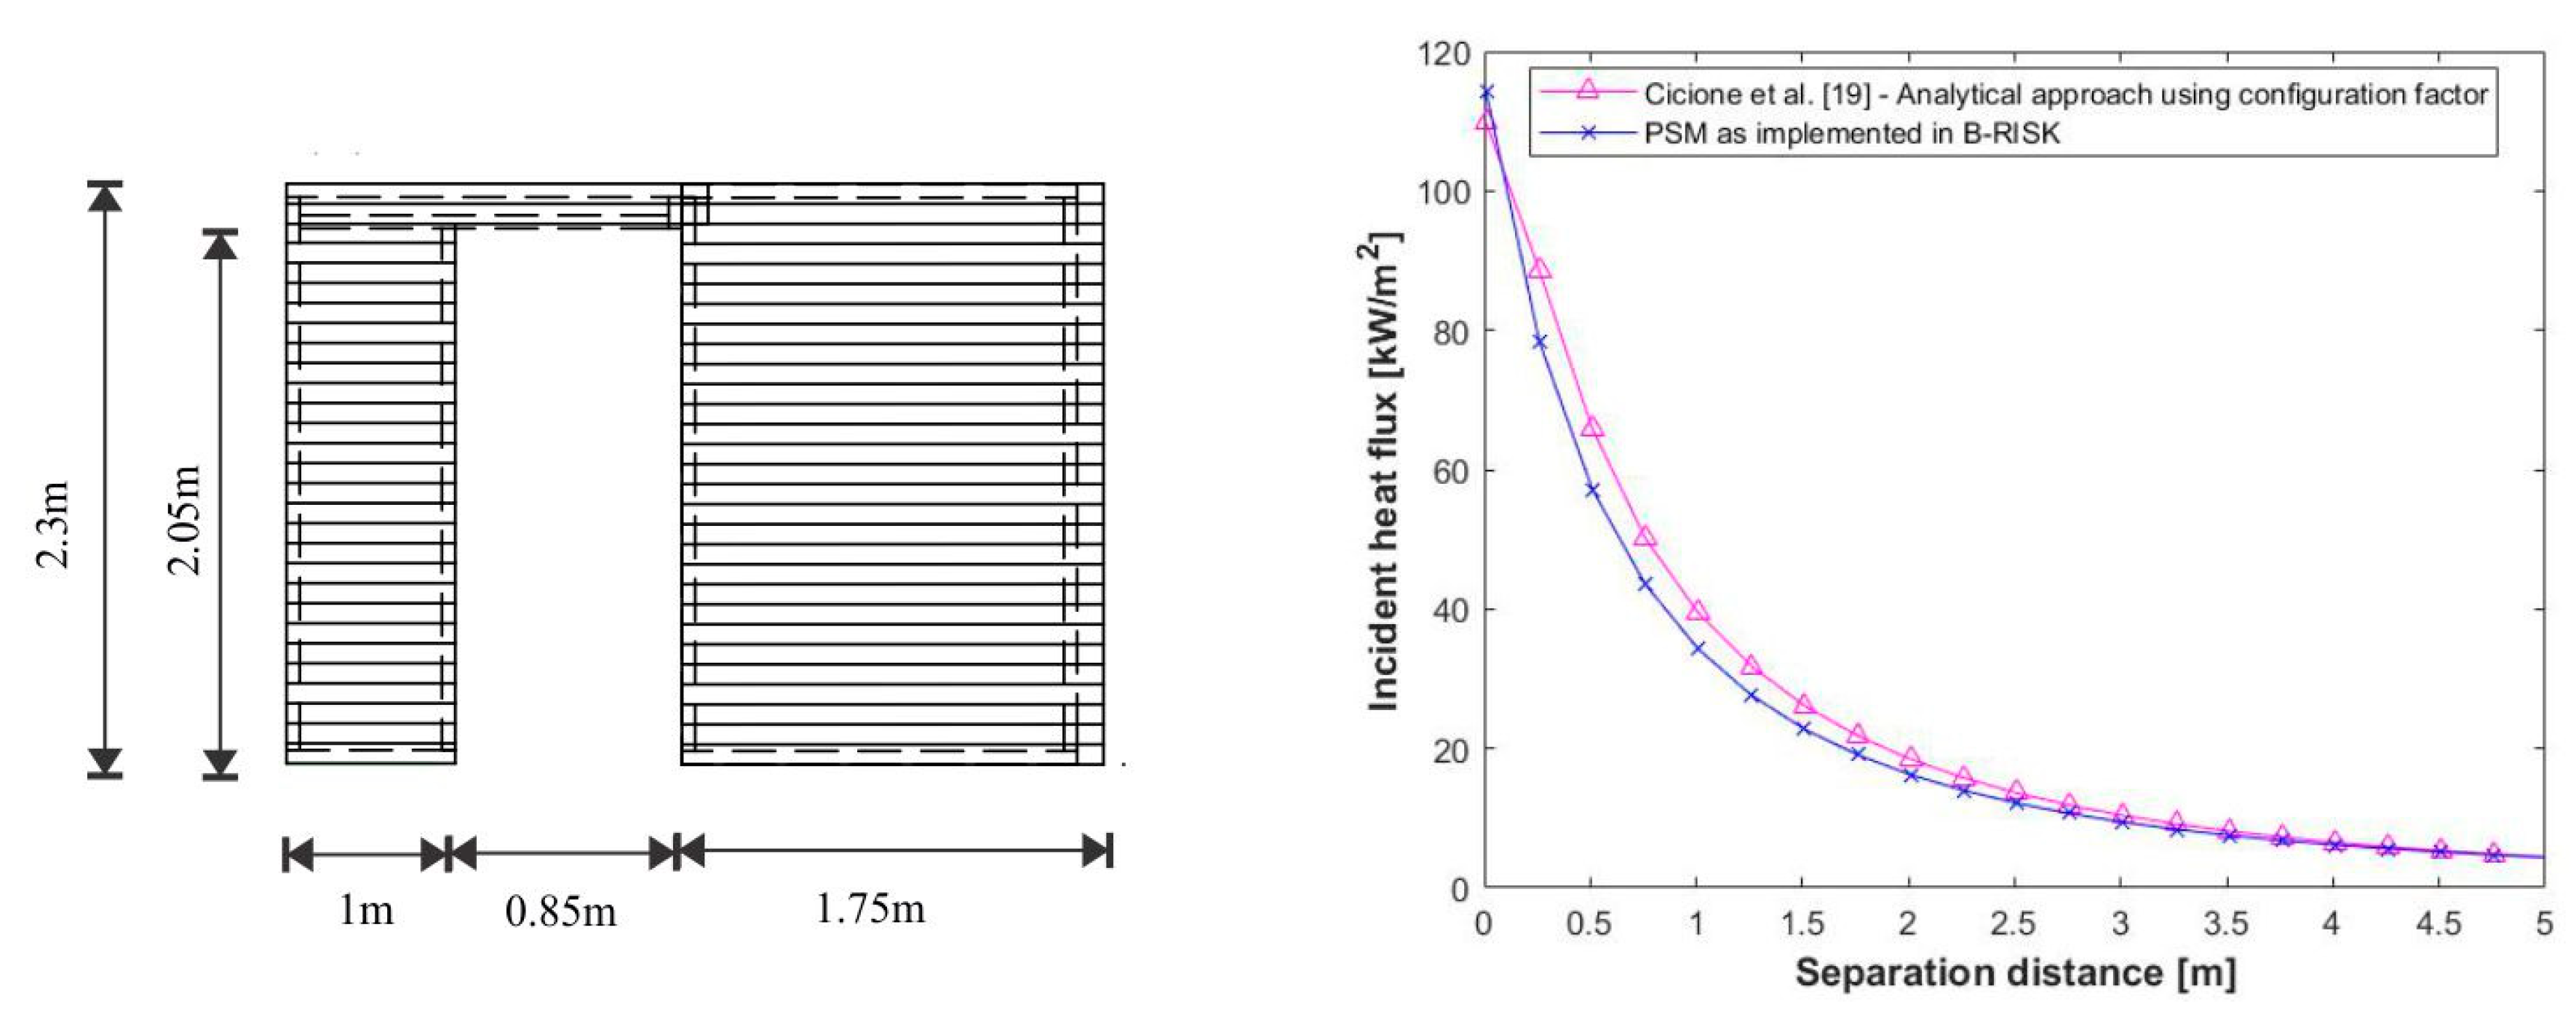
2.1. Radiation
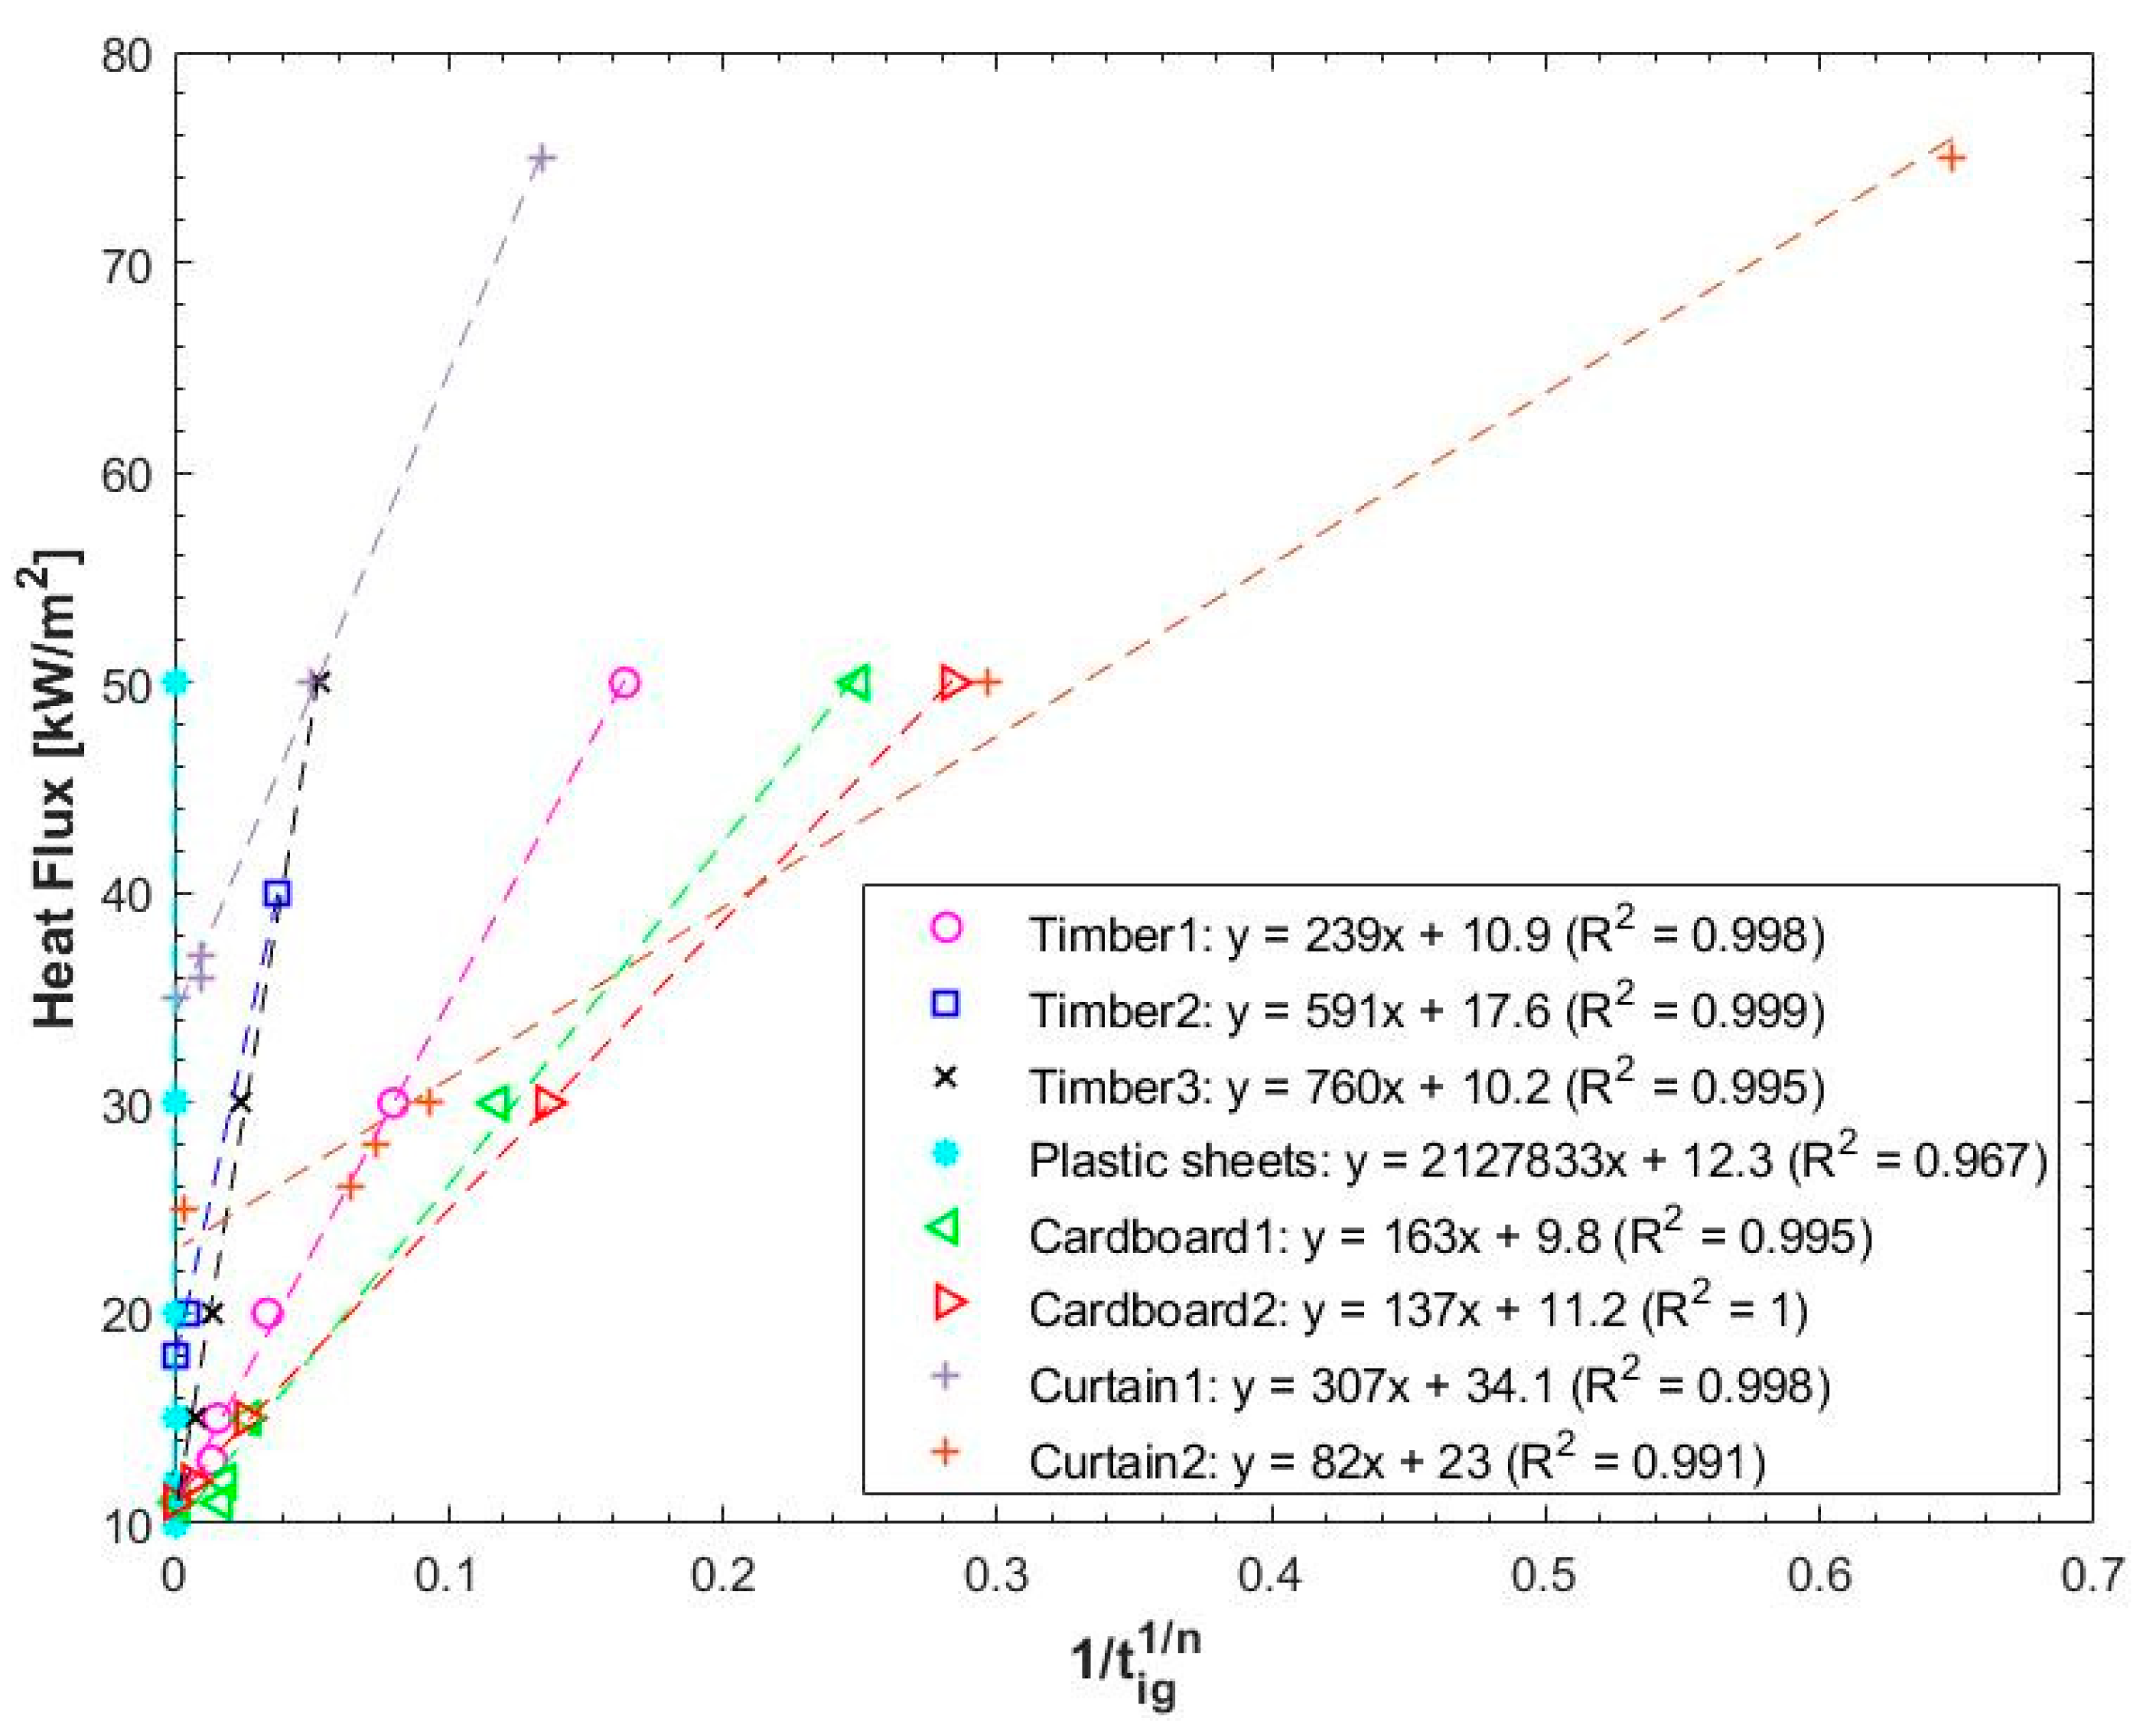
2.2. Ignition
3. Twenty-Dwelling Experiment Versus B-RISK
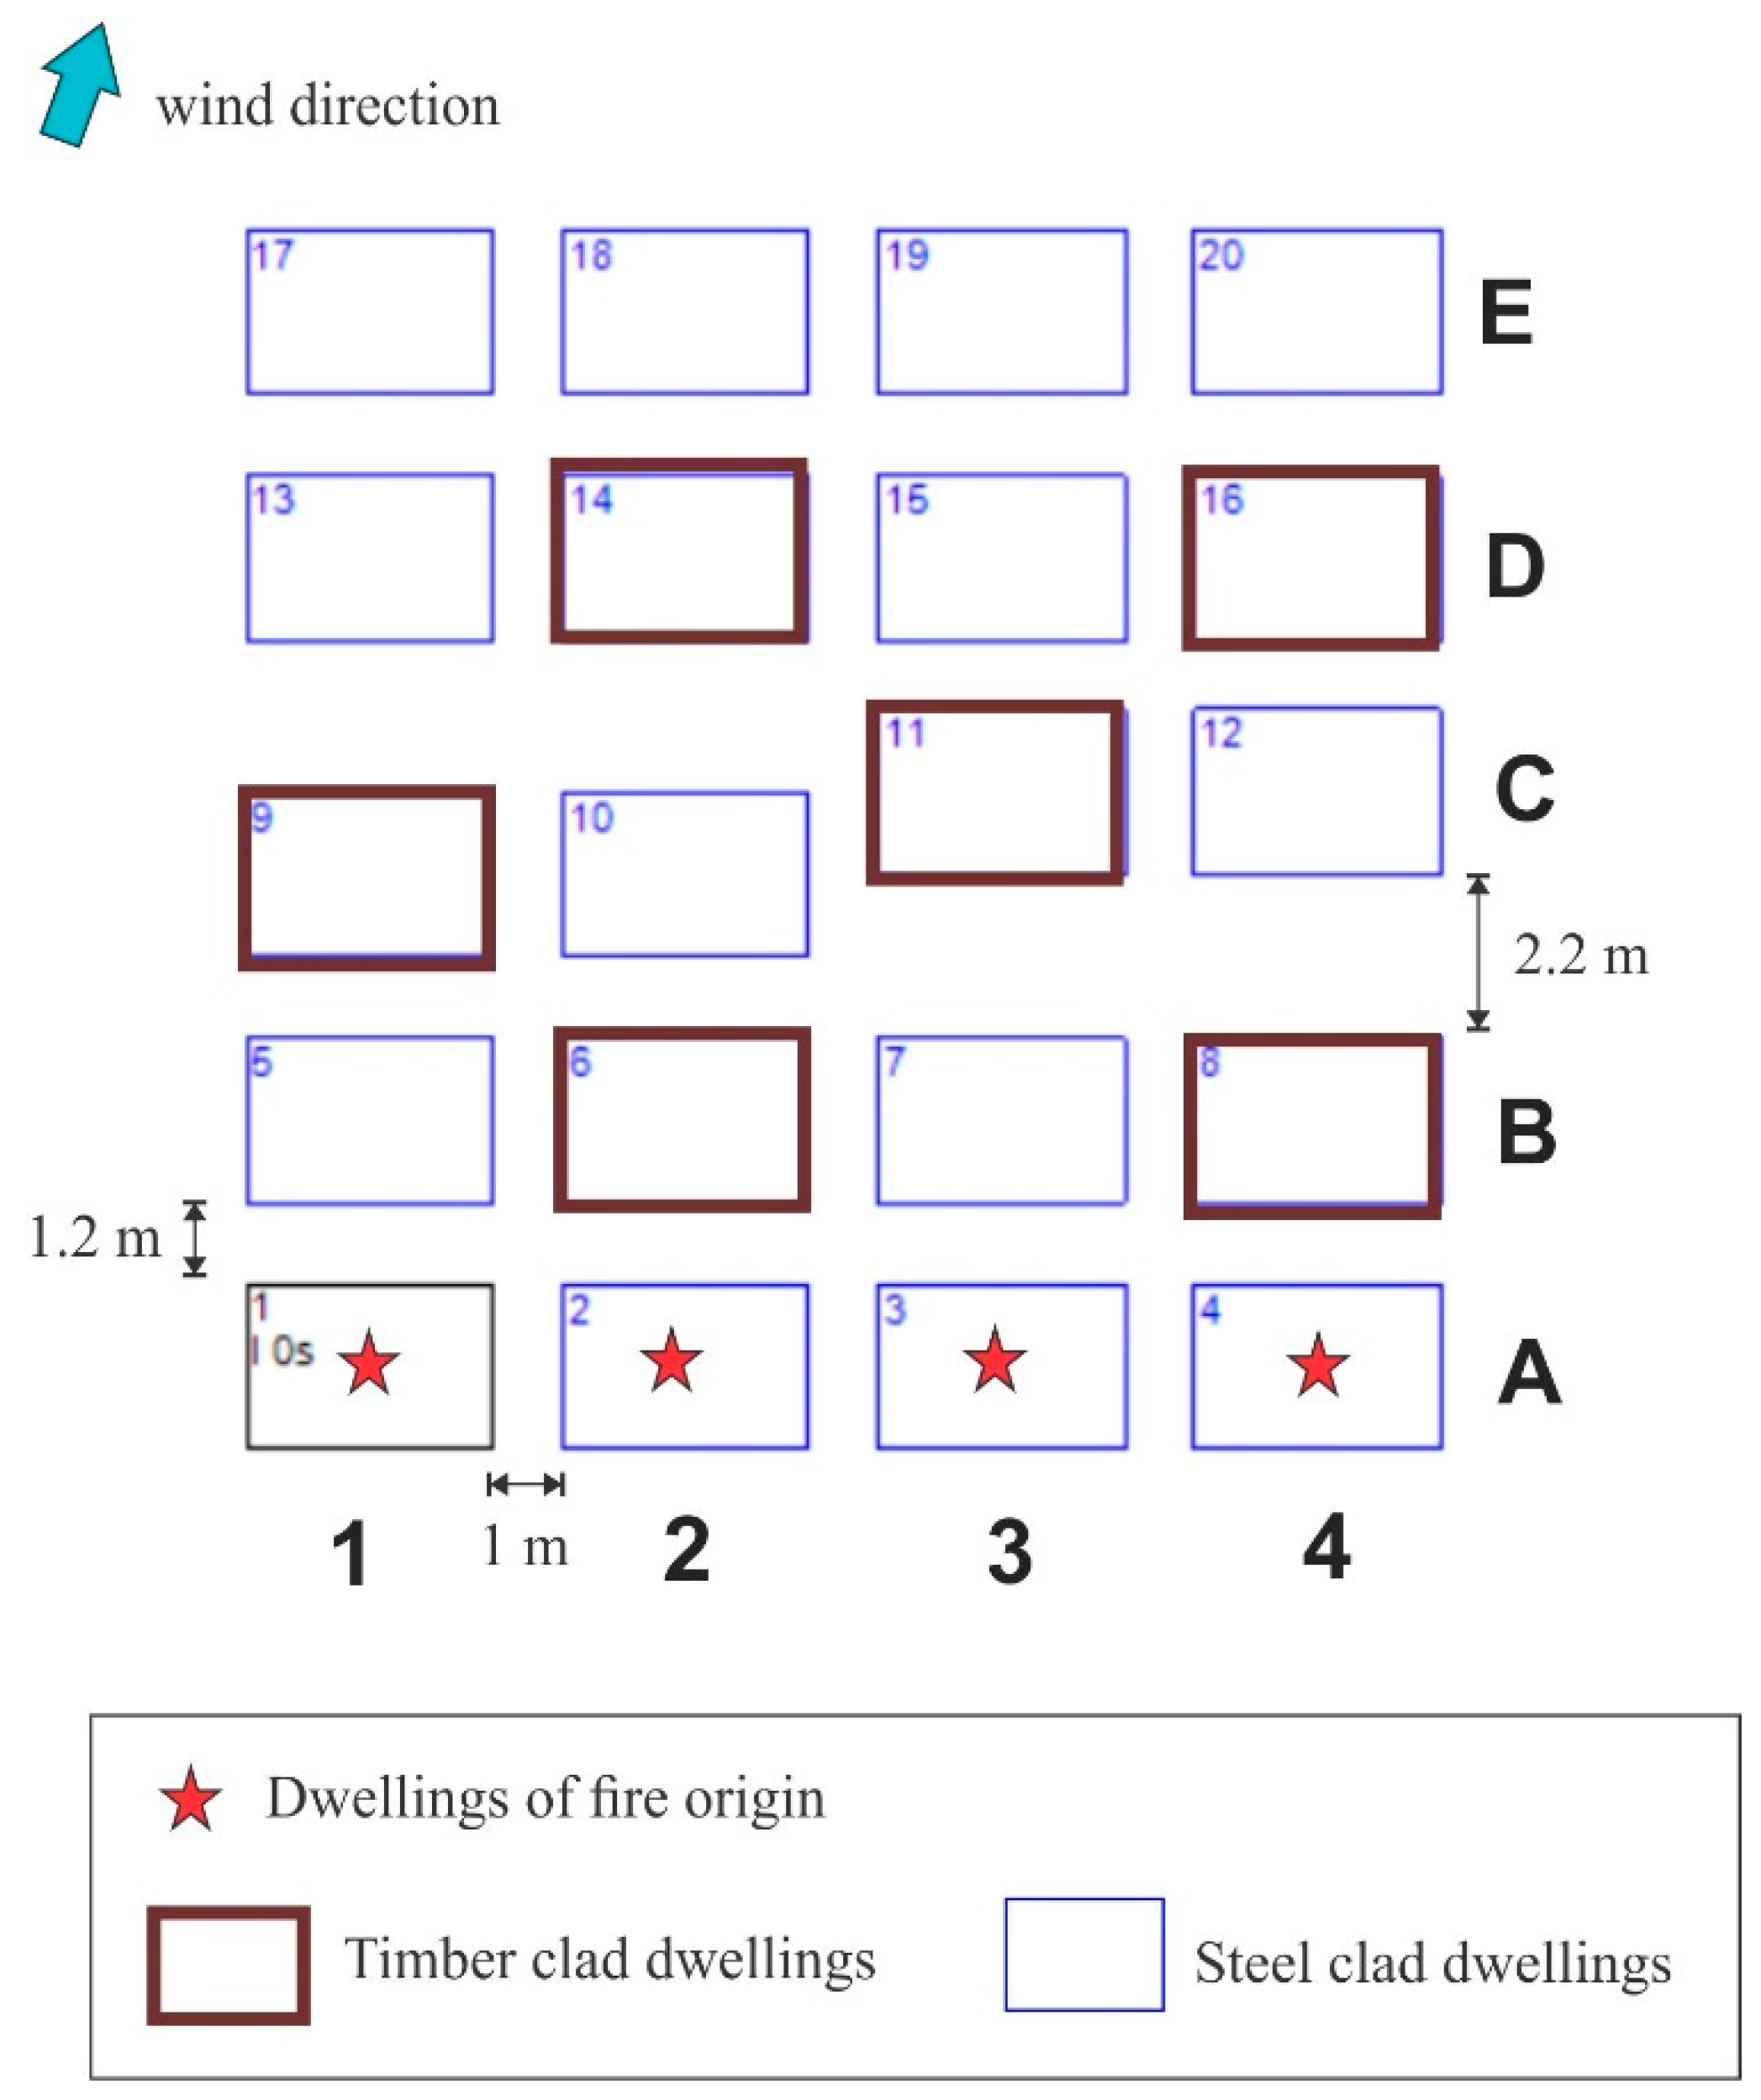
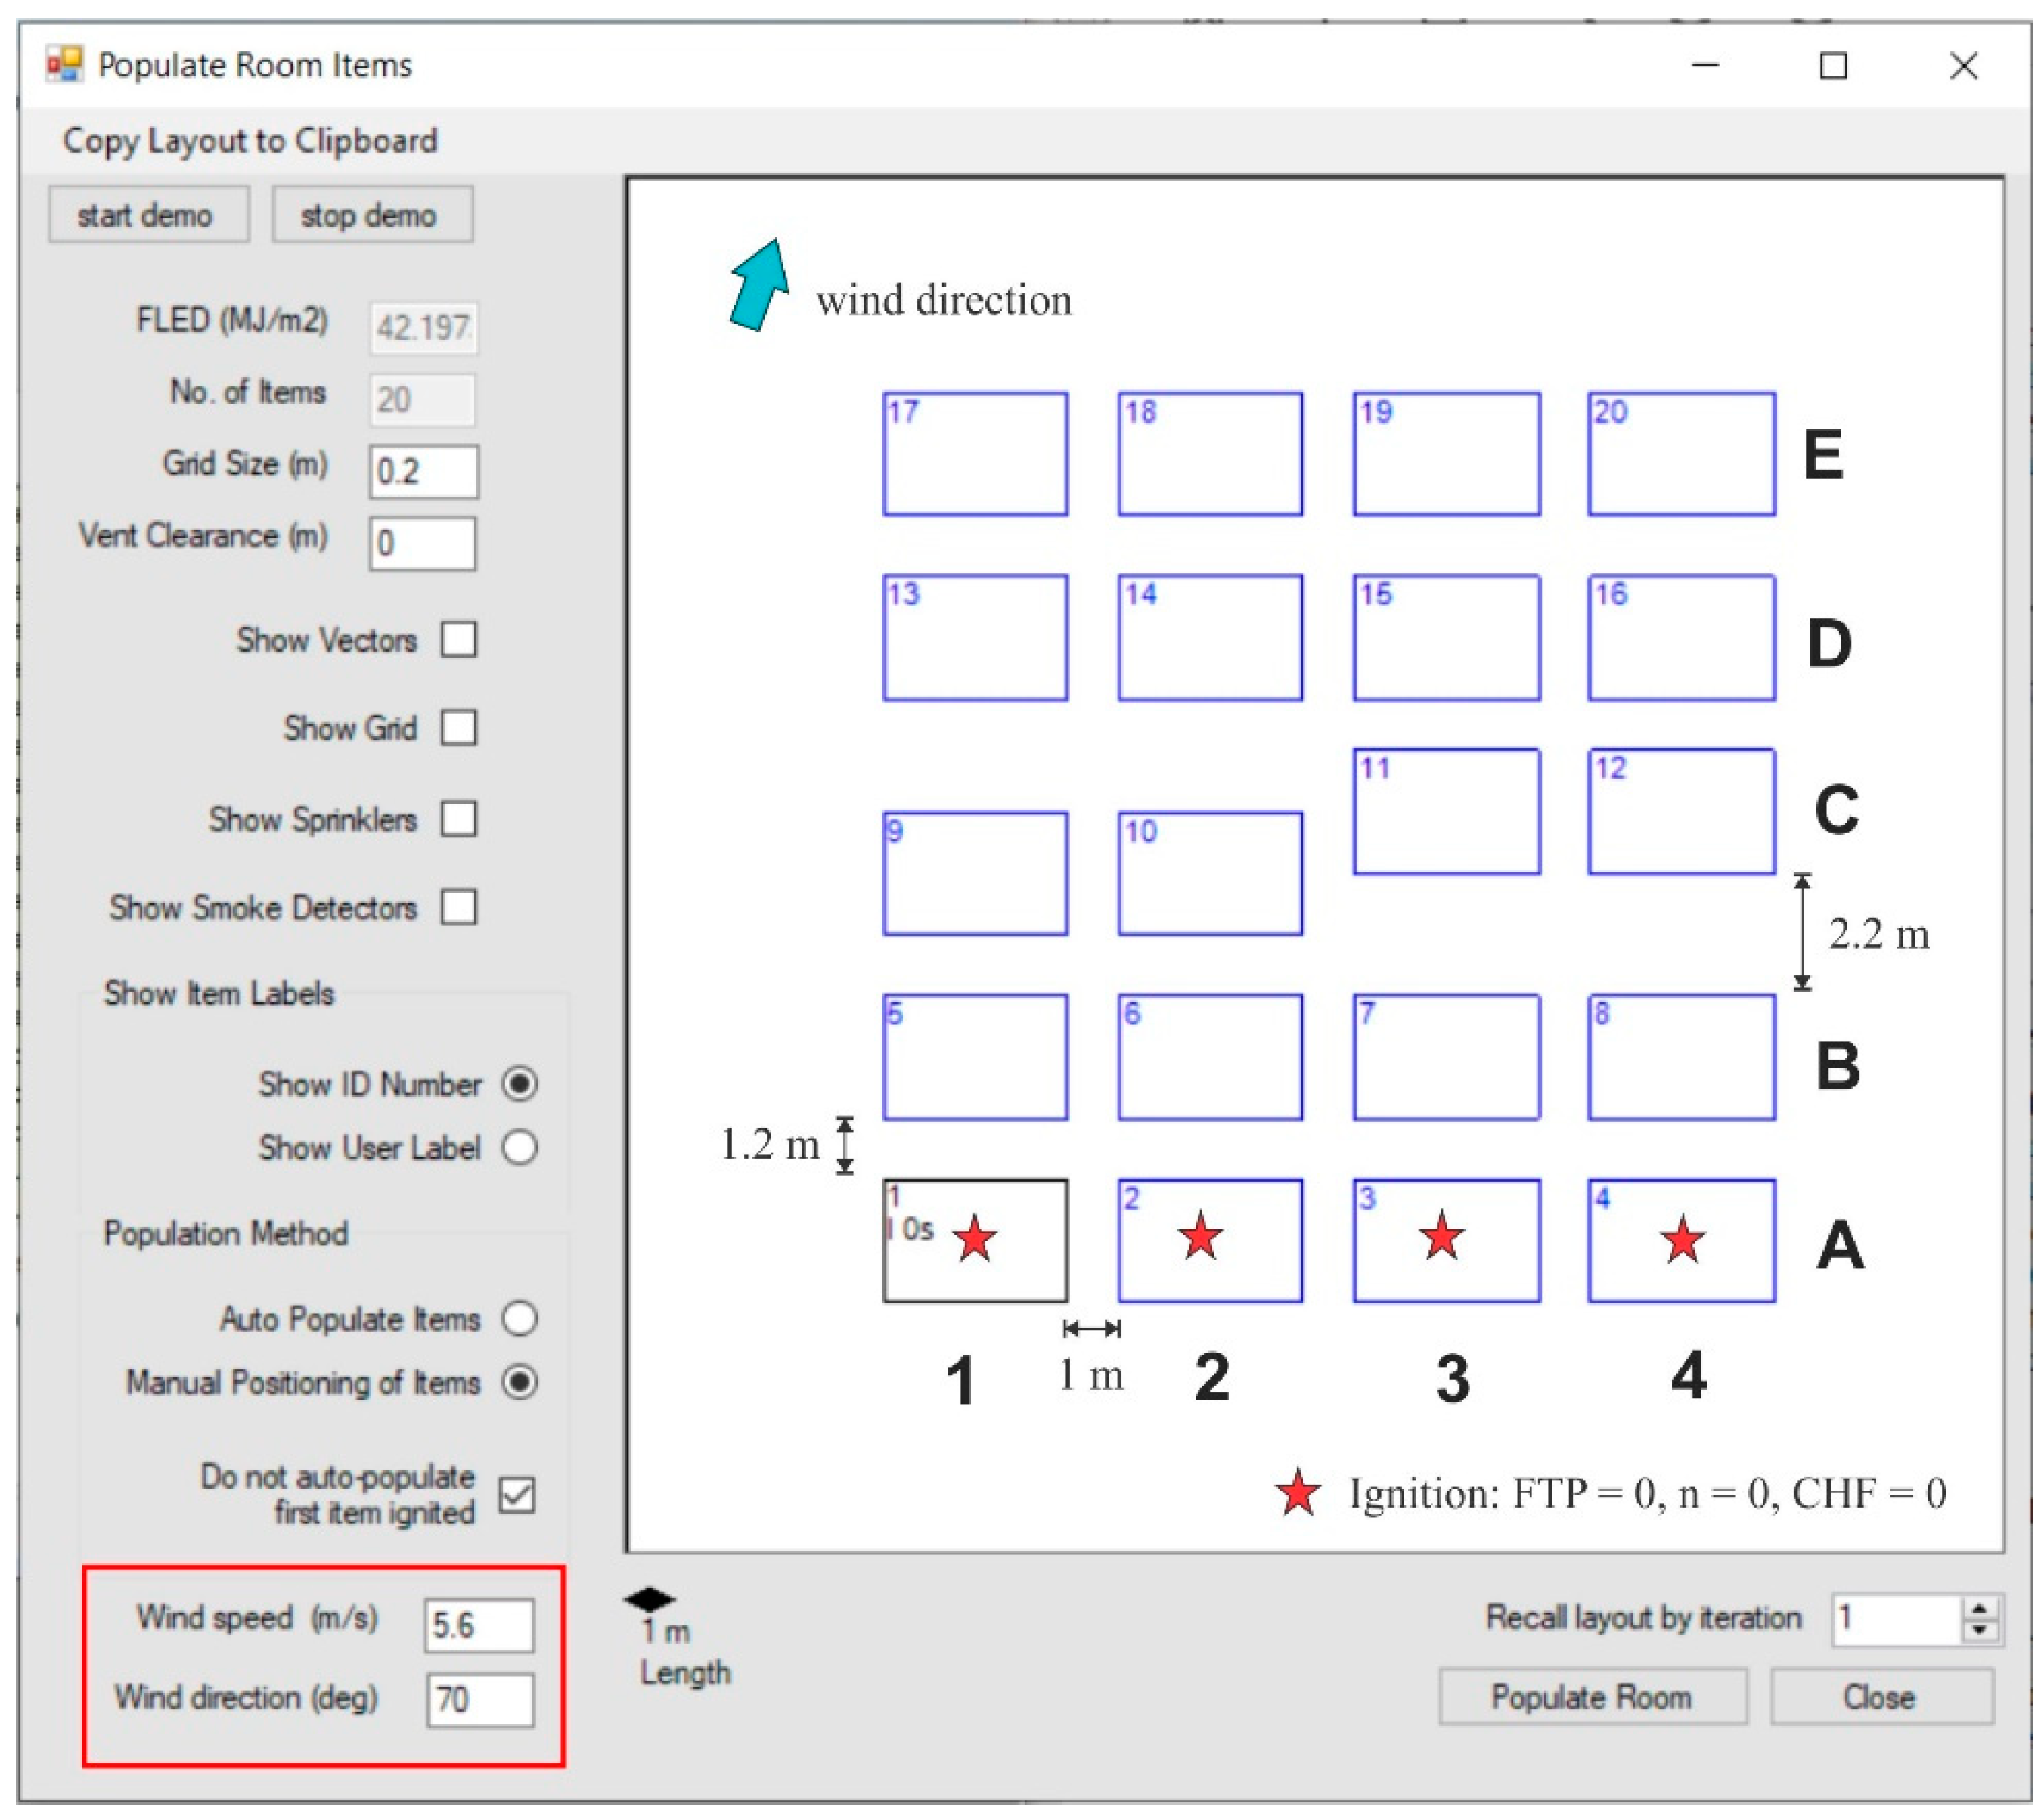
3.1. Experimental and Numerical Model Setup
3.2. Experimental versus Numerical Results
3.3. Effect of Ignition Criteria
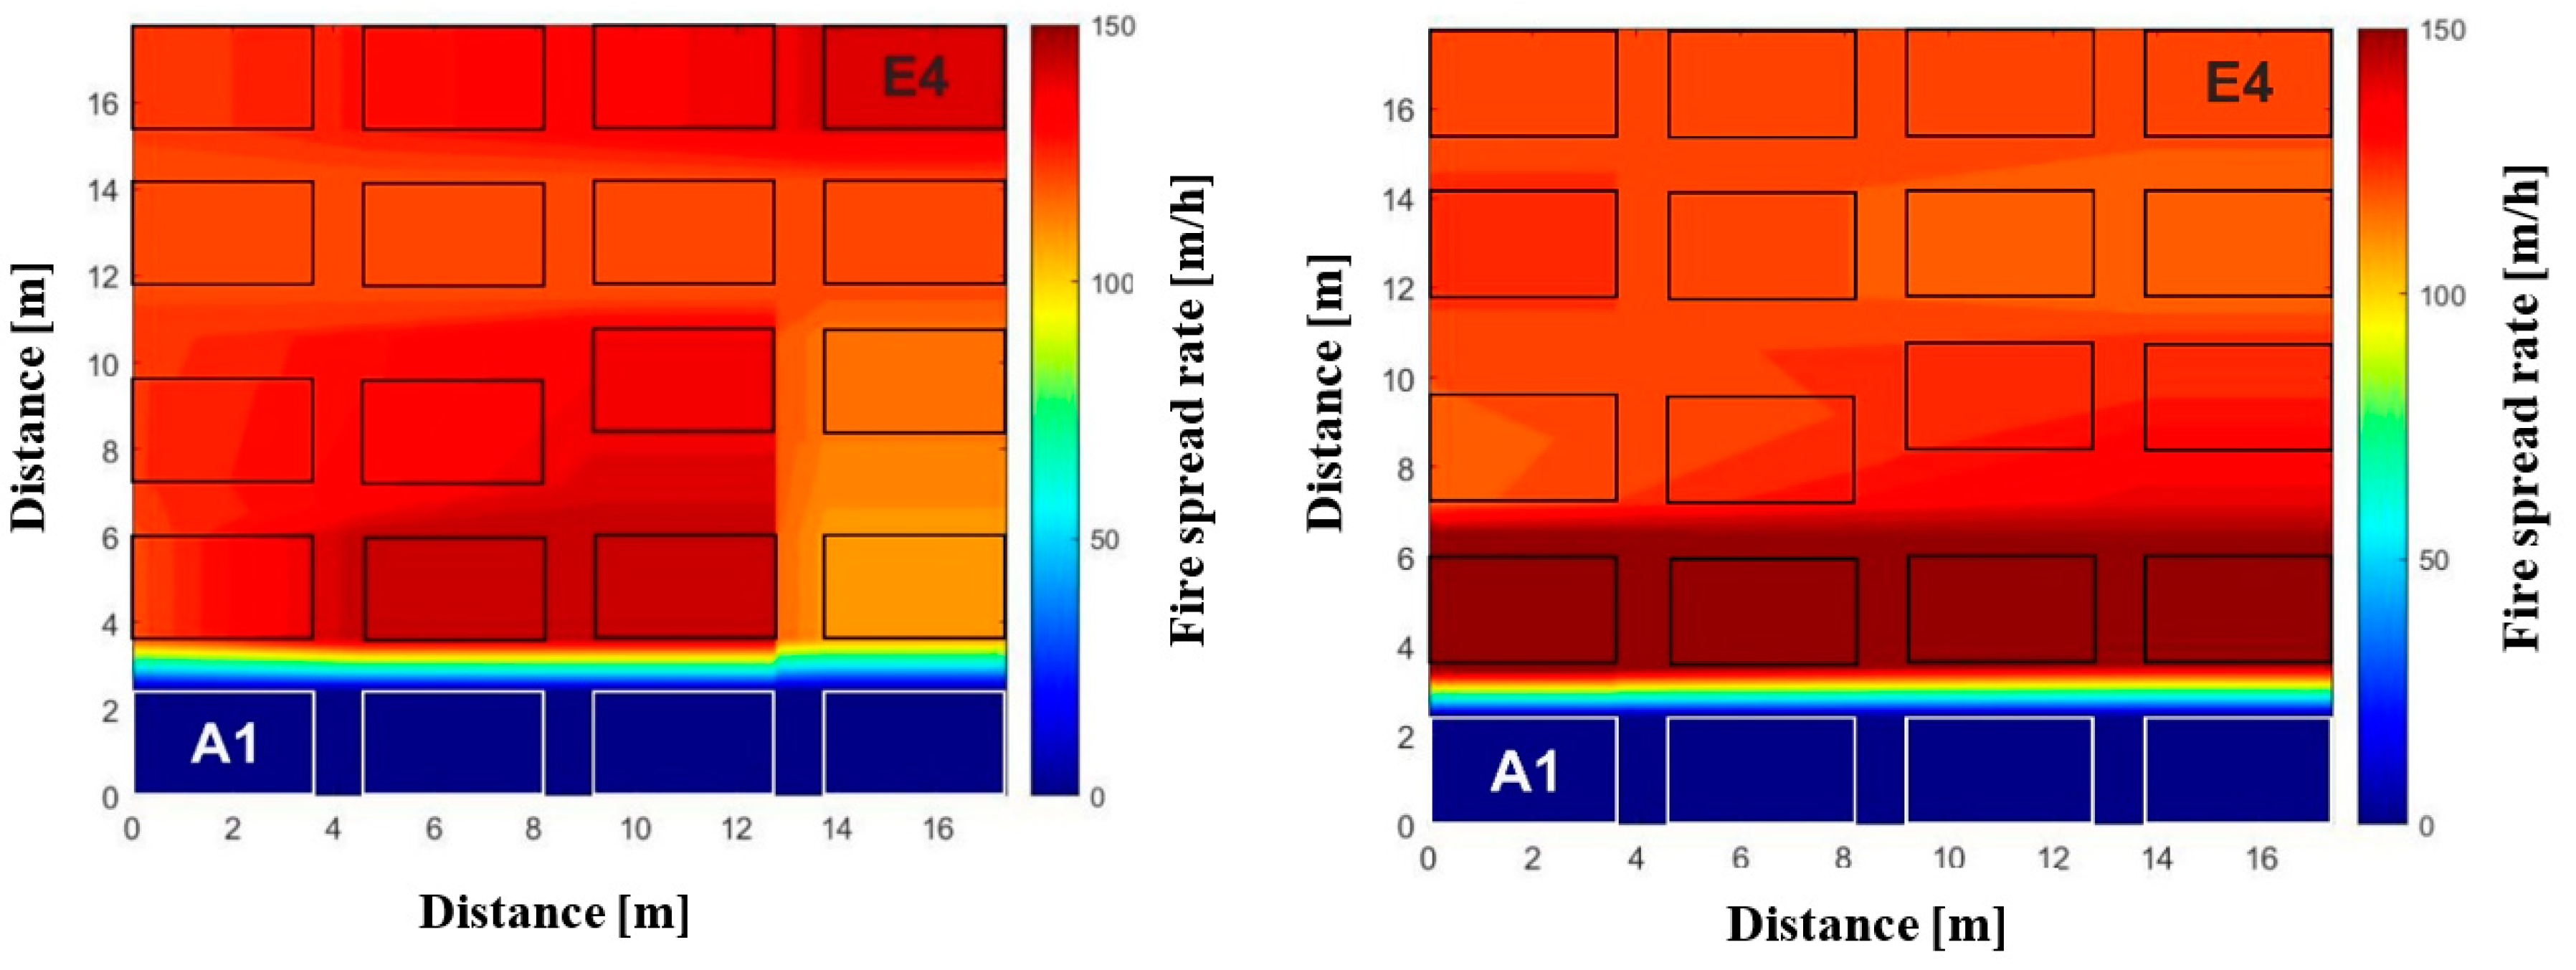
3.4. Colour Maps to Investigate Informal Settlement Layout Configurations
4. Spatial Metrics
5. Identifying the Spatial Metrics That Are Indicative of a Higher Fire Spread Risk
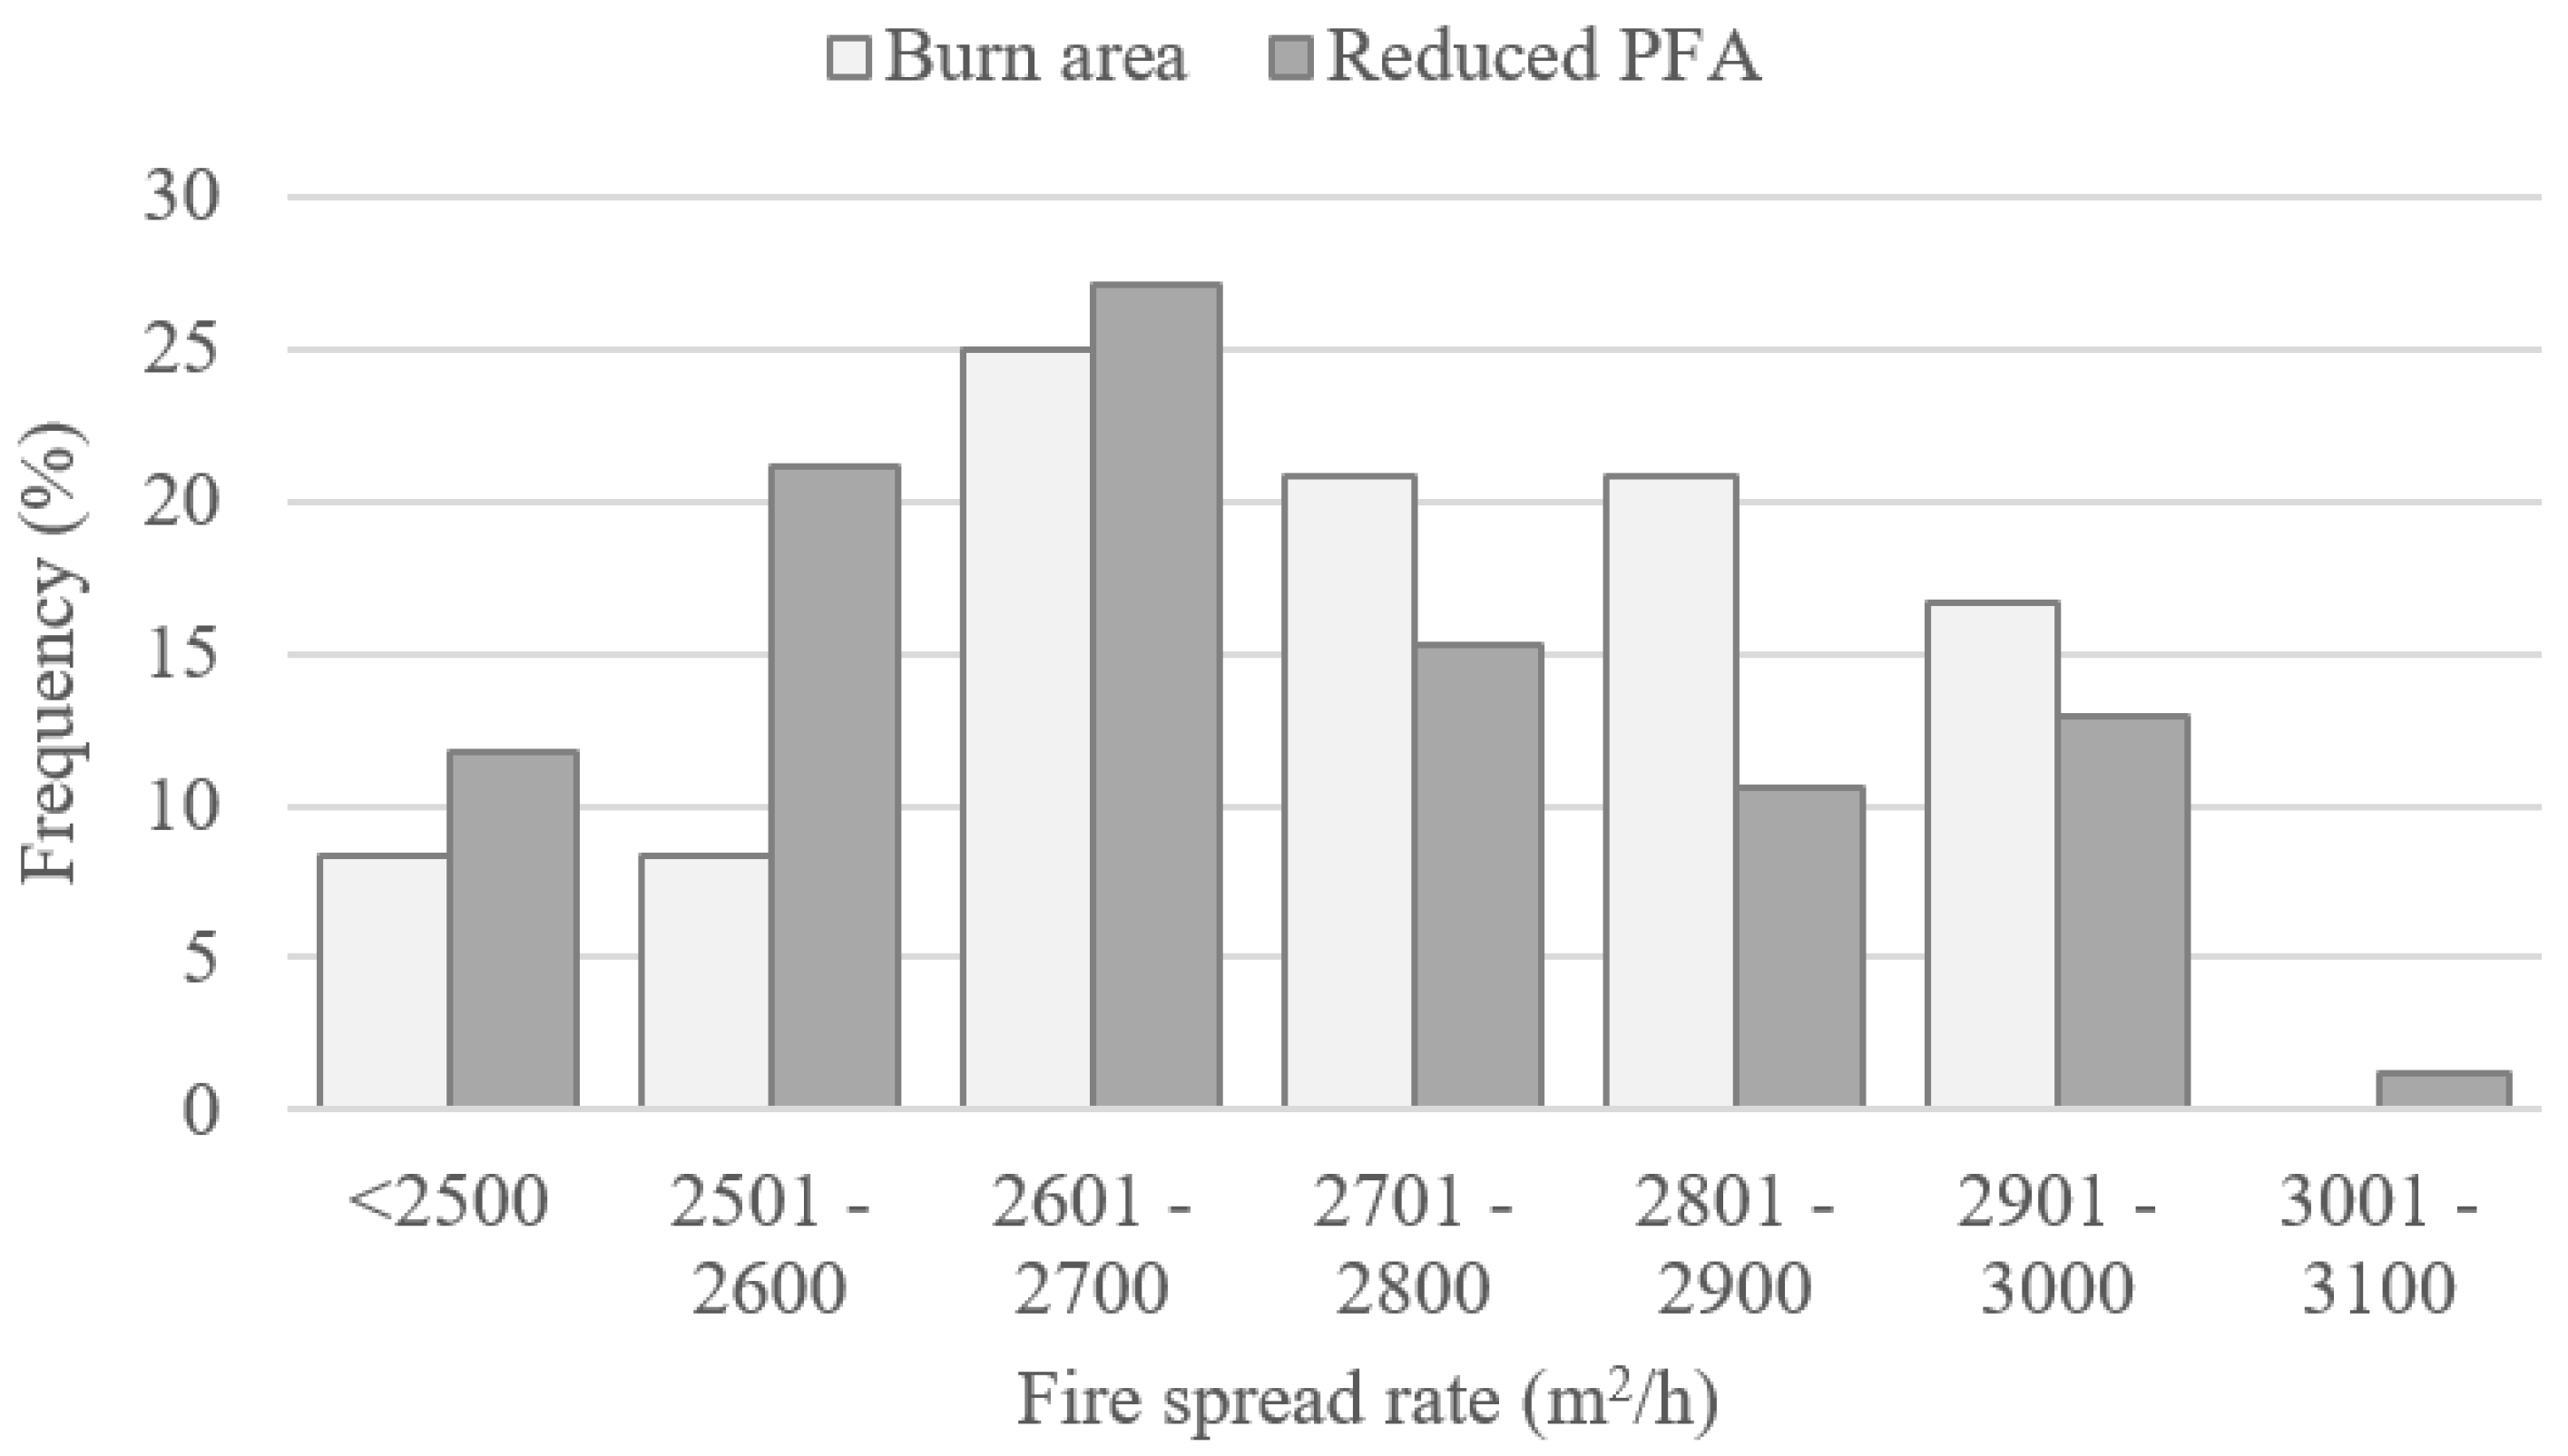
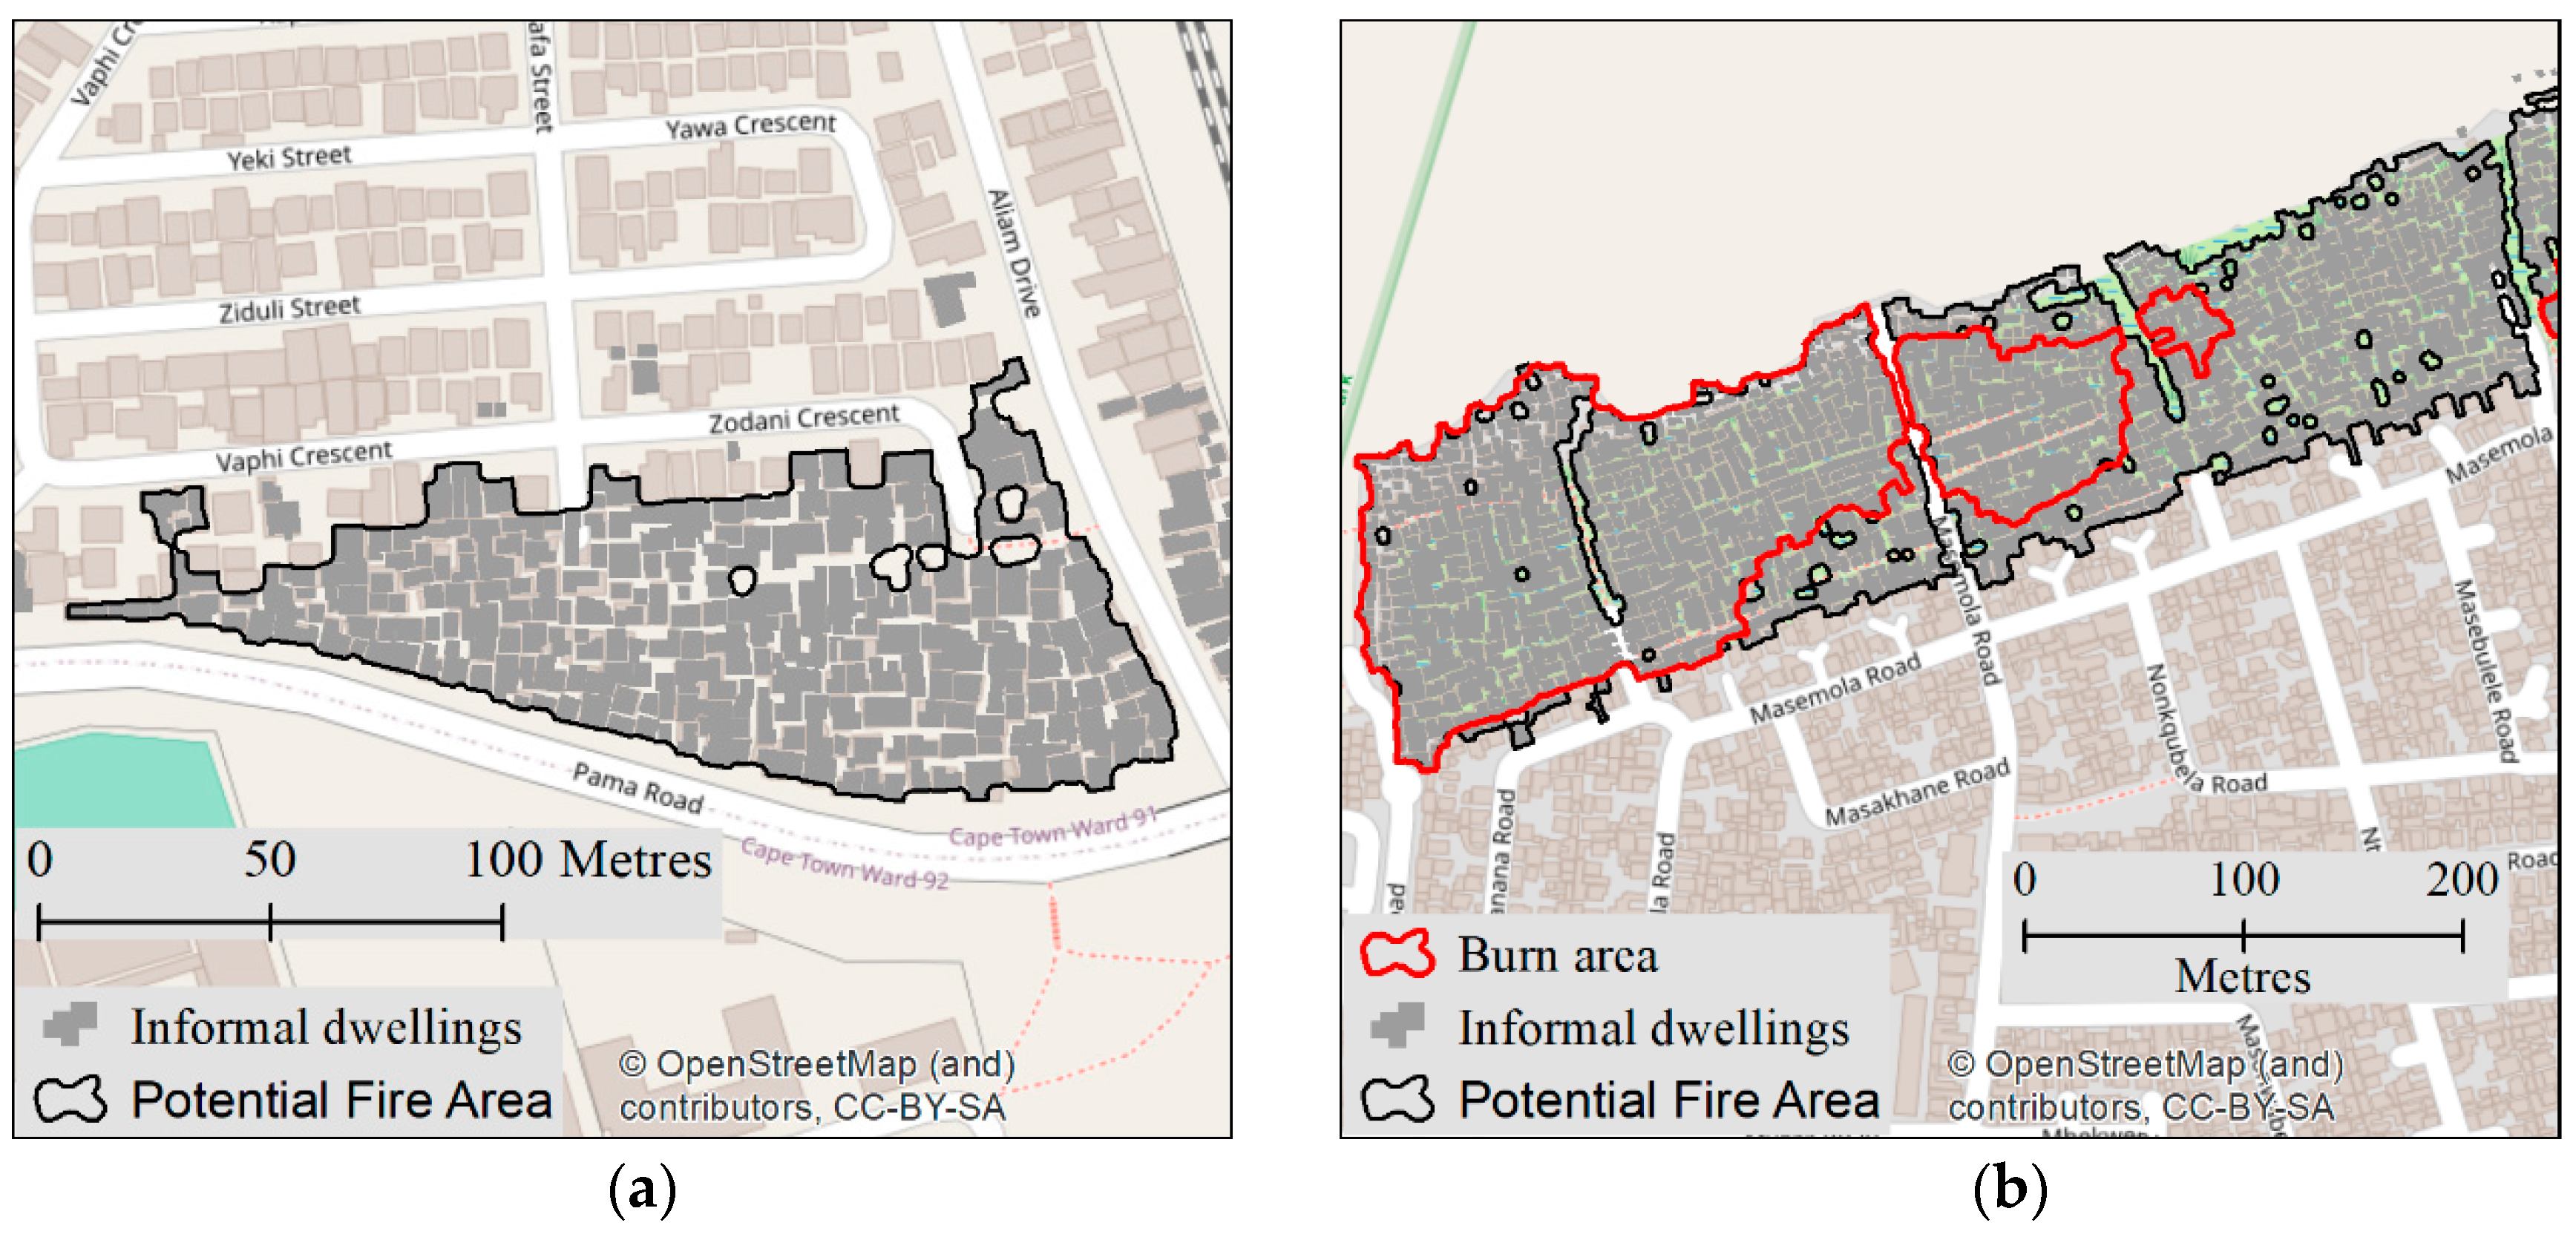
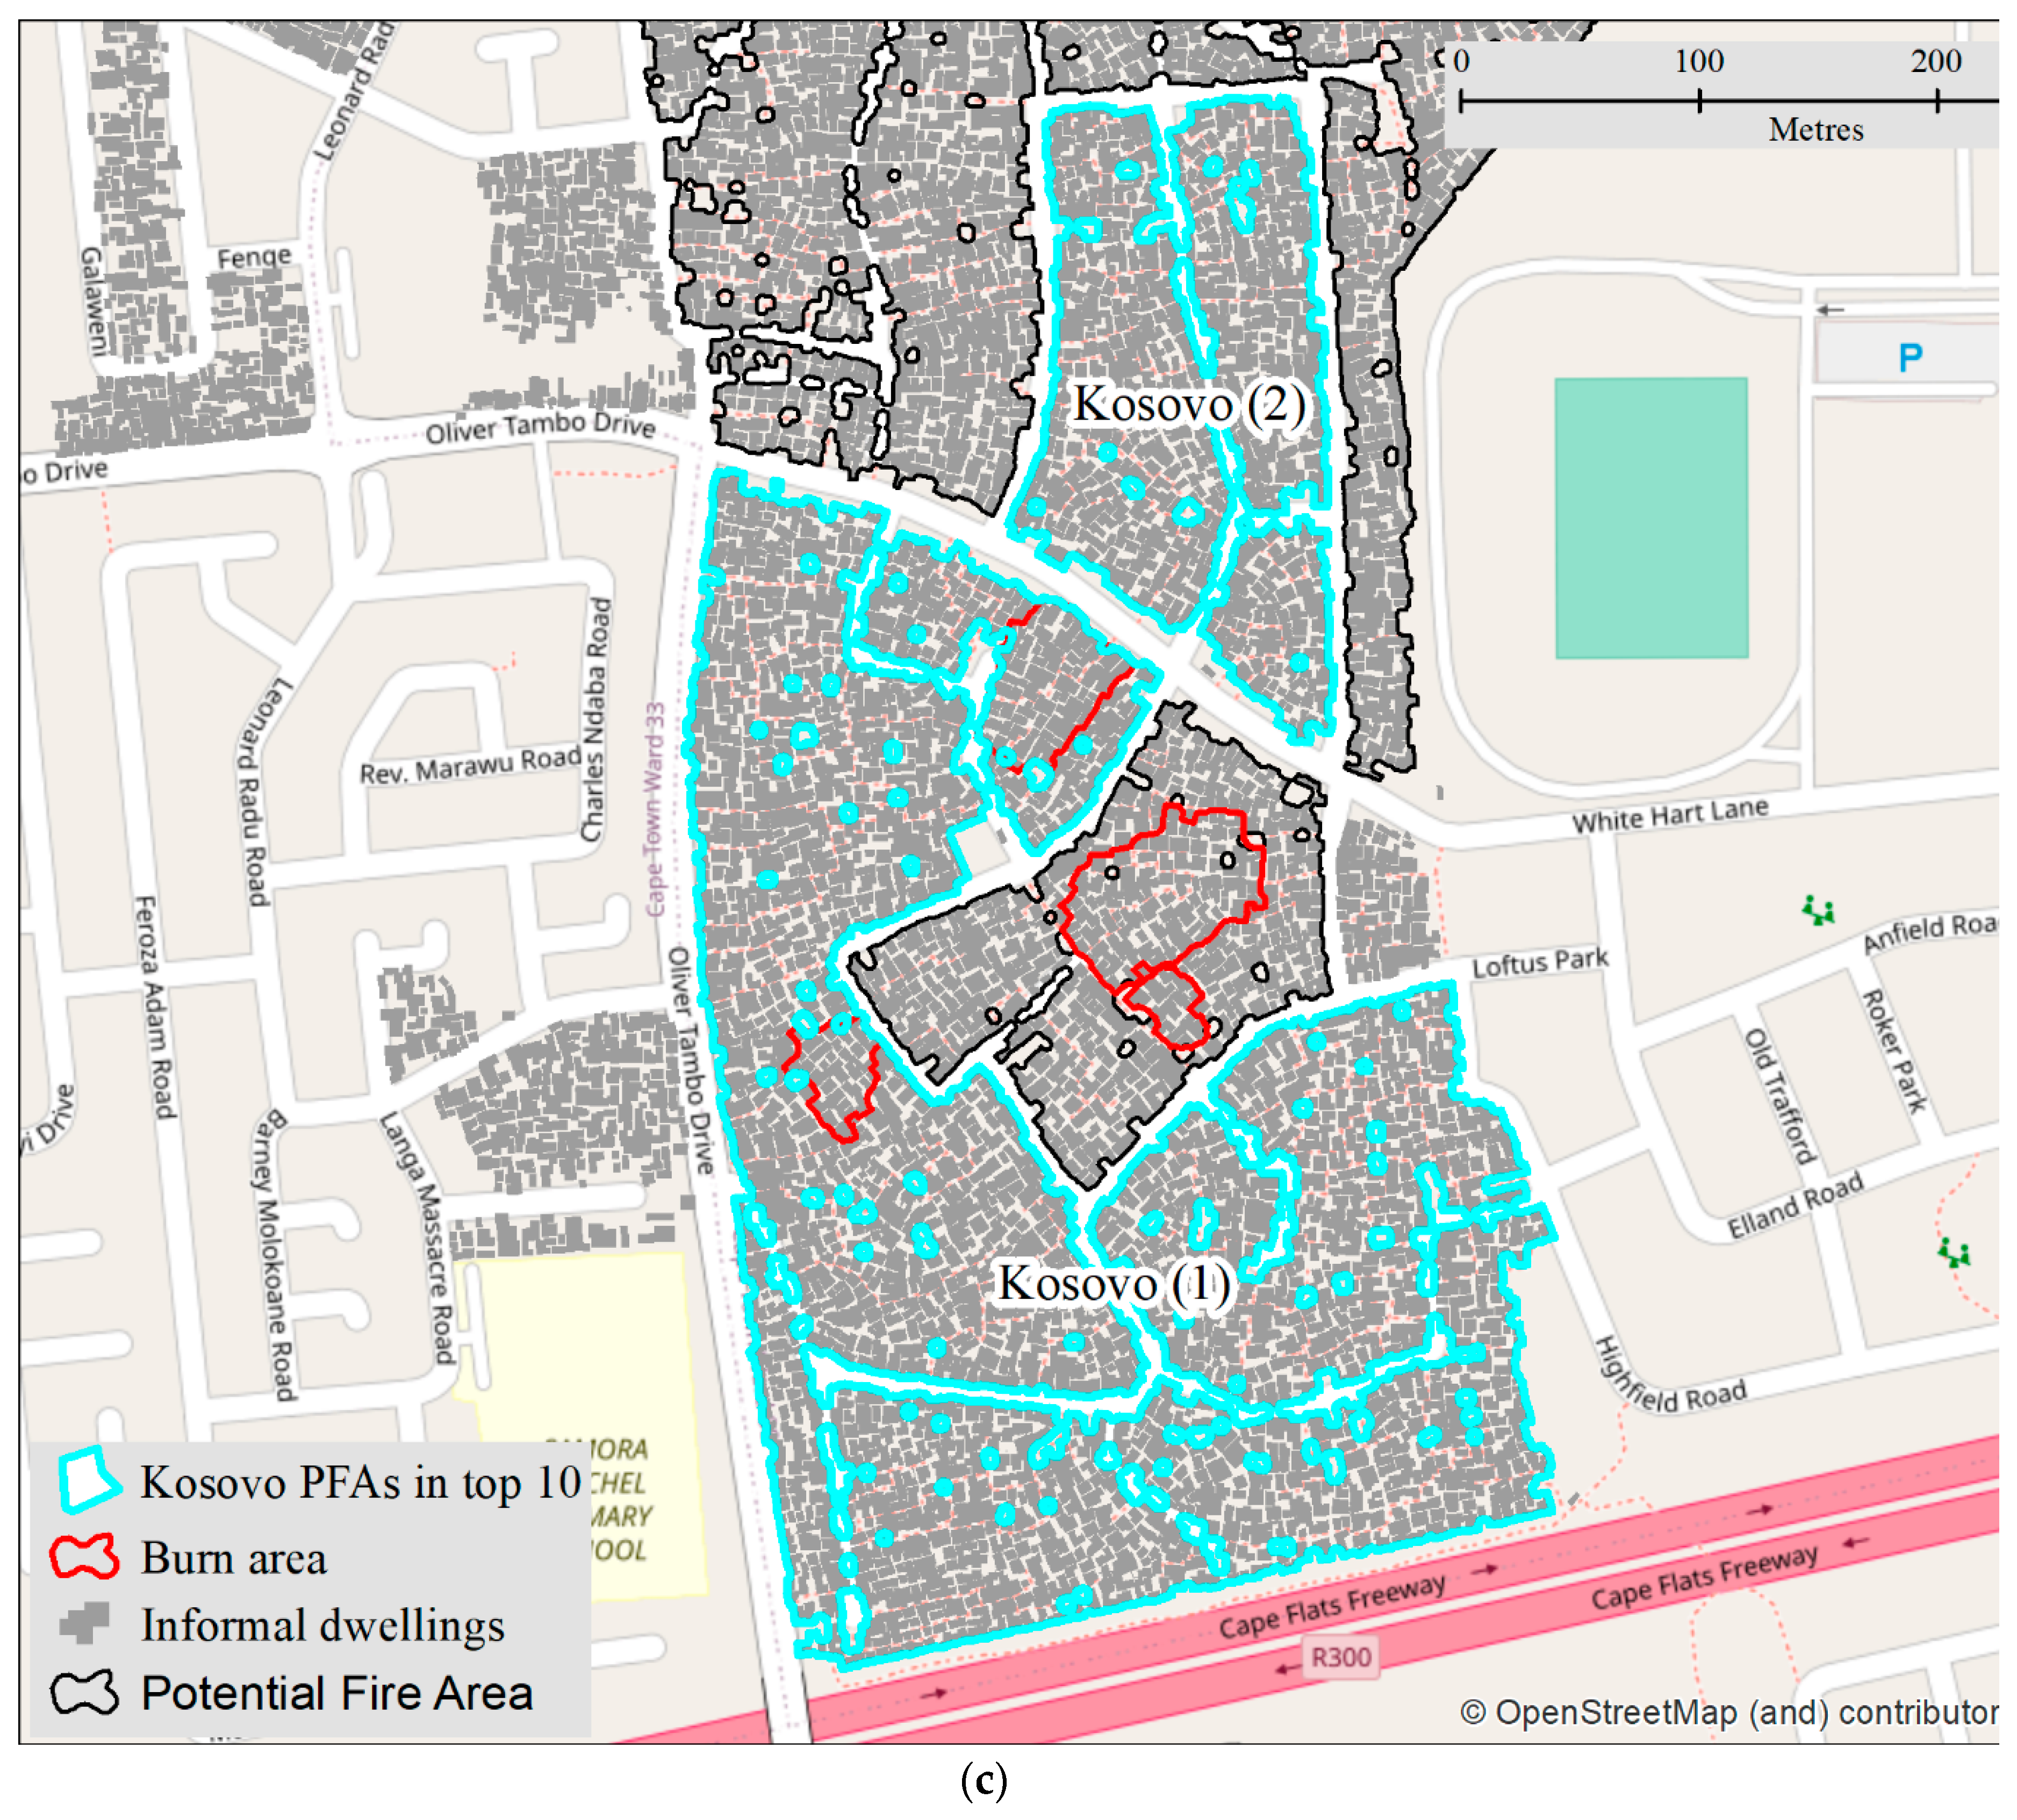
- PFA’s were created;
- due to the large number of informal settlements in Cape Town, only PFA’s larger than 1 ha were selected for subsequent analysis;
- density and NN1+3 have been calculated for each PFA;
- descriptive statistics of spatial metrics were calculated for both B-RISK scenarios and the PFAs; and
- Equation (11) has been applied to arrive at a fire spread rate for each PFA.
6. Future Considerations
- (a)
- the radiation emitted from dwellings could be calculated in a similar manner proposed by Equation (5) in this work. Hence, each wall of the ISD will thus emit a different incident heat flux based on the wall geometry (e.g., a wall with a window opening will radiate more energy compared to a wall with no openings);
- (b)
- the ignition criteria selected should consider both wind direction and separation distances to determine when the ignition criteria set should be auto- or piloted ignition;
- (c)
- the effect of changes in settlement (terrain) elevations;
- (d)
- a functionality that accounts for irregular shape dwellings;
- (e)
- the ability to include ISDs that are not orthogonal to each other in the domain;
- (f)
- the impact of convective cooling/heating; and
- (g)
- the impact of combustible materials placed between ISDs.
7. Conclusion
Author Contributions
Funding
Acknowledgments
Conflicts of Interest
References
- FPASA. SA Fire Loss Statistics 2016; FPASA: Boksburg, South Africa, 2018. [Google Scholar]
- World Health Organization. Burns; WHO: Geneva, Switzerland, 2018. [Google Scholar]
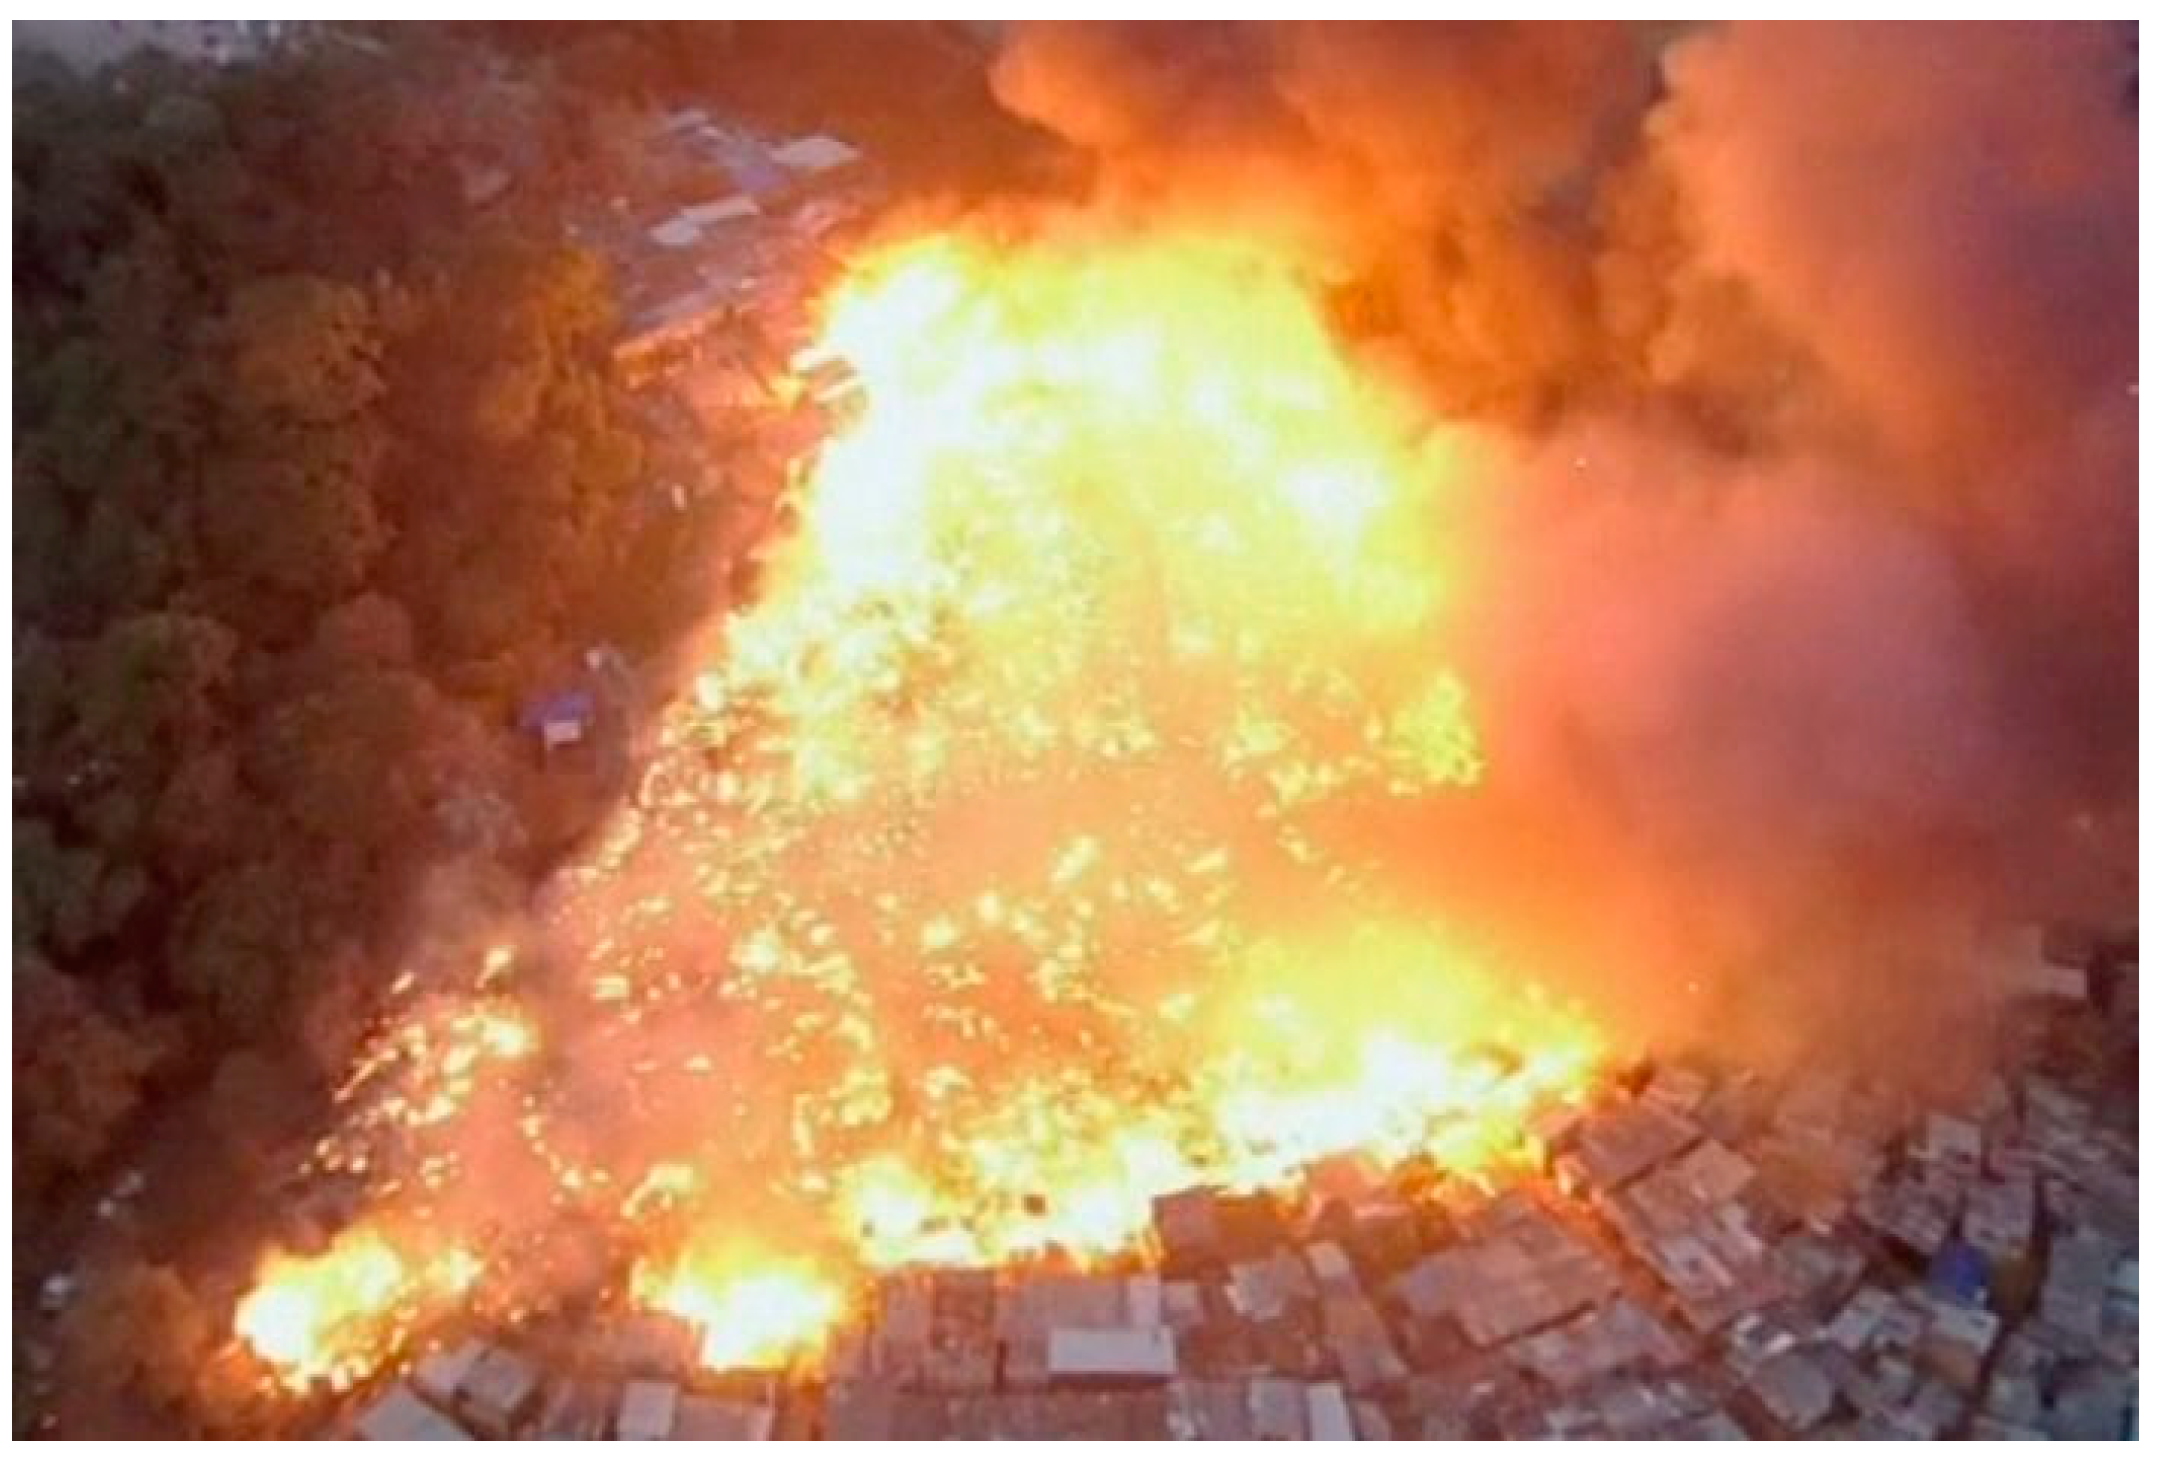
- A News, Favela in Flames: Aerial Footage Shows Fire Ripping through Brazilian Slum. 2016. Available online: https://www.abc.net.au/news/2016-09-14/fire-sweeps-through-sao-paulo-favela/7843336 (accessed on 9 April 2020).
- Kahanji, C.; Walls, R.S.; Cicione, A. Fire spread analysis for the 2017 Imizamo Yethu informal settlement conflagration in South Africa. Int. J. Disaster Risk Reduct. 2019, 39. [Google Scholar] [CrossRef]
- Wang, Y.; Beshir, M.; Cicione, A.; Hadden, R.; Krajcovic, M.; Rush, D. A full-scale experimental study on single dwelling burning behavior of informal settlement. Fire Saf. J. 2020, 103076. [Google Scholar] [CrossRef]
- Cicione, A.; Walls, R.S. Towards a simplified fire dynamic simulator model to analyse fire spread between multiple informal settlement dwellings based on full-scale experiments. Fire Mater. 2020, 1–17. [Google Scholar] [CrossRef]
- Cicione, A.; Beshir, M.; Walls, R.S.; Rush, D. Full-Scale Informal Settlement Dwelling Fire Experiments and Development of Numerical Models. Fire Technol. J. 2019. [Google Scholar] [CrossRef] [Green Version]
- de Koker, N.; Walls, R.; Cicione, A.; Sander, Z.; Loffel, S.; Claasen, J.; Fourie, S.; Croukamp, L.; Rush, D. 20 Dwelling Large-Scale Experiment of Fire Spread in Informal Settlements. Fire Technol. 2020. [Google Scholar] [CrossRef]
- Cicione, A.; Walls, R.S.; Kahanji, C. Experimental study of fire spread between multiple full scale informal settlement dwellings. Fire Saf. J. 2019, 105, 19–27. [Google Scholar] [CrossRef]
- Cicione, A.; Wade, C.; Spearpoint, M.; Gibson, L.; Walls, R.S.; Rush, D. A preliminary investigation to develop a semi-probabilistic model of informal settlement fire spread using B-RISK. Fire Saf. J. 2020, 103115. [Google Scholar] [CrossRef]
- Gibson, L.; Cicione, A.; Stevens, S.; Rush, D. The influence of wind and the spatial layout of dwellings on fire spread in informal settlements in Cape Town. Fire Saf. J. 2020. submitted. [Google Scholar]
- Walton, W.D.; Carpenter, D.; Wood, C. Zone Computer Fire Models for Enclosures. In SFPE Handbook of Fire Protection Engineering, 5th ed.; Springer: New York, NY, USA, 2016; pp. 1025–1033. [Google Scholar] [CrossRef]
- Wade, C.; Baker, G.; Frank, K.; Harrison, R.; Spearpoint, M. B-RISK User Guide and Technical Manual, BRANZ Study Report SR364; BRANZ: Porirua, New Zealand, 2016. [Google Scholar]
- Sazegara, S.; Spearpoint, M.; Baker, G. Benchmarking the Single Item Ignition Prediction Capability of B-RISK Using Furniture Calorimeter and Room-Size Experiments. Fire Technol. 2017, 53, 1485–1508. [Google Scholar] [CrossRef]
- Tohir, M.Z.M. The Capability of B-RISK Zone Modelling Software to Simulate BRE Multiple Vehicle Fire Spread Test. In Proceedings of the Asian Simulation Conference, Melaka, Malaysia, 27–29 August 2017. [Google Scholar]
- Building Research Establishment (BRE). Fire Spread in Car Parks; Building Research Establishment: London, UK, 2010. [Google Scholar]
- Heskestad, G. Fire Plumes, Flame Height, and Air Entrainment. In SFPE Handbook of Fire Protection Engineering, 4th ed.; Springer: Quincy, MA, USA, 2008; pp. 2–20. [Google Scholar]
- Oka, Y.; Sugawa, O.; Imamura, T.; Matsubara, Y. Effect of Cross-Winds to Apparent Flame Height and Tilt Angle from Several Kinds of Fire Source. In SFPE Handbook of Fire Protection Engineering; Springer: Quincy, MA, USA, 2003; pp. 915–926. [Google Scholar] [CrossRef] [Green Version]
- Cicione, A.; Walls, R.; Sander, Z.; Quiroz, N.F.; Narayanan, V.; Stevens, S.; Rush, D. The effect of separation distance between informal dwellings on fire spread rates based on experimental data and analytical equations. Fire Technol. 2020, 1–37. [Google Scholar] [CrossRef]
- Tewarson, A. Generation of Heat and Chemical Compounds in Fires. In SFPE Handbook of Fire Protection Engineering, 3rd ed.; DiNenno, P., Ed.; Springer: Quincy, MA, USA, 2016; pp. 277–324. [Google Scholar] [CrossRef]
- Shields, T.J.; Silcock, G.W.; Murry, J.J. Evaluating ignition data using the flux time product. Fire Mater. 1994, 18, 243–254. [Google Scholar] [CrossRef]
- Wang, Y.; Bertrand, C.; Beshir, M.; Kahanji, C.; Walls, R.; Rush, D. Developing an experimental database of burning characteristics of combustible informal settlement dwelling materials. Fire Saf. J. 2019. [Google Scholar] [CrossRef]
- Wang, Y.; Rush, D. Cone Calorimeter Tests of Combustible Materials Found in Informal Settlements; Edinburgh DataShare, University of Edinburgh: Edinburgh, UK, 2019. [Google Scholar] [CrossRef]
- Rush, D.; Gibson, L.; Bankoff, G.; Walls, R.; Spinardi, G.; Cooper-Knock, S.; Twigg, J.; Al, E. Fire Risk Reduction in an Urbanizing World. In United Nations Office for Disaster Risk Reduction; United Nations: Geneva, Switzerland, 2019. [Google Scholar]
- Walls, R.; Zweig, P. Towards sustainable slums: Understanding fire engineering in informal settlements, Sustain. Vital Technol. Eng. Inform. 2016, 4, 1–5. [Google Scholar]
- Baker, G.; Spearpoint, M.; Fleischmann, C.; Wade, C. Selecting an ignition criterion methodology for use in a radiative fire spread submodel. Fire Mater. 2011, 35, 367–381. [Google Scholar] [CrossRef]
- Babrauskas, V. Heat release rates. In SFPE Handbook of Fire Protection Engineering, 5th ed.; Hurley, M.J., Ed.; Springer: Berlin/Heidelberg, Germany, 2016; p. 829. [Google Scholar] [CrossRef]
- Cicione, A.; Walls, R. Estimating time to structural collapse of informal settlement dwellings based on structural fire engineering principles. In Advances in Engineering Materials, Structures and Systems: Innovations, Mechanics and Applications; CRC Press: Boca Raton, FL, USA, 2019. [Google Scholar]
- Walls, R.S.; Zweig, P. Towards sustainable slums: Understanding fire engineering in informal settlements. In Proceedings of the International Conference on Sustainable Vital Technologies in Engineering and Informatics, Cairo, Egypt, 7–9 November 2016; pp. 93–98. [Google Scholar] [CrossRef]
- Mcgrattan, K.; Mcdermott, R.; Simo, H.; Floyd, J.; Vanella, M.; Weinschenk, C.; Overholt, K. Fire Dynamics Simulator Technical Reference Guide Volume 3: Validation; NIST: Gaithersburg, MD, USA, 2017.
- Wang, Y.; Gibson, L.; Beshir, M.; Rush, D. Preliminary investigation of critical separation distance between shacks in informal settlements fire. In Proceedings of the 11th Asia-Oceania Symposium on Fire Science and Technology, Taipei, Taiwan, 22–24 October 2018. [Google Scholar]
- Gibson, L.; Adeleke, A.; Hadden, R.; Rush, D. Spatial metrics from LiDAR roof mapping for fire spread risk assessment of informal settlements in Cape Town, South Africa. Fire Saf. J. 2020, 103053. [Google Scholar] [CrossRef]
- School of Engineering, University of Edinburgh. Infrastructure and Environment, Dwelling Outline—Informal Settlements of Cape Town. 2020. Available online: https://datashare.is.ed.ac.uk/handle/10283/3560 (accessed on 3 November 2020).
- Montgomery, D.C.; Jennings, C.L.; Kulahci, M. Introduction Time Series Analysis and Forecasting; Wiley: Hoboken, NJ, USA, 2016. [Google Scholar]
- Gibson, L. Informal Dwelling Fires, 2009–2015, City of Cape Town, 2009–2015; School of Engineering, University of Edinburgh: Edinburgh, UK, 2020. [Google Scholar]
- Stevens, S.; Gibson, L.; Rush, D. Conceptualising a GIS-based risk quantification framework for fire spread in informal settlements: A Cape Town case study. Int. J. Disaster Risk Reduct. 2020, 50, 101736. [Google Scholar] [CrossRef]


| Item | FTP Value (kW/m2)n | FTP Index (n) | |
|---|---|---|---|
| Timber 1 | 6394.5 | 1.6 | 10.9 |
| Timber 2 | 2116.9 | 1.2 | 17.6 |
| Timber 3 | 2866.0 | 1.2 | 10.2 |
| Plastic sheets | 18.4 | 0.2 | 12.3 |
| Cardboard 1 | 1251.7 | 1.4 | 9.8 |
| Cardboard 2 | 224.5 | 1.1 | 11.2 |
| Curtain 1 | 97.6 | 0.8 | 34 |
| Curtain 2 | 1145.5 | 1.6 | 23 |
| ID | Perimeter (m) | Area (m2) | NN1:ID Distance (m) | NN2:ID Distance (m) | NN3:ID Distance (m) | NN4:ID Distance (m) | NN5:ID Distance (m) |
|---|---|---|---|---|---|---|---|
| 1 | 12 | 8.64 | 14 0.45 | 2 0.80 | 11 2.16 | 15 4.27 | 4 4.97 |
| 2 | 12 | 8.64 | 4 0.60 | 1 0.80 | 11 0.80 | 14 0.82 | 3 4.10 |
| 3 | 12 | 8.64 | 11 0.19 | 9 0.35 | 7 0.37 | 8 0.47 | 4 1.83 |
| 4 | 12 | 8.64 | 8 0.42 | 2 0.57 | 11 1.00 | 3 1.83 | 14 3.44 |
| 5 | 12 | 8.64 | 6 0.45 | 15 0.58 | 12 3.27 | 10 4.59 | 14 5.81 |
| 6 | 12 | 8.64 | 15 0.40 | 5 0.44 | 10 0.55 | 12 2.62 | 13 3.15 |
| 7 | 12 | 8.64 | 3 0.37 | 9 0.40 | 13 0.98 | 11 1.76 | 8 3.24 |
| 8 | 12 | 8.64 | 4 0.42 | 3 0.47 | 11 1.23 | 9 3.22 | 7 3.24 |
| 9 | 12 | 8.64 | 3 0.35 | 7 0.40 | 12 0.49 | 11 0.58 | 12 0.83 |
| 10 | 12 | 8.64 | 13 0.20 | 6 0.55 | 9 1.34 | 15 1.37 | 12 1.77 |
| 11 | 19.2 | 17.28 | 12 0.15 | 14 0.19 | 3 0.19 | 9 0.58 | 2 0.80 |
| 12 | 20.1 | 17.28 | 14 0.13 | 11 0.15 | 15 0.27 | 9 0.49 | 10 1.77 |
| 13 | 19.2 | 17.28 | 10 0.20 | 9 0.83 | 7 0.98 | 12 1.78 | 6 3.15 |
| 14 | 18.4 | 17.28 | 12 0.13 | 11 0.19 | 15 0.22 | 1 0.49 | 2 0.82 |
| 15 | 23.6 | 17.28 | 14 0.22 | 12 0.27 | 6 0.40 | 5 0.58 | 10 1.37 |
| Sum | 220.5 | 172.8 | |||||
| Average | 0.31 | 0.47 | 0.95 | 1.69 | 2.69 | ||
| PFA | 231.26 | ||||||
| Density (%) | = Sum Area/PFA ×100 = 172.8/231.26 ×100 = 74.7 | Edge density (m/ha) | = Sum Perimeter/PFA × 10,000 = 220.5/231.26 × 10,000 = 9535 | ||||
| Settlement Containing PFA | Area (m2) | Density (%) | NN1+3 (m) | Fire Spread Rate Predicted by Equation (11) (m2/h) |
|---|---|---|---|---|
| YAB Section | 10,143 | 77.9 | 1.21 | 3002 |
| K2 Section | 12,156 | 76.6 | 1.27 | 2960 |
| Dunoon School Site | 25,264 | 77.1 | 1.31 | 2957 |
| WB Section | 12,527 | 75.1 | 1.21 | 2942 |
| Kosovo (1) | 90,243 | 75.6 | 1.28 | 2935 |
| Silvertown | 28,124 | 79.7 | 1.6 | 2928 |
| PJS Section | 33,884 | 80.9 | 1.7 | 2927 |
| Phola Park–Philippi | 28,344 | 75.8 | 1.3 | 2926 |
| Masiphumelele | 60,411 | 77.2 | 1.4 | 2923 |
| Kosovo (2) | 23,663 | 77.3 | 1.5 | 2920 |
Publisher’s Note: MDPI stays neutral with regard to jurisdictional claims in published maps and institutional affiliations. |
© 2020 by the authors. Licensee MDPI, Basel, Switzerland. This article is an open access article distributed under the terms and conditions of the Creative Commons Attribution (CC BY) license (http://creativecommons.org/licenses/by/4.0/).
Share and Cite
Cicione, A.; Gibson, L.; Wade, C.; Spearpoint, M.; Walls, R.; Rush, D. Towards the Development of a Probabilistic Approach to Informal Settlement Fire Spread Using Ignition Modelling and Spatial Metrics. Fire 2020, 3, 67. https://0-doi-org.brum.beds.ac.uk/10.3390/fire3040067
Cicione A, Gibson L, Wade C, Spearpoint M, Walls R, Rush D. Towards the Development of a Probabilistic Approach to Informal Settlement Fire Spread Using Ignition Modelling and Spatial Metrics. Fire. 2020; 3(4):67. https://0-doi-org.brum.beds.ac.uk/10.3390/fire3040067
Chicago/Turabian StyleCicione, Antonio, Lesley Gibson, Colleen Wade, Michael Spearpoint, Richard Walls, and David Rush. 2020. "Towards the Development of a Probabilistic Approach to Informal Settlement Fire Spread Using Ignition Modelling and Spatial Metrics" Fire 3, no. 4: 67. https://0-doi-org.brum.beds.ac.uk/10.3390/fire3040067