Projected Impact of Mid-21st Century Climate Change on Wildfire Hazard in a Major Urban Watershed outside Portland, Oregon USA

 , , ,
, , ,
Abstract
:1. Introduction
2. Materials and Methods
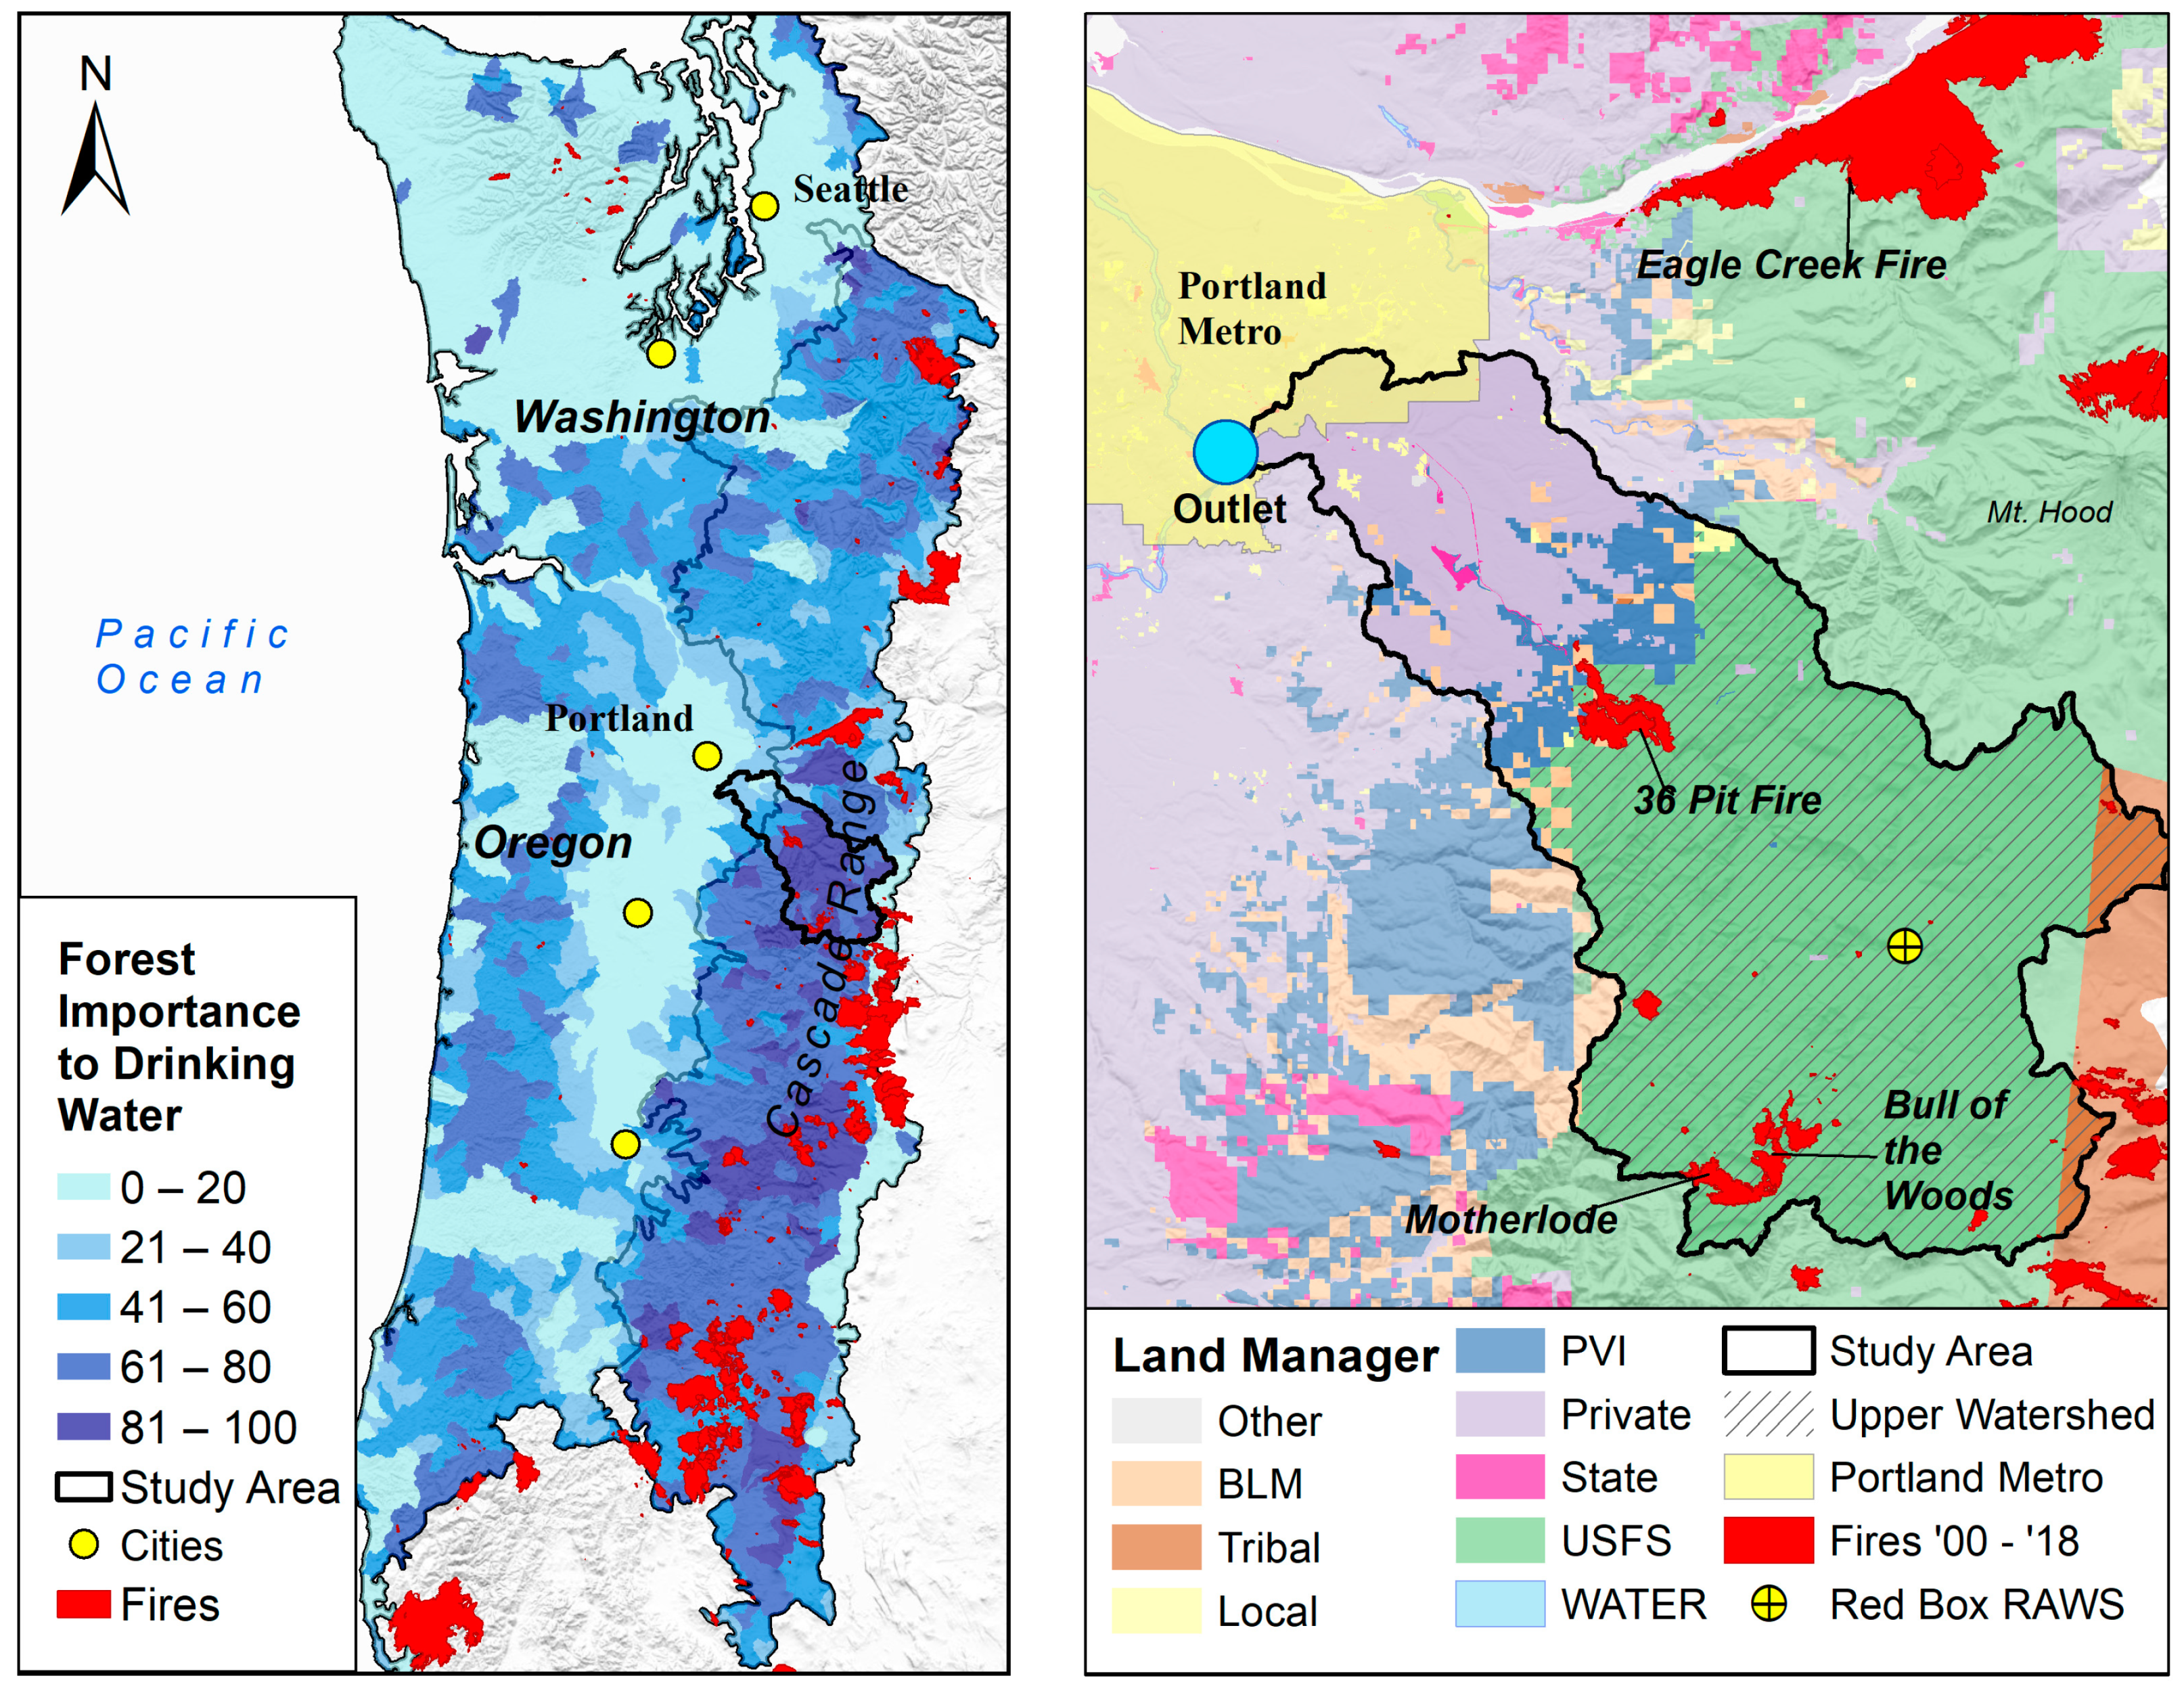
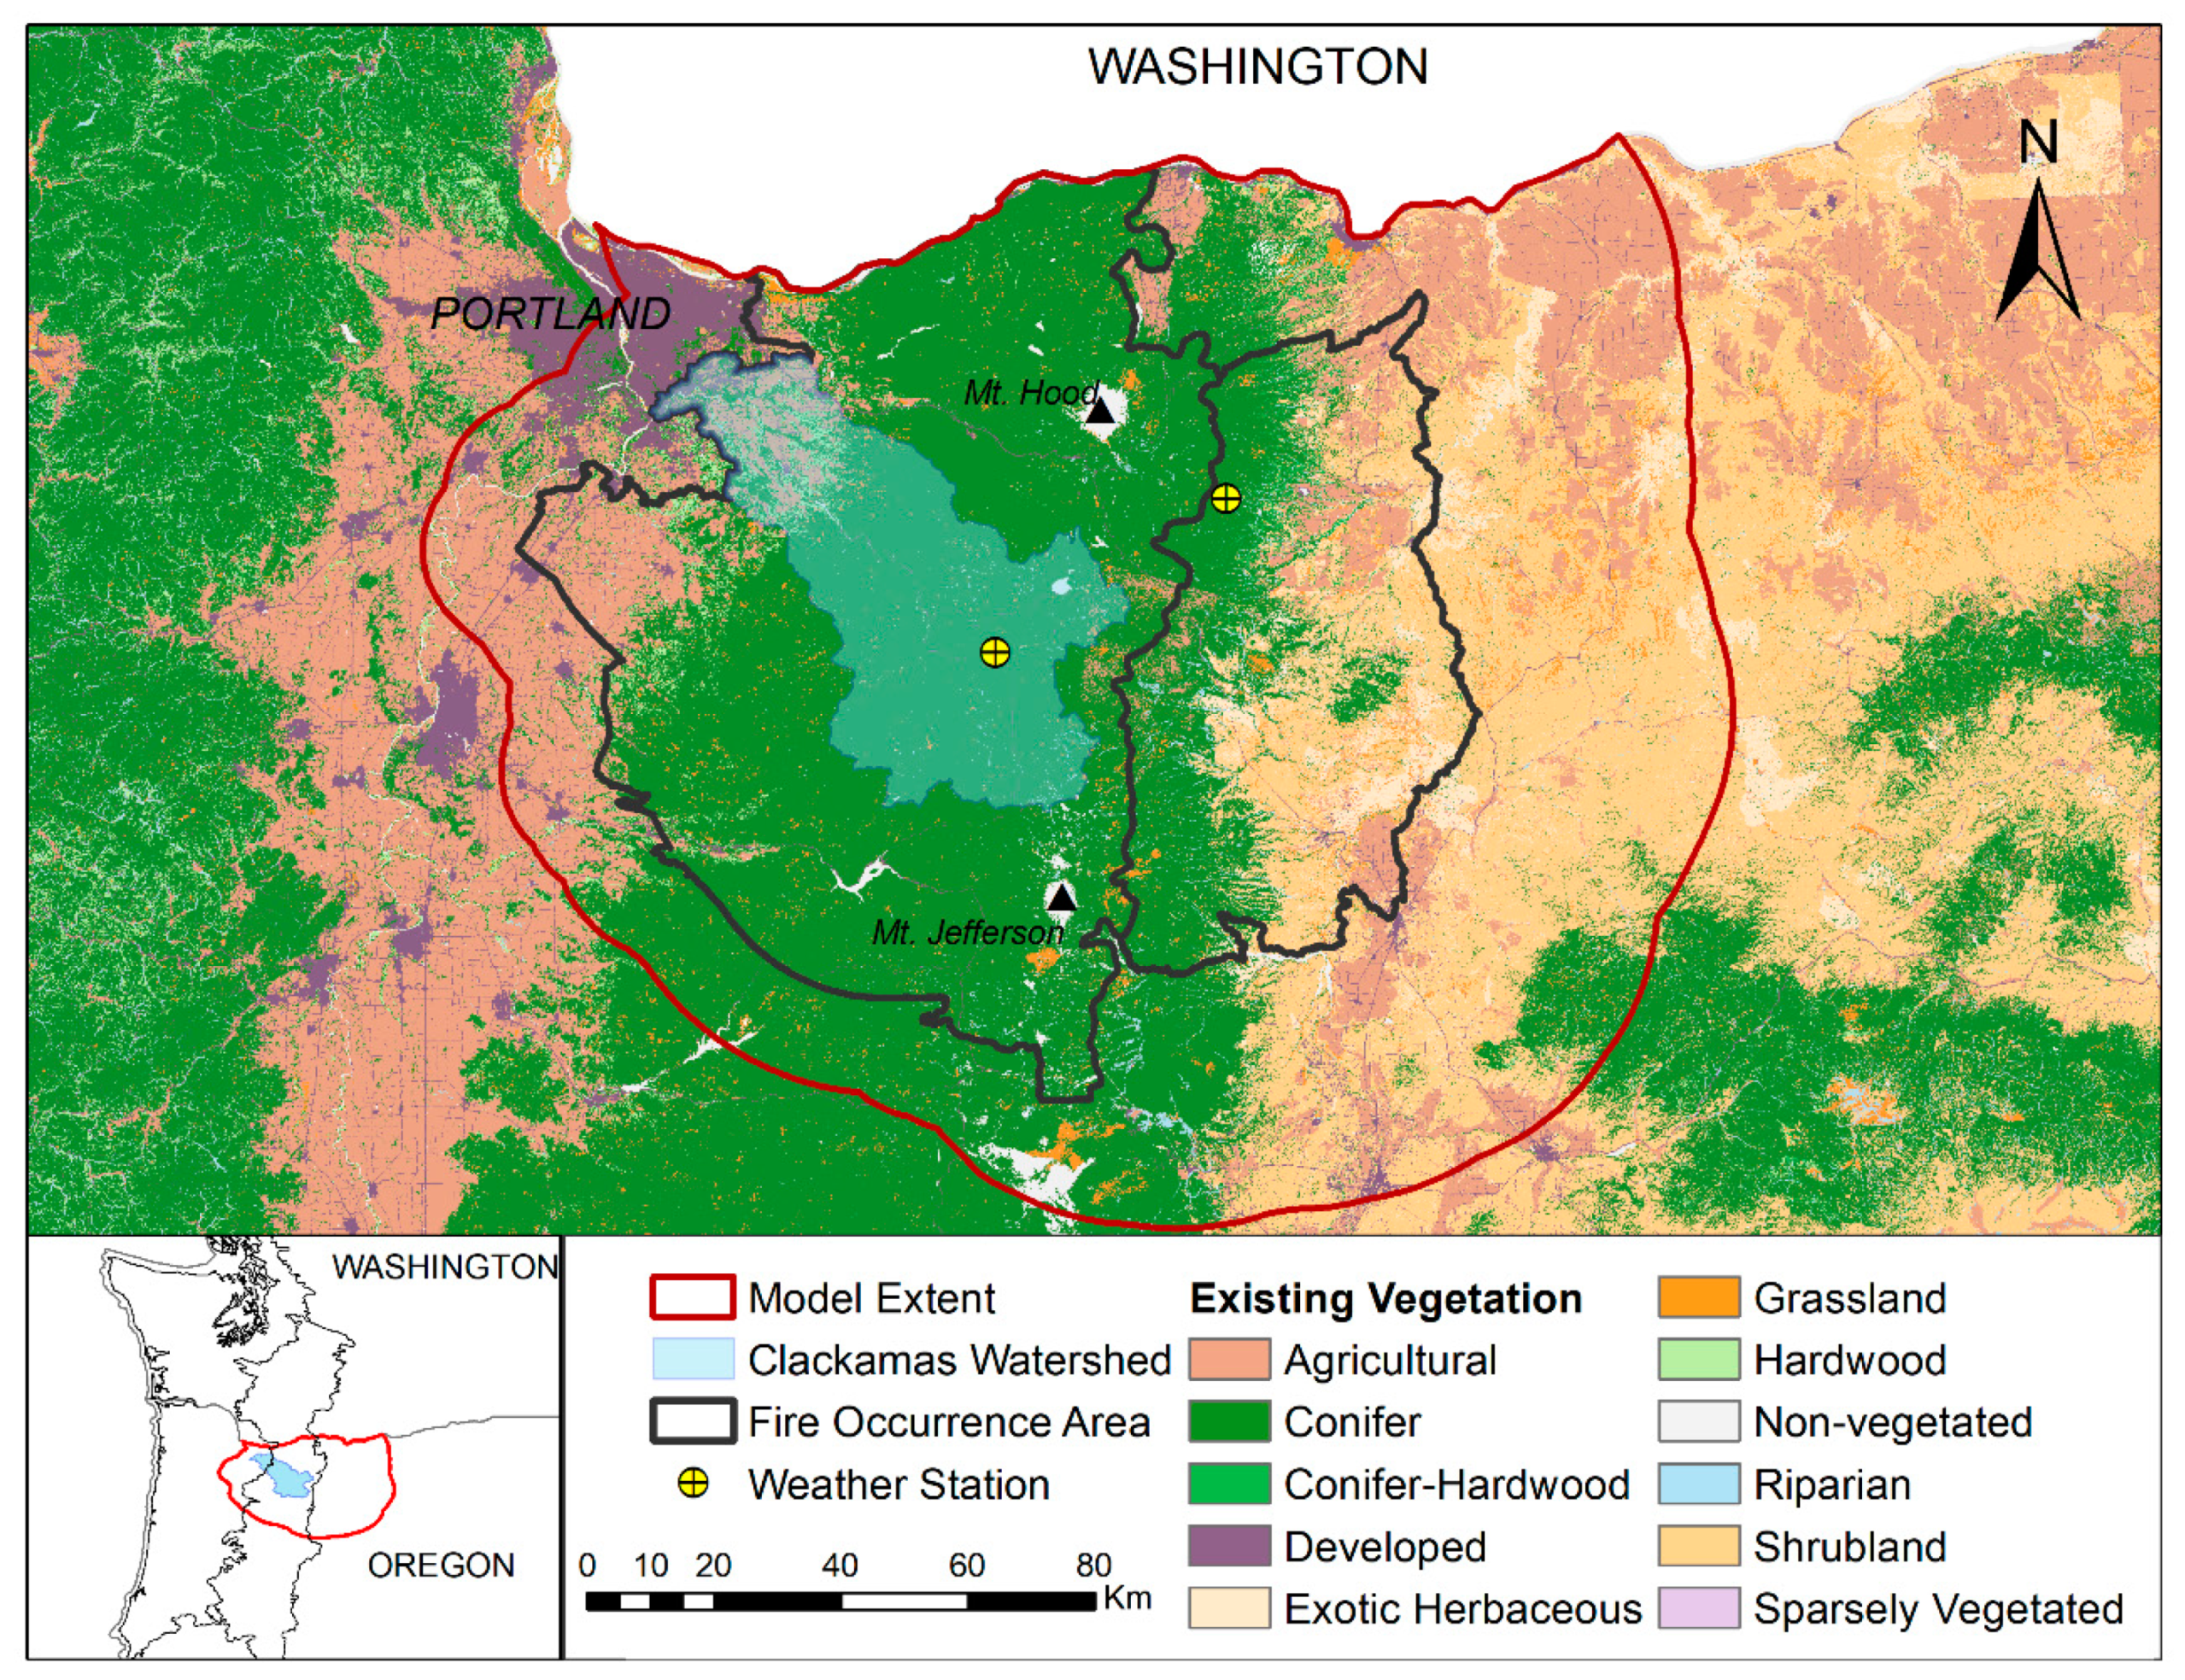
2.1. Study Area
2.2. Wildfire Modeling
2.3. Data Analysis
3. Results
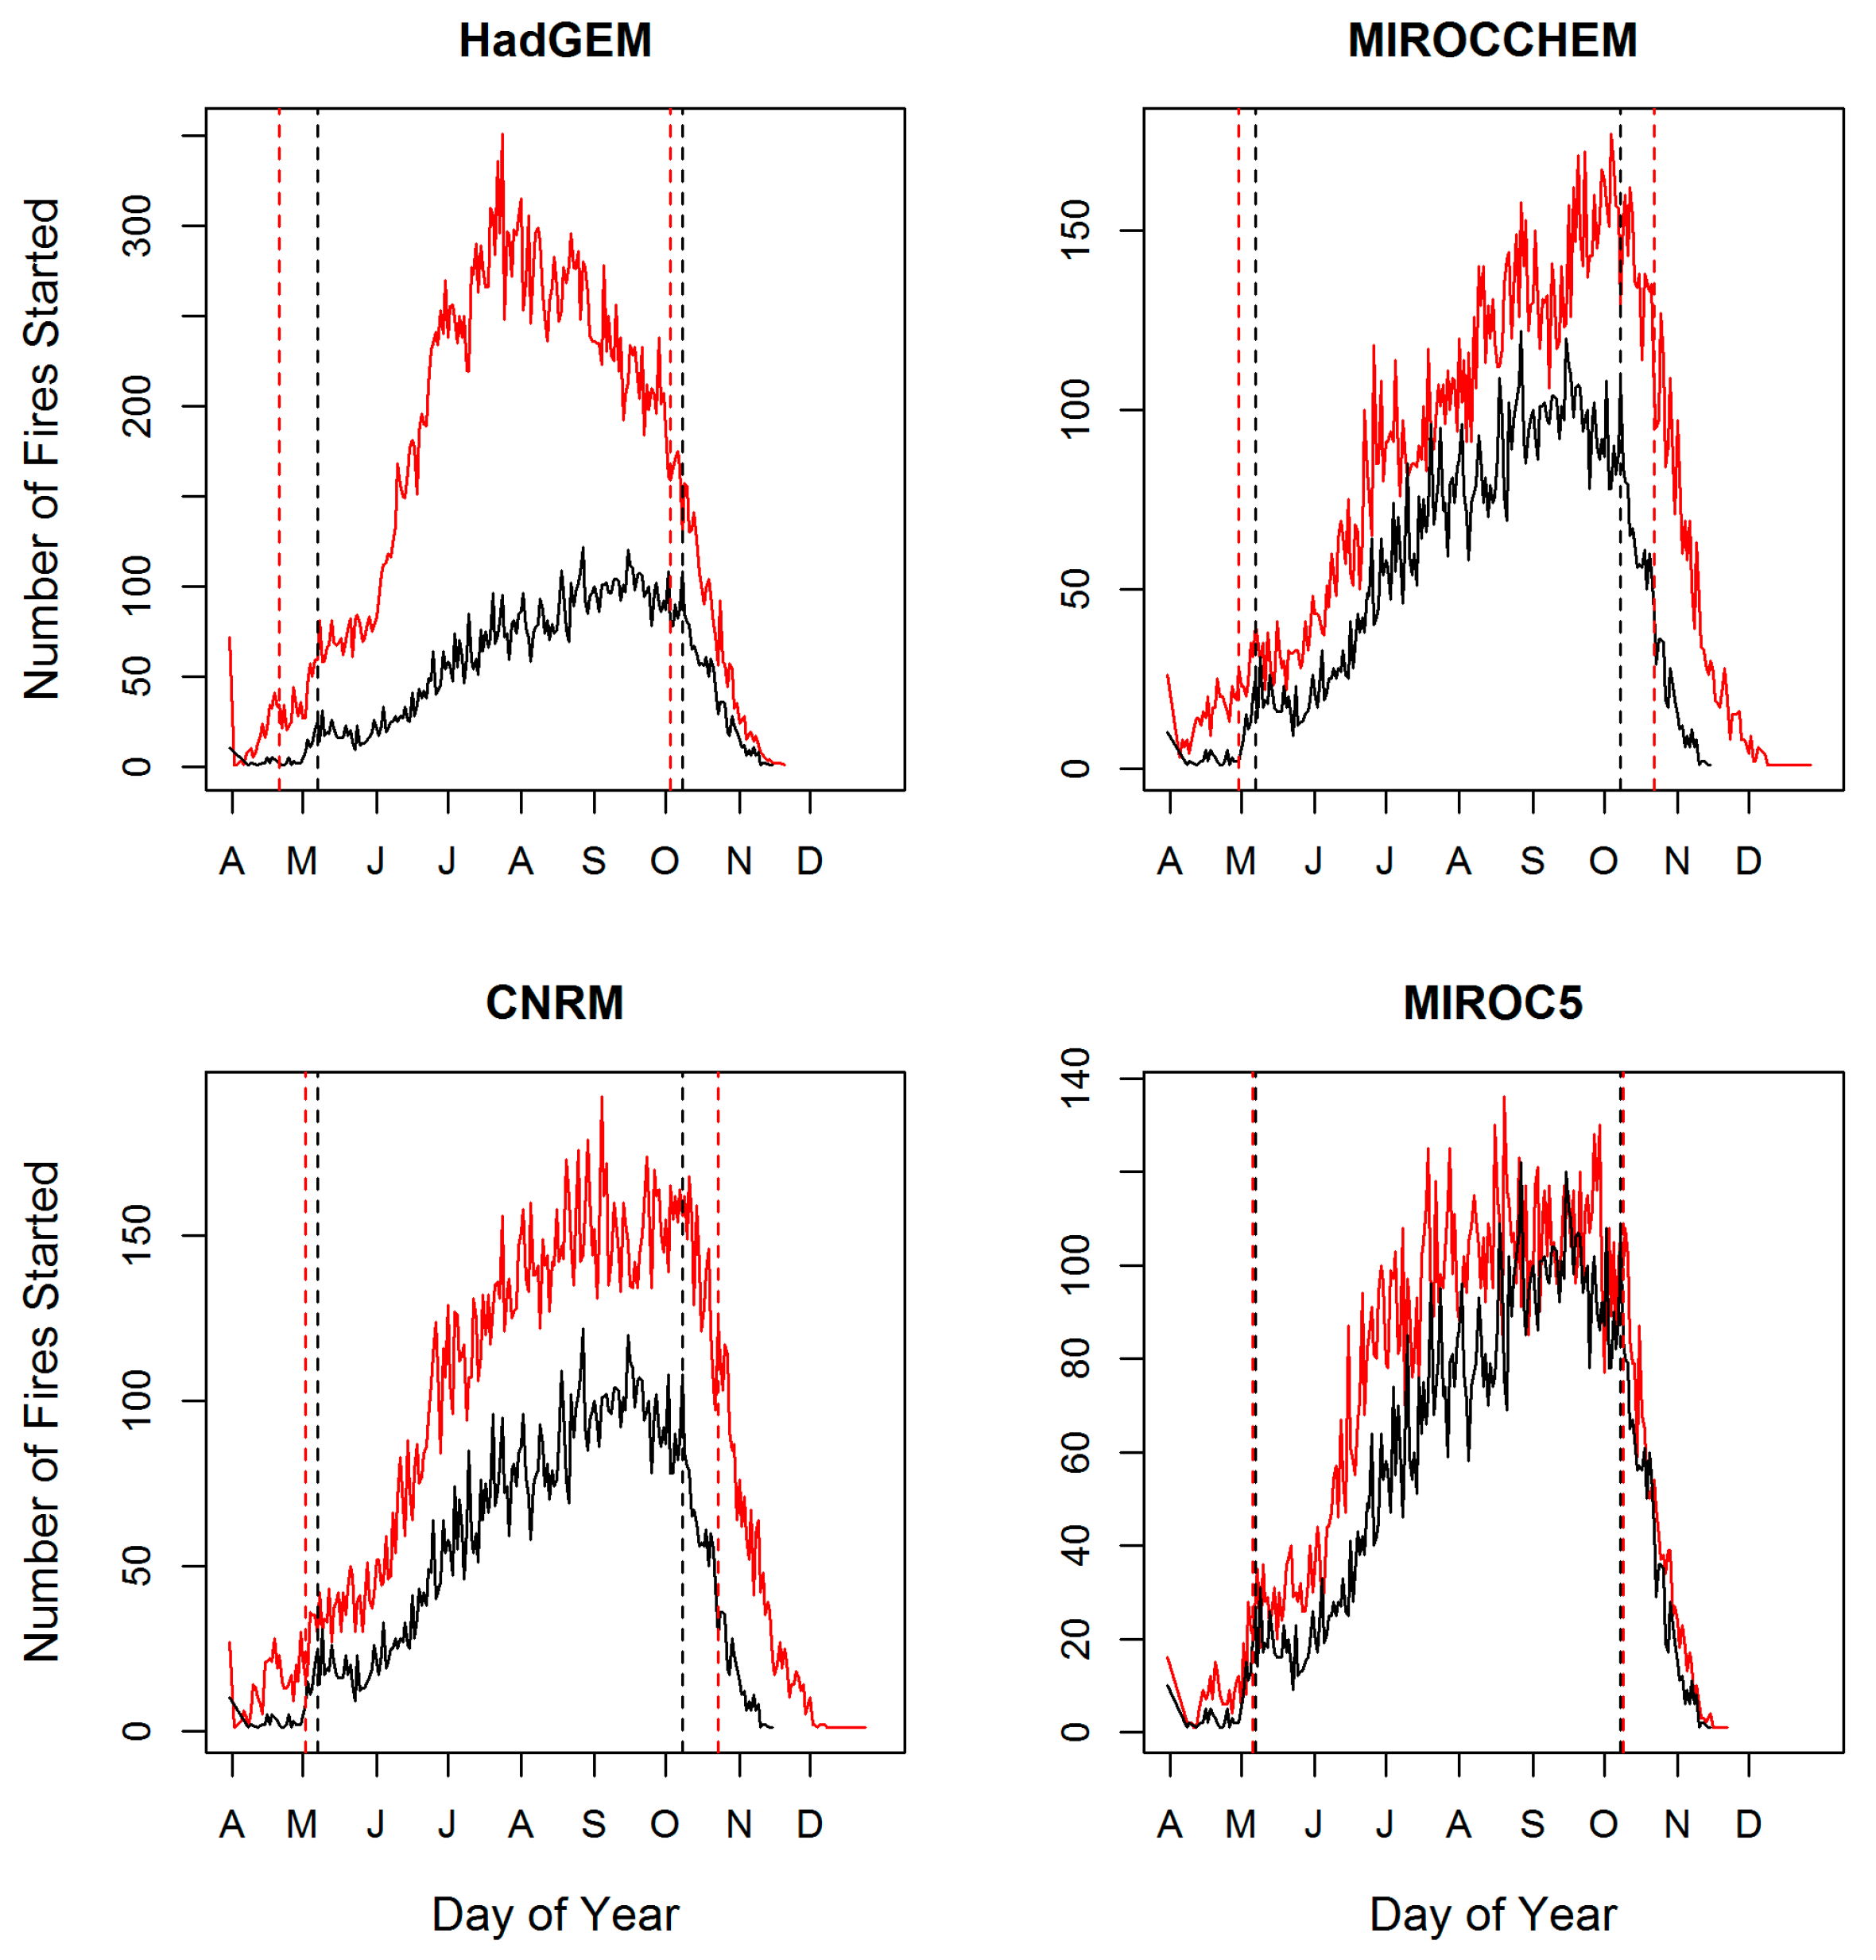
3.1. Fire Season
3.2. Large Fire Size and Frequency
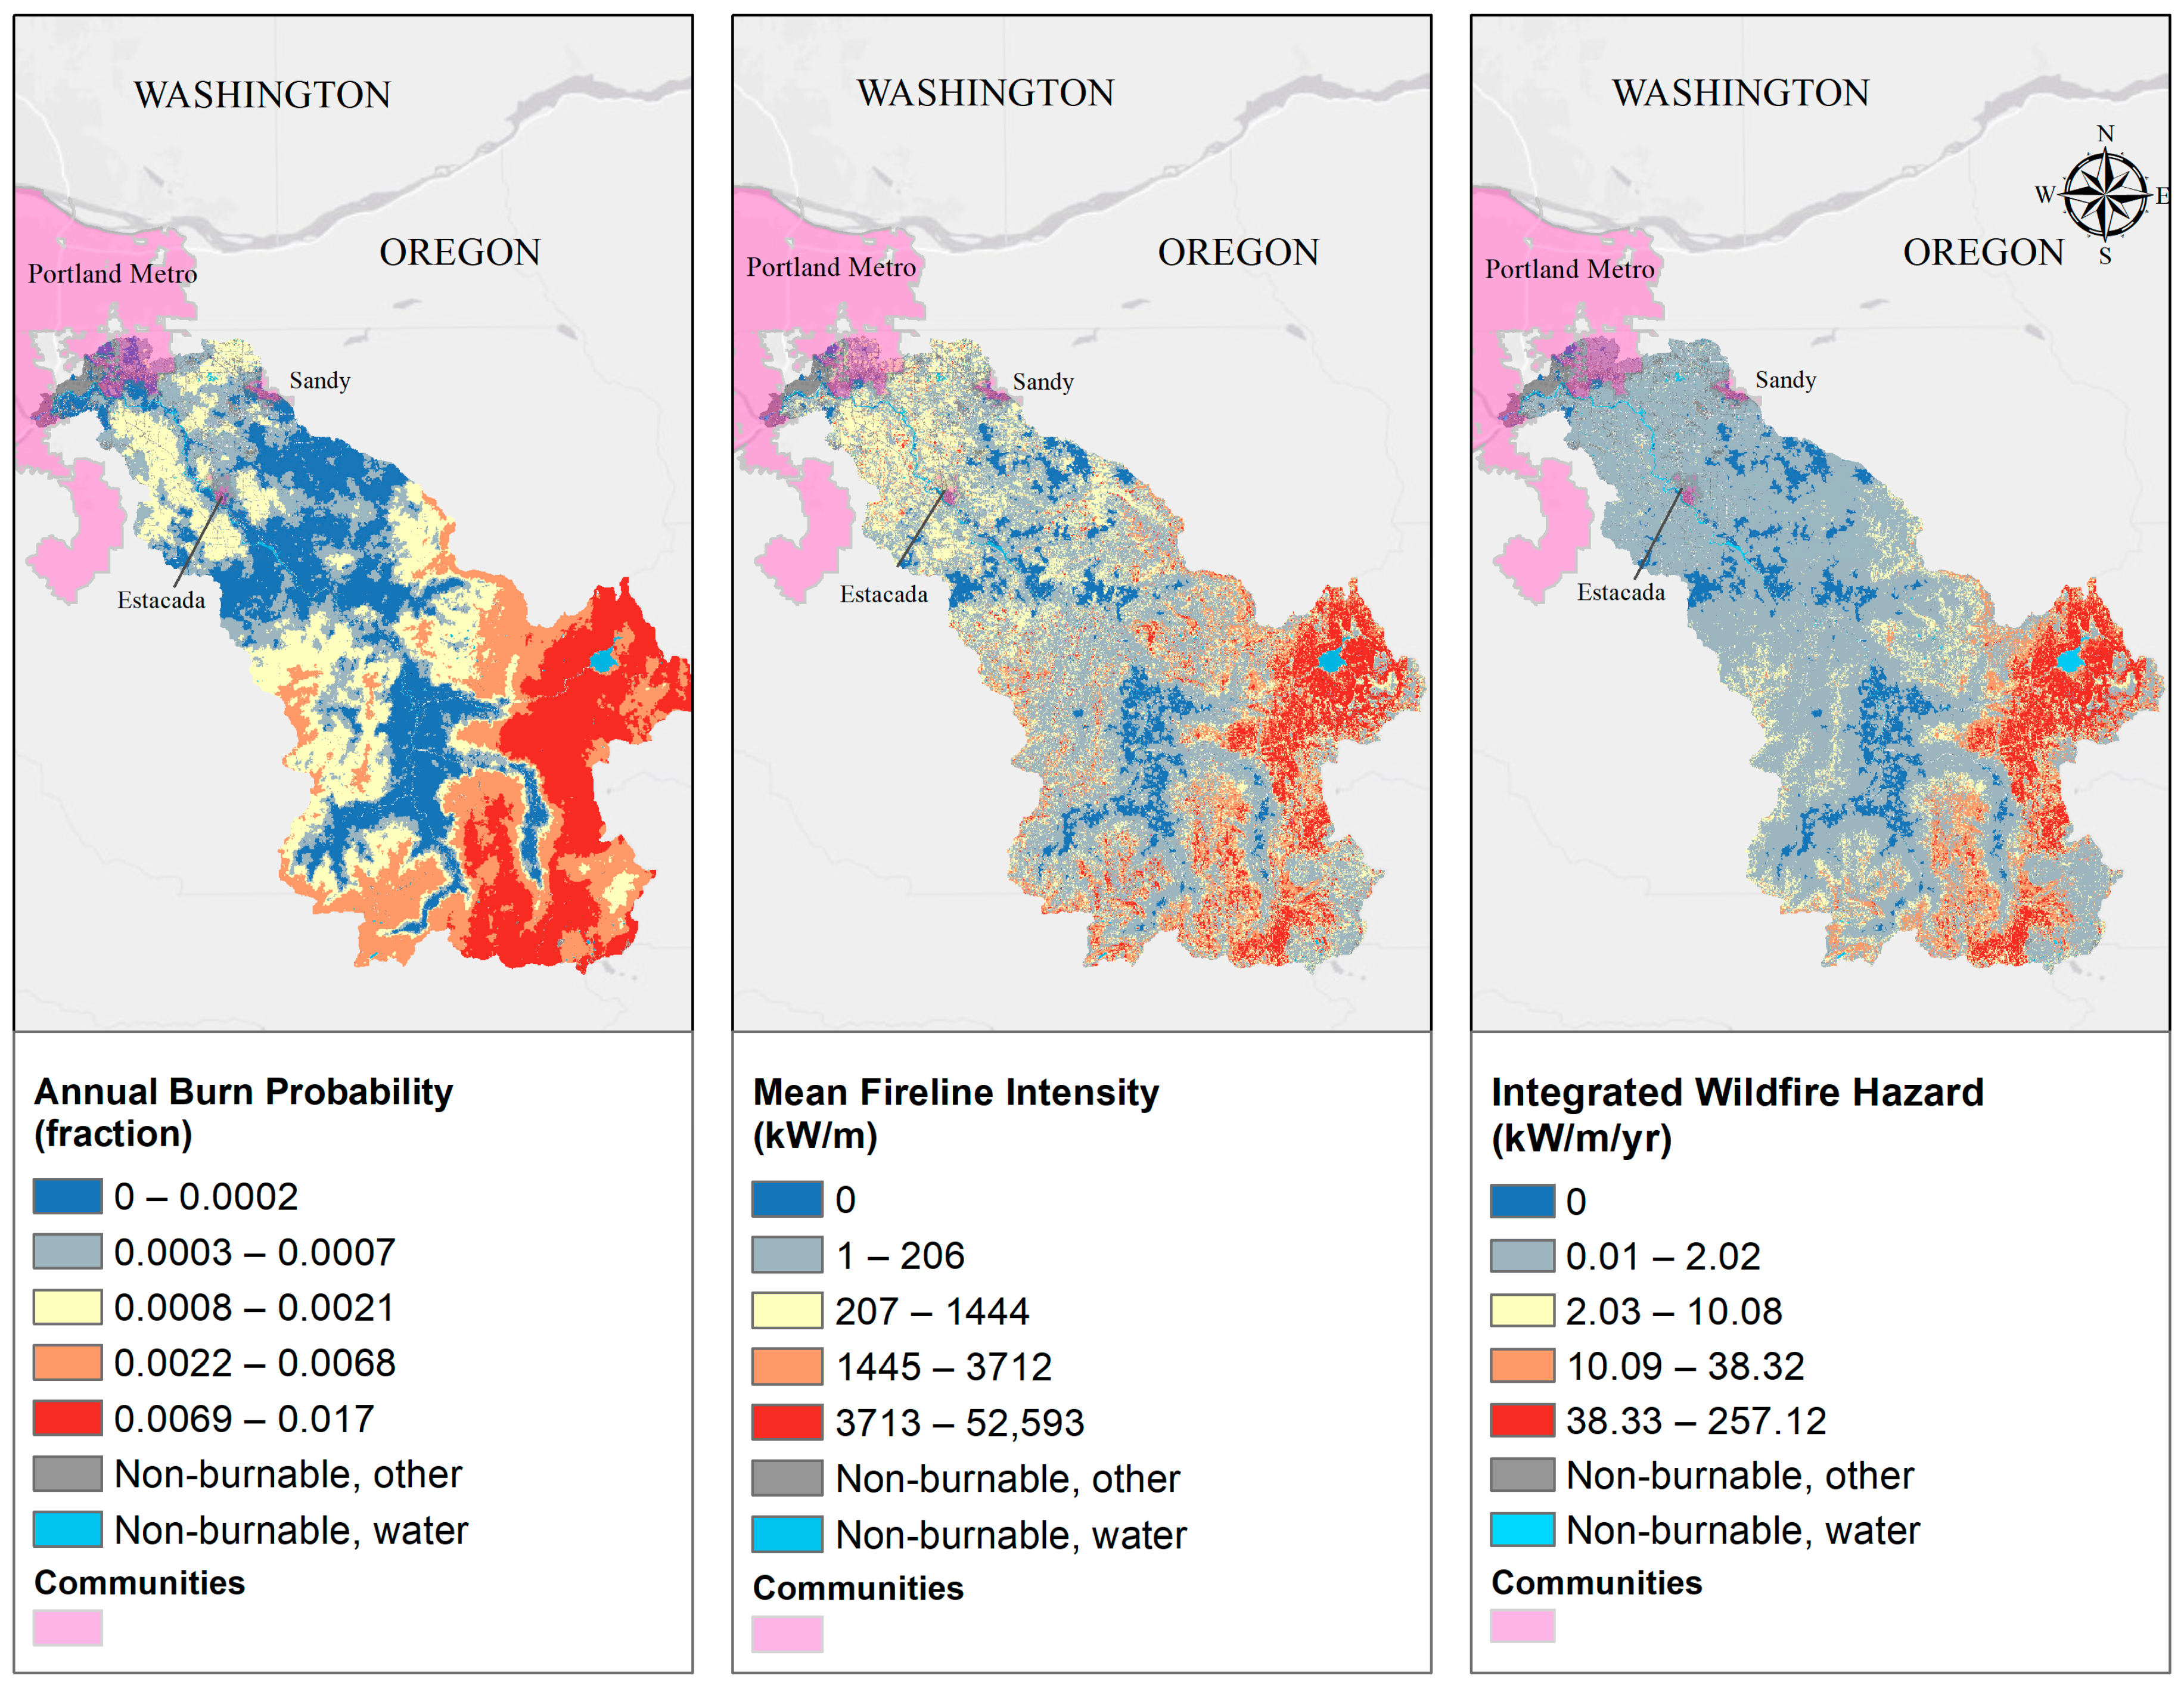
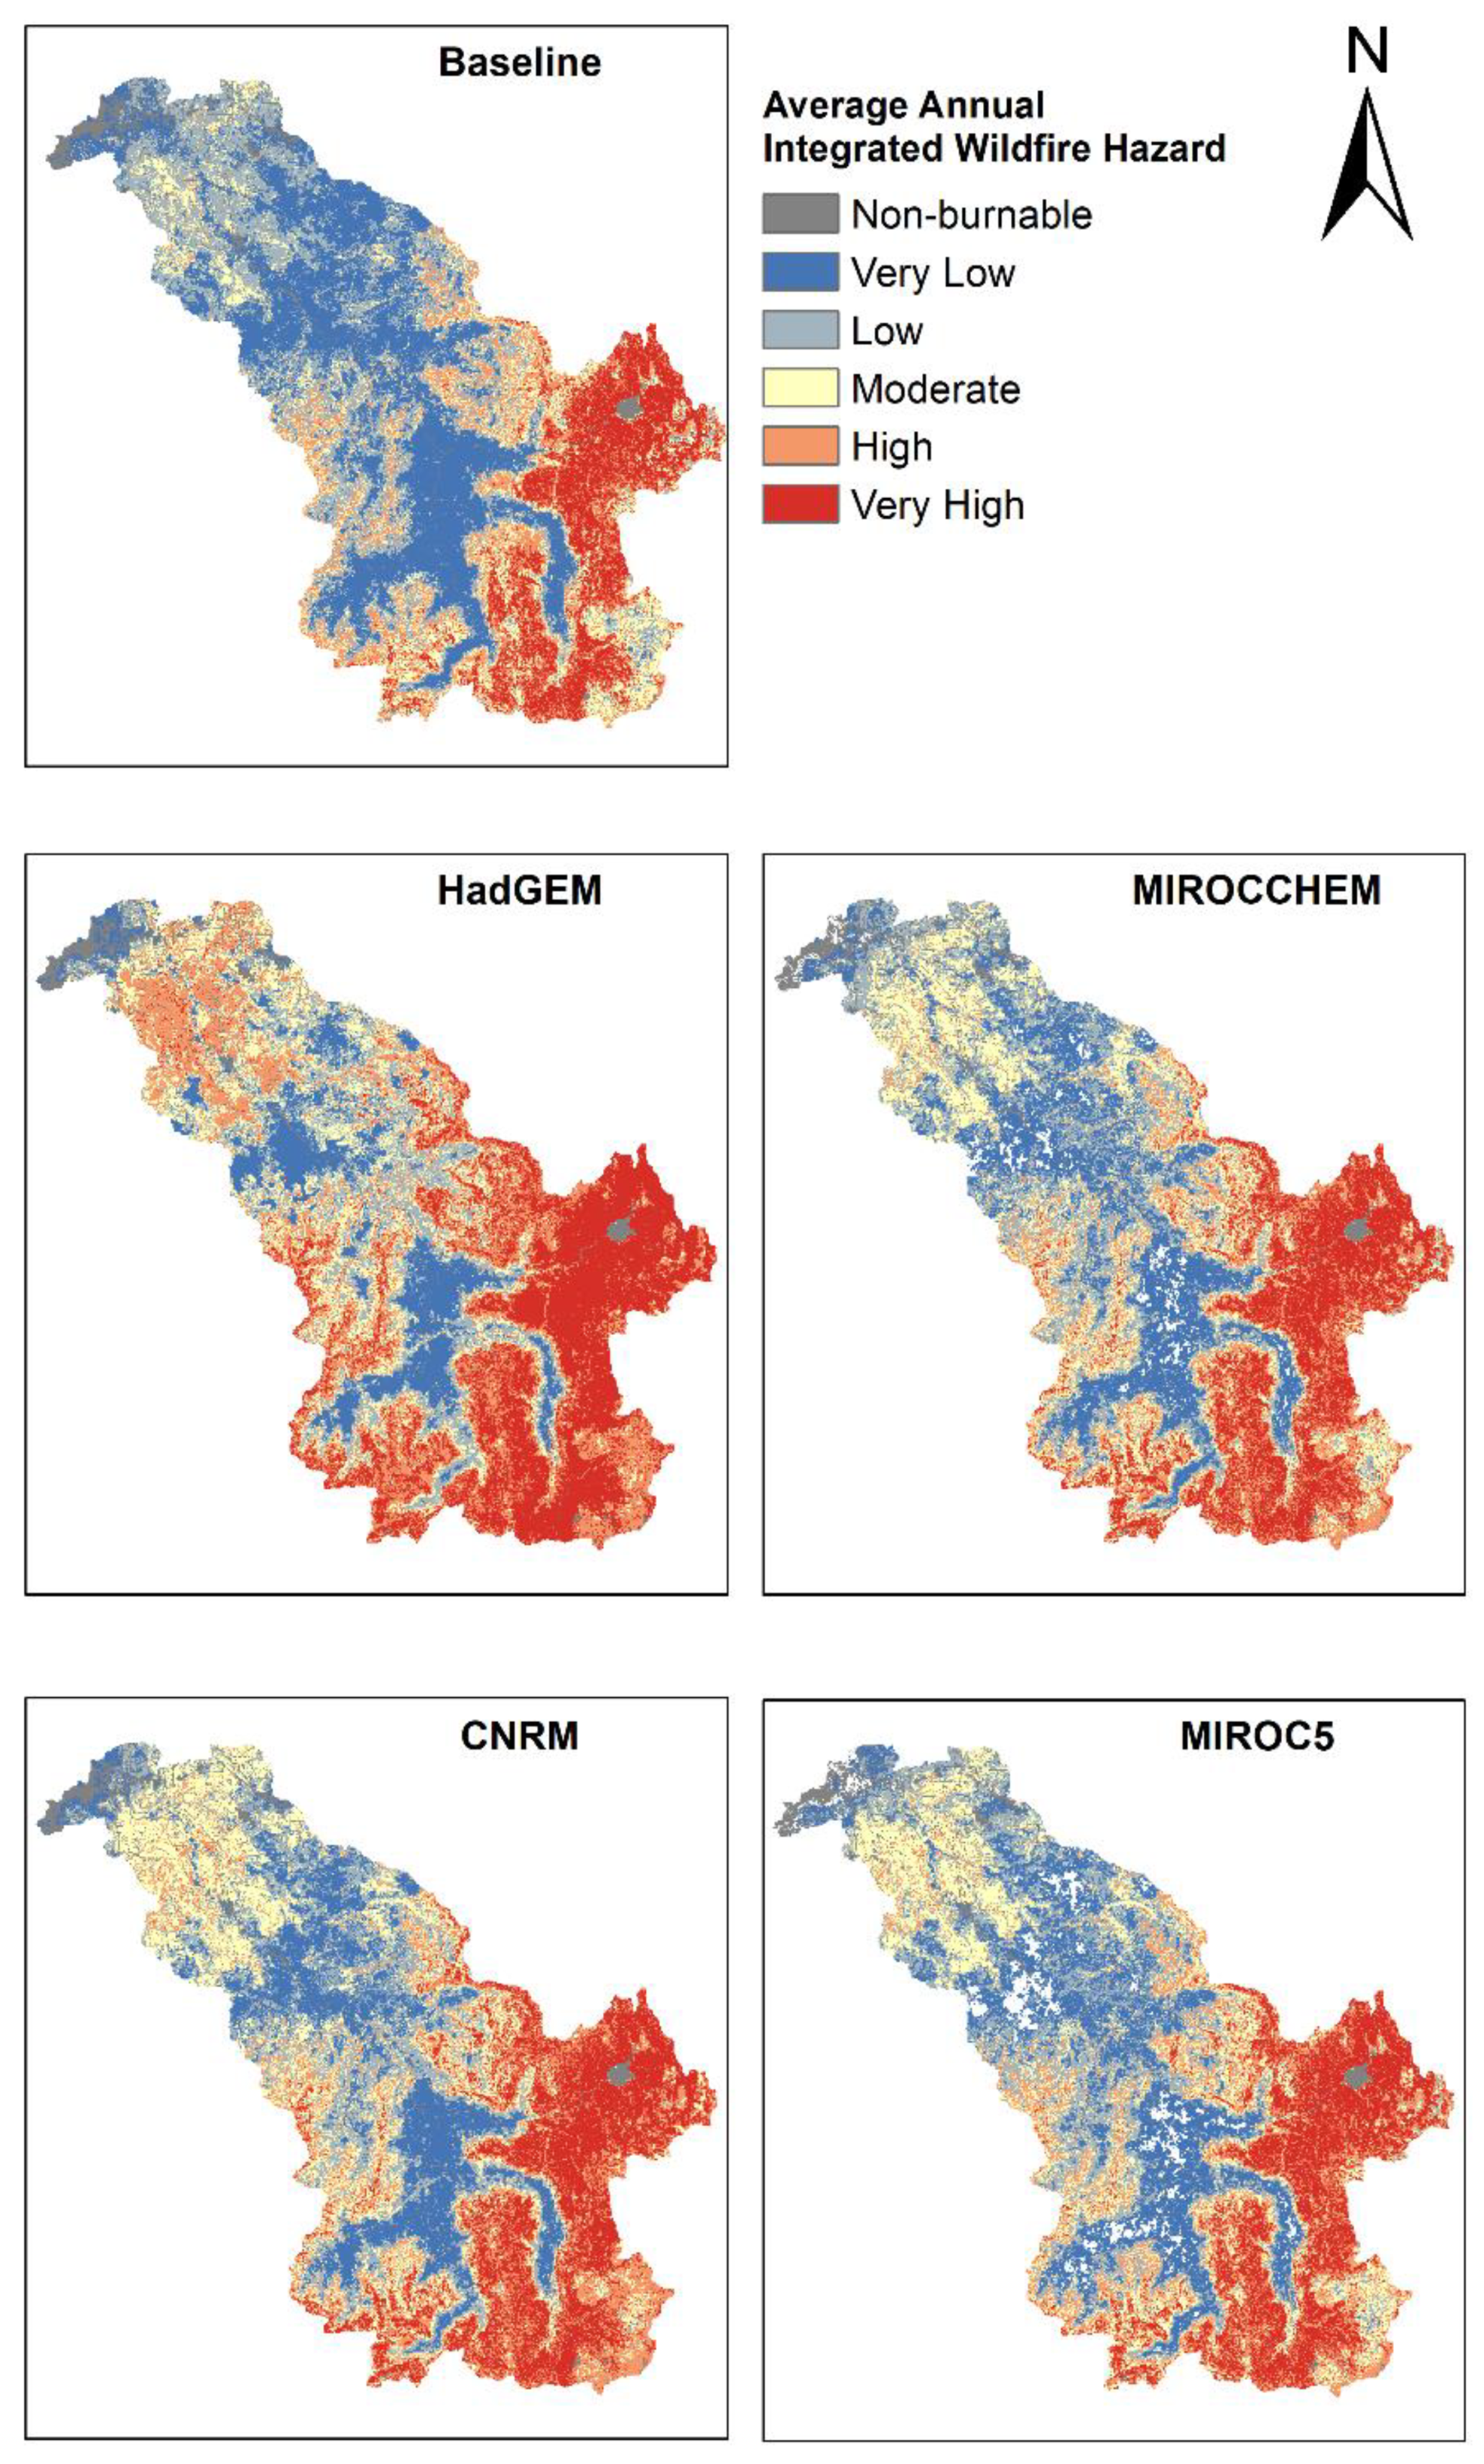
3.3. Wildfire Hazard
4. Discussion
5. Conclusions
Author Contributions
Funding
Acknowledgments
Conflicts of Interest
References
- Buma, B.; Batllori, E.; Bisbing, S.; Holz, A.; Saunders, S.C.; Bidlack, A.L.; Creutzburg, M.K.; DellaSala, D.A.; Gregovich, D.; Hennon, P.; et al. Emergent freeze and fire disturbance dynamics in temperate rainforests. Austral Ecol. 2019, 44, 812–826. [Google Scholar] [CrossRef]
- Krawchuk, M.A.; Moritz, M.A.; Parisien, M.A.; Van Dorn, J.; Hayhoe, K. Global Pyrogeography: The Current and Future Distribution of Wildfire. PLoS ONE 2009, 4, e5102. [Google Scholar] [CrossRef] [PubMed]
- Mariani, M.; Holz, A.; Veblen, T.T.; Williamson, G.; Fletcher, M.-S.; Bowman, D.M.J.S. Climate Change Amplifications of Climate-Fire Teleconnections in the Southern Hemisphere. Geophys. Res. Lett. 2018, 45, 5071–5081. [Google Scholar] [CrossRef]
- Kitzberger, T.; Aráoz, E.; Gowda, J.H.; Mermoz, M.; Morales, J.M. Decreases in Fire Spread Probability with Forest Age Promotes Alternative Community States, Reduced Resilience to Climate Variability and Large Fire Regime Shifts. Ecosystems 2012, 15, 97–112. [Google Scholar] [CrossRef]
- McDowell, N.G.; Allen, C.D.; Anderson-Teixeira, K.; Aukema, B.H.; Bond-Lamberty, B.; Chini, L.; Clark, J.S.; Dietze, M.; Grossiord, C.; Hanbury-Brown, A.; et al. Pervasive shifts in forest dynamics in a changing world. Science 2020, 368, eaaz9463. [Google Scholar] [CrossRef]
- McWethy, D.B.; Higuera, P.E.; Whitlock, C.; Veblen, T.T.; Bowman, D.M.; Cary, G.J.; Haberle, S.G.; Keane, R.E.; Maxwell, B.D.; McGlone, M.S.; et al. A conceptual framework for predicting temperate ecosystem sensitivity to human impacts on fire regimes: Evaluating human impacts on fire regimes. Glob. Ecol. Biogeogr. 2013, 22, 900–912. [Google Scholar] [CrossRef]
- Sommerfeld, A.; Senf, C.; Buma, B.; D’Amato, A.W.; Després, T.; Díaz-Hormazábal, I.; Fraver, S.; Frelich, L.E.; Gutiérrez, Á.G.; Hart, S.J.; et al. Patterns and drivers of recent disturbances across the temperate forest biome. Nat. Commun. 2018, 9, 4355. [Google Scholar] [CrossRef]
- Folke, C.; Carpenter, S.; Walker, B.; Scheffer, M.; Elmqvist, T.; Gunderson, L.; Holling, C.S. Regime Shifts, Resilience, and Biodiversity in Ecosystem Management. Annu. Rev. Ecol. Evol. Syst. 2004, 35, 557–581. [Google Scholar] [CrossRef] [Green Version]
- Folke, C.; Carpenter, S.; Walker, B.; Scheffer, M.; Chapin, T.; Rockstrom, J. Resilience Thinking: Integrating Resilience, Adaptability and Transformability. Ecol. Soc. 2010, 15, 20. [Google Scholar] [CrossRef]
- Seidl, R.; Spies, T.A.; Peterson, D.L.; Stephens, S.L.; Hicke, J.A. Review: Searching for resilience: Addressing the impacts of changing disturbance regimes on forest ecosystem services. J. Appl. Ecol. 2016, 53, 120–129. [Google Scholar] [CrossRef] [Green Version]
- Whitlock, C.; McWethy, D.B.; Tepley, A.J.; Veblen, T.T.; Holz, A.; McGlone, M.S.; Perry, G.L.; Wilmshurst, J.M.; Wood, S.W. Past and Present Vulnerability of Closed-Canopy Temperate Forests to Altered Fire Regimes: A Comparison of the Pacific Northwest, New Zealand, and Patagonia. BioScience 2015, 65, 151–163. [Google Scholar] [CrossRef] [Green Version]
- Halofsky, J.S.; Donato, D.C.; Franklin, J.F.; Halofsky, J.E.; Peterson, D.L.; Harvey, B.J. The nature of the beast: Examining climate adaptation options in forests with stand-replacing fire regimes. Ecosphere 2018, 9, e02140. [Google Scholar] [CrossRef]
- McWethy, D.B.; Schoennagel, T.; Higuera, P.E.; Krawchuk, M.; Harvey, B.J.; Metcalf, E.C.; Schultz, C.; Miller, C.; Metcalf, A.L.; Buma, B.; et al. Rethinking resilience to wildfire. Nat. Sustain. 2019, 2, 797–804. [Google Scholar] [CrossRef]
- Stephens, S.L.; Agee, J.K.; Fule, P.Z.; North, M.P.; Romme, W.H.; Swetnam, T.W.; Turner, M.G. Managing Forests and Fire in Changing Climates. Science 2013, 342, 41–42. [Google Scholar] [CrossRef]
- Turner, M.G.; Donato, D.C.; Romme, W.H. Consequences of spatial heterogeneity for ecosystem services in changing forest landscapes: Priorities for future research. Landsc. Ecol. 2013, 28, 1081–1097. [Google Scholar] [CrossRef]
- Spies, T.A.; Stine, P.A.; Gravenmier, R.; Long, J.W.; Reilly, M.J. Synthesis of Science to Inform Land Management within the Northwest Forest Plan Area; U.S. Department of Agriculture, Forest Service, Pacific Northwest Research Station: Portland, OR, USA, 2018.
- Gedalof, Z.; Peterson, D.L.; Mantua, N.J. Atmospheric, Climatic, and Ecological Controls on Extreme Wildfire Years in the Northwestern United States. Ecol. Appl. 2005, 15, 154–174. [Google Scholar] [CrossRef]
- Meyn, A.; White, P.S.; Buhk, C.; Jentsch, A. Environmental drivers of large, infrequent wildfires: The emerging conceptual model. Prog. Phys. Geogr. Earth Environ. 2007, 31, 287–312. [Google Scholar] [CrossRef] [Green Version]
- Agee, J.K. Fire Ecology of Pacific Northwest Forests; Island Press: Washington, DC, USA, 1993. [Google Scholar]
- Batllori, E.; De Cáceres, M.; Brotons, L.; Ackerly, D.D.; Moritz, M.A.; Lloret, F. Cumulative effects of fire and drought in Mediterranean ecosystems. Ecosphere 2017, 8, e01906. [Google Scholar] [CrossRef] [Green Version]
- Stavros, E.N.; Abatzoglou, J.; Larkin, N.K.; McKenzie, D.; Steel, E.A. Climate and very large wildland fires in the contiguous western USA. Int. J. Wildland Fire 2014, 23, 899–914. [Google Scholar] [CrossRef]
- Scott, J.H.; Thompson, M.P.; Calkin, D.E. A Wildfire Risk Assessment Framework for Land and Resource Management; U.S. Department of Agriculture, Forest Service, Rocky Mountain Research Station: Ft. Collins, CO, USA, 2013.
- Bessie, W.C.; Johnson, E.A. The Relative Importance of Fuels and Weather on Fire Behavior in Subalpine Forests. Ecology 1995, 76, 747–762. [Google Scholar] [CrossRef] [Green Version]
- Holbrook, S. Burning an Empire: The Story of American Forest Fires; The Macmillan Co.: New York, NY, USA, 1943. [Google Scholar]
- Kemp, J.L. Epitaph for the Giants: The Story of the Tillamook Burn; Touchstone Press: Portland, OR, USA, 1967. [Google Scholar]
- Morris, W.G. Forest Fires in Western Oregon and Western Washington. Or. Hist. Q. 1934, 35, 313–339. [Google Scholar]
- National Interagency Fire Center. Historically Significant Wildfires 2020. Available online: https://www.nifc.gov/fireInfo/fireInfo_stats_histSigFires.html (accessed on 1 July 2020).
- Cooper, M.G.; Nolin, A.W.; Safeeq, M. Testing the recent snow drought as an analog for climate warming sensitivity of Cascades snowpacks. Environ. Re. Lett. 2016, 11, 084009. [Google Scholar] [CrossRef] [Green Version]
- Abatzoglou, J.T.; Barbero, R. Observed and projected changes in absolute temperature records across the contiguous United States. Geophys. Res. Lett. 2014, 41, 6501–6508. [Google Scholar] [CrossRef] [Green Version]
- Mote, P.W.; Parson, E.A.; Hamlet, A.F.; Keeton, W.S.; Lettenmaier, D.; Mantua, N.; Miles, E.L.; Peterson, D.W.; Peterson, D.L.; Slaughter, R.; et al. Preparing for Climatic Change: The water, salmon, and forests of the Pacific Northwest. Clim. Chang. 2003, 61, 45–88. [Google Scholar] [CrossRef]
- Jung, I.-W.; Chang, H. Assessment of future runoff trends under multiple climate change scenarios in the Willamette River Basin, Oregon, USA. Hydrol. Process. 2011, 25, 258–277. [Google Scholar] [CrossRef]
- Tague, C.; Grant, G.E. Groundwater dynamics mediate low-flow response to global warming in snow-dominated alpine regions: Groundwater Dynamics and Low-Flow Response. Water Resour. Res. 2009, 45. [Google Scholar] [CrossRef]
- McKenzie, D.; Gedalof, Z.; Peterson, D.L.; Mote, P. Climatic Change, Wildfire, and Conservation. Conserv. Biol. 2004, 18, 890–902. [Google Scholar] [CrossRef]
- Mote, P.W.; Salathé, E.P. Future climate in the Pacific Northwest. Clim. Chang. 2010, 102, 29–50. [Google Scholar] [CrossRef]
- Kitzberger, T.; Falk, D.A.; Westerling, A.L.; Swetnam, T.W. Direct and indirect climate controls predict heterogeneous early-mid 21st century wildfire burned area across western and boreal North America. PLoS ONE 2017, 12, e0188486. [Google Scholar] [CrossRef] [Green Version]
- Davis, R.; Yang, Z.; Yost, A.; Belongie, C.; Cohen, W. The normal fire environment—Modeling environmental suitability for large forest wildfires using past, present, and future climate normals. For. Ecol. Manag. 2017, 390, 173–186. [Google Scholar] [CrossRef]
- Dalton, M.M.; Shell, K.M. Comparison of Short-Term and Long-Term Radiative Feedbacks and Variability in Twentieth-Century Global Climate Model Simulations. J. Clim. 2013, 26, 10051–10070. [Google Scholar] [CrossRef] [Green Version]
- Holden, Z.A.; Swanson, A.; Luce, C.H.; Jolly, W.M.; Maneta, M.; Oyler, J.W.; Warren, D.A.; Parsons, R.; Affleck, D. Decreasing fire season precipitation increased recent western US forest wildfire activity. Proc. Natl. Acad. Sci. USA 2018, 115, E8349–E8357. [Google Scholar] [CrossRef] [PubMed] [Green Version]
- Schoof, J.T. High-resolution projections of 21st century daily precipitation for the contiguous U.S. J. Geophys. Res. Atmos. 2015, 120, 3029–3042. [Google Scholar] [CrossRef]
- Mote, P.W.; Li, S.; Lettenmaier, D.P.; Xiao, M.; Engel, R. Dramatic declines in snowpack in the western US. Npj. Clim. Atmos. Sci. 2018, 1, 1–6. [Google Scholar] [CrossRef]
- Rogers, B.M.; Neilson, R.P.; Drapek, R.; Lenihan, J.M.; Wells, J.R.; Bachelet, D.; Law, B.E. Impacts of climate change on fire regimes and carbon stocks of the U.S. Pacific Northwest. J. Geophys. Res. 2011, 116, G03037. [Google Scholar] [CrossRef] [Green Version]
- Peterson, D.L.; Halofsky, J.E.; Johnson, M.C. Managing and adapting to changing fire regimes in a warmer climate. In The Landscape Ecology of Fire; Springer: Dordrecht, The Netherlands, 2011; pp. 249–267. [Google Scholar]
- Brown, T.C.; Hobbins, M.T.; Ramirex, J.A. Spatial Distribution of Water Supply in the Coterminous United States. J. Am. Water Resour. Assoc. 2008, 44, 1474–1487. [Google Scholar] [CrossRef]
- Wondzell, S.M.; King, J.G. Postfire erosional processes in the Pacific Northwest and Rocky Mountain regions. For. Ecol. Manag. 2003, 178, 75–87. [Google Scholar] [CrossRef]
- Nolin, A.W. Perspectives on Climate Change, Mountain Hydrology, and Water Resources in the Oregon Cascades, USA. Mt. Res. Dev. 2012, 32, S35–S46. [Google Scholar] [CrossRef]
- Gleason, K.E.; Nolin, A.W. Charred forests accelerate snow albedo decay: Parameterizing the post-fire radiative forcing on snow for three years following fire: Charred Forests Accelerate Snow Albedo Decay. Hydrol. Process. 2016, 30, 3855–3870. [Google Scholar] [CrossRef]
- Latta, G.; Temesgen, H.; Adams, D.; Barrett, T. Analysis of potential impacts of climate change on forests of the United States Pacific Northwest. For. Ecol. Manag. 2010, 259, 720–729. [Google Scholar] [CrossRef]
- Bakker, J.D.; Jones, E.; Sprenger, C.B. Evidence of a historical frequent, low-severity fire regime in western Washington, USA. Can. J. For. Res. 2019, 49, 575–585. [Google Scholar] [CrossRef]
- Hessburg, P.F.; Spies, T.A.; Perry, D.A.; Skinner, C.N.; Taylor, A.H.; Brown, P.M.; Stephens, S.L.; Larson, A.J.; Churchill, D.J.; Povak, N.A.; et al. Tamm Review: Management of mixed-severity fire regime forests in Oregon, Washington, and Northern California. For. Ecol. Manag. 2016, 366, 221–250. [Google Scholar] [CrossRef] [Green Version]
- Reilly, M.J.; Dunn, C.J.; Meigs, G.W.; Spies, T.A.; Kennedy, R.E.; Bailey, J.D.; Briggs, K. Contemporary patterns of fire extent and severity in forests of the Pacific Northwest, USA (1985–2010). Ecosphere 2017, 8, e01695. [Google Scholar] [CrossRef] [Green Version]
- Tepley, A.J.; Swanson, F.J.; Spies, T.A. Fire-mediated pathways of stand development in Douglas-fir/western hemlock forests of the Pacific Northwest, USA. Ecology 2013, 94, 1729–1743. [Google Scholar] [CrossRef] [PubMed] [Green Version]
- Bowman, D.M.; Balch, J.; Artaxo, P.; Bond, W.J.; Cochrane, M.A.; D’antonio, C.M.; DeFries, R.; Johnston, F.H.; Keeley, J.E.; Krawchuk, M.A.; et al. The human dimension of fire regimes on Earth: The human dimension of fire regimes on Earth. J. Biogeogr. 2011, 38, 2223–2236. [Google Scholar] [CrossRef] [Green Version]
- Calkin, D.E.; Gebert, K.M.; Jones, J.G.; Neilson, R.P. Forest Service Large Fire Area Burned and Suppression Expenditure Trends, 1970–2002. J. For. 2005, 103, 179–183. [Google Scholar] [CrossRef]
- Dunn, C.J.; DO’Connor, C.; Abrams, J.; Thompson, M.P.; Calkin, D.E.; Johnston, J.D.; Stratton, R.; Gilbertson-Day, J. Wildfire risk science facilitates adaptation of fire-prone social-ecological systems to the new fire reality. Environ. Res. Lett. 2020, 15, 025001. [Google Scholar] [CrossRef]
- Calkin, D.E.; Cohen, J.D.; Finney, M.A.; Thompson, M.P. How risk management can prevent future wildfire disasters in the wildland-urban interface. Proc. Natl. Acad. Sci. USA 2014, 111, 746–751. [Google Scholar] [CrossRef] [Green Version]
- Halofsky, J.E.; Peterson, D.L.; O’Halloran, K.A.; Hoffman, C.H. Adapting to Climate Change at Olympic National Forest and Olympic National Park; U.S. Department of Agriculture, Forest Service, Pacific Northwest Research Station: Portland, OR, USA, 2011.
- Halofsky, J.E.; Peterson, D.L.; Prendeville, H.R. Assessing vulnerabilities and adapting to climate change in northwestern U.S. forests. Clim. Chang. 2018, 146, 89–102. [Google Scholar] [CrossRef]
- Halofsky, J.S.; Conklin, D.R.; Donato, D.C.; Halofsky, J.E.; Kim, J.B. Climate change, wildfire, and vegetation shifts in a high-inertia forest landscape: Western Washington, U.S.A. PLoS ONE 2018, 13, e0209490. [Google Scholar] [CrossRef] [Green Version]
- Sheehan, T.; Bachelet, D.; Ferschweiler, K. Projected major fire and vegetation changes in the Pacific Northwest of the conterminous United States under selected CMIP5 climate futures. Ecol. Model. 2015, 317, 16–29. [Google Scholar] [CrossRef] [Green Version]
- Creutzburg, M.K.; Scheller, R.M.; Lucash, M.S.; LeDuc, S.D.; Johnson, M.G. Forest management scenarios in a changing climate: Trade-offs between carbon, timber, and old forest. Ecol. Appl. 2017, 27, 503–518. [Google Scholar] [CrossRef] [PubMed]
- Parisien, M.-A.; Dawe, D.A.; Miller, C.; Stockdale, C.A.; Armitage, O.B. Applications of simulation-based burn probability modelling: A review. Int. J. Wildland Fire 2019, 28, 913–926. [Google Scholar] [CrossRef] [Green Version]
- Thompson, M.P.; Gilbertson-Day, J.W.; Scott, J.H. Integrating Pixel- and Polygon-Based Approaches to Wildfire Risk Assessment: Application to a High-Value Watershed on the Pike and San Isabel National Forests, Colorado, USA. Environ. Model. Assess. 2016, 21, 1–15. [Google Scholar] [CrossRef]
- Riley, K.L.; Loehman, R.A. Mid-21st-century climate changes increase predicted fire occurrence and fire season length, Northern Rocky Mountains, United States. Ecosphere 2016, 7, e01543. [Google Scholar] [CrossRef]
- Scott, J.; Helmbrecht, D.; Thompson, M.P.; Calkin, D.E.; Marcille, K. Probabilistic assessment of wildfire hazard and municipal watershed exposure. Nat. Hazards 2012, 64, 707–728. [Google Scholar] [CrossRef] [Green Version]
- Jurjevich, J.R.; Chun, N.; Rancik, K.; Proehl, R.; Michel, J.; Harada, M.; Rynerson, C.; Morris, R. Coordinated Population Forecast for Clackamas County, Its Urban Growth Boundaries (UGB) and Area Outside UGB; Population Research Center, Portland State University: Portland, OR, USA, 2017. [Google Scholar]
- USDA Forest Service. Forest to Faucets: Forest Importance to Drinking Water Layer. 2011. Available online: http://www.arcgis.com/home/item.html?id=5a35484eba6c428bb1a0185729e7e6ff (accessed on 1 July 2020).
- Weidner, E.; Todd, A. From the Forest to the Faucet: Drinking Water and Forests in the US: Methods Paper; USDA Forest Service Ecosystem Services & Market Program Area and State and Private Forestry: Washington, DC, USA, 2011. [Google Scholar]
- Oregon Department of Forestry. Oregon Land Manager Layer. Oregon Spatial Data Library. 2015. Available online: https://spatialdata.oregonexplorer.info/geoportal/details;id=9b644e0f7a7d4124a50f6b35c05626ae (accessed on 1 July 2020).
- Simpson, M. Modeled Potential Vegetation Zones of Washington and Oregon; U.S. Department of Agriculture, Forest Service, Central Oregon Area Ecology and Forest Health Program: Bend, OR, USA, 2013; Available online: https://ecoshare.info/category/gis-datavegzones/ (accessed on 8 May 2020).
- Haugo, R.; Zanger, C.; DeMeo, T.; Ringo, C.; Shlisky, A.; Blankenship, K.; Simpson, M.; Mellen-McLean, K.; Kertis, J.; Stern, M. A new approach to evaluate forest structure restoration needs across Oregon and Washington, USA. For. Ecol. Manag. 2015, 335, 37–50. [Google Scholar] [CrossRef] [Green Version]
- Graves, D.; Chang, H. Hydrologic impacts of climate change in the Upper Clackamas River Basin, Oregon, USA. Clim. Res. 2007, 33, 143–157. [Google Scholar] [CrossRef]
- Ingebritsen, S.E.; Sherrod, D.R.; Mariner, R.H. Rates and patterns of groundwater flow in the Cascade Range Volcanic Arc, and the effect on subsurface temperatures. J. Geophys. Res. 1992, 97, 4599. [Google Scholar] [CrossRef]
- LANDFIRE 1.4.0. Fire Regime Class Layer 2014. Available online: https://www.landfire.gov/fuel.php (accessed on 1 June 2018).
- Short, K.C. Spatial Wildfire Occurrence Data for the United States, 1992–2015 [FPA_FOD_20170508], 4th ed.; Forest Service Research Data Archive: Fort Collins, CO, USA, 2017.
- Finney, M.A.; McHugh, C.W.; Grenfell, I.C.; Riley, K.L.; Short, K.C. A simulation of probabilistic wildfire risk components for the continental United States. Stoch. Environ. Res. Risk Assess. 2011, 25, 973–1000. [Google Scholar] [CrossRef] [Green Version]
- Parisien, M.A.; Ager, A.A.; Barros, A.M.; Dawe, D.; Erni, S.; Finney, M.A.; McHugh, C.W.; Miller, C.; Parks, S.A.; Riley, K.L.; et al. Commentary on the article “Burn probability simulation and subsequent wildland fire activity in Alberta, Canada-Implications for risk assessment and strategic planning” by J.L. Beverly and N. McLoughlin. For. Ecol. Manag. 2020, 460, 117698. [Google Scholar] [CrossRef]
- Thompson, M.; Scott, J.; Langowski, P.; Gilbertson-Day, J.; Haas, J.; Bowne, E. Assessing Watershed-Wildfire Risks on National Forest System Lands in the Rocky Mountain Region of the United States. Water 2013, 5, 945–971. [Google Scholar] [CrossRef] [Green Version]
- Thompson, M.P.; Scott, J.; Helmbrecht, D.; Calkin, D.E. Integrated wildfire risk assessment: Framework development and application on the Lewis and Clark National Forest in Montana, USA. Integr. Environ. Assess. Manag. 2013, 9, 329–342. [Google Scholar] [CrossRef] [PubMed]
- Bradshaw, L.; Jolly, M. Fire Family Plus Version 4.0; USDA, US Forest Service Rocky Mountain Research Station: Fort Collins, CO, USA, 2008.
- Andrews, P.L.; Loftsgaarden, D.O.; Bradshaw, L.S. Evaluation of fire danger rating indexes using logistic regression and percentile analysis. Int. J. Wildland Fire 2003, 12, 213. [Google Scholar] [CrossRef]
- Cohen, J.D.; Deeming, J.E. The National Fire-Danger Rating System: Basic Equations; U.S. Department of Agriculture, Forest Service, Pacific Southwest Forest and Range Experiment Station: Berkeley, CA, USA, 1985. [Google Scholar]
- Rupp, D.E.; Abatzoglou, J.T.; Mote, P.W. Projections of 21st century climate of the Columbia River Basin. Clim. Dyn. 2017, 49, 1783–1799. [Google Scholar] [CrossRef]
- Abatzoglou, J.T.; Brown, T.J. A comparison of statistical downscaling methods suited for wildfire applications. Int. J. Climatol. 2012, 32, 772–780. [Google Scholar] [CrossRef]
- LANDFIRE 1.4.0. Canopy Height Layer 2014. Available online: https://www.landfire.gov/fuel.php (accessed on 1 June 2018).
- LANDFIRE 1.4.0. Canopy Base Height Layer 2014. Available online: https://www.landfire.gov/fuel.php (accessed on 1 June 2018).
- LANDFIRE 1.4.0. Canopy Bulk Density Layer 2014. Available online: https://www.landfire.gov/fuel.php (accessed on 1 June 2018).
- LANDFIRE 1.4.0. Canopy Cover Layer 2014. Available online: https://www.landfire.gov/fuel.php (accessed on 1 June 2018).
- LANDFIRE 1.4.0. Aspect Layer 2014. Available online: https://www.landfire.gov/topographic.php (accessed on 1 June 2018).
- LANDFIRE 1.4.0. Elevation Layer 2014. Available online: https://www.landfire.gov/topographic.php (accessed on 1 June 2018).
- LANDFIRE 1.4.0. Slope Layer 2014. Available online: https://www.landfire.gov/topographic.php (accessed on 1 June 2018).
- LANDFIRE 1.4.0. 40 Scott and Burgan Fire Behavior Fuel Models Layer 2014. Available online: https://landfire.gov/fbfm40.php (accessed on 1 June 2018).
- R Core Team. R: A Language and Environment for Statistical Computing; R Foundation for Statistical Computing: Vienna, Austria, 2018. [Google Scholar]
- Riley, K.L.; Abatzoglou, J.T.; Grenfell, I.C.; Klene, A.E.; Heinsch, F.A. The relationship of large fire occurrence with drought and fire danger indices in the western USA, 1984–2008: The role of temporal scale. Int. J. Wildland Fire 2013, 22, 894. [Google Scholar] [CrossRef]
- Riley, K.; Thompson, M.; Scott, J.; Gilbertson-Day, J. A Model-Based Framework to Evaluate Alternative Wildfire Suppression Strategies. Resources 2018, 7, 4. [Google Scholar] [CrossRef] [Green Version]
- Cumming, S.G. A parametric model of the fire-size distribution. Can. J. For. Res. 2001, 31, 1297. [Google Scholar] [CrossRef]
- Moritz, M.A. Analyzing Extreme Disturbance Events: Fire in Los Padres National Forest. Ecol. Appl. 1997, 7, 1252–1262. [Google Scholar] [CrossRef]
- Jiang, Y.; Zhuang, Q. Extreme value analysis of wildfires in Canadian boreal forest ecosystems. Can. J. For. Res. 2011, 41, 1836–1851. [Google Scholar] [CrossRef]
- Gilleland, E. extRemes: Functions for Performing Extreme Value Analysis. R Package Version 2.01-2. 2020. Available online: https://cran.r-project.org/web/packages/extRemes/extRemes.pdf (accessed on 1 July 2020).
- Moody, J.A.; Martin, D.A.; Haire, S.L.; Kinner, D.A. Linking runoff response to burn severity after a wildfire. Hydrol. Process. 2008, 22, 2063–2074. [Google Scholar] [CrossRef]
- Emelko, M.B.; Silins, U.; Bladon, K.D.; Stone, M. Implications of land disturbance on drinking water treatability in a changing climate: Demonstrating the need for “source water supply and protection” strategies. Water Res. 2011, 45, 461–472. [Google Scholar] [CrossRef] [PubMed]
- Hallema, D.W.; Sun, G.; Caldwell, P.V.; Norman, S.P.; Cohen, E.C.; Liu, Y.; Bladon, K.D.; McNulty, S.G. Burned forests impact water supplies. Nat. Commun. 2018, 9, 1307. [Google Scholar] [CrossRef] [PubMed] [Green Version]
- Schwalm, C.R.; Glendon, S.; Duffy, P.B. RCP8.5 tracks cumulative CO 2 emissions. Proc. Natl. Acad. Sci. USA 2020, 117, 19656–19657. [Google Scholar] [CrossRef] [PubMed]
- Hausfather, Z.; Peters, G.P. RCP8.5 is a problematic scenario for near-term emissions. Proc. Natl. Acad. Sci. USA 2020, 117, 27791–27792. [Google Scholar] [CrossRef] [PubMed]
- Gilbertson-Day, J.; Stratton, R.D.; Scott, J.H.; Vogler, K.C.; Brough, A. Pacific Northwest Quantitative Wildfire Risk Assessment: Methods and Results. 2018. Available online: http://pyrologix.com/wp-content/uploads/2019/11/PNW%20Quantitiative%20Wildfire%20Risk%20Assessment%20Report%204-9-2018%20v2.pdf (accessed on 1 July 2020).
- Millar, C.I.; Stephenson, N.L. Temperate forest helath in the era of emerging megadisasters. Science 2015, 349, 823–826. [Google Scholar] [CrossRef] [PubMed]
- Tepley, A.J.; Thomann, E.; Veblen, T.T.; Perry, G.L.; Holz, A.; Paritsis, J.; Kitzberger, T.; Anderson-Teixeira, K.J. Influences of fire-vegetation feedbacks and post-fire recovery rates on forest landscape vulnerability to altered fire regimes. J. Ecol. 2018, 106, 1925–1940. [Google Scholar] [CrossRef] [Green Version]
- Byram, G.M. Combustion of forest fuels. For. Fire Control Use 1959, 61–89. [Google Scholar]
- Scott, J.H. Introduction to Wildfire Behavior Modeling. National Interagency Fuels, Fire & Vegetation Technology Transfer. 2012. Available online: www.nift.gov (accessed on 10 December 2018).
- Nelson, K.N.; Turner, M.G.; Romme, W.H.; Tinker, D.B. Simulated fire behaviour in young, postfire lodgepole pine forests. Int. J. Wildland Fire 2017, 26, 852. [Google Scholar] [CrossRef]
- Wotton, B.M.; Flannigan, M.D.; Marshall, G.A. Potential climate change impacts on fire intensity and key wildfire suppression thresholds in Canada. Environ. Res. Lett. 2017, 12, 095003. [Google Scholar] [CrossRef]
- Lozano, O.M.; Salis, M.; Ager, A.A.; Arca, B.; Alcasena, F.J.; Monteiro, A.T.; Finney, M.A.; Del Giudice, L.; Scoccimarro, E.; Spano, D. Assessing Climate Change Impacts on Wildfire Exposure in Mediterranean Areas: Climate Change Impacts on Mediterranean Wildfires. Risk Anal. 2017, 37, 1898–1916. [Google Scholar] [CrossRef] [PubMed]
- Keeley, J.E. Fire intensity, fire severity and burn severity: A brief review and suggested usage. Int. J. Wildland Fire 2009, 18, 116. [Google Scholar] [CrossRef]
- Hirsch, K.; Martell, D. A Review of Initial Attack Fire Crew Productivity and Effectiveness. Int. J. Wildland Fire 1996, 6, 199. [Google Scholar] [CrossRef]
- Cruz, M.G.; Alexander, M.E. Assessing crown fire potential in coniferous forests of western North America: A critique of current approaches and recent simulation studies. Int. J. Wildland Fire 2010, 19, 377. [Google Scholar] [CrossRef]
- Stavros, E.N.; Abatzoglou, J.T.; McKenzie, D.; Larkin, N.K. Regional projections of the likelihood of very large wildland fires under a changing climate in the contiguous Western United States. Clim. Chang. 2014, 126, 455–468. [Google Scholar] [CrossRef]
- Wang, X.; Studens, K.; Parisien, M.A.; Taylor, S.W.; Candau, J.N.; Boulanger, Y.; Flannigan, M.D. Projected changes in fire size from daily spread potential in Canada over the 21st century. Environ. Res. Lett. 2020, 15, 104048. [Google Scholar] [CrossRef]
- Millar, C.I.; Stephenson, N.L.; Stephens, S.L. Climate Change and Forests of the Future: Managing in the Face of Uncertainty. Ecol. Appl. 2007, 17, 2145–2151. [Google Scholar] [CrossRef]
- Schoennagel, T.; Balch, J.K.; Brenkert-Smith, H.; Dennison, P.E.; Harvey, B.J.; Krawchuk, M.A.; Mietkiewicz, N.; Morgan, P.; Moritz, M.A.; Rasker, R.; et al. Adapt to more wildfire in western North American forests as climate changes. Proc. Natl. Acad. Sci. USA 2017, 114, 4582–4590. [Google Scholar] [CrossRef] [Green Version]
- Podur, J.; Wotton, M. Will climate change overwhelm fire management capacity? Ecol. Model. 2010, 221, 1301–1309. [Google Scholar] [CrossRef]
- Gebert, K.M.; Calkin, D.E.; Yoder, J. Estimating Suppression Expenditures for Individual Large Wildland Fires. West. J. Appl. For. 2007, 22, 188–196. [Google Scholar] [CrossRef] [Green Version]
- Barros, A.M.; Ager, A.A.; Day, M.A.; Palaiologou, P. Improving long-term fuel treatment effectiveness in the National Forest System through quantitative prioritization. For. Ecol. Manag. 2019, 433, 514–527. [Google Scholar] [CrossRef]
- Barnett, K.; Miller, C.; Venn, T.J. Using Risk Analysis to Reveal Opportunities for the Management of Unplanned Ignitions in Wilderness. J. For. 2016, 114, 610–618. [Google Scholar] [CrossRef]
- Thompson, M.P.; Bowden, P.; Brough, A.; Scott, J.H.; Gilbertson-Day, J.; Taylor, A.; Anderson, J.; Haas, J.R. Application of Wildfire Risk Assessment Results to Wildfire Response Planning in the Southern Sierra Nevada, California, USA. Forests 2016, 7, 64. [Google Scholar] [CrossRef]


| Manager | Total Area (ha) | Percent of Study Area | Non-Vegetated | Developed | Agricultural | Hardwood | Conifer |
|---|---|---|---|---|---|---|---|
| USFS | 167,663 | 69% | 1% | 0% | 0% | 0% | 98% |
| Private | 47,358 | 19% | 1% | 14% | 36% | 12% | 34% |
| PVI | 14,130 | 6% | 1% | 1% | 1% | 7% | 85% |
| Federal | 6878 | 3% | 0% | 0% | 5% | 0% | 88% |
| BLM | 5697 | 2% | 0% | 0% | 0% | 7% | 90% |
| Local | 1490 | 1% | 2% | 8% | 20% | 5% | 59% |
| State | 691 | 0% | 6% | 12% | 12% | 16% | 51% |
| Annual Average | 30 Year Average | ||||
|---|---|---|---|---|---|
| Scenario | Mean Fire Size (ha) | Number of Large Fires | Area Burned (ha) | Number of Large Fires | Area Burned (ha) |
| Baseline | 587 | 0.36 | 1177 | 10.85 | 18,745 |
| range | <1–37,509 | 0–9 | <1–56,656 | 2–31 | 194–95,110 |
| SE | ±19.01 | ±0.009 | ±35.7 | ±0.4252 | 854 |
| MIROC5 | 794 | 0.54 | 1837 | 16.07 | 32,194 |
| range | <1–42,899 | 0–7 | <1–61,730 | 2–37 | 3439–133,842 |
| SE | ±21.16 | ±0.010 | ±50.2 | ±0.303 | 1125 |
| MIROCCHEM | 864 | 0.73 | 2295 | 22.00 | 43,278 |
| range | <1–45,051 | 0–11 | <1–86,162 | 7–53 | 6201–184,097 |
| SE | ±20.21 | ±0.012 | ±62.5 | ±0.382 | 1451 |
| CNRM | 999 | 0.89 | 2828 | 26.63 | 55,514 |
| range | <1–71,646 | 0–11 | <1–90,732 | 10–55 | 4674–142,224 |
| SE | ±20.85 | ±0.012 | ±67.2 | ±0.429 | 1498 |
| HadGEM | 1759 | 1.88 | 7542 | 56.32 | 137,616 |
| range | <1–68,152 | 0–12 | <1–102,730 | 0–140 | 31,745–262,257 |
| SE | ±23.57 | ±0.015 | ±125 | ±1.400 | 2275 |
| Peak over Threshold Results | Baseline | MIROC5 | MIROCCHEM | CNRM | HadGEM |
|---|---|---|---|---|---|
| Threshold (ha), μ | 9861 | 13,199 | 14,597 | 16,011 | 22,651 |
| Number of fires | 114 | 148 | 195 | 219 | 350 |
| Shape, ξ | 0.00 | −0.09 | −0.01 | 0.03 | −0.01 |
| 100 Year RI (ha) | 10,537 | 15,974 | 19,789 | 21,526 | 33,452 |
| 1000 Year RI (ha) | 25,853 | 30,493 | 34,469 | 38,460 | 49,645 |
| Scenario | Burn Probability (years−1) | Mean Intensity (kW/m) | Integrated Hazard (kW/m-year) |
|---|---|---|---|
| Baseline | 0.003 | 1140 | 8.01 |
| range | 0.0001–0.017 | 0.749–52,593 | 7.49 × 10⁻⁵–257 |
| SE | ±6.88 × 10⁻⁶ | ±4.38 | ±0.041 |
| MIROC5 | 0.005 | 1109 | 13.43 |
| range | 0.0001–0.028 | 0.415–41,066 | 4.15 × 10⁻⁵–472 |
| SE | ±1.17 × 10⁻⁵ | ±4.08 | ±0.068 |
| MIROCCHEM | 0.007 | 1116 | 20.87 |
| range | 0.0001–0.038 | 0.818–97,725 | 9.95 × 10⁻⁵–583 |
| SE | ±1.71 × 10⁻⁵ | ±3.99 | ±0.095 |
| CNRM | 0.009 | 1125 | 24.29 |
| range | 0.0001–0.057 | 0.551–31,419 | 5.51 × 10⁻⁵–968 |
| SE | ±2.22 × 10⁻⁵ | ±4.08 | ±0.126 |
| HadGEM | 0.025 | 1158 | 71.57 |
| range | 0.0001–0.140 | 0.830–93,566 | 1.57 × 10⁻⁴–2895 |
| SE | ±6.06 × 10⁻⁵ | ±4.34 | ±0.358 |
Publisher’s Note: MDPI stays neutral with regard to jurisdictional claims in published maps and institutional affiliations. |
© 2020 by the authors. Licensee MDPI, Basel, Switzerland. This article is an open access article distributed under the terms and conditions of the Creative Commons Attribution (CC BY) license (http://creativecommons.org/licenses/by/4.0/).
Share and Cite
McEvoy, A.; Nielsen-Pincus, M.; Holz, A.; Catalano, A.J.; Gleason, K.E. Projected Impact of Mid-21st Century Climate Change on Wildfire Hazard in a Major Urban Watershed outside Portland, Oregon USA. Fire 2020, 3, 70. https://0-doi-org.brum.beds.ac.uk/10.3390/fire3040070
McEvoy A, Nielsen-Pincus M, Holz A, Catalano AJ, Gleason KE. Projected Impact of Mid-21st Century Climate Change on Wildfire Hazard in a Major Urban Watershed outside Portland, Oregon USA. Fire. 2020; 3(4):70. https://0-doi-org.brum.beds.ac.uk/10.3390/fire3040070
Chicago/Turabian StyleMcEvoy, Andy, Max Nielsen-Pincus, Andrés Holz, Arielle J. Catalano, and Kelly E. Gleason. 2020. "Projected Impact of Mid-21st Century Climate Change on Wildfire Hazard in a Major Urban Watershed outside Portland, Oregon USA" Fire 3, no. 4: 70. https://0-doi-org.brum.beds.ac.uk/10.3390/fire3040070