The Post-Fire Assembly Processes of Tree Communities Based on Spatial Analysis of a Sierra Nevada Mixed-Conifer Forest


Wildland Resources Department and the Ecology Center, Utah State University, Logan, UT 84322, USA
*
Author to whom correspondence should be addressed.
Fire 2020, 3(4), 72; https://0-doi-org.brum.beds.ac.uk/10.3390/fire3040072
Submission received: 13 October 2020
/
Revised: 12 December 2020
/
Accepted: 14 December 2020
/
Published: 18 December 2020
Abstract
:Understanding the mechanisms underlying tree spatial arrangements may provide significant insights into the processes in the maintenance of species coexistence. We examined the potential role of habitat heterogeneity, dispersal limitation, negative density dependence, fire history, and unilateral intraspecific and interspecific interactions of adults on juveniles in shaping the spatial patterns of four dominant tree species (Abies concolor, Pinus lambertiana, Calocedrus decurrens, and Quercus kelloggii) after fire in the Yosemite Forest Dynamic Plot, California, USA. We used the univariate pair correlation function and implemented three point pattern processes (homogeneous Poisson process, inhomogeneous Poisson process, and homogeneous Thomas process) to evaluate the potential contributions of habitat filtering and dispersal limitation. We used a bivariate null model to evaluate unilateral intraspecific and interspecific interactions of adults on juveniles. We also used the pairwise correlation function to investigate the spatial patterns of density dependence. To understand the effect of fire, we used the univariate pair correlation function to investigate pattern changes during the six years following fire. We compared spatial pattern changes in both sprouting species (Quercus kelloggii) and seeding species (Abies concolor), and also examined the changes in patterns of large-diameter individuals of Abies concolor, Pinus lambertiana, and Calocedrus decurrens in 2013 (pre-fire), 2016 (two years post-fire), and 2019. Comparing the contributions of the homogeneous Thomas process and the inhomogeneous Poisson process at different spatial scales showed the importance of dispersal limitation and habitat heterogeneity at finer scales (0 m to 5 m) and coarser scales (5 m to 60 m), respectively, which suggests that the joint effects of dispersal limitation and habitat heterogeneity contribute to the spatial patterns of these three dominant tree species. Furthermore, the results showed that the young individuals of Abies concolor and Pinus lambertiana were more commonly found around the conspecific adults. Juvenile regeneration to the 1 cm diameter threshold was highly aggregated following the fire. Large-diameter trees of Abies concolor, Pinus lambertiana, and Calocedrus decurrens generally did not exhibit patterns different from complete spatial randomness (Calocedrus decurrens), or displayed only slight aggregation (Abies concolor and Pinus lambertiana). In addition, Abies concolor and Pinus lambertiana showed positive and negative conspecific density dependence in the immediate post-fire period, respectively.
1. Introduction
Studying processes underlying tree species spatial distributions provides insights into mechanisms that maintain species coexistence. Niche-based processes theory assumes that each species has its own niche and is restricted by various ecological factors [1]. Adaptation of species along with environmental heterogeneity and biotic interactions determine species coexistence. In contrast, neutral processes emphasize the role of stochastic ecological processes such as dispersal limitation in species assembly [2,3]. Species can be distributed in clumped (aggregated), uniform (dispersed), and random patterns. Considering forest trees, aggregated spatial patterns are more common than random distributions [4,5,6].
Species spatial patterns can reflect various ecological processes including abiotic microhabitat heterogeneity [7,8], seed dispersal limitations [9], local disturbance events [10], interspecific and intraspecific interactions, competition between neighboring trees [11,12], and negative density dependence [13]. According to niche theory, different species adapt along particular environmental gradients and show habitat preference (or avoidance). Species are often relatively more abundant in their preferred habitats. Therefore, habitat heterogeneity may potentially affect species distributions and lead to increases in species spatial aggregations. Dispersal limitation predicts species spatial aggregation due to the localized dispersal events irrespective of underlying habitat heterogeneity [2,14,15]. Tree species differ in their ability to disperse seeds and their ability is defined by the dispersal mode. Dispersal mode can affect regeneration and may have long-term consequences on subsequent adult distributions. Condit et al. (2000) [4] suggested that species with animal dispersal modes (zoochory) were better dispersed and showed less aggregated patterns comparing to species with wind or gravity dispersal mode. Some species may have a second stage of dispersal (secondary dispersal) which can change the pattern of seed distribution. Since seeds of P. lambertiana are large and heavy and their wings are relatively small, they are not often dispersed great distance by wind and mostly fall within a close distance to the parent tree [16]. Secondary mechanisms of dispersal (food-storing rodents and birds) contribute substantially in P. lambertiana seed dispersion by dispersing seeds away from parent trees [17]. Seeds of A. concolor disperse shorter distances due to their short and broad wing relative to their weight [18]. Seeds in Calocedrus decurrens are light with large wings and disperse by wind, usually in late autumn when wind speeds can be high, and can disperse longer distances from the parent trees. We hypothesized that tree species with restricted seed dispersal would be expected to be more clustered than those with a long-distance seed dispersal mode.
Species spatial patterns can also reflect disturbance history (i.e., fire). Fire has been one of the dominant disturbances in the most forests of western North America, and it was historically frequent in the forests of the Sierra Nevada. Fire generally causes higher mortality among small diameter classes, but leaves the large-diameter cohort relatively unaffected [19]. However, fire combined with other mortality agents (bark beetles, fungi, and drought) can introduce considerable uncertainty into post-fire tree patterns [20,21]. Large-diameter trees, in particular, play important ecological roles in sequestering biomass and reproductive output [22], but despite their multifaceted importance to forest ecosystem structure [23,24,25], there is still a lack of information about the factors regulating their spatial distribution. Mixed fire severity leads to patchy mortality of overstory trees in some areas, which may release resources for tree regeneration. Fire influences microhabitat by unequal consumption of organic matter [26,27], increasing light availability, decreasing nitrogen from the forest floor [28], and decreasing forest floor interception [29]. Additionally, the effect of fire on regeneration depends on the species physiology. Quercus species vigorously resprout after fire, taking advantage of the deep root system from mature top-killed trees, which increases their access to deeper water sources and carbohydrate mobilization, resulting in high initial growth [30], especially compared to seeder species (i.e., Abies concolor). We hypothesized that regeneration would be aggregated following the fire, especially in sprouting species.
Species interactions affect species assembly and can structure spatial patterns through altering growth [31], mortality [32], and biomass accumulation [33], with the strength of the interaction often depending on whether close neighbors are conspecific or heterospecific. Adult trees could have unfavorable and favorable effects on survivorship and spatial pattern of juveniles within the neighboring area through competition, light availability, and organic matter depth [34], ameliorating the effects of wind, predators, and parasites [35]. California experienced a severe drought from 2012 to 2016 [36]. We hypothesized that juveniles will be found around conspecific adults due to the increase in their resilience and resistance against intense drought stress [37], abiotic facilitation, and limited seed dispersal distances.
In addition, conspecific density can contribute to species spatial arrangement through negative density dependence (CNDD) or positive density dependence (CPDD, facilitation). CNDD occurs when conspecific densities are high and host-specific natural enemies (predators, herbivores, and pathogens) reduce offspring survival [38]. CNDD can be considered as a mechanism that would lead to a regular pattern by decreasing conspecific aggregation through the negative correlation between seedling survival and conspecific adults [39]. Based on the pre- and post-fire drought stress and fire effect on the intensity of density dependence and competition, we hypothesized that conspecific density-dependence among species plays an important role in shaping tree spatial patterns.
Spatial aggregation initiated by local dispersal limitation could be amplified by species associations with patchy habitats, facilitation, and CPDD, or it could be impeded by CNDD. We separated the processes which may potentially contribute to species spatial pattern to increase our ability to comprehend the underlying mechanisms of species coexistence. The study aimed to examine: (1) the potential contributions of dispersal limitation and habitat filtering to tree spatial patterns of three species at different scales, (2) the possible intraspecific and interspecific interactions between adults and juveniles in four abundant species, (3) the changes in regeneration patterns in seeder and sprouter species in the years following fire, (4) the possible effect of fire on large-diameter trees spatial patterns, and (5) the influence of density-dependent processes in forming dominant tree species spatial arrangements in the Yosemite Forest Dynamic Plot.
2. Materials and Methods
2.1. Study Area
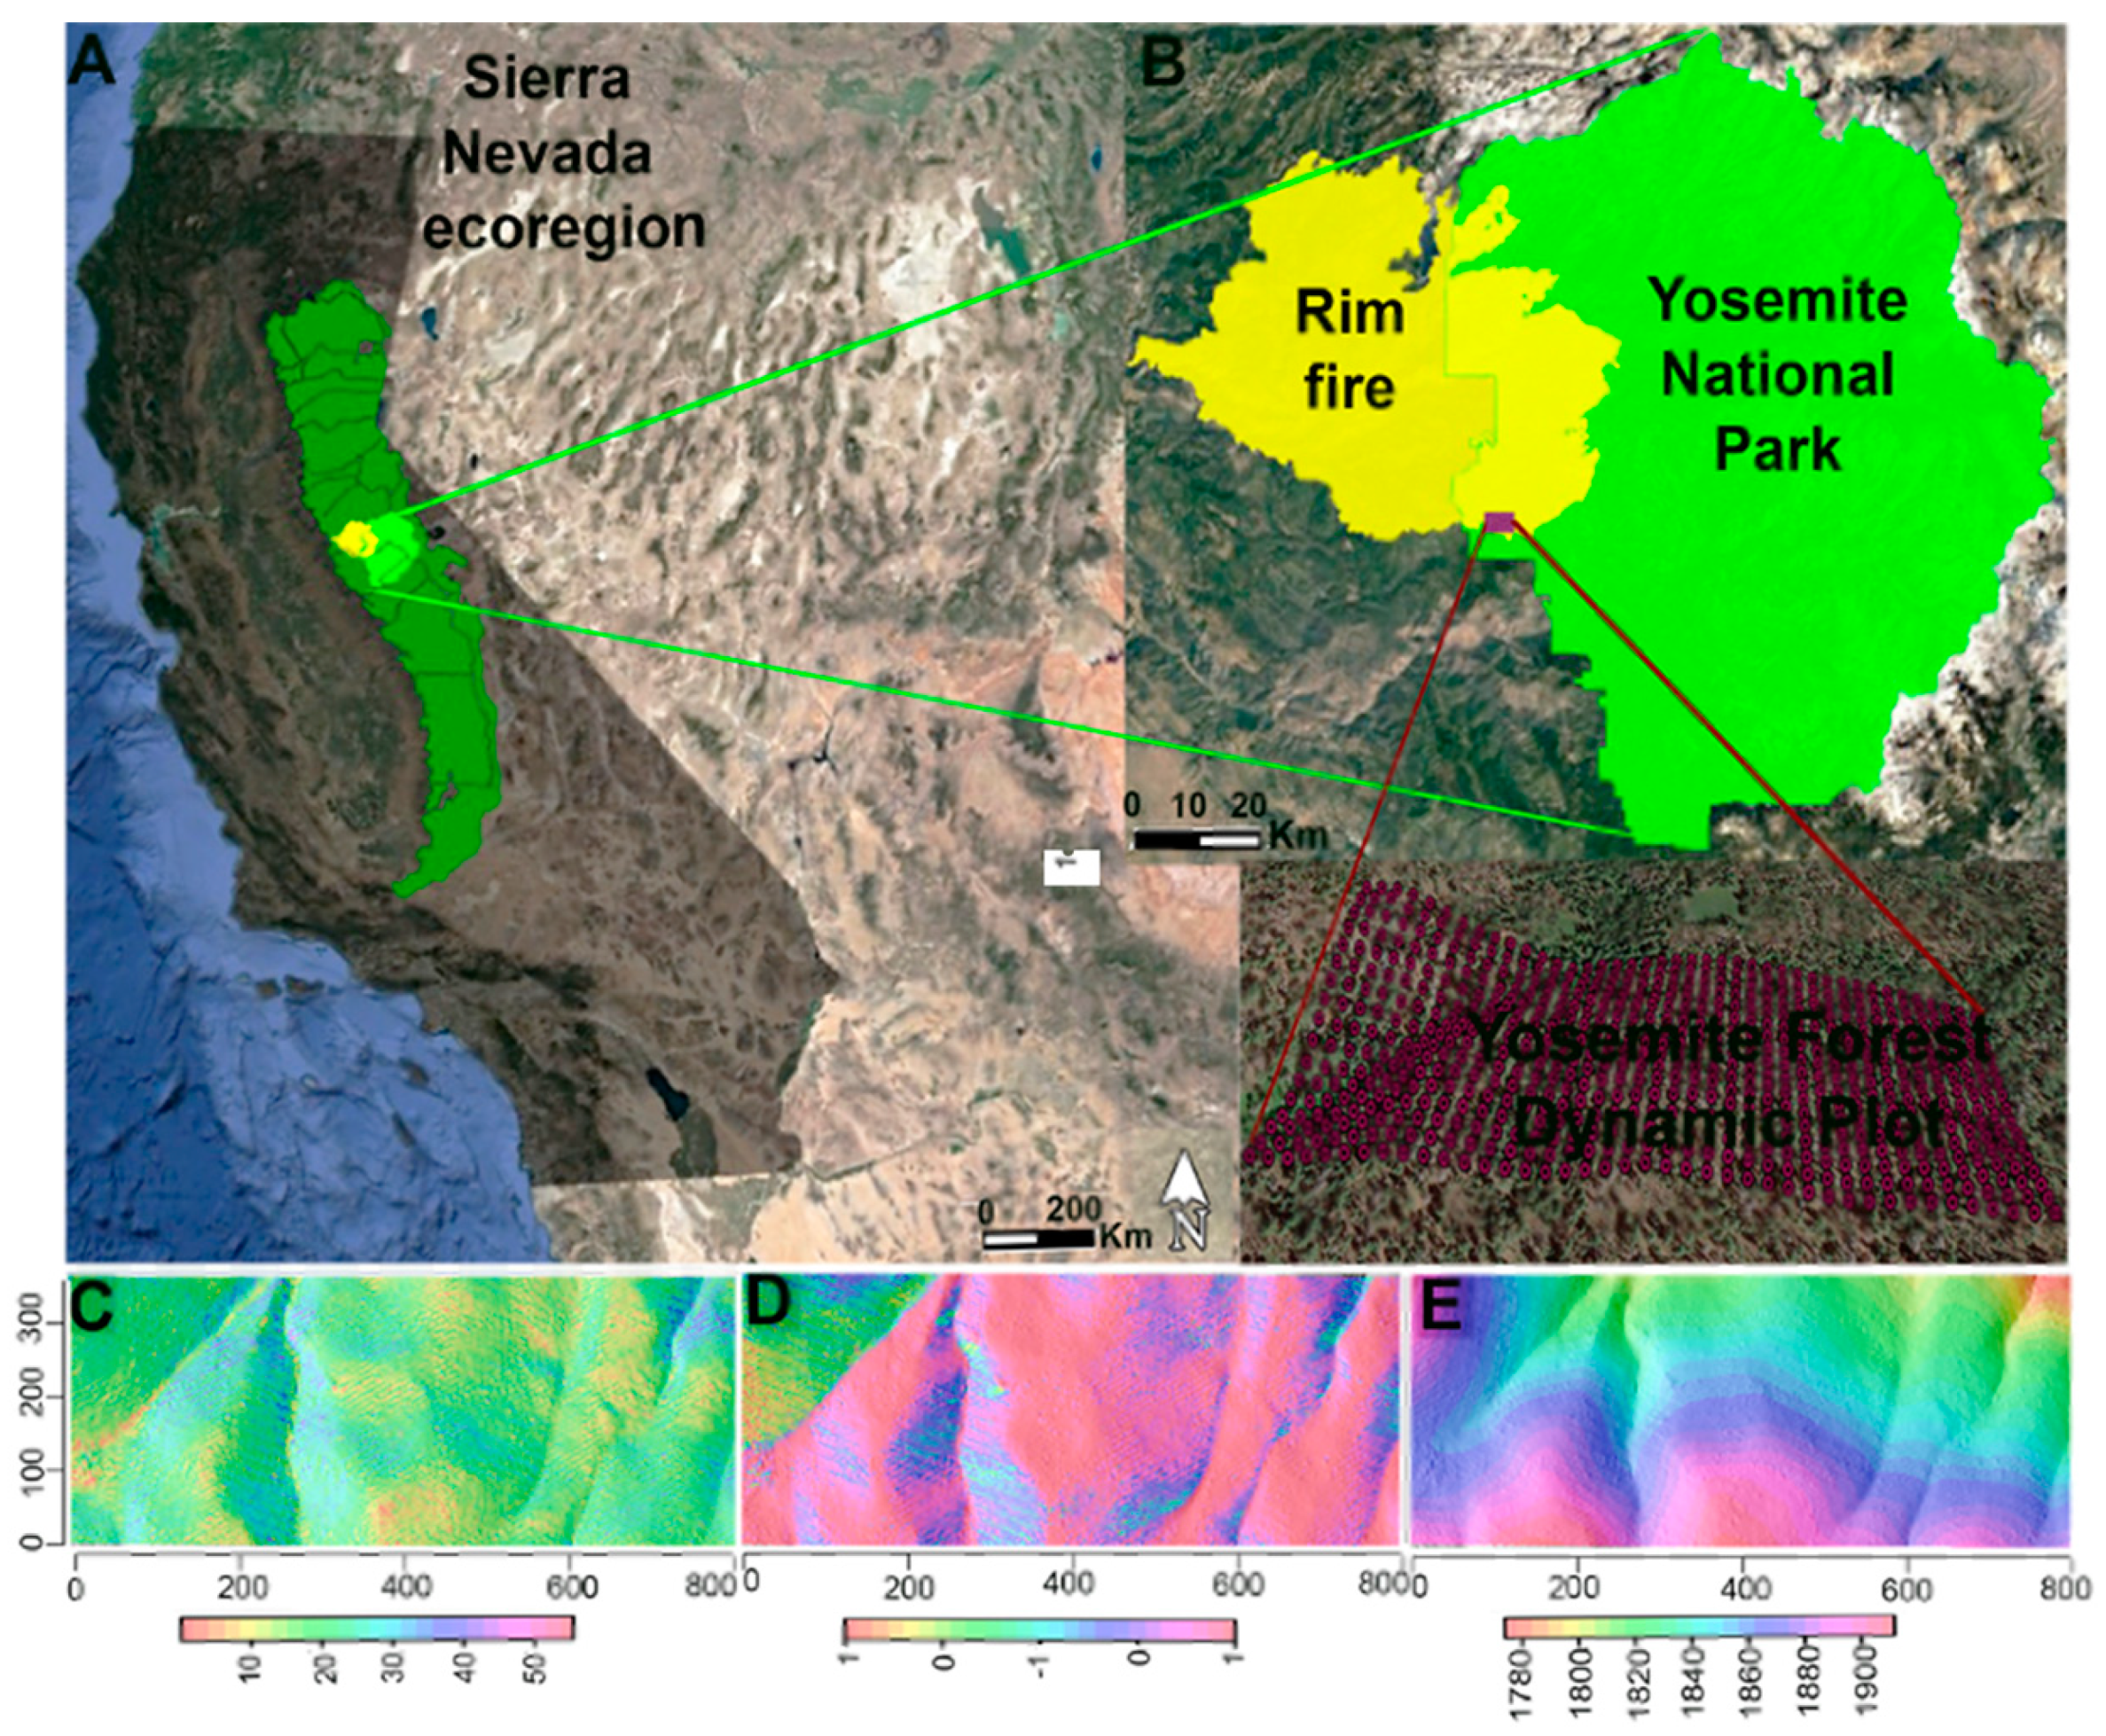
The study was carried out in the Yosemite Forest Dynamics Plot (YFDP), a 25.6 ha (320 m × 800 m) plot established according to the Smithsonian ForestGEO protocols near Crane Flat in Yosemite National Park, central Sierra Nevada, California, USA (Figure 1) [40,41]. The YFDP is further divided into 640 quadrats of 20 m × 20 m. The climate is Mediterranean, with hot, dry summers and cool, wet winters. Annual minimum and maximum monthly temperatures are in January (−1.82 °C to 10.01 °C) and July (13.9 °C to 27.14 °C) [42]. Mean annual precipitation is 1070 mm, with most precipitation occurring between November and March [42]. Elevation ranges from 1774.1 m to 1911.3 m. The principal tree species are Abies concolor (white fir), Pinus lambertiana (sugar pine), Cornus nuttallii (Pacific dogwood,) Calocedrus decurrens (incense-cedar), and Quercus kelloggii (California black oak) [23], with distribution and abundance of these species jointly controlled by climate and fire [43]. The YFDP was burned in August 2013 by a management-ignited backfire to prevent the spread of the Rim fire (details about fire behavior and fire effects: [27,44,45,46]).
2.2. Field Methods
Within the YFDP, each tree was revisited annually between 2011 and 2019 and the status (live or dead) was checked each year, with tree diameters remeasured in 2014 and 2019. We analyzed the four most abundant tree species; Abies concolor, Pinus lambertiana, Calocedrus decurrens, and Quercus kelloggii (2862, 857, 450, and 1282 live stems, respectively, in 2019). To evaluate the potential influence of topographic variables on species spatial patterns, elevation, aspect, and slope were calculated metrics for each 20 m × 20 m quadrat using the surveyed elevations of the quadrat corners. Each quadrat was divided into four triangular planes (each triangle is formed by connecting three corners of the quadrat) and the slope was calculated by taking the mean angular deviation of these panels. Elevation was calculated by averaging the elevations of four corners of the quadrat [7]. As aspect is a land-surface variable, we used a cosine transformation to obtain a continuous gradient.
2.3. Data Analysis
2.3.1. Null Models and Spatial Point Process Models
We used the pair correlation function to analyze the spatial pattern of individuals ≥1 cm diameter at breast height (dbh) [47,48]. The pair correlation function, g(r), replaces the circle in the Ripley’s k-function with a ring to analyze spatial distributions [47,49]. The g(r) is the expected density of points falling within a circular ring of radius (r) around a focal tree divided by the intensity of the pattern [47]. If g(r) ~1, then the inter-tree distances are consistent with complete spatial randomness. If g(r) values are larger than one, trees are more aggregated (clustered) than expected at radius r. Values of g(r) less than one indicate that trees are more dispersed than expected at distance r. Point process models use one of several distributions as null models [50]. We used inhomogeneous Poison processes, homogeneous Thomas processes, and three null models including complete spatial randomness, antecedent condition, and random labeling to address our questions (Table 1).
2.3.2. Complete Spatial Randomness (CSR)
The simplest and perhaps most common null model for univariate point patterns is complete spatial randomness (CSR), which indicates that the spatial distributions of trees are not influenced by any underlying biological mechanisms at any distance [52]. For CSR patterns, each point has the same probability of occurring at any place in the study area. Gradients due to first-order environmental differences are not considered.
2.3.3. Inhomogeneous Poisson Process (IPP)
The inhomogeneous Poisson process (IPP) considers first order gradients in the data. In this null model, the distribution of points is assumed to be based on an intensity function (λ) that depends on the interaction between environmental covariates and tree species density [53]. Aspect, slope, and elevation strongly affect the spatial distribution of solar radiation [54]. Solar radiation influences surface temperature, evatranspiration, and soil moisture content [55], which modify the local environment and influence species composition and productivity [56]. In this study, three topographic variables including aspect, slope, and elevation were selected as environmental variables. We used the heterogeneous Poisson process to estimate the effect of topographic heterogeneity on the local tree species density.
2.3.4. Homogeneous Thomas Process (HTP)
This point process is a Poisson cluster process which can model the impact of dispersal limitation (independent of the habitat heterogeneity) with the aggregation of the offspring around the parent trees. This process is modeled by two steps [48,57]. First, the locations of parent trees are generated from a homogeneous Poisson point process with λ > 0 on simulation window. Second, a number of offspring with mean μ > 0 are independently generated around each parent. These offspring form the clusters and were displaced from the parent by independent Gaussian dispersal kernel with standard deviation . For all analyses, 999 Monte Carlo simulations were used to evaluate departures of g(r) from the null models. We estimated 95% confidence envelopes from the twenty-fifth lowest and twenty-fifth highest values obtained from 999 simulations using the “spatstat” package (version 1.64-1; [58]) in R version 3.6.3 [59]. The distance associated with the Thomas process is the distance at which g(r) ~1.
2.3.5. Contributions of Habitat Heterogeneity and Dispersal Limitation at Different Scales
The goodness-of-fit of the homogeneous Poisson process, inhomogeneous Poisson process, and homogeneous Thomas process were calculated by Akaike’s information criterion (AIC). AICs were calculated using the “nmle” package (version 3.1-149; [60]). To evaluate the contributions of models at different spatial distances, distances were divided into the six categories: 0–2 m, 2–5 m, 5–10 m, 10–20 m, 20–40 m, and 40–60 m and the AIC values were calculated over each scale range. The best model was the one that had the lowest AIC among other models at a specific scale.
2.3.6. Antecedent Conditions Null Model
Point pattern analysis can be employed to analyze spatial distribution and unilateral interactions of juveniles with mature individuals [61]. This bivariate null model keeps the locations of antecedent (mature trees) pattern constant and randomizes the juvenile over the study area not occupied by mature trees [52]. Randomization of individuals was performed by random shifts which combine the rotation and mirroring method, while the shape of an individual occupied in different cells needs to be maintained. We used 999 Monte Carlo simulations and used the 25 largest and 25 smallest to define a 95% confidence interval. When the observed pattern falls above the 97.5% confidence interval, there is a positive spatial correlation between juveniles and adult or clustered distribution. When the observed pattern falls below the 2.5% confidence interval, adult trees negatively affect juvenile density and yield an overdispersed spatial distribution. Juveniles were considered to be those trees with 1 cm ≤ dbh < 5 cm and adults were considered to be those trees with dbh ≥ 20 cm in 2019 (diameter cutoffs followed selection criteria of [62]). Stems ≥ 5 and <20 cm were not included in the analysis because of the uncertainty in their reproductive status based on diameter threshold alone [62]. We performed a sensitivity analysis of ±50% on the diameter threshold values (2.5 cm to 7.5 cm dbh threshold values for juveniles and threshold values ≥ 10 cm to 30 cm dbh for adults) (Figures S1–S3).
2.3.7. Assessing Spatial Pattern
The spatial pattern was assessed using the univariate pair correlation function g(r). Changes in spatial patterns following the fire were examined for large-diameter trees and juvenile regeneration in 2013, 2016, and 2019 (different post-fire years). Large-diameter trees were considered to be those with dbh ≥ 60 cm. We limited our analysis to tree species with more than 70 stems since we needed a sufficient number of individuals to detect patterns in point pattern statistics [53]; those species were Abies concolor, Pinus lambertiana, and Calocedrus decurrens. The changes in juveniles spatial patterns were investigated in a sprouting species (Quercus kelloggii) and a non-sprouting species (Abies concolor). We applied a 9-m radius as the local neighborhood [23]. We used the goodness-of-fit test proposed by Loosmore and Ford [57,63], and the “ecespa” package [64] was used to examine the spatial pattern against the CSR. We set α = 0.05 and applied a Bonferroni correction for multiple tests (n = 23), resulting in a threshold p-value of 0.002.
2.3.8. Conspecific Negative Density Dependence
Conspecific negative density dependence (CNDD) was calculated with g d, d+l (r) − g l, d+l (r), which compares the conspecific neighborhood of trees that died and survived (subscripts show tree status: dead (d), live (l)). Dead trees were individuals that survived from fire but died in 2015–2019 and live trees indicate the trees that survived through the time period (2015–2019). Positive and negative values indicate that the neighborhood of trees that died was more (less) crowded than the neighborhood of trees that survived. Random labeling null model was implemented to generate 999 simulations. The goodness-of-fit test proposed by Loosmore and Ford [63] was used to calculate p-value at inter-tree distances up to 4 m for inference.
2.3.9. Edge Correction
Edge effects may arise in estimating point pattern due to the falling of sample rings partially outside of the study area. In this paper, we corrected edge effects by mirroring trees within 30 m of YFDP boundary to create a simulated stem map buffer zone around the study area [20].
3. Results
The observed (g) functions from CSR showed that species fell above the simulation envelopes at most scales, suggesting non-random species spatial distributions under the CSR null model (Figure 2A,D,G; Figures S4A–S6A).
3.1. Topographic Effect (Heterogeneous Poisson Process)
The observed clustered patterns of species could be generated by environmental gradients. To obtain an estimation of the magnitude of the habitat heterogeneity effects on the abundant species density, tree species distributions were generated based on topographic heterogeneity with the IPP null model. Abies concolor, Pinus lambertiana, and Calocedrus decurrens were aggregated at scales ≤15 m (Figure 2B,D,H; Figures S4B–S6B). The percentage of aggregated species decreased with the increase in the spatial distance. In addition, the species densities were predicted based on the covariates data (topographic) in the plot (Figure 3). The results show that the predicted patterns missed some clusters of trees. This indicates that point patterns analysis with topographic variables will be not enough to examine the species distributions.
3.2. Dispersal Limitation Effect (Homogeneous Thomas Process)
In this study, the effect of dispersal limitation on species distributions was tested separately to examine the importance of neutral-based (dispersal limitation) process in generating tree species spatial patterns. Results display that Abies concolor, Pinus lambertiana, and Calocedrus decurrens showed aggregated patterns at scales lower than 5 m, as with the inference of topographic effect (Figure 2C,F,I; Figures S4C–S6C).
3.3. Contributions of Habitat Heterogeneity and Dispersal Limitation
Results indicated that spatial scale was likely to affect the suitability of dispersal limitation and habitat heterogeneity in explaining tree species spatial patterns (Table 2). The homogeneous Thomas process was generally a better model in explaining species spatial patterns at finer scales. The inhomogeneous Poisson process performed better at coarser scales and the relative importance of the homogeneous Thomas process decreased with distance. At finer scales, individuals experienced relatively homogeneous environmental conditions and the species spatial distributions were severely limited by dispersal limitations. As the scales increased, the increased environmental heterogeneity appeared to be overbalanced by the lower effect of dispersal limitation. The results of the goodness-of-fit obtained from Monte Carlo simulation were relatively consistent with the results from AIC.
3.4. Spatial Patterns of Juvenile and Adult Trees
Juveniles of Abies concolor, Pinus lambertiana, and Quercus kelloggii were clustered around conspecific adults at 0–10 m, 0–7.5 m, and 0–4.5 m scales, respectively (Figure 4A,C,E,G; see the location of the observed values in relation to simulation envelope in Figure S7A,C,E,G; see species totals in Table S1 and species spatial distribution in Figure S8A,C,E,G). Juveniles of Abies concolor and Quercus kelloggii exhibited a significant attraction with adults of other species at 0–6.5 m and 0–2.5 m scales respectively (Figure 4B,D,F,H; see the location of the observed values in relation to simulation envelope in Figure S7B,D,F,H; see species spatial distribution in Figure S8B,D,F,H). The juveniles of Calocedrus decurrens were randomly distributed around conspecific and heterospecific adults at most distances.
3.5. Overall Changes in Tree Spatial Patterns
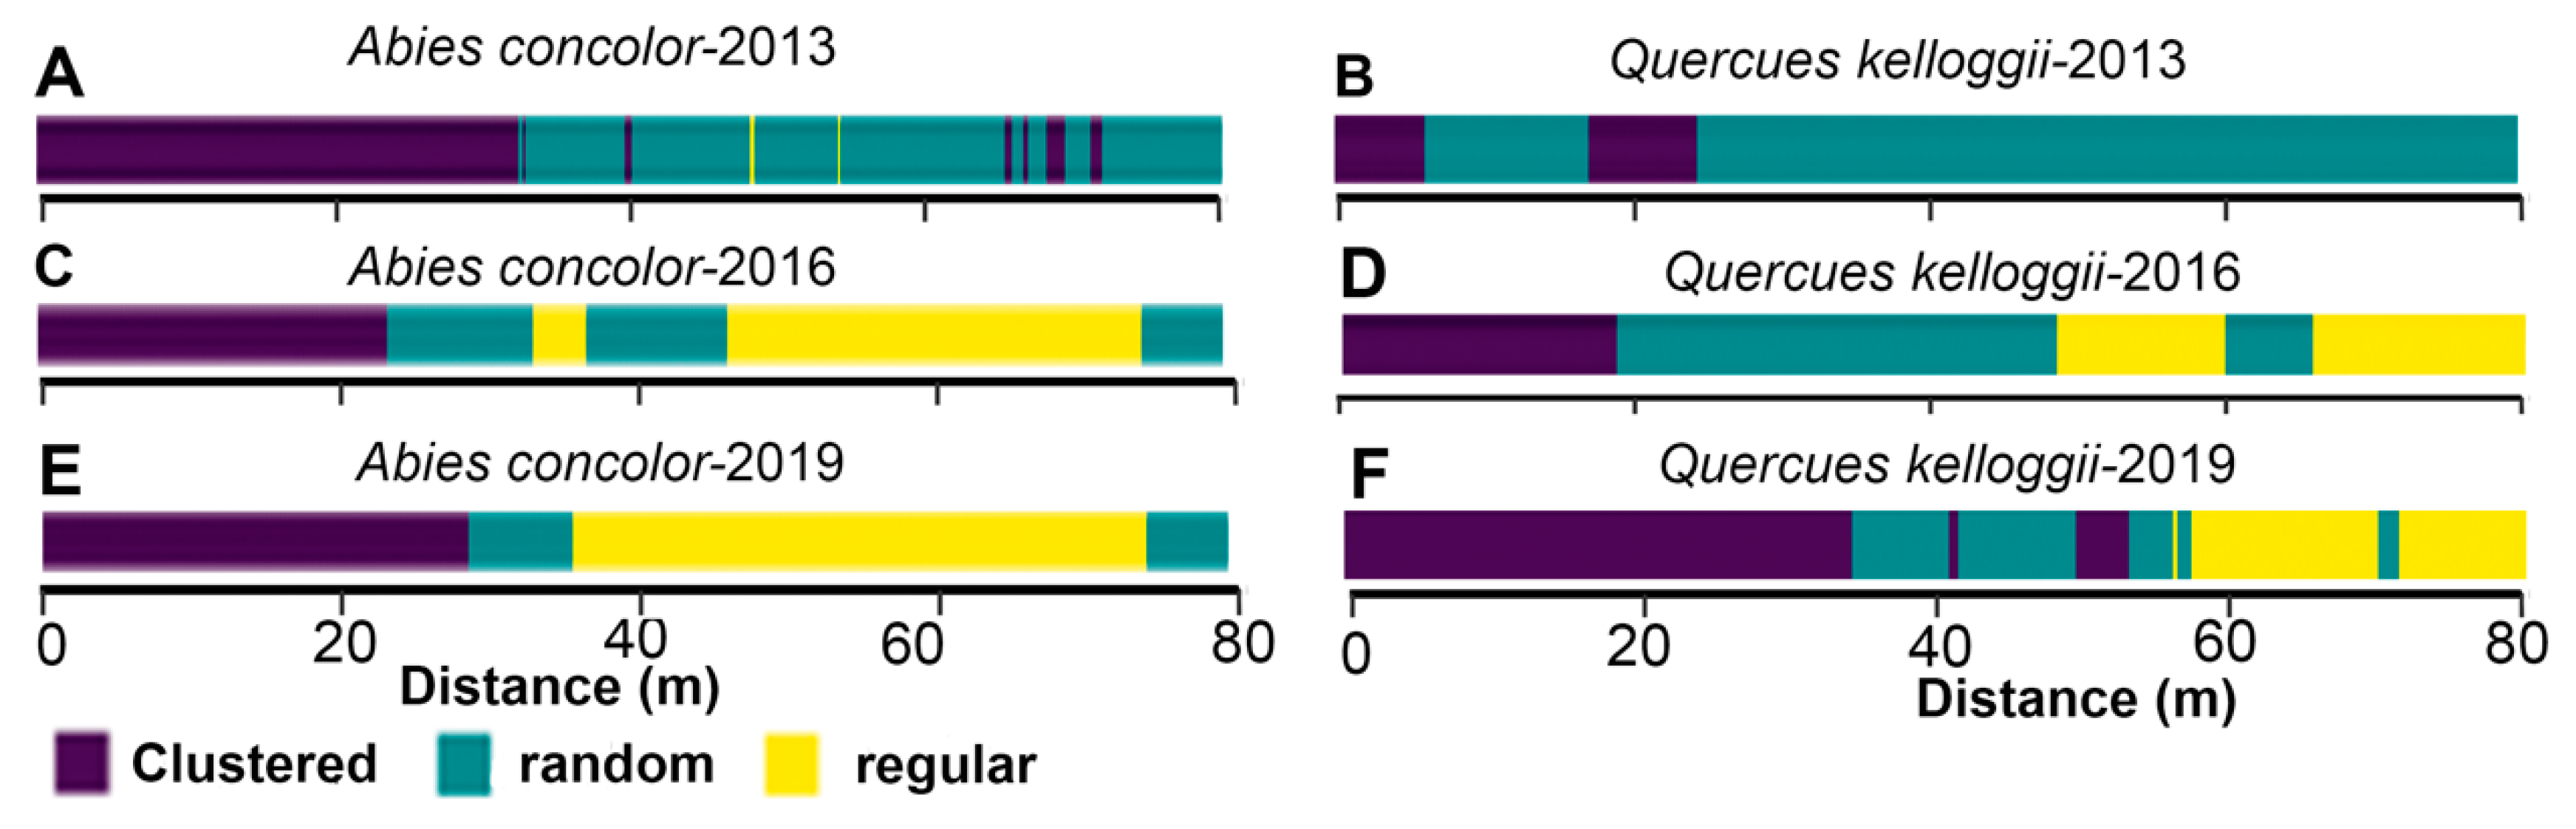
The changes in the spatial pattern of regeneration (1 cm ≤ dbh < 5 cm) were investigated for A. concolor and Q. kelloggii in 2013 (pre-fire), 2016 (little post-fire), and 2019 (Figure 5; Figures S9 and S10; Table S2). Most of the post-fire recruitments (2014–2015) of these species were from small seedlings that survived the fire. The regeneration in A. concolor displayed a significant aggregation pattern at the 0–9 m scale in 2013, 2016, and 2019 (Monte Carlo goodness-of-fit test; 2013, 2016, and 2019, all P = 0.001). Significant aggregation was observed for Q. kelloggii in 2016 and 2019 (Monte Carlo goodness-of-fit test; 2016 and 2019: P = 0.001). The g(r) value for A. concolor in 2016 rose significantly at small scale, reached to the aggregation peak at about 8 m and decreased gradually at coarse scale. The A. concolor spatial pattern in 2019 was approximately the same as 2016, but displayed aggregation at greater scales. The spatial arrangement was different from complete spatial randomness from 0–9 m for Q. kelloggii in 2016 (Monte Carlo goodness-of-fit test; 2016: P = 0.001). The g(r) value decreased from 18 to 45 m and showed spatial inhibition at around 45 m.
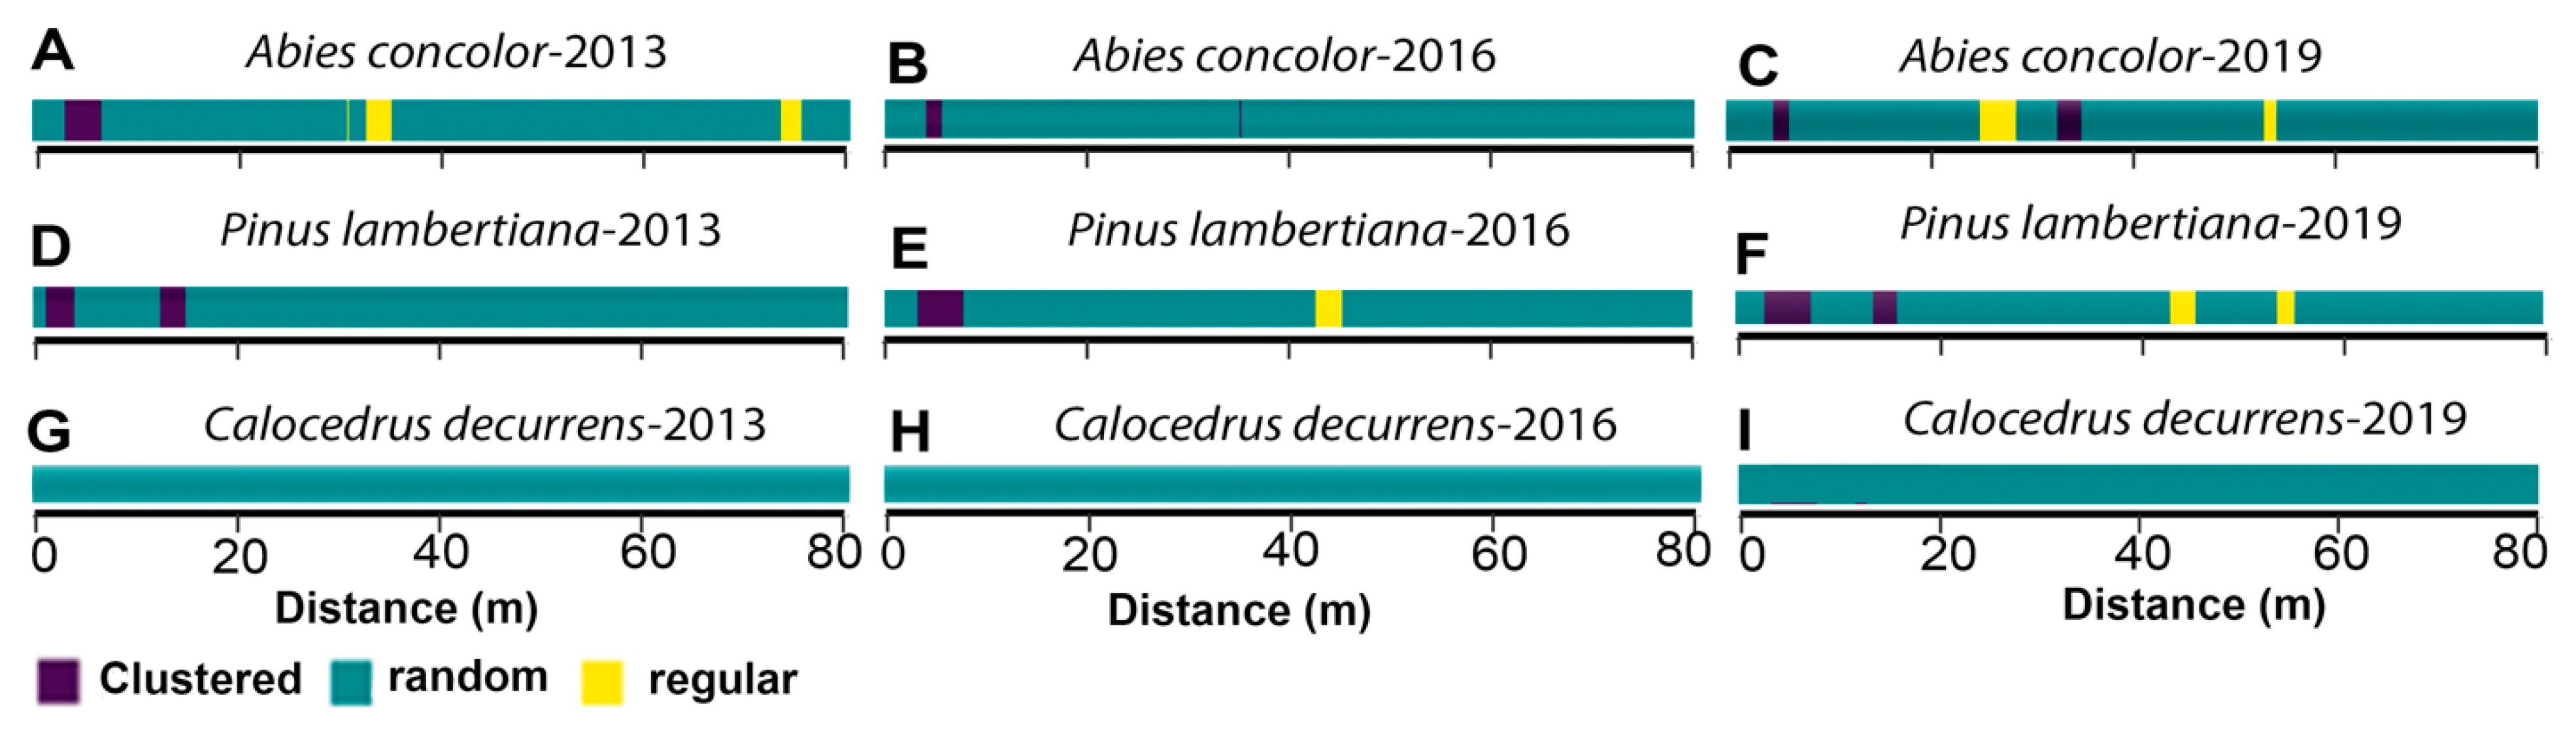
The spatial pattern of large-diameter A. concolor was different from complete randomness from 0–9 m (Monte Carlo goodness-of-fit test; 2013 and 2016: P = 0.001; Figure 6; Figures S11–S13). The g(r) values indicate spatial randomness from 0–9 in 2019 (Monte Carlo goodness-of-fit test; 2019: P = 0.003). The spatial pattern of P. lambertiana in 2013, 2016, and 2019 was different from complete randomness (exhibited the significant clustering) from 0–9 m (Monte Carlo goodness-of-fit test; 2013, 2016, and 2019: P = 0.001). The spatial arrangement at all scales did not change from 2016 to 2019 in P. lambertiana. The spatial pattern of large-diameter C. decurrens was not different from complete randomness from 0–9 m (Monte Carlo goodness-of-fit test; 2013, 2016, 2019: P = 0.001, 0.002, 0.001).
3.6. Conspecific Negative Density Dependence
Diameter distributions (Figure S14) showed that the plot was characterized by abundant trees in the smaller diameter classes in 2019. The number of living Quercus kelloggii was relatively greater than of dead Quercus kelloggii. Dead stems were in the smaller diameter classes (Figure S10). The results (Figure 7) showed that live A. concolor had more conspecific neighbors (living and dead) at 1–4 m than did dead A. concolor which indicates the conspecific positive density dependence. In addition, Pinus lambertiana trees that died during the study had significantly more crowded neighborhoods than trees that survived.
4. Discussion
4.1. Effect of Random Process, Habitat Heterogeneity, and Dispersal Limitation on the Formation of the Spatial Patterns of Abundant Species
The homogeneous Thomas process was the best model in describing the spatial pattern of three species compared to the inhomogeneous Poisson process at finer scales, consistent with a greater contribution of neutral processes and unmeasured environmental variables at those scales. Dispersal limitation introduced a mechanism in which a parent defines the location of an individual. Poor seed dispersal is related to a greater clumping pattern [65]. In species with animal dispersal mode, it is expected to have a higher dispersal ability and less aggregated pattern compared to species with wind or gravity dispersal mode. Seeds in P. lambertiana are not often dispersed great distances by wind, because they are large and heavy [66]. Furthermore, secondary mechanisms of dispersal (food-storing rodents and birds) contribute substantially in P. lambertiana seed dispersion by dispersing seeds away from parent trees [17]. In addition, seeds of A. concolor disperse shorter distances due to their short and broad wing relative to their weight [18]. Calocedrus decurrens is a wind-dispersed species that releases seeds in late autumn when winds can be high, increasing dispersal distances. The better contribution of dispersal limitation in comparison with the environmental heterogeneity in shaping species spatial aggregation relative to environmental heterogeneity was consistent with several studies [67,68,69].
However, the results displayed the contribution of habitat heterogeneity in forming tree species spatial patterns at coarser scales (>5 m), indicating the joint effects of the dispersal limitation and habitat heterogeneity in forming the species spatial pattern [70]. Species clumping patterns at fine scales were determined by dispersal limitations, whereas the impacts of habitat heterogeneity occurred at larger scales. These findings indicate that the effects of dispersal limitation and environmental heterogeneity did not overlap at the same scales. Dispersal limitation first generates the template for tree distribution (seed aggregation close to the parent trees), but species habitat requirements may result in uneven seedling survival (if species survival depends on the habitat characteristics) and modify the sapling and adult distribution. Thus, the spatial pattern of seedlings and young trees may display a combination of both habitat heterogeneity and dispersal limitation. Therefore, it is better to evaluate the potential contribution of two processes simultaneously while examining spatial distribution.
4.2. Biotic Interactions of the Four Abundant Species
The analysis of juveniles around adults can be considered as an approach to examine the facilitation or microhabitat selection. According to this analysis, in three out of four species including A. concolor, P. lambertiana, Q. kelloggii, we found juveniles aggregated around conspecific adults. This also can be related to dispersal limitation in these species as the regeneration occurred near the seed source. California experienced a severe drought from 2012 to 2016 [36]. The aggregation may be attributed to microhabitats less affected by the drought [71] and higher juveniles resilience after the intense drought [37] around the conspecific adults. Positive interactions with mycorrhizal fungi may facilitate the establishment of conspecifics. The vast majority of tree species are colonized by either arbuscular (AM) or ectomycorrhizal (ECM) fungi in the most temperate forests. AM trees do not have fungal external structures that protect root cells from entering pathogens. In contrast, ECM trees have a fungal structure that prevents pathogens entry. A. concolor and P. lambertiana juveniles were clustered around the conspecific adults at <10 m and <7.5 m scales, respectively. These aggregated patterns can be related to the mycorrhizal association (both are ECM trees and have ectomycorrhizal fungi), which caused positive interactions among their juveniles with conspecific trees [72,73]. Furthermore, the aggregation of A. concolor juveniles around the conspecific adults at fine scales may have arisen from a lower mortality risk with proximity to conspecific neighbors in old-growth conifer forests [74]. The juveniles of Q. kelloggii exhibited attractions with conspecific adults at the short distances due to the quick regeneration by sprouting in a response to fire [75,76]. Additionally, the juveniles of A. concolor and Q. kelloggii were aggregated around adults of other species at small scales, respectively. These interspecific aggregations suggest that the intraspecific self-thinning process may reduce competition, promote interactions, and create appropriate conditions for heterospecific recruitment. Results showed that young individuals were more commonly found around conspecific adults in comparison to heterospecific adults (three species vs. two species). The observed random distributions of Calocedrus decurrens juveniles around adults indicate that juveniles did not display association with local adults’ neighborhood. This suggests that the density-dependence effect was not striking to blur juveniles, and asymmetric competition between adults and juveniles represses the juveniles growth rather than eliminate them. The fact that more than 50% of these abundant species displayed intraspecific aggregation between juveniles and adults suggests the more significant effect of seed dispersal limitation rather than facilitation. The results of the antecedent condition null model would be better if we applied it to specific pairs of species, but due to the lack of enough sample size in particular species, we conducted it in all species in the plot.
4.3. Effect of Disturbance on the Spatial Pattern of Juveniles Regeneration and Large-Diameter Trees
Fire can alter plant community composition by generating post-fire conditions that favor in the establishment of some species and change the species composition in the remaining forest [43]. Fire was suppressed for a century in the YFDP which resulted in a nearly closed canopy forest, high stem density, and significant increase in surface and ladder fuels accumulations. The YFDP was burned in 2013 and the fire severity was classified as low-and-moderate severity fire regime with small unburned surface fuels and high severity patches within the YFDP [27,77]. The fire removed >90% of the fire surface fuels and >61% of the coarse woody debris [46,78]. Most post-fire mortality occurred in the first year, especially for small trees [79]. The proportional area of unburned fire refugia was 4.9% (12,597 m2) with the lowest number in high-severity pixels (derived from Landsat) within the YFDP [27]. When low- and mixed-severity fires burn through sugar pine-white forest, they can create a mosaic with patches including open patches, patches with spaced single trees, and patches with aggregated trees in the forest [80,81,82,83]. Open patches of mineral soil are favorable sites for seedling establishment and increased soil moisture and reduced competition in these patches [84] may promote seedling and sapling survival. Furthermore, burned patches may show a moderate rise in the availability of resources including soil nutrients, light, and water increasing the chances of establishment and survival [70]. The fact that light was not a dominant driver of regeneration success (unsurprising in this post-fire forest) was confirmed by the decreased attraction between juveniles and adults at greater distances. Oak’s traits and growth strategies allow it to take advantage of post-fire conditions. The better adaptation of oak can be traced to the ability to make root reserves by allocating carbohydrates to root growth [85], producing deep post-fire root systems from top-killed trees [86]. These characteristics allow oak to have a post-fire competitive advantage over seeders due to their shorter time to contribute to measured recruitment, i.e., 1 cm dbh [87]. Increasing the proportion of fire refugia may be considered as an important factor for post-fire species regeneration. As a nearby seed source is a principal requirement for A. concolor regeneration, there is likely to be higher juvenile regeneration near surviving mature trees in unburned patches. In addition, the residuals overstory in unburned patches produces shade which can limit shrub competition and promote seedling establishment. Bloomdahl et al. [27] reported that the proportion of fire refugia was higher in low- and moderate-severity burns and tree survival rates were higher in unburned patches for diameter classes ≤60 cm four years after the fire. In our study, most of the regeneration (three and six years following the fire) in A. concolor was from small seedlings that survived the fire because of their location in small fire refugia or completely unchanged patches (as inferred from Landsat). Results displayed the aggregated pattern in post-fire regeneration and increases in observed clustered patterns at finer scales following the fire. Additionally, other factors including favorable local microhabitat, vicinity to standing logs and stumps, which reduce summer drought by decreasing the solar radiation and increase soil moisture, could affect the regeneration’s aggregated pattern [88,89]. All of the recruitment for Q. kelloggii was from sprouting and resulted in a strongly aggregated post-fire pattern of at scale about 1 m. Our results suggest that post-fire regeneration had a tendency to aggregate at distances up to 20 m, consistent with Fulé and Covington [90]. Given continued fire exclusion in the plot, it is likely that the shade-tolerant and fire-intolerant A. concolor may have the competitive advantage and will emerge as dominant conifer regeneration within the plot [91].
The degree of disturbance affects the spatial pattern of large-diameter trees in different ways [92,93]. Ground fuel accumulations and increased tree density can result in mortality for most sub-canopy trees while most of the larger trees survive [94]. Although low-to-moderate intensity fire often does not have a direct effect on large-diameter tree mortality it can result in injuries that reduce large-diameter tree physiological functionality [95]. Small patches of high-severity fire can kill most or all large-diameter trees, but lower severity patches leave even medium-sized trees alive [91]. Spatial patterns of A. concolor were clumped at scales of 0–9 m in 2013 and 2016. The survival of the large-diameter of A. concolor in refugia [4,90] would result in a clustering pattern following the fire. Random spatial distributions of large-diameter trees were observed in most scales following the fire. The spatial pattern of large-diameter P. lambertiana did not change much from 2013 to 2019, most likely due to its fire resistance. Clustering patterns at 0–9 m scales were observed in P. lambertiana and A. concolor following the fire occurrence. This can be related to the survived stems in scattered fire refugia [23,96] within the plot. The post-fire spatial pattern in C. decurrens was not different from CSR which can be related to the fire-resistant characteristic in large trees (fire-intolerant when they are small).
4.4. Effect of Conspecific Negative Density Dependence in Regulating Dominant Tree Species Spatial Pattern
The conspecific negative density dependence (CNDD) was examined to assess the possible effect of density-dependent mortality on species spatial patterns. The observed positive density dependence in A. concolor at <4 m scales may be associated with environmental heterogeneity within the YFDP. Some residual trees may be found in the fire-created patches which may also be good habitat for soil fungi and persistent soil nutrients. Furthermore, this positive density effect is possibly related to the fungal structure in the roots of some species where saplings clustered around conspecific trees experience higher performance due to shared ectomycorrhizal protection against pathogens [73]. Additionally, CNDD regulation was only detected at scales <4 m in Pinus lambertiana. This may be related to the lack of separation based on neighboring tree diameter size as the intensity and tendency of density dependence differ according to the tree diameter [20]. The increase in post-fire conspecific density mortality in Pinus lambertiana may be related to the reduction in trees allocation to resin defense (resin duct area) due to the higher intraspecific competition for water, which increases their vulnerability against bark beetles attack and drought stress [97].
5. Conclusions
Understanding processes underlying spatial arrangement reveals important clues for mechanisms of species coexistence. Investigating the effect of environmental heterogeneity, dispersal limitation, biotic interactions, and disturbance in spatial patterns development would help us to predict plant community responses to environmental changes as a result of global change. This study showed that both seed dispersal limitation and habitat heterogeneity likely shape the spatial distribution of abundant species. We found that fire can play a key role in forest composition by creating opportunities for tree species to be reorganized following fire, although a longer time period is needed to study the regeneration spatial pattern as most of the recruits analyzed here originated from small seedlings which survived the fire rather than recruits developing from seed post-fire. Additionally, a more comprehensive study of the effect of fire on the tree mortality spatial pattern is needed to examine fire’s influence on species spatial pattern. The results of conspecific density dependence indicate the role of CNDD and CPDD in shaping abundant spatial distribution. Each of these processes may have acted individually or jointly with other processes to influence spatial patterns. Explaining the coexistence of species remains a challenge and future work could investigate the contribution of other ecological factors including bark beetles, pathogens, climate and drought, post-fire mortality pattern, physical mortality agent (including wind and crushing), and other environmental heterogeneity (including light, soil moisture, temperature) in species spatial pattern.
Supplementary Materials
The following are available online at https://0-www-mdpi-com.brum.beds.ac.uk/2571-6255/3/4/72/s1, Figure S1. Distribution and density of the four most abundant species in the Yosemite Forest Dynamic Plot in 2019; Figure S2. Results of the sensitivity analysis for diameter cutoff values chosen for the grouping of adult and juvenile stems in 2019 in the Yosemite Forest Dynamic Plot; Figure S3. Results of the sensitivity analysis for diameter cutoff values were chosen for grouping the adult and juvenile stems in 2019 in the Yosemite Forest Dynamic Plot; Figure S4. Panels display the relationship between the univariate pair-correlation function g(r) and distances for Abies concolor in 2019 in the Yosemite Forest Dynamic Plot; Figure S5. Panels display the relationship between the univariate pair-correlation function g(r) and distances for Calocedrus decurrens in 2019 in the Yosemite Forest Dynamic Plot; Figure S6. Panels display the relationship between the univariate pair-correlation function g(r) and distances for Pinus lambertiana in 2019 in the Yosemite Forest Dynamic Plot; Figure S7. Left panels show the relationship between the pair-correlation function g(r) and scales for the Abies concolor (A), Calocedrus decurrens (C), Pinus lambertiana (E), Quercus kelloggii (G), to assess the interaction between juveniles (1 cm ≤ dbh < 5 cm dbh) and conspecific adults (individuals ≥ 20 cm dbh) in 2019 in the Yosemite Forest Dynamic Plot; Figure S8. Left panels display the distributions of juveniles (1 cm ≤ dbh < 5 cm dbh) and conspecific adults (dbh ≥ 20 cm) in Abies concolor (A), Calocedrus decurrens (C), Pinus lambertiana (E), and Quercus kelloggii (F), in 2019 in the Yosemite Forest Dynamic Plot; Figure S9. Comparison of juveniles regeneration spatial patterns (1 cm ≤ dbh < 5 cm) in seeder species (Abies concolor) and sprouting species (Quercus kelloggii) in 2013 (pre-fire), 2016 (post-fire), and 2019 (postfire) in the Yosemite Forest Dynamic Plot. Black lines display the observed g(r), values above (below) simulation envelopes indicate aggregated (dispersed) pattern; Figure S10. Diameter distributions of live stems (panels in first and third rows) and dead stems (panels in second and forth rows) for species in 2013, 2016, and 2019 in the 25.6 ha Yosemite Forest Dynamics Plot; Figure S11. Spatial pattern of pre-fire (2013) and post-fire (2016 and 2019) for large-diameter trees (live and dbh ≥ 60 cm) within the Yosemite Forest Dynamic Plot;Figure S12. The panels (A, B, C) show the overall changes in live large-diameter trees spatial patterns (dbh ≥ 60 cm) in 2013, 2016, and 2019 in the Yosemite Forest Dynamic Plot; Figure S13. Diameter distributions for the three species (live stems) in 2013 (pre-fire), 2016 (little post-fire), and 2019 in the 25.6 ha Yosemite Forest Dynamics Plot; Figure S14. Diameter distributions of living (A) and dead (B) stems for the Abies concolor (ABCO), Calocedrus decurrens (CADE), Pinus lambertiana (PILA), and Quercus kelloggii (QUKE) in 2019 in the 25.6 ha Yosemite Forest Dynamic Plot. Table S1. Stem numbers of juveniles and adults in species in 2019 in the Yosemite Forest Dynamic Plot; Table S2. Live juveniles (1 cm ≤ dbh < 5) of Abies concolor and Quercus kelloggii in 2013, 2016, and 2019 in the Yosemite Forest Dynamic Plot.
Author Contributions
J.T. and J.A.L., designed the research; J.T. analyzed data and wrote the first draft; J.T. and J.A.L. edited and approved the final manuscript. All authors have read and agreed to the published version of the manuscript.
Funding
Funding was received from the Utah Agricultural Experiment Station (projects 1153 and 1398 to JAL). Funding for the YFDP has been provided by the Center for Tropical Forest Science of the Smithsonian Tropical Research Institute, Utah State University, and the University of Washington. The Yosemite Forest Dynamics Plot was made possible by a grant from Jennifer Walston Johnson to the Smithsonian ForestGEO.
Acknowledgments
Support was received from Utah State University, the Ecology Center at Utah State University, and the Utah Agricultural Experiment Station, which has designated this as journal paper 9333. We thank the field staff who collected data, each individually acknowledged at http://yfdp.org. We thank the managers and staff of Yosemite National Park for their logistical support.
Conflicts of Interest
The authors declare no conflict of interest.
References
- Whitfield, J. Neutrality versus the Niche. Nature 2002, 417, 480–481. [Google Scholar] [CrossRef]
- Hubbell, S.P. The Unified Neutral Theory of Biodiversity and Biogeography; Princton University Press: Princeton, NJ, USA, 2001. [Google Scholar]
- Zhou, S.; Zhang, D. Neutral theory in community ecology. Front. Biol. China 2008, 3, 1–8. [Google Scholar] [CrossRef]
- Condit, R.; Ashton, P.S.; Baker, P.; Bunyavejchewin, S.; Gunatilleke, S.; Gunatilleke, N.; Hubbell, S.P.; Foster, R.B.; Itoh, A.; LaFrankie, J.V. Spatial patterns in the distribution of tropical tree species. Science 2000, 288, 1414–1418. [Google Scholar] [CrossRef]
- Zhang, Z.-H.; Hu, G.; Ni, J. Effects of topographical and edaphic factors on the distribution of plant communities in two subtropical karst forests, southwestern China. J. Mt. Sci. 2013, 10, 95–104. [Google Scholar] [CrossRef]
- Engone Obiang, N.L.; Kenfack, D.; Picard, N.; Lutz, J.A.; Bissiengou, P.; Memiaghe, H.R.; Alonso, A. Determinants of spatial patterns of canopy tree species in a tropical evergreen forest in Gabon. J. Veg. Sci. 2019, 30, 929–939. [Google Scholar] [CrossRef]
- Harms, K.E.; Condit, R.; Hubbell, S.P.; Foster, R.B. Habitat associations of trees and shrubs in a 50-ha neotropical forest plot. J. Ecol. 2001, 89, 947–959. [Google Scholar] [CrossRef]
- Queenborough, S.A.; Burslem, D.F.; Garwood, N.C.; Valencia, R. Habitat niche partitioning by 16 species of Myristicaceae in Amazonian Ecuador. Plant Ecol. 2007, 192, 193–207. [Google Scholar] [CrossRef]
- Valencia, R.; Foster, R.B.; Villa, G.; Condit, R.; Svenning, J.C.; Hernández, C.; Romoleroux, K.; Losos, E.; Magård, E.; Balslev, H. Tree species distributions and local habitat variation in the Amazon: Large forest plot in eastern Ecuador. J. Ecol. 2004, 92, 214–229. [Google Scholar] [CrossRef]
- Briggs, J.M.; Gibson, D.J. Effect of fire on tree spatial patterns in a tallgrass prairie landscape. Bull. Torrey Bot. Club 1992, 119, 300–307. [Google Scholar] [CrossRef]
- Pillay, T.; Ward, D. Spatial pattern analysis and competition between Acacia karroo trees in humid savannas. Plant Ecol. 2012, 213, 1609–1619. [Google Scholar] [CrossRef]
- Das, A.J.; Larson, A.J.; Lutz, J.A. Individual species–area relationships in temperate coniferous forests. J. Veg. Sci. 2018, 29, 317–324. [Google Scholar] [CrossRef]
- Wang, H.; Peng, H.; Hui, G.; Hu, Y.; Zhao, Z. Large trees are surrounded by more heterospecific neighboring trees in Korean pine broad-leaved natural forests. Sci. Rep. 2018, 8, 1–11. [Google Scholar] [CrossRef] [PubMed]
- Dalling, J.W.; Hubbell, S.P. Seed size, growth rate and gap microsite conditions as determinants of recruitment success for pioneer species. J. Ecol. 2002, 90, 557–568. [Google Scholar] [CrossRef]
- Plotkin, J.B.; Chave, J.; Ashton, P.S. Cluster analysis of spatial patterns in Malaysian tree species. Am. Nat. 2002, 160, 629–644. [Google Scholar] [CrossRef] [PubMed]
- Kinloch, B.B., Jr.; Scheuner, W.H. Pinus lambertiana Dougl. Sugar pine. Silvics of North America, Conifers. In Agriculture Handbook; US Department of Agriculture: Washington, DC, USA, 1990; pp. 370–379. [Google Scholar]
- Vander Wall, S.B. Effects of seed size of wind-dispersed pines (Pinus) on secondary seed dispersal and the caching behavior of rodents. Oikos 2003, 100, 25–34. [Google Scholar] [CrossRef]
- Zouhar, K.L. Abies Concolor. Fire effects Information System (Online). US Department of Agriculture, Forest Service, Rocky Mountain Research, Fire Science Laboratory (Producer). 2001. Available online: https://www.feis-crs.org/feis (accessed on 15 December 2020).
- Furniss, T.J.; Larson, A.J.; Kane, V.R.; Lutz, J.A. Multi-scale assessment of post-fire tree mortality models. Int. J. Wildland Fire 2019, 28, 46–61. [Google Scholar] [CrossRef]
- Furniss, T.J.; Larson, A.J.; Kane, V.R.; Lutz, J.A. Wildfire and drought moderate the spatial elements of tree mortality. Ecosphere 2020, 11, e03214. [Google Scholar] [CrossRef]
- Furniss, T.J.; Kane, V.R.; Larson, A.J.; Lutz, J.A. Detecting tree mortality with Landsat-derived spectral indices: Improving ecological accuracy by examining uncertainty. Remote Sens. Environ. 2020, 237, 111497. [Google Scholar] [CrossRef]
- Lutz, J.A.; Furniss, T.J.; Johnson, D.J.; Davies, S.J.; Allen, D.; Alonso, A.; Anderson-Teixeira, K.J.; Andrade, A.; Baltzer, J.; Becker, K.M. Global importance of large-diameter trees. Glob. Ecol. Biogeogr. 2018, 27, 849–864. [Google Scholar] [CrossRef] [Green Version]
- Lutz, J.A.; Larson, A.J.; Swanson, M.E.; Freund, J.A. Ecological importance of large-diameter trees in a temperate mixed-conifer forest. PLoS ONE 2012, 7, e36131. [Google Scholar] [CrossRef]
- Lutz, J.A.; Larson, A.J.; Freund, J.A.; Swanson, M.E.; Bible, K.J. The importance of large-diameter trees to forest structural heterogeneity. PLoS ONE 2013, 8. [Google Scholar] [CrossRef] [PubMed] [Green Version]
- Lutz, J.A.; Struckman, S.; Furniss, T.J.; Cansler, C.A.; Germain, S.J.; Yocom, L.L.; McAvoy, D.J.; Kolden, C.A.; Smith, A.M.; Swanson, M.E. Large-diameter trees dominate snag and surface biomass following reintroduced fire. Ecol. Process. 2020, 9, 1–13. [Google Scholar] [CrossRef]
- Neary, D.G.; Ryan, K.C.; DeBano, L.F. Wildland Fire in Ecosystems: Effects of Fire on Soils and Water; General Technical Report RMRS-GTR-42-vol. 4; US Department of Agriculture, Forest Service, Rocky Mountain Research Station: Ogden, UT, USA, 2005; p. 42.
- Blomdahl, E.M.; Kolden, C.A.; Meddens, A.J.; Lutz, J.A. The importance of small fire refugia in the central Sierra Nevada, California, USA. For. Ecol. Manag. 2019, 432, 1041–1052. [Google Scholar] [CrossRef]
- Murphy, J.; Johnson, D.; Miller, W.W.; Walker, R.F.; Blank, R.R. Prescribed fire effects on forest floor and soil nutrients in a Sierra Nevada forest. Soil Sci. 2006, 171, 181–199. [Google Scholar] [CrossRef]
- Covington, W.W.; Sackett, S.S. The effect of a prescribed burn in southwestern ponderosa pine on organic matter and nutrients in woody debris and forest floor. For. Sci. 1984, 30, 183–192. [Google Scholar]
- Zhu, W.-Z.; Xiang, J.-S.; Wang, S.-G.; Li, M.-H. Resprouting ability and mobile carbohydrate reserves in an oak shrubland decline with increasing elevation on the eastern edge of the Qinghai–Tibet Plateau. For. Ecol. Manag. 2012, 278, 118–126. [Google Scholar] [CrossRef]
- Saha, S.; Kuehne, C.; Bauhus, J. Intra-and interspecific competition differently influence growth and stem quality of young oaks (Quercus robur L. and Quercus petraea (Mattuschka) Liebl.). Ann. For. Sci. 2014, 71, 381–393. [Google Scholar] [CrossRef] [Green Version]
- Liao, J.; Bogaert, J.; Nijs, I. Species interactions determine the spatial mortality patterns emerging in plant communities after extreme events. Sci. Rep. 2015, 5, 11229. [Google Scholar] [CrossRef] [Green Version]
- Yang, X.-Z.; Zhang, W.-H.; He, Q.-Y. Effects of intraspecific competition on growth, architecture and biomass allocation of Quercus Liaotungensis. J. Plant Interact. 2019, 14, 284–294. [Google Scholar] [CrossRef] [Green Version]
- Pardos, M.; Montes, F.; Aranda, I.; Cañellas, I. Influence of environmental conditions on germinant survival and diversity of Scots pine (Pinus sylvestris L.) in central Spain. Eur. J. For. Res. 2007, 126, 37–47. [Google Scholar] [CrossRef]
- Janzen, D.H. Escape of juvenile Dioclea megacarpa (Leguminosae) vines from predators in a deciduous tropical forest. Am. Nat. 1971, 105, 97–112. [Google Scholar] [CrossRef]
- Belmecheri, S.; Babst, F.; Wahl, E.R.; Stahle, D.W.; Trouet, V. Multi-century evaluation of Sierra Nevada snowpack. Nat. Clim. Chang. 2016, 6, 2–3. [Google Scholar] [CrossRef]
- Andivia, E.; Madrigal-González, J.; Villar-Salvador, P.; Zavala, M.A. Do adult trees increase conspecific juvenile resilience to recurrent droughts? Implications for forest regeneration. Ecosphere 2018, 9, e02282. [Google Scholar] [CrossRef]
- Janzen, D.H. Herbivores and the number of tree species in tropical forests. Am. Nat. 1970, 104, 501–528. [Google Scholar] [CrossRef]
- Inman-Narahari, F.; Ostertag, R.; Hubbell, S.P.; Giardina, C.P.; Cordell, S.; Sack, L. Density-dependent seedling mortality varies with light availability and species abundance in wet and dry Hawaiian forests. J. Ecol. 2016, 104, 773–780. [Google Scholar] [CrossRef]
- Anderson-Teixeira, K.J.; Davies, S.J.; Bennett, A.C.; Gonzalez-Akre, E.B.; Muller-Landau, H.C.; Joseph Wright, S.; Abu Salim, K.; Almeyda Zambrano, A.M.; Alonso, A.; Baltzer, J.L.; et al. CTFS-Forest GEO: A worldwide network monitoring forests in an era of global change. Glob. Chang. Biol. 2015, 21, 528–549. [Google Scholar] [CrossRef] [Green Version]
- Lutz, J.A. The evolution of long-term data for forestry: Large temperate research plots in an era of global change. Northwest Sci. 2015, 89, 255–269. [Google Scholar] [CrossRef] [Green Version]
- Lutz, J.A.; Van Wagtendonk, J.W.; Franklin, J.F. Climatic water deficit, tree species ranges, and climate change in Yosemite National Park. J. Biogeogr. 2010, 37, 936–950. [Google Scholar] [CrossRef]
- Van Wagtendonk, J.W.; Moore, P.E.; Yee, J.L.; Lutz, J.A. The distribution of woody species in relation to climate and fire in Yosemite National Park, California, USA. Fire Ecol. 2020, 16, 1–23. [Google Scholar] [CrossRef]
- Stavros, E.N.; Tane, Z.; Kane, V.R.; Veraverbeke, S.; McGaughey, R.J.; Lutz, J.A.; Ramirez, C.; Schimel, D. Unprecedented remote sensing data over King and Rim megafires in the Sierra Nevada Mountains of California. Ecology 2016, 97, 3244. [Google Scholar] [CrossRef]
- Lutz, J.A.; Matchett, J.R.; Tarnay, L.W.; Smith, D.F.; Becker, K.M.; Furniss, T.J.; Brooks, M.L. Fire and the distribution and uncertainty of carbon sequestered as aboveground tree biomass in Yosemite and Sequoia & Kings Canyon National Parks. Land 2017, 6, 10. [Google Scholar] [CrossRef] [Green Version]
- Cansler, C.A.; Swanson, M.E.; Furniss, T.J.; Larson, A.J.; Lutz, J.A. Fuel dynamics after reintroduced fire in an old-growth Sierra Nevada mixed-conifer forest. Fire Ecol. 2019, 15, 16. [Google Scholar] [CrossRef] [Green Version]
- Stoyan, D.; Stoyan, H. Fractals, Random Shapes, and Point Fields: Methods of Geometrical Statistics; John Wiley & Sons Inc.: Hoboken, NJ, USA, 1994; Volume 302. [Google Scholar]
- Illian, J.; Penttinen, A.; Stoyan, H.; Stoyan, D. Statistical Analysis and Modelling of Spatial Point Patterns; John Wiley & Sons: Hoboken, NJ, USA, 2008; Volume 70. [Google Scholar]
- Goreaud, F.; Pélissier, R. Avoiding misinterpretation of biotic interactions with the intertype K12-function: Population independence vs. random labelling hypotheses. J. Veg. Sci. 2003, 14, 681–692. [Google Scholar] [CrossRef]
- Harvey, P.H.; Colwell, R.K.; Silvertown, J.W.; May, R.M. Null models in ecology. Annu. Rev. Ecol. Syst. 1983, 14, 189–211. [Google Scholar] [CrossRef]
- Google Earth Pro 7.3. (December 8, 2017). Yosemite Forest Dynamic Plot, California, USA. 37.77° N, 119.92° W. Available online: http://www.google.com/earth/index.html (accessed on 21 July 2020).
- Wiegand, T.; Moloney, A.; Rings, K. Circles, and null-models for point pattern analysis in ecology. Oikos 2004, 104, 209–229. [Google Scholar] [CrossRef]
- Wiegand, T.; Gunatilleke, C.S.; Gunatilleke, I.N.; Huth, A. How individual species structure diversity in tropical forests. Proc. Natl. Acad. Sci. USA 2007, 104, 19029–19033. [Google Scholar] [CrossRef] [Green Version]
- Yetemen, O.; Istanbulluoglu, E.; Duvall, A.R. Solar radiation as a global driver of hillslope asymmetry: Insights from an ecogeomorphic landscape evolution model. Water Resour. Res. 2015, 51, 9843–9861. [Google Scholar] [CrossRef] [Green Version]
- Gibbons, J.; Newbery, D. Drought avoidance and the effect of local topography on trees in the understorey of Bornean lowland rain forest. Plant Ecol. 2003, 164, 1–18. [Google Scholar] [CrossRef]
- Stage, A.R.; Salas, C. Interactions of elevation, aspect, and slope in models of forest species composition and productivity. For. Sci. 2007, 53, 486–492. [Google Scholar]
- Baddeley, A.; Diggle, P.J.; Hardegen, A.; Lawrence, T.; Milne, R.K.; Nair, G. Spatial Point Patterns On tests of spatial pattern based on simulation envelopes. Ecol. Monogr. 2014, 84, 477–489. [Google Scholar] [CrossRef] [Green Version]
- Baddeley, A.; Rubak, E.; Turner, R. Spatial Point Pattern: Methodology and Applications with R.; Chapman and Hall CRC: London, UK, 2015; Available online: http://www.crcpress.com/Spatial-Point-Patterns-Methodology-and-Applications-with-R/Baddeley-Rubak-Turner/9781482210200/ (accessed on 15 November 2020).
- R Core Team. R: A Language and Environment for Statistical Computing. Version 3.6.3.; R Core Team: Vienna, Austria, 2020. [Google Scholar]
- Pinheiro, J.; Bates, D.; DebRoy, S.; Sarkar, D.; R Core Team. nlme: Linear and Nonlinear Mixed Effects Models. R Package Version 3.1-144. 2020. Available online: https://cran.r-project.org/web/packages/nlme/index.html (accessed on 15 November 2020).
- Batllori, E.; Camarero, J.J.; Gutiérrez, E. Current regeneration patterns at the tree line in the Pyrenees indicate similar recruitment processes irrespective of the past disturbance regime. J. Biogeogr. 2010, 37, 1938–1950. [Google Scholar] [CrossRef]
- Furniss, T.J.; Larson, A.J.; Lutz, J.A. Reconciling niches and neutrality in a subalpine temperate forest. Ecosphere 2017, 8, e01847. [Google Scholar] [CrossRef]
- Loosmore, N.B.; Ford, E.D. Statistical inference using the G or K point pattern spatial statistics. Ecology 2006, 87, 1925–1931. [Google Scholar] [CrossRef] [Green Version]
- De la Cruz Rot, M. Ecespa: Functions for Spatial Point Pattern Analysis. R Package Version 1.1-11. Available online: https://cran.r-project.org/web/packages/ecespa/index.html (accessed on 27 March 2020).
- Hubbell, S.P. Tree dispersion, abundance, and diversity in a tropical dry forest. Science 1979, 203, 1299–1309. [Google Scholar] [CrossRef] [Green Version]
- Habeck, R. Pinus lambertiana. Fire Effects Information System (Online); US Department of Agriculture, Forest Service, Rocky Mountain Research Station, Fire Sciences Laboratory (Producer). 1992. Available online: https://www.fs.fed.us/database/feis/plants/shrub/spibet/all.html (accessed on 15 November 2020).
- Hardy, O.J.; Sonké, B. Spatial pattern analysis of tree species distribution in a tropical rain forest of Cameroon: Assessing the role of limited dispersal and niche differentiation. For. Ecol. Manag. 2004, 197, 191–202. [Google Scholar] [CrossRef]
- Seidler, T.G.; Plotkin, J.B. Seed dispersal and spatial pattern in tropical trees. PLoS Biol. 2006, 4, e344. [Google Scholar] [CrossRef]
- Wang, X.; Ye, J.; Li, B.; Zhang, J.; Lin, F.; Hao, Z. Spatial distributions of species in an old-growth temperate forest, northeastern China. Can. J. For. Res. 2010, 40, 1011–1019. [Google Scholar] [CrossRef] [Green Version]
- Tamjidi, J.; Lutz, J.A. Soil Enzyme Activity and Soil Nutrients Jointly Influence Post-Fire Habitat Models in Mixed-Conifer Forests of Yosemite National Park, USA. Fire 2020, 3, 54. [Google Scholar] [CrossRef]
- Madrigal-González, J.; Zavala, M.A. Competition and tree age modulated last century pine growth responses to high frequency of dry years in a water limited forest ecosystem. Agric. For. Meteorol. 2014, 192, 18–26. [Google Scholar] [CrossRef]
- Molina, R.; O’Dell, T.; Luoma, D.; Amaranthus, M.; Castellano, M.; Russell, K. Biology, Ecology, and Social Aspects of Wild Edible Mushrooms in the Forests of the Pacific Northwest: A Preface to Managing Commercial Harvest; USDA Forest Service, Pacific Northwest Research Station: Portland, OR, USA, 1993; Volume 309.
- Johnson, D.J.; Clay, K.; Phillips, R.P. Mycorrhizal associations and the spatial structure of an old-growth forest community. Oecologia 2018, 186, 195–204. [Google Scholar] [CrossRef]
- Das, A.; Battles, J.; van Mantgem, P.J.; Stephenson, N.L. Spatial elements of mortality risk in old-growth forests. Ecology 2008, 89, 1744–1756. [Google Scholar] [CrossRef] [PubMed]
- Martínez, I.; Wiegand, T.; González-Taboada, F.; Obeso, J.R. Spatial associations among tree species in a temperate forest community in North-western Spain. For. Ecol. Manag. 2010, 260, 456–465. [Google Scholar] [CrossRef]
- Teste, F.P.; Simard, S.W.; Durall, D.M. Role of mycorrhizal networks and tree proximity in ectomycorrhizal colonization of planted seedlings. Fungal Ecol. 2009, 2, 21–30. [Google Scholar] [CrossRef]
- Lutz, J.; Larson, A.; Swanson, M. Advancing fire science with large forest plots and a long-term multidisciplinary approach. Fire 2018, 1, 5. [Google Scholar] [CrossRef] [Green Version]
- Larson, A.J.; Cansler, C.A.; Cowdery, S.G.; Hiebert, S.; Furniss, T.J.; Swanson, M.E.; Lutz, J.A. Post-fire morel (Morchella) mushroom abundance, spatial structure, and harvest sustainability. For. Ecol. Manag. 2016, 377, 16–25. [Google Scholar] [CrossRef]
- Jeronimo, S.M.; Lutz, J.A.; Kane, V.R.; Larson, A.J.; Franklin, J.F. Burn weather and three-dimensional fuel structure determine post-fire tree mortality. Landsc. Ecol. 2020, 35, 859–878. [Google Scholar] [CrossRef]
- Kane, V.R.; Cansler, C.A.; Povak, N.A.; Kane, J.T.; McGaughey, R.J.; Lutz, J.A.; Churchill, D.J.; North, M.P. Mixed severity fire effects within the Rim fire: Relative importance of local climate, fire weather, topography, and forest structure. For. Ecol. Manag. 2015, 358, 62–79. [Google Scholar] [CrossRef] [Green Version]
- Jeronimo, S.M.; Kane, V.R.; Churchill, D.J.; Lutz, J.A.; North, M.P.; Asner, G.P.; Franklin, J.F. Forest structure and pattern vary by climate and landform across active-fire landscapes in the montane Sierra Nevada. For. Ecol. Manag. 2019, 437, 70–86. [Google Scholar] [CrossRef]
- Ng, J.; North, M.P.; Arditti, A.J.; Cooper, M.R.; Lutz, J.A. Topographic variation in tree group and gap structure in Sierra Nevada mixed-conifer forests with active fire regimes. For. Ecol. Manag. 2020, 472, 118220. [Google Scholar] [CrossRef]
- Churchill, D.J.; Larson, A.J.; Dahlgreen, M.C.; Franklin, J.F.; Hessburg, P.F.; Lutz, J.A. Restoring forest resilience: From reference spatial patterns to silvicultural prescriptions and monitoring. For. Ecol. Manag. 2013, 291, 442–457. [Google Scholar] [CrossRef]
- Zald, H.S.; Gray, A.N.; North, M.; Kern, R.A. Initial tree regeneration responses to fire and thinning treatments in a Sierra Nevada mixed-conifer forest, USA. For. Ecol. Manag. 2008, 256, 168–179. [Google Scholar] [CrossRef]
- Johnson, P.S.; Shifley, S.R.; Rogers, R.; Dey, D.C.; Kabrick, J.M. The Ecology and Silviculture of Oaks; Cabi: Boston, MA, USA, 2019. [Google Scholar]
- Green, S.R.; Arthur, M.A.; Blankenship, B.A. Oak and red maple seedling survival and growth following periodic prescribed fire on xeric ridgetops on the Cumberland Plateau. For. Ecol. Manag. 2010, 259, 2256–2266. [Google Scholar] [CrossRef]
- Van Wilgen, B.W.; Richardson, D.M.; Kruger, F.J.; van Hensbergen, H.J. Fire in South African Mountain Fynbos: Ecosystem, Community and Species Response at Swartboskloof; Springer Science & Business Media: Berlin, Germany, 2012; Volume 93. [Google Scholar]
- Owen, S.M.; Sieg, C.H.; Meador, A.J.S.; Fulé, P.Z.; Iniguez, J.M.; Baggett, L.S.; Fornwalt, P.J.; Battaglia, M.A. Spatial patterns of ponderosa pine regeneration in high-severity burn patches. For. Ecol. Manag. 2017, 405, 134–149. [Google Scholar] [CrossRef]
- Ziegler, J.P.; Hoffman, C.M.; Fornwalt, P.J.; Sieg, C.H.; Battaglia, M.A.; Chambers, M.E.; Iniguez, J.M. Tree Regeneration Spatial Patterns in Ponderosa Pine Forests Following Stand-Replacing Fire: Influence of Topography and Neighbors. Forests 2017, 8, 391. [Google Scholar] [CrossRef] [Green Version]
- Fulé, P.Z.; Covington, W.W. Spatial patterns of Mexican pine-oak forests under different recent fire regimes. Plant Ecol. 1998, 134, 197–209. [Google Scholar] [CrossRef]
- Becker, K.M.; Lutz, J.A. Can low-severity fire reverse compositional change in montane forests of the Sierra Nevada, California, USA? Ecosphere 2016, 7, e01484. [Google Scholar] [CrossRef]
- Armesto, J.; Mitchell, J.; Villagran, C. A comparison of spatial patterns of trees in some tropical and temperate forests. Biotropica 1986, 18, 1–11. [Google Scholar] [CrossRef]
- Le, N.; Thi, D.; Van Thinh, N.; Mitlöhner, R. Effect of disturbance regimes on spatial patterns of tree species in three sites in a tropical evergreen forest in Vietnam. Int. J. For. 2016, 2016, 16. [Google Scholar]
- Larson, A.J.; Lutz, J.A.; Donato, D.C.; Freund, J.A.; Swanson, M.E.; HilleRisLambers, J.; Sprugel, D.G.; Franklin, J.F. Spatial aspects of tree mortality strongly differ between young and old-growth forests. Ecology 2015, 96, 2855–2861. [Google Scholar] [CrossRef] [Green Version]
- Bär, A.; Michaletz, S.T.; Mayr, S. Fire effects on tree physiology. New Phytol. 2019, 223, 1728–1741. [Google Scholar] [CrossRef] [Green Version]
- Davis, M.A.; Curran, C.; Tietmeyer, A.; Miller, A. Dynamic tree aggregation patterns in a species-poor temperate woodland disturbed by fire. J. Veg. Sci. 2005, 16, 167–174. [Google Scholar] [CrossRef]
- Hood, S.; Sala, A.; Heyerdahl, E.K.; Boutin, M. Low-severity fire increases tree defense against bark beetle attacks. Ecology 2015, 96, 1846–1855. [Google Scholar] [CrossRef] [PubMed] [Green Version]
Figure 1.
Locations of Yosemite National Park and Yosemite Forest Dynamic Plot (YFDP) in California (A,B). Topographic maps of the 25.6 ha plot including slope (°) (C), aspect (cosine of aspect) (D), and elevation (m) (E). Imagery from Google Earth 2020 [51].
Figure 1.
Locations of Yosemite National Park and Yosemite Forest Dynamic Plot (YFDP) in California (A,B). Topographic maps of the 25.6 ha plot including slope (°) (C), aspect (cosine of aspect) (D), and elevation (m) (E). Imagery from Google Earth 2020 [51].

Figure 2.
Results of different point process models of Abies concolor, Calocedrus decurrens, and Pinus lambertiana in 2019 in the Yosemite Forest Dynamic Plot. The color bars (A,D,G) indicate the spatial patterns under the homogeneous Poisson process (complete spatial randomness), (B,E,H) display the heterogeneous Poisson process (habitat heterogeneity), and (C,F,I) show the homogeneous Thomas process (dispersal limitation). Green, yellow, and violet colors show randomness, segregation, and clustering patterns, respectively.

Figure 3.
Intensity estimation (stem ha−1) for Abies concolor (A), Calocedrus decurrens (B), Pinus lambertiana (C), Quercus kelloggii (D), based on the slope, elevation, and aspect in 2019 in the Yosemite Forest Dynamic Plot. Black dots indicate the locations of observed stems within the Yosemite Forest Dynamic Plot.

Figure 4.
Left panels show the results of antecedent condition null model to assess the distribution of juveniles (1 cm ≤ dbh < 5 cm) around conspecific adults (individuals ≥ 20 cm dbh) in Abies concolor (A), Calocedrus decurrens (C), Pinus lambertiana (E), Quercus kelloggii (G) in 2019 in the Yosemite Forest Dynamic Plot. The right panels display the results of antecedent condition null model which was used to estimate the distribution of juveniles (1 cm ≤ dbh < 5 cm) of Abies concolor (B), Calocedrus decurrens (D), Pinus lambertiana (F), Quercus kelloggii (H), around other species adult trees (individuals ≥ 20 cm dbh) in 2019. Green, yellow, and violet colors show randomness, segregation, and clustering patterns, respectively.

Figure 5.
Comparison of juvenile (1 cm ≤ dbh < 5 cm) regeneration spatial patterns in seeder species (Abies concolor) and sprouting species (Quercus kelloggii) in 2013 (pre-fire), 2016 (post-fire), and 2019 (post-fire) in the Yosemite Forest Dynamic Plot. Green, yellow, and violet colors show randomness, segregation, and clustering patterns, respectively.

Figure 6.
Spatial pattern of pre-fire (2013) and post-fire (2016 and 2019) large-diameter trees (live and dbh ≥ 60 cm) within the Yosemite Forest Dynamic Plot. Green, yellow, and violet colors show randomness, segregation, and clustering spatial patterns, respectively.
Figure 6.
Spatial pattern of pre-fire (2013) and post-fire (2016 and 2019) large-diameter trees (live and dbh ≥ 60 cm) within the Yosemite Forest Dynamic Plot. Green, yellow, and violet colors show randomness, segregation, and clustering spatial patterns, respectively.

Figure 7.
Spatial pattern of the conspecific neighborhood around dead trees (survived the fire but died in 2015–2019) and live trees (survived throughout the time period 2015–2019) in Abies concolor (A), Calocedrus decurrens (B), Pinus lambertiana (C), and Quercus kelloggii (D) in the Yosemite Forest Dynamics Plot. The g(r) function indicates the pair correlation function, r is distance, and subscripts l, d, and a indicate live, dead, and all trees. Values above the simulation envelopes imply that live trees had more crowded conspecific neighborhoods than dead trees (conspecific negative density dependence). p-values are based on goodness-of-fit test implemented at distances of 0–4 m. The gray areas represent the simulation envelopes under the random labelling null model.


Table 1.
Overview of null models, their results, and explanations used to investigate the spatial structure of dominant tree species in the Yosemite Forest Dynamic Plot.
Table 1.
Overview of null models, their results, and explanations used to investigate the spatial structure of dominant tree species in the Yosemite Forest Dynamic Plot.
| Analysis | Null hypothesis | Results | Explanation |
|---|---|---|---|
| Complete Spatial randomness | Trees are randomly distributed. | Aggregation of trees (Figure 2). | Tree aggregation may be caused by seed dispersal, environmental heterogeneity, interaction, fire, and density dependence. |
| Inhomogeneous Poisson Process | Trees are spatially aggregated due to habitat preference. | Aggregation of all trees at scales ≤ 15 m (Figure 2). | Tree aggregations are based on habitat heterogeneity. |
| Homogeneous Thomas process | Trees are spatially aggregated at smaller distances due to seed dispersal limitations, especially in species with known restricted seed dispersal. | Spatial aggregation at scales < 5 m especially in species with restricted seed dispersal (Figure 2). | Tree aggregations are based on species dispersal limitations. |
| Antecedent condition null model | Juveniles are spatially aggregated around conspecific adults. | Juveniles are spatially aggregated around conspecific and heterospecific adults (Figure 4). | Facilitation due to habitat suitability, resilience promotion, mycorrhizal fungi, and reduced competition. |
| Random labeling | Conspecific density-dependent mortality exists among species. | Conspecific density- dependence mortality in Pinus lambertiana and positive density-dependence in Abies concolor at scales < 4 m (Figure 7). | Density-dependent mortality due to strong intraspecific competition, lower allocation on defense mechanisms, increased susceptibility to bark beetles and drought stress. |
Table 2.
The relative contributions of habitat heterogeneity and dispersal limitation for three abundant tree species (Abies concolor, Calocedrus decurrens, and Pinus lambertiana) in 2019 in the Yosemite Forest Dynamic Plot as judged by Akaike’s information criterion (AIC).
Table 2.
The relative contributions of habitat heterogeneity and dispersal limitation for three abundant tree species (Abies concolor, Calocedrus decurrens, and Pinus lambertiana) in 2019 in the Yosemite Forest Dynamic Plot as judged by Akaike’s information criterion (AIC).
| Best Model | <2 m | 2–5 m | 5–10 m | 10–20 m | 20–40 m | 40–60 m |
|---|---|---|---|---|---|---|
| Homogeneous Poisson process | 0% | 0% | 0% | 0% | 0% | 0% |
| Inhomogeneous Poisson process | 0% | 0% | 67% | 100% | 100% | 100% |
| Homogeneous Thomas process | 100% | 100% | 33% | 0% | 0% | 0% |
Publisher’s Note: MDPI stays neutral with regard to jurisdictional claims in published maps and institutional affiliations. |
© 2020 by the authors. Licensee MDPI, Basel, Switzerland. This article is an open access article distributed under the terms and conditions of the Creative Commons Attribution (CC BY) license (http://creativecommons.org/licenses/by/4.0/).
Share and Cite
MDPI and ACS Style
Tamjidi, J.; Lutz, J.A. The Post-Fire Assembly Processes of Tree Communities Based on Spatial Analysis of a Sierra Nevada Mixed-Conifer Forest. Fire 2020, 3, 72. https://0-doi-org.brum.beds.ac.uk/10.3390/fire3040072
AMA Style
Tamjidi J, Lutz JA. The Post-Fire Assembly Processes of Tree Communities Based on Spatial Analysis of a Sierra Nevada Mixed-Conifer Forest. Fire. 2020; 3(4):72. https://0-doi-org.brum.beds.ac.uk/10.3390/fire3040072
Chicago/Turabian StyleTamjidi, Jelveh, and James A. Lutz. 2020. "The Post-Fire Assembly Processes of Tree Communities Based on Spatial Analysis of a Sierra Nevada Mixed-Conifer Forest" Fire 3, no. 4: 72. https://0-doi-org.brum.beds.ac.uk/10.3390/fire3040072