
The Effect of Seeding Treatments and Climate on Fire Regimes in Wyoming Sagebrush Steppe


1
Department of Forest, Rangeland, and Fire Sciences, University of Idaho, Moscow, ID 83844, USA
2
Great Basin Rangelands Research Unit, Agricultural Research Service, Reno, NV 89512, USA
*
Author to whom correspondence should be addressed.
Fire 2021, 4(2), 16; https://0-doi-org.brum.beds.ac.uk/10.3390/fire4020016
Submission received: 23 February 2021
/
Revised: 11 March 2021
/
Accepted: 26 March 2021
/
Published: 27 March 2021
Abstract
:Wildfire size and frequency have increased in the western United States since the 1950s, but it is unclear how seeding treatments have altered fire regimes in arid steppe systems. We analyzed how the number of fires since 1955 and the fire return interval and frequency between 1995 and 2015 responded to seeding treatments, anthropogenic features, and abiotic landscape variables in Wyoming big sagebrush ecosystems. Arid sites had more fires than mesic sites and fire return intervals were shortest on locations first treated between 1975 and 2000. Sites drill seeded before the most recent fire had fewer, less frequent fires with longer fire return intervals (15–20 years) than aerially seeded sites (intervals of 5–8 years). The response of fire regime variables at unseeded sites fell between those of aerial and drill seeding. Increased moisture availability resulted in decreased fire frequency between 1994 and 2014 and the total number of fires since 1955 on sites with unseeded and aerially pre-fire seeding, but fire regimes did not change when drill seeded. Greater annual grass biomass likely contributed to frequent fires in the arid region. In Wyoming big sagebrush steppe, drill seeding treatments reduced wildfire risk relative to aerial seeded or unseeded sites.
1. Introduction
Fire regimes have changed considerably since the 1980s with increases in wildfire size and frequency across multiple ecosystems [1,2]. Climate change has led to shorter winters, decreased snowfall, shifts in precipitation regimes, and extended periods of drought, contributing to longer periods of fire risk [3,4,5]. Historical overgrazing and seed dispersal by livestock in arid lands and forests have contributed to annual grass invasions [6,7], and anthropogenic features, such as fuel breaks [7], roads, and utility lines [8], act as dispersal corridors. Global change has shifted many native plant communities to invasive-dominated communities, which promote fire [9,10]. Thus, climate change and annual grass cover increases have contributed to the increased numbers of large wildfires in the western United States [11,12], especially during periods of severe weather, such as dry lightning and strong winds [4,13]. Interactions among topography, climate change, fire history, invasive plants, and the difficulty in identifying vegetation with remote imagery provide uncertainty [14]; models predict increases in fire number, size, and fire season length [3,15,16,17] in the western United States. Fuel treatments may become insufficient to reduce future wildfire size, particularly during dry, windy conditions [4].
Sagebrush-dominated communities in the western United States once covered an estimated 38 million to 109 million ha [18]. Land use has converted 20% of these systems into private land, and grazing has impacted nearly all of the remaining sagebrush [19]. Invasive species also threaten the sagebrush steppe by altering the historical fire regimes [12,20,21]. In the United States’ Great Basin, fire regimes in sagebrush steppe ecosystems vary based on dominant sagebrush species. Within a sagebrush species, estimates of fire rotation or fire return vary due to the ranges of elevation found and regional climate variation [22]. For instance, one study estimated fire rotation for Artemisia arbuscula communities was 325–450 years [23] but could range from 93 to 187 in the Columbia Plateau and >1000 years in more xeric sites [22]. Artemisia tridentata subsp. vaseyana communities have a fire rotation of 70–217 years [23,24], but the lower elevation Artemisia tridentata subsp. wyomingensis ecosystems have fire rotations of 100-342 years [23,24]. Historical fires in Artemisia tridentata subsp. wyomingensis communities were larger, more continuous, stand-replacing fires than in Artemisia tridentata subsp. vaseyana communities [24].
Shifts in climate have favored a range expansion of the winter annual grass, Bromus tectorum (cheatgrass), an invasive species in the Intermountain West [25]. Consequently, B. tectorum has altered the historical fire regime in the Great Basin, leading to profound changes in fire size, frequency, and duration [12,21,26]. After a fire or other disturbance, B. tectorum takes advantage of the newly cleared space to recruit rapidly, increasing density and cover [10,27,28,29]. Even low B. tectorum cover will increase the chance of adjacent, non-invaded habitat burning in subsequent fires [26]. Models suggest climate change will increase the risk of B. tectorum invasion in Idaho, Montana, and Wyoming [25], making B. tectorum cover reduction by creating resistant plant communities an important goal of many fuels and post-fire rehabilitation treatments in the region [23,30].
Seeding treatments are commonly applied in the Great Basin to increase forage production, improve wildlife habitat, stabilize sites, and rehabilitate burned areas. Seed may be applied aerially from aircraft to avoid soil disturbance but may drop seeds in unfavorable habitat and decreases soil-seed contact limiting the likelihood of successful plant recruitment [31]. Drill seeding uses modified tractors to till the soil while simultaneously sowing seed [31]. Tilling soil may create microhabitats that promote desirable species recruitment, but the disturbance may also enhance B. tectorum recruitment [7,32]. Managers also combine aerial and drill seeding to enhance diversity and improve recruitment likelihood [31,33].
The plant species used in aerial and drill seeding treatments have changed since the mid-twentieth century. In the 1940s, nonnative bunchgrasses, typically Agropyron desertorum or A. cristatum, were drill seeded in monoculture or low diversity mixes to increase cattle forage throughout the sagebrush steppe [18,34,35], but aerial seeding was used infrequently [36,37]. In the mid-1980s, the United States Bureau of Land Management (BLM) switched to using the “Hycrest” crested wheatgrass cultivar (Agropyron desertorum X A. cristatum) in rangeland seeding treatments [36,38], which created larger plants with more blades and greater fecundity than either parent species [39]. During the 1970s in the Great Basin, the number and size of fires increased and half the seeding treatments were conducted after wildfires as part of rehabilitation efforts [36]. After 1990, the BLM conducted drill and aerial seeding treatments predominately after wildfires in the Great Basin [36]. In the nineties, the most common species used in rangeland seeding treatments were either Hycrest or Agropyron fragile (Siberian wheatgrass) [36]. The proportion of seeding treatments using native grasses, forbs, and Artemisia tridentata was limited before 1990 [36] but increased considerably after 2000 [36,40] in response to Executive Order 13112. The order required federal land management to use native rather than nonnative species, when possible. After 2000, the BLM also increased the agency’s use of native grasses and forbs in seeding treatments. [41]. Before 1990, the number of drill seeding treatments in the Great Basin was four times greater than aerial seeding treatments [36]. In the 1990s, the number of aerial and drill seedings were roughly equal [36]. Since 2000, managers used aerial seeding twice as often as drill seeding treatments [36]. Since 1980, the proportion of treatments using Artemisia species has doubled, and treatments including native grasses have quadrupled in the Great Basin [36]. The use of native species has created habitats more suitable for sagebrush obligate species, such as Centrocercus species (sage grouse), Brachylagus idahoensis (pygmy rabbit), and Artemisiospiza species (sparrows) [42,43,44,45,46] compared to sites dominated by nonnative species [47].
Increasing wildfire number and size in the sagebrush steppe requires a better understanding of the impact of environmental variables and land management practices on natural recovery, annual grass invasion, and rehabilitation efforts after fire [48]. For example, fuel breaks, green strips, and prescribed fires create disturbances that can provide suitable habitat for B. tectorum to establish [7,49] and invade into an intact habitat. Disturbances along roads and power line corridors provide suitable habitat and corridors for B. tectorum dispersal [8]. Studies suggest that livestock grazing can facilitate B. tectorum invasion by transmitting seeds and clearing or damaging existing vegetation through preferential grazing [50,51]. Increasing B. tectorum would lead to more frequent annual grass fires resulting in further shifts in the fire regime [12,21]. Few studies have examined the effects of seeding treatment practices on fire regimes in rangelands [52,53]. Recent studies have examined the effect of post-fire seeding treatments in the sagebrush steppe at large scales [40,47], but those efforts focus on sites with recovery after a single fire. It is unclear what effect multiple fires and management actions over decades might have on invasive species, plant communities, and/or shifts in fire regime attributes.
We examined the relationships among fire history, seeding treatments, and environmental characteristics to test the effect of those predictor variables on the response of fire regime variables. The fire regime variables we used as response variables included (1) the number of fires between 1955 and 2015, (2) the mean fire return interval between 1995 and 2015 (time between fires), and (3) the fire frequency between 1995 and 2015 (number of fires per unit time) [54]. Though the fire return interval and fire frequency are correlated, there are distinctions. Fire return interval, or mean fire return interval, is the average number of years between fires [55], which indicates the time available for species to recruit and establish communities between fires [36,37,56,57]. Fire frequency is the recurrence of fire in a given area over time [55] and is used in modeling [12,58,59,60,61] because it reflects the probability that a fire will occur in any one year. Our objective was to understand how climate, environmental characteristics, proximity to roads and private land (potential dispersal corridors of B. tectorum and sources of ignitions), and seeding treatments affect the fire regime characteristics; namely the total number of fires since 1955, as well as fire return interval and fire frequency between 1995 and 2015. We hypothesized that seeded sites would have (1) fewer fires, (2) longer mean fire return intervals, and (3) less frequent fires.
2. Materials and Methods
2.1. Site Description
The study area was 209,000 ha, located in southern Idaho, U.S.A., south of the Snake River (42.5° N, −115.4° W, Figure 1). Elevation in this region ranges from 750 to 1800 m increasing in elevation southward. Precipitation and snowfall increased as elevation increased (Figure 1). Climate data from Remote Automated Weather Stations (RAWS) in the study region show an increase in temperatures from 1962 to 2012; the timing and amount of rain and snow have also changed (Figure 2). Snow at all elevations has decreased since 1962. Precipitation has increased during the spring months across all elevations and decreased during summer months at near 800 m and in June near 1600 m.
The dominant shrub in the study area was Artemisia tridentata subsp. wyomingensis Beetle and Young (Wyoming big sagebrush). Artemisia thinning and removal from 1940 to 1980 to increase cattle forage and wildfires 1980-present have impacted the once-dominant vegetation, though some isolated patches remain [62]. The most common grass species were Poa secunda J. Presl (Sandberg bluegrass, hereafter Poa), Agropyron cristatum (L.) Gaertn (crested wheatgrass, hereafter Agropyron), and Bromus tectorum L. (cheatgrass or downy brome, hereafter Bromus). Other native bunchgrasses included Pseudoroegneria spicata (Pursh) Á. Löve (bluebunch wheatgrass), AchnatherumAchnatherum thurberianum (Piper) Barkworth (Thurber’s needlegrass, hereafter Achnatherum), and Elymus elymoides (Raf.) Swezey (squirreltail, hereafter Elymus). Poa cover was >15% at 70% of our sites and co-dominated with either Agropyron or Bromus. The historical fire rotation for Artemisia tridentata subsp. wyomingensis is estimated between 100 and 342 years, depending on the method used to estimate fire return [23,24]. Fires have burned most of the study area at least once, while other regions have burned up to seven times in the past 65 years [63].
Seeding treatment data was acquired from the Land Treatment Digital Library [38] and the Bureau of Land Management (BLM) [64,65]. Seeding treatments included aerial, drill, combined seeding, and unseeded treatments. Seeded species varied by treatment and year (see Section 1) [38,65]. As the number and size of wildfires increase in the 1980s [63], the BLM stopped thinning Artemisia stands and focused both aerial and drill seeding treatments on post-fire rehabilitation [38,64]. Seeded species for drill seeding treatments before 2000 were primarily low diversity seed mixes dominated by nonnative Agropyron species. After 2000, the proportion of seeding treatments using native grasses exceeded the use of nonnative grasses. Seeding treatments rarely included Artemisia tridentata prior to 1990, but 70% of seeding treatments included Artemisia after 2000. In our study area, aerial seeding was used primarily to seed shrubs species, although a small percentage of aerial seed mixes also included grasses and forbs when seeded on Wilderness Management Areas or rocky sites.
2.2. Data Extraction
We used ArcMap 10.3 software (ESRI) to generate 4000 random points across our study site with a minimum of 1 km distance between points. We eliminated points on features BLM land managers would never treat such as roads and highways [66], water features (e.g.- rivers, ponds, reservoirs) [67], and land owned not owned by the agency [68] by reviewing data extracted using the Intersection tool. We then removed points not located in pixels designated as “Wyoming Big Sagebrush-Wheatgrass” in “Group Name” category of LANDFIRE Environmental Site Potential Biophysical Settings raster [69]. The points were then verified using 1 m resolution orthorectified aerial imagery with a 6 m horizontal accuracy [70]. The result was 573 points (Figure 1a) used to extract data from polygon and raster layers. The response variables (fire number between 1955 and 2015, mean fire return interval 1995–2015, and mean fire frequency from 1995 to 2015) were derived from BLM fire polygon shapefiles [63]. Prescribed fires in the sagebrush steppe are much less common than wildfire, but we included prescribed fires when calculating the number of fires, if they occurred. The increased number and size of wildfires in the sagebrush steppe makes understanding the impact of environmental variables, seeding treatments, and potential sources of anthropogenic ignition sources on natural recovery and rehabilitation efforts after a fire imperative [48]. To address these concerns, we used information on seeding treatment history [64,65,71], climate [72], elevation [73], and proximity to anthropogenic features on the landscape [66,68] as explanatory variables. For a complete list of the 99 explanatory variables, see Table S1. Data extraction included unburned and burned sites. Unburned locations were typically unseeded or drill seeded, while burned areas could be unseeded or seeded via aerial, drill, or both methods.
2.3. Field Collection
Using 67 field sites from a concurrent field study conducted in 2014 and 2015, we collected standing herbaceous and woody biomass along the environmental gradient (Figure 1b). There were 11 unburned sites and 56 sites that burned one, two, three, or six times. We divided sites into the most recent treatment type (drill seeded, aerially seeded, or unseeded sites) nested within the number of fires that had occurred since 1950. The project did not include locations with both aerial and drill seeding conducted at the same time. Biomass was collected from six randomly placed 1 m2 quadrats within a 180 m2 location and classified into one of four functional groups: perennial bunchgrass, annual grass, forb, and shrubs. Biomass was air-dried in a closet for over a year.
2.4. Statistical Analysis
According to historical fire data from the BLM [63], there were few fires in our study area between 1900 and 1950. We defined fire number as the number of times a site burned in between 1955 and 2015. To determine how past vegetation management, fire history, and environmental conditions shaped the current fire regime characteristics, we defined fire return interval as the average number of years between fires from 1995 to 2015. We assigned sites that had burned only once during the 20-year period a fire return interval of 20 years. We labeled places that did not burn between 1995 and 2015 a fire return interval of 25 years. Fire frequency was determined by dividing the number of fires on a site over the twenty years from 1995 to 2015 by twenty.
We used a Nonparametric Multiplicative Regression (NPMR) in HyperNiche 2.3 [74] to determine how climate, seeding treatments, fire history, and proximity to anthropogenic features predicted the total number of fires since 1955, as well as the fire return interval and fire frequency between 1994 and 2014 (Table S1). The NPMR. evaluates how explanatory variables interact in nonlinear and multiplicative ways to alter the dependent variable and allows for the detection of nonlinear but significant relationships among explanatory and dependent variables. While Generalized Additive Models, Generalized Linear Models, and Multiple Linear Regression can analyze the relationship between response and explanatory variables, they can only handle a few potential explanatory variables. The accuracy of those analyses is limited to linear relationships. NPMR analyzes relationships between more variables and yields models that reflect nonlinear relationships [75].
Our NPMR used a quantitative local mean Gaussian weighting model. We assessed model fit using cross-validated R2 (xR2, Equation (1)), which a measure of the relationship between the residual sum of squares (RSS) and the total sum of squares (TSS) such that:
The xR2 uses a ‘‘leave-one-out’’ cross-validation and does not require withholding data for validation purposes [76]. To control overfitting, we set the model improvement criteria to a data-to-predictor ratio of ten, and a minimum of a 2% improvement was required to increase the number of variables in a model by an additional variable. Bootstrap resampling (each dataset resampled with replacement 100 times to generate 100 new datasets, each with n – 1 plots) was used to assess model stability against the inclusion of particular plots in a given analysis by providing an average xR2 (±SE) between the final model and 100 resampled datasets. We selected the models with the highest xR2 value, average neighborhood size (>10), and an improvement criterion of 2% [76].
Unlike traditional regression, NPMR does not fit coefficients in an equation. Instead, NPMR reports tolerances—the standard deviations used in the Gaussian smoothing. High tolerance values, relative to the predictor range, indicate a greater distance among points targeted for estimation. We report the average neighborhood size and sensitivity for each model. Neighborhood size is the average number of sample units contributing to the estimate of occupancy at each point on the modeled surface. Sensitivity indicates the relative importance of each quantitative predictor in the model. A sensitivity of 1 means that, on average, the percent change in the value of a predictor will result in a similar percentage change in the estimate of the response variable. In contrast, a sensitivity of 0 indicates the predictor does not affect the response variable. Since tolerance and sensitivity indicate how much the dependent variable changes in response to a predictor variable, sensitivity can only be calculated for continuous variables.
We examined the effect of 99 explanatory variables (Table S1) on fire regime characteristics (fire number, fire return interval, and fire frequency). We evaluated the models with the 100 greatest xR2 values, and we selected two to three models based on the predictor variables that appeared most frequently. We analyzed the sensitivity of the predictor variables and selected the model with the greatest sensitivity.
In the Great Basin, fire frequency and return interval are affected by the types and amount of available fuels, particularly annual grasses such as B. tectorum. We analyzed fuels composition (i.e., the types of fuels) and amount by collecting biomass in four functional groups (perennial bunchgrass, annual grass, forb, and shrubs). We analyzed the composition of functional group biomass using a Multi-Response Permutation Procedure (MRPP), a multivariate approach that analyzes the relationship among dependent variables (the biomass of four functional groups) and determines if there are differences among groups while allowing for an unbalanced design [77]. The MRPP compares the observed data to a randomized data. The MRPP measures the degree of separation among predetermined groups using the test statistic, T, which is the difference between the observed and expected weight mean within-group distance divided by the variance of the expected mean within group distances. A greater negative value of T indicates greater separation among groups. In MRPP, the A-statistic is the effect size of within group similarity compared to the expected similarity based on the randomized data. When A > 0 groups are more homogenous than chance by chance; A < 0 indicates groups are more heterogeneous than expected. The MRPP includes a pairwise comparison of individual groups but does not correct for multiple comparisons automatically. We used the Benjamini and Yekutieli false discovery rate (FDR) method described by Narum [78] to establish a conservative threshold for significance for the multiple comparison test (α = 0.0115). We conducted three MRPP analyses using predetermined groups based on (1) seeding treatment (aerial, drill, or unseeded), (2) four 250 m elevation ranges: low (770–1020 m), medium low (1021–1270 m), medium high (1271–1520 m), and high (1521–1780 m) and (3) seeding treatment nested within elevation bands [79]. Though the NPMR. data includes sites that received both aerial and drill seeding in the same treatment, the 67 sites used for acquiring biomass data used in the MRPP did not include such treatments. There were 11 unburned sites and 56 sites that burned one, two, three, or six times. Sites were divided into the most recent treatment type (drill seeded, aerially seeded, or unseeded sites) nested within the number of fires that had occurred since 1950. If one variable’s values are orders of magnitude greater it can skew the analysis, yielding results based primarily on that one variable. In our data, woody biomass was much greater than the biomass of the other three groups. To normalize data, biomass was square root transformed. We used a Jaccard distance measure to further decrease the influence of shrub biomass.
We used a Nonmetric Multidimensional Scaling (NMS) ordination with a Jaccard distance matrix to visualize relationships among MRPP groups (e.g., elevation, seeding treatment) within the ordination space determined by biomass. Drill seeded sites at 770–1020 m and 1521–1780 m had only one representative site each and were dropped from the analysis. Stress was determined by comparing observed data to randomized data 50 times using a stability criterion of 0.0001. We used an analysis of variance in MyStat 12 (Systat Software Inc) to evaluate if the biomass in one or more plant functional groups were different among elevation and treatment groups. Shapiro–Wilks test determined if the data was normally distributed and a Levene’s test was used to test for homoscedasticity. When biomass variables did not meet the assumptions for a parametric ANOVA, we used the Kruskal–Wallis Test.
3. Results
The number of fires since 1955 ranged from unburned to seven fires (Table 1). The fire return intervals ranged from 3 to 20 years, with 217 of the 573 locations not burning after 1995 (Table 1). Fire frequency between 1995 and 2014 varied from 0 to 0.3 with 150 sites burning with a frequency of 0.1 or greater (Table 1). Treatment history varied among locations with the total number of aerial seedings on a site ranging from 0 to 5 treatments and drill seedings ranging from 0 to 3 treatments (Table S2). The treatment history included 260 sites (45.3%) with some history of aerial seeding, but only 83 sites (14.5%) had two or more aerial seeding treatments since 1950. Sites were more likely to have a history of drill seeding treatments in our dataset. There were 309 sites (54%) with at least one drill seeding and 65 locations (11%) had more than one drill seeding treatment. Though there was a tendency for the number of aerial and drill seedings to increase with the number of fires (Table S3), the weighted average of aerial seeding treatments did not exceed two until there were more than six fires, and the weighted average of drill seeding treatments did not exceed one until the seventh fire (Figure S1).
The NPMR model that best predicted the number of fires between 1955 and 2015 consisted of the first year a site was burned, minimum spring vapor pressure deficit (VPD), total number of seeding treatments, and most recent seeding treatment method (Table 2). The number of fires was unaffected by vapor pressure deficit (VPD) for sites that first burned before 1990 (Figure 3a). For sites that burned for the first time after 1990, arid sites (greater spring VPD) tended to have more fires than more mesic sites. At sites that burned for the first time in 2014, the most arid sites burned 2.5 times on average while more mesic sites burned only once (Figure 3a). The number of fires increased with the number of seeding treatments regardless of the first year a site burned (Figure 3b). Fire number increased with greater numbers of treatments, particularly in areas with more arid spring weather; six treatments contributed to two fires at the most mesic sites and nearly four fires at more arid sites (Figure 3c).
The seeding treatment prior to the most recent fire (pre-fire) method had a significant effect on the modeled number of fires since 1955 (Figure 4). Sites that were drill seeded or aerial and drill seeded prior to the most recent fire tended to only burn twice; unseeded sites burned three to four times and aerial seeded sites burned three to five times (Figure 4a). Increasing aridity resulted in increased fire number for locations that were aerially seeded or unseeded prior to the most recent fire, but fire number at sites that were drill seeded, aerial, and drill seeded, or had no prior history of seeding treatments did not increase with aridity (Figure 4a). Fire number decreased as the year a site burned became more recent for aerially seeded treatments, but the number of fires for other pre-fire treatments were relatively unaffected by the year a site first burned (Figure 4b). Regardless of the number of historic treatments on a site, aerially seeded sites burned more times than other treatments (Figure 4c). On sites with one treatment, if the site was aerially seeded or left unseeded after the penultimate fire, there were three fires compared to two when drill seeded (Figure 4c). On sites with one treatment, drill seeded sites burned twice, while aerially seeded and unseeded sites burned three times (Figure 4c).
The NPMR model that best predicted the fire return interval between 1995 and 2015 consisted of four variables: the number of aerial seeding treatments, the first year a site was treated, the minimum spring VPD, and the pre-fire seeding method (Table 2). When the number of aerial seeding treatments increased, the fire return interval decreased across all levels of spring VPD but was reduced at high VPD (Figure 5a). On sites without aerial seeding treatments, the fire return interval was shortest on sites that first burned between 1975 and 1990 (Figure 5b). Adding aerial seeding treatments resulted in decreased fire return intervals, particularly at locations first treated before 1970 (Figure 5b). The fire return interval was shorter when on more arid sites regardless of the first time a site was treated (Figure 5c). Sites first treated in 1975–1995 had the shortest fire return interval on the most arid sites, while the shortest fire return interval on the more mesic sites were when the site was treated between 1985 and 1995 (Figure 5c).
As the number of aerial seeding treatments in a site’s treatment history increased, fire return intervals tended to decrease but varied according to seeding treatment type preceding the most recent fire (Figure 6a). The fire return interval was 20 years with drill seeding regardless of whether or not there was aerial seeding before the drill seeding (Figure 6a). For sites with both aerial and drill seeded prior to the most recent fire, the fire return interval decreased from 15 to 16 years with one aerial seeding treatment to 14 years with a history of two aerial seeding treatments (Figure 6a). The fire return interval decreased from 16 to 19 years when there was no aerial seeding to as little as 7 years when there was a history of two aerial seeding treatments (Figure 6a). When the most recent seeding treatment was aerial seeding, the fire return interval decreased from as much as 10 to as little as 5 years as the number of aerial seeding treatments increased (Figure 6a). On sites with a history of one aerial seeding, sites that were aerially seeded after the penultimate fire had the shortest fire return intervals (Figure 6a). Drill seeding in addition to aerial seeding increased the fire return interval, although fire return intervals were greater on sites that were only drill seeded (Figure 6a). For aerial seeded sites, the fire return interval increased as the first treatment year became more recent; however, fire return intervals decreased slightly when aerial and drill seeding were combined as first treatment year became more recent (Figure 6b). The fire return interval was unchanged for sites with drill seeding treatments regardless of when the site was first treated (Figure 6b) or across the spectrum of average minimum spring vapor pressure deficit (Figure 6c). Fire return interval decreased as the minimum spring VPD increased on unseeded or aerially seeded sites after the penultimate fire (Figure 6c). Fire return interval on drill only or aerial and drill seeding were unaffected by the increase in spring VPD (Figure 6c).
The NPMR model that best predicted fire frequency from 1995 to 2015 consisted of four variables: the number of drill seeding treatments, spring precipitation, the number of aerial seeding treatments, and the pre-fire seeding method (Table 2). Fire frequency decreased slightly as precipitation increased (Figure 7a,b). Fire frequency increased with the number of aerial seeding treatments with the greatest increase at high precipitation from a frequency of 0.02 (once every 50 years) to 0.18 (once every 5.5 years, Figure 7a). Fire frequency increased slightly as the number of drill seeding treatments increased with the greatest increase in fire frequency at low spring precipitation (Figure 7b). Fire frequency did not change as the number of drill seeded treatments increased when aerial seeding treatments were one or fewer (Figure 7c). Fire frequency decreased with increasing drill seedings when a site had three aerial seeding treatments (Figure 7c).
Sites varied in fire frequency based on the seeding treatment used after the prior fire. Fire frequency increased with the number of aerial seeding treatments, but the frequency was less when sites were drilled alone or in combination with aerial seeding treatments (Figure 8a). Fire frequency was greatest on sites aerially seeded after the penultimate fire regardless of whether there was one or two drill seeding treatments previously (Figure 8b). Fire frequency was similar on drill seeded or unburned and unseeded sites prior to the most recent fire and was not affected by spring precipitation (Figure 8c). Fire frequency was greater for aerial and drill seeded sites than sites with only drill seeding and showed a slight decrease as precipitation increased (Figure 8c). Variation in fire frequency for unseeded and aerially seeded sites decreased as precipitation increased (Figure 8c). Fire frequency for aerially seeded sites decreased as precipitation increased (Figure 8c).
Multi-response permutation procedure analysis showed there was no significant difference in biomass when grouped by most recent seeding treatment method (T = −1.10, A = 0.016, p = 0.13). Biomass components were significantly different along the elevational gradient (p = 0.007), but within group homogeneity was low (T = −3.17, A = 0.058), suggesting a high degree of variability. When sites were nested by treatment type within elevation, there was significant differences among groups and within group similarity increased (T = −3.08, A = 0.109, p = 0.004), but there was still considerable variation within treatment and elevation groups. The best fit NMS ordination had two axes that explained much of the variation (R2 = 0.9). The final stress was 11.7. Axis 1 was strongly correlated with shrub biomass and, to a lesser extent, perennial bunchgrass while axis 2 was strongly correlated with annual grass biomass and perennial bunchgrass (Table S4, Figure S2). The poor differentiation and within group variability with sites were grouped by elevation is demonstrated by the considerable overlap in ordination space (Figure 9).
The MRPP pairwise-comparisons, using the conservative α = 0.0115, showed biomass composition was significantly different between aerial seeded sites above 1521 m and four other groups: aerially seeded sites below 1020 m (T = −3.51, A = 0.211, p < 0.004); unseeded locations below 1020 m (T = −6.48, A = 0.247, p < 0.0002); aerially seeded sites between 1021 and 1270 m (T = −3.02, A = 0.096, p < 0.01) or 1271–1520 m (T = −3.92, A = 0.194, p < 0.003, see Table S5 for a complete list). Plant biomass composition at sites below 1020 m with no seeding treatment was the most variable, while aerial seeded sites between 1021 and 1270 m were the least variable, dominated by grasses (Figure 10a). Two plant functional groups were not normally distributed (annual grass W = 0.94, p = 0.005; shrub W = 0.93, p = 0.002) and the shrub biomass was heteroscedastic (W = 6.19, p < 0.001) requiring Kruskal–Wallis tests. Annual grass biomass was significantly different among seeding treatments and elevation groups (H(9) = 21.32, p = 0.01). Biomass among seeding treatments for bunchgrasses and shrubs tended to be different (bunchgrass F(9,55) = 1.86, p= 0.08; shrub H(9) = 15.91, p = 0.07), but there was no significant difference in forb biomass among treatments (F(9,55) = 1.29, p = 0.26). Bunchgrass and shrub biomass made up the largest biomass portion at sites above 1521 m, with annual grasses only found on aerially treated sites (Figure 10b). On aerial seeded sites below 1520 m, annual grass biomass comprised a more substantial proportion of biomass with little or no shrub biomass present (Figure 10b).
4. Discussion
Our research adds to a growing body of work that examines what shapes post-fire communities in the sagebrush steppe [54]. Artemisia tridentata subsp. wyomingensis communities exist in dry climates and require ≥ 80 years to recover to pre-fire levels of cover variability [23,24,80]. We found sites burned 2–7 times between 1955 and 2015 and the mean fire return intervals being as little as 3–5 years between 1995 and 2015 for aerial seeded sites. This makes the fire regime far outside the normal range of variability [23,24]. Pre-fire seeding treatment and site aridity consistently predicted fire regime characteristics. The number of seeding treatments predicted fire regime characteristics. The recovery rate in A. tridentata subsp. wyomingensis communities after a fire may increase with greater precipitation [81], but our results suggest a more nuanced effect. The effect of site moisture on fire regime characteristics was dependent on the type of seeding treatment used after a fire. Greater spring moisture had no effect on fire regime after drill seeding treatments; however, increased moisture—in the form of precipitation or lower vapor pressure deficit—resulted in fewer fires, lower fire frequency, and longer fire return intervals on aerial seeded sites. In our study area, precipitation increased, and vapor pressure deficit decreased, as elevation increased and resulted in cooler, more mesic summer conditions and longer, colder winters. Despite the elevation and climatic gradients, there was little differentiation in plant biomass when grouped by seeding treatment and elevation. When seeding treatments were nested in elevation, aerial treatments at high elevations showed differences with other treatments. Additionally, there was a difference in the amount of annual grass biomass along the elevation gradient.
The interaction between seeding treatment method and moisture availability suggests climatic influence over native bunchgrass and Bromus establishment likely contributed to the difference in fire regime characteristics. As moisture availability increased, fire number and fire frequency decreased at aerially seeded and unseeded sites but not at drill seeded sites. Established perennial bunchgrasses can inhibit Bromus plant growth [82,83], cover and density [84], but using aerial seeding is much less reliable at ensuring plant establishment than drill seeding [31]. Though the increase May rain since 1987 at low elevation sites may promote bunchgrass germination, rain between June and September has decreased since 1987, likely limiting the successful establishment of bunchgrasses [85,86,87] and opening habitat for Bromus establishment. In addition, mild winters with little snow at the low elevations and precipitation in May promote Bromus survival and fecundity [88,89]. Though native Vulpia species were present at the biomass collection sites, annual grass biomass was primarily composed of Bromus tectorum. Greater annual grass biomass at low elevations shown here demonstrates Bromus populations can take advantage of favorable growing conditions to increase their populations into the available space left open at lower elevation sites. Nonnative grasses can alter fire regime characteristics in a variety of native plant communities by increasing fire risk [26], creating continuous fuel beds [10], and/or increasing the likelihood of ignition [90] leading to increased fire frequency [12] and area burned [12]. That is particularly true of Bromus tectorum [20,21,26,91]. At high elevation sites, summer moisture appears adequate to promote bunchgrass establishment; when combined with snow accumulation and snow resident time, these climatic conditions likely decreased Bromus survival. The result is less annual biomass and fewer continuous fuels, and a shorter fire season that limit fires.
Fire regime characteristics were often determined by complex, nonlinear relationships between multiple variables. The effect of the year a site first burned, climate, and the total number of seeding treatments interacted to affect the number of fires. On sites that first burned prior to 1970, the number of fires did not change as the climate became drier, but the number of fires increased when the site first burned in or after 2000. This lack of change in the response of fire number before 1970 suggests a connection to changes in Bromus cover over time. Sites with that first burned prior to 1970 may have more time to recover from the fire. This is important because Bromus cover tends to higher in the years immediately following fire [27,92,93] and may decrease over time [94,95,96]. Bromus outcompetes bunchgrass seedlings [97,98,99], but some native species (e.g.-Poa secunda and Elymus multisetus) are able to establish or persist with Bromus [100,101]. If bunchgrasses establish, mature bunchgrasses can inhibit Bromus growth and reproduction [51,83,84], but the shift from a Bromus dominant community to a bunchgrass community could take decades [40,96]. In our study area, Bromus decreased as native bunchgrasses cover or density increased (unpublished data). Given the literature and our observations, it is likely bunchgrass communities on sites burned prior to 1970 had more mature bunchgrasses than recently burned sites that reduced Bromus cover consistent numbers of fires on sites burned before 1970 than more recently burn sites regardless of climate or the number of seeding treatments.
Fire return intervals responded differently from fire number to the interaction between time a site was first treated, climate, and the number of aerial treatments. The change in fire return interval had a markedly different relationship with time since first treated when the first seeding treatment occurred between 1970 to 1995 compared to the pre-1970 or post-1995 periods. That relationship suggests that changes in species composition used by the Bureau of Land Management in seed mixes for seeding treatments contributed to changes in fire return intervals. Agropyron desertorum, the dominant species used prior to 1970 [38,102], inhibits Bromus growth and seed production [82,84]. Bromus can recruit and survive in the presence of A. cristatum [99,103] and remain co-dominant in stands with A. cristatum and Poa secunda [104]. The increased use of A. cristatum after 1970 and Hycrest in the 1980s–1990s may have allowed Bromus to establish and even small amounts of Bromus cover can increase fire frequency [12,20,21]. The use of native grasses after 2000 has created a fire regime similar to the one created by treatments using A. desertorum.
The effect of the number of treatments on fire regime characteristics varied among treatment strategies. Sites with recent fires often received post-fire rehabilitation seeding treatments [38]; therefore, the number of treatments should increase as the number of fires increases. We found increasing the total number of seeding treatments on sites that first burned between 1965 and 1975 only increased the number of fires slightly, while fire numbers increased from one to three on sites that burned for the first time between 2005 and 2014. The number of fires and fire frequency increased as the number of treatments increased on sites where the pre-fire seeding treatment was aerial or unseeded but were unaffected when the most recent treatment included drill seeding. Aerial seeding grass species result in only low seeded species cover in forested systems [105]. In the sagebrush steppe, aerial seeding may increase nonnative perennial bunchgrasses at high elevations [40] but requires herbicide to reduce annual grass cover prior to seeding at low elevations [106]. One drawback of aerial seeding is the high potential of low seed-to-soil contact, resulting in low seeded species [31]. Great Basin native bunchgrass and forb recovery is not enhanced by aerial seeding after a fire [107]. Native species are inhibited when nonnative grasses, like A. cristatum, are included in the seed mix [40]. Aerial seeding does not increase Artemisia tridentata cover or density after a fire [33] even after two decades [40]. Drill seeding also had longer fire return intervals and lower fire frequency than other treatments in the last 20 years and mitigated the effect of aerial treatments. The number of fires on sites with drill and aerial treatments used in tandem was similar to those that were only drill seeded and had an intermediate fire return interval and fire frequency. Further, on sites that had aerial seedings in the past, treatments with both aerial and drill seedings before the most recent fire had in less frequent fires.
In our study area, the majority of recent aerial seed treatments included only A. tridentata seeded into recently burned, fire-resilient grasslands, such as Agropyron cristatum, A. fragile, or E. wawawaiensis [38]. The typical method of aerially seeding A. tridentata subsp. wyomingensis in the winter without drill seeding is unlikely to promote shrub establishment after fire [33]. In addition, the A. tridentata subsp. wyomingensis aerial seeding treatments in our study area were used on sites with established A. cristatum stands [38,64]. Agropyron cristatum outcompetes the seedlings of all A. tridentata subspecies [108], making it unlikely that A. tridentata subsp. wyomingensis will establish when aerially seeded into drill seeding treatments that used A. cristatum. Agropyron cristatum inhibits native forbs and grasses, leading to sites with low diversity or evenness [109,110,111] even when native species initially establish at the same rate as A. cristatum [112]. Therefore, sites seeded with both A. cristatum and native forbs and grasses in the 1980s and 1990s are unlikely to retain a diverse native species component. Since ‘Secar’ E. wawawaiensis is less palatable to cattle than other bunchgrasses used in recent post-fire rehabilitation seeding efforts [113,114] and avoided by goats [115], herbivore pressure on native forbs and other bunchgrasses likely increase on sites with E. wawawaiensis. This may shift the plant community to an unpalatable or invasive-dominated ecosystem [116], where fuels accumulate over time and create continuous fuel beds that promote more frequent fires. Whether the seeding included A. cristatum or E. wawawaiensis, the long-term result is a low diversity grassland that may be more susceptible to invasion by small-seeded, winter annual species [117], like Bromus.
Many factors may affect fire regimes, including average climate and interannual variation in weather [54,118], available fuels [119,120,121], historical fire management practices [52,53], and interactions between climate, fuels, and management [14]. There is a lack of understanding how seeding treatments affect fire regimes across arid landscapes [52,53,122]. Though some research has looked at post-fire seeding treatments after one fire [33,40,84,94,123], this study included sites with multiple wildfires and treatment histories over >50 years. Our results suggest that spring moisture is an important determinant of the fire regime, but the effect of spring moisture varies among seeding techniques. Spring moisture likely increased B. tectorum fecundity. Greater precipitation in May, could have stimulated germination of perennial bunchgrass, but the recent shifts in decreased precipitation between June and September would have increased water stress and mortality for seeded species. The consequence would be reduced bunchgrass establishment and less competition for B. tectorum in subsequent years, leading to increased B. tectorum establishment. As precipitation shifts and temperatures increase in the arid western United States, it may be necessary to provide additional summer water in the first year after seeding treatments to increase post-fire rehabilitation success.
Drill seeded sites had fewer fires over the 60-year study period and in recent years had longer fire return intervals and less frequent burns than aerial seeded sites. This trend did not differ along the moisture gradient and fire regimes on recently drilled sites had similar fire regimes to sites with older treatments. Aerially seeded sites had more frequent fires and were dominated by A. cristatum, E. wawawaiensis, or Bromus. The accumulation of fine fuels from Bromus combined with unconsumed, senesced A. cristatum and E. wawawaiensis likely contributed to frequent fires. Drill seeding helped mitigate the frequent and greater number of fires associated with aerial seeding treatments. If the goal is to minimize the number and frequency of fires [124], drill seeding larger areas with native bunchgrasses and forbs may help achieve that goal on drier sites historically dominated by A. tridentata subsp. wyomingensis. Additional treatments, such as the reduction of A. cristatum and E. wawawaiensis, may better establish diverse communities that are more palatable to livestock and wildlife, more resilient to Bromus invasion, and less prone to fire.
Supplementary Materials
The following are available online at https://0-www-mdpi-com.brum.beds.ac.uk/article/10.3390/fire4020016/s1, Figure S1: Treatment increase with fires; Figure S2: Contour plot of plant functional group biomass within the NMS; Table S1: List of potential explanatory variables; Table S2: Treatment histories information on sites used in the study; Table S3: Matrix of treatment and history; Table S4: NMS ordination Axis information; Table S5: MRPP multiple comparisons of significant differences among treatments.
Author Contributions
Conceptualization, C.B.-P. and B.A.N.; methodology, C.B.-P., B.A.N.; validation, C.B.-P., B.A.N., and E.K.S.; formal analysis, C.B.-P.; investigation, C.B.-P.; resources, B.A.N. and E.K.S.; data curation, C.B.-P.; writing—original draft preparation, C.B.-P.; writing—review and editing, C.B.-P., B.A.N., and E.K.S.; visualization, C.B.-P., B.A.N.; supervision, B.A.N. and E.K.S.; project administration, B.A.N. and E.K.S.; funding acquisition, C.B.-P., B.A.N., and E.K.S. All authors have read and agreed to the published version of the manuscript.
Funding
This project was funded by the Joint Fire Science Program (project numbers 14-1-01-7 and 15-2-01-22); N.A.S.A. Interdisciplinary Research in Earth Science Program (Award Number NNX11AO24G); 2014 Stillinger Herbarium Expedition Funds from the Stillinger Trust Foundation; and funding for undergraduate research assistance through the MILES Undergraduate Research Initiative.
Institutional Review Board Statement
Not applicable.
Informed Consent Statement
Not applicable.
Data Availability Statement
Data used in this paper is publicly available from several state and federal agencies. The data used and links to their sources area available in Table S1 in the Supplementary Material.
Acknowledgments
I would like to thank Robert Arkle and Bruce McCune for their assistance with learning Nonparametric Multiplicative Regression. I would also like to thank the technicians Brian Stultz, Karin Pacold, Jameson Rigg, Rebecca Glen, Jon Glueckert, Scott Nordstrom, Juan Ortiz, Jessie Dodge, Sue Birnbaum, Sharone Nehorai, Jenevieve Buckley, Abby Hale, Anne McGarvey, and Alex Greene.
Conflicts of Interest
The authors declare no conflict of interest. The funders had no role in the design of the study; in the collection, analyses, or interpretation of data; in the writing of the manuscript, or in the decision to publish the results.
References
- Goetz, S.J.; Mack, M.C.; Gurney, K.R.; Randerson, J.T.; Houghton, R.A. Ecosystem responses to recent climate change and fire disturbance at northern high latitudes: Observations and model results contrasting northern Eurasia and North America. Environ. Res. Lett. 2007, 2, 9. [Google Scholar] [CrossRef]
- Liu, Y.; Stanturf, J.; Goodrick, S. Trends in global wildfire potential in a changing climate. For. Ecol. Manag. 2010, 259, 685–697. [Google Scholar] [CrossRef]
- Littell, J.S.; McKenzie, D.; Peterson, D.L.; Westerling, A.L. Climate and wildfire area burned in western U.S. Ecoprovinces, 1916–2003. Ecol. Appl. 2009, 19, 1003–1021. [Google Scholar] [CrossRef] [PubMed]
- Gedalof, Z.E.; Peterson, D.L.; Mantua, N.J. Atmospheric, climatic, and ecological controls on extreme wildfire years in the northwestern United States. Ecol. Appl. 2005, 15, 154–174. [Google Scholar] [CrossRef]
- Cleetus, R.; Mulik, K. Playing with Fire: How Climate Change and Development Patterns Are Contributing to the Soaring Costs of Western Wildfires; Union of Concerned Scientists: Cambridge, MA, USA, 2014. [Google Scholar]
- Mack, R.N. Invasion of Bromus tectorum L. into Western North America: An ecological chronicle. Agro-Ecosystems 1981, 7, 145–165. [Google Scholar] [CrossRef]
- Keeley, J.E. Fire management impacts on invasive plants in the western United States. Conserv. Biol. 2006, 20, 375–384. [Google Scholar] [CrossRef]
- Bradley, B.A.; Mustard, J.F. Characterizing the landscape dynamics of an invasive plant and risk of invasion using remote sensing. Ecol. Appl. 2006, 16, 1132–1147. [Google Scholar] [CrossRef] [Green Version]
- Liu, Z.; Wimberly, M.C. Direct and indirect effects of climate change on projected future fire regimes in the western United States. Sci. Total Environ. 2016, 542, 65–75. [Google Scholar] [CrossRef] [Green Version]
- Brooks, M.L.; D’antonio, C.M.; Richardson, D.M.; Grace, J.B.; Keeley, J.E.; DiTomaso, J.M.; Hobbs, R.J.; Pellant, M.; Pyke, D. Effects of invasive alien plants on fire regimes. BioScience 2004, 54, 677–688. [Google Scholar] [CrossRef] [Green Version]
- Dennison, P.E.; Brewer, S.C.; Arnold, J.D.; Moritz, M.A. Large wildfire trends in the western United States, 1984–2011. Geophys. Res. Lett. 2014, 41, 2928–2933. [Google Scholar] [CrossRef]
- Fusco, E.J.; Finn, J.T.; Balch, J.K.; Nagy, R.C.; Bradley, B.A. Invasive grasses increase fire occurrence and frequency across US ecoregions. Proc. Natl. Acad. Sci. USA 2019, 116, 23594–23599. [Google Scholar] [CrossRef]
- Miller, J.D.; Skinner, C.N.; Safford, H.D.; Knapp, E.E.; Ramirez, C.M. Trends and causes of severity, size, and number of fires in northwestern California, USA. Ecol. Appl. 2011, 22, 184–203. [Google Scholar] [CrossRef]
- Hurteau, M.D.; Bradford, J.B.; Fulé, P.Z.; Taylor, A.H.; Martin, K.L. Climate change, fire management, and ecological services in the southwestern US. For. Ecol. Manag. 2014, 327, 280–289. [Google Scholar] [CrossRef]
- Barbero, R.; Abatzoglou, J.T.; Larkin, N.K.; Kolden, C.A.; Stocks, B. Climate change presents increased potential for very large fires in the contiguous United States. Int. J. Wildland Fire 2015, 24, 892–899. [Google Scholar] [CrossRef]
- Abatzoglou, J.T.; Kolden, C.A. Climate change in western US deserts: Potential for increased wildfire and invasive annual grasses. Rangel. Ecol. Manag. 2011, 64, 471–478. [Google Scholar] [CrossRef]
- McKenzie, D.; Gedalof, Z.E.; Peterson, D.L.; Mote, P. Climatic change, wildfire, and conservation. Conserv. Biol. 2004, 18, 890–902. [Google Scholar] [CrossRef]
- Blaisdell, J.P.; Murray, R.B.; McArthur, E.D. Managing Intermountain Rangelands—Sagebrush-Grass Ranges; US Department of Agriculture, Forest Service, Intermountain Forest and Range Experiment Station: Ogden, UT, USA, 1982; 41p.
- West, N.E. Managing for Biodiversity of Rangelands, in Biodiversity in Agroecosystems; Collins, W.W., Qualset, C.O., Eds.; CRC Press LLC: Boca Raton, FL, USA, 1999; pp. 101–126. [Google Scholar]
- Bradley, B.A.; Curtis, C.A.; Fusco, E.J.; Abatzoglou, J.T.; Balch, J.K.; Dadashi, S.; Tuanmu, M.N. Cheatgrass (Bromus tectorum) distribution in the intermountain western United States and its relationship to fire frequency, seasonality, and ignitions. Biol. Invasions 2018, 20, 1493–1506. [Google Scholar] [CrossRef] [Green Version]
- Balch, J.K.; Bradley, B.A.; D’Antonio, C.M.; Gómez-Dans, J. Introduced annual grass increases regional fire activity across the arid western USA (1980–2009). Glob. Chang. Biol. 2013, 19, 173–183. [Google Scholar] [CrossRef]
- Baker, W.L. Is wildland fire increasing in sagebrush landscapes of the western United States? Ann. Assoc. Am. Geogr. 2013, 103, 5–19. [Google Scholar] [CrossRef]
- Baker, W.L. Fire and restoration of sagebrush ecosystems. Wildl. Soc. Bull. 2006, 34, 177–185. [Google Scholar] [CrossRef]
- Bukowski, B.E.; Baker, W.L. Historical fire regimes, reconstructed from land-survey data, led to complexity and fluctuation in sagebrush landscapes. Ecol. Appl. 2013, 23, 546–564. [Google Scholar] [CrossRef] [PubMed]
- Bradley, B.A. Regional analysis of the impacts of climate change on cheatgrass invasion shows potential risk and opportunity. Glob. Chang. Biol. 2009, 15, 196–208. [Google Scholar] [CrossRef]
- Link, S.O.; Keeler, C.W.; Hill, R.W.; Hagen, E. Bromus tectorum cover mapping and fire risk. Int. J. Wildland Fire 2006, 15, 113–119. [Google Scholar] [CrossRef]
- West, N.E.; Hassan, M.A. Recovery of sagebrush-grass vegetation following wildfire. J. Range Manag. 1985, 38, 131–134. [Google Scholar] [CrossRef]
- Peterson, E.B. Mapping Percent-Cover of the Invasive Species Bromus Tectorum (Cheatgrass) over a Large Portion of Nevada from Satellite Imagery; Nevada Natural Heritage Program: Carson City, NV, USA, 2003. [Google Scholar]
- Jessop, B.D.; Anderson, V.J. Cheatgrass invasion in salt desert shrublands: Benefits of postfire reclamation. Rangel. Ecol. Manag. 2007, 60, 235–243. [Google Scholar] [CrossRef]
- Jewell, S. Secretarial Order 3336; Department of the Interior: Washington, DC, USA, 2015; p. 5.
- BLM. Burned Area Emergency Stabilization and Rehabilitation Manual, (BLM Handbook H-1742-1); U.S. Department of Interior, Bureau of Land Management: Washington, DC, USA, 2007; 80p.
- Merriam, K.E.; Keeley, J.E.; Beyers, J.L. Fuel breaks affect nonnative species abundance In Californian plant communities. Ecol. Appl. 2006, 16, 515–527. [Google Scholar] [CrossRef]
- Ott, J.E.; Cox, R.D.; Shaw, N.L. Comparison of postfire seeding practices for Wyoming big sagebrush. Rangel. Ecol. Manag. 2017, 70, 625–632. [Google Scholar] [CrossRef]
- Rogler, G.A.; Russell, J.L. Crested wheatgrass: Early history in the United States. J. Range Manag. 1983, 36, 91–93. [Google Scholar] [CrossRef]
- Vale, T.R. Sagebrush conversion projects: An element of contemporary environmental change in the Western United States. Biol. Conserv. 1974, 6, 274–284. [Google Scholar] [CrossRef]
- Pilliod, D.S.; Welty, J.L.; Toevs, G.R. Seventy-five years of vegetation treatments on public rangelands in the Great Basin of North America. Rangelands 2017, 39, 1–9. [Google Scholar] [CrossRef]
- Copeland, S.M.; Munson, S.M.; Pilliod, D.S.; Welty, J.L.; Bradford, J.B.; Butterfield, B.J. Long-term trends in restoration and associated land treatments in the southwestern United States. Restor. Ecol. 2018, 26, 311–322. [Google Scholar] [CrossRef]
- Pilliod, D.S.; Welty, J.L. Land Treatment Digital Library: U.S. Geological Survey Data Series 806. 2013. Available online: http://pubs.er.usgs.gov/publication/ds806;https://ltdl.wr.usgs.gov/ (accessed on 1 March 2013).
- Asay, K.H.; Dewey, D.R.; Gomm, F.B.; Johnson, D.A.; Carlson, J.R. Registration of ‘Hycrest’ crested wheatgrass. Crop Sci. 1985, 25, 368–369. [Google Scholar] [CrossRef]
- Knutson, K.C.; Pyke, D.A.; Wirth, T.A.; Arkle, R.S.; Pilliod, D.S.; Brooks, M.L.; Chambers, J.C.; Grace, J.B. Long-term effects of seeding after wildfire on vegetation in Great Basin shrubland ecosystems. J. Appl. Ecol. 2014, 51, 1414–1424. [Google Scholar] [CrossRef]
- Clinton, W. Executive Order 13112- Invasive Species. Fed. Regist. 1999, 64, 6183–6186. [Google Scholar]
- Knick, S.T.; Rotenberry, J.T. Ghosts of habitats past: Contribution of landscape change to current habitats used by shrubland birds. Ecology 2000, 81, 220–227. [Google Scholar] [CrossRef]
- Knick, S.T.; Dobkin, D.S.; Rotenberry, J.T.; Schroeder, M.A.; Vander Haegen, W.M.; Van Riper, C., III. Teetering on the Edge or Too Late? Conservation and Research Issues for Avifauna of Sagebrush Habitats. Condor 2003, 105, 611–634. [Google Scholar] [CrossRef]
- Knick, S.T. Historical development, principal federal legislation, and current management of sagebrush habitats: Implications for conservation, in Greater Sage-Grouse: Ecology and conservation of a landscape species and its habitats. Stud. Avian Biol. 2011, 38, 13–31. [Google Scholar]
- Connelly, J.W.; Schroeder, M.A.; Sands, A.R.; Braun, C.E. Guidelines to manage sage grouse populations and their habitats. Wildl. Soc. Bull. 2000, 28, 967–985. [Google Scholar]
- BLM. Management Considerations for Sagebrush (Artemisia) in the Western United States; U.S. Department of Interior, Bureau of Land Management: Washington, DC, USA, 2002; 73p.
- Arkle, R.S.; Pilliod, D.S.; Hanser, S.E.; Brooks, M.L.; Chambers, J.C.; Grace, J.B.; Knutson, K.C.; Pyke, D.A.; Welty, J.L.; Wirth, T.A. Quantifying restoration effectiveness using multi-scale habitat models: Implications for sage-grouse in the Great Basin. Ecosphere 2014, 5, 1–32. [Google Scholar] [CrossRef]
- Hulet, A.; Boyd, C.S.; Davies, K.W.; Svejcar, T.J. Prefire (preemptive) management to decrease fire-induced bunchgrass mortality and reduce reliance on postfire seeding. Rangel. Ecol. Manag. 2015, 68, 437–444. [Google Scholar] [CrossRef]
- Bradford, J.B.; Lauenroth, W.K. Controls over invasion of Bromus tectorum: The importance of climate, soil, disturbance and seed availability. J. Veg. Sci. 2006, 17, 693–704. [Google Scholar]
- Ponzetti, J.M.; McCune, B.; Pyke, D.A. Biotic soil crusts in relation to topography, cheatgrass and fire in the Columbia Basin, Washington. Bryologist 2007, 110, 706–722. [Google Scholar] [CrossRef]
- Reisner, M.D.; Grace, J.B.; Pyke, D.A.; Doescher, P.S. Conditions favouring Bromus tectorum dominance of endangered sagebrush steppe ecosystems. J. Appl. Ecol. 2013, 50, 1039–1049. [Google Scholar] [CrossRef] [Green Version]
- Martinson, E.J.; Omi, P.N. Fuel Treatments and Fire Severity: A Meta-Analysis; Res. Pap. RMRS-RP-103WWW; U.S. Department of Agriculture, Forest Service, Rocky Mountain Research Station: Fort Collins, CO, USA, 2013; 35p.
- Hudak, A.T.; Rickert, I.; Morgan, P.; Strand, E.; Lewis, S.A.; Robichaud, P.; Hoffman, C.; Holden, Z.A. Review of Fuels Treatment Effectiveness in Forests and Rangelands and a Case Study from the 2007 Megafires in Central Idaho, USA; Gen. Tech. Rep. RMRS-GTR-252; U.S. Department of Agriculture, Forest Service, Rocky Mountain Research Station: Fort Collins, CO, USA, 2011; 60p.
- Miller, R.F.; Chambers, J.C.; Pyke, D.A.; Pierson, F.B.; Williams, C.J. A Review of Fire Effects on Vegetation and Soils in the Great Basin Region: Resposnse and Ecological Site Characteristics; Gen. Tech. Rep. RMRS-GTR-308; U.S. Department of Agriculture, Forest Service, Rocky Mountain Research Station: Fort Collins, CO, USA, 2013; 126p.
- NWCG. Glossary of Wildland Fire Terminology; PMS 205; N.W.C. Group: Boise, ID, USA, 2012; p. 190.
- Strand, E.K.; Vierling, L.A.; Bunting, S.C.; Gessler, P.E. Quantifying successional rates in western aspen woodlands: Current conditions, future predictions. For. Ecol. Manag. 2009, 257, 1705–1715. [Google Scholar] [CrossRef]
- Strand, E.K.; Vierling, L.A.; Bunting, S.C. A spatially explicit model to predict future landscape composition of aspen woodlands under various management scenarios. Ecol. Model. 2009, 220, 175–191. [Google Scholar] [CrossRef]
- Sunderman, S.O.; Weisberg, P.J. Predictive modelling of burn probability and burn severity in a desert spring ecosystem. Int. J. Wildland Fire 2012, 21, 1014–1024. [Google Scholar] [CrossRef]
- Roth, A.D.; Bunting, S.C.; Strand, E.K. Relationships between landscape patterns and fire occurrence within a successional gradient in sagebrush steppe–juniper woodland. Int. J. Wildland Fire 2011, 20, 69–77. [Google Scholar] [CrossRef]
- Peeler, J.L.; Smithwick, E.A.H. Exploring invasibility with species distribution modeling: How does fire promote cheatgrass (Bromus tectorum) invasion within lower montane forests? Divers. Distrib. 2018, 24, 1308–1320. [Google Scholar] [CrossRef] [Green Version]
- Ottmar, R.D.; Sandberg, D.V.; Riccardi, C.L.; Prichard, S.J. An overview of the fuel characteristic classification system—Quantifying, classifying, and creating fuelbeds for resource planning. Can. J. For. Res. 2007, 37, 2383–2393. [Google Scholar] [CrossRef]
- Welch, B.L. Big Sagebrush: A Sea Fragmented into Lakes, Ponds, and Puddles; General Technical Report RMRS-GTR-144; U.S. Department of Agriculture, Forest Service, Rocky Mountain Research Station: Fort Collins, CO, USA, 2005; 210p.
- BLM. Historic Fire Perimeter; U.S. Department of the Interior (DOI), Bureau of Land Management, Idaho State Office: Boise, ID, USA, 2015. Available online: https://catalog.data.gov/dataset/fire-perimeters-historic-polygon (accessed on 1 March 2015).
- NOC. Completed Vegetation Treatments; U.S. Department of the Interior (DOI), Bureau of Land Management, Idaho State Office, GIS Staff: Denver, CO, USA, 2014. Available online: https://catalog.data.gov/dataset/vegetation-treatment-area-completed-polygonbd74a (accessed on 1 March 2015).
- BLM. Bureau of Land Management EPlanning Project Search. 2019. Available online: https://eplanning.blm.gov/ (accessed on 1 October 2019).
- Division, Geospatial. TIGER 2015 Roads; USDA Geospatial Data Gateway; U.S. Department of Commerce: Washington, DC, USA, 2015.
- Excellence, National Geospatial Center of National Hydrography Dataset; USA Natural Resources Conservation Service: Washington, DC, USA, 2012.
- BLM. BLM Idaho Surface Management Agency (Surface Ownership); Bureau of Land Management; U.S. Department of Interior, Idaho State Office: Boise, ID, USA, 2015.
- LandFire, 2014 Biophysical Settings. Available online: https://www.landfire.gov/bps.php (accessed on 1 January 2014).
- NAIP. National Agriculture Imagery Program; USA Farm Service Agency: Washington, DC, USA, 2015.
- Hilty, J. DOI-BLM-ID-T010-2012-0020-DNA (Kinyon Road Fire (G1CH) Emergency Stabilization and Burned Area Rehabilitation (ES&BAR) Plan). 2012. Available online: https://eplanning.blm.gov/epl-front-office/eplanning/projectSummary.do?methodName=renderDefaultProjectSummary&projectId=33702 (accessed on 1 June 2013).
- PRISM. PRISM Climate Group. Oregon State University. 2014. Available online: http://prism.oregonstate.edu (accessed on 1 May 2014).
- Center, E.D. National Elevation Dataset; U.S. Geological Survey; 2013. Available online: https://datagateway.nrcs.usda.gov (accessed on 1 March 2013).
- McCune, B.; Mefford, M.J. HyperNiche: Nonparametric Multiplicative Habitat Modeling; Version 2.30; MjM Software: Gleneden Beach, OR, USA, 2009. [Google Scholar]
- McCune, B. Non-parametric habitat models with automatic interactions. J. Veg. Sci. 2006, 17, 819–830. [Google Scholar] [CrossRef]
- McCune, B. Nonparametric Multiplicative Regression for Habitat Modeling. 2011. Available online: http://www.pcord.com/NPMRintro.pdf (accessed on 1 May 2016).
- McCune, B.; Grace, J.B. Analysis of Ecological Communities; MjM Software Design: Gleneden Beach, OR, USA, 2002. [Google Scholar]
- Narum, S.R. Beyond Bonferroni: Less conservative analyses for conservation genetics. Conserv. Genet. 2006, 7, 783–787. [Google Scholar] [CrossRef]
- McCune, B.; Mefford, M. PC-ORD. Multivariate Analysis of Ecological Data; Version 7.02; MjM Software: Gleneden Beach, OR, USA, 2016. [Google Scholar]
- Welch, B.L.; Criddle, C. Countering Misinformation Concerning Big Sagebrush; Research Paper RMRS-RP-40; U.S. Department of Agriculture, Forest Service, Rocky Mountain Research Station: Ogden, UT, USA, 2003; p. 28.
- Shinneman, D.J.; McIlroy, S.K. Identifying key climate and environmental factors affecting rates of post-fire big sagebrush Artemisia tridentata recovery in the northern Columbia Basin, USA. Int. J. Wildland Fire 2016, 25, 933–945. [Google Scholar] [CrossRef]
- Yoder, C.; Caldwell, M. Effects of perennial neighbors and nitrogen pulses on growth and nitrogen uptake by Bromus tectorum. Plant Ecol. 2002, 158, 77–84. [Google Scholar] [CrossRef]
- Blank, R.R.; Morgan, T. Suppression of Bromus tectorum L. by established perennial grasses: Potential mechanisms part one. Appl. Environm. Soil Sci. 2012, 2012, 9. [Google Scholar]
- Davies, K.W.; Johnson, D.D. Established perennial vegetation provides high resistance to reinvasion by exotic annual grasses. Rangel.Ecol. Manag. 2017, 70, 748–754. [Google Scholar] [CrossRef]
- Svejcar, T.; Boyd, C.; Davies, K.; Hamerlynck, E.; Svejcar, L. Challenges and limitations to native species restoration in the Great Basin, USA. Plant Ecol. 2017, 218, 81–94. [Google Scholar] [CrossRef]
- James, J.J.; Svejcar, T.J.; Rinella, M.J. Demographic processes limiting seedling recruitment in arid grassland restoration. J. Appl. Ecol. 2011, 48, 961–969. [Google Scholar] [CrossRef]
- Boyd, C.S.; Lemos, J.A. Evaluating winter/spring seeding of a native perennial bunchgrass in the sagebrush steppe. Rangel. Ecol. Manag. 2015, 68, 494–500. [Google Scholar] [CrossRef]
- Dyer, A.R.; Hardison, J.L.; Rice, K.J. Phenology constrains opportunistic growth response in Bromus tectorum L. Plant Ecol. 2012, 213, 103–112. [Google Scholar] [CrossRef]
- Compagnoni, A.; Adler, P.B. Warming, soil moisture, and loss of snow increase Bromus tectorum’s population growth rate. Elem. Sci. Anthr. 2014, 2, 1–10. [Google Scholar] [CrossRef] [Green Version]
- Fusco, E.J.; Abatzoglou, J.T.; Balch, J.K.; Finn, J.T.; Bradley, B.A. Quantifying the human influence on fire ignition across the western USA. Ecol. Appl. 2016, 26, 2390–2401. [Google Scholar] [CrossRef] [PubMed] [Green Version]
- Davies, K.W.; Nafus, A.M. Exotic annual grass invasion alters fuel amounts, continuity, and moisture content. Int. J. Wildland Fire 2013, 22, 353–358. [Google Scholar] [CrossRef]
- Boyte, S.P.; Wylie, B.K.; Major, D.J. Mapping and monitoring cheatgrass dieoff in rangelands of the northern Great Basin, USA. Rangel. Ecol. Manag. 2015, 68, 18–28. [Google Scholar] [CrossRef]
- Akinsoji, A. Postfire vegetation dynamics in a sagebrush steppe in southeastern Idaho, USA. Vegetatio 1988, 78, 151–155. [Google Scholar] [CrossRef]
- Pyke, D.A.; Wirth, T.A.; Beyers, J.L. Does seeding after wildfires in rangelands reduce erosion or invasive species? Restor. Ecol. 2013, 21, 415–421. [Google Scholar] [CrossRef]
- West, N.E.; Yorks, T.P. Vegetation responses following wildfire on grazed and ungrazed sagebrush semi-desert. J. Range Manag. 2002, 55, 171–181. [Google Scholar] [CrossRef]
- Morris, L.R.; Leger, E.A. Secondary succession in the sagebrush semidesert 66 years after fire in the Great Basin, USA. Natl. Areas J. 2016, 36, 187–193. [Google Scholar] [CrossRef]
- Mangla, S.; Sheley, R.L.; James, J.J.; Radosevich, S.R. Intra and interspecific competition among invasive and native species during early stages of plant growth. Plant Ecol. 2011, 212, 531–542. [Google Scholar] [CrossRef]
- Ray-Mukherjee, J.; Jones, T.A.; Adler, P.B.; Monaco, T.A. Immature seedling growth of two North American native perennial bunchgrasses and the invasive grass Bromus tectorum. Rangel. Ecol. Manag. 2011, 64, 358–365. [Google Scholar] [CrossRef]
- Aguirre, L.; Johnson, D.A. Influence of temperature and cheatgrass competition on seedling development of two bunchgrasses. J. Range Manag. 1991, 44, 347–354. [Google Scholar] [CrossRef]
- Goergen, E.M.; Leger, E.A.; Espeland, E.K. Native perennial grasses show evolutionary response to Bromus tectorum (cheatgrass) invasion. PLoS ONE 2011, 6, e18145. [Google Scholar] [CrossRef] [PubMed] [Green Version]
- Phillips, A.J.; Leger, E.A. Plastic responses of native plant root systems to the presence of an invasive annual grass. Am. J. Bot. 2015, 102, 73–84. [Google Scholar] [CrossRef] [Green Version]
- Hull, A.C.; Klomp, G.J. Longevity of crested wheatgrass in the sagebrush-grass type in southern Idaho. J. Range Manag. 1966, 19, 5–11. [Google Scholar] [CrossRef]
- Arredondo, J.T.; Jones, T.A.; Johnson, D.A. Seedling growth of intermountain perennial and weedy annual grasses. J. Range Manag. 1998, 51, 584–589. [Google Scholar] [CrossRef] [Green Version]
- Bowman-Prideaux, C.; Newingham, B.A.; Strand, E.K. The effects of fire history, post-fire rehabilitation, and environmental factors on shrub steppe communities. In preparation.
- Hunter, M.E.; Omi, P.N.; Martinson, E.J.; Chong, G.W. Establishment of non-native plant species after wildfires: Effects of fuel treatments, abiotic and biotic factors, and post-fire grass seeding treatments. Int. J. Wildland Fire 2006, 15, 271–281. [Google Scholar] [CrossRef]
- Wirth, T.A.; Pyke, D.A. Effectiveness of Post-Fire Seeding at the Fitzner-Eberhardt Arid Land Ecology Reserve; Geological Survey Open-File Report 2011-1241; U.S. Geological Survey: Reston, VA, USA, 2011.
- Bruce, L.B.; Perryman, B.; Conley, K.; McAdoo, K. Case Study: Grazing Management on Seeded and Unseeded Post-Fire Public Rangelands. Prof. Anim. Sci. 2007, 23, 285–290. [Google Scholar] [CrossRef]
- Newhall, R.; Rasmussen, V.P.; Kitchen, B. Introducing big sagebrush into a crested wheatgrass monoculture. Natl. Resour. Environ. Issues 2011, 17, 26. Available online: http://digitalcommons.usu.edu/nrei/vol17/iss1/26 (accessed on 30 January 2012).
- Marlette, G.M.; Anderson, J.E. Seed banks and propagule dispersal in crested-wheatgrass stands. J. Appl. Ecol. 1986, 23, 161–175. [Google Scholar] [CrossRef]
- Gunnell, K.L. Seed Banks of Sagebrush Communities Seeded with Crested Wheatgrass. Master’s Thesis, Utah State University, Logan, UT, USA, 2009. Available online: http://digitalcommons.usu.edu/etd/250 (accessed on 6 April 2013).
- Pellant, M.; Lysne, C.R. Strategies to enhance plant structure and diversity in crested wheatgrass seedings. In Proceedings of the Sage-Grouse Habitat Restoration Symposium Proceedings, Boise, ID, USA, 4–7 June 2001; Shaw, N.L., Pellant, M., Monsen, S.B., Eds.; U.S. Department of Agriculture, Forest Service, Rocky Mountain Research Station: Fort Collins, CO, USA, 2005. [Google Scholar]
- Nafus, A.M.; Svejcar, T.J.; Ganskopp, D.C.; Davies, K.W. Abundances of coplanted native bunchgrasses and crested wheatgrass after 13 Years. Rangel. Ecol. Manag. 2015, 68, 211–214. [Google Scholar] [CrossRef]
- Ganskopp, D.; Myers, B.; Lambert, S.; Cruz, R. Preferences and behavior of cattle grazing 8 varieties of grasses. J. Range Manag. 1997, 50, 578–586. [Google Scholar] [CrossRef]
- Jones, T.A.; Michael, H.R.; Dale, C.N. Cattle preference for 4 wheatgrass taxa. J. Range Manag. 1994, 47, 119–122. [Google Scholar] [CrossRef]
- Ganskopp, D.; Richman, L.; Johnson, D.; Angell, R.; Cruz, R. Preferences of Angora goats for eight selections of grasses used for reclamation of Great Basin rangelands. Small Rumin. Res. 1996, 19, 103–112. [Google Scholar] [CrossRef]
- Orrock, J.; Witter, M. Multiple drivers of apparent competition reduce re-establishment of a native plant in invaded habitats. Oikos 2010, 119, 101–108. [Google Scholar] [CrossRef]
- Roscher, C.; Gerighausen, U.; Schmid, B.; Schulze, E.D. Plant diversity and community history shift colonization success from early-to mid-successional species. J. Plant Ecol. 2015, 8, 231–241. [Google Scholar] [CrossRef] [Green Version]
- Pilliod, D.S.; Welty, J.L.; Arkle, R.S. Refining the cheatgrass-fire cycle in the Great Basin: Precipitation timing and fine fuel composition predict wildfire trends. Ecol. Evol. 2017, 7, 8126–8151. [Google Scholar] [CrossRef] [PubMed]
- Strand, E.K.; Launchbaugh, K.L.; Limb, R.F.; Torell, L.A. Livestock grazing effects on fuel loads for wildland fire in sagebrush dominated ecosystems. J. Rangel. Appl. 2014, 1, 35–57. [Google Scholar]
- Davies, K.W.; Vavra, M.; Schultz, B.W.; Rimbey, N.R. Implications of longer term grazing rest in the sagebrush steppe. J. Rangel. Appl. 2014, 1, 14–34. [Google Scholar]
- Chambers, J.C.; Miller, R.F.; Board, D.I.; Pyke, D.A.; Roundy, B.A.; Grace, J.B.; Schupp, E.W.; Tausch, R.J. Resilience and resistance of sagebrush ecosystems: Implications for state and transition models and management treatments. Rangel. Ecol. Manag. 2014, 67, 440–454. [Google Scholar] [CrossRef] [Green Version]
- Davies, K.W.; Bates, J.D.; Svejcar, T.J.; Boyd, C.S. Effects of long-term livestock grazing on fuel characteristics in rangelands: An example from the sagebrush steppe. Rangel. Ecol. Manag. 2010, 63, 662–669. [Google Scholar] [CrossRef]
- Williams, J.R.; Morris, L.R.; Gunnell, K.L.; Johanson, J.K.; Monaco, T.A. Variation in sagebrush communities historically seeded with crested wheatgrass in the eastern Great Basin. Rangel. Ecol. Manag. 2017, 70, 683–690. [Google Scholar] [CrossRef]
- Jewell, S. An integrated rangeland fire management strategy. In Final Report to the Secretary of the Interior; Department of the Interior: Washington, DC, USA, 2015; p. 94. [Google Scholar]
Figure 1.
The study area located in southern Idaho, U.S.A., the center of which is approximately 65 km due west of Twin Falls. Red squares (a) indicate locations where we extracted fire regime characteristics and environmental data from geospatial layers along the elevation gradient (n = 573). We collected biomass from 67 field locations (b) along the precipitation gradient (n = 67). We indicate the location of weather stations used in examining regional climate: Bruneau (a,b), Muphy Hot Springs (MS), and Three Creek (3C).

Figure 2.
The 25-year mean (±SE) monthly climate data for the low and high elevation sites in our study area. The snowfall (a,b) and precipitation (c,d) near low (a,c) and high elevation (b,d) sites. The average monthly mean low temperatures (e) and high temperatures (f) for low and high elevation sites. Low elevation climate data from Remote Automated Weather Stations in Bruneau, Idaho (770 m, station ID 101195); high elevation climate data for 1962–1987 from Three Creek, Idaho (3C, 1655 m, station ID 109119) and after 1987 from Murphy Hot Springs, Idaho (M, 1572 m, station ID 106250). We downloaded data from the Western Regional Climate Center at the Desert Research Institute (https://wrcc.dri.edu/summary/Climsmsid.html (accessed on 1 March 2015)). The Bruneau RAWS recorded data from 1962 to 2012 with the mean monthly averages based on a sample size of 23–25 years for each period. The Three Creek RAWS site was discontinued in 1987; the monthly average was based on a sample size of 20–25 years. The Murphy RAWS was the nearest location to Three Creek and established in December 1987. Missing data between 1987 and 2012 resulted in a smaller sample size (n = 12–15 years); we include data from 1987 to 2019 to increase the sample size (n = 20–23 years), so the data would be based on similar numbers of years as both Bruneau and Three Creek.
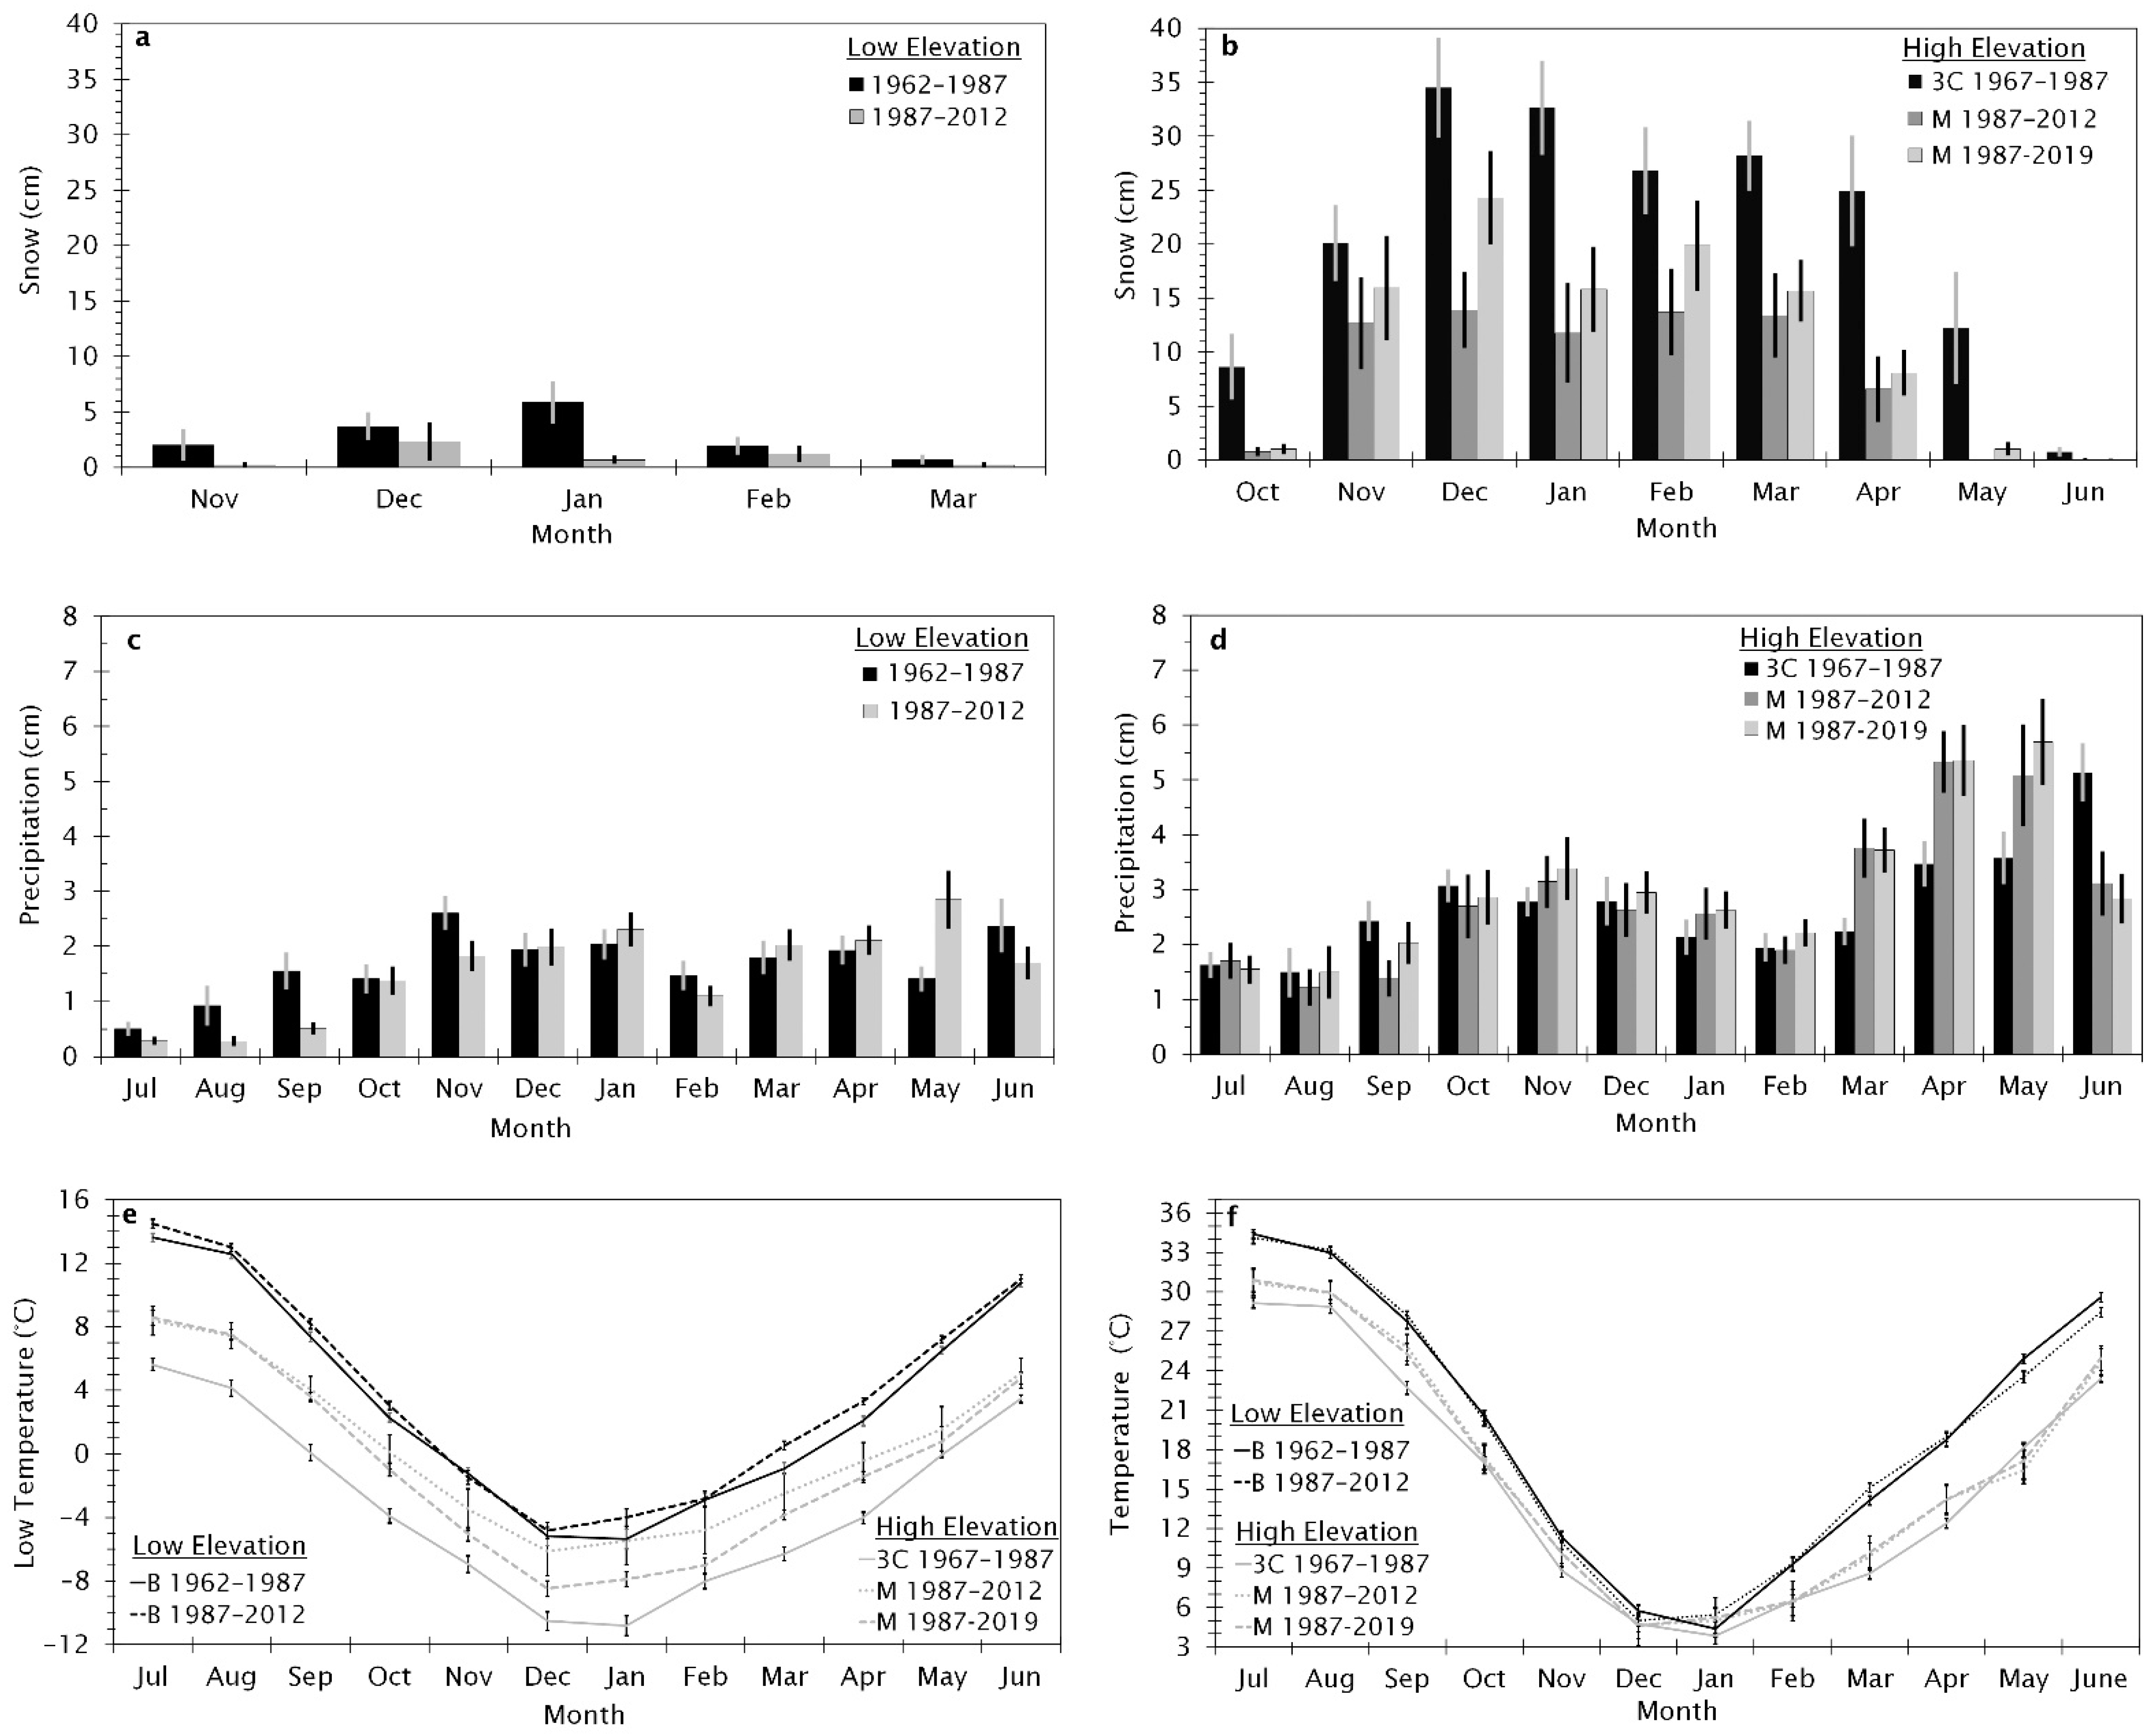
Figure 3.
The Nonparametric Multiplicative Regression modeled relationship response of the number of fires to (a) the first year the site experienced fire and the 30-year average minimum vapor pressure deficit in spring (spring VPD), (b) the first year the location experienced a fire, and the total number of seed treatments, and (c) the 30-year average minimum vapor pressure deficit in spring and the total number of seed treatments. The color scale ranges from 0 fires (black) to 4 fires (red).

Figure 4.
The modeled relationship between the number of fires grouped by the type of pre-fire seeding treatment (unseeded, aerial, drill, or both aerial and drill seeding) prior to the most recent fire along the gradient in (a) the minimum spring vapor pressure deficit (VPD), (b) the year the site first burned in a fire, and (c) the total number of seeding treatments (both aerial and drill seeding). Five percent jittering along the x-axis (a) or y-axis (b,c) was used to see overlapping treatments.
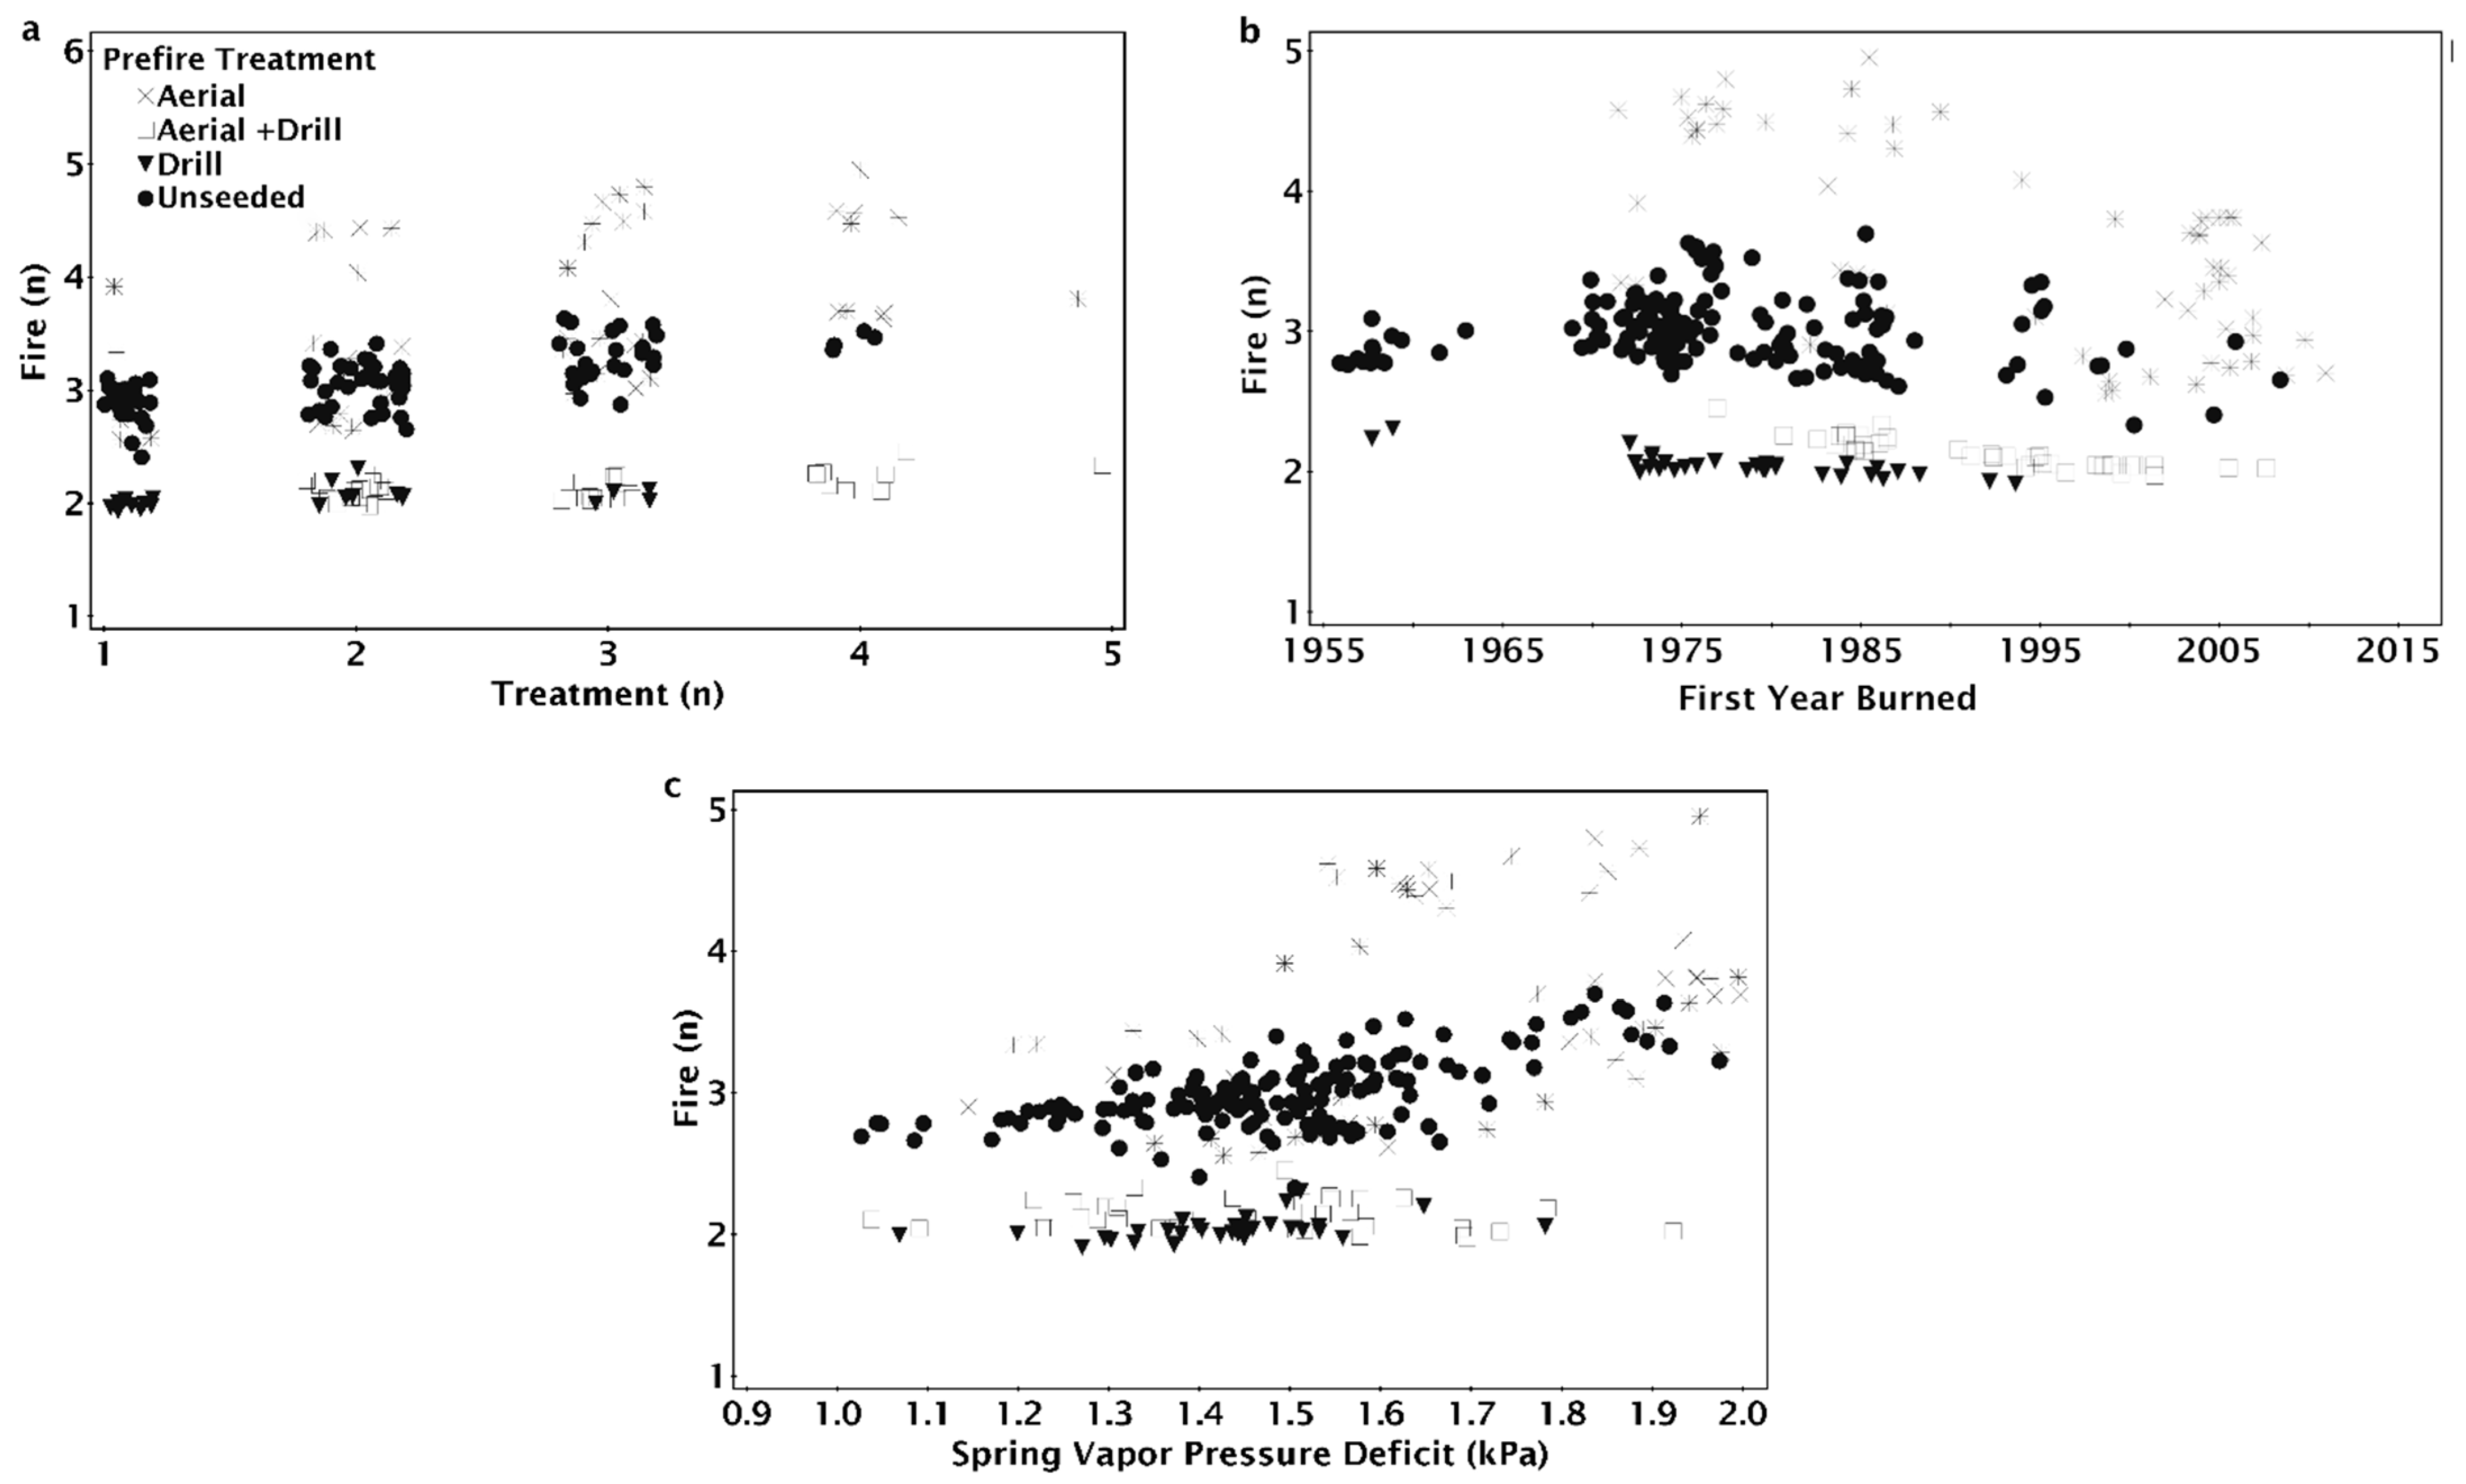
Figure 5.
The Nonparametric Multiplicative Regression modeled relationship response of fire return interval (FRI) to (a) the number of aerial seeding treatments and the 30-year average minimum vapor pressure deficit in spring (spring VPD), (b) the first year a site had a seeding treatment and the number of aerial seeding treatments, (c) the first year a site had a seeding treatment and the spring VPD. The color scale ranges from shorter FRIs (black) to longer FRIs (gray). Unshaded areas in the predictor space represent areas where predictor variable data was insufficient to model the relationship.

Figure 6.
The modeled relationship between the fire return interval grouped by the type of pre-fire Scheme 30. year average spring vapor pressure deficit. Figures include 5% jittering along the x-axis (a) or y-axis (b,c) was used to see overlapping treatments.
Figure 6.
The modeled relationship between the fire return interval grouped by the type of pre-fire Scheme 30. year average spring vapor pressure deficit. Figures include 5% jittering along the x-axis (a) or y-axis (b,c) was used to see overlapping treatments.

Figure 7.
The Nonparametric Multiplicative Regression modeled relationship response of fire frequency to (a) the 30-year average spring precipitation and the number of aerial seeding treatments, (b) the 30-year average spring precipitation and the number of drill treatments, and (c) the number of drill seeding and the number of aerial seeding treatments. The color scale ranges from less frequent fires (black) to more frequent fires (gray). Unshaded areas in the predictor space represent areas where predictor variable data was insufficient to model the relationship.
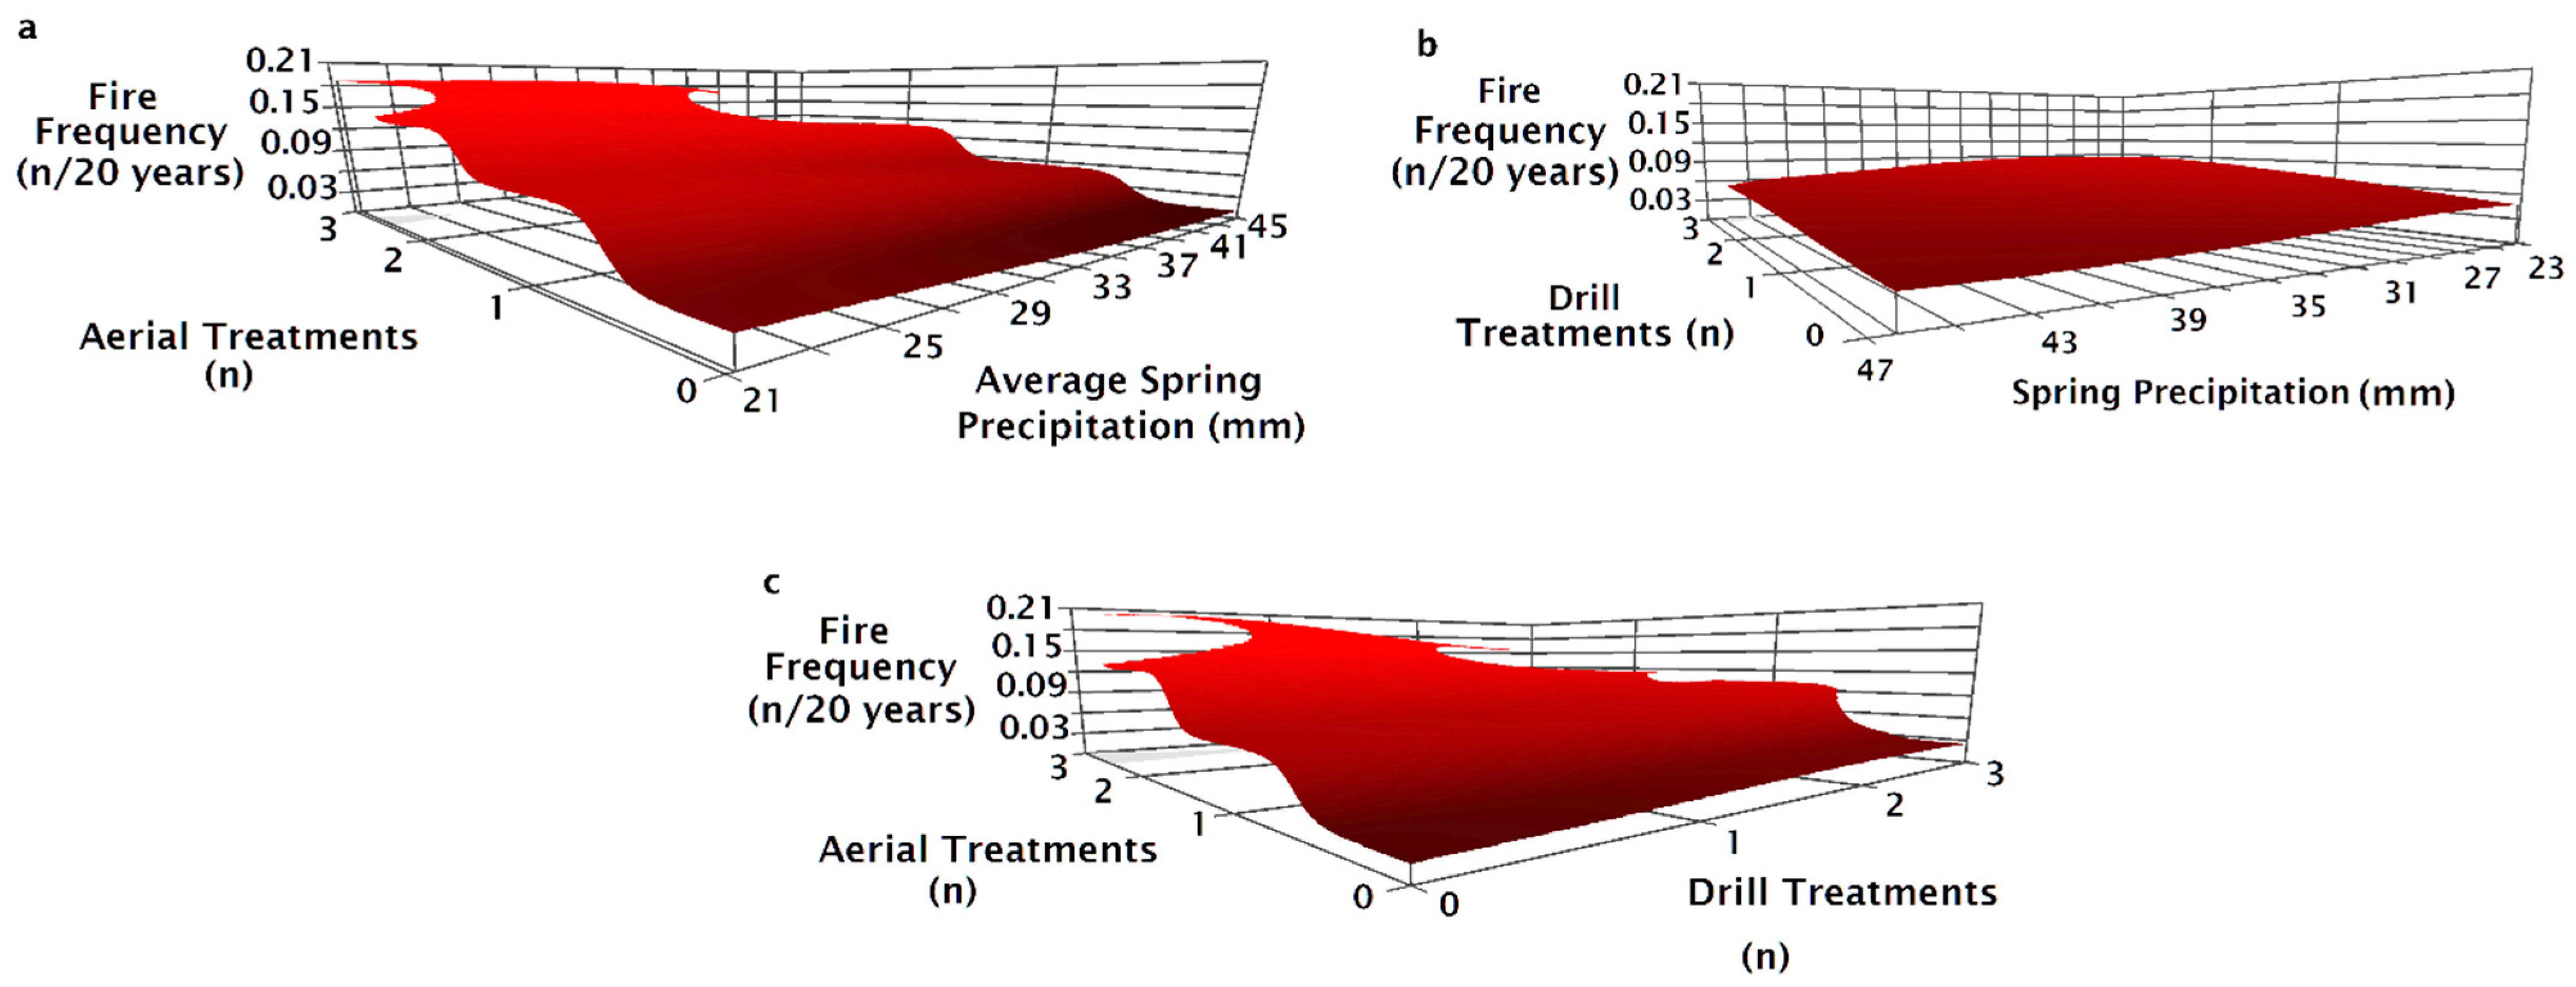
Figure 8.
The modeled relationship between fire frequency grouped by the type of pre-fire seeding. jittering along the x-axis (a,b) or y-axis (c) was used to see overlapping treatments.
Figure 8.
The modeled relationship between fire frequency grouped by the type of pre-fire seeding. jittering along the x-axis (a,b) or y-axis (c) was used to see overlapping treatments.

Figure 9.
NMS ordination of the biomass grouped by elevation with centroids (+) for each convex hull polygon. Plant functional groups labeled in ordination space indicate where the biomass for each group was the greatest (e.g., shrub biomass increased from left to right on Axis 1 and from bottom to top on Axis 2).

Figure 10.
NMS ordination (a) illustrating significantly different plant community biomass composition for elevation and seeding treatment combination that was significantly different according to the multiple response permutation procedure (α = 0.011). Plant functional groups labeled in ordination space indicate where the biomass for each group was the greatest (e.g., Shrub biomass increased from left to right on Axis 1 and from bottom to top on Axis 2). Mean biomass of each plant functional group (b) for each treatment (Aerial, A; Drill, D; Unseeded, N) along the elevation gradient: low (770–1020 m), medium-low (1021–1270 m), medium-high (1271–152 m), and high (1521–1780 m). Letters represent differences in biomass amount and composition among plant communities. Drill seeded sites at low and high elevations had an n = 1 and were dropped from the analysis.
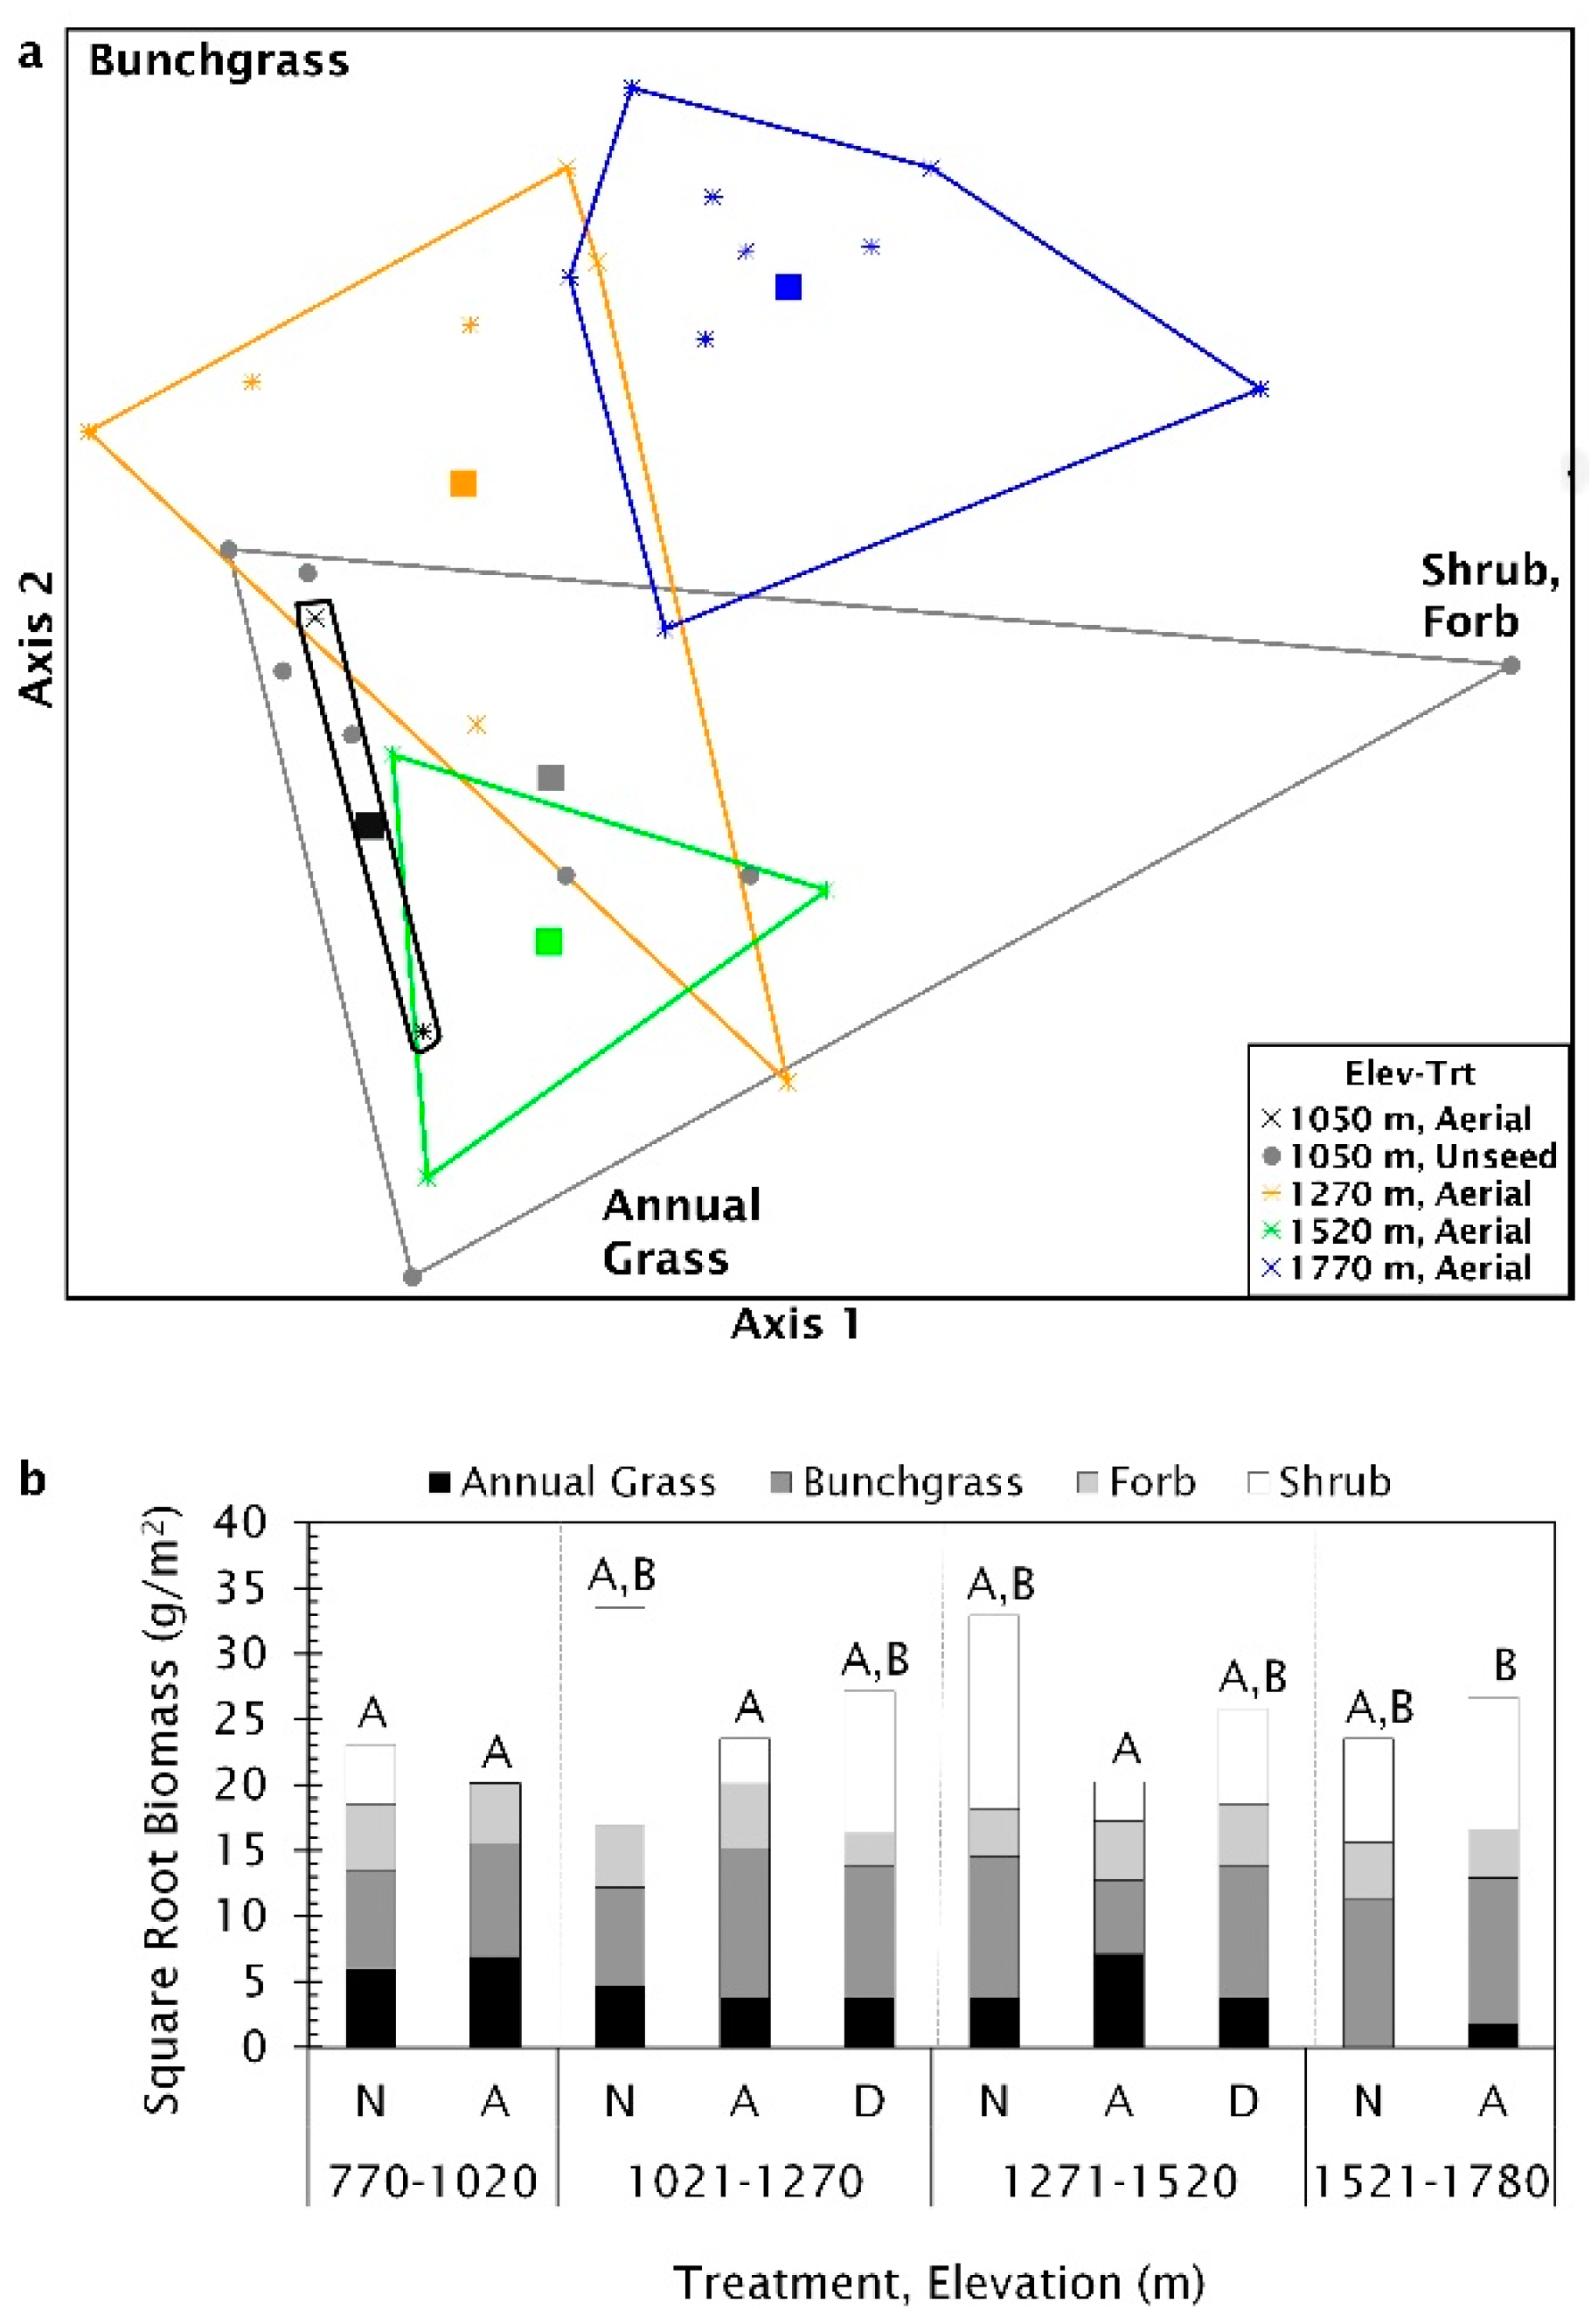

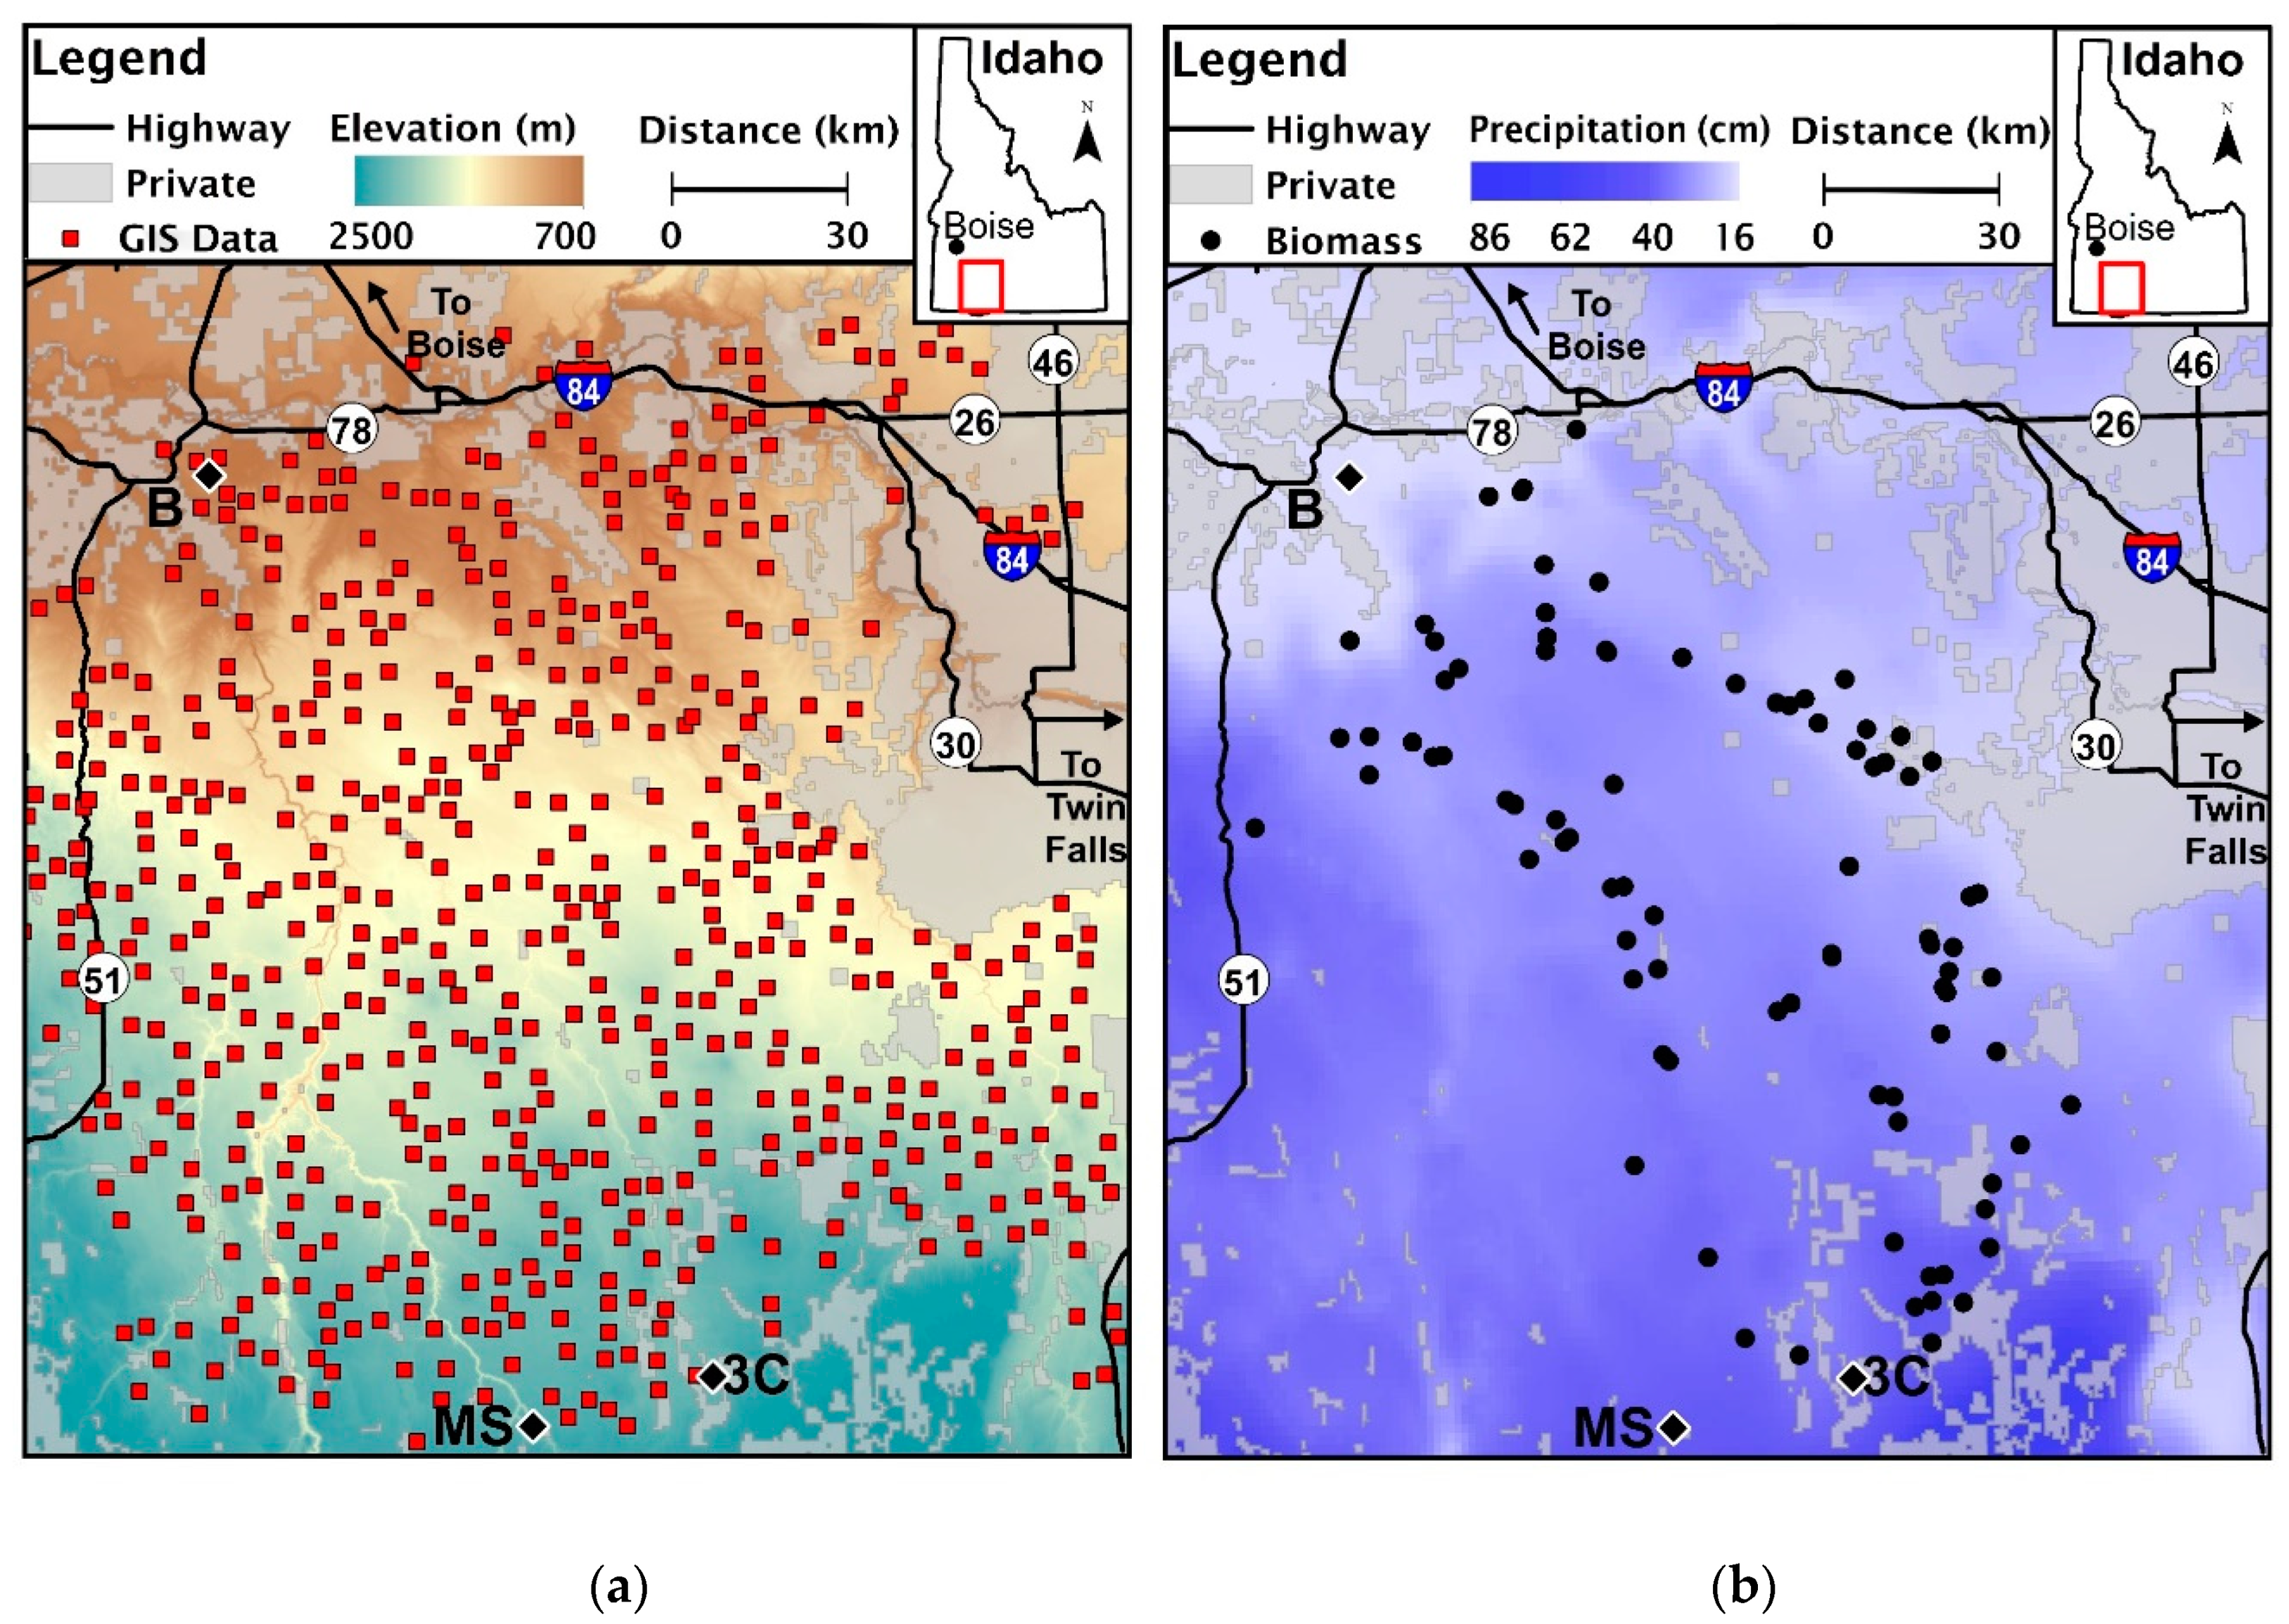
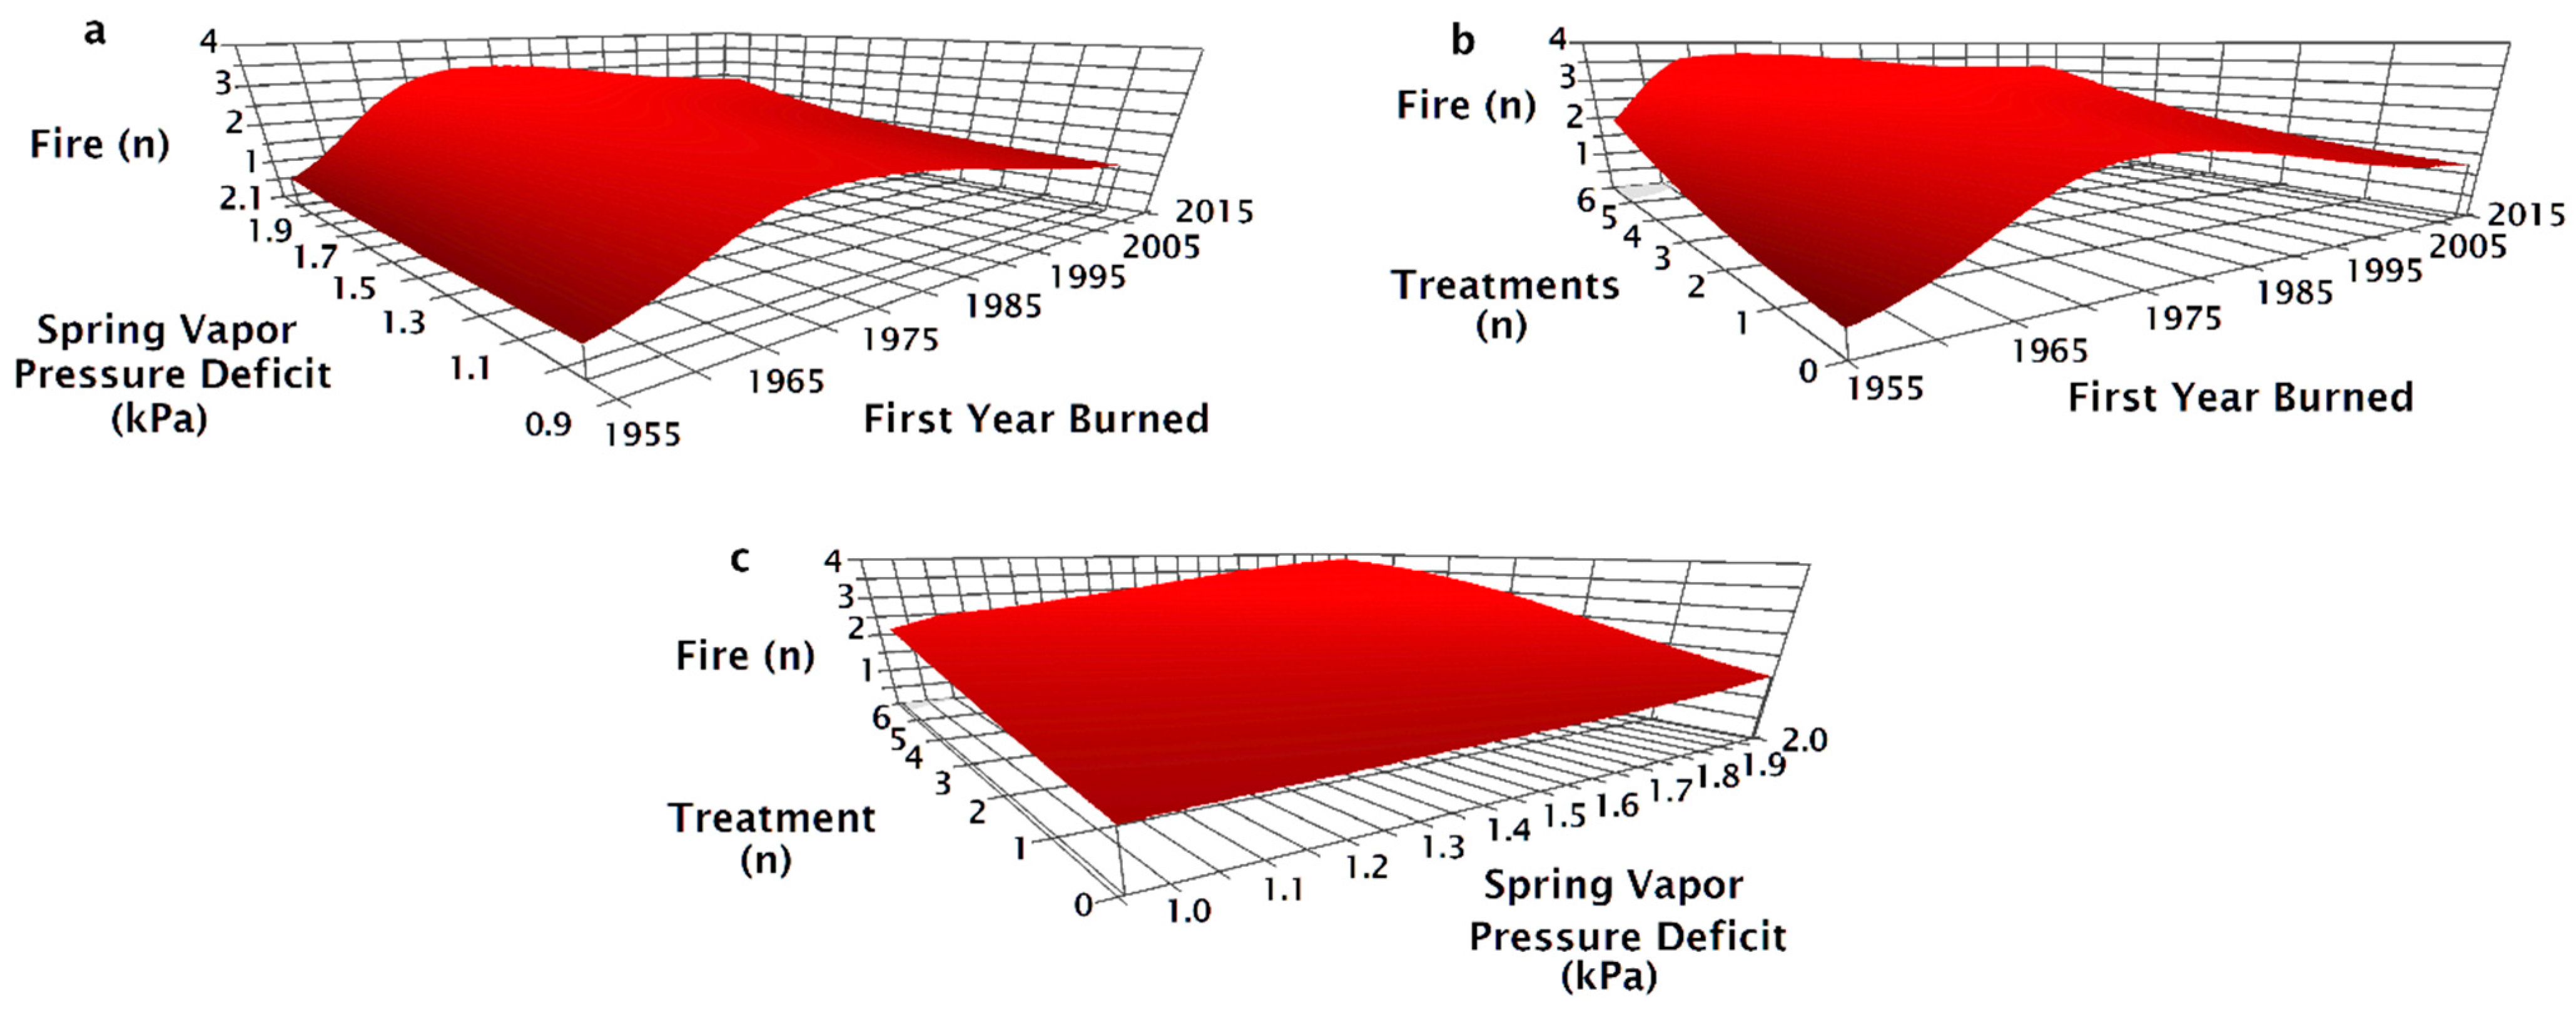
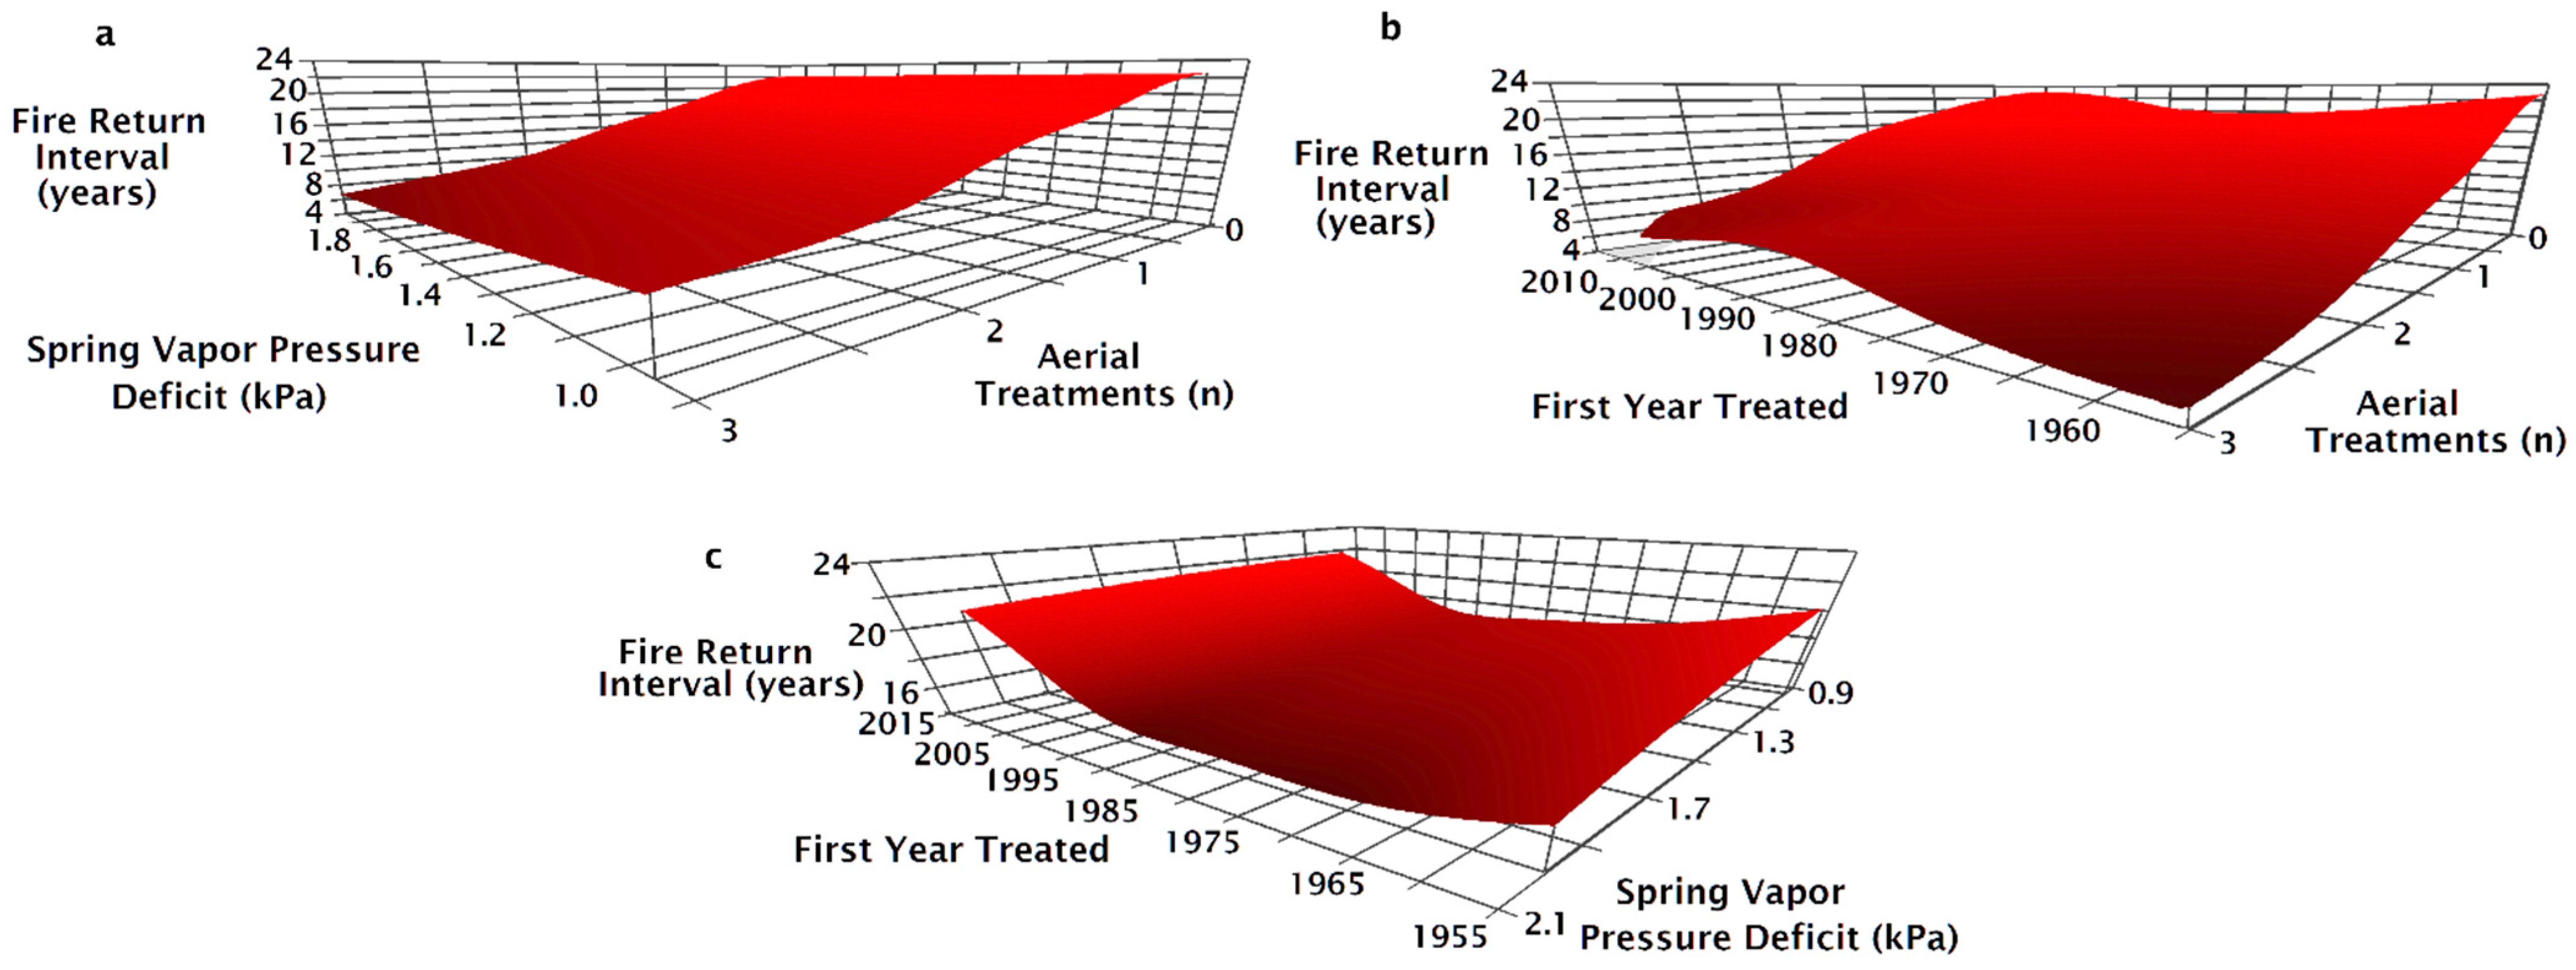
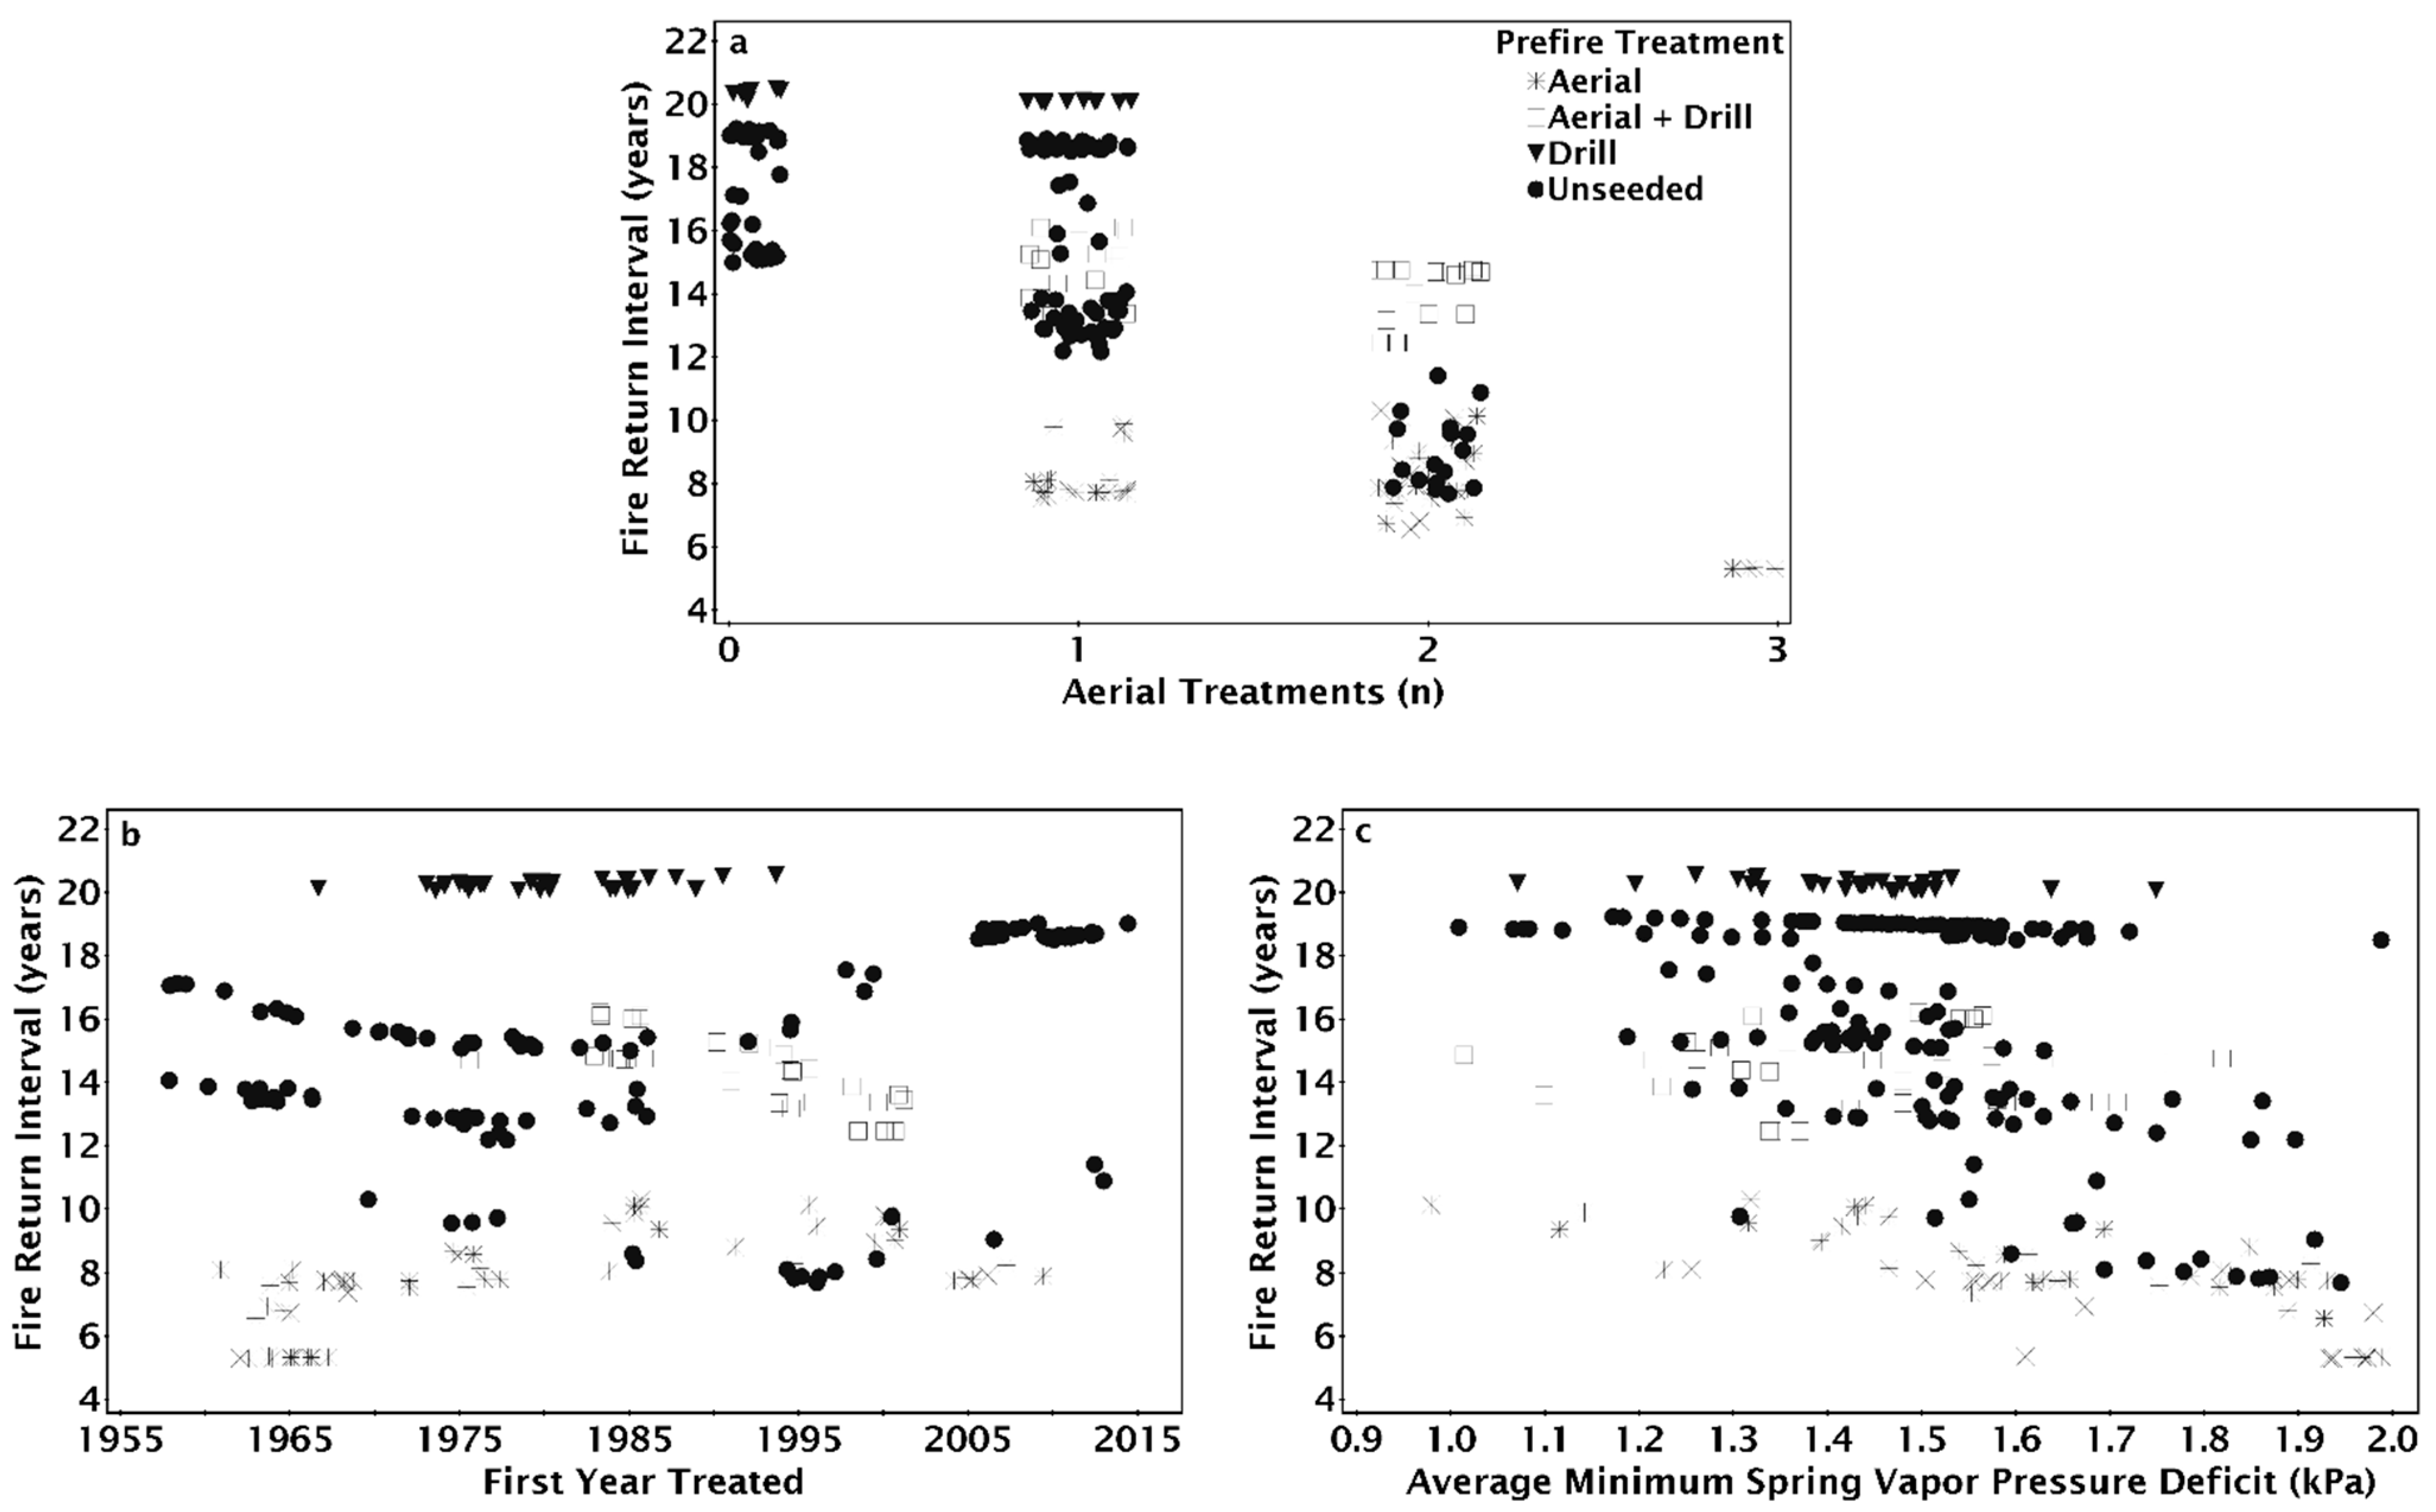
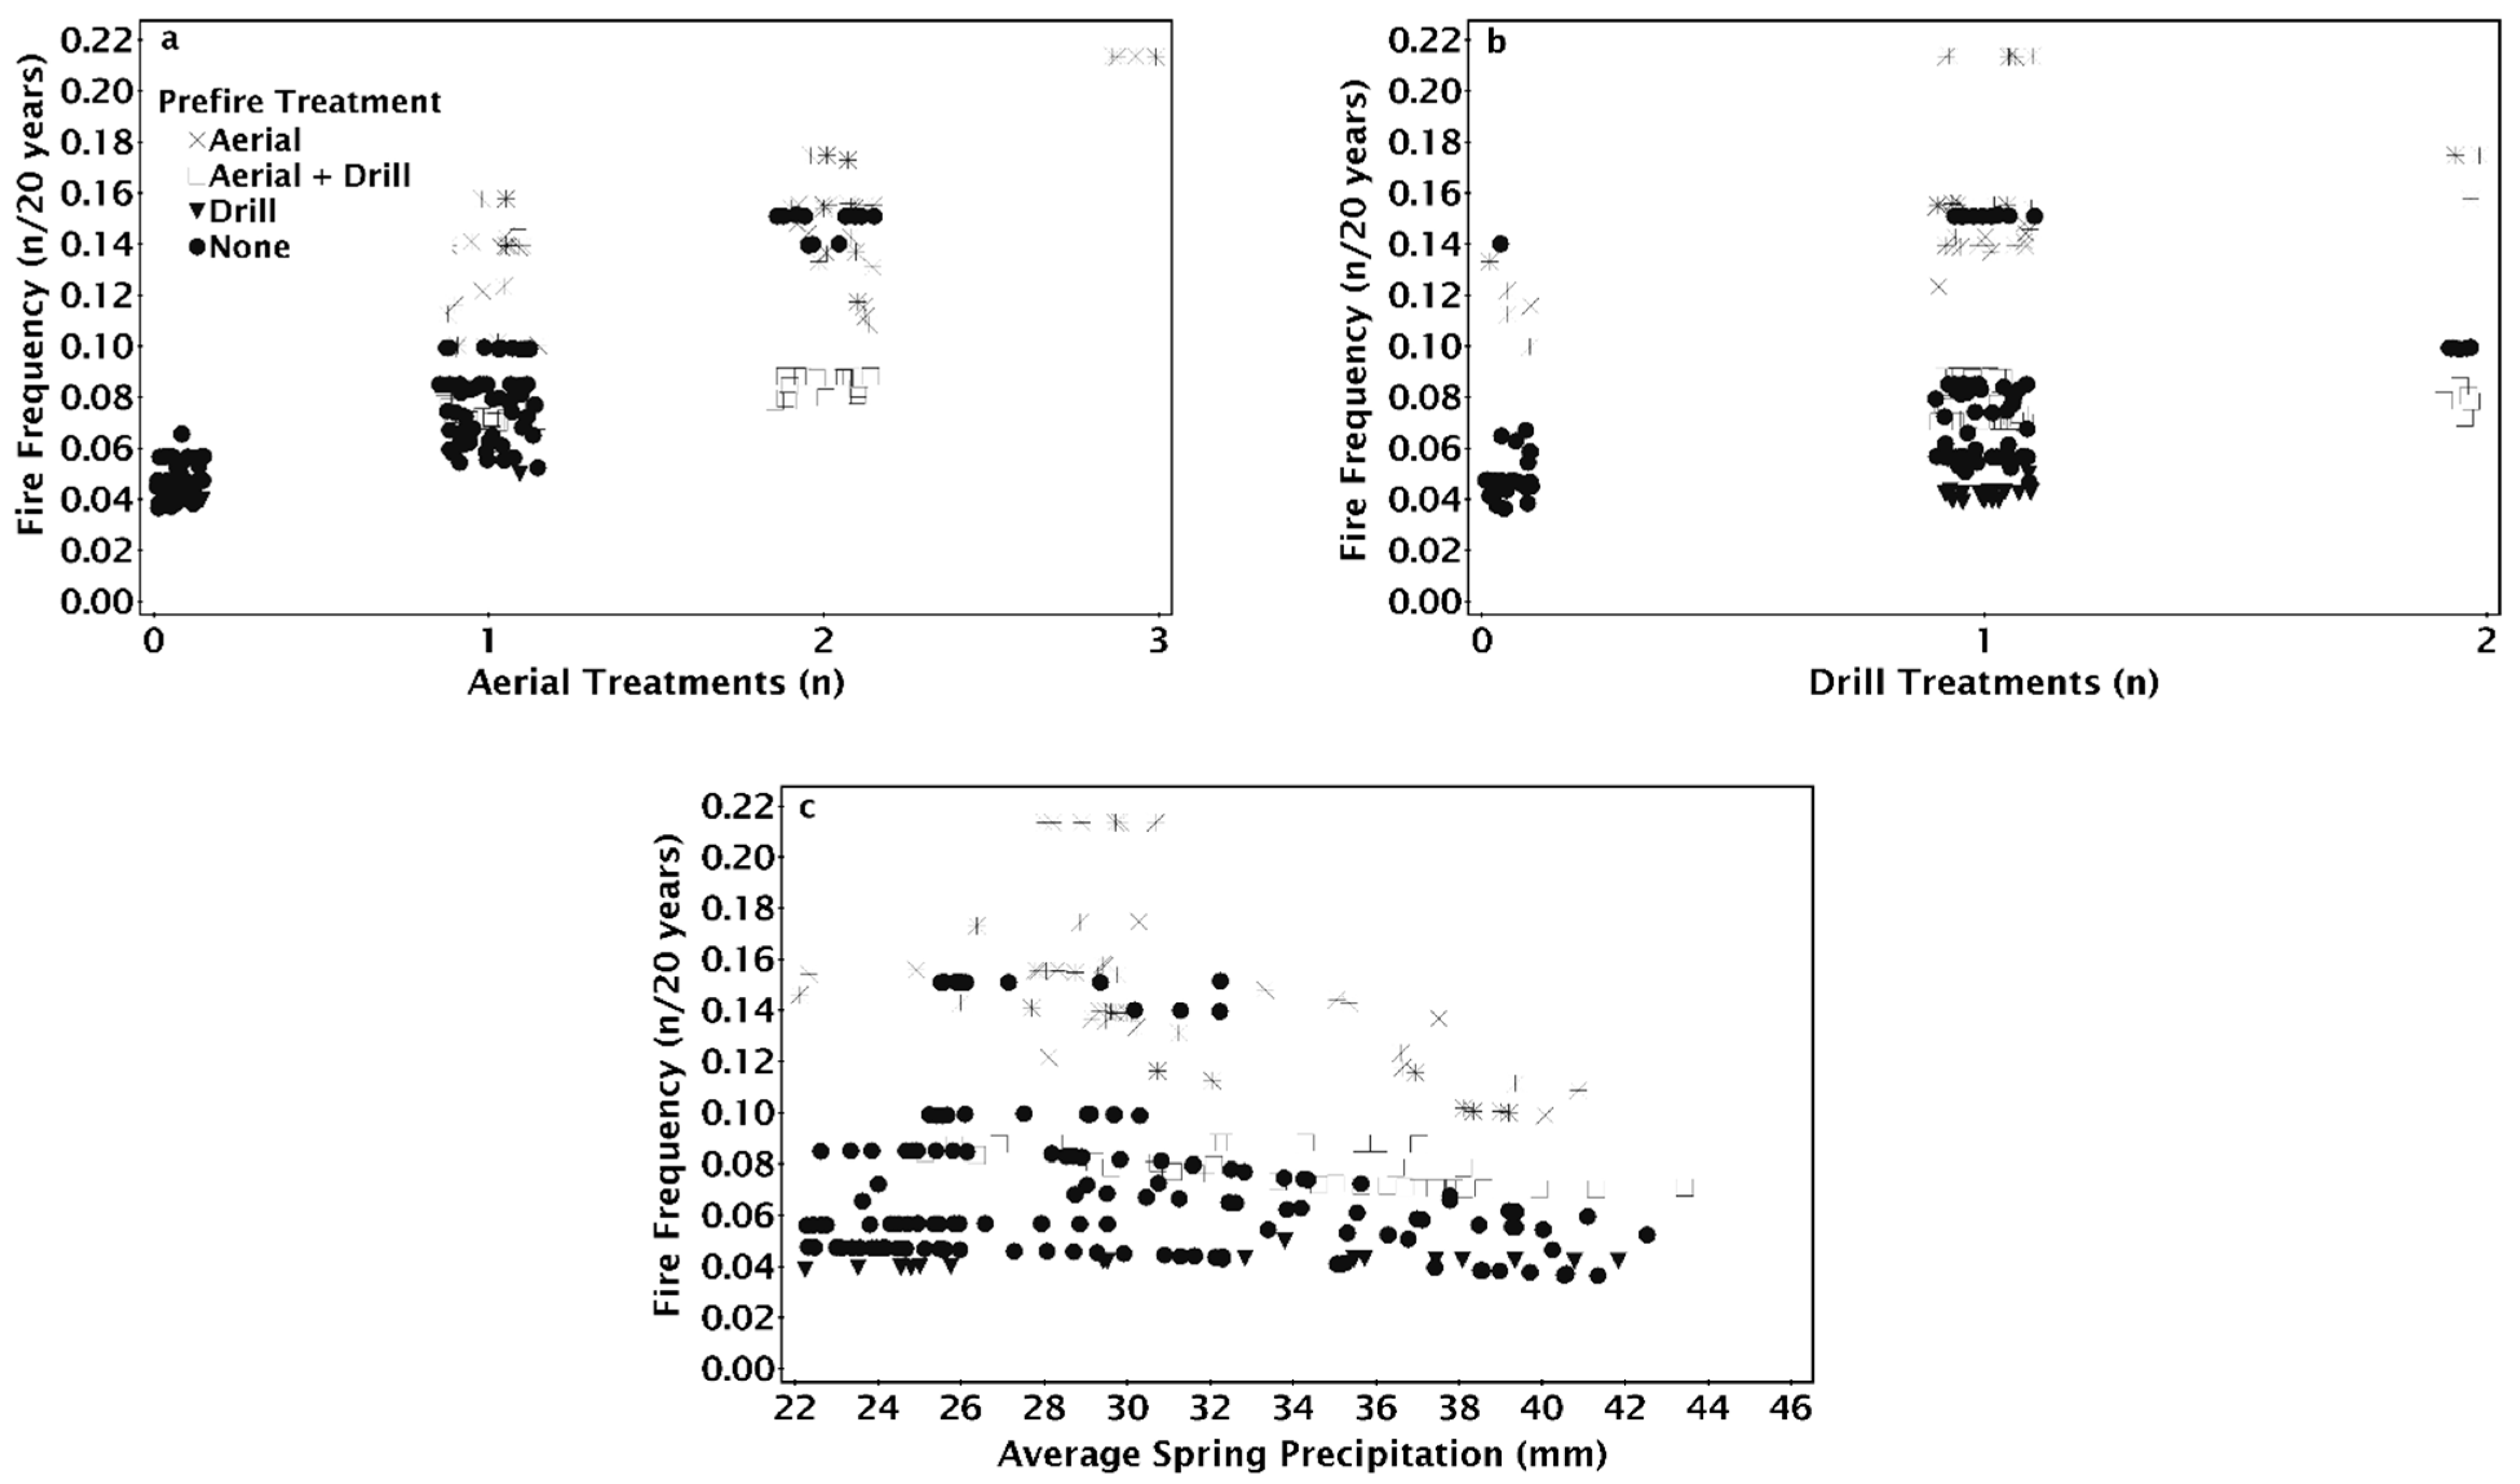
Table 1.
Summary statistics of the fire regime response variables. The total fire number was the sum of the fires between 1955 and 2015. The mean fire return interval and frequency were based on fire data between 1995 and 2015. Sites that did not burn between 1995 and 2015 were designated as a fire return interval of more than 25 years and had a fire frequency of 0.
| Fire Regime Variable | Category | Count (n) |
|---|---|---|
| Total Fire (n) | Unburned | 164 |
| 1 | 114 | |
| 2 | 154 | |
| 3 | 63 | |
| 4 | 42 | |
| 5 | 24 | |
| 6–7 | 12 | |
| Return Interval (years) | <5 | 6 |
| 5–10 | 143 | |
| 11–20 | 188 | |
| >20 | 236 | |
| Fire Frequency | 0.00 | 236 |
| 0.05 | 1880 | |
| 0.10 | 81 | |
| 0.15 | 43 | |
| ≥0.20 | 26 |
Table 2.
The Nonparametric Multiplicative Regression best-fit models for each fire regime variable. The explanatory variables that compose the models include the first year a site burned (1st fire year), the 30-year mean minimum vapor pressure deficit from March-May (Spring VPD min), the seeding treatment before the most recent fire (Pre-fire seeding treat), the total number of times a site was aerially seeded (Aerial seeding (n)), the total number of times a site was drill seeded (Drill seeding (n)) and 30-year mean spring precipitation from March-May (Spring precipitation).
| Response Variable | Eval xR² | Model Fit xR² (±SE) | Avg Size | Predictor Variable | Sensitivity | Tolerance | |
|---|---|---|---|---|---|---|---|
| Fires (n) * | 0.8 | 0.83 | 31.2 | 1st fire year | 0.09 | 9.45 | (15%) |
| 1950–2014 | (±0.0) | Spring VPD min | 0.05 | 0.26 | (25%) | ||
| Treatment (n) | 0.05 | 1.5 | (25%) | ||||
| Pre-fire seeding treat † | - | - | - | ||||
| Fire Return Interval * | 0.78 | 0.81 | 43.32 | Aerial seeding (n) | 0.22 | 0.5 | (10%) |
| 1994–2014 | (±0.0) | 1st year treated | 0.15 | 10.35 | (15%) | ||
| Spring VPD min | 0.02 | 0.46 | (45%) | ||||
| Pre-fire seeding treat † | - | - | - | ||||
| Fire Frequency * | 0.76 | 0.77 | 33.29 | Drill seeding (n) | 0.07 | 0.75 | (25%) |
| 1994–2014 | (±0.0) | Spring precipitation | 0.05 | 6.28 | (25%) | ||
| Aerial seeding (n) | 0.03 | 0.25 | (5%) | ||||
| Pre-fire seeding treat † | - | - | - | ||||
Eval xR2 = The correlation from original model analysis. Model Fit xR2 = Correlation based on the bootstrap analysis. Avg. Size = The number of sample units contributing to the estimate of occupancy. * p < 0.01, SE = Standard error. † Categorical variable. Sensitivity and tolerance can only be calculated with continuous variables.
Publisher’s Note: MDPI stays neutral with regard to jurisdictional claims in published maps and institutional affiliations. |
© 2021 by the authors. Licensee MDPI, Basel, Switzerland. This article is an open access article distributed under the terms and conditions of the Creative Commons Attribution (CC BY) license (http://creativecommons.org/licenses/by/4.0/).
Share and Cite
MDPI and ACS Style
Bowman-Prideaux, C.; Newingham, B.A.; Strand, E.K. The Effect of Seeding Treatments and Climate on Fire Regimes in Wyoming Sagebrush Steppe. Fire 2021, 4, 16. https://0-doi-org.brum.beds.ac.uk/10.3390/fire4020016
AMA Style
Bowman-Prideaux C, Newingham BA, Strand EK. The Effect of Seeding Treatments and Climate on Fire Regimes in Wyoming Sagebrush Steppe. Fire. 2021; 4(2):16. https://0-doi-org.brum.beds.ac.uk/10.3390/fire4020016
Chicago/Turabian StyleBowman-Prideaux, Chris, Beth A. Newingham, and Eva K. Strand. 2021. "The Effect of Seeding Treatments and Climate on Fire Regimes in Wyoming Sagebrush Steppe" Fire 4, no. 2: 16. https://0-doi-org.brum.beds.ac.uk/10.3390/fire4020016