
River Flows Are a Reliable Index of Forest Fire Risk in the Temperate Tasmanian Wilderness World Heritage Area, Australia


1
School of Natural Sciences, University of Tasmania, Sandy Bay, TAS 7001, Australia
2
NSW Bushfire Risk Management Research Hub, School of Natural Sciences, University of Tasmania, Sandy Bay, TAS 7001, Australia
*
Author to whom correspondence should be addressed.
Fire 2021, 4(2), 22; https://0-doi-org.brum.beds.ac.uk/10.3390/fire4020022
Submission received: 4 March 2021
/
Revised: 26 April 2021
/
Accepted: 29 April 2021
/
Published: 30 April 2021
(This article belongs to the Special Issue Bushfire in Tasmania)
Abstract
:Fire risk can be defined as the probability that a fire will spread across a landscape, that therefore determines the likely area burnt by a wildfire. Reliable monitoring of fire risk is essential for effective landscape management. Compilation of fire risk records enable identification of seasonal and inter-annual patterns and provide a baseline to evaluate the trajectories in response to climate change. Typically, fire risk is estimated from meteorological data. In regions with sparse meteorological station coverage environmental proxies provide important additional data source for estimating past and current fire risk. Here, we use a 60-year record of daily flows (ML day−1 past a fixed-point river gauge) from two rivers (Franklin and Davey) in the remote Tasmanian Wilderness World Heritage Area (TWWHA) to characterize seasonal patterns in fire risk in temperate Eucalyptus forests and rainforests. We show that river flows are strongly related to landscape soil moisture estimates derived from down-scaled re-analysis of meteorological data available since 1990. To identify river flow thresholds where forests are likely to burn, we relate river flows to known forest fires that have occurred in the previously defined ecohydrological domains that surround the Franklin and Davey catchments. Our analysis shows that the fire season in the TWWHA is centered on February (70% of all years below the median river flow threshold), with shoulders on December-January and March. Since 1954, forest fire can occur in at least one month for all but four summers in the ecohydrological domain that includes the Franklin catchment, and since 1964 fire could occur in at least one month in every summer in the ecohydrological domain that includes the Davey catchment. Our analysis shows that managers can use river flows as a simple index that indicates landscape-scale forest fire risk in the TWWHA.
1. Introduction
Fire risk can be defined as the probability that a fire will spread across a landscape [1], therefore affecting likely area burnt by wildfire. A major determinant of landscape flammability and area burnt is the moisture content of live and dead vegetation, or ‘fuel’ [2]. Accurate determination of fuel moisture, however, is extremely difficult given the floristic diversity and structural complexity of vegetation combined with the highly variable effects of meso and microclimate [3]. Accordingly, weather danger indices, which are central to fire management, use simple proxies of fuel moisture derived from available meteorological data [4]. For instance, the Australian MacArthur index uses a bucket model estimate of soil moisture, derived from antecedent rainfall and evapotranspiration, which is assumed to scale to fuel moisture [5,6]. With the advent of down-scaled meteorological products it is now possible to estimate soil moisture, and therefore fuel moisture, across landscapes for the last three decades [7]. The availability of such estimates enables refined understanding of historic spatio-temporal patterns of fire hazard and improved predictions of fire behaviour. Critically, however, the short record length of down-scaled meteorological data hampers quantifying basic parameters about frequency of extreme events and trends in fire risk over longer times scales. This problem is particularly acute for remote environments that have very spare meteorological coverage, and for vegetation communities with fire regimes with long fire-return intervals.
Given the limitation of translating available meteorological data into fire risk assessments, a diverse range of natural archives and environmental monitoring records have been used to reconstruct trends in fire risk. Analysis of charcoal in sediments, and tree ring and fire scar analyses provide well-established proxies to understand the linkage between climate variation and past fire activity over several centuries at the landscape scale [8]. Ecohydrological records have also illuminated changes in fire risk: for instance, there is a strong linkage between early spring snowmelt and increasing extent of wildfires in the western USA [9]. Here, we analyse river flows in the Tasmanian Wilderness World Heritage Area to assess whether this record can be used to quantity the seasonal pattern of forest fires and serve as an indicator of landscape fire risk. This region has sparse meteorological coverage, yet because of hydroelectric power generation potential there is a high-quality record of daily river flows spanning over 60 years. Given the sparse meteorological data our approach provides a novel approach to identify hisotrical trends in fire risk thereby filling an important knowledge gap for this internationally important region.
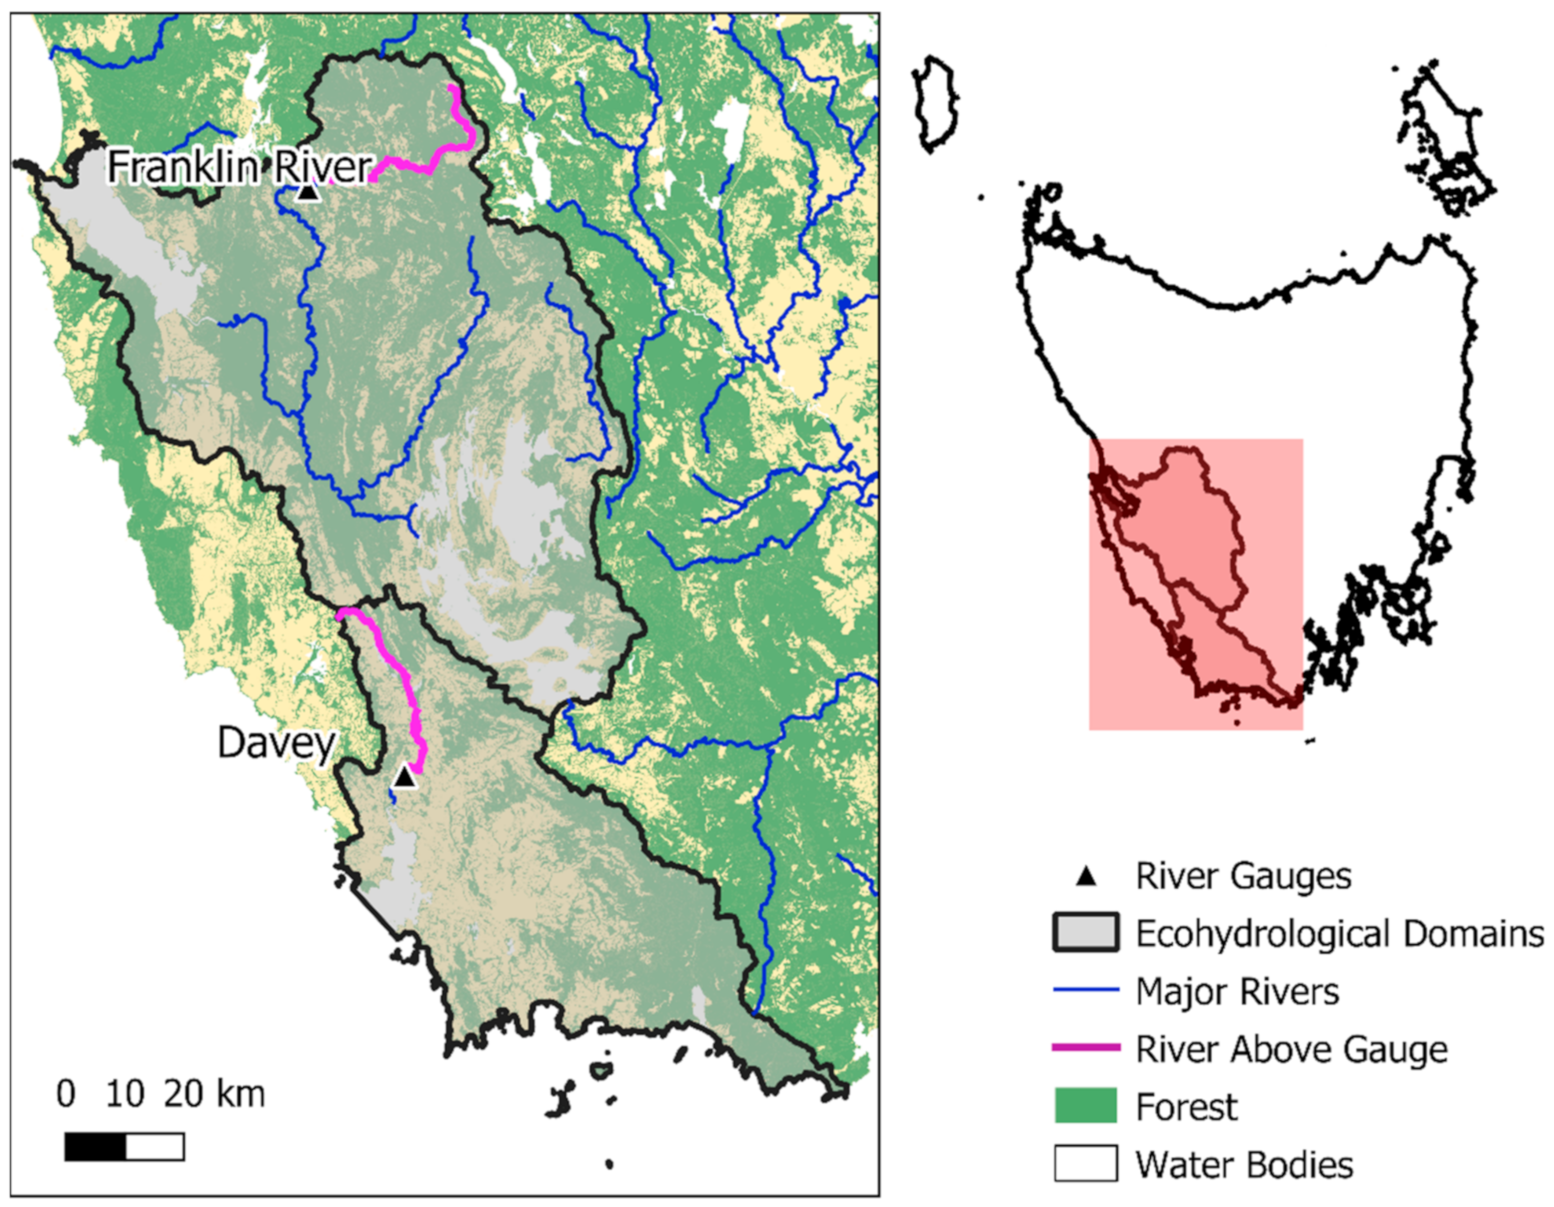
The Tasmanian Wilderness World Heritage Area (TWWHA) is 15,800 km2 in extent and covers almost all of the southwest quarter of the continental island of Tasmania, which lies 200 km south of the Australian mainland [10]. The region is geologically varied, topographically rugged, biologically diverse with a history of human occupancy from the late Pleistocene, which together satisfy seven of ten natural and cultural heritage criteria used to assess World Heritage status [11]. The region has a cool temperate climate in one of the wettest environments in Australia, with no pronounced dry season, receiving in excess of 2000 mm of precipitation annually [12]. In spite of the perhumid climate, an important feature of the TWWHA is a complex pattern of fire sensitive and fire tolerant vegetation communities with strongly contrasting fire regimes [13]. Temperate rainforests with Gondwanan affinities only rarely burn, and only under extreme drought conditions, whereas treeless sedgelands and Myrtaceous shrublands are highly flammable and support high fire frequencies. Eucalyptus forests are more flammable than rainforests, and depend on fire for regeneration [14], but have much lower fire frequencies than sedgelands [15]. The cause of the complex patterns is debated but key factors relate to gradients in soil fertility and soil moisture, combined with anthropogenic ignitions and climate changes since the late-Pleistocene [13].
Of high importance for land managers is accurate determination of trends and real-time assessment fire risk of different plant communities in the TWWHA [16]. Although frustrated by sparse meteorological coverage, recent studies have identified thresholds of concern for flammability of some different vegetation types in the region. Styger and Kirkpatrick [17] provided an analysis of 11 fires, some seven of which include burned rainforest, and concluded that this vegetation is vulnerable to wildfire if the antecedent 30-day rainfall is below 50 mm. The combination of experimentally assessed moisture thresholds in peat soils with soil moisture estimates derived from reanalysis of meteorological data from 1990–2018 demonstrated the vulnerability to combustion of most Tasmanian organic soils almost every summer [18].
Here, we investigate an alternative approach to evaluate forest fire risk in the TWWHA, based on calibration and validation of river flows using the river level records for two major catchments in the TWWHA, the Franklin and Davey (Figure 1) which commence from 1953 and 1964, respectively. First, we substantiate that there is a linkage between the catchment-scale soil moisture with respective daily and monthly river flows. Using this calibration, we then explore the relationship of the occurrence of forest fires, predominantly Eucalyptus but including rainforest, within each of the two catchments to identify river flow thresholds when forests are available to burn, and compare these to the rainforest and organic combustion thresholds [17,18]. Finally, based on this validation we estimate the number of summers that include periods when forests are available to burn. This research is motivated to provide a longer-term perspective on fire risk in the TWWHA, and to provide managers with a simple index to assess the likelihood of forest fires in the region. We focus on forest vegetation because the treeless vegetation in this region is highlight flammable being available to burn after brief dry spells even when organic soils are saturated [19].
2. Materials and Methods
Our study is focused on two rivers (Franklin and Davey) in the TWWHA which have natural flows that have been monitored since 1954 and 1964, respectively. These rivers are representative of the southwestern Tasmanian landscapes, including large tract of Eucalyptus and rainforests (Figure 1). River flow rate (ML day−1 past a fixed point river gauge) data at a sub-daily timestep were obtained from the Australian Bureau of Meteorology’s Water Data Online service for two gauges, the Franklin River at Mt Fincham Track (42.24° S 145.77° E) and the Davey River below Crossing River (43.13° S 145.95° E) [20]. The geographical domain of our analysis was based on the ecohydrological land and water management polygons derived from the Conservation of Freshwater Ecosystem Values (CFEV) spatial dataset provided by the Tasmanian government, which included Davey and Franklin catchments [21]. This larger geographic domain was required to capture the few known fires that have occurred during the period covered by the river flow records.
2.1. Soil Moisture Calibration
We investigated the relationship between river flow and the estimates of soil moisture in the two ecohydrological land and water management domains that included the Franklin and Davey Rivers [21]. Within each of the ecohydrological land and water management domains, mean monthly soil moisture in the surface soil layer (0–10 cm) was calculated from the Bureau of Meteorology’s BARRA-TA downscaled reanalysis for Tasmania for the period 1990 to 2018 [22]. Regression analysis of river flow against modelled soil moisture for both rivers were used to substantiate a direct relationship between these variables. Linear models of log mean monthly river flow rate against mean monthly surface soil moisture content were then trained using data for the period 1990 to 2014, and models were validated for the period 2015–2018, to establish the relationship between landscape soil moisture and river flow.
2.2. River Flows and Fire Risk Thresholds
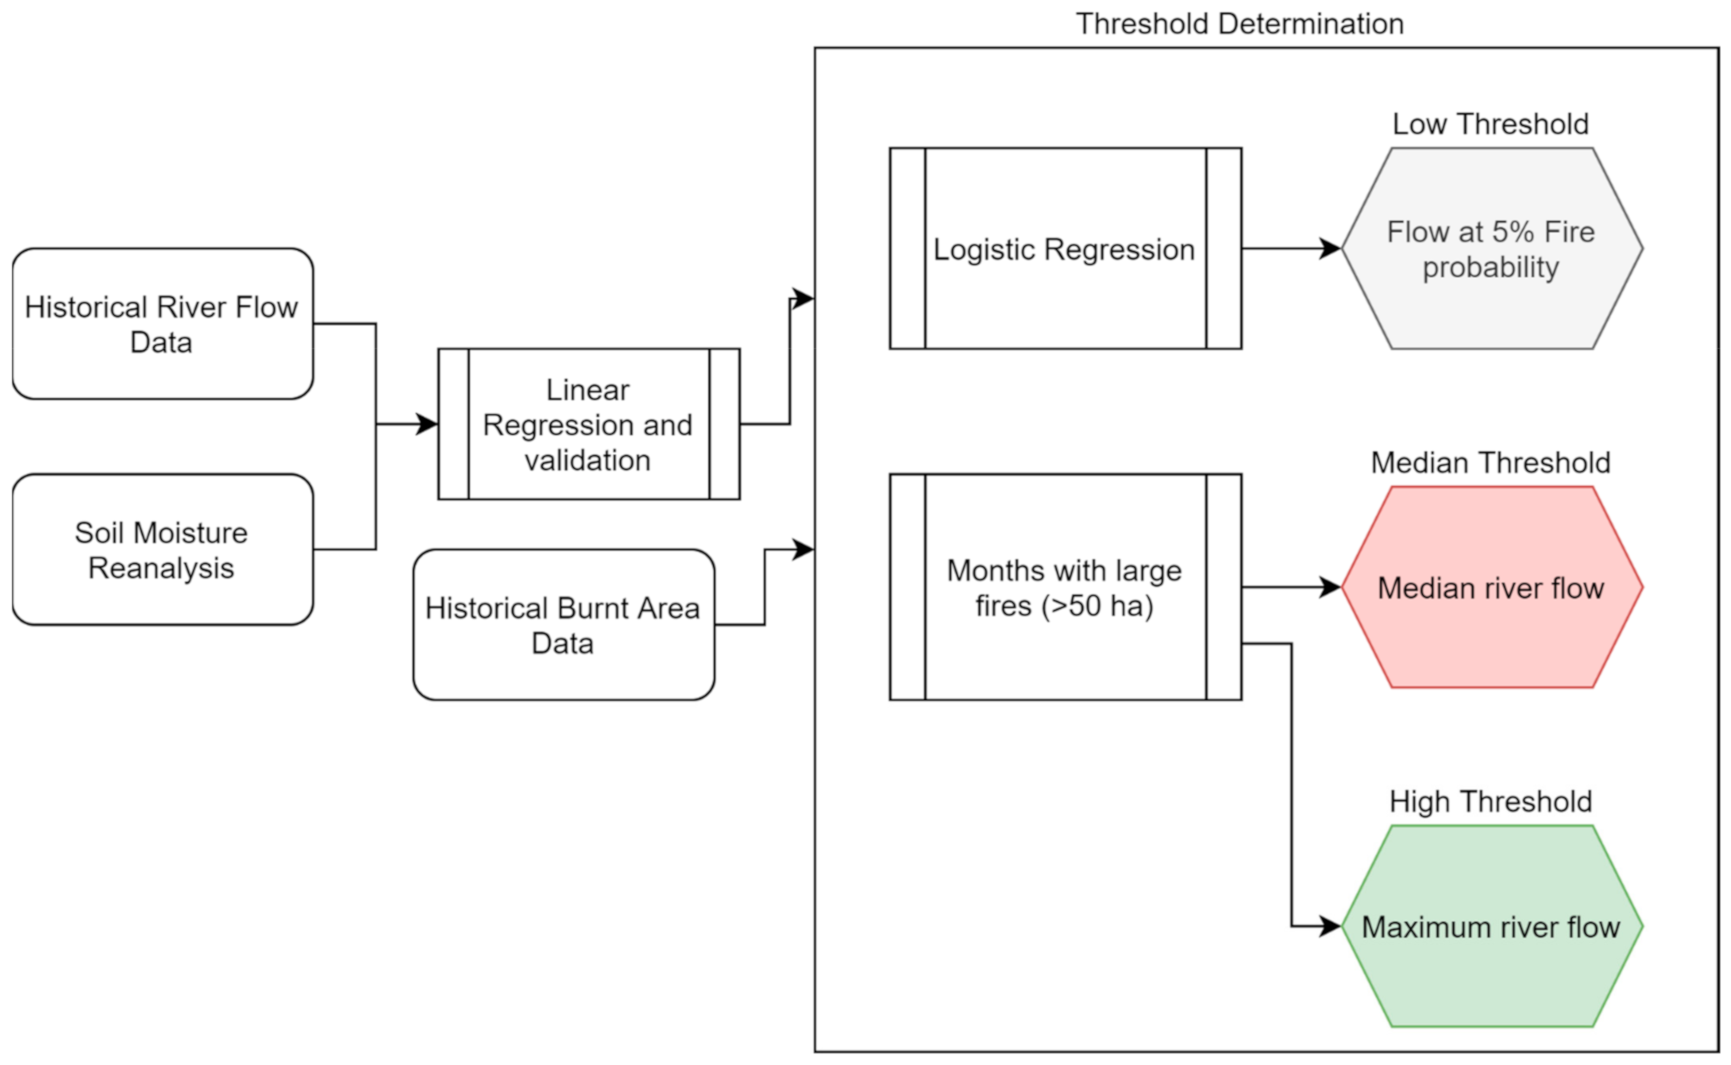
We determined the likelihood of fire in the ecohydrological land and water management domains in relation to river flows. For each ecohydrological land and water management domains we obtained mapping of past fires spanning the river flow records [23]. The fire polygons were clipped to forest vegetation (combining Eucalyptus and rainforests) based on TasVeg 3.0 vegetation mapping [24], excluding treeless (e.g., sedgeland, heathland, alpine) vegetation types. Forest fires were classified according to area, with fires larger than 50 ha in size labelled as ’large fires’. For each of the two rivers, a logistic regression was performed, modelling the probability of occurrence of a large fire in a given month against mean monthly river flow rate, across the available historical record. Three river flow thresholds were derived from these data and models (Figure 2). First, a low flow threshold was calculated, representing the river flow rate derived from the logistic model representing >5% probability of a large fire occurring in a given month. Second, a median flow threshold was calculated, representing the median river flow across all months with large fires, with as many fires occurring when the river was above that flow level as below. Finally, we calculated a high flow threshold, representing the river flow rate above which no large fires occurred over the available historical record.
For each of the two rivers, the number of years at which the river flow rate was below the median, above the median, and above the high flow thresholds in each month was calculated. We then calculated the frequency of the number of months each year from the period November to March inclusive, over the river data record, in which river flow was below the median flow threshold when fire activity is expected to be more likely. The workflow with this analysis is outlined in Figure 2.
For both rivers we assessed historical trends in area burnt as a proxy for forest-fire risk based on flows and compared these ecohydrological estimates with previously determined indices of the risk of fire in temperate rainforest [17] and organic sedgeland soils [18]. We used meteorological data from Strathgordon BoM station to calculate fire risk to rainforest, and downscaled soil moisture data for the risk of organic soil combustion. All analyses were conducted in R version 4.0.2 [25] using the sf [26] and ggeffects [27] packages.
3. Results
3.1. Soil Moisture Calibration
There is a strong relationship between river flows and soil moisture estimates in ecohydrological land and water management polygons (Figure 3a,b). Linear regressions of log river flow rate against mean catchment surface layer soil moisture derived from the BARRA-TA downscaled reanalysis showed excellent predictive performance, with Pearson’s correlation coefficients of 0.9 for the Franklin river and 0.8 for the Davey river (Figure 3c,d), although models tended to underpredict river flow under higher flow conditions. This may reflect a point of saturation of the surface soil layers and increased overland flow that is not accounted for by the model during particularly wet conditions. Such under-prediction of high river flows is not important for this study because under these fires are unlikely to occur. These results confirm river flow acts as an excellent proxy for soil moisture across the catchments, particularly in drier conditions when fire is more likely.
3.2. River Flow and Fire Risk Thresholds
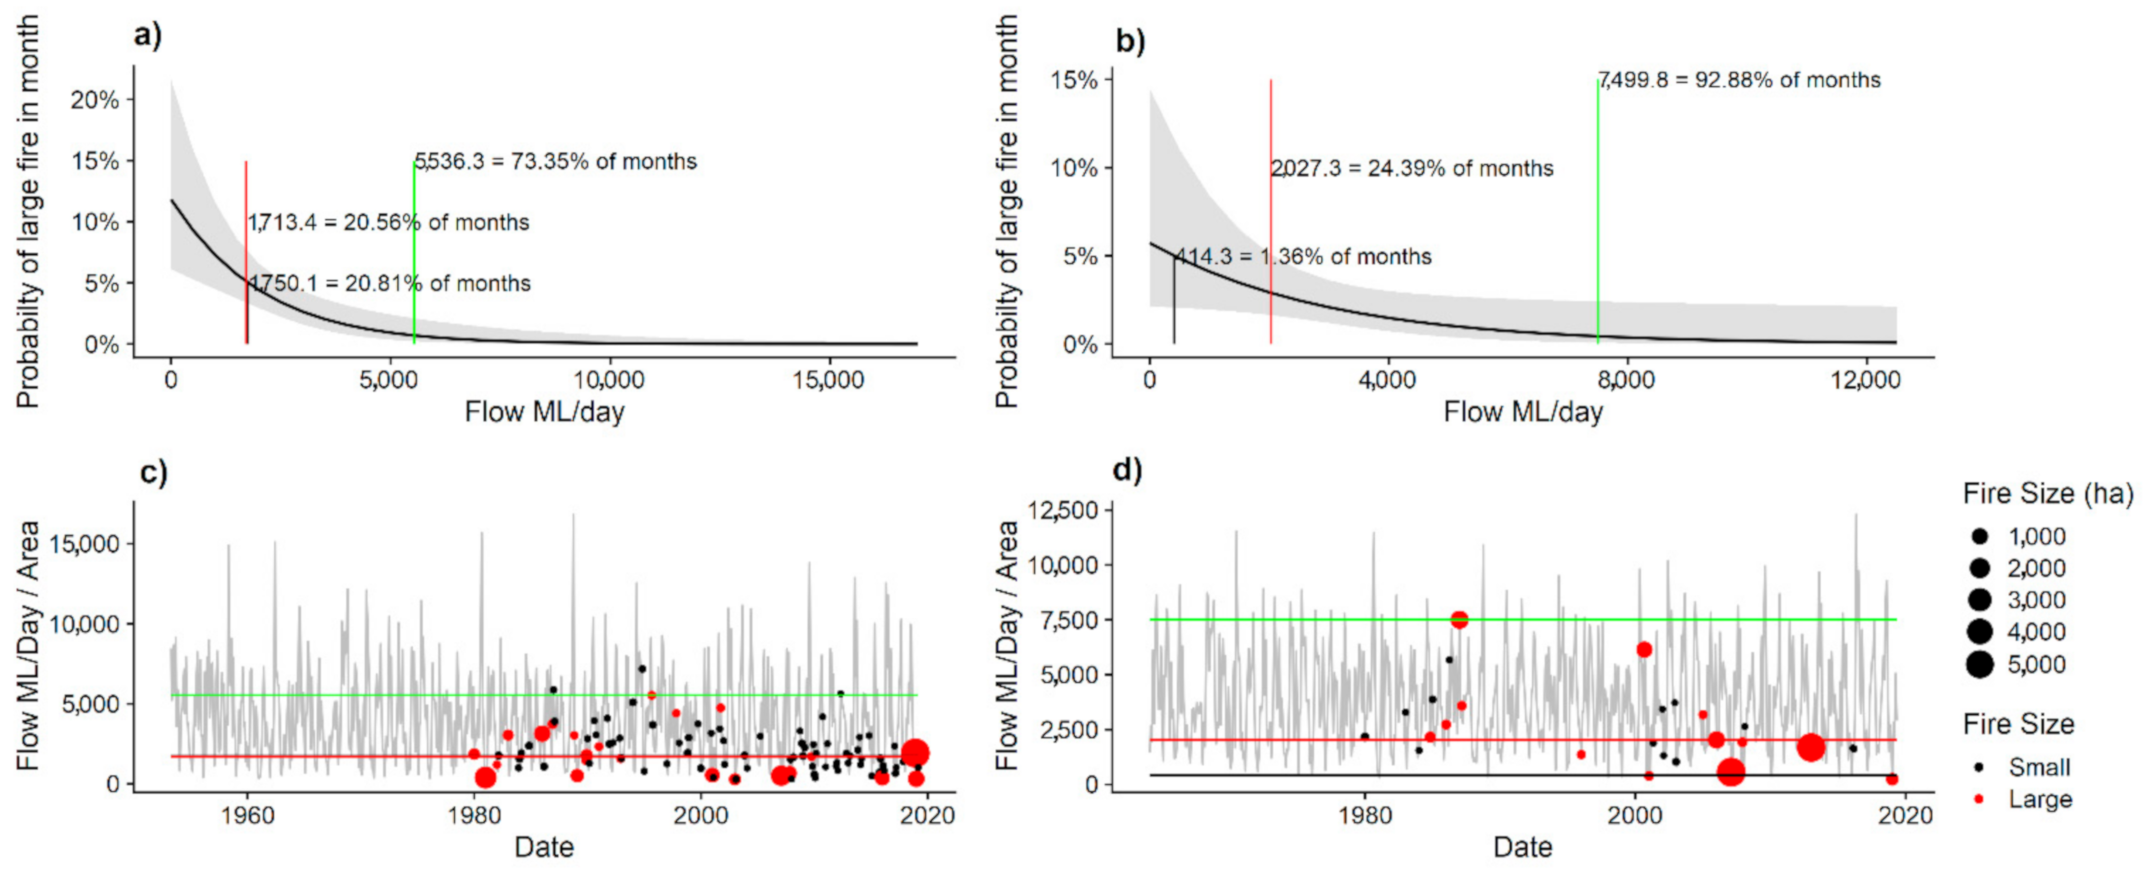
We found a statistical relationship between river flows and the occurrence of fires in the ecohydrological land and water management domains. The logistic model of monthly large fire occurrence based on river flow showed a significant negative association between fire occurrence and river flow (p < 0.05 for both Franklin and Davey rivers), with a higher probability of fire occurrence during periods of low flow (Figure 4). We chose to investigate the river flow associated with a 5% probability of large fire occurrence, which occurred with a flow below 1750 L ML/day for the Franklin River, and 414.3 ML/day for the Davey River. This low flow threshold agreed well with the median flow threshold, calculated as the flow rate below which 50% of the large fires occurred, for the Franklin River (1713.4 ML/day) but was significantly lower than the median flow threshold for the Davey River (2027.3 ML/day). The lower flow associated with that 5% fire probability for the Davey River reflects the lower overall incidence of fire in that catchment (Figure 4c vs. Figure 4d) over the available historical record, with only 1.36% of months in the Davey River catchment falling below that low flow threshold. We therefore chose to consider the simple median flow threshold in the subsequent analysis of the frequency of elevated fire risk months for the two rivers.
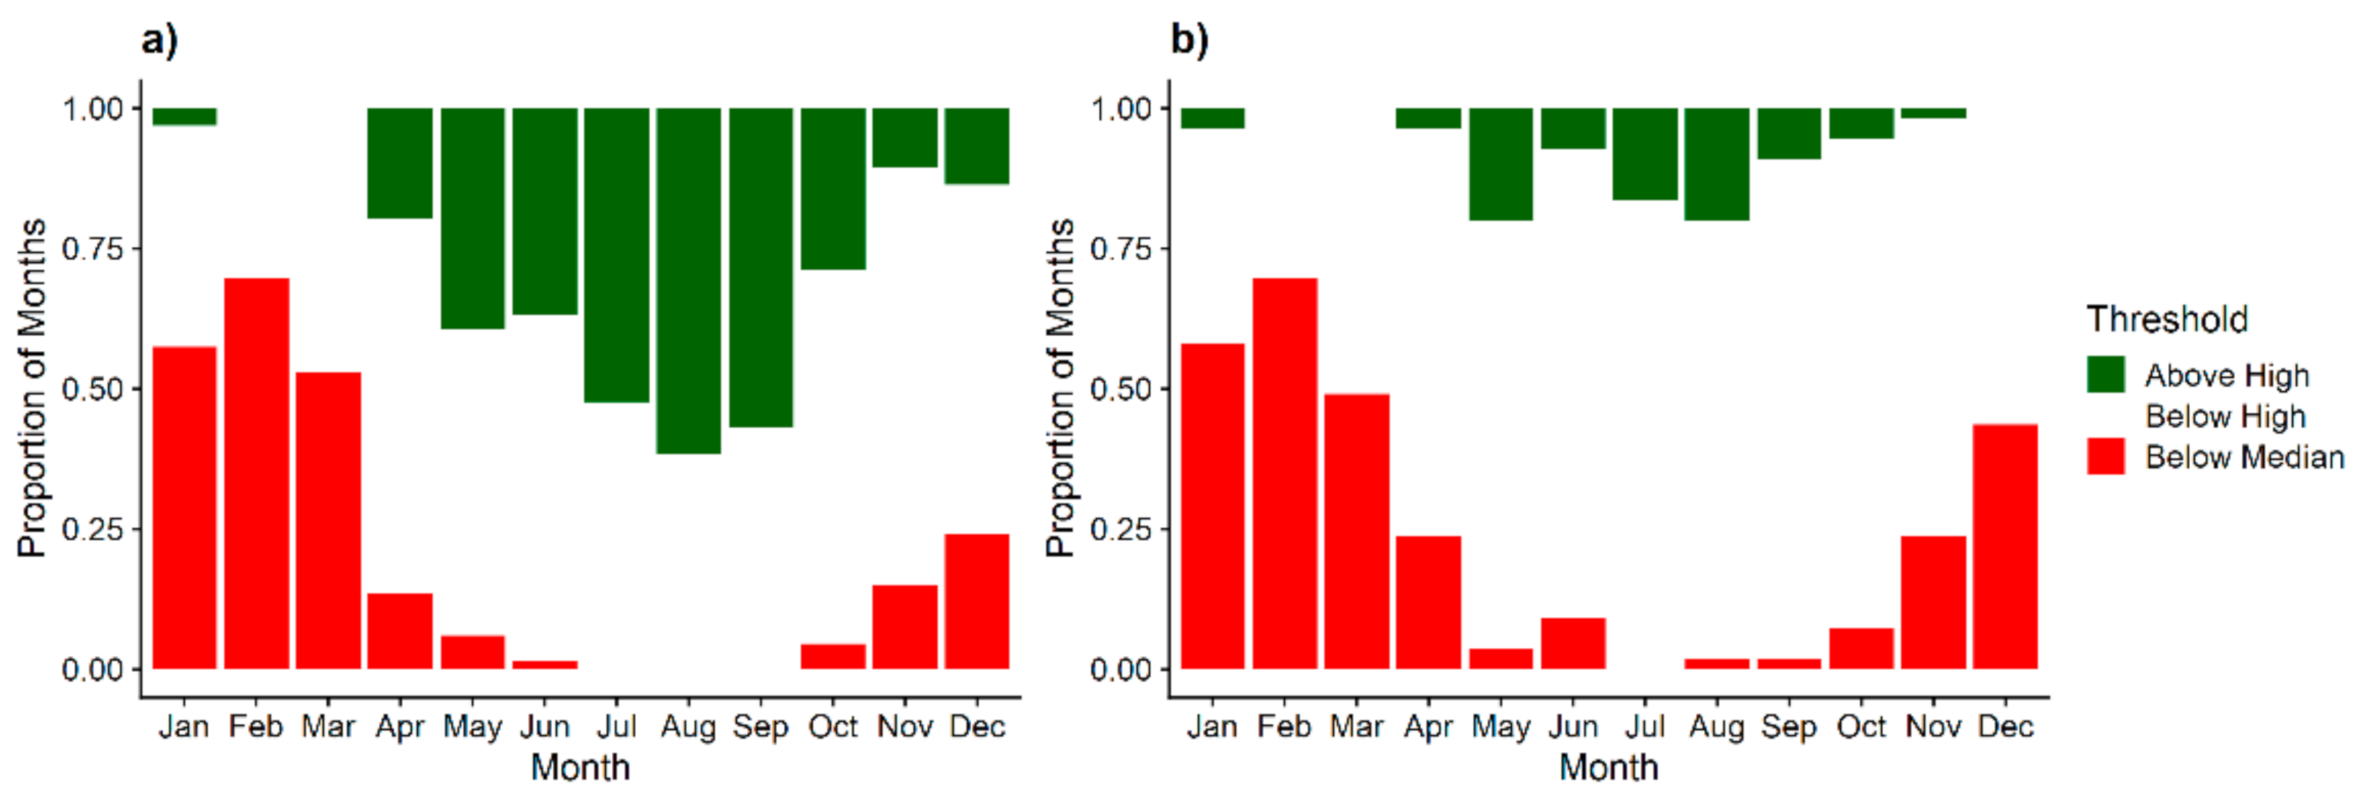
For both the Franklin and Davey rivers, clear seasonal patterns of low river flow associated with high fire risk are evident (Figure 5) with February being the month most frequently experiencing conditions below the median threshold in both rivers across the historical record, followed by January and March. Winter months frequently experience wet, high flow conditions above the high flow threshold beyond which no large fires were recorded.
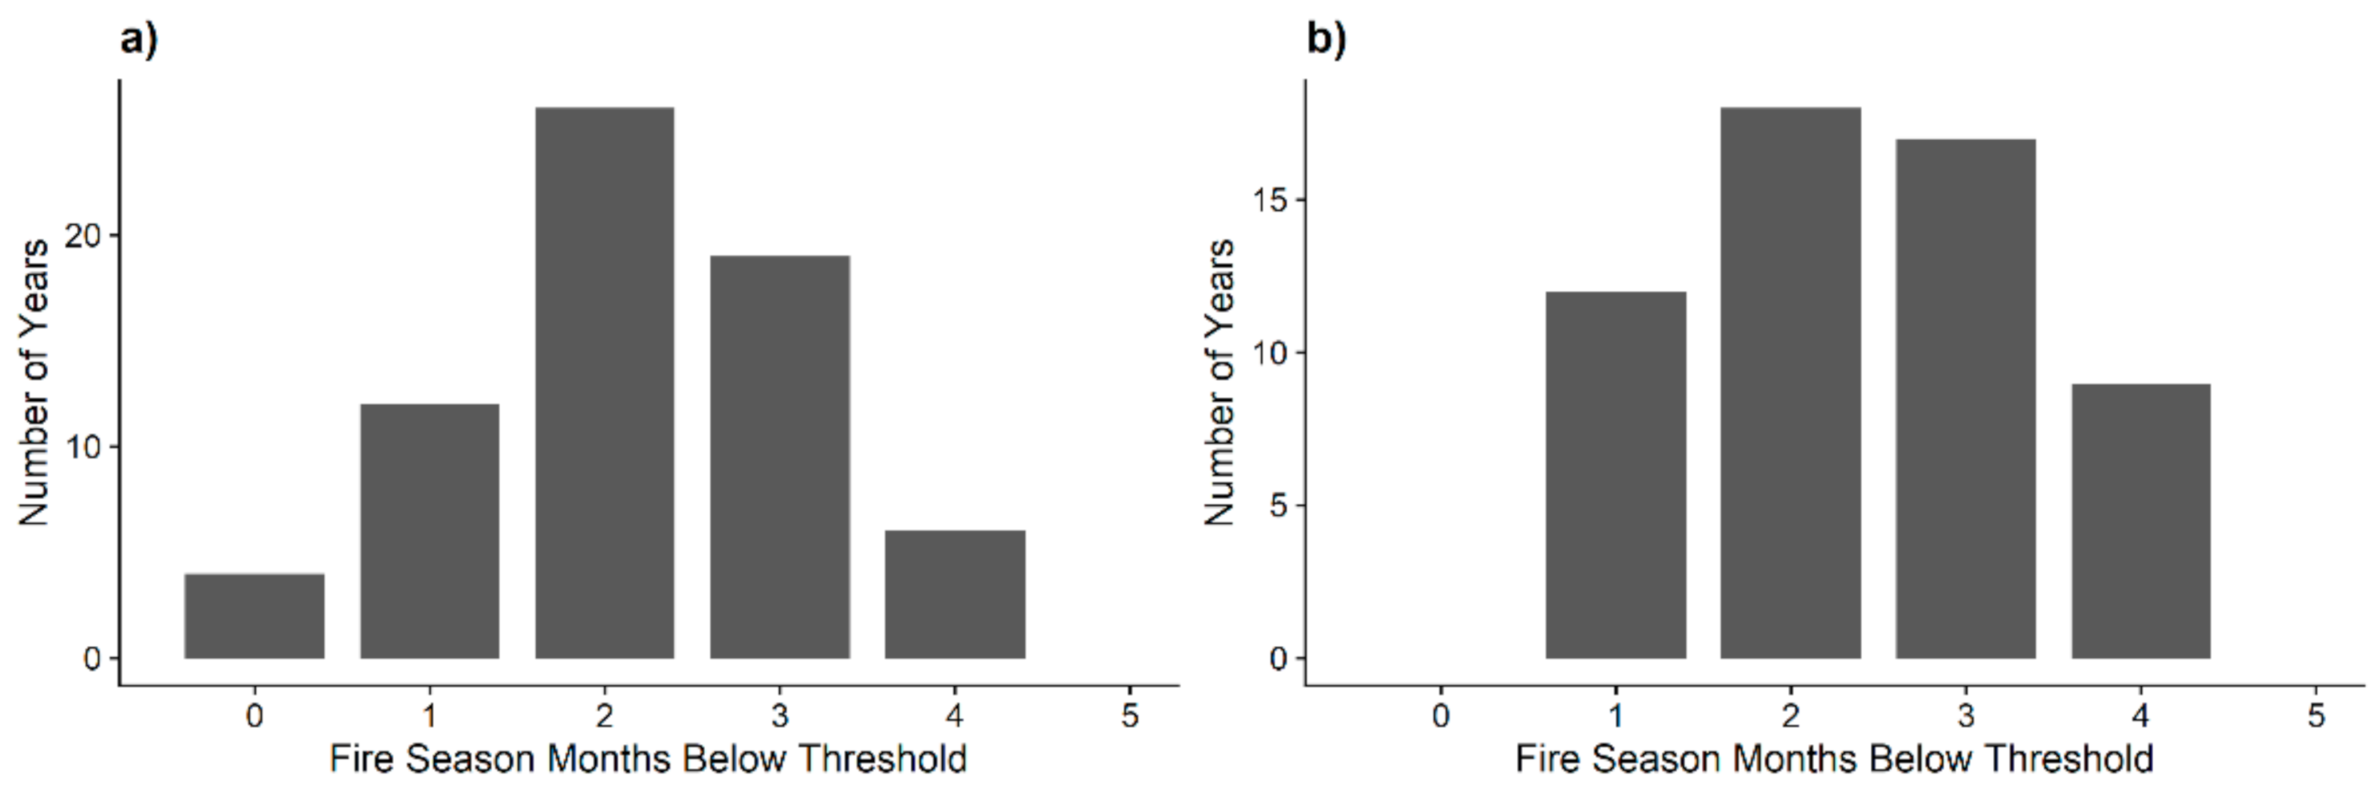
Our summary of the frequency of the number of months within each summer fire season (defined broadly as November to March inclusive) in which river flows were below the median flow threshold is shown in Figure 6. In both the Franklin and Davey rivers, it is most common for there to be two months below the medium flow threshold per year, with only the Franklin river experiencing four years where no summer months were below the median flow threshold.
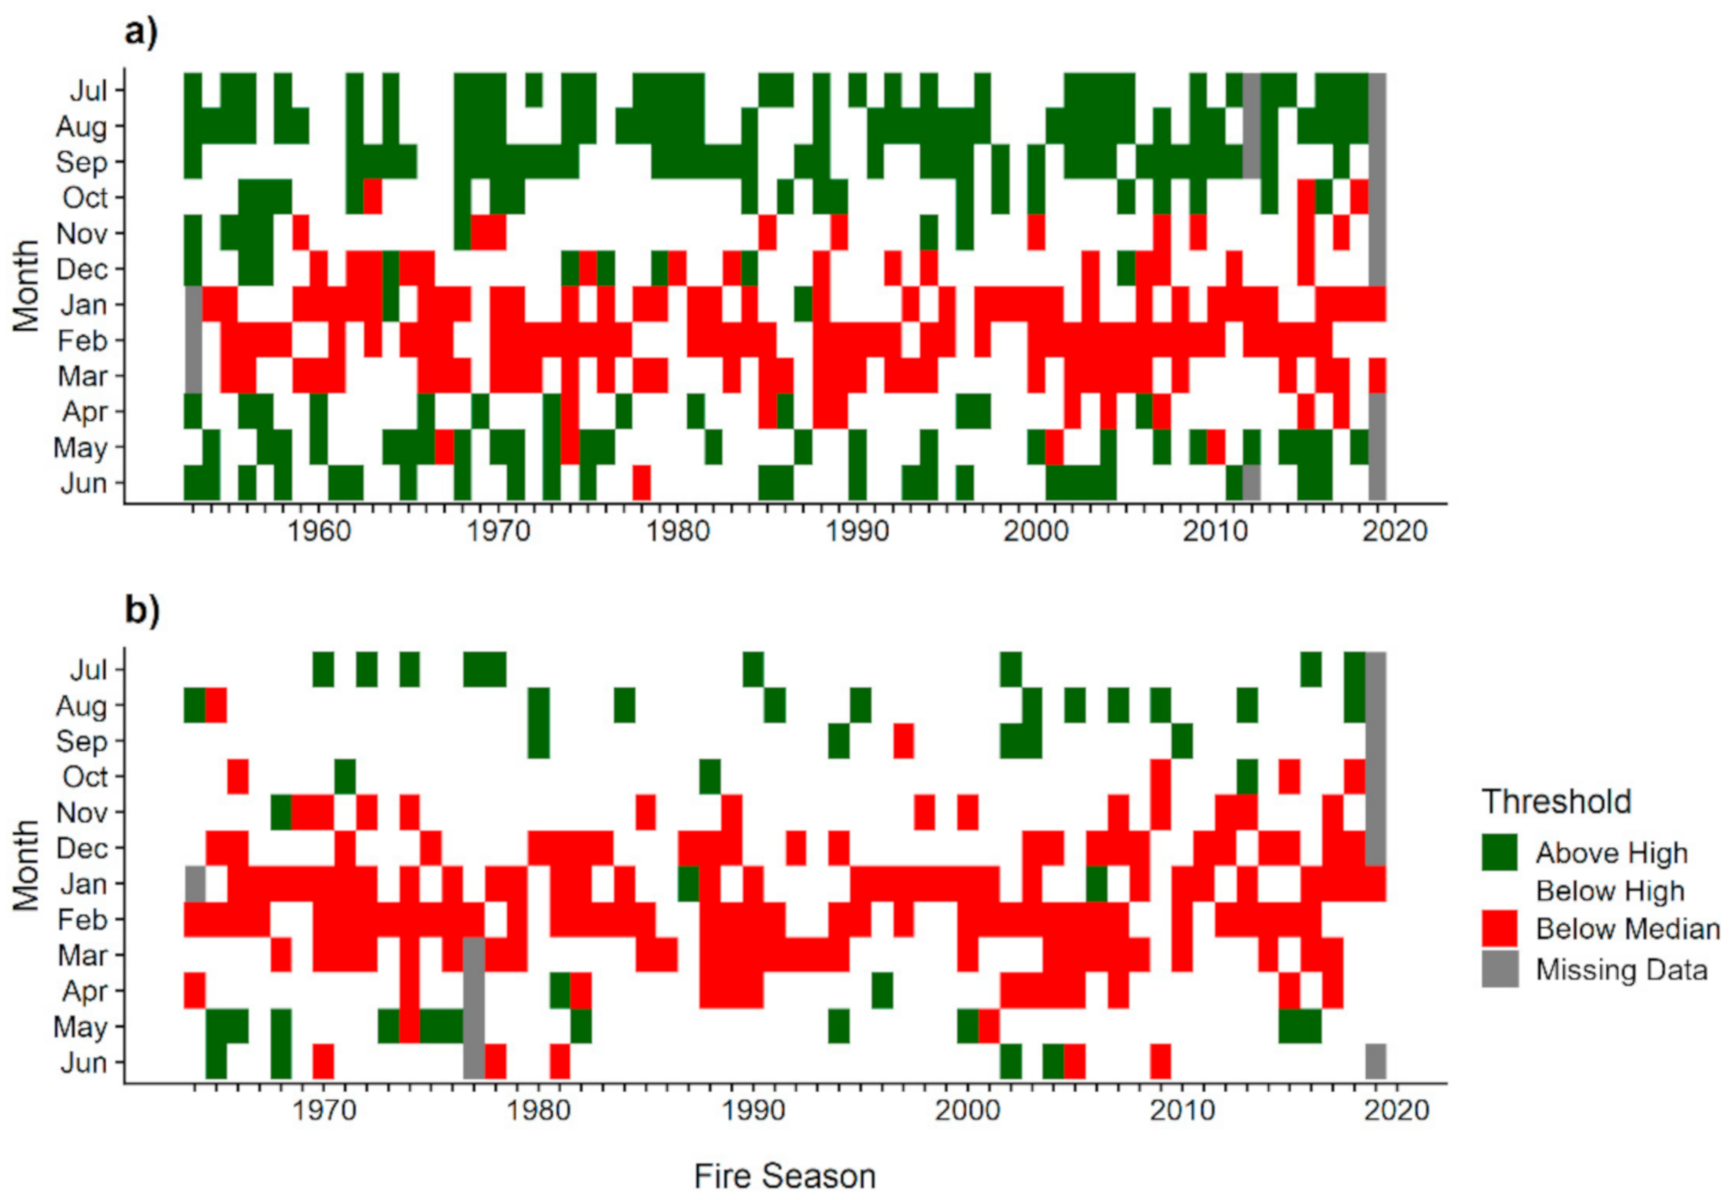
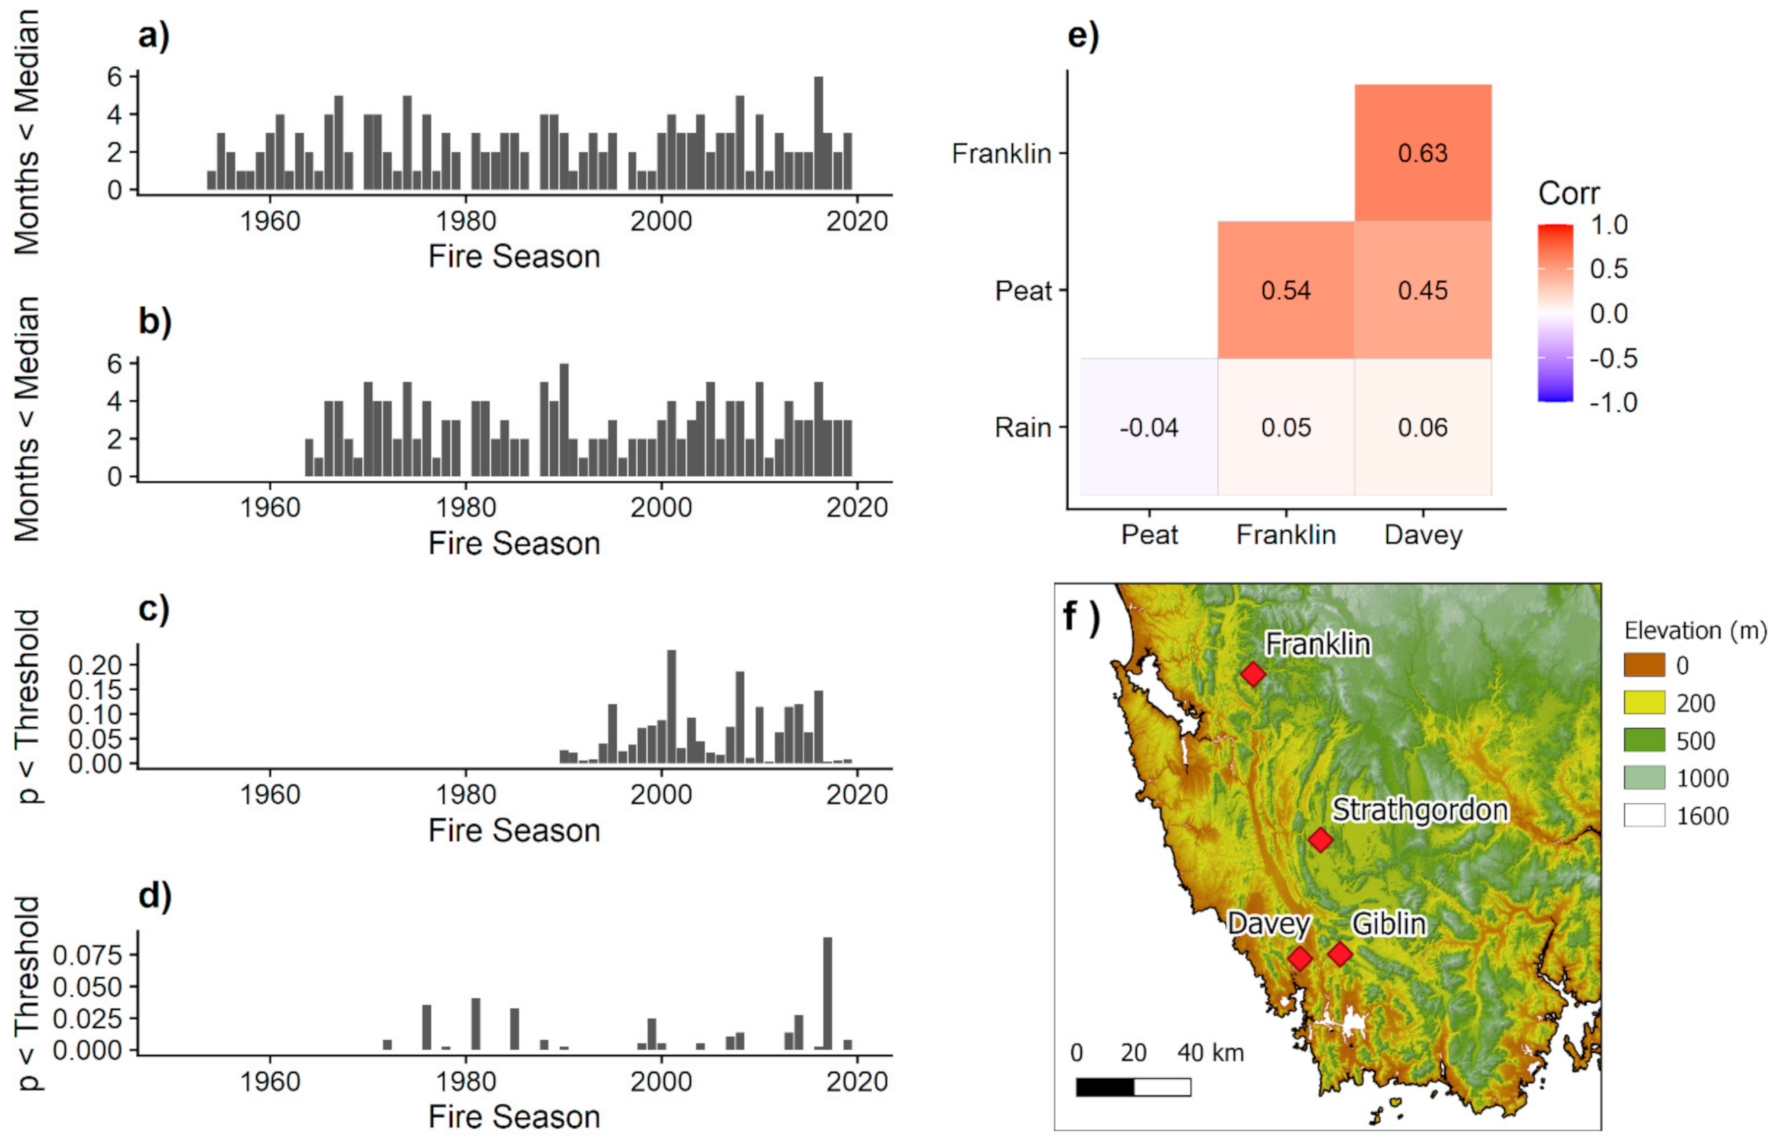
Time-series plots of months below the median or above the high flow threshold (Figure 7) highlight the potential utility of the median fire threshold river flow rate in detecting months with higher likelihood of fire, with strong intra- and interannual patterning in above- and below-threshold months, including highlighting dry periods outside the summer fire season. Plots of the count of months per fire season below the median flow threshold (Figure 8a,b) show no strong trends in drying over time, but this threshold may provide a useful index of change in the future under climate change. Broadly, our estimates of forest fire risk correlate with another index of fire risk in organic sedgeland and scrub soils [18] (Figure 8c) but differ from an index of the risk of fire in temperate rainforest [17] (Figure 8d), which is much more conservative, reflecting the extremely drier conditions required for fire spread in rainforests. The correlation matrix of Pearson correlation coefficients for fire-season level summaries of time-below-medium flow threshold (Figure 8e) highlights the high concordance of river flow fire risk estimates with the index of risk of organic soil combustion, and the weaker relationship with rainforest fire risk index. It should be noted that sample locations at which these indices were derived are not all spatially coincident (Figure 8f) but are close enough that seasonal precipitation and drying patterns should be comparable.
4. Discussion
Our analysis shows that the flows of two major Tasmanian undammed rivers provide a reliable landscape proxy for forest flammability in the TWWHA. The historical river flow record shows that the Eucalyptus forests and rainforests in the TWWHA are available to burn every year, typically over a two-to-three-month period centred on the austral summer month of February. Our study has implications for both understanding and managing fire regimes in the TWWHA as outlined below.
The TWWHA area is one of the wettest environments in Australia, with limited season variation and no pronounced spring snow melt. Consequently, river flows fluctuate throughout the year. There is considerable inter-annual variability in rainfall, which has been shown to be an important predictor of area burnt in Tasmania [28]. During dry spells the landscape can become flammable but there are pronounced differences among vegetation types. Treeless sedgelands are available to burn under a much wider range of fuel moistures than forests [19], strongly shaping both seasonal occurrence and geographical fire patterns [15]. Sedgeland fires typically self-extinguish on forest edges and have little effect on organic soils upon which they grow. However, under very dry conditions, which typically occur at least once each summer, sedgeland fires can damage organic sedgeland soils [18], and can sometimes spread into surrounding forests [29]. Our analysis shows that our fire risk threshold using river flows broadly corresponds to other indices that assess risk to organic soils (Figure 8). Such concordance instils confidence in our ecohydrological fire risk index. The weaker relationship between the river flow and the rainforest fire risk indices is explicable because rainforests only rarely become available to burn following prolonged dryness [17].
The river flow analysis provides an important context to understand the temporal variation in forest fire risk. Overall, our study identifies the forest fire season in TWWHA as between December through to March. The climatological analysis of Fox-Hughes [30] also identified low fire risk in spring months in western Tasmania. An analysis of observed MODIS satellite ‘hotspots’ across Australia [31] identified a slightly later fire season, from February to April. This difference from our study no doubt reflects the combining of uncontrolled wildfires in the high summer months with prescribed burning of sedgeland and forest regeneration burning, the latter undertaken in the late summer and autumn months when fires are unlikely to escape into surrounding forests [32]. Climate projections suggest that the western Tasmania, and hence the TWWHA, will become drier due to reduced summer rainfall and higher temperatures, leading to an increase in fire risk, and broadening of the fire season in spring [33]. Our analysis, however, does not show a trend towards worsening fire weather. Indeed, reconstructed summer flows for the King River in western Tasmania, based on tree-ring analysis, suggest that 20th century flows are similar to the last 400 years [34]. Given this consistency, river flows are a useful baseline to track changing forest risk in response to climate change. The lack of a drying trend apparent in this analysis also suggests that the observed increase in fires ignited by lightning in western Tasmania may reflect an increase in the number or intensity of lightning storms rather than greater ignitability of fuels due to dryness although the short time series of lightning data precludes resolution of this conjecture [29,35].
We know of no prior studies that have used river flows to assess forest fire risk [36], although note that one study has shown a relationship between extensive fires in river catchments in Siberia and reduced late summer/autumn river flows [37]. Serious consideration should be given to monitoring flows of other undammed rivers in the region to provide managers with a simple estimate of forest fire risk and encourage other researchers to explore the relationship between historical river flow records and landscape fire activity. We suspect this approach of using river levels may be transferable to other high rainfall environments globally, which are likely to be increasingly impacted by forest fires due to climate change [36,38,39]. An important constraint with using river flows is it is likely most effective where soil moisture and river flows are tightly coupled (Figure 3). Our approach is likely unsuitable for rivers where this coupling between flows and soil moisture is weaker, such as watersheds with large groundwater flows or where the catchment area is large and there are pronounced climatic gradients, as well as in regions with prolonged dry seasons conducive for landscape fire (such as Mediterranean and monsoonal climates) when river flows are consistently low. Additionally, our approach provides a baseline for subsequent research to discover how the size and severity of fires affects river flows.
We acknowledge a limitation of our study is the low number of fires that have occurred within our ecohydrological domains, restricting our capacity to precisely define forest fire danger thresholds using logistic modelling. A high flow threshold (0% probability) when no fires ever occur can only delineate the winter months, whereas a low flow threshold (5% probability) of forest fire risk is too restrictive. Accordingly, we used a median flow threshold representing the level above with 50% of the large fires occurred, and below which 50% of the large fires occurred—this does not represent a probability of fire occurrence, but is a sensitive, conservative index of when the landscape is available to burn. We believe our fire risk index based on river flow is conservative because it represents river flows thresholds at which half of the large forest fires have occurred. We suggest, therefore, river flows can provide a readily interpretable index of landscape flammability in Tasmanian Wilderness World Heritage Area (TWWHA).
Author Contributions
Conceptualization, D.M.J.S.B.; methodology, and analysis G.J.W.; writing—original draft preparation, D.M.J.S.B.; writing—review and editing, G.J.W.; visualization, G.J.W. All authors have read and agreed to the published version of the manuscript.
Funding
ARC Discovery—DP200102395 and NSW Bushfire Risk Management Research Hub, New South Wales Department of Planning, Industry & Environment.
Institutional Review Board Statement
Not applicable.
Informed Consent Statement
Not applicable.
Data Availability Statement
River flow data are available at: http://www.bom.gov.au/jsp/ncc/climate_averages/rainfall/index.jsp#info (accessed on 3 March 2021). Vegetation cover data available at: https://dpipwe.tas.gov.au/conservation/development-planning-conservation-assessment/planning-tools/monitoring-and-mapping-tasmanias-vegetation-(tasveg)/tasveg-the-digital-vegetation-map-of-tasmania (accessed on 4 March 2021). Ecohydrologcal domain definitions and polygons are available at: https://dpipwe.tas.gov.au/water/water-monitoring-and-assessment/cfev-program/cfev-resources#TheCFEVTechnicalReport (accessed on 3 March 2021). Fire history s=data are available at: https://www.thelist.tas.gov.au/app/content/data/geo-meta-data-record?detailRecordUID=b94d4388-995d-416a-9844-a39de2798bed (accessed on 3 March 2021).
Acknowledgments
We acknowledge the excellent data resources developed by the Tasmanian Government, without which this study would have been impossible. We thank Lynda Prior for her helpful comments on an earlier draft of this paper and the helpful comment of three anonymous reviewers.
Conflicts of Interest
The authors declare no conflict of interest. The funders had no role in the design of the study; in the collection, analyses, or interpretation of data; in the writing of the manuscript, or in the decision to publish the results.
References
- Hardy, C.C. Wildland fire hazard and risk: Problems, definitions, and context. For. Ecol. Manag. 2005, 211, 73–82. [Google Scholar] [CrossRef]
- Nolan, R.H.; Boer, M.M.; Resco de Dios, V.; Caccamo, G.; Bradstock, R.A. Large-scale, dynamic transformations in fuel moisture drive wildfire activity across southeastern Australia. Geophys. Res. Lett. 2016, 43, 4229–4238. [Google Scholar] [CrossRef] [Green Version]
- Slijepcevic, A.; Anderson, W. Hourly variation in fine fuel moisture in eucalypt forests in Tasmania. For. Ecol. Manag. 2006, 234, S36. [Google Scholar] [CrossRef]
- Flannigan, M.D.; Wotton, B.M.; Marshall, G.A.; de Groot, W.J.; Johnston, J.; Jurko, N.; Cantin, A.S. Fuel moisture sensitivity to temperature and precipitation: Climate change implications. Clim. Chang. 2016, 134, 59–71. [Google Scholar] [CrossRef]
- Noble, I.; Gill, A.; Bary, G. McArthur’s fire-danger meters expressed as equations. Aust. J. Ecol. 1980, 5, 201–203. [Google Scholar] [CrossRef]
- Keetch, J.J.; Byram, G.M. A Drought Index for Forest Fire Control; US Department of Agriculture, Forest Service, Southeastern Forest Experiment Station: Asheville, NC, USA, 1968; Volume 38.
- Field, R.; Spessa, A.; Aziz, N.; Camia, A.; Cantin, A.; Carr, R.; De Groot, W.; Dowdy, A.; Flannigan, M.; Manomaiphiboon, K. Development of a global fire weather database. Nat. Hazards Earth Syst. Sci. 2015, 15, 1407–1423. [Google Scholar] [CrossRef] [Green Version]
- Marlon, J.R.; Bartlein, P.J.; Gavin, D.G.; Long, C.J.; Anderson, R.S.; Briles, C.E.; Brown, K.J.; Colombaroli, D.; Hallett, D.J.; Power, M.J. Long-term perspective on wildfires in the western USA. Proc. Natl. Acad. Sci. USA 2012, 109, E535–E543. [Google Scholar] [CrossRef] [Green Version]
- Westerling, A.L. Increasing western US forest wildfire activity: Sensitivity to changes in the timing of spring. Philos. Trans. R. Soc. B: Biol. Sci. 2016, 371, 20150178. [Google Scholar] [CrossRef]
- Department of Primary Industries Parks Water and Environment. Tasmanian Wilderness World Heritage Area Management Plan 2016; Department of Primary Industries, Parks, Water and Environment: Hobart, Australia, 2016.
- Department of Agriculture Water and the Environment. World Heritage Places—Tasmanian Wilderness. Available online: http://www.environment.gov.au/heritage/places/world/tasmanian-wilderness (accessed on 3 March 2021).
- Bureau of Meteorology. Mean Monthly, Seasonal and Annual Rainfall Data (Base Climatological Data Sets). Available online: http://www.bom.gov.au/jsp/ncc/climate_averages/rainfall/index.jsp#info (accessed on 3 March 2021).
- Bowman, D.M.; Perry, G.L. Soil or fire: What causes treeless sedgelands in Tasmanian wet forests? Plant Soil 2017, 420, 1–18. [Google Scholar] [CrossRef]
- Tng, D.; Williamson, G.; Jordan, G.; Bowman, D. Giant eucalypts-globally unique fire-adapted rain-forest trees? New Phytol. 2012, 196, 1001–1014. [Google Scholar] [CrossRef]
- Wood, S.W.; Murphy, B.P.; Bowman, D.M. Firescape ecology: How topography determines the contrasting distribution of fire and rain forest in the south-west of the Tasmanian Wilderness World Heritage Area. J. Biogeogr. 2011, 38, 1807–1820. [Google Scholar] [CrossRef]
- Press, A. Tasmanian Wilderness World Heritage Area Bushfire and Climate Change Research Project; Tasmanian Government: Hobart, Australia, 2016.
- Styger, J.; Kirkpatrick, J.B. Less than 50 millimetres of rainfall in the previous month predicts fire in Tasmanian rainforest. Pap. Proc. R. Soc. Tasman. 2015, 149, 1–5. [Google Scholar] [CrossRef] [Green Version]
- Prior, L.D.; French, B.J.; Storey, K.; Williamson, G.J.; Bowman, D.M. Soil moisture thresholds for combustion of organic soils in western Tasmania. Int. J. Wildland Fire 2020, 29, 637–647. [Google Scholar] [CrossRef]
- Marsden-Smedley, J.B.; Catchpole, W.R.; Pyrke, A. Fire modelling in Tasmanian buttongrass moorlands. IV. Sustaining versus non-sustaining fires. Int. J. Wildland Fire 2001, 10, 255–262. [Google Scholar] [CrossRef]
- Bureau of Meteorology. Water Data Online. Available online: http://www.bom.gov.au/waterdata/ (accessed on 3 March 2021).
- Department of Primary Industries Parks Water and Environment. The CFEV Assessment Framework Summary. Available online: https://dpipwe.tas.gov.au/water/water-monitoring-and-assessment/cfev-program/cfev-resources#TheCFEVTechnicalReport (accessed on 3 March 2021).
- Bureau of Meteorology. Atmospheric High-Resolution Regional Reanalysis for Australia. Available online: http://www.bom.gov.au/research/projects/reanalysis/ (accessed on 3 March 2021).
- Department of Primary Industries Parks Water and Environment. Fire History. Available online: https://www.thelist.tas.gov.au/app/content/data/geo-meta-data-record?detailRecordUID=b94d4388-995d-416a-9844-a39de2798bed (accessed on 3 March 2021).
- Department of Primary Industries Parks Water and Environment. TASVEG—The Digital Vegetation Map of Tasmania. Available online: https://dpipwe.tas.gov.au/conservation/development-planning-conservation-assessment/planning-tools/monitoring-and-mapping-tasmanias-vegetation-(tasveg)/tasveg-the-digital-vegetation-map-of-tasmania (accessed on 4 March 2021).
- Team, R.C. R: A Language and Environment for Statistical Computing. Available online: https://www.R-project.org/ (accessed on 4 March 2021).
- Pebesma, E. Simple features for R: Standardized support for spatial vector data. R J. 2018, 10, 439–446. [Google Scholar] [CrossRef] [Green Version]
- Lüdecke, D. Ggeffects: Tidy data frames of marginal effects from regression models. J. Open Source Softw. 2018, 3, 772. [Google Scholar] [CrossRef] [Green Version]
- Nicholls, N.; Lucas, C. Interannual variations of area burnt in Tasmanian bushfires: Relationships with climate and predictability. Int. J. Wildland Fire 2007, 16, 540–546. [Google Scholar] [CrossRef]
- Styger, J.; Marsden-Smedley, J.; Kirkpatrick, J. Changes in lightning fire incidence in the Tasmanian wilderness world heritage area, 1980–2016. Fire 2018, 1, 38. [Google Scholar] [CrossRef] [Green Version]
- Fox-Hughes, P. A fire danger climatology for Tasmania. Aust. Meteorol. Mag. 2008, 57, 109–120. [Google Scholar]
- Williamson, G.J.; Prior, L.D.; Jolly, W.M.; Cochrane, M.A.; Murphy, B.P.; Bowman, D.M. Measurement of inter-and intra-annual variability of landscape fire activity at a continental scale: The Australian case. Environ. Res. Lett. 2016, 11, 035003. [Google Scholar] [CrossRef] [Green Version]
- Tasmania, S.T. Planned Burns: What We Do. Available online: https://www.sttas.com.au/forest-operations-management/our-operations/planned-burns (accessed on 3 March 2021).
- Fox-Hughes, P.; Harris, R.; Lee, G.; Grose, M.; Bindoff, N. Future fire danger climatology for Tasmania, Australia, using a dynamically downscaled regional climate model. Int. J. Wildland Fire 2014, 23, 309–321. [Google Scholar] [CrossRef]
- Allen, K.; Nichols, S.; Evans, R.; Cook, E.; Allie, S.; Carson, G.; Ling, F.; Baker, P. Preliminary December–January inflow and streamflow reconstructions from tree rings for western T asmania, southeastern A ustralia. Water Resour. Res. 2015, 51, 5487–5503. [Google Scholar] [CrossRef]
- Nampak, H.; Love, P.; Fox-Hughes, P.; Watson, C.; Aryal, J.; Harris, R. Characterizing Spatial and Temporal Variability of Lightning Activity Associated with Wildfire over Tasmania, Australia. Fire 2021, 4, 10. [Google Scholar] [CrossRef]
- Bowman, D. When will the jungle burn? Nat. Clim. Chang. 2017, 7, 390–391. [Google Scholar] [CrossRef]
- Ponomarev, E.I.; Ponomareva, T.V.; Prokushkin, A.S. Intraseasonal Dynamics of River Discharge and Burned Forest Areas in Siberia. Water 2019, 11, 1146. [Google Scholar] [CrossRef] [Green Version]
- Watt, M.S.; Kirschbaum, M.U.; Moore, J.R.; Pearce, H.G.; Bulman, L.S.; Brockerhoff, E.G.; Melia, N. Assessment of multiple climate change effects on plantation forests in New Zealand. For. Int. J. For. Res. 2019, 92, 1–15. [Google Scholar] [CrossRef]
- Seidl, R.; Thom, D.; Kautz, M.; Martin-Benito, D.; Peltoniemi, M.; Vacchiano, G.; Wild, J.; Ascoli, D.; Petr, M.; Honkaniemi, J. Forest disturbances under climate change. Nat. Clim. Chang. 2017, 7, 395–402. [Google Scholar] [CrossRef] [PubMed] [Green Version]
Figure 1.
Map of study location in Tasmania, showing location of Franklin and Davey river gauges, surrounding eco-hydrological domains other major rivers, as well as extent of forest vegetation.
Figure 1.
Map of study location in Tasmania, showing location of Franklin and Davey river gauges, surrounding eco-hydrological domains other major rivers, as well as extent of forest vegetation.

Figure 2.
Flow diagram showing the steps taken to use river flow to develop thresholds that estimate forest fire risk using river flow data in the Tasmanian Wilderness World Heritage Area. Data input is historical river flows for the Franklin and Davey Rivers, historic burnt forest area surrounding each river catchment, and soil moisture derived from the BARRA meteorological reanalysis. Analytical steps are provided in the text.

Figure 3.
Regression of mean monthly river flow against modelled soil moisture for the (a) Franklin River and (b) Davey River. Model validation plots of river flow based on monthly BARRA-TA catchment surface layer soil moisture for (c) Franklin River and (d) Davey River for the 2015–2018 validation period. One to one validation line is shown in red, and modelled line in blue, with standard errors. Validation data points are shown in black. Shaded areas represent 95% model confidence intervals.

Figure 4.
Logistic regression model of large fire occurrence against river flow for (a) Franklin River and (b) Davey River, showing the 5% probability low flow threshold in black, the median large fire occurrence in red, and the high flow threshold in green. Time series plots of monthly river flow for the (c) Franklin River and (d) Davey River are shown below, with the three threshold flows indicated, and large (red) and small (black) fire occurrences and size indicated by circles. Note the red and black lines overlap in panels (a,c). Fires only occur at river levels where there is a close relationship between river flow levels and soil moisture (Figure 3).

Figure 5.
Frequency of months across the historical river flow record for the (a) Franklin River and (b) Davey River, during which the months were below the median flow threshold (red) and above the high flow threshold (green).
Figure 5.
Frequency of months across the historical river flow record for the (a) Franklin River and (b) Davey River, during which the months were below the median flow threshold (red) and above the high flow threshold (green).

Figure 6.
Characterization of forest fire season based on river flows. Frequency of the number of summer (November-March) months in the historical river gauge records fire for the (a) Franklin River and (b) Davey River when flows were below the median probability of forest fires occurrence in the respective surrounding ecohydrological domains identified by this analysis.

Figure 7.
Monthly river flow classified as above and below high and median thresholds for forest fire risk identified for this analysis for the (a) Franklin River and (b) Davey River based on respective historical river flow records.
Figure 7.
Monthly river flow classified as above and below high and median thresholds for forest fire risk identified for this analysis for the (a) Franklin River and (b) Davey River based on respective historical river flow records.

Figure 8.
Number of months per fire season (July to June) below the median flow threshold for the (a) Franklin and (b) Davey rivers; (c) the proportion of the fire season with soil moisture content below the 17% threshold at the location of the Giblin River fire based on [18], and (d) the proportion of the fire season where the previous 30 days had <50 mm of precipitation at Strathgordon based on [17]. Panel (e) shows Pearson correlation coefficients between the seasonal indices shown in panels (a–d) for coinciding years of data availability. Map (f) shows the location of the sample points the data was taken for on a map of elevation for the area.

Publisher’s Note: MDPI stays neutral with regard to jurisdictional claims in published maps and institutional affiliations. |
© 2021 by the authors. Licensee MDPI, Basel, Switzerland. This article is an open access article distributed under the terms and conditions of the Creative Commons Attribution (CC BY) license (https://creativecommons.org/licenses/by/4.0/).
Share and Cite
MDPI and ACS Style
Bowman, D.M.J.S.; Williamson, G.J. River Flows Are a Reliable Index of Forest Fire Risk in the Temperate Tasmanian Wilderness World Heritage Area, Australia. Fire 2021, 4, 22. https://0-doi-org.brum.beds.ac.uk/10.3390/fire4020022
AMA Style
Bowman DMJS, Williamson GJ. River Flows Are a Reliable Index of Forest Fire Risk in the Temperate Tasmanian Wilderness World Heritage Area, Australia. Fire. 2021; 4(2):22. https://0-doi-org.brum.beds.ac.uk/10.3390/fire4020022
Chicago/Turabian StyleBowman, David M. J. S., and Grant J. Williamson. 2021. "River Flows Are a Reliable Index of Forest Fire Risk in the Temperate Tasmanian Wilderness World Heritage Area, Australia" Fire 4, no. 2: 22. https://0-doi-org.brum.beds.ac.uk/10.3390/fire4020022