
Broad-Scale Surface and Atmospheric Conditions during Large Fires in South-Central Chile


1
Department of Earth Sciences, Montana State University, Bozeman, MT 59717, USA
2
Department of Geophysics, Universidad de Chile, Santiago 8320000, Chile
3
Center for Climate and Resilience Research, CR2, Universidad de Chile, Santiago 8320000, Chile
4
Department of Geography, Portland State University, Portland, OR 97201, USA
5
U.S. Geological Survey, Northern Rocky Mountain Science Center, Bozeman, MT 59715, USA
*
Author to whom correspondence should be addressed.
Fire 2021, 4(2), 28; https://0-doi-org.brum.beds.ac.uk/10.3390/fire4020028
Submission received: 12 April 2021
/
Revised: 3 May 2021
/
Accepted: 6 May 2021
/
Published: 15 May 2021
Abstract
:The unprecedented size of the 2017 wildfires that burned nearly 600,000 hectares of central Chile highlight a need to better understand the climatic conditions under which large fires develop. Here we evaluate synoptic atmospheric conditions at the surface and free troposphere associated with anomalously high (active) versus low (inactive) months of area burned in south-central Chile (ca. 32–41° S) from the Chilean Forest Service (CONAF) record of area burned from 1984–2018. Active fire months are correlated with warm surface temperatures, dry conditions, and the presence of a circumpolar assemblage of high-pressure systems located ca. 40°–60° S. Additionally, warm surface temperatures associated with active fire months are linked to reduced strength of cool, onshore westerly winds and an increase in warm, downslope Andean Cordillera easterly winds. Episodic warm downslope winds and easterly wind anomalies superimposed on long-term warming and drying trends will continue to create conditions that promote large fires in south-central Chile. Identifying the mechanisms responsible for easterly wind anomalies and determining whether this trend is strengthening due to synoptic-scale climatic changes such as the poleward shift in Southern Hemisphere westerly winds will be critical for anticipating future large fire activity in south-central Chile.
1. Introduction
In recent years, large wildfires have affected human communities throughout central and southern Chile along the subtropical Mediterranean and transitional-temperate west coast of South America. During the 2016–2017 fire season, wildfires burned nearly 600,000 hectares in central Chile, the largest area burned during a single fire season since detailed records of fire activity began in the 1960s [1]. In 2014, major fires near the cities of Valparaíso and Santiago destroyed thousands of homes and forced more than 10,000 people to evacuate. While changing climatic and biophysical conditions, land-use transitions, and changes in the vegetation and fuel characteristics are all thought to be partially responsible for these large fires [2,3], the role that broad-scale surface and atmospheric conditions play in driving the spread of large fires is still not well understood.
The primary controls on fire activity vary across spatiotemporal scales, from factors associated with individual fire events to patterns of fire activity that occur over decades to centuries that characterize a fire regime [4]. At global spatial scales, biophysical conditions (e.g., climate, substrate, insolation) and primary productivity gradients determine fuel type, availability and condition, where climate-limited and fuel-limited fire regimes mark the extreme ends of a continuum [5]. Previous research [6] has shown that the pattern of average fire activity (e.g., fire frequency and area burned) along the moisture/productivity gradient from 25 to 56° S in Chile corresponds well with the varying constraints model [5]. This model predicts patterns of fire activity will vary along a resource gradient from dry, fuel-limited ecosystems where discontinuous fuels limit fire activity at one end of the gradient to wet, biomass rich ecosystems where fuel moisture constrains fire activity at the other end of the gradient.
Historically, in south-central Chile fire spread was limited by discontinuous fuels in the drier regions in the north, and cool and wet conditions that inhibited fire spread in high-elevation and biomass-rich, humid landscapes of the southern regions [6]. During large fire years in both fuel-limited and moisture-limited regions, inter-annual and intra-annual climate variability play an important role in promoting or inhibiting fire activity and fire spread [7,8]. For example, years of widespread fire in semi-arid Mediterranean ecosystems in the Southern Hemisphere often occur 1–2 years after above- average precipitation which increases fine fuel quantities [6]. This sequence is associated with El Niño–Southern Oscillation (ENSO) events which can promote increases in the abundance of fine fuel lagging wet years [6,9,10,11]. Increased wildfire activity in these drier systems is also linked to the negative phase of the Southern Annular Mode (SAM) [12]. Conversely, in wetter regions, including deciduous temperate forests and evergreen temperate rainforest ecosystems, fire is strongly associated with extreme drought. As a result, years with anomalously high area burned in southern Chile are linked to warmer and drier-than-average spring and summers and prolonged drought [10,13,14,15]. In recent decades, the widespread conversion of native forests with highly flammable and dense plantation forests and an increase in human ignitions are also factors linked to the occurrence of large fires throughout south-central Chile [16,17,18,19].
While it is clear that extended drought conditions including the 2010–2015 ‘megadrought’ [14] helped create the conditions for the occurrence of recent large fires in south-central Chile, the broad-scale (i.e., thousands of kilometers) climatic conditions associated with years of anomalously high (or low) area burned have not been well examined. These include synoptic-scale conditions that promote extreme fire weather including unstable air, low relative humidity, strong surface winds and high temperatures [1,6,20]. Here we evaluate whether surface and atmospheric conditions and anomalies operating on intra- and interannual time scales explain long-term trends and provide information with which to predict and anticipate future large fire events. We hypothesize that months with anomalously high area burned (‘active fire months’) are strongly associated with broad-scale surface and atmospheric conditions and develop the following specific predictions:
H1:
Months with anomalously high area burned (‘active fire months’) are associated with (H1a) warm temperature anomalies (Tmax), and (H1b) dry surface conditions.
H2:
Active fire months will be associated with broad-scale atmospheric circulation patterns characterized by (H2a) stationary high-pressure systems positioned at a latitudinal band corresponding with south-central Chile (c. 30–40° S Latitude) that deflect rain-carrying westerly winds poleward, and (H2b) warm and strong 850 hPA winds that result in pronounced fuel drying.
H3:
Climate teleconnections (ENSO and SAM) promote (H3) alternating years of fuel growth and subsequent drying that can lead to active fire months and years with high annual area burned (AAB).
In order to evaluate these hypotheses, we investigate whether months of anomalously high (top 12% of all burned area months) and low (bottom 12% of all burned area months) area burned in south-central Chile are associated with specific patterns in regional to subregional climatic (mid-tropospheric atmospheric) and surface conditions. We examine these fire-climate relationships from 1984 to 2018 from the Corporación Nacional Forestal of Chile (CONAF) fire records and broad-scale atmospheric and surface conditions for seven administrative districts of south-central Chile where Mediterranean and drier temperate vegetation intersect. This information is needed to help managers and communities anticipate conditions that could promote large and hazardous fires and prioritize resources to respond.
2. Materials and Methods
2.1. Study Area
The study area spans 32–41° S latitude, including seven administrative districts (hereafter “districts”) from Valparaíso to Los Ríos (Figure 1a, Table 1). The drier northern bioclimatic zone (between approximately 32 and 36° S) supports Mediterranean-matorral shrub and sclerophyllous forests, whereas the wetter southern bioclimatic zone supports temperate deciduous and broadleaf evergreen forests (between approximately 36 and 41° S) [21,22,23]. Like Mediterranean-temperate vegetation transitions elsewhere, these two bioclimatic zones span a critical transition between dry, shrubland (fuel-limited) fire regimes in the north to wetter (climate-limited) fire regimes in the south. We focus on these zones because large fires have increasingly affected these regions in recent decades, they span an understudied gradient in fuel-limited to climate-limited fire activity and because they include the highest population densities found in Chile (ca. 15 million inhabitants). The two bioclimatic zones encompass highly productive coastal forests (>1000 gCm2/yr), unproductive (<100 gCm2/yr) arid shrublands, mid-elevation Andean Nothofagus forests, and high-alpine ecosystems [24]. The primary climatic controls on the distribution, abundance and structure of vegetation varies from limited water availability and high temperatures in the northern bioclimatic zone to limited availability of solar radiation and persistent cool temperatures in the southern bioclimatic zone [22,23].
2.2. Climate Context
The climate of south-central Chile is largely controlled by the semi-permanent subtropical anticyclone over the southeast Pacific Ocean, associated with dry and stable conditions, and the westerly wind regime at mid-latitudes co-located with the storm track (Figure 1b). These features result in a marked precipitation gradient with semi-arid Mediterranean climate in northern areas generally north of 36° S, and wetter more temperate conditions south of 36° S [25]. The south-central regions experience strong seasonal precipitation with several to a dozen or more rainfall events in winter months (May to September) accounting for most of the annual precipitation which ranges from 100–2000 mm between 30° S and 40° S [26]. Cold sea surface temperatures along the coast (relative to the same latitude over the open ocean) and the predominance of westerly flow in the free troposphere (i.e., above ~1 km above sea level) results in progressive westerly flow (hereafter referred to as ‘ventilation’) of cool, low-moisture onshore winds of south-central Chile [27]. The prevailing ventilation produces moderate temperatures along the narrow strip of land to the west of the Andes Cordillera, in sharp contrast with the much warmer conditions to the east (Figure 1b). During the austral summer (DJF), the poleward expansion of the subtropical anticyclone results in a high number of cloud-free days with intense solar radiation, low humidity, and little rainfall.
Variability in ENSO promotes large changes in annual precipitation totals, with a tendency for wetter than average conditions during El Niño years and drier conditions during La Niña years in south-central Chile [28,29]. However, the ultimate influence on precipitation depends on the seasonal timing of the onset of ENSO events and latitudinal position [30]. Likewise, the positive (negative) phase of the Pacific Decadal Oscillation (PDO) tends to produce extended periods that are on average drier (wetter) than the long-term mean in central Chile [25,31]. At higher latitudes (ca. > 36° S), SAM (e.g., [32]) can alter the intensity of the mid-latitude westerly winds, so that during the SAM positive (negative) phase there is a decrease (increase) in precipitation co-occurring with warmer (cooler) conditions over southern Chile (e.g., [33]). Each of these teleconnections (i.e., ENSO, SAM) can play a role in driving interannual variability in precipitation that promotes cycles of fuel growing and/or fuel drying that, when coupled with warm, dry and windy surface conditions, can lead to anomalously large fires.
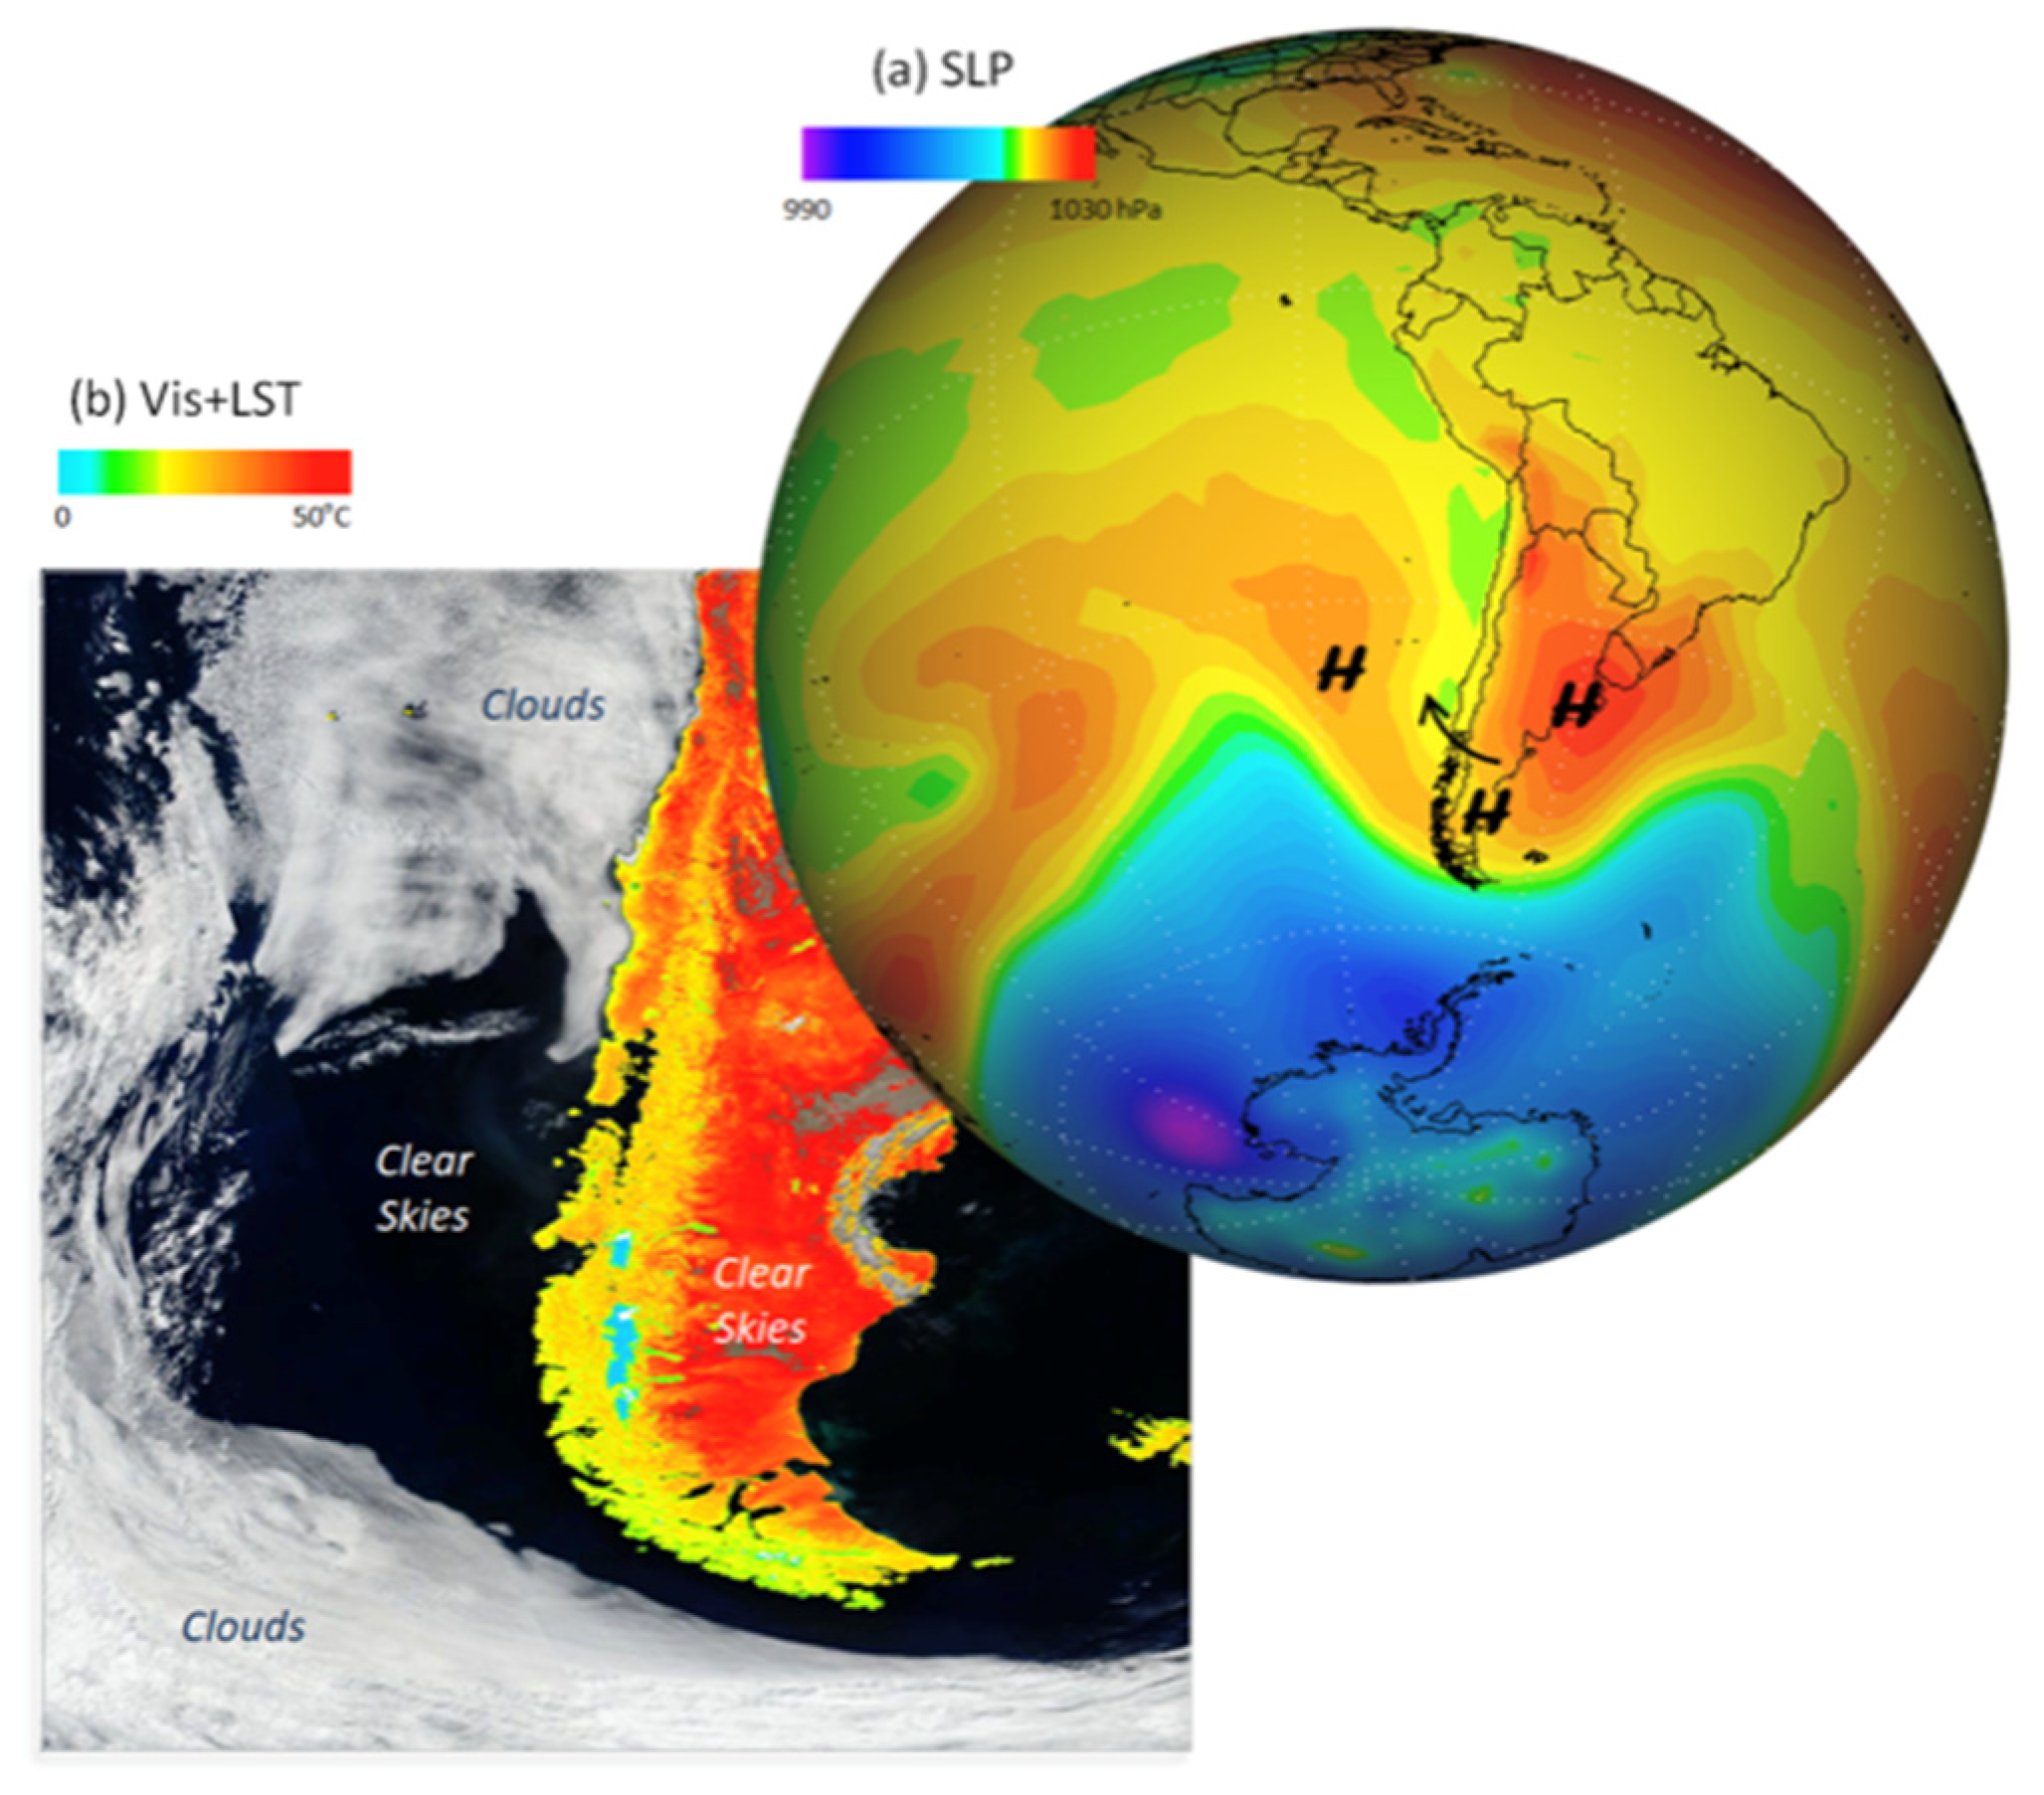
At the regional scale, large wildfires in central Chile are often associated with periods of high temperature, low humidity, high winds that persist for several days and the presence of (mostly anthropogenic) ignitions [35]. The coincidence of these climatic conditions can occur numerous times each summer and are a consequence of the passage of a transient anticyclone over southern Chile as shown in Figure 2 for 4 February 2019, at the beginning of a wildfire that lasted several weeks and burned more than 15,000 ha [34,36]. Subsidence (downward motion) over the center of the high-pressure cell adiabatically produces warm, dry and clear sky conditions for days. Furthermore, a mid-latitude anticyclone drives mid-level easterly winds to the north of its center. The latter results in a reduction of westerly-wind ventilation and, in some cases, the occurrence of strong, hot and dry downslope (easterly) winds from the Andean valleys (i.e., foehn winds), locally known as Puelche [37] and Raco [38]. At low levels, the intense along-shore pressure gradient between the high pressure area to the south and a coastal trough (low-pressure) to the north greatly intensifies the near-surface southerly winds along the coast of central-southern Chile since the coastal topography breaks down, due to friction, the geostrophic balance [39].
2.3. Data
2.3.1. Fire Dataset
Historically, wildfire occurrence in south-central Chile was most common during the warm and dry summer season (January–March), although fires in recent decades have been recorded throughout the year in many parts of the study area [15,40]. The extension of the fire season is due to both widespread anthropogenic ignitions which provide ample fire starts throughout the year [40] and the increasing persistence of warm and dry conditions outside of the typical fire season months. We evaluated the spatially aggregated monthly burned area data compiled by CONAF across a latitudinal band spanning ~800 km for the time period 1984–2018. The CONAF fire dataset consists of fires (>50 ha) identified through only the most active fire season (austral summer) months (November–March) for the 34 fire seasons in the dataset (http://conaf.cl/ (accessed on 11 April 2021)). CONAF fire detections primarily rely on the presence and spatial distribution of mobile and fixed ground and aerial operators which are complemented by (and well correlated with [17]) satellite derived fire detections, and exclude prescribed burns. We then identified the top (4) and bottom (4) area burned months from the long-term fire season monthly distribution (i.e. Nov-Mar) and selected the 20 months with the greatest (“active months”) and lowest (“inactive months”) area burned during the fire season representing the upper and lower deciles of extreme values (Figure 3b, Supplementary S1: Table S1). We evaluate our hypotheses using the fire time series data at the monthly scale because even within the fire season, climatic conditions vary, likely obscuring the relationship between broad-scale surface and atmospheric conditions and large fire activity. Importantly, and in contrast to previous studies [6,10], using active and inactive fire months rather than seasons best reflects broad-scale surface and atmospheric conditions operating at a temporal scale that is most relevant to the promotion of large fires. We also consider the impact of temporal autocorrelation in our analyses. The monthly time series of burned area and air temperature have low autocorrelation values (0.1 and 0.3, respectively) and most of the active/inactive fire months do not occur in a sequence. This means that the burned area (and air temperature) of a given month within the fire season is largely independent of the previous conditions, lending support to the use of individual months for performing our analyses.
2.3.2. Fire Data Trend Analysis
To evaluate whether the occurrence of recent large fires exhibit a trend of increasing fire activity (i.e., burned area) across the fire time series we performed trend analyses on mean and total annual area burned (AAB) values using the parametric ordinary least squares (OLS) regression method, with year as the predictor variable. We evaluated whether (1) mean area burned, and (2) total area burned exhibited increasing or decreasing trends over the fire time series. We determined statistical significance based on the t-statistic of the predictor slope coefficient to determine if the slope was significantly different from zero. Significance was assessed at the 95% (p = 0.05) and 90% (p = 0.10) confidence levels. In specific cases, when high variability or extreme outliers were suspected to exert undue influence on an OLS regression estimate, the non-parametric Mann–Kendall trend test [41,42] and Theil–Sen regression approach [43,44] were employed. The Theil–Sen non-parametric regression method is highly robust to outliers since the trend line is computed by estimating slopes between all possible pairs of points, then estimating the overall trend using the median of the slopes.
2.3.3. Climate Dataset and Analysis
We employed two main data sources for our climate analysis. For tropospheric circulation (e.g., 850 and 500 hPa winds and geopotential height), we used monthly-mean global meteorological field data (e.g., mid-level winds, geopotential height) from the National Centers for Environmental Prediction and the National Center for Atmospheric Research (NCEP-NCAR) Reanalysis (NNR) dataset available on a regular 2.5° × 2.5° latitude-longitude resolution [45]. The more regional, near-surface meteorology from local station data is not well captured by the coarse reanalysis data [10], and many parts of south-central Chile have few meteorological stations. For near-surface meteorology we used CR2Met-V2 (available from http://www.cr2.cl/datos-productos-grillados/ (accessed on 11 April 2021)), a newly released dataset of maximum/minimum temperatures and precipitation for continental Chile with high spatial resolution (5 × 5 km) that combines station data and reanalysis data [46].
For each inactive (n = 20) and active (n = 20) fire month we obtained the corresponding climate variable value (from CR2Met or NNR) and derived composite anomalies by subtracting the corresponding long-term (1980–2010) monthly mean value from the single monthly values. We then averaged the anomalies to obtain active and inactive composites. We verified that the meteorological patterns during active months were roughly opposite to their counterparts during inactive months and their main spatial features are summarized by displaying their difference. The significance of the difference fields were assessed using a non-parametric Monte Carlo technique that required no assumption on the variable distribution [47]. In each grid box we randomly selected two groups of 20 months each and calculated their mean difference. We repeated this extraction 5000 times to construct an empirical frequency distribution of the mean difference. The frequency of the observed difference (mean of the 20 active minus mean of 20 inactive months) was then obtained. We also calculated the difference between the four most active and inactive forest fire seasons in south-central Chile using the November–March averages of selected fields. The monthly differences are very consistent with their seasonal counterparts (not shown) although the latter tends to be smoother.
To further explore the climate-fire relationship in central and south-central Chile, we also considered the relationship between burned area and the following meteorological variables: (1) maximum air temperature, (2) minimum air temperature, and (3) precipitation [6]. We considered the relationship between meteorological indices and burned area aggregated in space (from Valparaíso to Los Ríos) and time (the full fire season, November–March). We assessed the strength of the relationship between the climate variables and the aggregated annual area burned time series (Supplementary S1: Figure S2) using a Pearson’s correlation (between the meteorological index and the burned area) and its significance assessed with a Student’s t-test with (n − 2) degrees of freedom.
Among many fire-weather (or aridity) indices, those using the water vapor deficit (VPD: saturation water pressure minus actual water pressure) perform well in evaluating the relationship between combined precipitation and temperature controls on area burned [48]. Based on previous research from southern Chile [1,6,35], we expected that VPD would also perform well as a proxy for combined warm and dry surface and fuel conditions in our study area and that VPD would be a strong predictor of AAB. Using compiled daily meteorological data (Tmax, pressure, relative humidity) for three stations in central Chile (Santiago 33° S, Curico 35° S and Chillan 37° S), we calculated VPD and then obtained its monthly mean. As expected, VPD was highly correlated with Tmax (r~0.85, significant at p < 0.01) but Tmax was more strongly correlated with burned area. As a result, we used Tmax in our analysis, a variable that is more readily available from meteorological stations in south-central Chile and has robust projections for the future.
3. Results
The fire time series (1984–2018) for south-central Chile districts exhibit strong year-to-year variability in area burned within and across districts (Figure 3a). The mean AAB for the time series (all districts) was 71,244 ha (SD = 92,996 ha; range= 10,921–570,197 ha). The mean fire season (Nov-Mar) area burned for the time series (all districts) was 67,779 ha (SD = 92,994 ha; range = 10,463-567,270 ha). The mean burned area for the 20 most active fire months was 56,801 ha (SD = 104,885 ha; range = 2364–493,214 ha). The record-breaking 2016–2017 fire season (567,270 ha Nov–Mar) had a strong influence on the long-term mean burned area for the most active fire months. Excluding this fire year reduced the mean area burned for the time series to 33,832 ha (SD = 21,777 ha; range = 2364–73,899). The mean burned area for the 20 most inactive fire months was 2139 ha (SD =1510 ha; range = 168–5272 ha).
Results for trend analysis of the mean and total area burned for all districts indicate no trends were observed over the time series (1984–2018), with the exception of a marginally significant (p-value = 0.07) positive trend from OLS regression when the outlier 2016–2017 fire year is retained in the database. Results from the non-parametric, permuted Theil–Sen regression approach were not significant (p < 0.1), however, suggesting this trend is driven by the single outlier fire year of 2016–2017 (Supplementary S1: Figure S4a,b). Trend analysis for individual districts furthermore indicates significant negative trends in area burned for two districts, Valparaíso [regression coefficient ß = −190.5 ha, p = 0.062] and Bío Bío [regression coefficient ß = −40.6 ha, p = 0.040]) (Figure 3a).
Clustered correlation analyses indicate different temporal patterns of area burned between the northern (Valparaíso to Bío Bío) and southern districts (La Araucanía and Los Ríos) (Supplementary S1: Figure S2). This latitudinal break in the correlation of the time series aligns with the ecoregional boundary between Mediterranean-temperate zones and with differences in the controls driving fire activity in the northern, more fuel-limited districts versus the southern districts where fire-spread is more climate/moisture limited. Area burned was anomalously high for the 2016–2017 fire year across several districts including Metropolitana (53,235 ha), O’Higgins (105,542 ha), Maule (252,556 ha) and Bío Bío (119,409 ha). Active and inactive fire months have been relatively equally distributed over the time series (Figure 3b). However, over recent fire years there has been an apparent increase (decrease) in consecutive intra-annual active (inactive) fire months.
Our compositing analysis shows that active (and inactive) fire months feature distinctive surface maximum summer temperature and large-scale circulation patterns. An evaluation of local surface temperature and precipitation conditions for the active minus inactive composite indicate concurrent maximum temperature is the variable that most clearly differentiates the active and inactive composites across the study area (Figure 4). Months with anomalously high area burned exhibit higher maximum temperatures across the study area and an increase of up to two degrees Celsius in the central valley and western slope of the Andes in south-central Chile (33–43° S), significant at p ≤ 0.05. The warmer conditions accompanying active months extend zonally from the Pacific coast to the eastern slope of the Andes and tend to reach maximums over the Andes’ divide. In contrast, the active minus inactive signal in minimum temperature is mostly insignificant across central Chile (see spatial distribution of significance in Figure 4b), although warmer temperatures (up to +0.5 °C) also dominate the western slope of the Andes during active months. Active months during summer also show dry (up to −50 mm/month) conditions (relative to inactive months), mostly along the western slope of the Andes but they reach significance (p ≤ 0.05) for only the southern (>35° S) portion of our study area.
Evaluation of active minus inactive composite air temperature at the 850 hPa (about 1500 m ASL), a level in the lower free troposphere, shows that active months are characterized by a broad area of warm anomalies over southwestern South America and the adjacent Pacific Ocean (Figure 5). Within this area, the difference between active minus inactive months can be as large as +1.8 °C and reaches significance (p ≤ 0.05) over south-central Chile, encompassing our study area, and the adjacent ocean (area enclosed by grey dashed line shown in Figure 5). The warm anomaly seen in the maximum surface air temperature (Figure 4a) lies southward of the region with the largest warming in the lower free troposphere, which results from large-scale dynamics (see below). We hypothesize that this connection occurs because of the entrainment of free tropospheric air into the continental mixed layer that can extend up to 1.5 km above the land surface during summer days [49].
Estimates of geopotential height anomalies using the geostrophic balance from 850 hPa wind vector anomalies highlight active minus inactive climate conditions (Figure 5). The most salient feature is the anticyclonic (counterclockwise) anomalies connected with positive geopotential anomalies during active months (relative to inactive months) located over the southeast Pacific Ocean off southern Chile (Figure 5). A similar pattern can be seen at other levels in the troposphere, from the surface to 500 hPa (Figure 6).
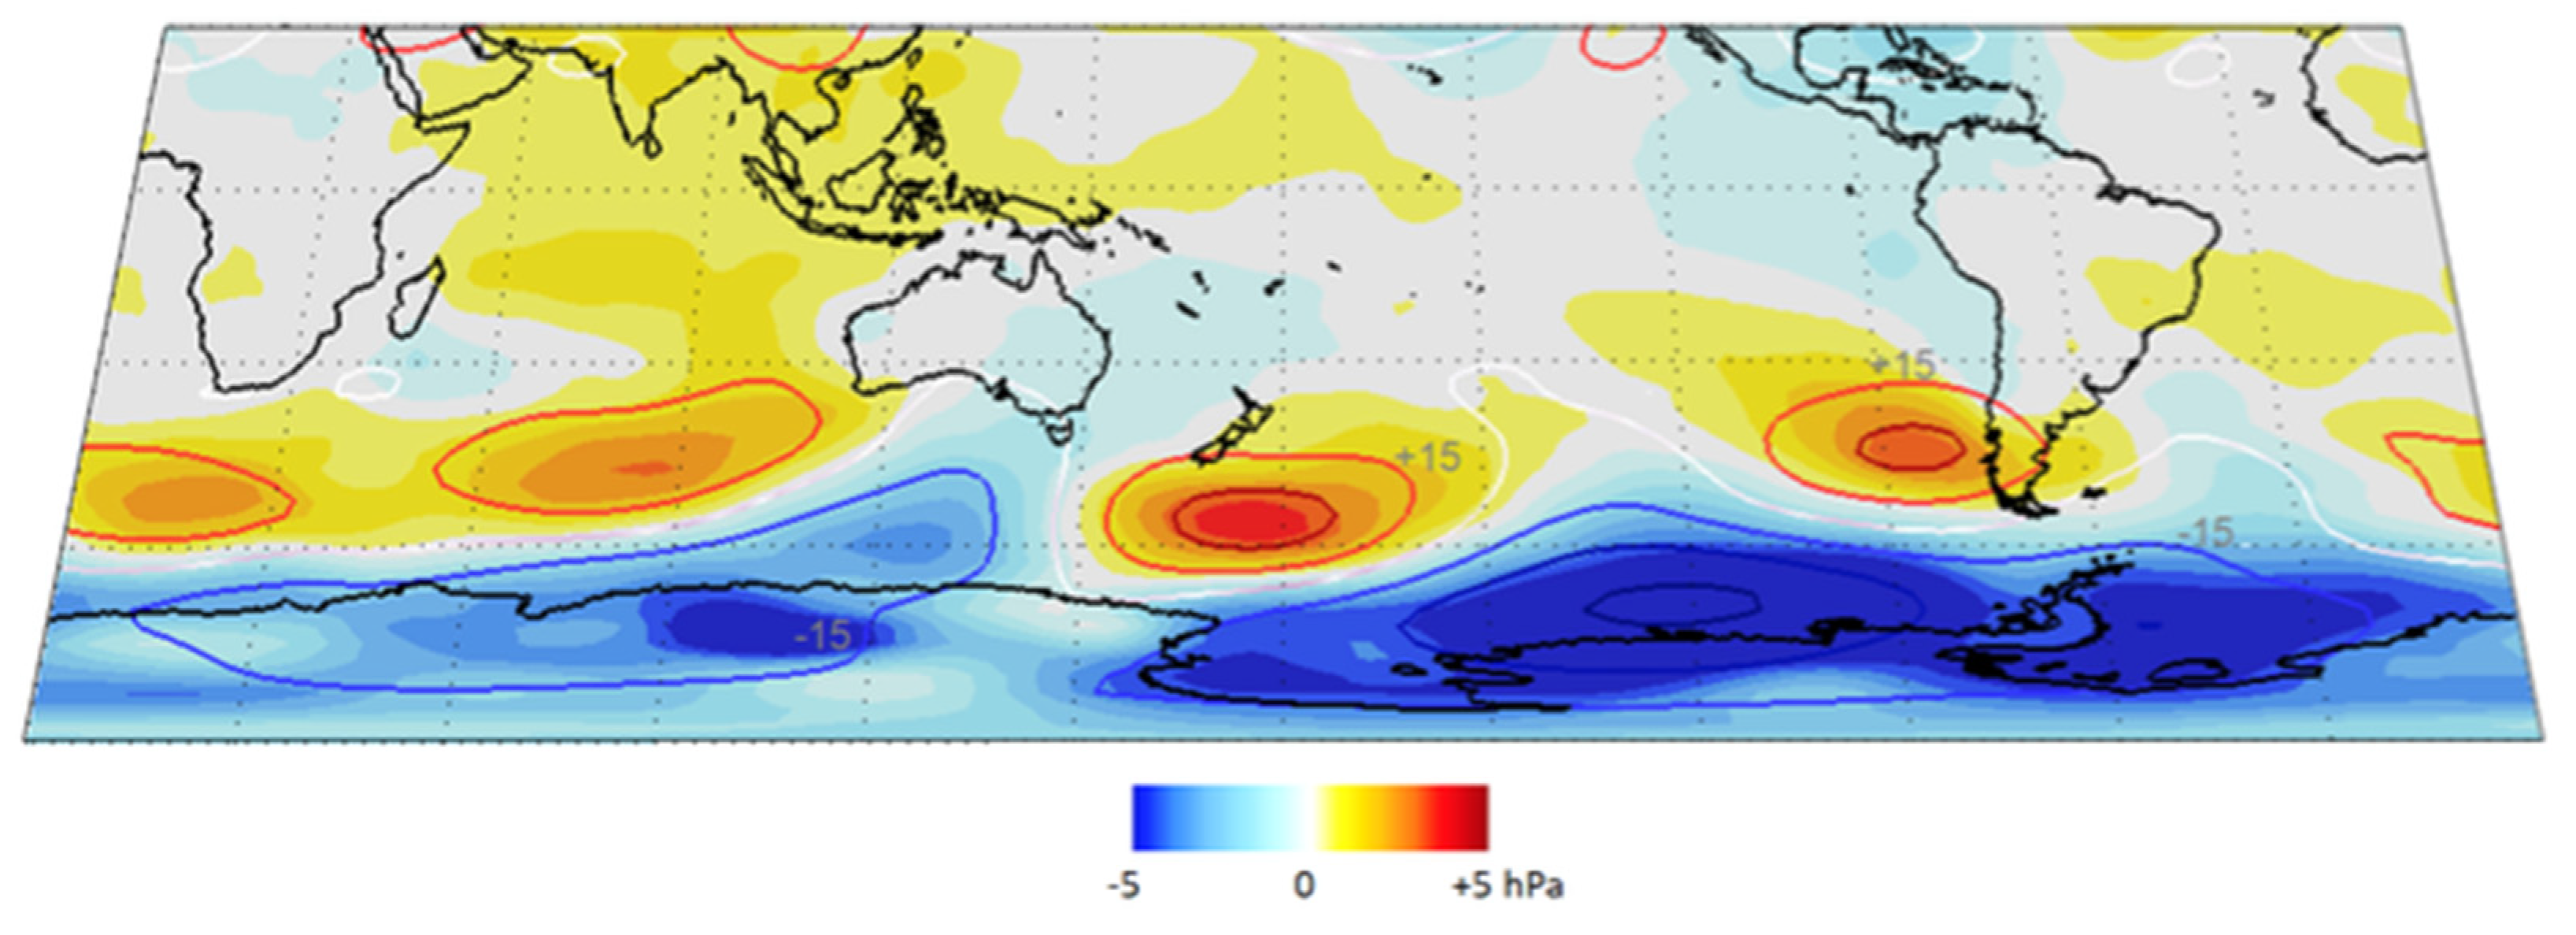
At a broader scale, the active minus inactive composites for sea level pressure (SLP) and 500 hPa geopotential height (Z500) in the upper troposphere also exhibit similar anticyclonic positive geopotential anomalies for active vs. inactive fire months (Figure 6). The anticyclone off southern Chile during active months tends to occur in connection with a circumpolar chain of high pressure at subtropical latitudes and low pressure around the Antarctic periphery. Mid-tropospheric geopotential height anomalies show a similar pattern for active fire seasons (Figure 6). These mid-troposphere and surface conditions associated with active minus inactive composites project upon the positive SAM phase (see below).
Superposed epoch analysis (SEA) evaluating the relationship (teleconnections) between large-scale climate drivers (i.e., ENSO, SAM) and active (inactive) fire months indicate that low area burned during inactive fire months is strongly linked to the negative SAM phase during the month of the fire (Supplementary S1: Figure S5d). No ecologically meaningful relationship was found between SAM and active months or ENSO events and active or inactive fire months (Supplementary S1: Figure S5a–c).
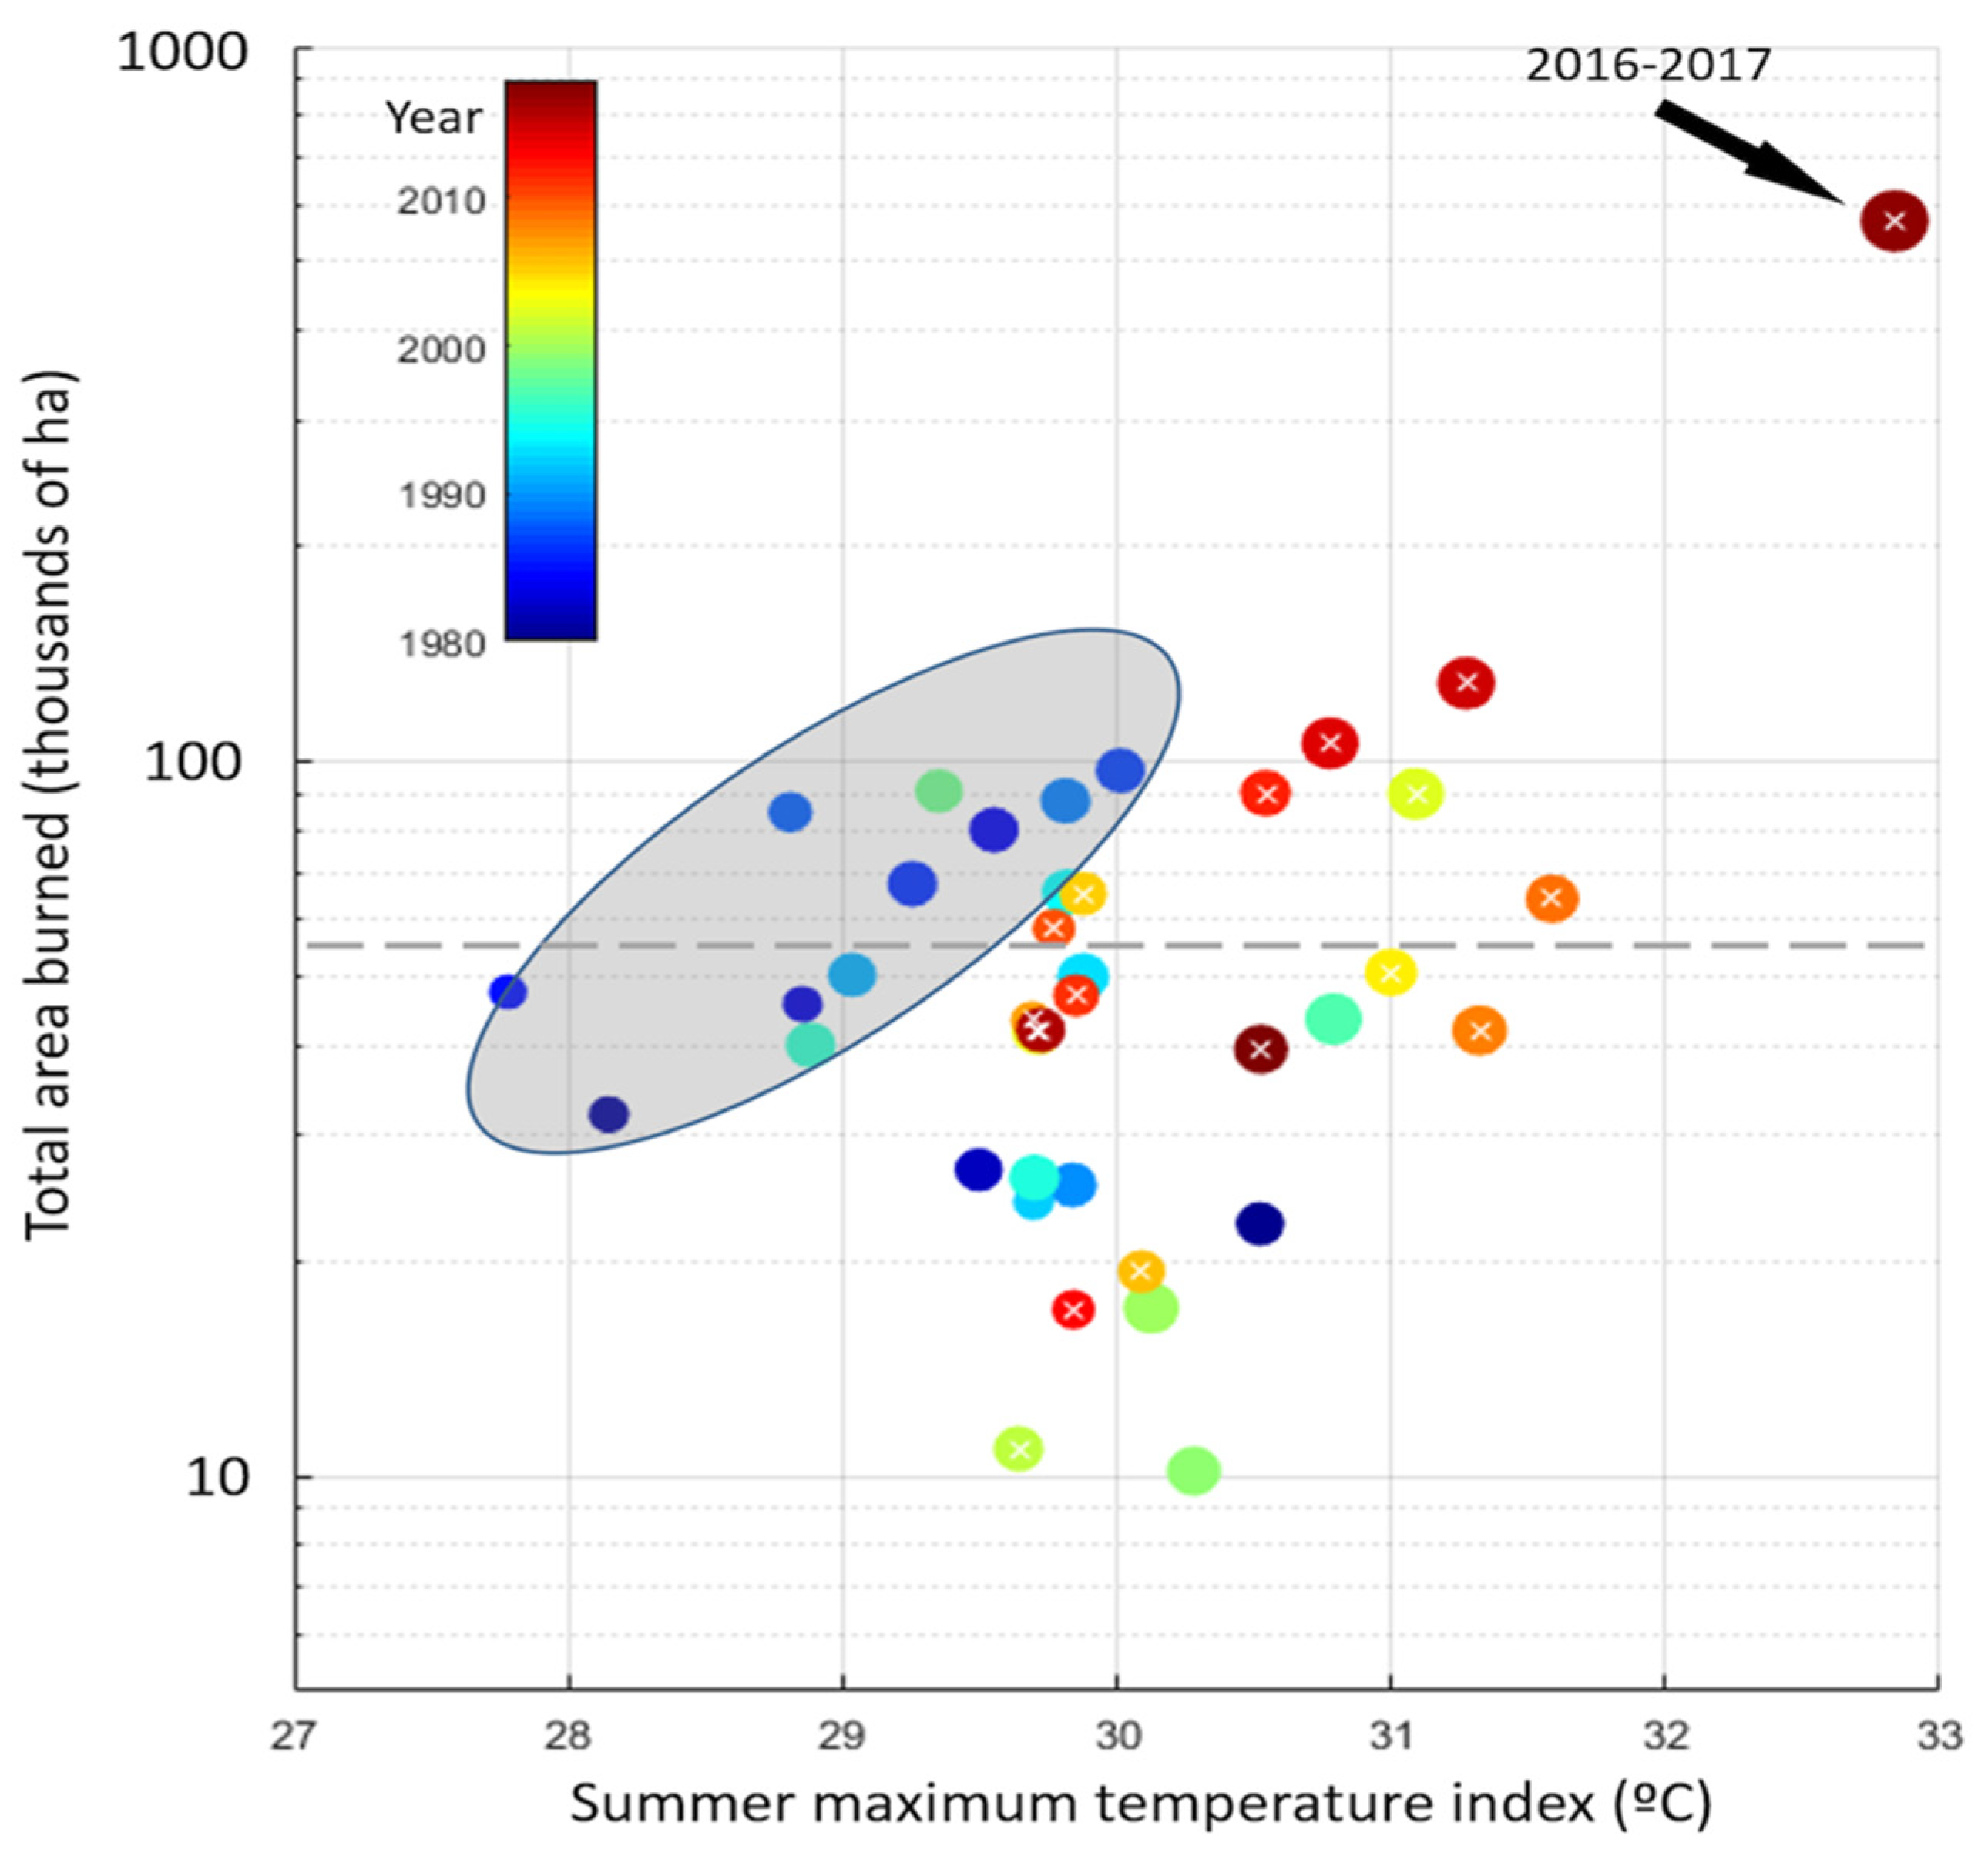
An evaluation of the entire burned area dataset (1984–2018) shows a significant relationship between mean maximum summer temperature and total area burned (Figure 7; sum of burned area by any wildfire in our study region from November to March, (see Supplementary S1, Figure S3). Then considering the full sample, the Pearson correlation coefficient reaches +0.58. However, a substantial part of this value results from the extremely warm and large area burned in the 2016–2017 fire season, and removal of this point reduces the correlation to +0.37. Figure 7 also reveals a cluster of points (identified by the grey oval) mostly represented by fire seasons before 1990 when the total area burned was consistently higher than the value expected from the full sample linear regression. The occurrence of large fires during relatively cool surface temperatures during this earlier period of the dataset (pre-1990s) could signal a difference in non-climatic controlling factors (e.g., limited firefighting capacity) as discussed further below.
4. Discussion
Our evaluation of broad-scale surface conditions for months with anomalously high (and low) area burned highlights the role that patterns in the frequency and position of anticyclonic activity off the coast of southern Chile and related effects on the strength of westerly winds and warm surface conditions play in mediating the occurrence of large fires in south-central Chile. Results suggest that the occurrence of warm anticyclones off of the coast of southern Chile, weakening of cooling onshore westerly winds and warm surface conditions combine to promote active fire months (supporting hypotheses H1–H2). The presence of strong anticyclones positioned off the coast of southern Chile appear to enhance warm surface conditions by weakening westerly winds and/or creating easterly wind anomalies that are both adiabatically and diabatically warmed. The broad-scale, multi-month (composite) pattern of pressure anomalies evident from our results (Figure 5) is surprisingly similar to the synoptic map shown in Figure 2 for one particular large fire that occurred in February 2019 in southern Chile, suggesting that the recurrence of a strong anticyclone approaching southern Chile is the key element in causing wildfires in this region, confirming previous work [50,51].
What is less known about these fire-favoring anticyclones, however, is: (a) the large-scale, tropospheric-deep subsidence that takes place in the center of the anticyclone, causing the offshore warming anomaly in the lower troposphere by adiabatic warming, and (b) that the largest warming over south-central Chile is located in the periphery of the anticyclone and coincides with a band of easterly wind anomalies (offshore flow) extending from about 40° to 30° S just to the west of the Andes (Figure 6). Recalling that the mean lower-to-upper tropospheric flow is from the ocean to the continent causing a cool westerly flow, or ‘ventilation’ over south-central Chile (Figure 1), the easterly anomalies during active forest fire months imply a weakening of the westerlies (although in some individual cases there can be actual easterly flow; Figure 5). Therefore, the warming over the west side of the continent is largely produced by a reduction of the lower troposphere ‘ventilation’ that would normally cool the region. Additionally, the easterly winds in the lower troposphere can force extra subsidence (and hence warming) in the western slope of the Andes and cause downslope flow along the foothills [37,38]. This is confirmed by an examination of the difference in the vertical velocity field (omega at the 500 hPa level) between active and inactive months (Supplementary S1: Figure S6), which shows enhanced subsidence over the eastern Pacific Ocean near the center of the anomalous anticyclone conducive of the offshore warming. The subsidence declines over the study region (in part because of the presence of the Andes), emphasizing the crucial role of the decrease in ventilation (weaker westerly flow of cool air) in creating the local warming.
The proximity of the anomalous anticyclone center to south-central Chile also ensures a tendency for clear skies and low-level stability, resulting in warming at the surface during daytime, and reduced precipitation during active months. In contrast, months or seasons with larger frequencies of cyclones tracking over southern Chile often result in inactive wildfire periods. Negative (cyclonic) anomalies prevail off western Patagonia, enhancing cool air ventilation along the coast and farther inland by strong onshore flow and likely reflects a frequent passage of cold-front causing precipitation episodes.
An evaluation of mean maximum summer temperature and total area burned (Figure 7; sum of burned area by any wildfire in our study region from November to March) suggests a significant relationship between maximum summer temperature (which is highly correlated with VPD, r = 0.85). The substantial scatter in Figure 7 may be in part due to the spatio-temporal aggregation of bioclimatic zones (i.e., the intersection of Mediterranean and temperate vegetation assemblages) that are driven by different climatic controls and at different times (temporally: November–March; spatially: Valparaíso–Los Ríos). Nonetheless, sub-dividing the spatial domain in districts and the summer season in months results in a marginal increase in the correlation between Tmax and burned area as shown in Úbeda and Sarricolea [19]. The lack of a relationship between large fire months and low rainfall anomalies in the core of our study region (33–38° S) is not surprising because rainfall amounts are generally very low during the fire season when active fire months occur. As a result, low rainfall anomalies occur within the context of already dry conditions and cannot, alone, explain the occurrence of active/inactive fire months. Additionally, the amount of burned area is sensitive to the accumulated rainfall in the previous spring and concurrent summer, but once again with modest correlation coefficients. Other studies have also found links between antecedent rainfall pulses and area burned in the northern half section of our study area [6,10].
The large scatter in the climate-burned area relationship (Figure 7) in south-central Chile may reflect a strong degree of “human influence” on the fire regime over central Chile. Multiple years of relatively large area burned during the colder-than-present conditions in the decades prior to 1995 may reflect modest and less coordinated fire suppression efforts during this time period. Additionally, in recent decades, the relatively weak relationship between temperature and burned area may indicate that, despite substantial increases in fire suppression efforts, burned area levels are comparable to previous decades that were generally cooler. CONAF and private forest companies spend substantial and increasing resources in detecting and controlling wildfires once initiated, especially since the 2017 fires that affected much of central Chile [20]. Take for instance the present fire season (2019–2020), when an extreme drought in 2019 and very warm summer temperatures created conditions conducive to large fires. These conditions were comparable to those observed in the summer of 2016–2017, yet (as of the end of the 2020 fire season) the total area burned was close to 100,000 ha, above the average but within the historical range for annual area burned. The relatively modest area burned despite extreme fire-weather conditions may be related to the more than US$ 150 million invested by CONAF and private companies in wildfire control [20]. In this case, intensive fire suppression efforts in recent years are preventing large increases in area burned (in most years) that would be expected with warmer temperatures [35].
Our analysis of broad-scale surface and atmospheric conditions associated with active/inactive fire months supports previous work [10,13,14,58] but provides more detail on the complexity of these synoptic mechanisms. Importantly, a comparison of large fires from the earlier period (1984–1996) with large fires in recent decades (1997–2018) suggests the relationship between atmospheric and surface conditions may be shifting as the interaction between factors that drive fire activity (fuel availability, continuity and condition, fire weather and ignitions) have changed. In the earlier period (1984–1996), large fires were associated with relatively cool surface conditions. While similarly associated with anticyclonic anomalies, a weakening of westerly winds and clear, dry conditions, fires that occurred during the latter period of the time series (1997–2018), however, are more strongly associated with warm temperatures and more robust adiabatic warming linked to a weakening of westerly winds and a strengthening of offshore easterly winds. This shift from large fires occurring during cool, dry conditions in the early period to large fire occurrence during warm conditions in recent decades may signal that (as suggested by Figure 7) the lower troposphere ‘ventilation’ that normally cooled the region may be weakening, enhancing warm adiabatic easterly offshore winds that can promote fire spread, especially when fuels are strongly preconditioned for burning following warm and dry conditions.
Novel to our understanding of climate-fire interactions in the region, our results show that inactive months during the fire season were related to negative SAM. This suggests that negative SAM was the most important broad-scale teleconnection influencing variation in monthly area burned across the study. In contrast to previous studies [6,10], our analyses do not show clear relationships between SAM and active fire months or ENSO and active or inactive fire months (Supplementary S2: Figure S5a–c, lack of support for hypothesis H3). These findings are likely a result of the different factors that drive large fire activity in the drier Mediterranean vegetation of the northern districts versus the wetter, fuel-rich temperate forest ecosystems of the southern districts. Summer months in the northern districts (north of the Bío Bío district; ca. 36° S) are almost always warm and dry, resulting in a low correlation between temperature and burned area. Instead, antecedent rainy conditions (variability between warm/wet and cool/dry winters) play a key fuel-buildup role in the northern Mediterranean districts versus the fuel-rich temperate forests in the southern districts which experience larger fires during anomalously warm/dry summers and extended droughts.
Although not reported here, we also examined seasonal relationships (DJF) between the climate modes (i.e., SAM and ENSO) and active and inactive burned area for northern and southern districts separately. In northern districts we found that active fire activity was linked to both antecedent positive ENSO (2-yr prior) and concurrent positive SAM (year of the fire) conditions. In Central Chile antecedent positive ENSO is a driver of wet conditions, whereas positive SAM is associated with dry conditions [25]; thus, in the northern Mediterranean bioclimatic region the former leads fine-fuel build up and the former cures them [6]. Also in agreement with Holz et al. [6], in southern districts active fire activity was linked to the dry and fire-prone positive SAM phase and when ENSO was not important. Inactive fire months in northern districts were not linked to ENSO but instead to antecedent positive SAM, which is associated with warm conditions. The relationship between warm surface conditions and large fires is likely weak in Chilean Mediterranean vegetation because large fires are more strongly related to antecedent fuel growing rather than warming (warm temperatures are predominant in Mediterranean systems) [52]. By contrast, clear and ecologically-meaningful links between inactive fire months and fire-season ENSO or SAM were mostly absent in the southern temperate region of our study area. While the nature and strength of the relationship between broad-scale teleconnections and active/inactive fire months varies across the northern to southern regions of our study area, we expect that interannual variability associated with these teleconnections will continue to influence the occurrence of large fires through fuel growing and drying in the northern Mediterranean vegetation and enhancing long-term warming and drying trends in the temperate vegetation of south-central Chile.
Importantly, the upper and surface atmospheric conditions (e.g., weakened westerlies-induced warming) that can promote active fire months, and that appear to occur several times per fire season, are projected to become more common in south-central Chilean districts in the coming decades [14,53]. Climate models are largely in agreement that temperatures will continue to warm 3–4 °C by 2100 across central Chile [14,54]. Concurrent with projections for warming temperatures, a long-term shift in the position of Hadley cells which directs storms entrained by southern westerly winds poleward, is expected to continue to promote long-term drought conditions in south-central Chile [25,55], under a heavy emission scenario [14,56]. When coupled with fuel drying resulting from persistent drought conditions and warm surface temperatures, easterly (dry) winds and the reduced westerly flow of cool air will likely provide the ingredients for large conflagrations to become more frequent in south-central Chile, especially where woody biomass is abundant and well connected (i.e., Maule, Bío Bío, Araucanía, Los Ríos) [6,10].
5. Conclusions
Our evaluation of broad-scale atmospheric and surface conditions indicate specific climatic patterns are associated with the most active fire months. Results suggest active fire months are associated with:
- The persistence of anticyclonic anomalies (high pressure systems) located over the southeast Pacific Ocean off southern Chile.
- Warm surface conditions (maximum temperature) throughout a large area (ca. 34–45° S) of south-central Chile.
- Easterly surface wind anomalies linked to reduced onshore westerly ventilation of cooler oceanic winds to the south-central Chilean land-surface.
- At broader spatial scales, a circumpolar chain of high-pressure systems at subtropical latitudes and low pressure around the Antarctic periphery (i.e., patterns associated with positive SAM).
Our results highlight the need to better understand how broad-scale atmospheric and surface conditions will interact with and overlay on longer-term trends in the climate system to influence future fire activity in south-central Chile. Our results also draw attention to potential shifts in the relationship between simple, aggregated indices of climate (e.g., seasonal average of maximum temperature) and area burned, which suggest climate–fuel linkages are changing, such that temperature may become increasingly important in driving large fires despite potential increases in precipitation. Additionally, the relatively low area burned in 2019 despite conditions conducive for large fires underscores the potentially strong role of human influence and management—both in the propagation of wildfire ignition and its subsequent controls—and patterns of human activity and management that may be changing as fast as climate.
The potentially strong impact of human activity on large fire occurrence is noteworthy, highlighting the complex relationship between wildfire management, land use and demographic change on the spread of large fires in south-central Chile. Fire ignitions in south-central Chile are almost all attributed to human activities, yet increasing land-use change (urbanization and cultivation) and strong fire suppression efforts can potentially, as evidenced by the 2019–2020 fire season, reduce the occurrence of large fires [20]. However, intensive water use can exacerbate drought conditions in some areas, further promoting large fires [57]. Increases in the extent of highly flammable eucalypt and pine forest plantations have also been shown to promote large fires by replacing more structurally heterogeneous and discontinuous native forests with structurally and compositionally homogeneous and contiguous vegetation [15,17,57,58].
Hence, human activity in south-central Chile can either promote fire activity, through additional ignitions and changes in land-use that increase landscape flammability (e.g., expansion of pine and eucalypt plantations, increased water use), or inhibit fire activity through increased suppression effectiveness and land-use activities that result in fragmentation of fuels. These human–wildfire interactions make it difficult to anticipate the extent to which management can mitigate the climate conditions conducive to large fires described in our analyses. As documented elsewhere, it is likely that increased fire suppression efforts will be most effective in reducing the occurrence of large fires in years with low to moderate fire weather [59,60,61]. In years with extreme fire weather, especially during anomalously warm and high surface winds, it is unlikely that fire suppression efforts will be able to contain fires that escape initial attacks [61]. This will be particularly true for the homogeneous pine and eucalyptus plantations and the fuel-rich southern districts of our study area during years of extreme fuel drying, that when combined with ignitions, promote rapid fire spread. What is certain is that short-term atmospheric and surface conditions conducive to fire spread will overlay and interact with longer-term trends in climatic variability and land-use trends to further increase fire risk and hazard in the fuel-rich temperature forests of south-central Chile. And as has been shown in dry temperate forests elsewhere, warmer annual and seasonal temperatures may increasingly override potential increases in precipitation leading to long-term increases in evapotranspiration promoting fuel drying and fire spread.
Further clarifying the trends and mechanisms governing persistent patterns in the strength and position of high-pressure systems, surface temperature and easterly wind anomalies will help managers and communities anticipate when conditions are ripe for promoting large and hazardous wildfires in south-central Chile—wildfires that management efforts may not be able to control. Future research is needed to evaluate the causes and consequences of easterly wind anomalies linked to reduced onshore ‘ventilation’ of cooler oceanic winds to the land surface and to determine if this trend is strengthening under large-scale climatic changes such as projections for the long-term poleward shift of Southern Hemisphere westerly winds under a warming climate [55,62,63]. Of critical importance is understanding how short temporal scale (days to weeks to months) atmospheric and surface conditions associated with fire weather will be superimposed on these longer-term trends that are increasingly preconditioning historically less flammable, fuel-rich regions of south-central Chile to burn.
Supplementary Materials
The following are available online at https://0-www-mdpi-com.brum.beds.ac.uk/article/10.3390/fire4020028/s1, Figure S1: Comparison of monthly versus seasonal fire composites, Figure S2: Annual area burned (AAB) correlation matrix, Figure S3: Climate and annual area burned (AAB) time series, Figure S4: Annual area burned (AAB) trend analysis, Figure S5: Active fire months and ENSO and SAM anomalies, Figure S6: Difference in atmospheric subsidence between active and inactive fire months. Table S1: Fire season monthly area burned summary.
Author Contributions
Conceptualization, D.B.M., R.D.G., A.H., and G.T.P.; methodology, D.B.M., R.D.G., A.H., and G.T.P.; formal analysis, D.B.M., R.D.G., A.H., and G.T.P.; investigation, D.B.M., R.D.G., A.H., and G.T.P.; writing—original draft preparation, D.B.M., R.D.G., A.H., and G.T.P.; writing—review and editing, D.B.M., R.D.G., A.H., and G.T.P.; funding acquisition, D.B.M., R.D.G., A.H., and G.T.P. All authors have read and agreed to the published version of the manuscript.
Funding
This project was funded by grants from the Council for International Exchange of Scholars Fulbright US Scholars Program, the Facultad de Ciencias Forestales at the Universidad de Concepción, and National Science Foundation BCS-1539820 and BCS-1832486 (to DBM). AH was partially supported by the National Science Foundation awards EAR-1738104 and BCS-1832483. GTP was supported by the U.S. Geological Survey Land Resources and Ecosystems Mission Areas. Any use of trade, firm, or product names is for descriptive purposes only and does not imply endorsement by the U.S. Government.
Data Availability Statement
Data used in this study can be found at: NCEP-NCAR reanalysis data, https://psl.noaa.gov/data/gridded/data.ncep.reanalysis.html (accessed on 11 April 2021); near-surface meteorology data, CR2Met-V2, http://www.cr2.cl/datos-productos-grillados/ (accessed on 11 April 2021); CONAF fire data, https://www.conaf.cl/incendios-forestales/incendios-forestales-en-chile/estadisticas-historicas/ (accessed on 11 April 2021).
Conflicts of Interest
The authors declare no conflict of interest. The funders had no role in the design of the study; in the collection, analyses, or interpretation of data; in the writing of the manuscript; or in the decision to publish the results.
References
- Bowman, D.M.; Moreira-Muñoz, A.; Kolden, C.A.; Chávez, R.O.; Muñoz, A.A.; Salinas, F.; González-Reyes, Á.; Rocco, R.; de la Barrera, F.; Williamson, G.J.; et al. Human–environmental drivers and impacts of the globally extreme 2017 Chilean fires. Ambio 2019, 48, 350–362. [Google Scholar] [CrossRef]
- Flannigan, M.D.; Krawchuk, M.A.; de Groot, W.J.; Wotton, B.M.; Gowman, L.M. Implications of changing climate for global wildland fire. Int. J. Wildland Fire 2009, 18, 483–507. [Google Scholar] [CrossRef]
- Moreira, F.; Viedma, O.; Arianoutsou, M.; Curt, T.; Koutsias, N.; Rigolot, E.; Barbati, A.; Corona, P.; Vaz, P.; Xanthopoulos, G.; et al. Landscape—wildfire interactions in southern Europe: Implications for landscape management. J. Environ. Manag. 2011, 92, 2389–2402. [Google Scholar] [CrossRef] [Green Version]
- Whitlock, C.; Higuera, P.E.; McWethy, D.B.; Briles, C.E. Paleoecological perspective on fire ecology: Revisiting the fire regime concept. Open Ecol. J. 2010, 3, 6–23. [Google Scholar] [CrossRef] [Green Version]
- Krawchuk, M.A.; Moritz, M.A. Constraints on global fire activity vary across a resource gradient. Ecology 2011, 92, 121–132. [Google Scholar] [CrossRef] [PubMed]
- Holz, A.; Kitzberger, T.; Paritsis, J.; Veblen, T.T. Ecological and climatic controls of modern wildfire activity patterns across southwestern South America. Ecosphere 2012, 3. [Google Scholar] [CrossRef]
- Bradstock, R.A. A biogeographic model of fire regimes in Australia: Current and future implications. Glob. Ecol. Biogeogr. 2010, 19, 145–158. [Google Scholar] [CrossRef]
- Kitzberger, T.; Falk, D.A.; Westerling, A.L.; Swetnam, T.W. Direct and indirect climate controls predict heterogeneous early-mid 21st century wildfire burned area across western and boreal North America. PLoS ONE 2017, 12, e0188486. [Google Scholar] [CrossRef] [Green Version]
- Kitzberger, T.; Veblen, T.T. Influences of humans and ENSO on fire history of Austrocedrus chilensis woodlands in northern Patagonia, Argentina. Ecoscience 1997, 4, 508–520. [Google Scholar] [CrossRef]
- Urrutia-Jalabert, R.; González Mauro, E.; González-Reyes, Á.; Lara, A.; Garreaud, R. Climate variability and forest fires in central and south-central Chile. Ecosphere 2018, 9, e02171. [Google Scholar] [CrossRef]
- de la Barrera, F.; Barraza, F.; Favier, P.; Ruiz, V.; Quense, J. Megafires in Chile 2017: Monitoring multiscale environmental impacts of burned ecosystems. Sci. Total Environ. 2018, 637–638, 1526–1536. [Google Scholar] [CrossRef]
- Veblen, T.T.; Holz, A.; Paritsis, J.; Raffaele, E.; Kitzberger, T.; Blackhall, M. Adapting to global environmental change in Patagonia: What role for disturbance ecology? Austral Ecol. 2011, 36, 891–903. [Google Scholar] [CrossRef]
- Boisier, J.P.; Rondanelli, R.; Garreaud, R.D.; Muñoz, F. Anthropogenic and natural contributions to the Southeast Pacific precipitation decline and recent megadrought in central Chile. Geophys. Res. Lett. 2016, 43, 413–421. [Google Scholar] [CrossRef] [Green Version]
- Garreaud, R.D.; Alvarez-Garreton, C.; Barichivich, J.; Boisier, J.P.; Christie, D.; Galleguillos, M.; LeQuesne, C.; McPhee, J.; Zambrano-Bigiarini, M. The 2010–2015 megadrought in central Chile: Impacts on regional hydroclimate and vegetation. Hydrol. Earth Syst. Sci. 2017, 21, 6307–6327. [Google Scholar] [CrossRef] [Green Version]
- González, M.E.; Gómez-González, S.; Lara, A.; Garreaud, R.; Díaz-Hormazábal, I. The 2010-2015 Megadrought and its influence on the fire regime in central and south-central Chile. Ecosphere 2018. In press. [Google Scholar] [CrossRef] [Green Version]
- Nahuelhual, L.; Carmona, A.; Lara, A.; Echeverria, C.; Gonzalez, M.E. Land-cover change to forest plantations: Proximate causes and implications for the landscape in south-central Chile. Landsc. Urban Plan. 2012, 107, 12–20. [Google Scholar] [CrossRef] [Green Version]
- McWethy, D.B.; Pauchard, A.; García, R.A.; Holz, A.; González, M.E.; Veblen, T.T.; Stahl, J.; Currey, B. Landscape drivers of recent fire activity (2001-2017) in south-central Chile. PLoS ONE 2018, 13, e0201195. [Google Scholar] [CrossRef] [PubMed]
- Paritsis, J.; Landesmann, B.J.; Kitzberger, T.; Tiribelli, F.; Sasal, Y.; Quintero, C.; Dimarco, D.R.; Barrios-García, N.M.; Iglesias, L.A.; Diez, P.J.; et al. Pine Plantations and Invasion Alter Fuel Structure and Potential Fire Behavior in a Patagonian Forest-Steppe Ecotone. Forests 2018, 9, 117. [Google Scholar] [CrossRef] [Green Version]
- Úbeda, X.; Sarricolea, P. Wildfires in Chile: A review. Glob. Planet. Chang. 2016, 146, 152–161. [Google Scholar] [CrossRef]
- Garreaud, R.; Zamorano, C.; González, M.; Lara, A.; Jacques, M. The 2019–2020 Fire Season: Lessons and Challenges; (CR)2: Universidad de Chile, Universidad de Concepción y Universidad Austral de Chile: Valdivia, Chile, 2020. [Google Scholar]
- Veblen, T.T.; Schlegel, F.M.; Oltremari, J.V. Temperate broad-leaved evergreen forests of South America. In Temperate Broad-leaved Evergreen Forests; Ovington, J.D., Ed.; Elsevier: Amsterdam, The Netherlands, 1983; pp. 5–31. [Google Scholar]
- Gajardo, R. La Vegetación Natural de Chile: Clasificación y Distribución Gegráfica; Editorial Universitaria: Santiago, Chile, 1994. [Google Scholar]
- Luebert, F.; Pliscoff, P. Sinopsis Bioclima´tica y Vegetacional de Chile; Editorial Universitaria: Santiago de Chile, 2006. [Google Scholar]
- Zhao, M.; Running, S.W. Drought-Induced Reduction in Global Terrestrial Net Primary Production from 2000 Through 2009. Science 2010, 329, 940–943. [Google Scholar] [CrossRef] [PubMed] [Green Version]
- Garreaud, R.D.; Vuille, M.; Compagnucci, R.; Marengo, J. Present-day South American climate. Palaeogeogr. Palaeoclimatol. Palaeoecol. 2009, 281, 180–195. [Google Scholar] [CrossRef]
- Falvey, M.; Garreaud, R. Wintertime Precipitation Episodes in Central Chile: Associated Meteorological Conditions and Orographic Influences. J. Hydrometeorol. 2007, 8, 171–193. [Google Scholar] [CrossRef]
- Chou, C.; Neelin, J.D. Mechanisms limiting the southward extent of the South American Summer Monsoon. Geophys. Res. Lett. 2001, 28, 2433–2436. [Google Scholar] [CrossRef]
- Aceituno, P. On the Functioning of the Southern Oscillation in the South American Sector. Part I: Surface Climate. Mon. Weather Rev. 1988, 116, 505–524. [Google Scholar] [CrossRef] [Green Version]
- Montecinos, A.; Aceituno, P. Seasonality of the ENSO-Related Rainfall Variability in Central Chile and Associated Circulation Anomalies. J. Clim. 2003, 16, 281–296. [Google Scholar] [CrossRef] [Green Version]
- Kitzberger, T. ENSO as a forewarning tool of regional fire occurrence in northern Patagonia, Argentina. Int. J. Wildland Fire 2002, 11, 33–39. [Google Scholar] [CrossRef]
- Masiokas, M.H.; Villalba, R.; Luckman, B.H.; Mauget, S. Intra- to Multidecadal Variations of Snowpack and Streamflow Records in the Andes of Chile and Argentina between 30° and 37° S. J. Hydrometeorol. 2010, 11, 822–831. [Google Scholar] [CrossRef]
- Thompson, D.W.J.; Wallace, J.M. Annular Modes in the Extratropical Circulation. Part I: Month-to-Month Variability. J. Clim. 2000, 13, 1000–1016. [Google Scholar] [CrossRef]
- Boisier, J.P.; Alvarez-Garreton, C.; Cordero, R.R.; Damiani, A.; Gallardo, L.; Garreaud, R.D.; Lambert, F.; Ramallo, C.; Rojas, M.; Rondanelli, R.; et al. Rondanelli. Anthropogenic drying in central-southern Chile evidenced by long term observations and climate model simulations. Elem. Sci. Anth. 2018, 6, 1–20. [Google Scholar] [CrossRef]
- Garreaud, R. Incendios en Aysén; Center for Climate and Resilience Research: Santiago, Chile, 2019. [Google Scholar]
- Garreaud, R.; Jacques, M.; Vargas, F.; Boisier, J.P.; Rojas, M. Clima e Incendios. In Incendios Forestales en Chile: Causas, Impactos y Resiliencia. Centro de Ciencia del Clima y la Resiliencia; González, M.E., et al., Eds.; (CR)2: Universidad de Chile, Universidad de Concepción y Universidad Austral de Chile: Valdivia, Chile, 2020; p. 84. [Google Scholar]
- Garreaud, R.D.; Boisier, J.P.; Rondanelli, R.; Montecinos, A.; Sepúlveda, H.H.; Veloso-Aguila, D. The Central Chile Mega Drought (2010–2018): A climate dynamics perspective. Int. J. Climatol. 2019, 40. [Google Scholar] [CrossRef]
- Montecino, H.D.C.; Ferreira, V.G.; Cuevas, A.; Cabrera, L.C.; Báez, J.C.S.; De Freitas, S.R.C. Vertical deformation and sea level changes in the coast of Chile by satellite altimetry and tide gauges. Int. J. Remote Sens. 2017, 38, 7551–7565. [Google Scholar] [CrossRef]
- Rutllant, J.; Garreaud, R. Episodes of Strong Flow down the Western Slope of the Subtropical Andes. Mon. Weather Rev. 2004, 132, 611–622. [Google Scholar] [CrossRef] [Green Version]
- Garreaud, R.; Muñoz, R.C. The low-level jet off the subtropical west coast of South America: Structure and variability. Mon. Weather Rev. 2005, 133, 2246–2261. [Google Scholar] [CrossRef] [Green Version]
- CONAF. Incendios forestales. Estadísticas históricas. 2020. [Google Scholar]
- Mann, H.B. Non-parametric tests against trend. Econometrica 1945, 13, 163–171. [Google Scholar] [CrossRef]
- Kendall, M.G. Rank Correlation Methods, 4th ed.; Charles Griffin: London, 1975. [Google Scholar]
- Sen, P.K. Estimates of Regression Coefficient Based on Kendall’s tau. J. Am. Stat. Ass. 1968, 63, 1379–1389. [Google Scholar] [CrossRef]
- Theil, H. A rank invariant method for linear and polynomial regression analysis. Nederl. Akad. Wetensch. Proc. Ser. A 1950, 53, 386–392 (Part I), 521–525 (Part II), 1397–1412 (Part III). [Google Scholar]
- Kalnay, E.; Kanamitsu, M.; Kistler, R.; Collins, W.; Deaven, D.; Gandin, L.; Iredell, M.; Saha, S.; White, G.; Woollen, J.; et al. The NCEP/NCAR 40-year reanalysis project. Bull. Am. Meteorol. Soc. 1996, 77, 437–471. [Google Scholar] [CrossRef] [Green Version]
- Alvarez-Garreton, C.; Mendoza, P.A.; Boisier, J.P.; Addor, N.; Galleguillos, M.; Zambrano-Bigiarini, M.; Lara, A.; Puelma, C.; Cortes, G.; Garreaud, R.; et al. The CAMELS-CL dataset: Catchment attributes and meteorology for large sample studies—Chile dataset. Hydrol. Earth Syst. Sci. 2018, 22, 5817–5846. [Google Scholar] [CrossRef] [Green Version]
- Baez, J.C.; Tweed, D. Monte Carlo Methods in Climate Science. Math Horiz. 2013, 21, 5–8. [Google Scholar] [CrossRef] [Green Version]
- Williams, A.P.; Abatzoglou, J.T.; Gershunov, A.; Guzman-Morales, J.; Bishop, D.A.; Balch, J.K.; Lettenmaier, D.P. Observed Impacts of Anthropogenic Climate Change on Wildfire in California. Earth’s Future 2019, 7, 892–910. [Google Scholar] [CrossRef] [Green Version]
- Muñoz, R.C.; Undurraga, A.A. Daytime Mixed Layer over the Santiago Basin: Description of Two Years of Observations with a Lidar Ceilometer. J. Appl. Meteorol. Climatol. 2010, 49, 1728–1741. [Google Scholar] [CrossRef]
- Kitzberger, T.; Veblen, T.T.; Villalba, R. Climatic influences on fire regimes along a rain forest to xeric woodland gradient in northern Patagonia, Argentina. J. Biogeogr. 1997, 24, 35–47. [Google Scholar] [CrossRef]
- Holz, A.; Haberle, S.; Veblen, T.T.; De Pol-Holz, R.; Southon, J. Fire history in western Patagonia from paired tree-ring fire-scar and charcoal records. Clim. Past Discuss. 2012, 7, 3203–3238. [Google Scholar] [CrossRef] [Green Version]
- Mariani, M.; Holz, A.; Veblen, T.T.; Williamson, G.; Fletcher, M.-S.; Bowman, D.M.J.S. Climate Change Amplifications of Climate-Fire Teleconnections in the Southern Hemisphere. Geophys. Res. Lett. 2018, 45, 5071–5081. [Google Scholar] [CrossRef]
- Thompson, D.W.J.; Solomon, S.; Kushner, P.J.; England, M.H.; Grise, K.M.; Karoly, D.J. Signatures of the Antarctic ozone hole in Southern Hemisphere surface climate change. Nat. Geosci. 2011, 4, 741–749. [Google Scholar] [CrossRef]
- IPCC. Climate Change 2014: Synthesis Report. Contribution of Working Groups I, II and III to the Fifth Assessment Report of the Intergovernmental Panel on Climate Change; IPCC: Geneva, Switzerland, 2014; p. 151. [Google Scholar]
- Banerjee, A.; Fyfe, J.C.; Polvani, L.M.; Waugh, D.; Chang, K.-L. A pause in Southern Hemisphere circulation trends due to the Montreal Protocol. Nature 2020, 579, 544–548. [Google Scholar] [CrossRef] [PubMed]
- Fuenzalida, H.; Aceituno, P.; Falvey, M.; Garreaud, R.; Rojas, M.; Sanchez, R. Study on Climate Variability for Chile during the 21st Century, National Environmental Committee Tech. Rep.: Santiago, Chile, 2007.
- Gómez-González, S.; González, M.E.; Paula, S.; Díaz-Hormazábal, I.; Lara, A.; Delgado-Baquerizo, M. Temperature and agriculture are largely associated with fire activity in Central Chile across different temporal periods. For. Ecol. Manag. 2019, 433, 535–543. [Google Scholar] [CrossRef]
- Carmona, A.; Gonzalez, M.E.; Nahuelhual, L.; Silva, J. Spatio-temporal effects of human drivers on fire danger in Mediterranean Chile. Bosque 2012, 33, 321–328. [Google Scholar] [CrossRef] [Green Version]
- Brotons, L.; Aquilué, N.; de Cáceres, M.; Fortin, M.-J.; Fall, A. How Fire History, Fire Suppression Practices and Climate Change Affect Wildfire Regimes in Mediterranean Landscapes. PLoS ONE 2013, 8, e62392. [Google Scholar] [CrossRef] [PubMed] [Green Version]
- Fernandes, P.M.; Pacheco, A.P.; Almeida, R.; Claro, J. The role of fire-suppression force in limiting the spread of extremely large forest fires in Portugal. Eur. J. For. Res. 2016, 135, 253–262. [Google Scholar] [CrossRef]
- Moreira, F.; Ascoli, D.; Safford, H.; Adams, M.A.; Moreno, J.M.; Pereira, J.M.C.; Catry, F.X.; Armesto, J.; Bond, W.; González, M.E.; et al. Wildfire management in Mediterranean-type regions: Paradigm change needed. Environ. Res. Lett. 2020, 15, 011001. [Google Scholar] [CrossRef]
- Abatzoglou, J.T.; Hatchett, B.J.; Fox-Hughes, P.; Gershunov, A.; Nauslar, N.J. Global climatology of synoptically-forced downslope winds. Int. J. Climatol. 2021, 41, 31–50. [Google Scholar] [CrossRef]
- Bracegirdle, T.J.; Shuckburgh, E.; Sallee, J.-B.; Wang, Z.; Meijers, A.J.S.; Bruneau, N.; Phillips, T.; Wilcox, L.J. Assessment of surface winds over the Atlantic, Indian, and Pacific Ocean sectors of the Southern Ocean in CMIP5 models: Historical bias, forcing response, and state dependence. J. Geophys. Res. Atmos. 2013, 118, 547–562. [Google Scholar] [CrossRef] [Green Version]
Figure 1.
Study area with administrative districts and forest fire density (number of fires 2000–2016) by region (1a, adapted from [15]). Austral summer mean (Dec–Feb; 2000–2016) air temperature and wind vectors at 850 hPa. Also indicated is the westerly wind belt (WWB) and the center of the subtropical anticyclone (H) (1b).
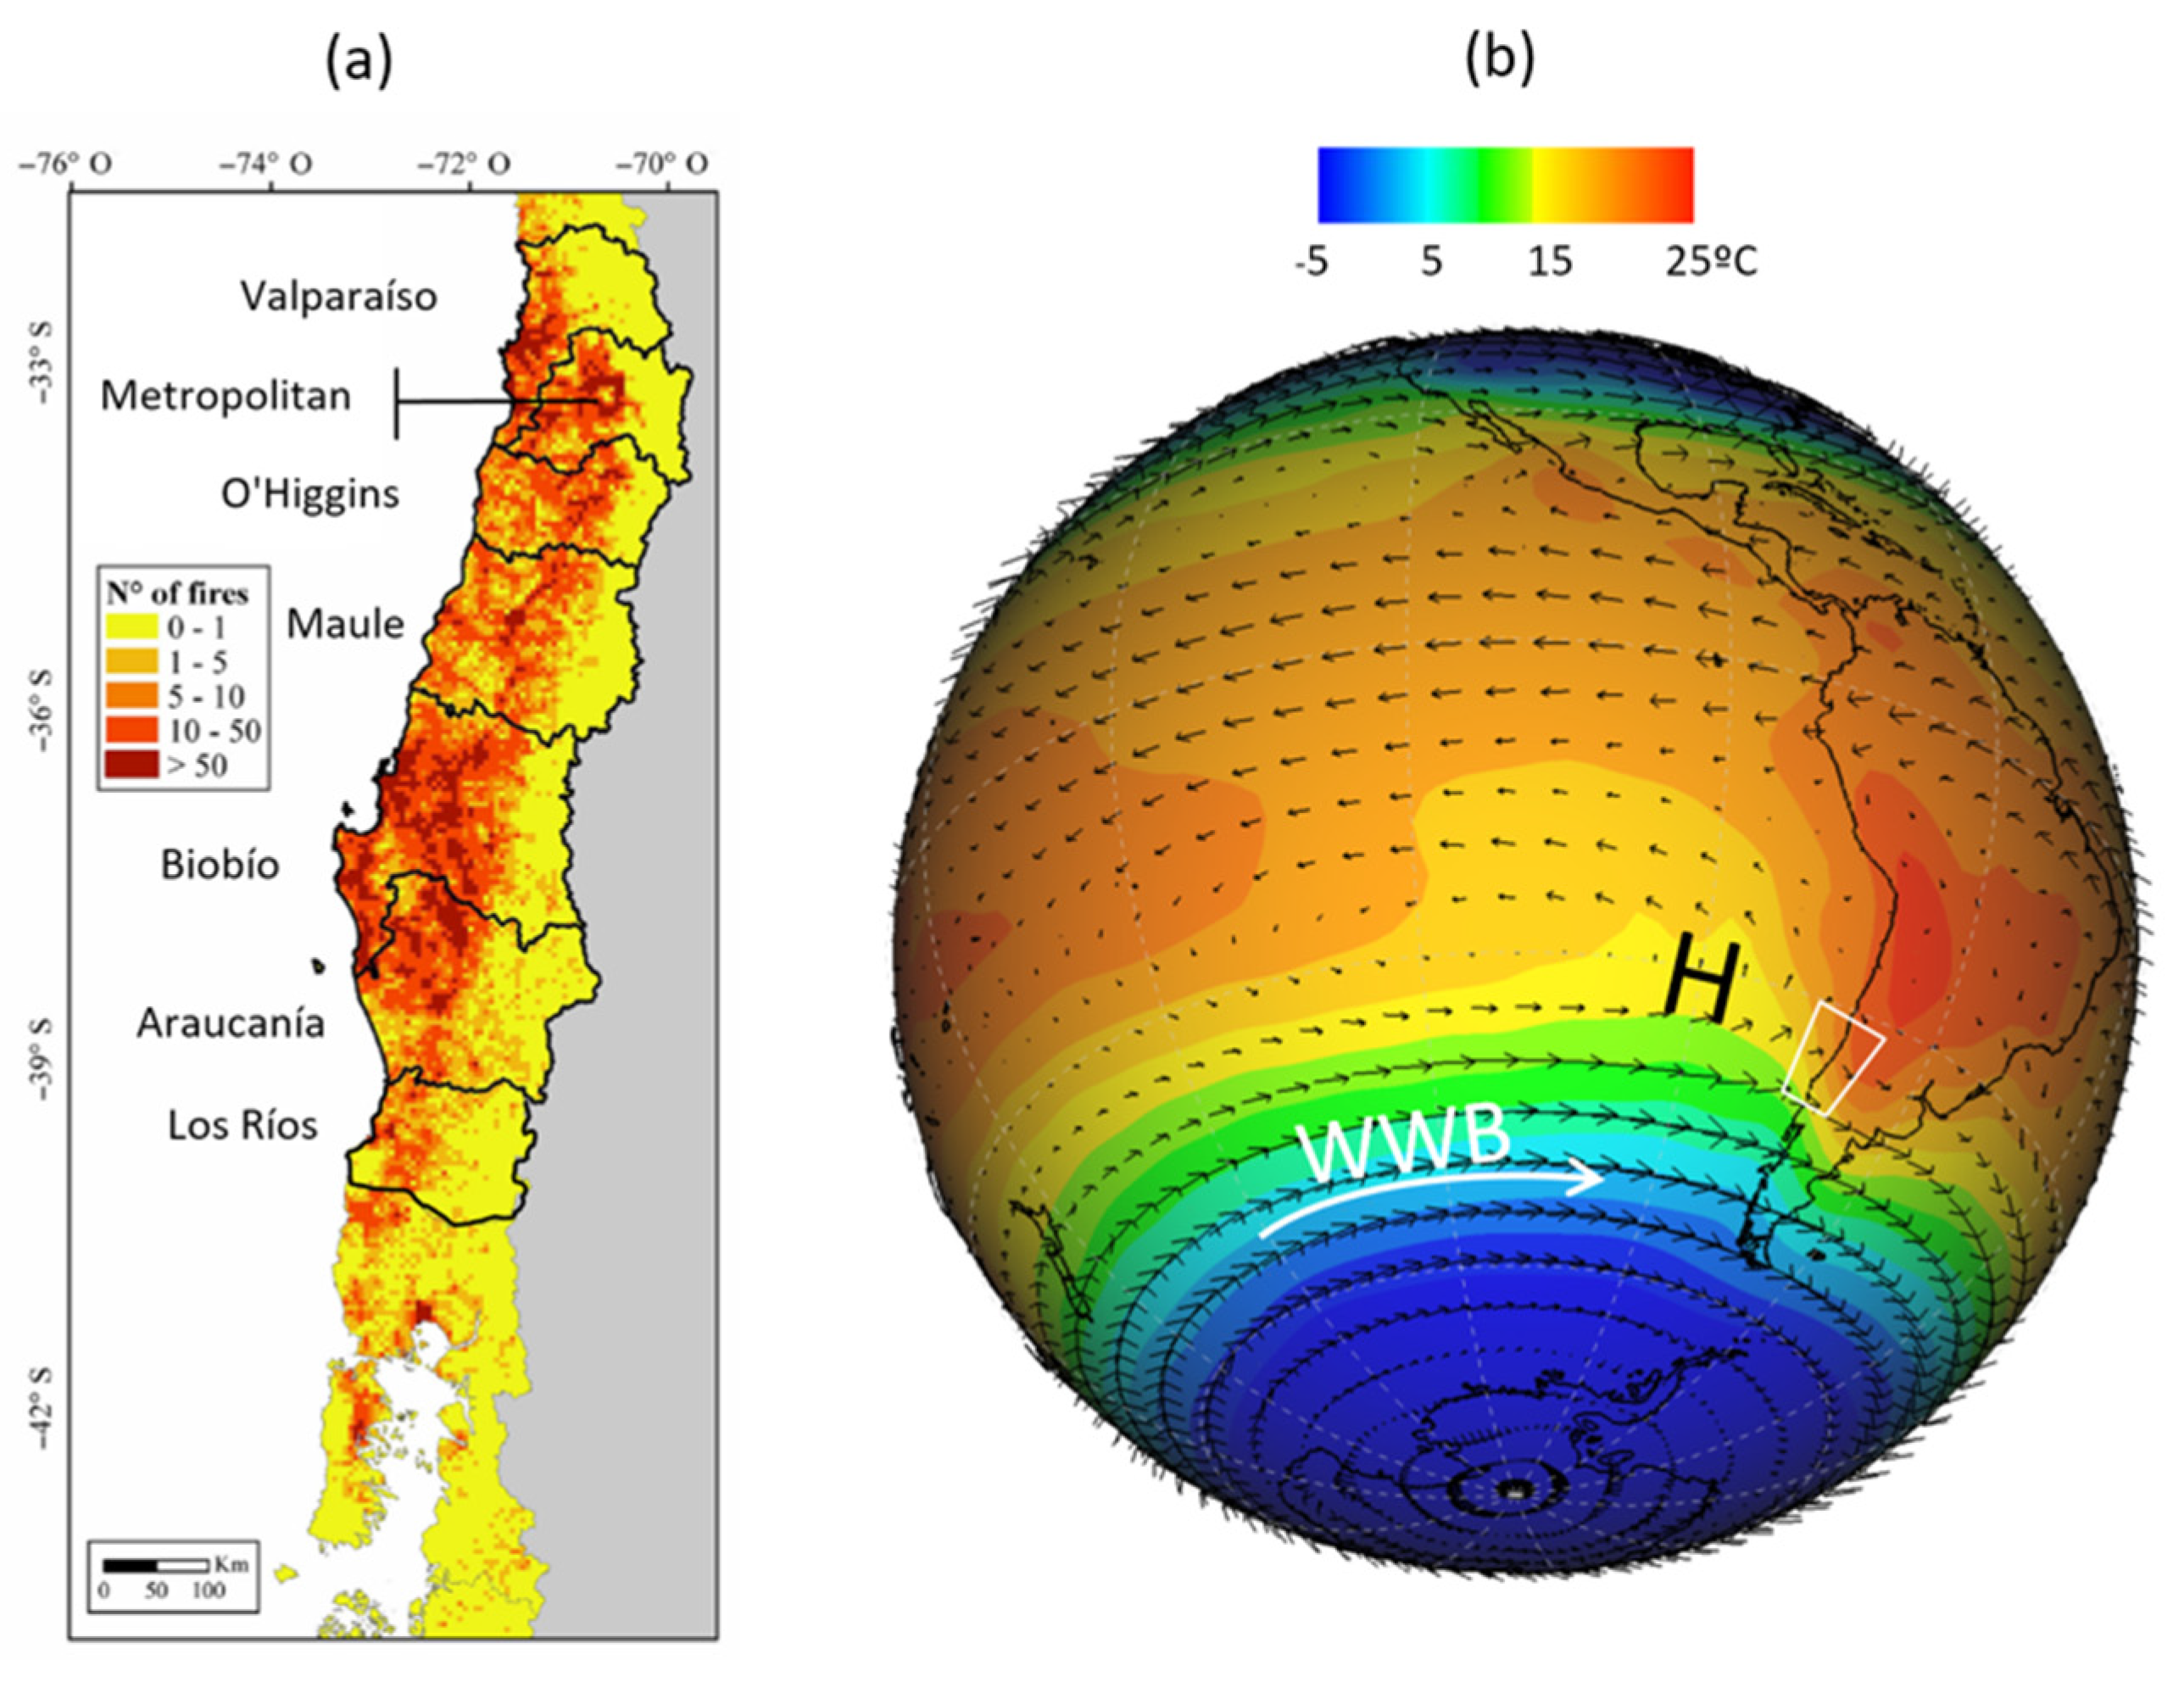
Figure 2.
(a) Sea level pressure (SLP) field from National Oceanic and Atmospheric Administration (NOAA) Global Forecast System (GFS), and (b) Moderate Resolution Imaging Spectroradiometer (MODIS) Aqua land surface temperatures vegetation impervious surface-soil (VIS) + land surface temperature (LST) data on 4 February 2019, during the initial days of wildfires that burned for several weeks in southern Chile (ca. 47° S) [34].

Figure 3.
(a) Area burned time series (1984–2018) for each district (top panel), and (b) area burned by month for all districts with active (red shading) versus inactive (blue shading) fire months indicated (bottom panel) (*note log scale for both time series).
Figure 3.
(a) Area burned time series (1984–2018) for each district (top panel), and (b) area burned by month for all districts with active (red shading) versus inactive (blue shading) fire months indicated (bottom panel) (*note log scale for both time series).
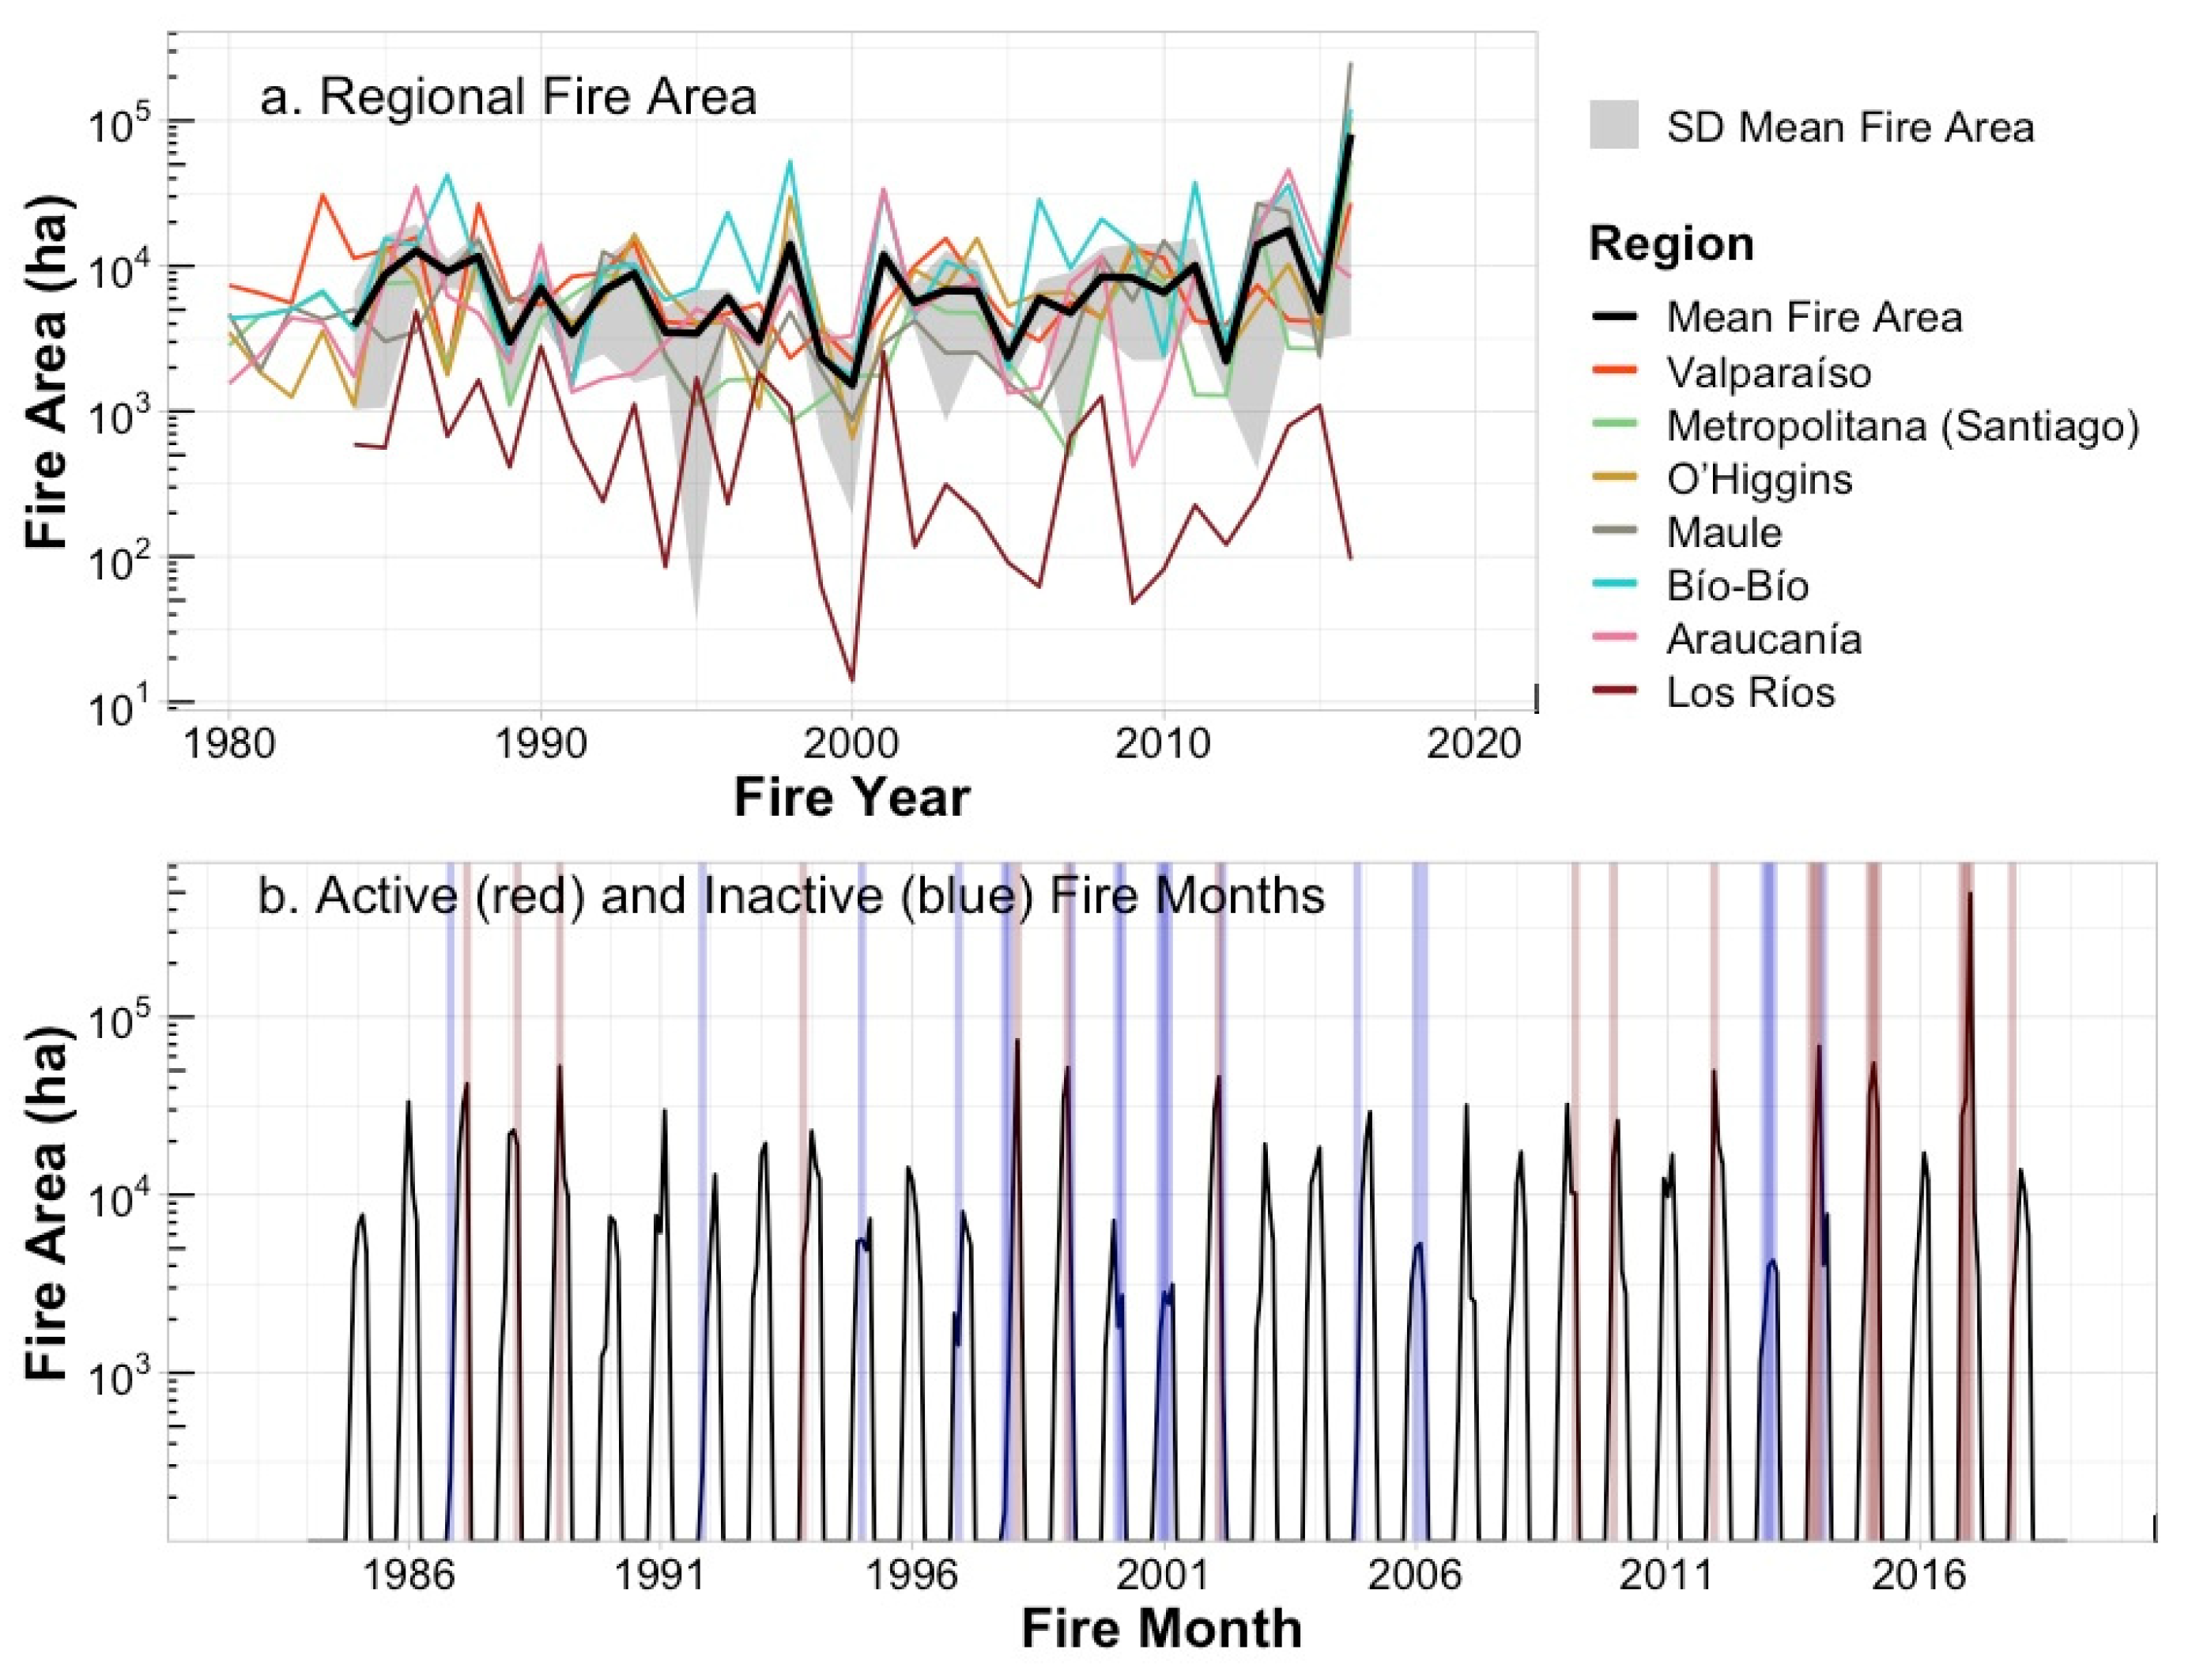
Figure 4.
Active minus inactive monthly composites of concurrent surface: (a) maximum air temperature (°C), (b) minimum temperature (°C), and (c) precipitation (mm/month). The central box shows the approximate location of the study area in south-central Chile (Valparaíso to Los Ríos districts). The areas with gridded dots (black or white) and delimited by a white line indicate where the active minus inactive differences is significant at p ≤ 0.1 according to the Monte Carlo test described in Methods.
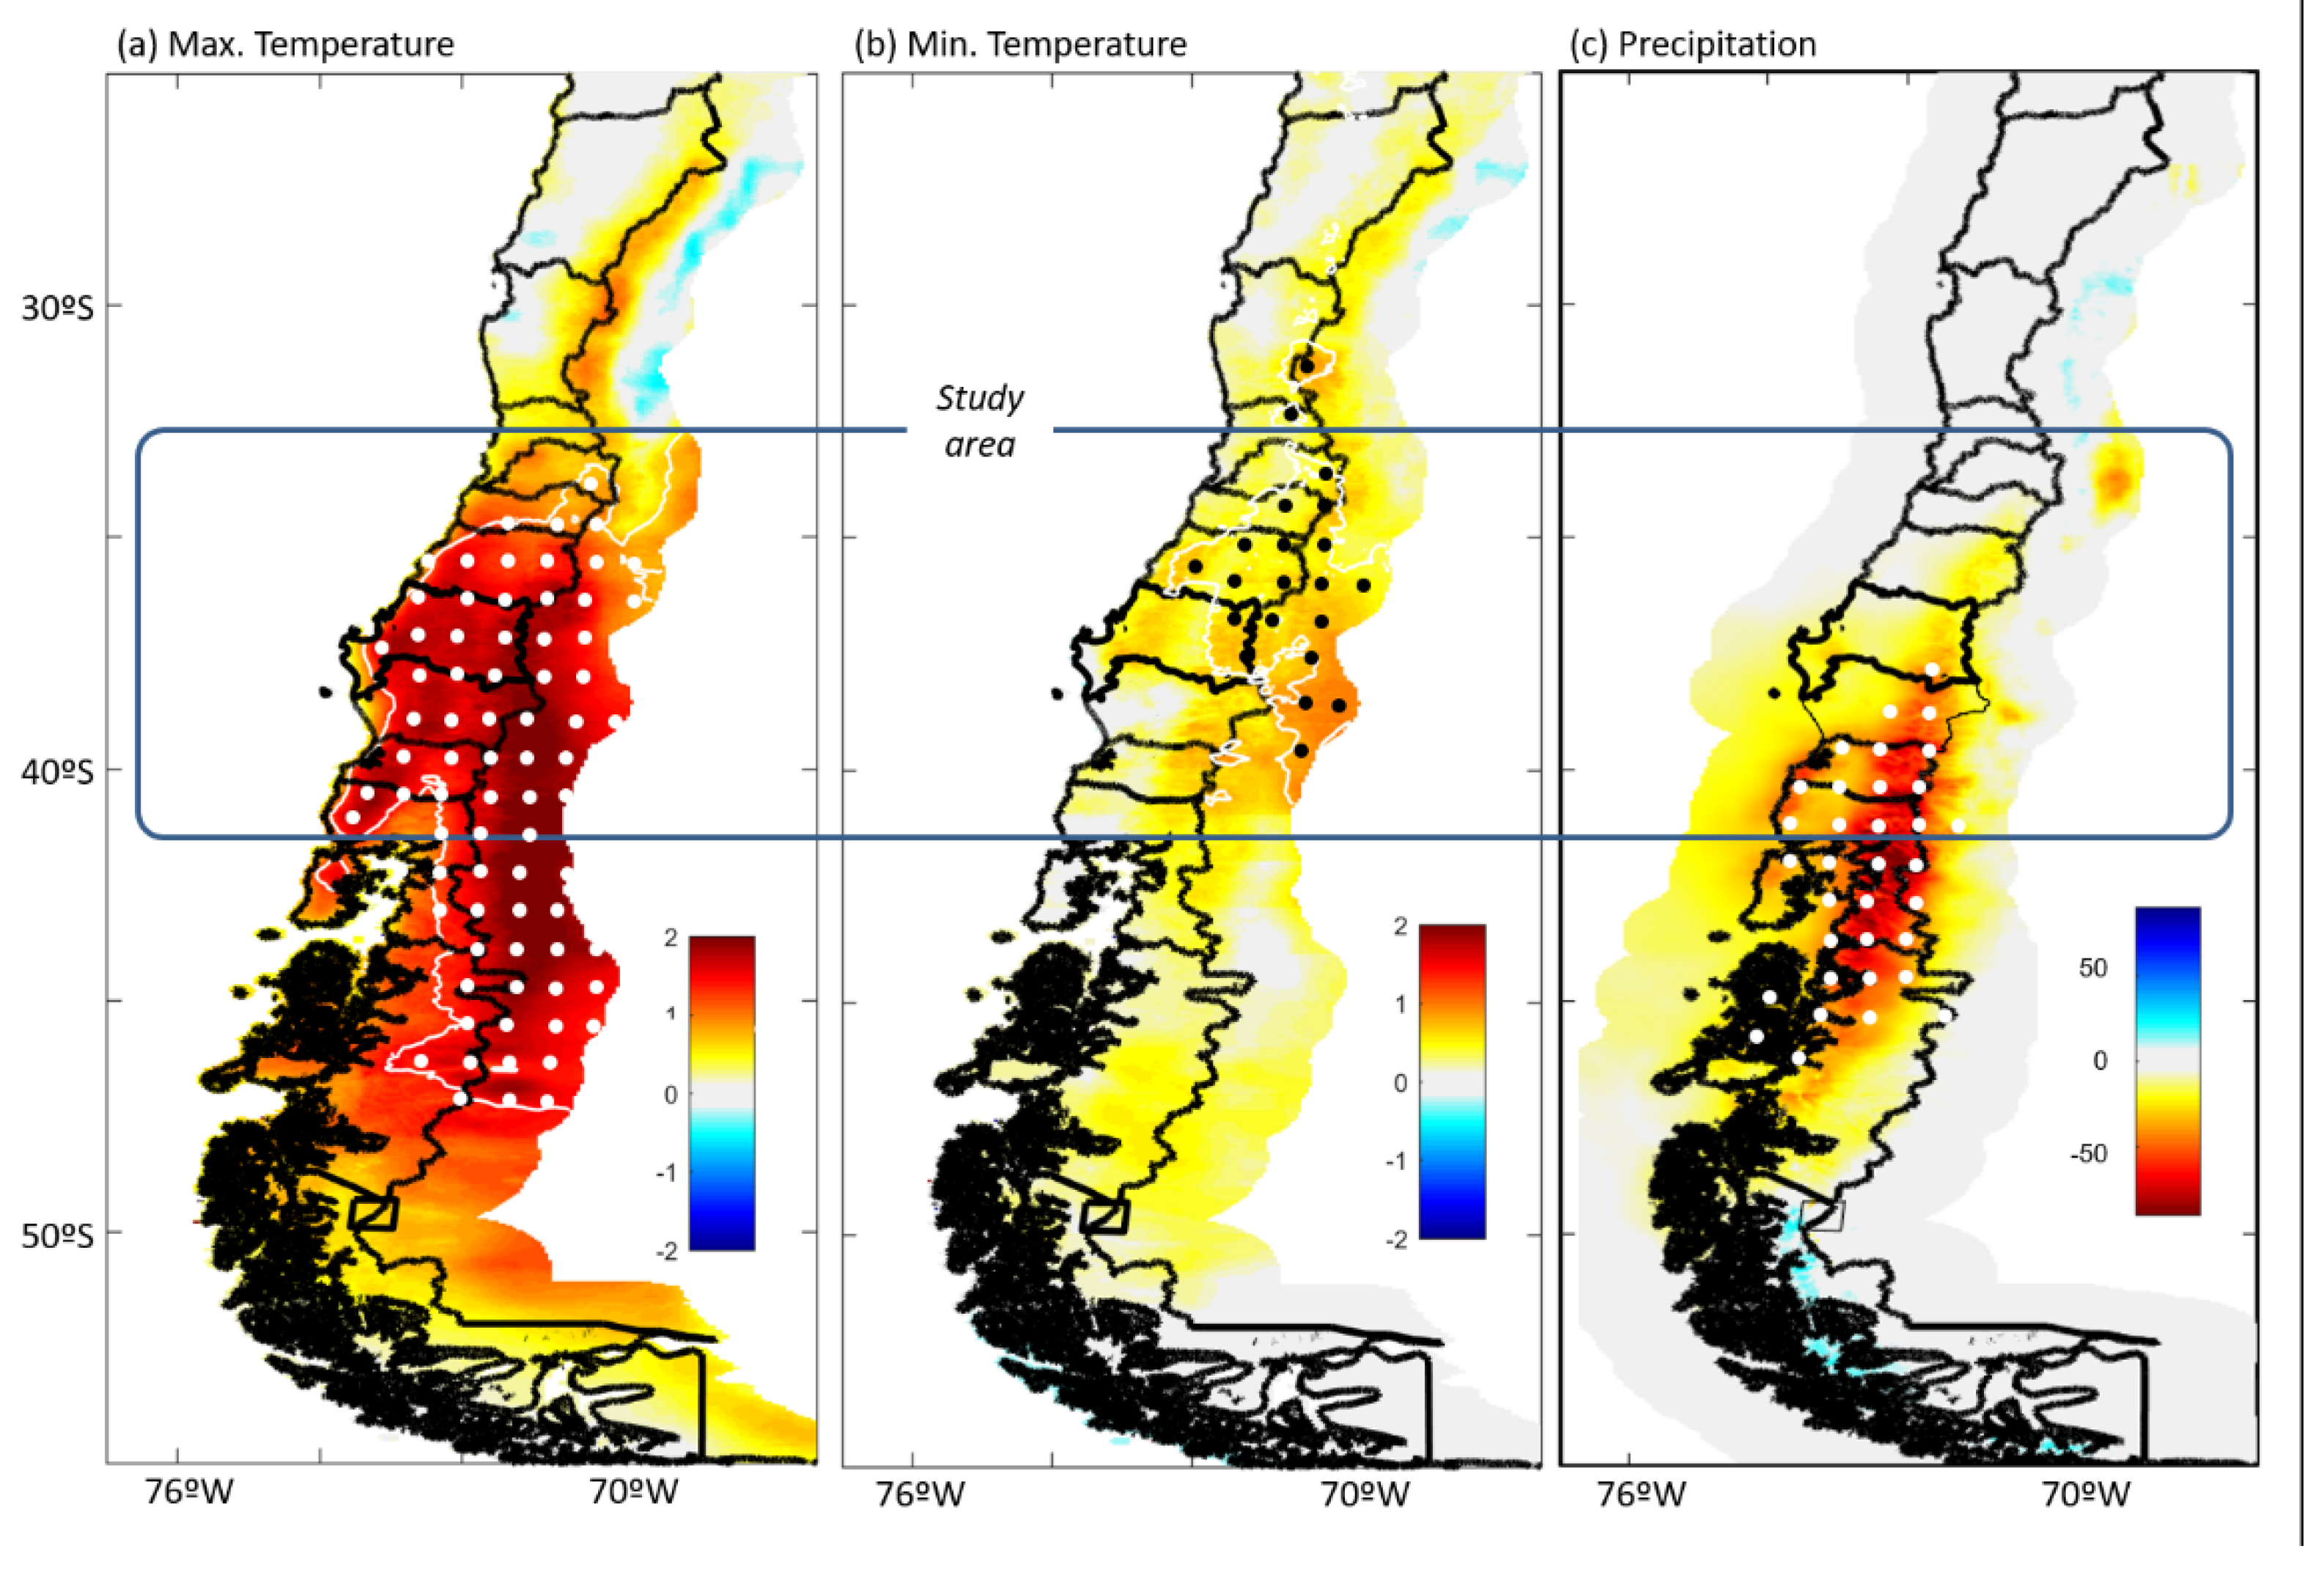
Figure 5.
Active minus inactive monthly composites of 850 hPa (about 1500 m ASL) air temperature (colors) and wind vectors (grey arrows). The largest arrows represent a wind speed difference of 4 ms−1. The letter H indicates the center of the anticyclonic (high pressure) anomaly, the curved black arrows indicate the area with marked easterly (dry wind) anomalies and the black rectangle covers south-central Chile (Valparaíso to Los Ríos districts). The dashed contours encircle grid boxes where the active minus inactive difference is significant at p ≤ 0.05 according to the Monte Carlo test described in Methods.
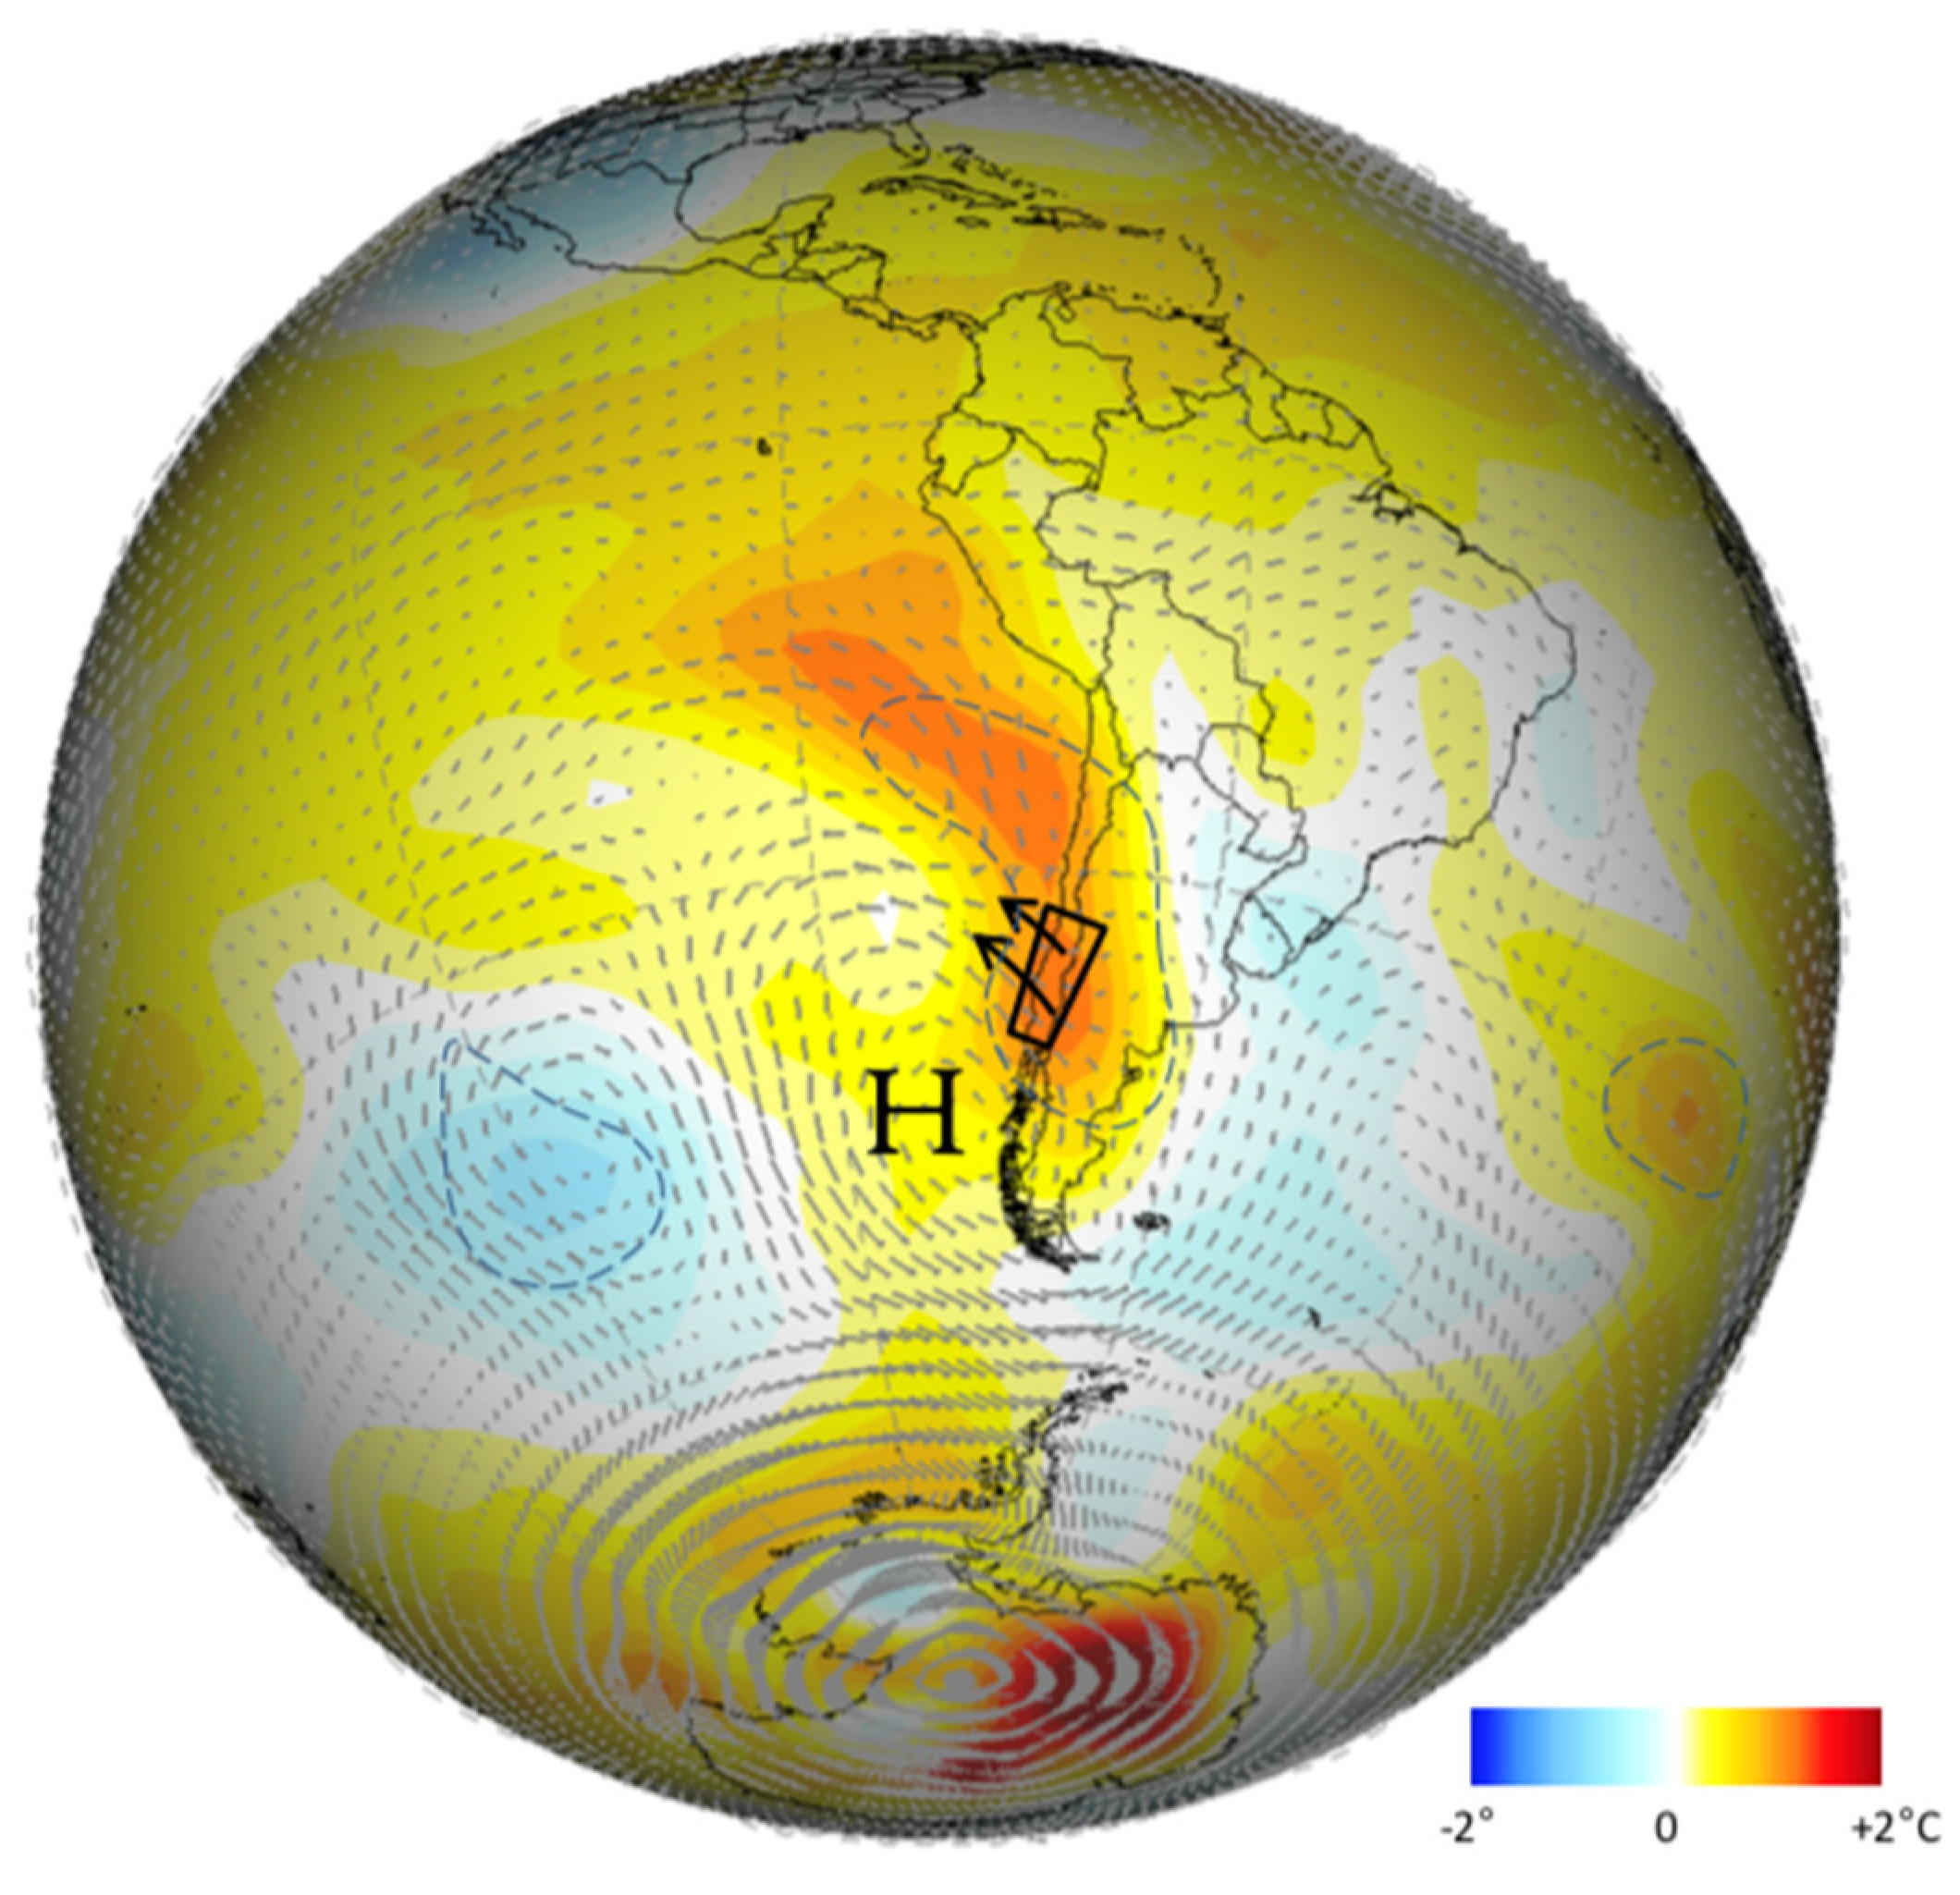
Figure 6.
Sea-level pressure (SLP; colors, scale at bottom) and 500 hPa (contoured every 15 geopotential meters, significant at p < 0.05) for active minus inactive fire months in south-central Chile.
Figure 6.
Sea-level pressure (SLP; colors, scale at bottom) and 500 hPa (contoured every 15 geopotential meters, significant at p < 0.05) for active minus inactive fire months in south-central Chile.

Figure 7.
Total area burned and summer maximum temperature for each fire year of the dataset. Colors indicate decades with cool colors (blue-green) early in the dataset (1980–1990s) and warmer colors (yellow-red) for more recent years (2000s–2018). The record-breaking 2016–2017 fire season is in the far upper right quadrant. The grey dashed line represents the long-term mean annual area burned for the time series and the grey oval identifies a cluster of fire years early in the dataset (i.e., prior to 1990s) that mostly exhibit higher than expected total area burned values compared to our model (see text). Circles with a white “x” mark indicate years during the central Chile mega drought (2010–2018 and continuing) [14].

Table 1.
Study area administrative districts, land area and bioclimatic zone.
| Administrative District | Area (km2) | Bioclimatic Zone |
|---|---|---|
| Valparaíso | 16,396 | Mediterranean |
| Metropolitana | 15,403 | Mediterranean |
| O’Higgins | 16,387 | Mediterranean |
| Maule | 30,296 | Mediterranean |
| Bío bío | 37,069 | Mediterranean/Temperate |
| Araucanía | 31,842 | Temperate |
| Los Ríos | 18,430 | Temperate |
Publisher’s Note: MDPI stays neutral with regard to jurisdictional claims in published maps and institutional affiliations. |
© 2021 by the authors. Licensee MDPI, Basel, Switzerland. This article is an open access article distributed under the terms and conditions of the Creative Commons Attribution (CC BY) license (https://creativecommons.org/licenses/by/4.0/).
Share and Cite
MDPI and ACS Style
McWethy, D.B.; Garreaud, R.D.; Holz, A.; Pederson, G.T. Broad-Scale Surface and Atmospheric Conditions during Large Fires in South-Central Chile. Fire 2021, 4, 28. https://0-doi-org.brum.beds.ac.uk/10.3390/fire4020028
AMA Style
McWethy DB, Garreaud RD, Holz A, Pederson GT. Broad-Scale Surface and Atmospheric Conditions during Large Fires in South-Central Chile. Fire. 2021; 4(2):28. https://0-doi-org.brum.beds.ac.uk/10.3390/fire4020028
Chicago/Turabian StyleMcWethy, David B., René D. Garreaud, Andrés Holz, and Gregory T. Pederson. 2021. "Broad-Scale Surface and Atmospheric Conditions during Large Fires in South-Central Chile" Fire 4, no. 2: 28. https://0-doi-org.brum.beds.ac.uk/10.3390/fire4020028